Erste Group investor presentation FY 2018 preliminary results · Willibald Cernko, CRO Erste Group...
46
Page Erste Group targets ROTE > 11% for 2019; in 2018 operating profit growth and risk releases drove record net profit Andreas Treichl, CEO Erste Group Gernot Mittendorfer, CFO Erste Group Willibald Cernko, CRO Erste Group 28 February 2019 Erste Group investor presentation FY 2018 preliminary results
Transcript of Erste Group investor presentation FY 2018 preliminary results · Willibald Cernko, CRO Erste Group...

Page
Erste Group targets ROTE > 11% for 2019; in 2018 operating profit growth and risk releases drove record net profit Andreas Treichl, CEO Erste Group Gernot Mittendorfer, CFO Erste Group Willibald Cernko, CRO Erste Group
28 February 2019
Erste Group investor presentation FY 2018 preliminary results
Page
Disclaimer – Cautionary note regarding forward-looking statements
2
• THE INFORMATION CONTAINED IN THIS DOCUMENT HAS NOT BEEN INDEPENDENTLY VERIFIED AND NO REPRESENTATION OR WARRANTY EXPRESSED OR IMPLIED IS MADE AS TO, AND NO RELIANCE SHOULD BE PLACED ON, THE FAIRNESS, ACCURACY, COMPLETENESS OR CORRECTNESS OF THIS INFORMATION OR OPINIONS CONTAINED HEREIN.
• CERTAIN STATEMENTS CONTAINED IN THIS DOCUMENT MAY BE STATEMENTS OF FUTURE EXPECTATIONS AND OTHER FORWARD-LOOKING STATEMENTS THAT ARE BASED ON MANAGEMENT’S CURRENT VIEWS AND ASSUMPTIONS AND INVOLVE KNOWN AND UNKNOWN RISKS AND UNCERTAINTIES THAT COULD CAUSE ACTUAL RESULTS, PERFORMANCE OR EVENTS TO DIFFER MATERIALLY FROM THOSE EXPRESSED OR IMPLIED IN SUCH STATEMENTS.
• NONE OF ERSTE GROUP OR ANY OF ITS AFFILIATES, ADVISORS OR REPRESENTATIVES SHALL HAVE ANY LIABILITY WHATSOEVER (IN NEGLIGENCE OR OTHERWISE) FOR ANY LOSS HOWSOEVER ARISING FROM ANY USE OF THIS DOCUMENT OR ITS CONTENT OR OTHERWISE ARISING IN CONNECTION WITH THIS DOCUMENT.
• THIS DOCUMENT DOES NOT CONSTITUTE AN OFFER OR INVITATION TO PURCHASE OR SUBSCRIBE FOR ANY SHARES AND NEITHER IT NOR ANY PART OF IT SHALL FORM THE BASIS OF OR BE RELIED UPON IN CONNECTION WITH ANY CONTRACT OR COMMITMENT WHATSOEVER.

Page
Presentation topics
3
• Executive summary • Business environment • Business performance • Assets and liabilities • Outlook • Additional information

Page
Executive summary – Group income statement performance
QoQ net profit reconciliation (EUR m)
YoY net profit reconciliation (EUR m)
4
• Erste Group Q4 18 net profit advances to EUR 565m driven by improved operating income and booking of deferred tax assets
• Operating income improved on the back of strong net interest income and trading & fair value result
• After 3 quarters of risk releases, minor risk costs in Q4 18 (11bps) • Booking of deferred tax assets in Austria and Hungary (in total
EUR 79.3m) led to positive tax result in Q4 18
• 2018 net profit rises to EUR 1,793m driven by operating turnaround (operating result up 8.9%), exceptional risk performance (net release of EUR 59.3m) and lower tax charge
• Strong NII (+5.3%) and fee growth (+3.1%) more than offset slightly weaker trading/FV result and dividend income
• Marginally higher costs despite significant wage growth and higher deposit insurance contributions
97 143
Q3 18 Operating income
Minorities
-53
Operating expenses
-72
Risk costs
-41
Other result
Taxes on income
37
Q4 18
565
454
+24.5%
247
191 2
Operating expenses
2017
1,316
Operating income
Minorities Other result
Taxes on income
18
Risk costs 2018
23
1,793 78
+36.3%

Page
Executive summary – Key income statement data
Net interest income & margin
5
Operating result & cost/income ratio Cost of risk
Banking levies
Reported EPS & ROE
Return on tangible equity
2,511 2,735
2017 2018
+8.9%
-29
43
-0.02% 0.11%
Q3 18 Q4 18
132
-59 2018 2017
696 741
59.6% 59.3%
Q4 18 Q3 18
1,158 1,210
2.27% 2.33%
Q3 18 Q4 18
25 24
Q3 18 Q4 18
106 112
2017 2018
2.94
4.02
10.1% 13.4%
2017 2018
1.06 1.23
14.4% 16.0%
Q3 18 Q4 18
4,353 4,582
2.40% 2.30%
2018 2017
in EUR m
in EUR m
in EUR m in EUR m
in EUR
2018
11.5%
2017
15.2% 16.4%
Q4 18 Q3 18
18.1%

Page
Executive summary – Group balance sheet performance
YTD total asset reconciliation (EUR m)
YTD equity & total liability reconciliation (EUR m)
6
• Total assets rose markedly in 2018, due to customer loan growth (+7.0%) and expansion of interbank and trading volumes
• Decline in cash position directly correlated to increase in interbank assets as overnight CB deposits were shifted into 2w facility in CZ in order to maximise NII
• Shift from cash to interbank assets also contributed to rise in interest bearing assets (YE17: EUR 188bn, YE18: EUR 210bn)
• Total liability growth in 2018 driven by customer deposits and debt issuance (primarily mortgage covered bonds)
• Customer deposits grew by 7.7%, resulting in a loan/deposit ratio of 91.8% (YE17: 92.4%)
• Increase in equity despite implementation of IFRS9 (-EUR 0.7bn), payout of 2017 dividend (-EUR 0.6bn) and currency translation effects
4,247 1,178 9,977
9,789
220,659
Cash
236,792
Loans to banks
31/12/17 Trading, financial assets
Net loans
16
Intangibles
548
Miscella-neous assets
31/12/18
+7.3%
1,308
4,643 1,154
31/12/17
580
Miscellaneous liabilities
31/12/18
915
Trading liabilities
Bank deposits
Equity
220,659
236,792
Customer deposits
Debt securities
11,669
+7.3%

Page
Executive summary – Key balance sheet data
Loan/deposit & loan/TA ratio
7
Net loans & credit RWA NPL coverage ratio & NPL ratio
B3FL capital ratios1
B3FL capital & tangible equity2
Liquidity coverage & leverage ratio3
139.5
89.2
149.3
95.8
Net loans Credit RWA
+7.0%
31/12/18 31/12/17
4.0% 3.2%
73.0%
NPL coverage NPL ratio
68.8%
92.4%
63.2%
91.8%
63.1%
Loan/deposit ratio Loans/total assets
11.4
CET 1 Tangible equity
14.4 15.5
11.9 18.2%
12.9%
18.1%
13.5%
Total capital CET 1
2) Based on shareholders’ equity, not total equity
6.6% 6.6%
LR (B3FL) LCR
150.3%
145.2%
in EUR bn
in EUR bn 3) Pursuant to Delegated Act
1) Based on the verified but preliminary YE profits ECB has approved an amount of € 1,315.9mn to include in consolidated CET1 capital according to Art 26 (2) CRR. Assuming the approval and endorsement of the financial statement by the Supervisory Board the eligible amount changes to € 1,341.9mn resulting in a CET1 ratio of 13.45% (Basel 3 fully loaded) and 13.54% (Basel 3 phased-in).

Page
Presentation topics
8
• Executive summary • Business environment • Business performance • Assets and liabilities • Outlook • Additional information

Page
Business environment – Strong economic outlook for 2019
Real GDP growth (in %)
9
Dom. demand contribution* (in %) Net export contribution* (in %)
Unemployment rate (avg, in %)
Current account balance (% of GDP)
Gen gov balance (% of GDP)
Consumer price inflation (ave, in %)
Public debt (% of GDP)
• Erste Group’s core CEE markets expected to grow by about 3% in 2019 • Domestic demand is expected to remain the main driver of economic growth • Consumption is supported by improving labour markets, wage increases and relatively low inflation rates across the region
• Solid public finances across Erste Group‘s core CEE markets: almost all countries fulfill Maastricht criteria • Sustainable current account balances, supported by competitive economies with decreasing unemployment rates
2.0
3.8 4.0 4.7
5.8
3.4
1.6
3.0 2.6
3.9 4.7
3.4
SK HR CZ AT RO HU
2018 2019
2.7 3.0 4.1 4.1
4.8
2.8 2.1 2.5
3.4 3.1 3.6
2.6
AT HR SK CZ RO HU
2.1 2.2 2.5
4.6
2.8
1.5 2.0 2.3 2.5
3.2 2.7
1.0
HR SK CZ AT RO HU
4.9
2.4
6.7
4.2 3.7
8.8
4.8
2.5
6.3
3.8 3.8
7.8
HR CZ AT SK RO HU
2.3 0.6
-1.5
-4.6
1.4 2.8 2.3
0.5
-0.9
-4.9
0.8 2.4
HU AT CZ SK RO HR
-0.3
1.5
-0.8
-2.9 -2.0
0.2 0.1 1.1
-0.7
-3.0 -1.8
HR HU AT CZ
-3
SK RO
0.0
74
33 49
35
72 74 71
32 48
36
69 71
RO AT
60
CZ SK HU HR
* Contribution to real GDP growth. Domestic demand contribution includes inventory change. Source: Erste Group Research, EU Commission
0.7
-0.8
0.1
-0.6 -1.0
-0.7
0.4
-0.5
0.8
-0.8 -1.2
-0.7
AT CZ SK HR RO HU

Page
Business environment – CZ further increases key policy rate to 175bps in November 2018
Austria
10
Czech Republic Romania
Slovakia
Hungary
Croatia
• ECB cut discount rate to zero in March 16 • Maintains expansionary monetary policy
stance, despite tapering announcement
• National bank has increased its benchmark rate in seven steps from historic low of 0.05% to 1.75% since August 2017
• Central bank increases policy rate from historic low of 1.75% to 2.50% in January, February and May 2018
• As part of euro zone ECB rates are applicable in SK
• National bank cut the benchmark interest rate to record low of 0.9% in May 2016
• Central bank maintains discount rate at 3.0% since 2015
0.41%
1.27%
1.02% 1.98%
2017 2018
0.95%
3.92% 4.77%
2017 2018
2.61%
0.14% 0.12%
2.96% 3.05%
2017 2018
0.36% 0.25%
2017 2018
-0.32% -0.32%
0.58% 0.60%
Q3 18 Q4 18
1.39% 1.91%
2.13% 2.04%
Q4 18 Q3 18
3.12% 3.01%
4.90% 4.97%
Q4 18 Q3 18
-0.32% -0.32%
0.80% 1.02%
Q3 18 Q4 18
0.21% 0.15%
3.44% 3.45%
Q3 18 Q4 18
0.25% 0.25%
Q4 18 Q3 18
Source: Bloomberg, Reuters for SK 10Y.
-0.33% -0.32%
0.58% 0.66%
2017 2018
3M Interbank 10YR GOV
-0.33% -0.32%
0.94% 0.86%
2017 2018

Page
Business environment – Emerging market volatility has minor impact on CEE currencies
EUR/CZK
11
EUR/RON
EUR/HUF
EUR/HRK
• Czech National Bank ended its currency peg in April 17; benchmark rate increased further to 1.75% in November 2018
• RON depreciated slightly vs EUR amid political volatility; policy rate raised to 2.50% in May 2018
• HUF has recovered after reaching record low against the EUR
• Croatian National Bank continues to manage HRK in tight range
26.3 25.6
2017 2018
-2.6%
25.7 25.9
Q4 18 Q3 18
+0.6%
25.5 25.7
31/12/17 31/12/18
+0.9%
4.57 4.65
2017 2018
+1.9%
4.65 4.66
Q3 18 Q4 18
+0.3%
4.67 4.65
31/12/18 31/12/17
-0.3%
309.3 318.8
2018 2017
+3.1%
324.1 322.9
Q3 18 Q4 18
-0.4%
310.8 320.9
31/12/17 31/12/18
+3.2%
7.46 7.42
2018 2017
-0.6%
7.42 7.42
Q3 18 Q4 18
0.0%
7.43 7.41
31/12/18 31/12/17
-0.3%
Source: Bloomberg

Page
Business environment – Market shares: mostly stable or increasing shares across the region
Gross retail loans
12
• CZ: increasing market shares in growing markets
• RO: increasing market shares despite restrictive lending standards
• SK: declining market shares due to aggressive pricing by some of the smaller competitors
Gross corporate loans
• RO: conservative lending standards impact market share
• HR: yoy market share increase mainly due to substantial sale of NPLs by other market participants
Retail deposits
• Continued inflows in all markets despite low interest rate environment, with growing market shares in AT, CZ, and SK
Corporate deposits
• Changes mainly due to normal quarterly volatility in corporate business
20.2%
23.2%
27.7%
16.0%
11.9%
13.6%
5.4%
20.3%
23.4%
27.0%
16.6%
12.0%
13.9%
6.3%
23.6%
26.7%
16.7%
11.8%
6.5%
HR
SK
RS
AT
HU
CZ
RO
31/12/17 30/09/18 31/12/18
21.0%
20.6%
12.6%
12.1%
7.0%
16.3%
5.1%
21.2%
20.8%
13.7%
11.5%
7.2%
17.9%
5.9%
20.9%
13.9%
11.2%
7.3%
6.1%
HR
HU
CZ
AT
SK
RO
RS
19.5%
25.3%
27.6%
15.9%
9.0%
13.8%
3.8%
19.8%
25.6%
27.9%
15.6%
9.4%
13.9%
4.0%
25.6%
28.0%
15.4%
9.2%
4.1%
AT
CZ
HR
SK
HU
RO
RS
20.2%
12.0%
13.1%
15.4%
6.0%
13.9%
6.0%
21.4%
12.2%
15.7%
14.6%
5.9%
14.1%
7.4%
12.2%
13.4%
14.8%
5.4%
6.0%
SK
AT
CZ
HU
RO
HR
RS
13.8% 17.4% 13.5% 13.8%
AT market shares for 31/12/18 not yet available

Page
Presentation topics
13
• Executive summary • Business environment • Business performance • Assets and liabilities • Outlook • Additional information
Page
Business performance: performing loan stock & growth – Performing loans continue to grow in Q4 18
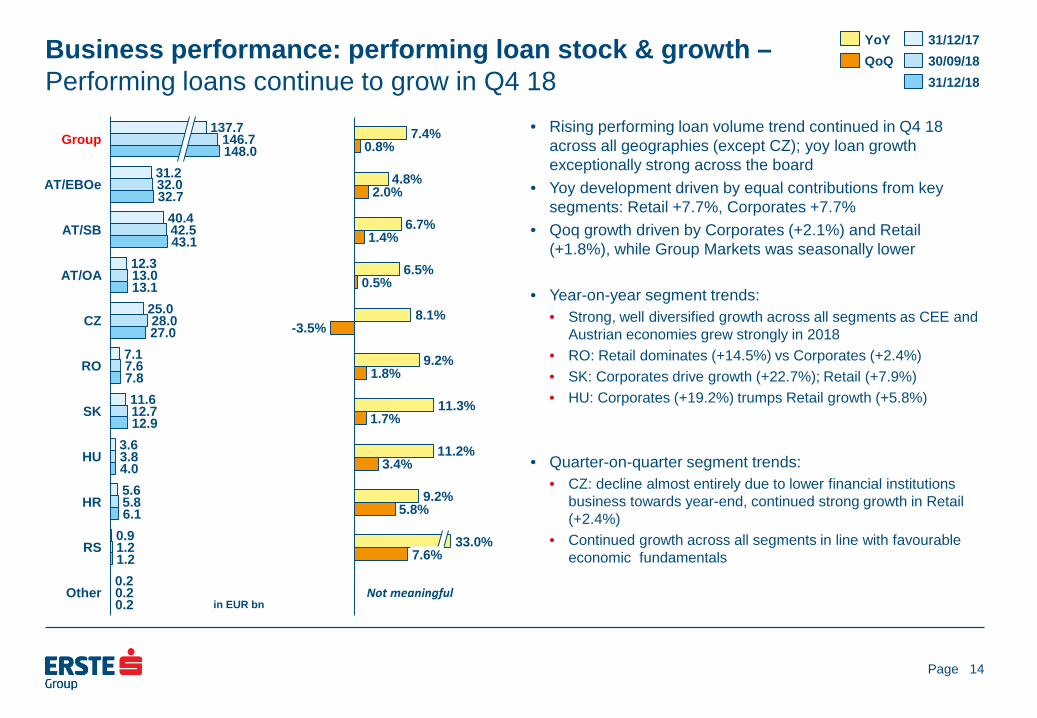
• Rising performing loan volume trend continued in Q4 18 across all geographies (except CZ); yoy loan growth exceptionally strong across the board
• Yoy development driven by equal contributions from key segments: Retail +7.7%, Corporates +7.7%
• Qoq growth driven by Corporates (+2.1%) and Retail (+1.8%), while Group Markets was seasonally lower
• Year-on-year segment trends: • Strong, well diversified growth across all segments as CEE and
Austrian economies grew strongly in 2018 • RO: Retail dominates (+14.5%) vs Corporates (+2.4%) • SK: Corporates drive growth (+22.7%); Retail (+7.9%) • HU: Corporates (+19.2%) trumps Retail growth (+5.8%)
• Quarter-on-quarter segment trends: • CZ: decline almost entirely due to lower financial institutions
business towards year-end, continued strong growth in Retail (+2.4%)
• Continued growth across all segments in line with favourable economic fundamentals
14
13.0
12.7
0.2
31.2
CZ
HU
AT/OA
0.9
Group
AT/EBOe
AT/SB
RO
11.6 SK
5.6 HR
4.0
RS
Other
137.7
7.1
146.7
42.5
148.0
32.0 32.7
40.4
28.0
43.1
12.9
12.3
1.2
13.1
1.2
25.0
3.6
27.0
7.6 7.8
3.8
5.8 6.1
0.2 0.2
7.4%
4.8%
6.7%
6.5%
8.1%
9.2%
11.3%
11.2%
9.2%
0.8%
2.0%
1.4%
0.5%
-3.5%
1.8%
1.7%
3.4%
5.8%
33.0% 7.6%
QoQ YoY 31/12/17
31/12/18 30/09/18
in EUR bn Not meaningful

Page
Business performance: customer deposit stock & growth – Deposit build-up continues apace in Q4 18
• Continuation of exceptional deposit growth across all geographies despite zero/low interest rate environment as retail and corporate clients park cash in overnight accounts
• Yoy growth in absolute terms mainly driven by Retail segment (+EUR 5.7bn) followed by Group Markets (+EUR 2.9bn) and Corporates segment (+EUR 1.1bn); strong contribution from Savings Banks (+EUR 3.8bn)
• Qoq increase across most geographies
• Year-on-year segment trends: • AT/OA: higher volumes driven by increased money market
business activity in the New York Branch (Group Markets) • RS: strong growth in Retail (+16.9%) with smaller contribution
from Corporates (+7.1%)
• Quarter-on-quarter segment trends:
• AT/OA: minor decline in Corporates business • HU: decrease driven by Corporates, Retail up by 2.8% • HR: minor decline driven by ALM/LCC
15
Group
5.4 5.6
CZ
Other
RO
36.5 34.6
SK
11.3
AT/EBOe
AT/OA
AT/SB
HU
12.5
HR
RS
5.0
151.0 159.8 162.6
1.0
33.7 34.4
7.3
35.5
7.2
42.6 44.6 46.4
4.5
0.8
37.1
11.3 11.8
13.6 13.7
0.0
6.7 6.6
1.0
-1.2 -2.0
6.0
7.7%
5.1%
8.9%
7.3%
4.8%
9.4%
8.6%
11.3%
1.8%
3.1%
4.0%
-2.4%
1.6%
4.7%
0.0%
-4.5%
-0.5%
2.0%
58.7%
21.3%
YoY QoQ
in EUR bn
31/12/17 30/09/18 31/12/18
Not meaningful

Page
Business performance: NII and NIM – NII advances further qoq and yoy
• Yoy NII increase mainly driven by CZ due to higher business volumes and rising interest rates; also strong contribution from AT and RO; NIM decline due to changed balance sheet structure, resulting in higher interest-bearing assets
• Qoq improvement primarily in CZ and AT
• Year-on-year segment trends: • CZ: higher rates and volumes push NII up, particularly strong
in Corporates; decline in NIM mainly related to technical effect of shifting cash to interbank assets, ie overnight CNB facility to 2-week repo
• AT/EBOe: mainly supported by one-off effects in Q4 17 and Q4 18 with a combined positive effect of EUR 13m
• AT/OA: increased volumes in reverse repo/MM business • RO: higher interbank rates following rate hikes and higher
volumes drive NII growth
• Quarter-on-quarter segment trends: • CZ: continued NII growth due to rising interest rates, driven
mainly by Corporates • AT/OA: strong increase in MM/repo business in the Holding • Other: higher NII due to increased intragroup bookings • RO: one-off income from early repayments in Q3 18 (EUR 6m) • AT/EBOe: increase due to positive one-off (EUR 6m) in Q4 18
16
150
252
95
257
93
110
51
70
13
34
160
256
102
267
107
111
51
68
13
25
168
262
112
289
102
110
53
67
13
35
HU
CZ
Group
AT/EBOe
AT/SB
AT/OA
RO
SK
HR
RS
Other
1,124 1,158
1,210
Q4 17 Q3 18 Q4 18
2.41%
1.50%
1.86%
1.32%
2.56%
3.07%
2.91%
3.02%
3.48%
4.52%
2.27%
1.56%
1.77%
1.15%
2.13%
3.42%
2.73%
2.87%
3.29%
3.68%
2.33%
1.61%
1.83%
1.26%
2.24%
3.26%
2.68%
2.85%
3.20%
3.48%
in EUR m Not meaningful

Page
Business performance: operating income – Operating income up yoy, mainly on strong NII
• Yoy up on strong rise in NII and improved net trading result and FV result, while fees declined slightly
• Qoq up on rising NII, fees and net trading & FV result
• Year-on-year segment trends: • Revenues rise in most segments on the back of good macro
environment, higher volumes and higher rates, except in: • AT/OA: decline in net trading result only partially offset by stronger
NII, while net fee income remains flat • HR: marginally lower NII, fee and rental income
• Other: improvement due to better FV result on the back of improved own issues valuations
• Quarter-on-quarter segment trends: • Other: various valuation effects led to significantly improved net
trading and FV result • AT/EBOe: driven by across the board higher revenues • RO: slightly lower income across all revenue lines (see NII) • HR: down on lower fees due to seasonality
17
1,732
269
385
192
366
153
143
102
104
17
1,722
260
378
159
385
181
153
109
110
18
-30
1,819
287
384
169
394
171
149
114
100
19
34
HR
Group
SK
AT/EBOe
RO
AT/SB
HU
AT/OA
CZ
RS
Other 0
Q3 18 Q4 17
Q4 18
in EUR m
5.0%
6.8%
-0.4%
-12.3%
7.7%
11.6%
3.8%
11.9%
-4.3%
8.1%
5.7%
10.5%
1.6%
6.2%
2.2%
-5.4%
-2.8%
4.7%
-9.5%
6.3%
YoY QoQ
Not meaningful
Page
Business performance: operating expenses – Moderate cost development despite wage pressure in CEE
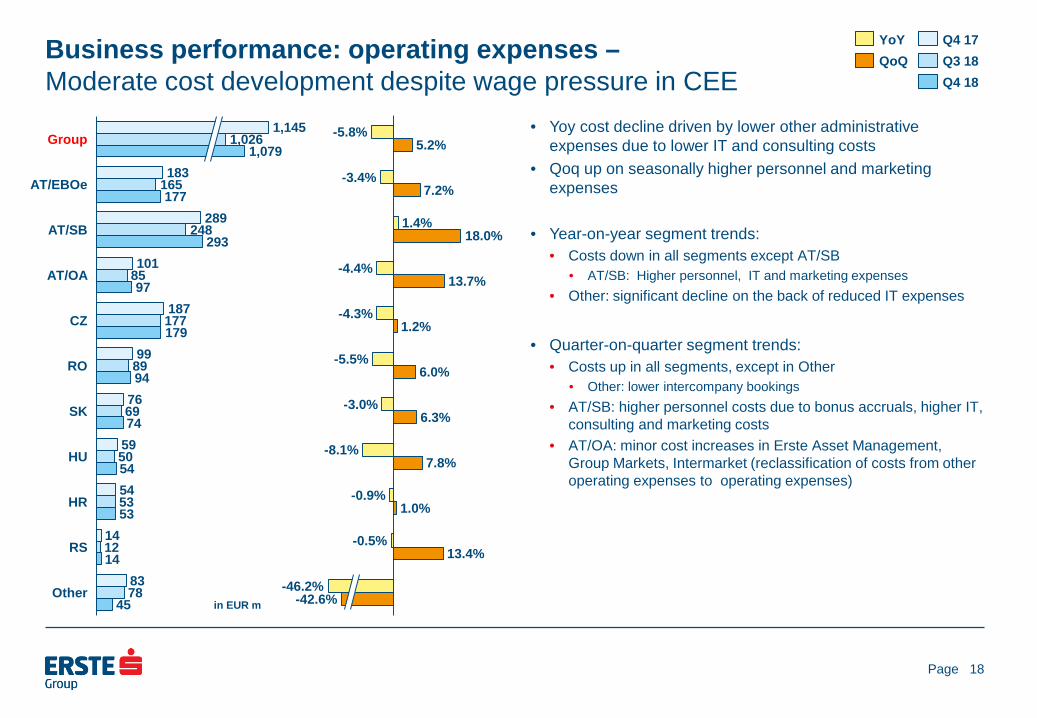
• Yoy cost decline driven by lower other administrative expenses due to lower IT and consulting costs
• Qoq up on seasonally higher personnel and marketing expenses
• Year-on-year segment trends: • Costs down in all segments except AT/SB
• AT/SB: Higher personnel, IT and marketing expenses • Other: significant decline on the back of reduced IT expenses
• Quarter-on-quarter segment trends:
• Costs up in all segments, except in Other • Other: lower intercompany bookings
• AT/SB: higher personnel costs due to bonus accruals, higher IT, consulting and marketing costs
• AT/OA: minor cost increases in Erste Asset Management, Group Markets, Intermarket (reclassification of costs from other operating expenses to operating expenses)
18
183
289
101
187
99
76
59
54
14
83
165
248
85
177
89
69
50
53
12
78
177
293
97
179
94
74
54
53
14
45
AT/EBOe
RO
AT/SB
1,079 Group
AT/OA
HU
CZ
SK
HR
RS
Other
1,145 1,026
Q3 18 Q4 17
Q4 18
in EUR m
-5.8%
-3.4%
1.4%
-4.4%
-4.3%
-5.5%
-3.0%
-8.1%
-0.9%
-0.5%
5.2%
7.2%
18.0%
13.7%
1.2%
6.0%
6.3%
7.8%
1.0%
13.4%
-42.6% -46.2%
YoY QoQ
Page
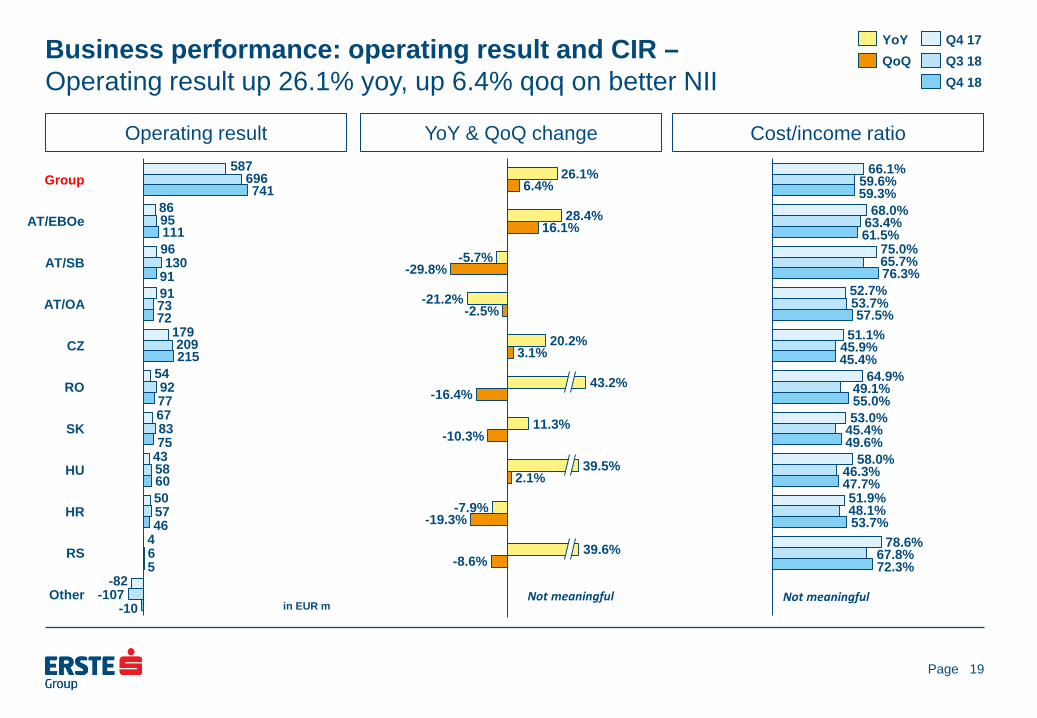
Business performance: operating result and CIR – Operating result up 26.1% yoy, up 6.4% qoq on better NII
Operating result
YoY & QoQ change
19
Cost/income ratio 587
86
96
91
179
54
67
43
50
4
-82
696
95
130
73
209
92
83
58
57
6
-107
741
111
91
72
215
77
75
60
46
5
-10
RS
Group
AT/EBOe
HU
AT/OA
SK
AT/SB
CZ
HR
RO
Other
66.1%
68.0%
75.0%
52.7%
51.1%
64.9%
53.0%
58.0%
51.9%
78.6%
59.6%
63.4%
65.7%
53.7%
45.9%
49.1%
45.4%
46.3%
48.1%
67.8%
59.3%
61.5%
76.3%
57.5%
45.4%
55.0%
49.6%
47.7%
53.7%
72.3%
in EUR m Not meaningful
26.1%
28.4%
-5.7%
-21.2%
20.2%
11.3%
-7.9%
6.4%
16.1%
-29.8%
-2.5%
3.1%
-16.4%
-10.3%
2.1%
-19.3%
-8.6%
43.2%
39.5%
39.6%
YoY QoQ
Q4 17 Q3 18 Q4 18
Not meaningful

Page
Business performance: risk costs (abs/rel*) – Minor risk provisions in Q4 18, after 3 quarters of releases
• Yoy and qoq development characterised by continuation of healthy asset quality, resulting in net releases in most geographies
• Year-on-year segment trends:
• AT/SB: higher risk provisions among large savings banks • AT/OA: significant reduction in new impairments combined with
recoveries led to net release • CZ: provisions for various corporate clients • RO: minor provisions in all business lines • HU: net releases due to upgrades and NPL sales above book
value • HR: decline in risk costs due to releases in Corporates
• Quarter-on-quarter segment trends:
• AT/SB, AT/OA, CZ: see above (yoy explanations)
20
61
-6
1
17
19
-6
0
10
24
-1
2
-29
-6
-30
-9
-9
16
6
-9
11
-1
2
43
1
14
55
17
6
-8
13
-5
7
RS
HU
AT/SB
Group
CZ
AT/EBOe
AT/OA
RO
SK
HR
Other
-57
0.17%
-0.07%
0.01%
0.52%
0.30%
-0.32%
0.01%
1.13%
1.51%
-0.60%
-0.02%
-0.15%
-0.11%
-0.19%
0.84%
0.22%
-1.04%
0.60%
-0.20%
0.11%
0.09%
0.25%
-0.61%
0.49%
0.47%
0.21%
-0.75%
0.69%
-1.36%
0.00%
Q4 17 Q3 18 Q4 18
in EUR m
*) To ensure comparability with historically reported, pre-IFRS9 provisioning ratios, relative risk costs are calculated as annualised quarterly impairment result from financial instruments adjusted for net allocation of provisions for commitments and guarantees given over average gross customer loans.
Not meaningful

Page
Business performance: non-performing loans and NPL ratio – NPL ratio improves further to 3.2%, best level since 1999
• NPL volume falls by almost EUR 0.5bn to EUR 4.9bn in Q4 18, despite continued loan growth, supported by: • Limited gross new inflows • High levels of recoveries and write-offs (including NPL sales) • Portfolio upgrades
• NPL sales of EUR 108.3m in Q4 18 (Q3 18: EUR 25.0m) • Retail: EUR 66.6m (Q3 18: EUR 10.6m) • Corporates: EUR 41.7m (Q3 18: EUR 14.3m) • Q4 18 NPL sales mainly in Romania, Slovakia and Croatia
21
631
1,758
723
525
632
458
209
783
32
25
618
1,663
536
525
554
463
173
754
22
29
601
1,586
448
492
476
438
152
638
21
30
CZ
AT/OA
4,881 Group
RS
AT/EBOe
AT/SB
RO
SK
HU
HR
Other
5,776 5,337
4.0%
2.0%
4.2%
5.6%
2.1%
8.1%
3.8%
5.5%
12.3%
3.3%
11.7%
3.5%
1.9%
3.8%
4.0%
1.8%
6.8%
3.5%
4.3%
11.6%
1.9%
12.1%
3.2%
1.8%
3.6%
3.3%
1.8%
5.8%
3.3%
3.7%
9.5%
1.7%
12.1%
31/12/17
31/12/18 30/09/18
in EUR m

Page
Business performance: allowances for loans and NPL coverage* – NPL provision coverage rises to 73.0%
• NPL provision coverage rises qoq and yoy, exceptionally strong in Central & Eastern Europe
• Stock of provisions continues to decline at a slower pace than stock of NPLs
• Year-on-year segment trends: • AT/OA: enhanced coverage and significant decrease of NPLs
triggered by write-offs in connection with NPL sales • RO: substantial decrease of NPLs due to recoveries and large-
scale write-offs; additional allowances contribute to sharp increase of coverage ratio
• HU: decreasing coverage because of sales and write-offs of highly provisioned NPLs
• HR: improved coverage due to additional allowances and sharp decrease of NPLs as a result of recoveries and large-scale write-offs (partially in connection with NPL sales)
• Quarter-on-quarter segment trends:
• RO: despite sharp reduction in provisions due to NPL sales and write-offs, the NPL coverage ratio rose significantly based on additional bookings for already defaulted Corporates
• AT/SB: lower provisions due to portfolio upgrades; coverage remains stable
22
360
1,026
363
486
586
365
186
556
36
14
376
1,016
256
509
520
374
138
537
31
17
368
971
251
497
477
354
128
469
29
16
Group
AT/EBOe
CZ
AT/SB
AT/OA
RO
SK
RS
HU
HR
Other
3,977
3,563 3,774
68.8%
57.1%
58.3%
50.2%
92.5%
92.7%
79.7%
89.3%
70.9%
112.0%
56.6%
70.7%
60.8%
61.1%
47.8%
97.1%
93.8%
80.8%
79.6%
71.2%
139.0%
57.7%
73.0%
61.3%
61.2%
56.1%
101.2%
100.3%
80.9%
84.6%
73.5%
139.4%
52.9%
31/12/17 30/09/18 31/12/18
in EUR m *) To ensure comparability with historically reported, pre-IFRS9 NPL coverage ratios, non-performing loans include NPLs from all categories of customer loans.

Page
Business performance: other result – Other result improves yoy
• Yoy: slight improvement despite sale of participation in Q4 17 • Qoq other operating result deteriorated due to allocation of
additional litigation provisions, primarily in Austria
• Year-on-year segment trends: • AT/EBOe: deterioration due to booking of litigation provisions • AT/SB: release of provisions in Q4 18, shift to impairment result • AT/OA: improvement due to booking of legal provisions in Q4
17, shift of off balance sheet provisions to impairment result in 2018
• CZ: Q4 17 burdened by impairments on branches • RO: shift of off balance sheet provisions to impairment result • Other: Q4 17 benefitted from sale of participation, while other
operating result remained flat
• Quarter-on-quarter segment trends: • AT/EBOe: see above • AT/SB: see above • AT/OA: deterioration mainly attributable to reversal of provision
in Commercial Real Estate in Q3 18 • CZ: Q3 18 impacted by branch impairments • RO: lower other result due to impairments on buildings • Other: Q4 18 burdened by revaluation effects
23
3
6
-31
-28
-37
-17
-14
1
41
5
-2
25
-30
-6
-9
-12
0
-1
-1
-24
17
10
1
-21
-12
-13
-2
-28
AT/EBOe
-31 Group
0
AT/SB
-72
AT/OA
CZ
RO
SK
HU
HR
RS
Other
-75
0
in EUR m
Q4 17 Q3 18 Q4 18
Page
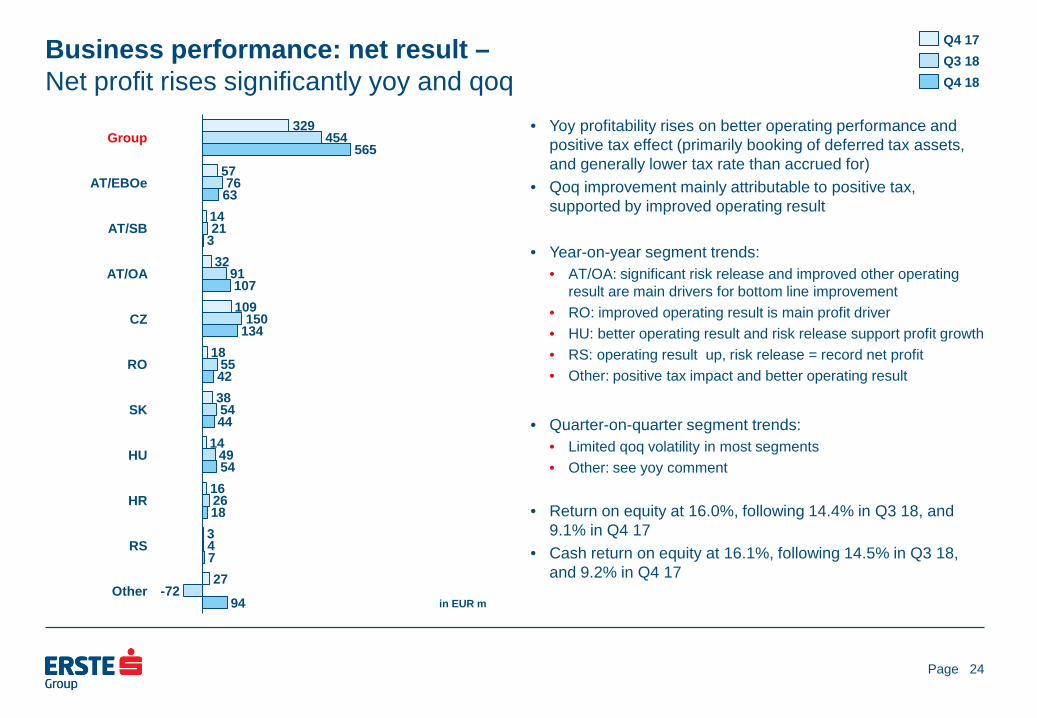
Business performance: net result – Net profit rises significantly yoy and qoq
• Yoy profitability rises on better operating performance and positive tax effect (primarily booking of deferred tax assets, and generally lower tax rate than accrued for)
• Qoq improvement mainly attributable to positive tax, supported by improved operating result
• Year-on-year segment trends: • AT/OA: significant risk release and improved other operating
result are main drivers for bottom line improvement • RO: improved operating result is main profit driver • HU: better operating result and risk release support profit growth • RS: operating result up, risk release = record net profit • Other: positive tax impact and better operating result
• Quarter-on-quarter segment trends:
• Limited qoq volatility in most segments • Other: see yoy comment
• Return on equity at 16.0%, following 14.4% in Q3 18, and
9.1% in Q4 17 • Cash return on equity at 16.1%, following 14.5% in Q3 18,
and 9.2% in Q4 17
24
329
57
14
32
109
18
38
14
16
3
27
454
76
21
91
150
55
54
49
26
4
-72
565
63
3
107
134
42
44
54
18
7
94
SK
Group
AT/EBOe
RO
AT/SB
Other
HU
AT/OA
CZ
HR
RS
in EUR m
Q4 18
Q4 17 Q3 18

Page
Presentation topics
25
• Executive summary • Business environment • Business performance • Assets and liabilities • Outlook • Additional information

Page
Assets and liabilities: YTD overview – Loan/deposit ratio stable at 91.8% at Dec 18 (Dec 17: 92.4 %)
Assets (EUR bn)
26
Assets (in %)
Liabilities & equity (EUR bn)
Liabilities & equity (in %)
21.8
139.5
42.8
9.1
5.9 31/12/17
1.5 1.5
17.5
43.9
19.1
149.3
5.4 31/12/18
220.7 236.8
Loans to banks
Cash Trading, financial assets
Net loans Intangibles Miscellaneous assets
162.6
3.4 16.3
151.0
31/12/17
25.1
18.3 6.5
2.5 17.7
29.7 5.4
18.9 31/12/18
220.7 236.8
Trading liabilities
Debt securities
Bank deposits Customer deposits
Miscellaneous liabilities Equity
0.7% 0.6%
63.2% 63.1%
8.1%
19.4% 18.6%
9.9% 7.4%
31/12/17
4.1%
2.7% 2.3% 31/12/18
100%
8.3% 8.0% 3.0% 2.3%
11.4% 12.6%
68.4% 68.7%
7.4% 7.5% 1.6% 1.1%
31/12/17
100%
31/12/18
Page
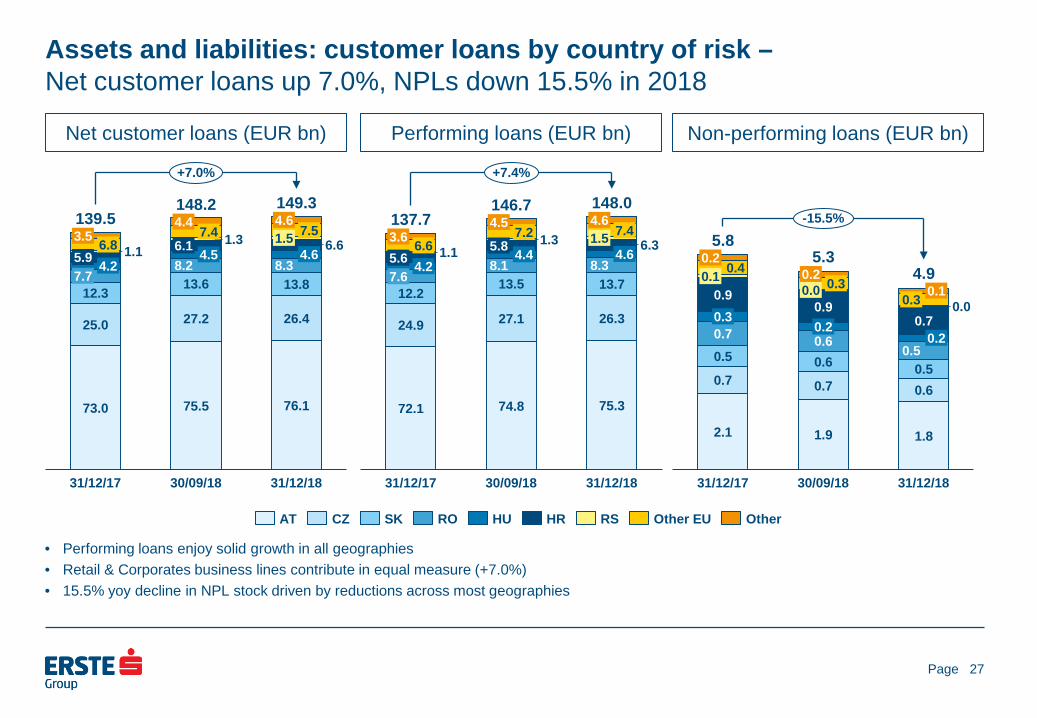
Assets and liabilities: customer loans by country of risk – Net customer loans up 7.0%, NPLs down 15.5% in 2018
Net customer loans (EUR bn)
Performing loans (EUR bn)
27
Non-performing loans (EUR bn)
• Performing loans enjoy solid growth in all geographies • Retail & Corporates business lines contribute in equal measure (+7.0%) • 15.5% yoy decline in NPL stock driven by reductions across most geographies
1.1 4.5 3.5 6.8
12.3
4.2
27.2
5.9
31/12/18
7.7
25.0
73.0
31/12/17
1.3 6.1 8.2
75.5
13.6
30/09/18
4.6
6.6 7.5 1.5
139.5
4.6
148.2
8.3 13.8
26.4
76.1
7.4 4.4
149.3
+7.0%
AT CZ SK RO HU HR RS Other EU Other
72.1
3.6 6.6 1.1 4.2 5.6
4.5
7.6 12.2
31/12/17
24.9
7.2 1.3 5.8
13.5
27.1
74.8
30/09/18
7.4 6.3
8.3 4.6
13.7
26.3
75.3
4.6
31/12/18
1.5 4.4
146.7 137.7
148.0
8.1
+7.4%
0.7
0.5 0.6
0.7
0.2
0.5
5.3
0.7
0.6
0.4 0.1 0.9
0.2 0.3
2.1
0.0
31/12/17
0.0 0.9 0.2
1.9
30/09/18
0.1 0.3 0.7
0.5 0.6
1.8
31/12/18
0.2 0.3
5.8
4.9
-15.5%

Page
Assets and liabilities: financial and trading assets * – LCR at excellent 150.3%
By geography in EUR bn
By debtor type
28
Liquidity buffer in EUR bn
• Liquidity buffer is defined as unencumbered collateral plus cash
• Total liabilities are defined as total on balance sheet liabilities excluding total equity
4.6
8.6
0.8
9.4
7.7
3.3
30/09/18
5.0
31/12/17
9.3
0.7 3.7
8.9
5.0
4.8
8.6
9.0
3.5
9.5
9.1
0.7
4.9
5.3
31/12/18
39.4 41.0 41.8
+6.1%
Other DE HU RO
SK CZ AT
83.1% 82.1% 81.6%
7.8% 8.6% 9.0% 9.2% 9.3% 9.4%
100%
31/12/17 30/09/18 31/12/18
Other Banks Sovereign
51.2 55.5
47.3
58.7
26.7% 27.4%
21.9%
26.9%
31/12/16 30/09/18 31/12/17 31/12/18
Liquidity buffer Liquidity buffer as % of total liabilities
* Excludes derivatives held for trading.

Page
Assets and liabilities: customer deposit funding – Customer deposits grow by 7.7% in 2018, driven by households
By customer type in EUR bn
By product type
29
in EUR bn
Highlights • Continued deposit inflows driven by Retail
segment with highest demand for overnight deposits amid low interest rate environment
• Solid growth also in corporate and public sector deposits
• Increasing share of overnight deposits with significantly longer behavioural maturity provides a cost effective funding source
1.1
159.8 0.0 0.1
31/12/17
50.6
99.3
1.4
51.2
107.2
31/12/18 30/09/18
0.2 1.5
50.7
110.2
151.0 162.6
FV deposits Repurchase agreements Term deposits Overnight deposits
0.0 0.2
7.6 9.7
104.3
29.3
31/12/17
151.0 0.1 9.2 11.2
30.5
108.9
30/09/18
8.7 10.6
31/12/18
31.2
111.9
159.8 162.6
+7.7%
FV deposits
Households
Other financial corporations General governments
Non-financial corporations

Page
Assets and liabilities: debt vs interbank funding – Taking advantage of favourable market conditions
Debt securities issued in EUR bn
Interbank deposits in EUR bn
30
• After periods of reduced wholesale funding, volumes increased again in 2018 led by mortgage covered bond issuances
• Stable development of interbank deposits
9.0
0.2 0.9
1.2
0.9
0.1
31/12/17
5.8 5.9
8.8
29.7
7.9
0.3 1.1
11.1 10.6
28.2
0.4 1.2 31/12/18 30/09/18
1.0
0.4 2.0
5.8 8.5
25.1
+18.5%
Sub debt
Certificates of deposit Senior unsec. bonds
Public sector CBs
Other CDs, name cert’s Mortgage CBs
Other
30/09/18
12.0
1.0
3.5
11.9
31/12/17
11.0
6.0
2.2
4.3
1.4
16.3
31/12/18
19.1 17.7
+8.0%
Overnight deposits Term deposits Repurchase agreements

Page
Assets and liabilities: LT funding – Limited LT funding needs in 2019
Maturity profile of debt
31
• One single benchmark redemption in May 2019 only; thus timing flexibility in new issuance • Funding needs in 2019 amount to approx. EUR 3.8bn in various seniorities • When determined, MREL needs are likely to be met with a mix of own funds, senior non-preferred and senior preferred
instruments; inaugural NPS issuance by Erste Group Bank AG might happen in 2019 • Erste Group targets to fill 1.5%-AT1 bucket by year-end 2020
2023 2020 2019 2021 2024 2022 2026 2025
3.1
2027 2028 2029 2030 2031+
2.5 2.7
3.2
2.0 1.8
1.6 1.4 1.4 1.4
0.1 0.2 0.4
Debt CEE Senior unsec. bonds Covered bonds Capital exc Tier 1
in EUR bn

Page
Basel 3 capital (phased-in) in EUR bn
Risk-weighted assets (phased-in)
32
in EUR bn
Basel 3 capital ratios (phased-in)
• CET1 capital: +EUR 805m, due to: • Significant increase in retained earnings
and minority interest recognised in CET1, partly offset by IFRS9-led reclassification of own liabilities to FV
• Available distributable items (ADIs) at EUR 2.7bn (pre share dividend)
• Credit RWA: +EUR 6.6bn in 2018 • Business effects (loan growth): +EUR 6.3bn • Regulatory one-off effects (higher sovereign
and equity RWA): +EUR 1.6bn • Portfolio changes (migration): -EUR 2.2bn
• Operational risk RWA down yoy and qoq on implementation of new model
• B3FL CET1 ratio at 13.5% at 31 Dec 2018 (YE 2017: 12.9%)
• B3FL total capital ratio at 18.1% (YE17: 18.2%)
31/12/17
0.7 4.9
31/03/18
14.7
4.8 1.0
14.3
4.6
30/06/18
1.0
14.7
4.4 1.0
14.7
30/09/18
4.4 1.0
15.5
31/12/18
20.3 20.1 20.3 20.1 20.9
Tier 2 AT1 CET1
2.9 17.9
89.2
3.4
31/12/17
17.9
92.8
31/03/18
117.0 3.6 110.0 17.8
94.8
30/06/18
3.7
30/09/18
17.7
95.5
3.4 15.2
95.9
31/12/18
114.0 116.3 114.6
Market risk Credit RWA Op risk
31/12/17 31/03/18
18.5
%
31/12/18 30/06/18 30/09/18
12.6
%
13.4
%
14.0
%
12.6
%
13.4
% 17
.6%
13.5
% 17
.4%
12.5
%
13.4
% 17
.2%
13.5
%
14.4
% 18
.2%
CET1 Tier 1 Total capital
Assets and liabilities: capital position – Internal B3FL CET1-target for 2020 of 13.5% met early*
* See footnote 1 on page 7.

Page
Presentation topics
33
• Executive summary • Business environment • Business performance • Assets and liabilities • Outlook • Additional information

Page
• Real GDP growth of approx. 3% expected in 2019 in CEE and above 2% in Austria • Real GDP growth to be driven by solid domestic demand, as real wage growth and
low unemployment support economic activity in CEE • Solid public finances across CEE
Macro outlook 2019
• ROTE for 2019 targeted at >11% (based on average tangible equity) • Revenue growth > cost growth based on mid-single digit loan growth • Risk costs to rise, but to remain at historically low levels (10-20bps) • Other operating result to be negatively impacted by Romanian banking tax • Tax rate expected below 20%
Business outlook 2019
• Impact from other than expected interest rate development • Political or regulatory measures against banks • Geopolitical risks and global economic risks
Risk factors for guidance
Conclusion – Outlook 2019
34

Page
Presentation topics
35
• Executive summary • Business environment • Business performance • Assets and liabilities • Outlook • Additional information

Page
Additional information: new segmentation – Business line and geographic view
Retail
Erste Group – Business segments
Corporates Savings Banks
Group Markets
Group Corporate
Center
Intragroup Elimination
Erste Group – Geographical segmentation
Austria Central and Eastern Europe Other
EBOe & Subsidiaries (AT/EBOe)
Savings Banks (AT/SB)
Other Austria
(AT/OA)
Czech Republic
(CZ)
Slovakia (SK)
Romania (RO
Hungary (HU)
Croatia (HR)
Serbia (RS)
• Holding Business • Erste Group Immorent • Erste Asset Management • Intermarket Bank AG
• Asset/Liability Management • Local Corporate Center
• SME • Local Large Corporate • Group Large Corporate • Commercial Real Estate • Public Sector
• Other Subsidiaries • Group bookings • Holding Corporate Center • Free Capital
• Holding ALM • Holding CC • Other Subsidiaries • Group bookings and
IC elimination • Free Capital
36
ALM & Local CC
(ALM&LCC)

Page
Additional information: income statement – Year-to-date and quarterly view
37
in EUR million 2017 2018 YOY-Δ Q4 17 Q3 18 Q4 18 YOY-Δ QOQ-ΔNet interest income 4,353.2 4,582.0 5.3% 1,123.9 1,158.2 1,210.0 7.7% 4.5%
Interest income 5,624.4 5,174.3 -8.0% 1,400.3 1,314.0 1,374.9 -1.8% 4.6%Other similar income 0.0 1,772.6 n/a 0.0 448.8 437.0 n/a -2.6%Interest expenses -1,271.3 -1,003.4 -21.1% -276.4 -262.5 -270.6 -2.1% 3.1%Other similar expenses 0.0 -1,361.5 n/a 0.0 -342.1 -331.3 n/a -3.2%
Net fee and commission income 1,851.6 1,908.4 3.1% 489.7 471.4 477.7 -2.4% 1.3%Fee and commission income 2,329.4 2,377.0 2.0% 605.7 584.0 587.0 -3.1% 0.5%Fee and commission expenses -477.8 -468.6 -1.9% -116.1 -112.6 -109.3 -5.8% -3.0%
Dividend income 43.7 29.0 -33.6% 6.2 4.8 6.7 7.9% 39.7%Net trading result 222.8 -1.7 n/a 83.5 -62.2 48.7 -41.7% n/aGains/losses from financial instruments measured at fair value through profit or loss -12.3 195.4 n/a -24.4 99.2 29.6 n/a -70.1%Net result from equity method investments 15.9 13.1 -17.4% 5.7 3.0 3.1 -45.8% 1.8%Rental income from investment properties & other operating leases 194.2 189.4 -2.5% 47.6 47.7 43.6 -8.5% -8.6%Personnel expenses -2,388.6 -2,474.2 3.6% -641.3 -613.8 -643.8 0.4% 4.9%Other administrative expenses -1,309.6 -1,234.9 -5.7% -384.4 -294.0 -313.4 -18.5% 6.6%Depreciation and amortisation -460.0 -472.0 2.6% -118.9 -118.0 -121.7 2.3% 3.1%Gains/losses from financial assets and liabilities not measured at fair value through profit or loss, net 156.4 0.0 -100.0% 85.7 0.0 0.0 -100.0% n/aGains/losses from derecognition of financial assets measured at amortised cost 0.0 0.1 n/a 0.0 0.5 -0.1 n/a n/aOther gains/losses from derecognition of financial instruments not measured at fair value through profit or loss 0.0 5.7 n/a 0.0 1.0 -4.1 n/a n/aGains/losses from reclassification from amortised cost to fair value through profit or loss 0.0 0.0 n/a 0.0 0.0 0.0 n/a n/aGains/losses from reclassification from fair value through other comprehensive income to fair value through profit or loss 0.0 0.0 n/a 0.0 0.0 0.0 n/a n/aNet impairment loss on financial assets -132.0 0.0 -100.0% -60.5 0.0 0.0 -100.0% n/aImpairment result from financial instruments 0.0 59.3 n/a 0.0 28.9 -42.9 n/a n/aOther operating result -457.4 -304.5 -33.4% -160.9 -32.4 -67.6 -58.0% >100.0%
Levies on banking activities -105.7 -112.2 6.2% -23.6 -24.8 -24.1 2.3% -3.0%Pre-tax result from continuing operations 2,077.8 2,495.0 20.1% 451.7 694.3 626.0 38.6% -9.8%Taxes on income -410.1 -332.4 -18.9% -44.2 -120.0 22.5 n/a n/aNet result for the period 1,667.7 2,162.5 29.7% 407.5 574.2 648.5 59.1% 12.9%
Net result attributable to non-controlling interests 351.5 369.1 5.0% 78.9 120.3 83.3 5.6% -30.7%Net result attributable to owners of the parent 1,316.2 1,793.4 36.3% 328.6 454.0 565.2 72.0% 24.5%
Operating income 6,669.0 6,915.6 3.7% 1,732.1 1,722.1 1,819.5 5.0% 5.7%Operating expenses -4,158.2 -4,181.1 0.5% -1,144.7 -1,025.8 -1,078.8 -5.8% 5.2%Operating result 2,510.8 2,734.6 8.9% 587.5 696.3 740.6 26.1% 6.4%
Year-to-date view Quarterly view

Page
Additional information: group balance sheet – Assets
38
in EUR million Dec 17 Mar 18 Jun 18 Sep 18 Dec 18 YOY-Δ YTD-Δ QOQ-ΔCash and cash balances 21,796 25,246 16,888 15,237 17,549 -19.5% -19.5% 15.2%Financial assets held for trading 6,349 6,603 6,888 6,034 5,584 -12.0% -12.0% -7.4%
Derivatives 3,333 3,696 3,804 3,303 3,037 -8.9% -8.9% -8.0%Other financial assets held for trading 3,016 2,907 3,083 2,731 2,547 -15.6% -15.6% -6.7%
Financial assets at fair value through profit or loss 543 0 0 0 0 -100.0% -100.0% n/aNon-trading financial assets at fair value through profit or loss 0 3,405 3,430 3,403 3,310 n/a n/a -2.7%
Equity instruments 0 278 279 303 372 n/a n/a 22.8%Debt securities 0 2,727 2,739 2,717 2,651 n/a n/a -2.4%Loans and advances to banks 0 0 0 0 0 n/a n/a n/aLoans and advances to customers 0 401 412 383 287 n/a n/a -25.2%
Financial assets available for sale 16,060 0 0 0 0 -100.0% -100.0% n/aFinancial assets at fair value through other comprehensive income 0 10,289 9,965 9,850 9,272 n/a n/a -5.9%
Equity instruments 0 262 242 259 239 n/a n/a -7.9%Debt securities 0 10,027 9,723 9,591 9,033 n/a n/a -5.8%
Financial assets held to maturity 19,800 0 0 0 0 -100.0% -100.0% n/aLoans and receivables to credit institutions 9,126 0 0 0 0 -100.0% -100.0% n/aLoans and receivables to customers 139,532 0 0 0 0 -100.0% -100.0% n/aFinancial assets at amortised cost 0 172,805 180,748 188,323 189,106 n/a n/a 0.4%
Debt securities 0 23,710 24,029 25,430 26,050 n/a n/a 2.4%Loans and advances to banks 0 11,944 17,149 19,972 19,103 n/a n/a -4.4%Loans and advances to customers 0 137,151 139,570 142,921 143,953 n/a n/a 0.7%
Finance lease receivables 0 3,561 3,676 3,715 3,763 n/a n/a 1.3%Hedge accounting derivatives 884 103 116 90 132 -85.0% -85.0% 47.1%Property and equipment 2,387 2,342 2,363 2,327 2,293 -3.9% -3.9% -1.5%Investment properties 1,112 1,106 1,102 1,100 1,159 4.3% 4.3% 5.4%Intangible assets 1,524 1,511 1,507 1,483 1,507 -1.1% -1.1% 1.7%Investments in associates and joint ventures 198 197 201 200 198 -0.1% -0.1% -0.9%Current tax assets 108 122 125 110 101 -5.9% -5.9% -8.2%Deferred tax assets 258 319 320 333 402 55.9% 55.9% 20.7%Assets held for sale 214 228 203 196 213 -0.4% -0.4% 9.0%Trade and other receivables 0 947 1,072 1,292 1,318 n/a n/a 2.0%Other assets 769 1,235 1,274 1,136 882 14.8% 14.8% -22.3%Total assets 220,659 230,018 229,878 234,827 236,792 7.3% 7.3% 0.8%
Quarterly data Change

Page
Additional information: group balance sheet – Liabilities and equity
39
in EUR million Dec 17 Mar 18 Jun 18 Sep 18 Dec 18 YOY-Δ YTD-Δ QOQ-ΔFinancial liabilities held for trading 3,423 2,940 3,070 2,865 2,508 -26.7% -26.7% -12.5%
Derivatives 2,934 2,384 2,529 2,153 2,000 -31.8% -31.8% -7.1%Other financial liabilities held for trading 489 555 541 712 508 3.9% 3.9% -28.7%
Financial liabilities at fair value through profit or loss 1,801 14,478 14,473 14,267 14,122 >100.0% >100.0% -1.0%Deposits from customers 49 58 56 62 212 >100.0% >100.0% >100.0%Debt securities issued 1,753 13,855 13,874 13,668 13,446 >100.0% >100.0% -1.6%Other financial liabilities 0 565 544 537 464 n/a n/a -13.5%
Financial liabilities at amortised cost 191,711 189,427 189,875 194,025 196,863 2.7% 2.7% 1.5%Deposits from banks 16,349 20,988 17,867 19,086 17,658 8.0% 8.0% -7.5%Deposits from customers 150,921 155,248 156,775 159,765 162,426 7.6% 7.6% 1.7%Debt securities issued 23,342 12,596 14,601 14,582 16,293 -30.2% -30.2% 11.7%Other financial liabilities 1,099 595 633 591 486 -55.8% -55.8% -17.7%
Finance lease liabilities 0 0 0 0 0 n/a n/a -3.4%Hedge accounting derivatives 360 277 311 342 277 -23.1% -23.1% -19.1%Fair value changes of hedged items in portfolio hedge of interest rate risk 666 0 0 0 0 -100.0% -100.0% >100.0%Provisions 1,648 1,799 1,688 1,628 1,705 3.4% 3.4% 4.7%Current tax liabilities 101 114 127 126 99 -1.8% -1.8% -21.5%Deferred tax liabilities 61 54 65 67 23 -62.8% -62.8% -65.9%Liabilities associated with assets held for sale 3 4 3 3 3 20.3% 20.3% 9.1%Other liabilities 2,596 2,958 2,558 3,109 2,323 -10.5% -10.5% -25.3%Total equity 18,288 17,968 17,708 18,396 18,869 3.2% 3.2% 2.6%
Equity attributable to non-controlling interests 4,416 4,353 4,402 4,518 4,494 1.8% 1.8% -0.5%Additional equity instruments 993 993 993 993 993 0.0% 0.0% 0.0%Equity attributable to owners of the parent 12,879 12,622 12,313 12,884 13,381 3.9% 3.9% 3.9%
Subscribed capital 860 860 860 860 860 0.0% 0.0% 0.0%Additional paid-in capital 1,477 1,477 1,477 1,477 1,477 0.0% 0.0% 0.0%Retained earnings and other reserves 10,542 10,286 9,977 10,548 11,045 4.8% 4.8% 4.7%
Total liabilities and equity 220,659 230,018 229,878 234,827 236,792 7.3% 7.3% 0.8%
Quarterly data Change
Page
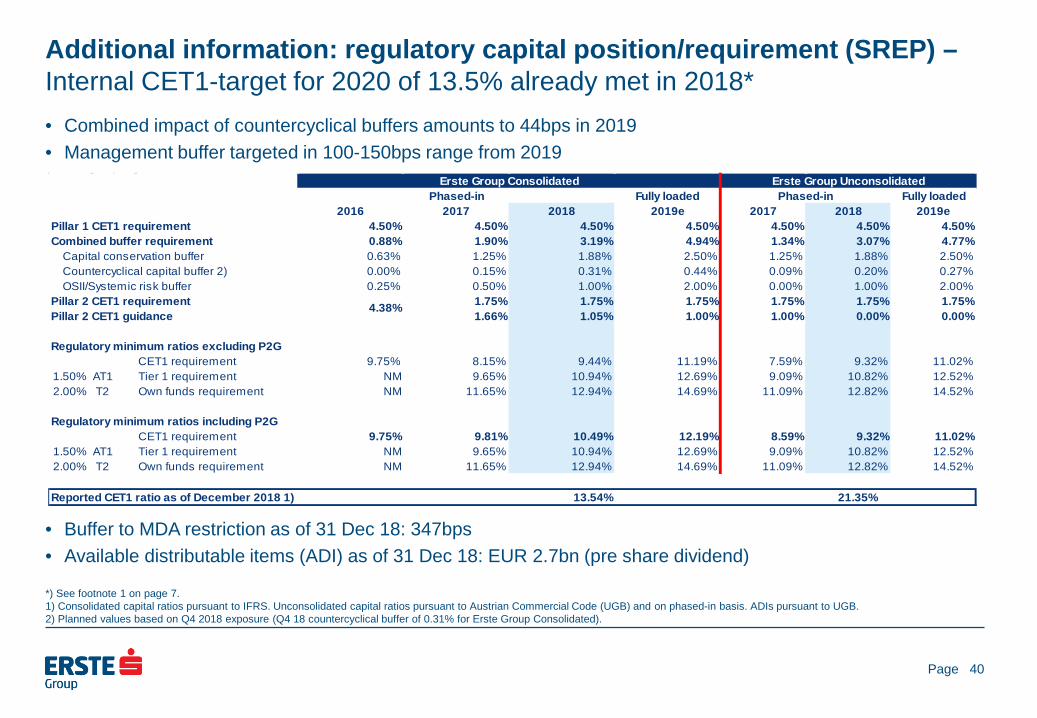
Additional information: regulatory capital position/requirement (SREP) – Internal CET1-target for 2020 of 13.5% already met in 2018* • Combined impact of countercyclical buffers amounts to 44bps in 2019 • Management buffer targeted in 100-150bps range from 2019
• Buffer to MDA restriction as of 31 Dec 18: 347bps • Available distributable items (ADI) as of 31 Dec 18: EUR 2.7bn (pre share dividend)
40
*) See footnote 1 on page 7. 1) Consolidated capital ratios pursuant to IFRS. Unconsolidated capital ratios pursuant to Austrian Commercial Code (UGB) and on phased-in basis. ADIs pursuant to UGB. 2) Planned values based on Q4 2018 exposure (Q4 18 countercyclical buffer of 0.31% for Erste Group Consolidated).
Fully loaded Fully loaded2016 2017 2018 2019e 2017 2018 2019e
Pillar 1 CET1 requirement 4.50% 4.50% 4.50% 4.50% 4.50% 4.50% 4.50%Combined buffer requirement 0.88% 1.90% 3.19% 4.94% 1.34% 3.07% 4.77%
Capital conservation buffer 0.63% 1.25% 1.88% 2.50% 1.25% 1.88% 2.50%Countercyclical capital buffer 2) 0.00% 0.15% 0.31% 0.44% 0.09% 0.20% 0.27%OSII/Systemic risk buffer 0.25% 0.50% 1.00% 2.00% 0.00% 1.00% 2.00%
Pillar 2 CET1 requirement 1.75% 1.75% 1.75% 1.75% 1.75% 1.75%Pillar 2 CET1 guidance 1.66% 1.05% 1.00% 1.00% 0.00% 0.00%
Regulatory minimum ratios excluding P2GCET1 requirement 9.75% 8.15% 9.44% 11.19% 7.59% 9.32% 11.02%
1.50% AT1 Tier 1 requirement NM 9.65% 10.94% 12.69% 9.09% 10.82% 12.52%2.00% T2 Own funds requirement NM 11.65% 12.94% 14.69% 11.09% 12.82% 14.52%
Regulatory minimum ratios including P2GCET1 requirement 9.75% 9.81% 10.49% 12.19% 8.59% 9.32% 11.02%
1.50% AT1 Tier 1 requirement NM 9.65% 10.94% 12.69% 9.09% 10.82% 12.52%2.00% T2 Own funds requirement NM 11.65% 12.94% 14.69% 11.09% 12.82% 14.52%
Reported CET1 ratio as of December 2018 1) 13.54% 21.35%
Phased-inErste Group Consolidated Erste Group Unconsolidated
4.38%
Phased-in
Page
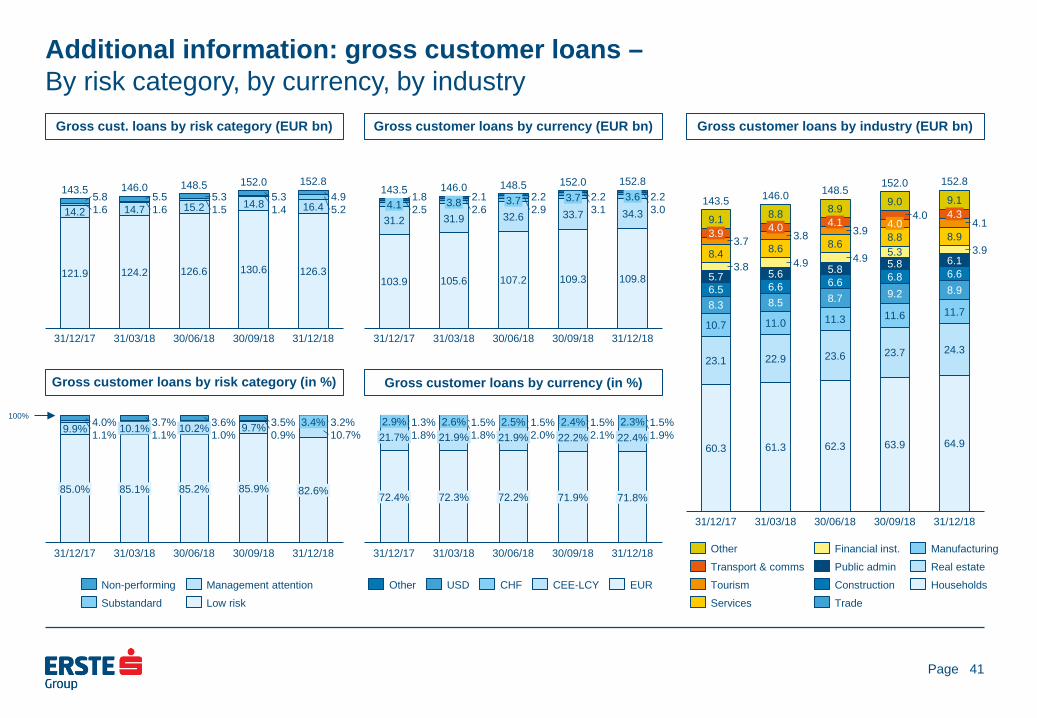
Additional information: gross customer loans – By risk category, by currency, by industry
Gross cust. loans by risk category (EUR bn)
41
Gross customer loans by currency (EUR bn) Gross customer loans by industry (EUR bn)
Gross customer loans by risk category (in %)
Gross customer loans by currency (in %)
5.5 5.8 146.0
14.2 1.6 15.2 1.6 14.7
124.2
31/03/18
130.6
30/06/18 31/12/17
5.3 1.5
152.0
126.6
16.4 5.3 1.4 14.8
30/09/18
4.9
121.9
31/12/18
5.2
126.3
143.5 148.5 152.8
Low risk Non-performing Substandard
Management attention
9.9% 9.7% 10.7% 1.1% 1.1% 1.0% 0.9% 4.0% 3.7% 3.6% 3.5% 3.2%
30/06/18
85.1% 85.2%
31/12/17
85.0%
10.1%
31/03/18
10.2%
85.9%
30/09/18
3.4%
82.6%
31/12/18
100%
2.5 1.8
103.9
31.2 4.1
143.5 3.6 3.1
2.1 2.6
31/12/18 30/06/18
107.2
3.8 31.9
105.6
31/03/18
2.2
31/12/17
2.9 3.7
32.6 33.7 2.2 3.7
109.3
30/09/18
2.2
109.8
3.0 34.3
146.0 148.5 152.0 152.8
Other USD CHF CEE-LCY EUR
1.8% 1.8% 2.0% 2.1% 1.9% 1.3% 1.5% 1.5% 1.5% 1.5%
72.4%
2.9%
31/12/17
21.7% 2.6%
21.9% 21.9%
72.3%
31/03/18
2.5%
72.2%
30/06/18
2.4% 22.2%
71.9%
30/09/18
2.3% 22.4%
71.8%
31/12/18
5.7
9.1 4.3
6.6
3.9
62.3
3.8 6.6
9.1
3.7
6.5 8.3
4.9
10.7
3.9
23.1
60.3
6.1
8.8
31/12/17
8.8
23.7
6.6
3.8
11.0
8.6
5.6
4.0
22.9
61.3
143.5
31/03/18
8.9 4.1
5.8
11.3 8.5 8.7
8.6
63.9
4.9 5.8
23.6
30/06/18
9.0
4.1
5.3 3.9
6.8 9.2
11.6
30/09/18
8.9
8.9
11.7
4.0
64.9
31/12/18
146.0 148.5 152.0 152.8
4.0
8.4
24.3
Other Transport & comms
Financial inst.
Tourism Services
Public admin
Trade Construction
Manufacturing Real estate Households
Page
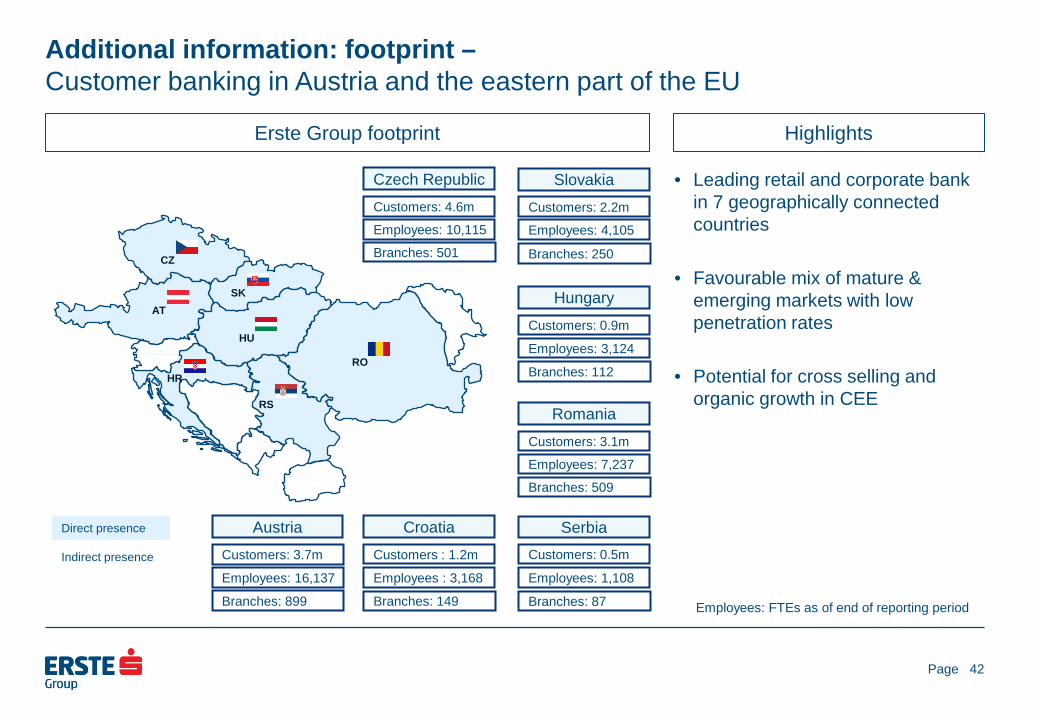
• Leading retail and corporate bank in 7 geographically connected countries
• Favourable mix of mature & emerging markets with low penetration rates
• Potential for cross selling and organic growth in CEE
Additional information: footprint – Customer banking in Austria and the eastern part of the EU
Erste Group footprint Highlights
42
Direct presence
Indirect presence
Customers: 0.9m
Hungary
Employees: 3,124
Branches: 112
Customers: 3.1m
Romania
Employees: 7,237
Branches: 509
Customers: 0.5m
Serbia
Employees: 1,108
Branches: 87
Customers : 1.2m
Croatia
Employees : 3,168
Branches: 149
Customers: 4.6m
Czech Republic
Employees: 10,115
Branches: 501
Customers: 2.2m
Slovakia
Employees: 4,105
Branches: 250
Customers: 3.7m
Austria
Employees: 16,137
Branches: 899
AT
CZ
SK
HU
RO HR
RS
Employees: FTEs as of end of reporting period
Page
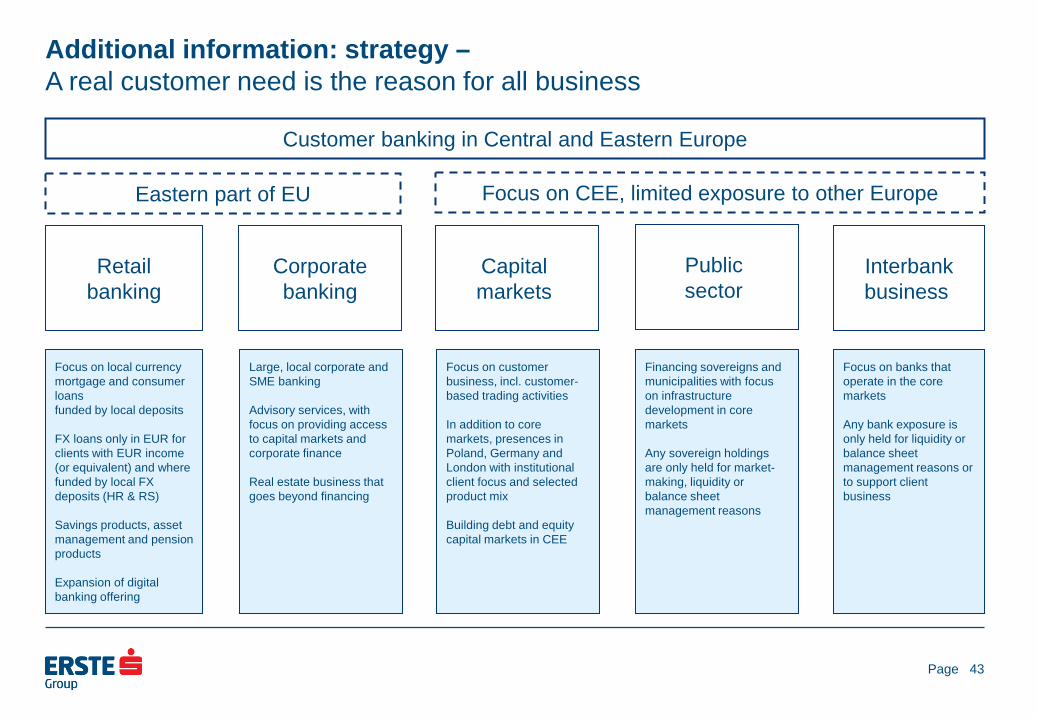
Additional information: strategy – A real customer need is the reason for all business
Retail banking
Corporate banking
Capital markets
Public sector
Interbank business
Customer banking in Central and Eastern Europe
Eastern part of EU Focus on CEE, limited exposure to other Europe
Focus on local currency mortgage and consumer loans funded by local deposits FX loans only in EUR for clients with EUR income (or equivalent) and where funded by local FX deposits (HR & RS) Savings products, asset management and pension products Expansion of digital banking offering
Focus on customer business, incl. customer-based trading activities In addition to core markets, presences in Poland, Germany and London with institutional client focus and selected product mix Building debt and equity capital markets in CEE
Financing sovereigns and municipalities with focus on infrastructure development in core markets Any sovereign holdings are only held for market-making, liquidity or balance sheet management reasons
Large, local corporate and SME banking Advisory services, with focus on providing access to capital markets and corporate finance Real estate business that goes beyond financing
Focus on banks that operate in the core markets Any bank exposure is only held for liquidity or balance sheet management reasons or to support client business
43

Page
Additional information: Ratings – Composition of Erste Group Bank AG’s issuer ratings
44
Status as of 5 February 2019
AnchorBusiness Position Strong +1Capital & Earnings Adequate 0Risk Position Adequate 0Funding Above AverageLiquidity Strong
Support
ALAC SupportGRE SupportGroup SupportSovereign Support
Additional Factors
SACP - Stand-Alone Credit Profile
a
00
+
bbb+
+1
0
▲
▲
=Issuer Credit Rating
Long-Term Outlook / Short-Term
A Positive / A-1
00
0
+
Asset Risk baa2Capital baa1Profitability baa3Funding Structure a3Liquid Resources baa1
Business Diversif ication 0Opacity, Complexity 0Corporate Behaviour 0
BCA Baseline Credit Assessment baa1
Affiliate Support 0
Adjusted BCA baa1
LGF Loss Given Failure + 2Government Support 0
Qualitative Factors
Macro ProfileStrong
+Financial Profile
+
+
=Issuer Rating / Senior Unsecured
Long-Term Outlook / Short-Term
A2 Positive / P-1
=+=
A Stable / F1
VR - Viability Rating (Individual Rating )
a
SRF - Support Rating Floor
NF (No Floor)
IDR - Issuer Default Rating Long-Term Outlook / Short-Term

Page
Additional information: shareholder structure – Total number of shares: 429,800,000
By investor By region
45
1 Economic interest Erste Foundation, including Erste Employees Private Foundation 2 Economic interest Savings Banks & Savings Banks Foundations 3 Other parties to the shareholder agreement of Erste Foundation, Savings Banks and CaixaBank * Unidentified institutional and retail investors ** Including Market Makers, Prime Brokerage, Proprietary Trading, Collateral and Stock Lending positions which are visible through custodian banklists Status as of 8 February 2019
11.28%
5.71%
3.08%
9.92%
5.00%
49.46%
4.06%
8.42%
Caixa
Institutional
Other Syndicated 3
Erste Foundation 1
Savings Banks & Savings Banks Foundations 2
0.78% Employees
Retail
BlackRock Inc. 2.29%
Identified Trading **
Unidentified *
27.53%
16.29%
16.60%
25.15%
3.72%
8.42%
Continental Europe
Austria
North America
UK & Ireland
Rest of world
Identified Trading **
2.29%
Unidentified *

Page
Investor relations details
• Erste Group Bank AG, Am Belvedere 1, 1100 Vienna E-mail: [email protected] Internet: http://www.erstegroup.com/investorrelations
http://twitter.com/ErsteGroupIR http://www.slideshare.net/Erste_Group Erste Group IR App for iPad, iPhone and Android http://www.erstegroup.com/de/Investoren/IR_App
Reuters: ERST.VI Bloomberg: EBS AV Datastream: O:ERS ISIN: AT0000652011
• Contacts Thomas Sommerauer Tel: +43 (0)5 0100 17326 e-mail: [email protected] Peter Makray Tel: +43 (0)5 0100 16878 e-mail: [email protected] Simone Pilz Tel: +43 (0)5 0100 13036 e-mail: [email protected] Gerald Krames Tel: +43 (0)5 0100 12751 e-mail: [email protected]
46