ERP1958 Appendixes 6
89
Appendix F STATISTICAL TABLES RELATING TO INCOME, EMPLOYMENT, AND PRODUCTION I I I Digitized for FRASER http://fraser.stlouisfed.org/ Federal Reserve Bank of St. Louis
-
Upload
fraser-federal-reserve-archive -
Category
Documents
-
view
229 -
download
1
Transcript of ERP1958 Appendixes 6
Appendix F
STATISTICAL TABLES RELATING TO INCOME,EMPLOYMENT, AND PRODUCTION
I I I
Digitized for FRASER http://fraser.stlouisfed.org/ Federal Reserve Bank of St. Louis

Digitized for FRASER http://fraser.stlouisfed.org/ Federal Reserve Bank of St. Louis
CONTENTSNational income or expenditure: Page
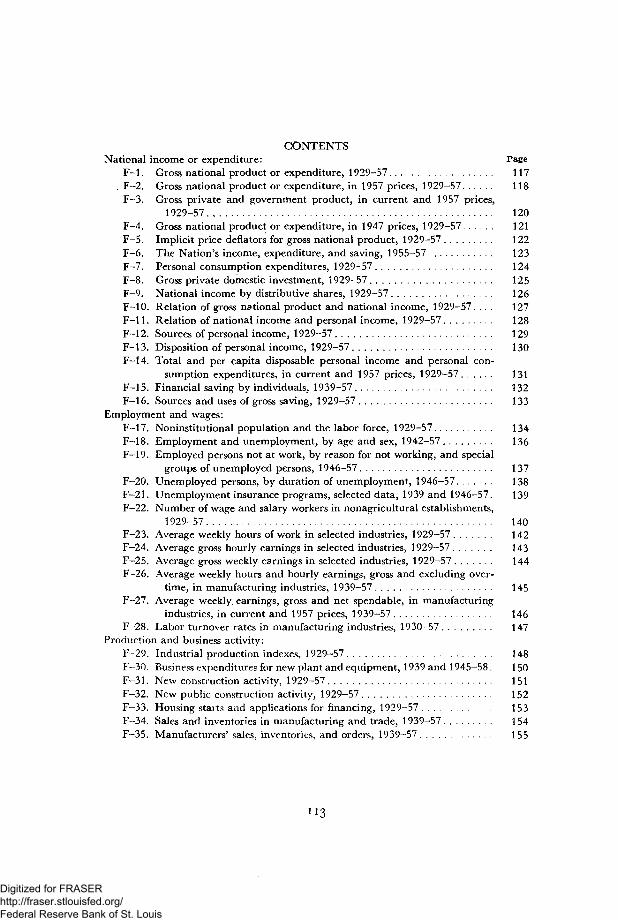
F-l. Gross national product or expenditure, 1929-57 117, F-2. Gross national product or expenditure, in 1957 prices, 1929-57 118
F—3. Gross private and government product, in current and 1957 prices,1929-57 120
F-4, Gross national product or expenditure, in 1947 prices, 1929-57 121F-5. Implicit price deflators for gross national product, 1929-57 122F-6. The Nation's income, expenditure, and saving, 1955-57 123F-7. Personal consumption expenditures, 1929-57 124F~8. Gross private domestic investment, 1929-57 125F-9. National income by distributive shares, 1929-57 126F-10. Relation of gross national product and national income, 1929-57. . . . 127F- l l . Relation of national income and personal income, 1929-57 128F-12. Sources of personal income, 1929-57 129F-l3. Disposition of personal income, 1929-57 130F-l 4. Total and per capita disposable personal income and personal con-
sumption expenditures, in current and 1957 prices, 1929-57 131F-l5. Financial saving by individuals, 1939-57 132F-l6. Sources and uses of gross saving, 1929-57 133
Employment and wages:F-l 7. Noninstitutional population and the labor force, 1929-57 134F-18. Employment and unemployment, by age and sex, 1942-57 136F-l9. Employed persons not at work, by reason for not working, and special
groups of unemployed persons, 1946-57 137F-20. Unemployed persons, by duration of unemployment, 1946-57 138F-21. Unemployment insurance programs, selected data, 1939 and 1946-57. 139F-22. Number of wage and salary workers in nonagricultural establishments,
1929-57 140F-23. Average weekly hours of work in selected industries, 1929-57 142F-24. Average gross hourly earnings in selected industries, 1929-57 143F-25. Average gross weekly earnings in selected industries, 1929-57 144F-26. Average weekly hours and hourly earnings, gross and excluding over-
time, in manufacturing industries, 1939-57 145F-27. Average weekly, earnings, gross and net spendable, in manufacturing
industries, in current and 1957 prices, 1939-57 146F-28. Labor turnover rates in manufacturing industries, 1930-57 147
Production and business activity:F-29. Industrial production indexes, 1929-57 148F--30. Business expenditures for new plant and equipment, 1939 and 1945-58. 150F-31. New construction activity, 1929-57 151F-32. New public construction activity, 1929-57 152F-33. Housing starts and applications for financing, 1929-57 153F-34. Sales and inventories in manufacturing and trade, 1939-57 . 154F-35. Manufacturers' sales, inventories, and orders, 1939-57 155
J I3
Digitized for FRASER http://fraser.stlouisfed.org/ Federal Reserve Bank of St. Louis
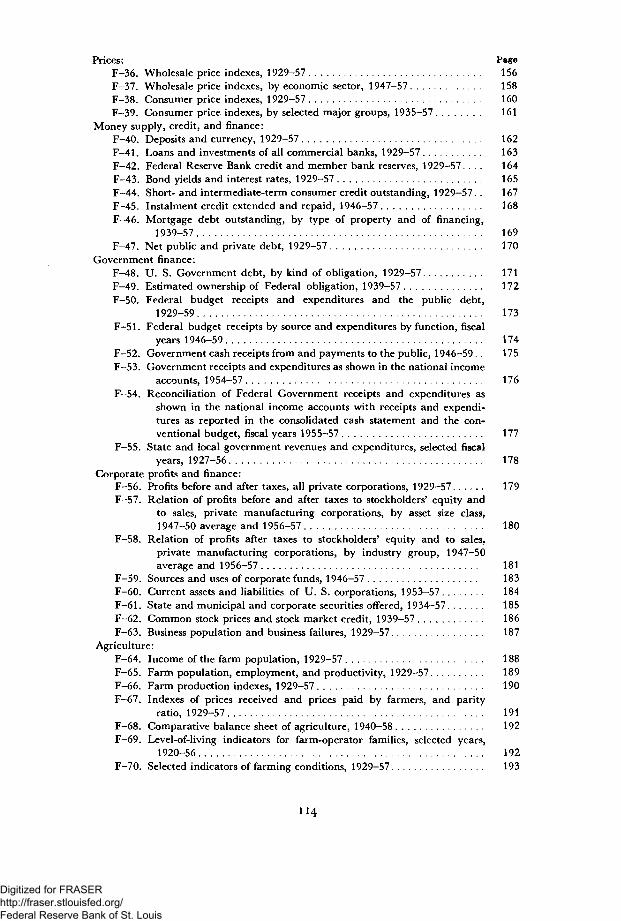
Prices: PageF-36. Wholesale price indexes, 1929-57 156F-37. Wholesale price indexes, by economic sector, 1947-57 158F-38. Consumer price indexes, 1929-57 160F-39. Consumer price indexes, by selected major groups, 1935-57 161
Money supply, credit, and finance:F-40. Deposits and currency, 1929-57 162F-41. Loans and investments of all commercial banks, 1929-57 163F-42. Federal Reserve Bank credit and member bank reserves, 1929-57. . . . 164F-43. Bond yields and interest rates, 1929-57 165F-44. Short- and intermediate-term consumer credit outstanding, 1929-57. . 167F-45. Instalment credit extended and repaid, 1946-57 168F-46. Mortgage debt outstanding, by type of property and of financing,
1939-57 169F-47. Net public and private debt, 1929-57 170
Government finance:F-48. U. S. Government debt, by kind of obligation, 1929-57 171F-49. Estimated ownership of Federal obligation, 1939-57 172F-50. Federal budget receipts and expenditures and the public debt,
1929-59 173F-51. Federal budget receipts by source and expenditures by function, fiscal
years 1946-59 174F-52. Government cash receipts from and payments to the public, 1946-59. . 175F-53. Government receipts and expenditures as shown in the national income
accounts, 1954-57 176F-54. Reconciliation of Federal Government receipts and expenditures as
shown in the national income accounts with receipts and expendi-tures as reported in the consolidated cash statement and the con-ventional budget, fiscal years 1955-57 177
F-55. State and local government revenues and expenditures, selected fiscalyears, 1927-56 178
Corporate profits and finance:F-56. Profits before and after taxes, all private corporations, 1929-57 179F—57. Relation of profits before and after taxes to stockholders' equity and
to sales, private manufacturing corporations, by asset size class,1947-50 average and 1956-57 180
F—58. Relation of profits after taxes to stockholders' equity and to sales,private manufacturing corporations, by industry group, 1947-50average and 1956-57 181
F-59. Sources and uses of corporate funds, 1946-57 183F-60. Current assets and liabilities of U. S. corporations, 1953-57 184F-61. State and municipal and corporate securities offered, 1934-57 185F-62. Common stock prices and stock market credit, 1939-57 186F-63. Business population and business failures, 1929-57 187
Agriculture:F-64. Income of the farm population, 1929-57 188F-65. Farm population, employment, and productivity, 1929-57 189F-66. Farm production indexes, 1929-57 190F-67. Indexes of prices received and prices paid by farmers, and parity
ratio, 1929-57 191F-68. Comparative balance sheet of agriculture, 1940-58 192F—69. Level-of-living indicators for farm-operator families, selected years,
1920-56 192F-70. Selected indicators of farming conditions, 1929-57 193
Digitized for FRASER http://fraser.stlouisfed.org/ Federal Reserve Bank of St. Louis
International transactions: PageF-71. United States balance of payments, 1953-57 194F-72. United States balance of payments with individual areas, 1953-57. . . . 195F-73. United States merchandise exports and imports for consumption, by
leading commodities, 1936-38 average and 1953-57 . . 197"F—74. U. S. Government grants and credits, excluding military supplies and
services, by areas, total postwar period and fiscal years 1953-57. . . . 198F-75. U. S. Government grants of military supplies and services, by areas,
total postwar period and fiscal years 1953-57 199F—76. Estimated gold reserves and dollar holdings of foreign countries, 1937
and 1949-57 199
Digitized for FRASER http://fraser.stlouisfed.org/ Federal Reserve Bank of St. Louis

Digitized for FRASER http://fraser.stlouisfed.org/ Federal Reserve Bank of St. Louis
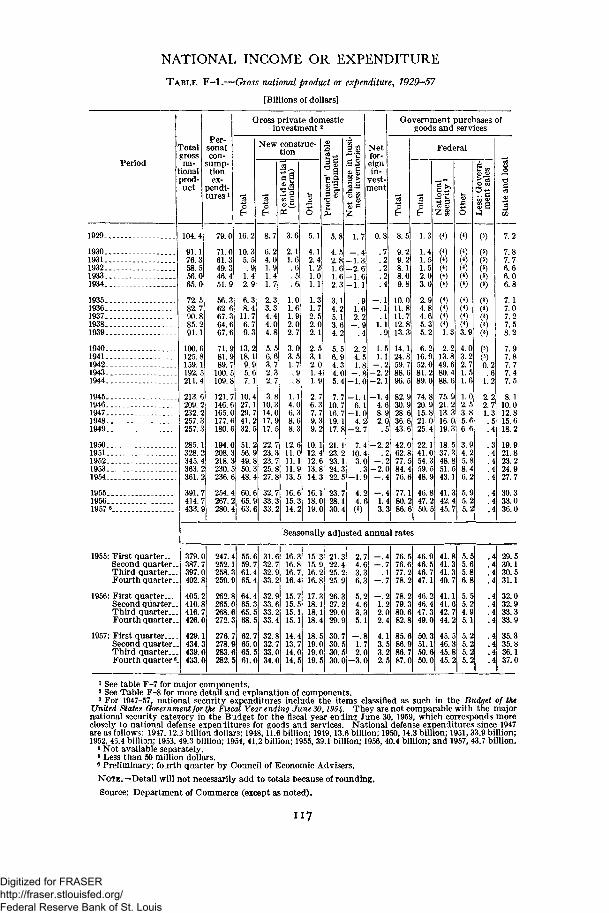
NATIONAL INCOME OR EXPENDITURE
TABLE F—1.—Gross national product or expenditure, 1929—57
[Billions of dollars]
Period
^otalsrossna-
tionalprod-uct
1929.
19301931193219331934
19351936193719381939
19401941194219431944
19451946 .194719481949
19501951195219531954
195519561957«...
1955: First quarter..Second quarter.Third quarter..Fourth quarter.
1956: First quarter..Second quarter.Third quarter..Fourth quarter.
1957: First quarter...Second quarter.Third quarter..Fourth quarter
Per-sonalcon-
sump-tionex-
pendi-tures 1
104.4
91.176.358.556.065.0
72.582.90.885.291.1
100.6125.8159.192.5211.4
213.209.232.257.257.
285.328.345.363.361.
391.414.433.
79.0
71.061.349.346.51.9
56.362.667.364.667.6
71.81.89.7
100.109.8
121.146. e165.177.180.
194.208.218.230.236.
254.267.280.
Gross private domesticinvestment2
16.
10.35.5
.91.42.9
8.411.
13.218.19.95.67.
10.427.29.741.232.5
51.256.49.850. £48.
60.65. S63.
New construc-tion
10.214.017. S17.
22.23.23.25.27.
32.33.33.
3.6
2.11.6.6
12.11.11.11.813.5
16.15.14.
10.12.412.13.14.
16.18.19.
5.8
4.52.81.61.62.3
3.14.25.13.64.2
5.56.94.34.05.
7.710.16.719.
- 1 . 3- 2 . 6
Netfor-eignin-
vest-ment
.91.02.2
2.24.51.8
-l'.C
0.8
- . 1- . 1
.11.1
- 2 .
Government purchases ofgoods and services
9.29.28.18.09.8
10.011.811.12.813.3
14.124.859.788.696.5
82.930.928.636.643.6
42.62. £77.84.4
77.
Federal
1.3
1.41.51.52.03.0
2.94.84.65.35.2
6.216.952.081.289.0
20.915.821.025.4
22.
59. £48. S
46.847.250.
()1.3
2.213.849.680.488.6
75.921.213.316.019.3
18.537.348.851.543.1
41.42.445.
()(*)
)
3.9
4.03.22.1.51.6
1.02.53.85.66.6
3.94.25.88.46.2
5.95.25.2
Seasonally adjusted annual rates
379.0387.7397.0402.8
405.2410.8416.7426.0
429.1434.3439.0433.0
247.4252.1258.3259.9
262.8265.0268.6272.3
276.7278.9283.6282.5
55.659.761.465.4
64.465.365.568.5
62.765.065.561.0
31.632.732.933.2
32.933.633.233.4
32.832.733.034.0
16.316.816.716.4
15.715.515.115.1
14.413.714.014.5
15.315.916.216.8
17.318.118.118.4
18.519.019.019.5
21.322.425.225.9
26.327.229.029.9
30.730.530.530.0
2.74.63.36.3
5.24.63.35.1
- . 81.72.0
- 3 . 0
- . 4- . 7
.1- . 7
- . 21.22.02.4
4.13.53.22.5
76.576.677.278.2
78.279.380.682.8
85.686.986.787.0
46.946.546.747.1
46.246.447.349.0
50.351.150.650.0
41.841.341.340.7
41.141.642.744.2
45.546.345.845.2
5.55.65.86.8
5.55.24.95.1
5.25.25.25.2
.4
.4
.4
.4
.4
.4
.4
.4
.4
.4
.4
.4
7.2
7.87.76.66.06.8
7.17.07.27.58.2
7.97.87.77.47.5
8.110.012.815.618.2
19.921.823.224.927.7
30.333.036.0
29.530.130.531.1
32.032.933.333.9
35.335.836.137.0
1 See table F-7 for major components.1 See Table F-8 for more detail and explanation of components.3 For 1947-57, national security expenditures include the items classified as such in the Budget of the
United States Government for tjie Fiscal Year ending June 30,1954. They are not comparable with the majornational security category in the Budget for the fiscal year ending June 30, 1959, which corresponds moreclosely to national defense expenditures for goods and services. National defense expenditures since 1947are as follows: 1947,12.3 billion dollars; 1948,11.6 billion; 1949,13.6 billion; 1950,14.3 billion; 1951, 33.9 billion;1952, 43.4 billion; 1953, 49.3 billion; 1954, 41.2 billion; 1955, 39.1 billion; 1956, 40.4 billion; and 1957, 43.7 billion.
4 Not available separately.8 Less than 50 million dollars.9 Preliminary; fourth quarter by Council of Economic Advisers.
NOTE.—Detai l will not necessarily add to totals because of rounding.
Source: Department of Commerce (except as noted).
117
Digitized for FRASER http://fraser.stlouisfed.org/ Federal Reserve Bank of St. Louis
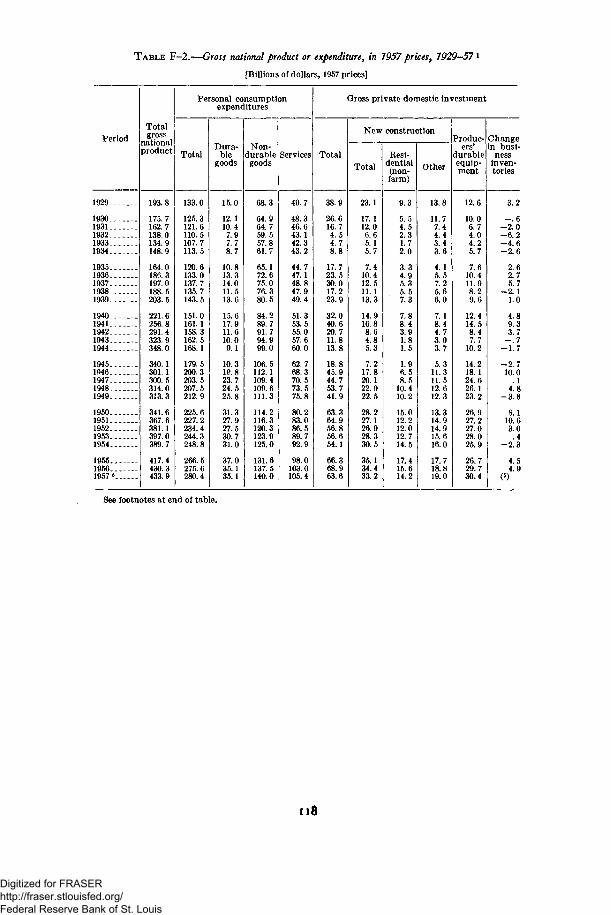
TABLE F—2.—Gross national product or expenditure, in 1957 prices, 1929—57*
[Billions of dollars, 1957 prices]
Period
1929
19301931193219331934
19351936193719381939
19401941194219431944
19451946194719481949
19501951195219531954
195519561957 8
Totalgross
nationalproduct
193.8
175.7162.7138.0134.9148.9
164.0186.3197.0188.5203.5
221.6256.8291.4323.9348.0
340.1301.1300.5314.0313. 3
341.6367.6381.1397.0389.7
417.4430.3433.9
Personal consumptionexpenditures
Total
133.0
125.3121.6110.5107.7113.5
120.6133.0137.7135.7143.5
151.0161.1158.3162.5168.1
179.5200.3203.5207.5212.9
225.6227.2234.4244. 3248.8
266.5275.6280.4
Dura-ble
goods
15.0
12.110.47.97.78.7
10.813.314.011.513.6
15.617.911.610.09.1
10.319.823.724.525.8
31.327.927.530.731.0
37.035.135.1
Non-durable
goods
68.3
64.964.759.557.861.7
65.172.675.076.380.5
84.289.791.794.999.0
106.5112.1109.4109.6111.3
114.2116.3120.3123.9125.0
131.6137.5140.0
Services
49.7
48.346.643.142.343.2
44.747.148.847.949.4
51.353.555.057.660.0
62.768.370.573.575.8
80.283.086.589.792.9
98.0103.0105.4
Gross private domestic investment
Total
38.9
26.616.74.54.78.8
17.723.530.017.223.9
32.040.620.711.813.8
18.845.944.753.741.9
63.364.956.856.654.1
66.368.963.6
New construction
Total
23.1
17.112.06.65.15.7
7.410.412.511.113.3
14.916.88.64.85.3
7.217.820.122.922.5
28.227.126.928.330.5
35.134.433.2
Resi-dential(non-farm)
9.3
5.54.52.31.72.0
3.34.95.35.57.3
7.88.43.91.81.5
1.96.58.5
10.410.2
15.012.212.012.714.5
17.415.614.2
Other
13.8
11.77.44.43.43.6
4.15.57.25.66.0
7.18.44.73.03.7
5.311.311.512.612.3
13.314.914.915.616.0
17.718.819.0
Produc-ers'
durableequip-ment
12.6
10.06.74.04.25.7
7.610.411.98.29.6
12.414.58.47.7
10.2
14.218.124.626.123.2
26.927.227.028.025.9
26.729.730.4
Changein busi-
nessinven-tories
3.2
- . 6- 2 . 0- 6 . 2- 4 . 6- 2 . 6
2.62.75.7
- 2 . 11.0
4.89.33.7
- . 7- 1 . 7
- 2 . 710.0
.14.8
- 3 . 8
8.110.63.0.4
- 2 . 3
4.54.9
(6)
See footnotes at end of table.
u8
Digitized for FRASER http://fraser.stlouisfed.org/ Federal Reserve Bank of St. Louis
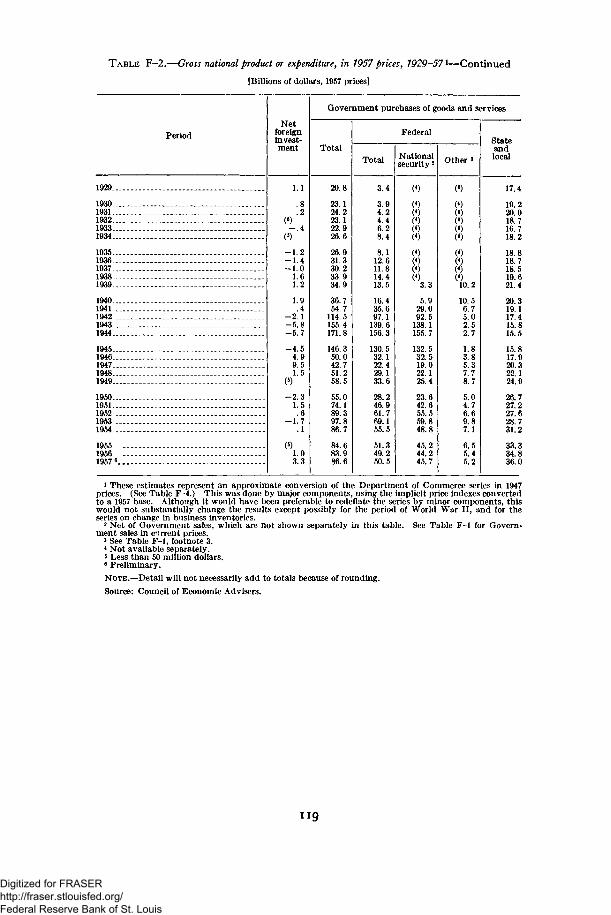
TABLE F-2.—Gross national product or expenditure, in 1957 prices, 1929-57l
[Billions of dollars, 1957 prices]
-Continued
Period
1929
19301931193219331934
19351936193719381939
1940 _194119421943 _ -- . .1944
1945.19461947 . -19481949
19501951 .195219531954
195519561957 6 . .
Netforeigninvest-ment
1.1
.8
.2
- . 4
-L.2L.4LOL.6
?
1.9.4
- 2 . 1- 5 . 8- 5 . 7
- 4 . 54.99.51.5
- 2 . 31.5.6
- 1 . 7.1
1.93.3
Government purchases of goods and services
Total
20.8
23.124.223.122.926.6
26.931.330.233.934.9
36.754.7
114.5155.4171.8
146.350.042.751.258.5
55.074.189.397.886.7
84.683.986.6
Federal
Total
3.4
3.94.24.46.28.4
8.112.611.814.413.5
16.435.697.1
139.6156.3
130.532.122.429.133.6
28.246.961.769.155.5
51.349.250.5
Nat iona lsecuri ty 2
(4)
(})
(4)3.3
5.929.092.5
138.1155.7
132.532.519.022.125.4
23.642.655.559.848.8
45.244.245.7
Other 3
(4)
10.2
10.56.75.02.52.7
1.83.85.37.78.7
5.04.76.69.87.1
6.55.45.2
Stateandlocal
17.4
19.220.018.716.718.2
18.818.718.519.621.4
20.319.117.415.815.5
15.817.920.322.124.9
26.727.227.628.731.2
33.334.836.0
1 These estimates represent an approximate conversion of the Department of Commerce series in 1947prices. (See Table F-4.) This was done by major components, using the implicit price indexes convertedto a 1957 base. Although it would have been preferable to redeflate the series by minor components, thiswould not substantially change the results except possibly for the period of World War II, and for theseries on change in business inventories.
2 Net of Government sales, which are not shown separately in this table. See Table F-l for Govern-ment sales in current prices.
3 See Table F-l , footnote 3.4 Not available separately.« Less than 50 million dollars.6 Preliminary.
NOTE.—Detail will not necessarily add to totals because of rounding.
Source: Council of Economic Advisers.
Digitized for FRASER http://fraser.stlouisfed.org/ Federal Reserve Bank of St. Louis
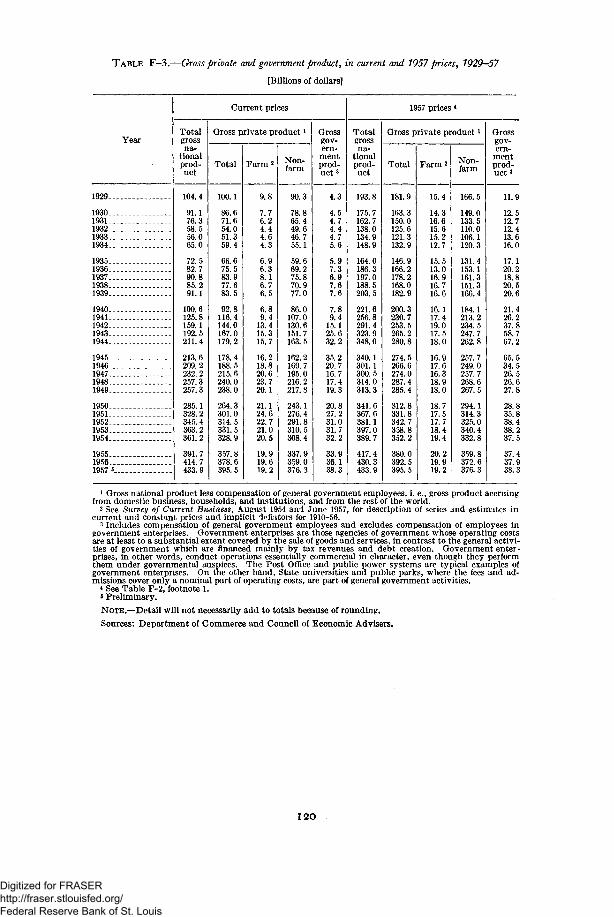
TABLE F—3.—Gross private and government product, in current and 7957 prices, 1929—57
[Billions of dollars]
Year
1929
193019311932 - . . .19331934
1935 . _ .193619371938 .1939
194019411942 .19431944
19451946194719481949 - . .
19501951195219531954
195519561957 «
Current prices
Totalgrossna-
tionalprod-uct
104.4
91.176.358.556.065.0
72.582.790.885.291.1
100.6125.8159.1192.5211,4
213.6209.2232.2257.3257.3
285.1328.2345.4363.2361.2
391.7414.7433.9
Gross private productl
Total
100.1
86.671.654.051.359.4
66.675.583.977.683.5
92.8116.4144.0167.0179.2
178.4188.5215.6240.0238.0
264.3301.0314.5331.5328.9
357.8378.6395.5
Farm2
9.8
7.76.24.44.64.3
6.96.38.16.76.5
6.89.4
13.415.315.7
16.218.820.623.720.1
21.124.622.721.020.5
19.919.619.2
Non-farm
90.3
78.865.449.646.755.1
59.669.275.870.977.0
86.0107.0130.6151.7163.5
162.2169.7195.0216.2217.8
243.1276.4291.8310.5308.4
337.9359.0376.3
Grossgov-ern-
mentprod-uc t 3
4.3
4.54.74.44.75.6
5.97.36.97.67.6
7.89.4
15.125.632.2
35.220.716.717.419.3
20.827.231.031.732.2
33.936.138.3
1957 prices *
Totalgrossna-
tionalprod-uct
193.8
175.7162.7138.0134.9148.9
164.0186.3197.0188.5203.5
221.6256.8291.4323.9348.0
340.1301.1300.5314.0313.3
341.6367.6381.1397.0389.7
417.4430.3433.9
Gross private product *
Total
181.9
163.3150.0125.6121.3132.9
146.9166.2178.2168.0182.9
200.3230.7253.5265.2280.8
274.5266.6274.0287.4285.4
312.8331.8342.7358.8352.2
380.0392.5395.5
Farm 2
15.4
14.316.615.615.212.7
15.513.016.916.716.6
16.117.419.017.518.0
16.917.616.318.918.0
18.717.517.718.419.4
20.219.919.2
Non-farm
166.5
149.0133.5110.0106.1120.3
131.4153.1161.3151.3166.4
184.1213.2234.5247.7262.8
257.7249.0257.7268.6267.5
294.1314.3325.0340.4332.8
359. 8372.6376.3
Grossgov-ern-
mentprod-uct 3
11.9
12.512.712.413.616.0
17.120.218.820.520.6
21.426.237.858.767.2
65.534.526.526.627.8
28.835.838.438.237.5
37.437.938.3
1 Gross national product less compensation of general government employees, i. e., gross product accruingfrom domestic business, households, and institutions, and from the rest of the world.
2 See Survey of Current Business, August 1954 and June 1957, for description of series and estimates incurrent and constant prices and implicit deflators for 1910-56.
3 Includes compensation of general government employees and excludes compensation of employees ingovernment enterprises. Government enterprises are those agencies of government whose operating costsare at least to a substantial extent covered by the sale of goods and services, in contrast to the general activi-ties of government which are financed mainly by tax revenues and debt creation. Government enter-prises, in other words, conduct operations essentially commercial in character, even though they performthem under governmental auspices. The Post Office and public power systems are typical examples ofgovernment enterprises. On the other hand, State universities and public parks, where the fees and ad-missions cover only a nominal part of operating costs, are part of general government activities.
* See Table F-2, footnote 1.8 Preliminary.
NOTE.—Detail will not necessarily add to totals because of rounding.
Sources: Department of Commerce and Council of Economic Advisers.
I 2 O
Digitized for FRASER http://fraser.stlouisfed.org/ Federal Reserve Bank of St. Louis
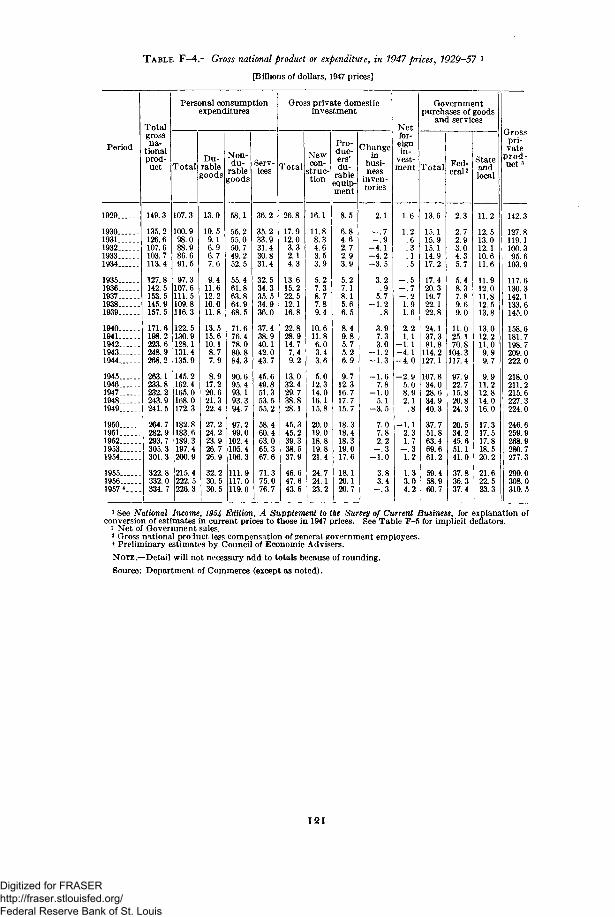
TABLE F—4.—Gross national product or expenditure, in 1947 prices, 1929-57 1
[Billions of dollars, 1947 prices]
Period
1929
19301931193219331934
19351936193719381939
19401941194219431944 .
19451946194719481949
19501951195219531954
195519561957 *
Totalgrossna-tionalprod-uct
149.3
135.2126.6107.6103.7113.4
127.8142.5153.5145.9157.5
171.6198.2223.6248.9268.2
263.1233.8232.2243.9241.5
264.7282.9293.7305.3301.3
322.8332.0334.7
Personal consumption
Total
107.3
100.998.088.986.691.5
97.3107.6111.5109.8116.3
122.5130.9128.1131.4135.9
145.2162. 4165.0168.0172.3
182.8183.6189.3197.4200.9
215.4222.5226.3
expenditures
Du-rablegoods
13.0
10.59.16.96.77.6
9.411.612.210.011.8
13.515.610.18.77.9
8.917.220.621.322.4
27.224.223.926.726.9
32.230.530.5
Non-du-
rablegoods
58.1
55.255.050.749.252.5
55.461.863 864.968.5
71.676.478.080.884.3
90.695.493.193.394.7
97.299.0
102.4105.4106.3
111.9117.0119.0
Serv-ices
36.2
35.233.931.430.831.4
32.534.335 534.936.0
37.438.940.142.043.7
45.649.851.353.555.2
58.460.463.065.367.6
71.375.076.7
Gross private domestic
Total
26.8
17.912.03.32.14.3
13.615.222 512.116.8
22.828.914.77.49.2
13.032.429.738.828.1
45.345.239.338.537.9
46.647.643.6
investment
Newcon-
struc-tion
16.1
11.88.34.63.53.9
5.27.38 77.89.4
10.611.86.03.43.6
5.012.314.016.115.8
20.019.018.819.821.4
24.724.123.2
Pro-duc-ers'du-
rableequip-ment
8.5
6.84.62.72.93.9
5.27.18.15.66.5
8.49.85.75.26.9
9.712.316.717.715.7
18.318.418.319.017.6
18.120.120.7
Changein
busi-ness
inven-tories
2.1
- . 7- . 9
- 4 . 1—4.2- 3 . 5
3.2.9
5 7- 1 . 2
.8
3.97.33.0
— 1.2- 1 . 3
—1.67.8
- 1 . 05.1
- 3 . 5
7.07.82.2
- . 3- 1 . 0
3.83.4
- . 3
Netfor-eignin-
vest-ment
1.6
1.2.6.3. 1.5
- 5- . 7— 21.91.6
2.21 1
- 1 . 1—4.1- 4 . 0
—2.95.08.92.1
.8
- 1 . 12.31.7
- . 31.2
1.33.04.2
Governmentpurchases of goods
and services
Total
13.6
15.115.915.114 917.2
17.420.319.722.122.8
24.137 381.8
114.2127.1
107.834.028.634.940.3
37.751.863.469.661.2
59.458.960.7
Fed-e r a l
2.3
2.72.93.04 35.7
5 48.37.89.69.0
11.025 170.8
104 3117.4
97.922.715.820.824.3
20.534.245.651.141.0
37.836.337.4
Stateandlocal
11.2
12.513.012.110.611.6
11.912.011.812.513.8
13.012 211.09 99.7
9 911.212.814.016.0
17.317.517.818.520.2
21.622.523.3
Grosspri-vate
prod-uct 3
142.3
127. 8119.1100.395.6
103.9
117.6130.3142 1133! 6145.0
158.6181.7198.7209.0222.0
218.0211 2215.6227.3224.0
246.6259.9268.9280.7277.3
299.0308.0310.5
1 See National Income, 1954. Edition, A Supplement to the Survey of Current Business, for explanation ofconversion of estimates in current prices to those in 1947 prices. See Table F-5 for implicit deflators.
2 Net of Government sales.3 Gross national product less compensation of general government employees.* Preliminary estimates by Council of Economic Advisers.
NOTE.—Detail will not necessary add to totals because of rounding.
Source: Department of Commerce (except as noted).
121
Digitized for FRASER http://fraser.stlouisfed.org/ Federal Reserve Bank of St. Louis
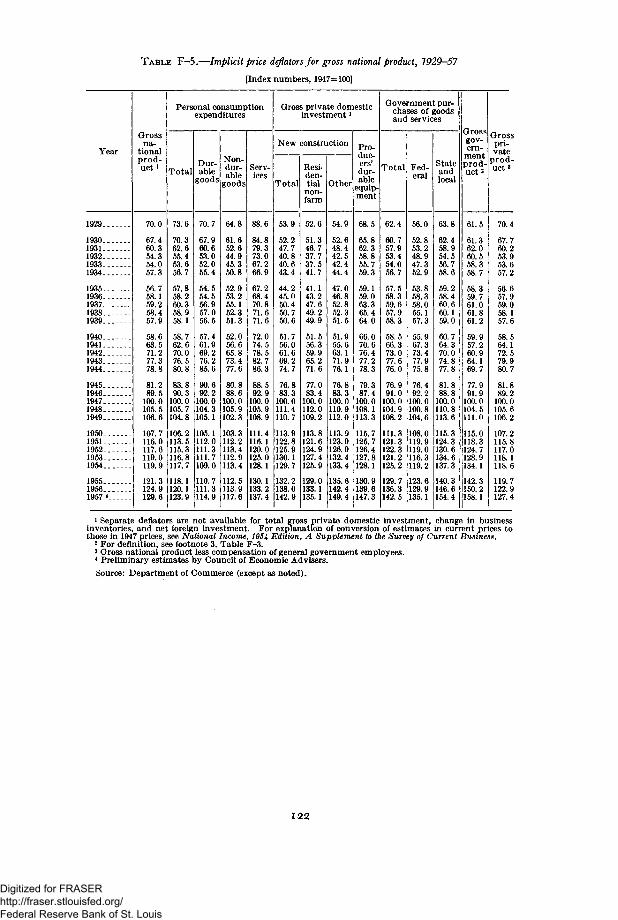
TABLE F—5.—Implicit price deflators for gross national product, 1929—57
[Index numbers, 1947=100]
Year
1929
19301931193219331934
19351936193719381939
19401941194219431944
19451946194719481949 - .
19501951195219531954
195519561957 «
Grossna-
tionalprod-uct i
Total
70.0
67.460.354.354.057.3
56.758.159.258.457.9
58.663.571.277.378.8
81.289.5
100.0105.5106.6
107.7116.0117.6119.0119.9
121.3124.9129.6
Personal consumptionexpenditures
Dur-able
goods
73.6
70.362.655.453.656.7
57.858.260.358.958.1
58.762.670.076.580.8
83.890.3
100.0105.7104.8
106.2113.5115.3116.8117.7
118.1120.1123.9
Non-dur-able
goods
70.7
67.960.653.052.055.4
54.554.556.957.056.5
57.461.969.276.285.6
90.692.2
100.0104.3105.1
105.1112.0111.3111.7109.0
110.7111.3114.9
64.8
61.652.644.945.350.8
52.953.255.152.351.3
52.056.665.873.477.6
80.888.6
100.0105.9102.3
103.3112.2113.4112.9113.4
112.5113.9117.6
Serv-ices
Total
88.6
84.879.373.067.266.9
67.268.470.871.671.6
72.074.578.582.786.3
88.592.9
100.0105.9108.9
111.4116.1120.0125.0128.1
130.1133.2137.4
Gross private domesticinvestment1
New construction
53.9
52.247.740.840.643.4
44.245.050.450.750.6
51.756.061.669.274.7
76.883.3
100.0111.4110.7
113.9122.8125.9130.1129.7
132.2138.0142.9
Resi-den-tialnon-farm
Other
52.6
51.346.737.737.541.7
41.143.247.649.249.9
51.556.359.965.271.6
77.083.4
100.0112.0109.2
113.8121.6124.9127.4125.9
129.0133.1135.1
54.9
52.648.442.542.444.4
47.046.852.852.351.5
51.955.663.171.976.1
76.883.3
100.0110.9112.0
113.9123.9126.9132.4133.4
135.6142.4149.4
Pro-duc-ers'dur-able
equip-ment
68.5
65.862.358.855.759.3
59.159.063.365.464.0
66.070.676.477.278.3
79.387.4
100.0108.1113.3
115.7125.7126.4127.8128.1
130.9139.6147.3
Total
Government pur-chases of goodsand services
62.4
60.757.953.454.056.7
57.558.359.657.958.3
58.566.373.077.676.0
76.991.0
100.0104.9108.2
111.3121.3122.3121.2125.2
129.7136.3142.5
Fed-eral
56.0
52.853.248.947.352.9
53.858.358.055.157.3
55.967.373.477.975.8
76.492.2
100.0100.8104.6
108.0119.9119.0116.3119.2
123.6129.9135.1
Stateandlocal
63.8
62.458.954.556.758.6
59.258.460.660.159.0
60.764.370.074.877.8
81.888.8
100.0110.8113.6
115.3124.3130.6134.6137.3
140.3146.6154.4
Grossgov-ern-
mentprod-uct2
Grosspri-vate
prod-uct 3
61.5
61.362.060.558.358.7
58.359.761.061.861.2
59.957.260.964.169.7
77.991.9
100.0104.5111.0
115.0118.3|124. 7!128. 9134.1
142.3150.2158.1
70.4
67.760.253.953.657.2
56.657.959.058.157.6
58.564.172.579.980.7
81.889.2
100.0105.6106.2
107.2115.8117.0118.1118.6
119.7122.9127.4
1 Separate deflators are not available for total gross private domestic investment, change in businessinventories, and net foreign investment. For explanation of conversion of estimates in current prices tothose in 1947 prices, see National Income, 1954. Edition, A Supplement to the Survey of Current Business.
2 For definition, see footnote 3, Table F-3.3 Gross national product less compensation of general government employees.4 Preliminary estimates by Council of Economic Advisers.
Source: Department of Commerce (except as noted).
1 2 2
Digitized for FRASER http://fraser.stlouisfed.org/ Federal Reserve Bank of St. Louis
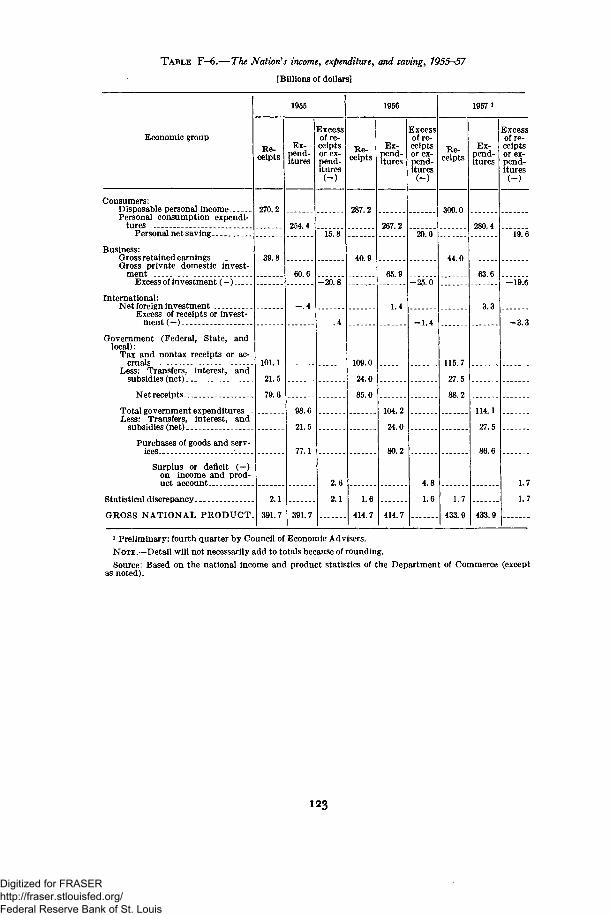
T A B L E F—6.—The Nation's income, expenditure, and saving, 1955—57
[Billions of dollars]
Economic group
Consumers:Disposable personal incomePersonal consumption expendi-
turesPersonal net saving. _
Business:Gross retained earningsGross private domestic invest-
mentExcess of investment (—)
International:Net foreign investment
Excess of receipts or invest-ment (—)
Government (Federal, State, andlocal):
Tax and nontax receipts or ac-cruals
Less: Transfers, interest, andsubsidies (net)
Net receipts
Total government expenditures _Less: Transfers, interest, and
subsidies (net)
Purchases of goods and serv-ices
Surplus or deficit (—)on income and prod-uct account
Statistical discrepancy
GROSS NATIONAL PRODUCT
1955
Re-ceipts
270.2
39.8
101.1
21.5
79 6
2.1
391.7
Ex-pend-itures
254.4
60.6
— .4
98.6
21.5
77 1
391.7
Excessof re-ceiptsor ex-pend-itures
<-)
15.8
—20 8
.4
2.6
2.1
1956
Re-ceipts
287.2
40 9
109.0
24.0
85.0
1.6
414.7
Ex-pend-itures
267.2
65.9
1.4
104.2
24.0
80 2
414.7
Excessof re-ceiptsor ex-pend-itures
(-)
20.0
—25 6
— 1 4
4 8
1 6
1957 1
Re-ceipts
300.0
44 0
115 7
27.5
88 2
1 7
433.9
Ex-pend-itures
280.4
63.6
3.3
114.1
27.5
86.6
433.9
Excessof re-ceiptsor ex-pend-itures(-)
19.6
-19.6
- 3 . 3
1.7
1.7
i Preliminary; fourth quarter by Council of Economic Advisers.
NOTE.—Detail will not necessarily add to totals because of rounding.
Source: Based on the national income and product statistics of the Department of Commerce (exceptas noted).
123
Digitized for FRASER http://fraser.stlouisfed.org/ Federal Reserve Bank of St. Louis

TABLE F-7.—Personal consumption expenditures, 1929-57
[Billions of dollars]
Period
1929-
1930-1931-1932-1933-1934-
1935-1936-1937-1938-1939..
1940-1941-1942-1943-1944-
1945-1946-1947-1948-1949-
1950-1951-1952-1953-1954..
1955..1956-1957 «.
1955: First quarter...Second quarter.Third quarter __Fourth quarter.
1956: First quarter._.Second quarter.Third quarter..Fourth quarter
1957: First quarter...Second quarter.Third quarter..Fourth quarter
Totalper-sonalcon-
sump-tionex-
pend-itures
79.0
71.061.349.346.451.9
56.362.667.364.67.6
71.981.89.7
100.5109.
121.7146.165.0177.6180.6
194.0208.3218.3230.5236.6
254.4267.2280.4
Durable goods
To-tal
9.2
7.25.53.3.54.2
5.16.36.95.76.7
7.89.77.06.6.8
8.115.920.622.223.
29.829.4
33.35.1
28. 6 12. 4 12. 910. 9 12. 7
26. 6 10. 413.12. 6 12. 9
35. 6 17. 2 14. 214.8
L79 14.
1.03.96.37.3 11.59. 5 10. 9
4.8.7
11.0
12.5
Nondurable goods
To-tal
37. 7 19. 5
3428.922.822.3
0 18J14.711.410.9
26. 7 12. 2
29.32.835.34.035.1
3 13.
37.243.251.59.65.
73.84.93.198. 7 49.
3. 3 100. 4111.1116.1119.120.
1.615.2
L 415.15.7
2 16.
7.48.8
11.03 27. 8 13. 4
14.
16.719.4
1.73 23.
4 30.6
2 34., 5 40.
1.4
45.1.4
9 48.8
16.518.218.819.618.5
51.0 18.558.3119.861. 4 20.1
6 64
4. 2 126. 0 66. 9 20. 64. 5 133. 3 714.7
.3 21.8140. 0 75.4 22. 3
19.7
7.0
6.35.74.85.37.2
7.99.19.89.5
10.1
10.12.314.5
2.32.62.11. 3 16. 71.4 18.7
1. 8 20.81.8
3. 6 25.14. 3 25.4. 7 24.
. 95. 5 27. 4
0 28.66. 6 29. 66. 9 29. 7
7. 5 31. 08. 0 32. 28. 6 33. 7
Services
32.1
29.26.22.920.721.0
8 11.9 10.
21.23.525.125.025.8
26.929.31.534.737.7
40.446.51.56.60.1
65.70.75.81.786.6
11.4
0 10.9.3
i . O10.11.311.9
12.4i. 2 13.
5.417.519.4
0 21.1 23.
27.629.5
92. 8 31.199.
105. 4 34. 5
4.0
3.93.53.02.83.0
3.23.43.73.3.
4.04.34.85.25.9
6.46.77.48.08.5
9.410.311.112.012.6
14.18 15.5
16.3
2. 6 14.0
2. 2 12. 71.9 11.2
9.38.5
1.61.5
9.410.311. 110.711.0
11.412.313.114.716.3
5.5
17.51.8
23.0.2
1 20.
5. 9 25.5. 8 26. 4
5. 8 28. 56. 4 30. 06. 8 32. 17. 3 34. 87. 3 37. 2
7. 5 40.17. 7 43. 87.9 46. 6
Seasonally adjusted annual rates
247.4252.1258.3259.9
262.8265.0268.272.3
276.278.9283.282.5
34.'35.337. 2 18. 535.4
34.6
16. 8 13. 91
14.516. 5 14. 4
15.433. 3 13. 8 15. 033. 0 13. 7 14. 734. 8 15. 3 14. 9
35. 9 16. 3 14. 935. 0 15. 5 14. 935. 0 15. 334. 5 15. 6 14.1
14.
14. 9
19. 96. 3 20. 6
. 4 68. 0 20. 83
122. 4 64. 8124.127.129. 2 68. 6 21. 3
8 66.
4. 5 130. 9 69. 9 21. 04. 5 132. 7 70. 8 21.4. 6 134. 4 71. 9 22. 34. 6 135. 3 72. 7 22. 2
4. 7 137. 3 74. 0 21.75. 5 22. 0
4. 8 142. 5 76. 6 23.14. 8 141. 0 76.1 22.1
3 30.5 30.
7 31.
8. 7 34.1
90.92.93. 7 31. 3 14. 395. 3 31 7
2 30.0 30.
15.215.5
33. 2 15. 7
7. 9 32.18. 0 32. 28. 0 32. 28. 3 32.1
8. 5 32. 9 103. 4 33. 9 16. 08. 7 32. 9 104. 9 34. 3 16. 28. 7 34. 0 106.1 34.7
107. 0 35.0
i. 5 13. 5I. 9 13. 8
97. 2 32.199. 0 32. 6
101.1102. 2 33. 5 15. 8
16.6
. 4 38.
. 4 39.
. 5 40.
. 6 41.
7. 7 42. 27.7.7. 8 45.1
'. 7 43.
7. 8 45. 77. 9 46. 57. 9 47.18.0 47. 4
1 Quarterly data are estimates by Council of Economic Advisers.2 Includes standard clothing issued to military personnel.3 Includes imputed rental value of owner-occupied dwellings.* Preliminary; fourth quarter by Council of Economic Advisers.
NOTE.—Detail will not necessarily add to totals because of rounding.
Source: Department of Commerce (except as noted).
124
Digitized for FRASER http://fraser.stlouisfed.org/ Federal Reserve Bank of St. Louis
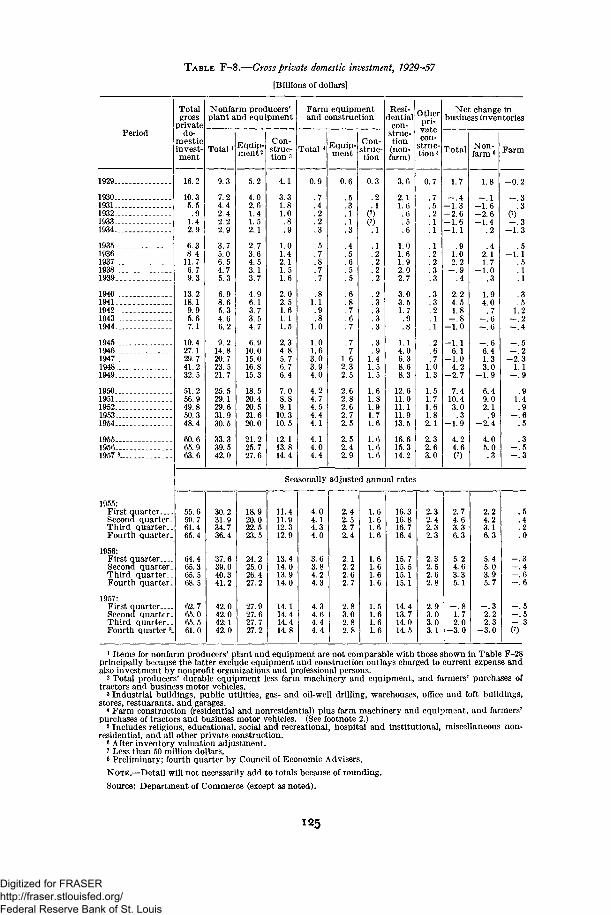
TABLE F-8.—Gross private domestic investment, 1929-57
[Billions of dollars]
Periodprivate
do-mesticinvest-ment
1929.
1930..1931.1932.1933..1934.
19351936193719381939.
19401941.194219431944.
1945.1946-1947,19481949-
1950.1951-1952.1953.1954.
1955.1956.1957*
1955:First quarterSecond quarter.Third quarter..Fourth quarter.
1956:First quarterSecond quarter.Third quarter..Fourth quarter.
1957:First quarterSecond quarter.Third quarter. .Fourth quarter 8.
Total
16.2
10.35.5.9
1.42.9
6.38.4
11.76.79.3
13.218.19.95.67.1
10.427.129.741.232.5
51.256.949.850.348.4
60.665.963.6
Nonfarm producers'plant and equipment
Total Equip-ment 2
55.659.761.465.4
64.465.365.568.5
62.765.065.561.0
9 3
7.24.42.42.22.9
3.75.06.54.75.3
5.34.66.2
9.214.820.723.521.7
25.529.129.631.930.5
33.339.542.0
5.2
4.02.61.41.52.1
2.73.64.53.13.7
4.96.13.73.54.7
6.910.015.016.815.3
18.520.420.521.620.0
21.225.727.6
Con-struc-tions
4.1
3.31.81.0
1.01.42.11.51.6
2.02.51.61.11.5
2.34.85.76.76.4
7.08.89.1
10.310.5
12.113.814.4
Farm equipmentand construction
Total Equip-ment
0.9
.7
.4
.2
.2
.3
.5
.7
.8
.7
.7
1.0
1.01.63.03.94.0
4.24.74.54.44.1
4.14.04.4
0.6
.5
.3
.1
.1
.3
.4
.5
.6
.5
.5
.6
.8
.7
.6
.7
.7
.71.62.32.5
2.62.82.62.72.5
2.52.42.9
Con-struc-tion
Resi-dential
con-struc-tion(non-farm)
0.3
. 2
. 1(7)
(01
. 1
.2
.2
.2
.2
.2
.3
.3
.3
.3
.3
.91.41.51.5
1.61.81.91.71.6
1.61.61.6
Otherpri-vatecon-
struc-tions
3.6
2.11.6.6.5
1.01.61.92.02.7
3.03.51.7
1.14.06.38.68.3
12.611.011.111.913.5
16.615.314.2
Total
0.7
.7
.5
.2
.1
.1
.1
.2
.2
.3
.71.01.3
1.51.71.61.82.1
2.32.63.0
Net change inbusiness inventories
1.7
- . 4- 1 . 3- 2 . 6- 1 . 6- 1 . 1
.91.02.2
- . 9.4
2.24.51.8
- . 8- 1 . 0
- 1 . 16.1
- 1 . 04.2
- 2 . 7
7.410.43.0
.3- 1 . 9
4.24.6(0
Non-farm 6
1.8
- . 1- 1 . 6- 2 . 6-1 .4
.2
.42.11.7
- 1 . 0.3
1.94.0
.7- . 6- . 6
- . 66.41.33.0
- 1 . 9
6.49.02.1.9
- 2 . 4
4.05.0.3
Farm
Seasonally adjusted annual rates
-0.2
- . 3.3
(7)- . 3
- 1 . 3
.5- 1 . 1
.5
.1
.1
.3
.51.2
- . 2- . 4
- . 5- . 2
- 2 . 31.1
- . 6.5
.3- . 5- . 3
30.231.934.736.4
37.639.040.341.2
42.042.042; 142.0
18.920.022.523.5
24.225.026.427.2
27.927.627.727.2
11.411.912.312.9
13.414.013.914.0
14.114.414.414.8
4.04.14.34.0
3.63.84.24.3
4.34.64.44.4
2.42.52.72.4
2.12.22.62.7
2.83.02.82.8
1.61.61.61.6
1.61.61.61.6
1.51.61.61.6
16.316.816.716.4
15.715.515.115.1
14.413.714.014.5
2.32.42.32.3
2.32.52.62.8
2.93.03.03.1
2.74.63. 36.3
5.24.63.35.1
- . 81.72.0
- 3 . 0
2.24.23.16.3
5.45.03.95.7
- . 32.22.3
- 3 .0
- . 5- . 5- . 3CO
1 Items for nonfarm producers' plant and equipment are not comparable with those shown in Table F-28principally because the latter exclude equipment and construction outlays charged to current expense andalso investment by nonprofit organizations and professional persons.
2 Total producers' durable equipment less farm machinery and equipment, and farmers' purchases oftractors and business motor vehicles.
3 Industrial buildings, public utilities, gas- and oil-well drilling, warehouses, office and loft buildings,stores, restuarants, and garages.
* Farm construction (residential and nonresidential) plus farm machinery and equipment, and farmers'purchases of tractors and business motor vehicles. (See footnote 2.)
s Includes religious, educational, social and recreational, hospital and institutional, miscellaneous non-residential, and all other private construction.
6 After inventory valuation adjustment.7 Less than 50 million dollars.s Preliminary; fourth quarter by Council of Economic Advisers.
NOTE.—Detail will not necessarily add to totals because of rounding.
Source: Department of Commerce (except as noted).
125
Digitized for FRASER http://fraser.stlouisfed.org/ Federal Reserve Bank of St. Louis
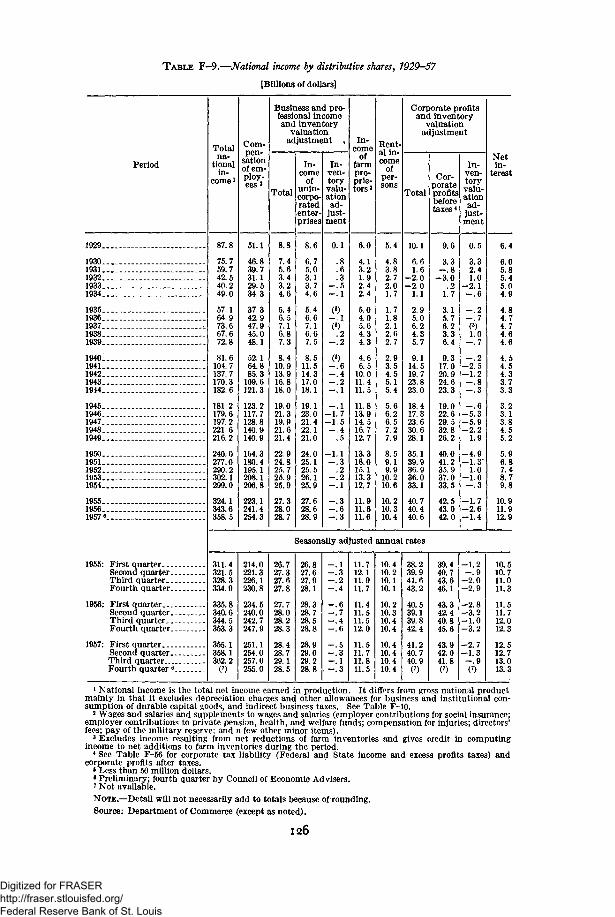
TABLE F-9.—National income by distributive shares, 1929-57
[Billions of dollars]
Period
Totalna-
tionalin-
come1
Com-pen-
sationof em-ploy-ees 2
Business and pro-fessional incomeand inventory-
valuationadjustment »
Total
8.8
7.45.63.43.24.6
5.46.57.16.87.3
8.410.913.916.818.0
19.021.319.921.621.4
22 924.825.725.925.9
27.328.028.7
In-come
ofunin-corpo-ratedenter-prises
8.6
6.75.03.13.74.6
5.46.67.16.67.5
8.511.514.317.018.1
19.123.021.422.121.0
24.025.125.526.125.9
27.628.628.9
In-ven-toryvalu-ationad-
just-ment
In-come
offarmpro-prie-tors3
6.0
4.13.21.92.42.4
5.04.05.64.34.3
4.66.5
10.011.411.5
11.813.914.516.712.7
13.316.015.113.312.7
11.911.611.6
Rent-al in-come
ofper-sons
5.4
4.83.82.72.01.7
1.71.82.12.62.7
2.93.54.55.15.4
5.66.26.57.27.9
8.59.19.9
10.210.6
10.210.310.4
Corporate profitsand inventory
valuationadjustment
Total
10.1
6.61.6
-2 .0-2 .0
1.1
2.95.06.24.35.7
9.114.519.723.823.0
18.417.323.630.628.1
35.139.936.936.033.1
40.740.440.6
Cor-porateprofitsbeforetaxes<
9.6
3.3- . 8
-3 .0. 2
1.7
3.15.76.23.36.4
9.317.020.924.623.3
19.022.629.532.826.2
40.041.235.937.033.5
42.543.042.0
In-ven-toryvalu-ationad-just-ment
Netin-
terest
1929
1930 _ -19311932 .-_19331934
193519361937 ,19381939
1940.1941194219431944
194519461947 .._19481949
1950 _1951195219531954
195519561957 6
1955: First quarter....Second quarter..Third quarter...Fourth quarter..
1956: First quarterSecond quarter.Third quarter. _.Fourth quarter.
1957: First quarter....Second quarter..Third quarter...Fourth quarter 6.
87.8
75.759.742.540.249.0
57.164.973.667.672.8
81.6104.7137. 7170.3182.6
181.2179.6197.2221.6216.2
240.0277.0290.2302.1299.0
324.1343.6358.5
51.1
46.839.731.129.534.3
37.342.947.945.048.1
52.164.885.3
109.6121.3
123.2117.7128.8140.9140.9
LS4.3180.4195.1208.1206.8
223.1241.4254.3
0.1
.8
.6
.3- . 5- . 1
().2
- . 2
- . 6- . 4- . 2- . 1
- . 1- 1 . 7- 1 . 5- . 4
.5
- 1 . 1- . 3
.2- . 2- . 1
- . 3
0.5
3.32.41.0
-2 .1
- . 2
()1.0
- . 7
- . 2-2 .5-1.2- . 8- . 3
-5 .3-5.9-2.2
1.9
-4 .9-1 .3
1.0-1.0- . 3
-1.7-2.6-1.4
6.4
6.05.85.45.04.9
4.84.74.74.64.6
4.64.54.33.73.3
3.23.13.84.55.2
5.96.87.48.79.8
10.911.912.9
Seasonally adjusted annual rates
311.4321.5328.3334.9
335.8340.6344.5353.3
355.1358.1362. 2
(7)
214.0221.3226.1230.8
234.5240.0242.7247.9
251.1254.0257.0255.0
26.727.327.627.8
27.728.028.228.3
28.428.729.128.5
26.827.627.928.1
28.328.728.528.8
28.929.029.228.8
- . 1- . 3
o
- ! 4
- . 6- . 7- . 4- . 6
- . 5- . 3- . 1- . 3
11.712.111.911.7
11.411.511.512.0
11.511.711.811.5
10.410.210.110.1
10.210.310.410.4
10.410.410.410.4
38.239.941.643.2
40.539.139.842.4
41.240.740.9(7)
39.440.743.646.1
43.342.440.845.6
43.942.041.8(7)
-1 .2- . 9
-2 .0-2 .9
- 2 . 8-3 .2-1 .0-3 .2
-2 .7- 1 . 3
- . 9(7)
10.510.711.011.3
11.511.712.012.3
12.512.713.013.3
1 National income is the total net income earned in production. It differs from gross national productmainly in that it excludes depreciation charges and other allowances for business and institutional con-sumption of durable capital goods, and indirect business taxes. See Table F-10.
2 Wages and salaries and supplements to wages and salaries (employer contributions for social insurance;employer contributions to private pension, health, and welfare funds; compensation for injuries; directors'fees; pay of the military reserve: and a few other minor items).
3 Excludes income resulting from net reductions of farm inventories and gives credit in computingincome to net additions to farm inventories during the period.
4 See Table F-56 for corporate tax liability (Federal and State income and excess profits taxes) andcorporate profits after taxes.
« Less than 50 million dollars.6 Preliminary; fourth quarter by Council of Economic Advisers.7 Not available.NOTE.—Detail wUl not necessarily add to totals because of rounding.Source: Department of Commerce (except as noted).
126
Digitized for FRASER http://fraser.stlouisfed.org/ Federal Reserve Bank of St. Louis
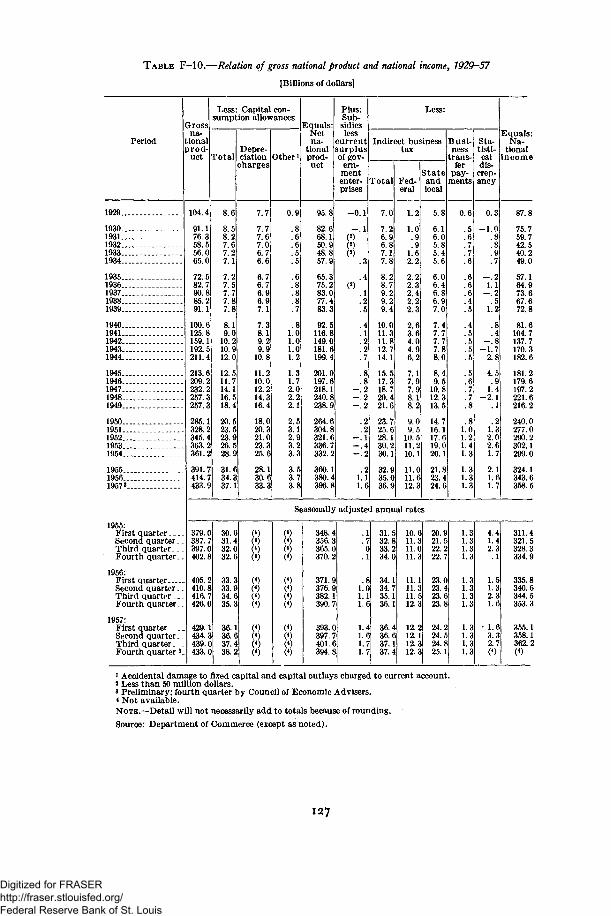
T A B L E F-10.—Relation of gross national product and national income, 1029—57
[Billions of dollars]
Period
Grossna-
tionalprod-
uct Total
Less: Capital con-sumption allowances
Depre-ciation
chargesOther
Equals:Netna-
tionalprod-uct
Plus:Sub-sidiesless
iurrentsurplusof gov-ern-mententer-prises
Less:
Indirect business
Total
7.0
7.26.96.87.17.8
8.28.79.29.29.4
10.011.311.812.714.1
15.517.318.720.421.6
23.725.628.130.230.1
32.935.036.9
tax
Fed-eral
1.2
1.0.9.9
1.62.2
2.22.32.42.22.3
2.63.64.04.96.2
7.17.97.98.18.2
9.09.5
10.511.210.1
11.011.612.3
Stateandlocal
5.8
6.16.05.85.45.6
6.06.46.86.97.0
7.47.77.77.88.0
8.49.5
10.812.313.5
14.716.117.619.020.1
21.823.424.6
Busi-ness
trans-fer
pay-ments
0.6
.5
.6
.7
.7
.6
.6
.6
.6
.4
.5
.4
.5
.5
.5
.5
. 5
.6
.7
.7
.8
. 81.01.21.41.3
1.31.31.3
Sta-tisti-caldis-crep-ancy
0.3
- 1 . 0. 8.8.9.7
- . 21.1
- . 2.5
1.2
. 8
.4- . 8
- 1 . 72.8
4.5.9
1.4- 2 . 1
.1
.21.32.02.61.7
2.11.61.7
Equals:Na-
tionalncome
1929..
1930..1931..1932..1933-1934..
1935..1936..1937-1938..
19401941194219431944
19451946194719481949
19501951195219531954
195519561957 »
1955:First quarterSecond quarter-Third quar te r . -Four th quarter .
1956:First quar ter . . . .Second quar te r .Third quarter - .Four th quar ter .
1957:First quar te r . _.Second quarter _Third quar te r .Four th quarter 3
104.4
91.176.358.56.065.0
72.582.90.885.291.1
100.6125.8159.1192.5211.
213.6209.2232.2257.3257.3
285.1328.2345.4363.2361.2
391.7414.433. S
8.6
8.58.27.67.27.1
7.27.57.77.87.8
8.19.0
10.210.912.0
12.511.714.116.518.4
20.523.523.926.528.9
31.634.337.1
7.7
7.77.67.06.7
6.76.76.96.97.1
7.38.19.29.9
10.8
11.210.012.214.316.4
18.020.321.023.325.6
28.130.633.3
0.9
.8
.6
.6
.5
.5
.6
.7
.81.01.01.01.2
1.31.72.02.2.1
2.53.12.93.3.3
3.73.8
95.8
82.668.150.948.857.9
65.375.283.077.483.3
92.5116.8149.0181.6199.4
201.0197.6218.1240.8238.9
264.6304.8321.6336.332.2
360.1380.4396.8
- 0 . 1
1.11.6
Seasonally adjusted annual rates
379.0387.7397.0402.8
405.2410.8416.7426.0
429.1434.3439.0433.0
30.631.432.032.6
33.333.934.635.3
36.136.637.438.2
(4)(4)(4)(4)
(4)(4)(4)(4)
(4)(4)(4)(4)
(4)(4)(4)(4)
(4)(4)(4)(4)
(4)(4)(4)(4)
348.4356.3365.0370.2
371.9376.9382.1390.7
393.0397.7401.6394.8
. 1
.70
. 1
.81.01.11.6
1.41.61.71.7
31.532.833.234.0
34.134.735.136.1
36.436.637.137.4
10.611.311.011.3
11.111.311.512.3
12.212.112.312.3
20.921.522.222.7
23.023.423.623.8
24.224.524.825.1
1.31.31.31.3
1.31.31.31.3
1.31.31.3, 3
4.41.42.3
. 1
1.51.32.31.6
- 1.63.32.7«
87.8
75.759.742.540.249.0
57.164.973.667.672.8
81.6104.7137.7170.3182.6
181.2179.6197.2221.6216.2
240.0277.0290.2302.1299.0
324.1343.6358.5
311.4321.5328.3334.9
335.8340.6344. 5353.3
355.1358.1362.2
1 Accidental damage to fixed capital and capital outlays charged to current account.2 Less than 50 million dollars.3 Preliminary; fourth quarter by Council of Economic Advisers.* Not available.NOTE.—Detail will not necessarily add to totals because of rounding.Source: Department of Commerce (except as noted).
127
Digitized for FRASER http://fraser.stlouisfed.org/ Federal Reserve Bank of St. Louis
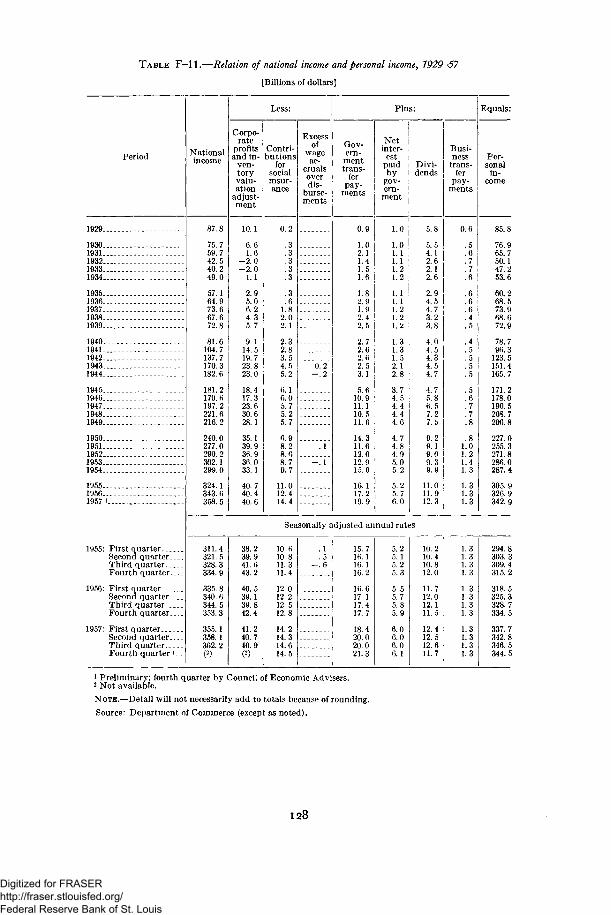
T A B L E F—11.—Relation of national income and personal income^ 1929—57
[Billions of dollars]
Period Nationalincome
Less:
Corpo-rate
profitsand in-
ven-toryvalu-ation
adjust-ment
Contri-butions
forsocialinsur-ance
Excessof
wageac-
crualsoverdis-
burse-ments
Gov-ern-
menttrans-
ferpay-
ments
Plus:
Netinter-
estpaidby
gov-ern-
ment
Divi-dends
Busi-ness
trans-fer
pay-ments
Equals:
Per-sonal
L929
1930 . .193119321933 . .1934
19351936193719381939
19401941 -194219431944
1945 - -194619471948-1949
19501951195219531954
1955.-- . - - . .19561957 1
87.8
75.759.742.540.249.0
57.164.973.667.672.8
81.6104.7137.7170 3182.6
181.2179.6197.2221.6216.2
240.0277.0290.2302.1299.0
324.1343.6358.5
1955: First quarterSecond quarter._Third quarter...Fourth quarter..
1956: First quarterSecond quarter..Third quarter...Fourth quarter..
1957: First quarterSecond quarter..Third quarter-..Fourth quarter i.
311.4321. 5328.3334.9
335.8340.6344.5353.3
355.1358.1362.2
10.1
6.61.6
-2 .0-2 .0
1.1
2.95.06.24.35.7
9.114.519.723.823.0
18.417.323.630.628.1
35.139.936.936.033.1
40.740.440.6
0.2
.3
.3
.3
.3
.3
.3
.61.82.02.1
2.32.83.54.55.2
6.16.05.75.25.7
6.98.28.68.79.7
11.012.414.4
0.2- . 2
0.9
1.02.11.41.51.6
1.82.91.9 j2.4 !2.5
2.7 12.62.62.53.1
5.610.911.1
1.0
1.01.1.1.2.2
.1
.1
.2
.2.. 2
.3
.3
.52.12.8
3.74.54.4
- . 1
10.511.6
14.311.612.012.915.0
16.117.219.9
4.4 j4.6
4.74.84.95.05.2
5.25.76.0
5.8
5.54.12.62.12.6
2.94.54.73.23.8
4.04.54.34.54.7
4.75.86.57.27.5
9.29.19.09.39.9
11.011.912.3
Seasonally adjusted annual rates
38.239.941.643.2
40.539. 139.842.4
41.240.740.9(2)
10.610.811.311.4
12.012.212.512.8
14.214.314.614.5
. 1
.5- . 6
0.6
.5
1.1.1.1.
1.1.1.
45
45555
56778
80243
333
15.716.116. 116.2
16.617.117.417.7
18.420.020.021.3
5.25.15.25.3
5.55.75.85.9
6.06.06.06.1
10.210.410.812.0
11.712.012.111.5
12.412.512.611.7
1.31.31.31.3
1.31.31.31.3
1.31.31.31.3
85.8
76.965.750.147.253.6
60.268.573.968.672.9
78.796.3
123.5151. 4165.7
171.2178.0190.5208.7206.8
227.0255.3271.8286.0287.4
305.9326.9342.9
294.8303.3309.4315.2
318.5325.3328.7334.5
337.7342.8346.5344.5
1 Preliminary; fourth quarter by Council of Economic Advisers.2 Not available.
NOTE.—Detail will not necessarily add to totals because of rounding.
Source: Department of Commerce (except as noted).
128
Digitized for FRASER http://fraser.stlouisfed.org/ Federal Reserve Bank of St. Louis
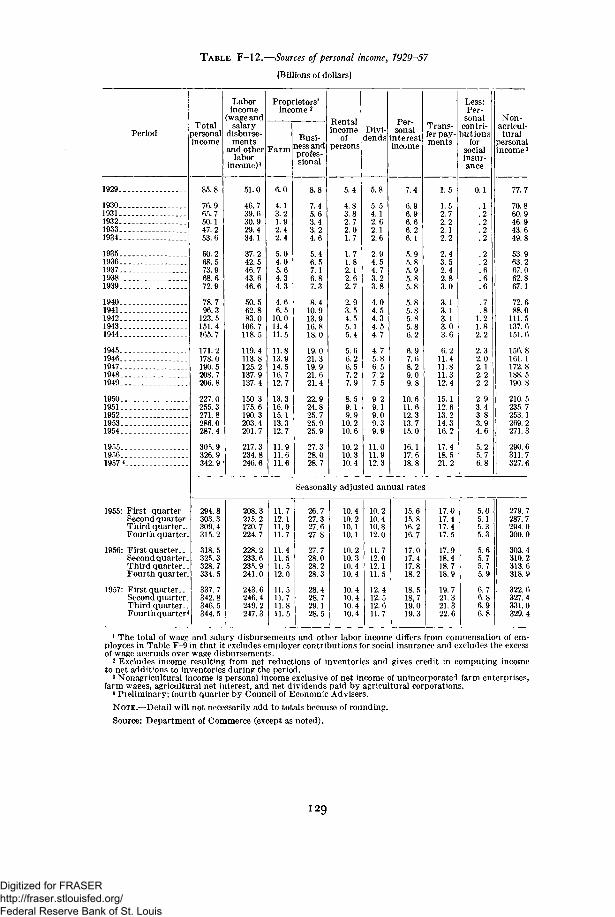
TABLE F-12.—Sources of personal income, 1929—57
[Billions of dollars]
PeriodTotal
personalincome
1929..
1930..1931 . .1932..1933. .1934..
1935..1936..1937..1938..1939..
1940..1941..1942..1943..1944..
1945..1946..1947..1948..1949..
1950..1951..1952..1953..1954..
1955..1956..1957 «
1955: First quarterSecond quarter-Third quarter..Fourth quarter.
1956: First quarter-Second quarter-Third quarter.-Fourth quarter.
1957: First quarter..Second quarter.Third quarter..Fourth quarter
85.8
76.965.750.147.253.6
60.268.573.968.672.9
78.796.3
123.5151.4165.7
171.2178.0190.5208.7206.8
227.0255.3271.8286.0287.4
305.9326.9342.9
Laborincomewage andsalary
disburse-ments
and otherlabor
income)1
F a r m
51.0
46.739.630.929.434.1
37.242.546.743.646.6
50.562.883.0
106.7118.5
119.4113.8125.2137.9137.4
150. 3175.6190.3203.4201.7
217.3234.8246.6
Proprietors'income 2
Busi-ness andprofes-sional
6.0
4.13.21.92.42.4
5.04.05.64.34.3
4.66.5
10.011.411.5
11.813.914.516.712.7
13.316.015.113.312.7
11.911.611.6
8.8
7.45.63.43.24.6
5.46.57.16.87.3
8.410.913.916.818.0
19.021.319.921.621.4
22.924.825.725.925.9
27.328.028.7
Rentalincome
ofpersons
Divi-dends
5.4
4.83.82.72.01.7
1.71.82.12.62.7
2.93.54.55.15.4
5.66.26.57.27.9
8.59.19.9
10.210.6
10.210.310.4
5.8
5.54.12.62.12.6
2.94.54.73.23.8
4.04.54.34.54.7
4.75.86.57.27.5
9.29.19.09.3
11.011.912.3
Per-sonal
interestincome
6.96.96.66.26.1
5.95.85.95.85.8
5.85.85.85.86.2
6.97.68.29.0
10.611.612.313.715.0
16.117.618.8
Trans-fer pay-ments
Less:Per-sonal
contri-butions
forsocialinsur-ance
1.5
1.52.72.22.12.2
2.43.52.42.83.0
3.13.13.13.03.6
6.211.411.811.312.4
15.112.613.214.316.2
17.418.521.2
Seasonally adjusted annual rates
294.8303.3309.4315.2
318.5325. 3328.7334.5
337.7342.8346.5344.5
.1
.2
.2
.2
.2
.2
.2
.6
.6
.6
.7
.81.21.82.2
2.32.02.12.22.2
2.93.43.83 94^6
5.25.7
Non-agricul-tural
personalncome3
208.3215. 2220.7224.7
228.2233.6235. 9241.0
243.6246.4249.2247.3
11.712.111.911.7
11.411.511.512.0
11.511.711.811.5
26.727.327.627.8
27.728.028.228.3
28.428.729.128.5
10.410.210.110.1
10.210.310.410.4
10.410.410.410.4
10.210.410.812.0
11.712.012.111.5
12.412.512.611.7
15.615.816.216.7
17.017.417.818.2
18.518.719! 019.3
17.017.417.417.5
17.918.418.718.9
19.721.321.322.6
5.05.15.35.3
5.65.75.75.9
6.76.86.96.8
77.7
70.860.946.943.649.8
53.963.267.062.867.1
72.688.0
111.5137.6151.6
156.8161.1172.8188.5190.8
210.5235. 7253.1269.2271.3
290.6311.7327.6
279.7287.7294.0300.0
303.4310.2313.6318.9
322.6327.4331.0329.4
1 The total of wage and salary disbursements and other labor income differs from condensation of em-ployees in Table F-9 in that it excludes employer contributions for social insurance and excludes the excessof wage accruals over wage disbursements.
2 Excludes income resulting from net reductions of inventories and gives credit in computing incometo net additions to inventories during the period.3 Nonagricultural income is personal income exclusive of net income of unincorporated farm enterprises,farm wages, agricultural net interest, and net dividends paid by agricultural corporations.4 Preliminary; fourth quarter by Council of Economic Advisers.
NOTE.—Detail will not necessarily add to totals because of rounding.Source: Department of Commerce (except as noted).
129
Digitized for FRASER http://fraser.stlouisfed.org/ Federal Reserve Bank of St. Louis
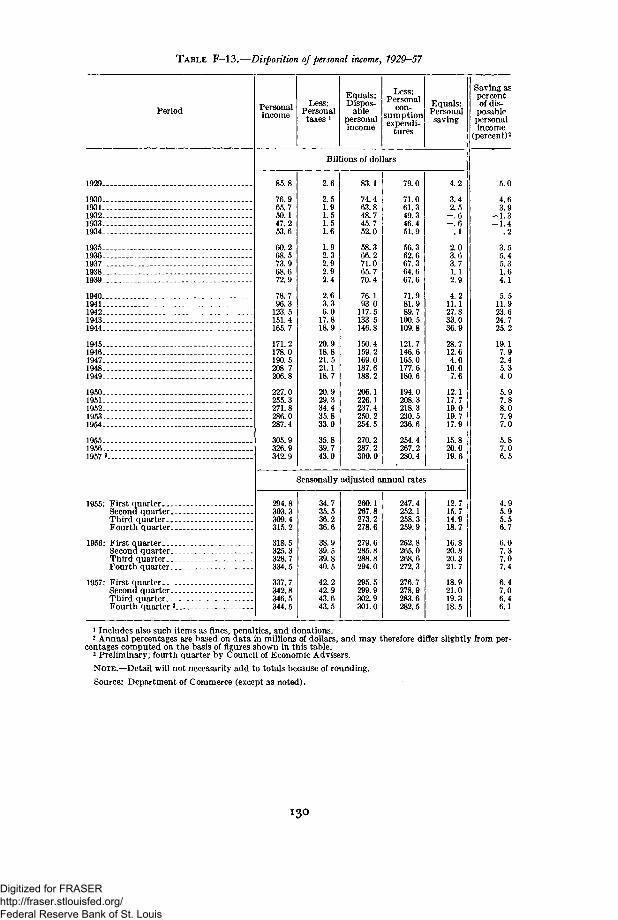
TABLE F-13.—Disposition of personal income, 1929-57
Period Personalincome
Less:Personaltaxes »
Equals:Dispos-
ablepersonalincome
Less:Personal
con-sumptionexpendi-
tures
Equals:Personalsaving
Saving aspercentof dis-
posablepersonalincome
(percent)2
Billions of dollars
1929.-
1930-.1931..1932..1933-.1934..
1935..1936..1937..1938-.1939..
1940..1941..1942..1943..1944-.
1945..1946-.1947-,1948-.1949..
1950..1951..1952..1953..1954-
1955-.1956-.1957 3.
1955; First quarterSecond quarter..Third quarter. . .Fourth quarter..
1956: First quarterSecond quarter..Third quarter. . .Fourth quarter..
1957: First quarterSecond quarter..Third quarter. _.Fourth quarter 3.
85.8
76.965.750.147.253.6
60.268.573.968.672.9
78.796.3
123.5151.4165.7
171.2178.0190.5208.7206.8
227.0255.3271.8286.0287.4
305.9326.9342.9
2.6
2.51.91.51.51.6
1.92.32.92.92.4
2.63.36.0
17.818.9
20.918.821.521.118.7
20.929.334.435.833.0
35.839.743.0
83.1
74.463.848.745.752.0
58.366.271.065.770.4
76.193.0
117.5133.5146.8
150.4159.2169.0187.6188.2
206.1226.1237.4250.2254.5
270.2287.2300.0
79.0
71.061.349.346.451.9
56.362.667.364.667.6
71.981.989.7
100.5109.8
121.7146.6165.0177.6180.6
194.0208.3218.3230.5236.6
254.4267.2280.4
Seasonally adjusted annual rates
294.8303.3309.4315.2
318.5325.3328.7334.5
337.7342.8346.5344.5
34.735.536.236.6
38.939.539.840.5
42.242.943.643.5
260.1267.8273.2278.6
279.6285.8288.8294.0
295.5299.9302.9301.0
247.4252.1258.3259.9
262.8265.0268.6272.3
276.7278.9283.6282.5
4.2
3.42.5
- . 6- . 6
.1
2.03.63.71.12.9
4.211.127.833.036.9
28.712.64.0
10.07.6
12.117.719.019.717.9
15.820.019.6
12.715.714.918.7
16.820.820.321.7
18.921.019.318.5
5.0
4.63.9
- 1 . 3-1 .4
.2
3.55.45.31.64.1
5.511.923.624.725.2
19.17.92.45.34.0
5.97.88.07.97.0
5.87.06.5
4.95.95.56.7
6.07.37.07.46.47.06.46.1
1 Includes also such items as fines, penalties, and donations.2 Annual percentages are based on data in millions of dollars, and may therefore differ slightly from per-
centages computed on the basis of figures shown in this table.3 Preliminary; fourth quarter by Council of Economic Advisers.
NOTE.—Detail will not necessarily add to totals because of rounding.
Source: Department of Commerce (except as noted).
I3O
Digitized for FRASER http://fraser.stlouisfed.org/ Federal Reserve Bank of St. Louis
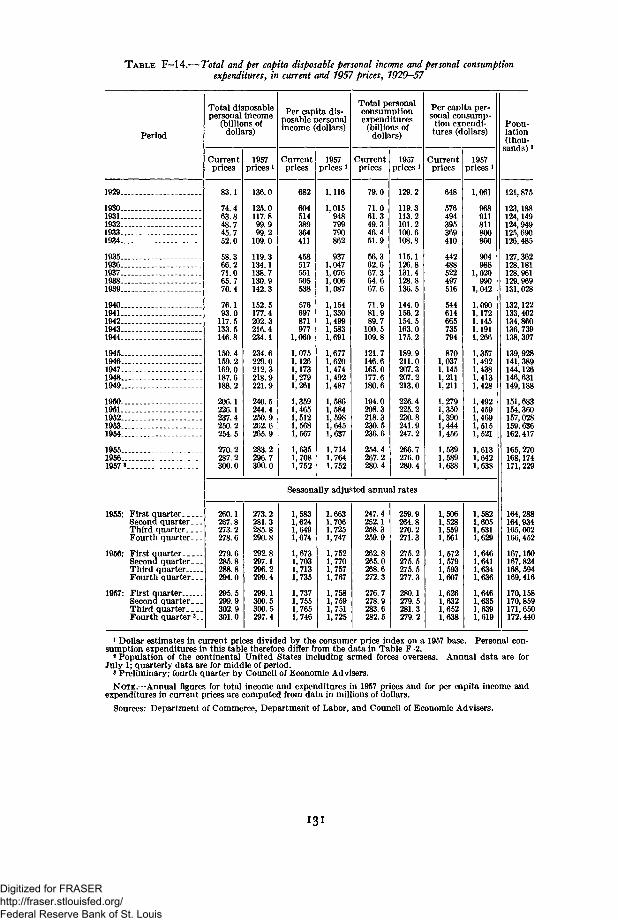
TABLE F-14.—Total and per capita disposable personal income and personal consumptionexpenditures, in current and 1957 prices, 1929-57
Period
Total disposablepersonal income
(billions ofdollars)
Currentprices
1957prices ]
Per capita dis-posable personalincome (dollars)
Currentprices
1957prices'
Total personalconsumptionexpenditures(billions ofdollars)
Currentprices
1957prices ]
Per capita per-sonal consump-tion expendi-tures (dollars)
Currentprices
1957prices ]
Popu-lation(thou-sands) 2
1929..
1930-1931..1932..1933..1934..
1935-1936..1937..1938-1939..
1940..1941..1942..1943-1944..
1945-1946..1947..1948-1949..
1950-1951-1952..1953-1954-
1955-1956-1957«.
1955: First quarterSecond quarter..Third quarter...Fourth quarter..
1956: First quarterSecond quarter..Third quarter._.Fourth quarter..
1957: First quarterSecond quarter..Third quarter. _.Fourth quarter 3
83.1
74.463.848.745.752.0
58.366.271.065.770.4
76.193.0
117.5133.5146.8
150.4159.2169.0187.6188.2
206.1226.1237.4250.2254.5
270.2287.2300.0
136.0
125.0117.899.999.2
109.0
119.3134.1138.7130.9142.3
152.5177.4202.3216.4234.1
234.6229.0212.3218.9221.9
240.5244.4250.9262.6265.9
283.2296.7300.0
682
604514389364411
458517551.505538
576697871977
1,060
1,0751,1261,1731,2791,261
1,3591,4651,5121,5681,567
1,6351,7081,752
1,116
1,015948799790862
9371,0471,0761,0061,087
1,1541,3301,4991,5831,691
1,6771,6201,4741,4921,487
1,5861,5841,5981,6451,637
1,7141,7641,752
79.0
71.061.349.346.451.9
56.362.667.364.667.6
71.981.989.7
100.5109.8
121.7146.6165.0177.6180.6
194.0208.3218.3230.5236.6
254.4267.2280.4
129.2
119.3113.2101.2100.6108.8
115.1126.8131.4128.8136.5
144.0156.2154.5163.0175.2
189.9211.0207.3207.2213.0
226.4225.2230.8241.9247.2
266.7276.0280.4
Seasonally adjusted annual rates
576494
410
442488522497516
544614665735794
8701,0371,1451,2111,211
,279,350,390,444,456
,539
260.1267.8273. 2278.6
279.6285.8288.8294.0
295.5299.9302.9301.0
273.2281.3285.8290.8
292.8297.1296.2299.4
299.1300.5300.5297.4
1]1]
:
,583,624,649,674
,673L,7031,713L,735
1,7371,7551,7651,746
1,6631,7061,7251,747
1,7521,7701, 7571,767
1,7581,7591,7511,725
247.4252.1258.3259.9
262.8265.0268.6272.3
276.7278.9283.6282.5
259.9264.8270.2271.3
275.2275.5275.5277.3
280.1279.5281.3279.2
1,5061,5281,5591,561
1,5721, 5791,5931,607
1,6261,6321,6521,638
1,061
911811800860
904988
1,020990
1,042
1,090,172,145,191,266
,357,492,438,413,428
,492,459,469,5151,521
1,6131,6421,638
1,5821,6051,6311,629
1,6461,6411,6341,636
1,6461,6351,6391,619
121,875
123,188124,149124,949125,690126,485
127,362128,181128,961129,969131,028
132,122133,402134,860136,739138, 397
139,928141,389144,126146,631149,188
151,683154,360157,028159,636162,417
165, 270168,174171, 229
164,288164,934165, 662166,452
167,150167,824168, 594169,416
170,158170,859171,650172, 440
i Dollar estimates in current prices divided by the consumer price index on a 1957 base. Personal con-sumption expenditures in this table therefore differ from the data in Table F-2.8 Population of the continental United States including armed forces overseas. Annual data are forJuly 1; quarterly data are for middle of period.
3 Preliminary; fourth quarter by Council of Economic Advisers.NOTE.—Annual figures for total income and expenditures in 1957 prices and for per capita income and
expenditures in current prices are computed from data in millions of dollars.Sources: Department of Commerce, Department of Labor, and Council of Economic Advisers.
Digitized for FRASER http://fraser.stlouisfed.org/ Federal Reserve Bank of St. Louis
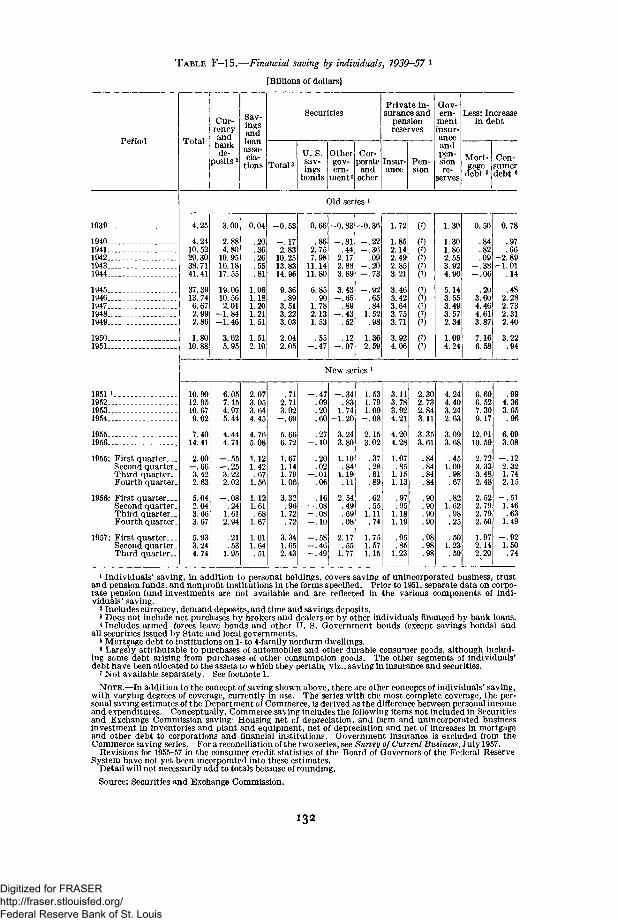
TABLE F-15.—Financial saving by individuals, 1939-57
[Billions of dollars]
Period Total
Cur-rencyand
bankde-
posits 2
Sav-ingsandloanasso-cia-
tions
Securities
TotalsU. S.sav-ings
bonds
Othergov-ern-
ment4
Cor-
andother
Private in-surance and
pensionreserves
[nsur-ance
Pen-sion
Gov-ern-
mentinsur-anceandpen-sionre-
serves
Less: Increasein debt
Mort-gage
debt5
Con-sumerdebt «
Old series J
1939
19401941194219431944
19451946194719481949
19501951
1951 i195219531954
19551956
1955: First quarter._.Second quarter.Third quarter..Fourth quarter
1956: First quarter...Second quarter.Third quarter..Fourth quarter.
1957: First quarter...Second quarter.Third quarter..
4.25
4.2410.5229.3038.7141.41
37.3913.746.672.992.86
1.8010.88
3.00
2.884.80
10.9516.1817.55
19.0610.562.01
-1.84-1.46
3.625.95
0.04
.20
.36
.26
.55
.81
1.061.181.201.211.51
1.512.10
-0.53
- .172.83
10.2513.8314.96
9.36.89
3.513.223.03
2.042.05
0.66
.862.757.98
11.1411.80
6.85.90
1.782.131.53
.55- . 47
-0.83
- . 8 1.44
2.172.883.89
3.43- . 6 5
.89- . 4 3
.52
.12- . 07
-0.36
- . 22- . 36
.09- .20- . 7 3
- .92.65.84
1.52.98
1.362.59
1.72
1.852.142.492.853.21
3.463.423.643.753.71
3.924.06
(7)
(7)(7)(7)(7)(7)
(7)(7)(7)(7)(7)
(7)(7)
1.30
1.301.862.553.924.96
5.143.553.493.572.34
1.094.24
0.50
.84
.82
.09- . 3 8- .06
.203.604.464.613.87
7.166.58
.97
.66-2.89-1.01
.14
.482.282.732.312.40
3.22
New series !
10.9012.9510.679.02
7.4014.41
2.00- .663.422.63
5.042.043.663.67
5.933.244.74
6.057.154.975.44
4.444.71
- . 5 5- . 2 53.222.02
- . 08.24
1.612.94
.21
.531.95
2.073.053.644.45
4.765.08
1.121.42
.671.56
1.121.61.68
1.67
1.011.64.51
.712.713.02
- .69
5.666.72
1.671.141.791.06
3.32.96
1.72.72
3.341.652.43
- . 4 7.09.20.60
.27- . 10
.20
.02- . 0 1
.06
.16- . 08- . 08- .10
- . 58- . 46- .49
- .34.83
1.74-1.20
3.243.80
1.10.84
1.19.11
2.54.49.69.08
2.17.55
1.77
1.531.791.09
- . 08
2.153.02
.37
.28
.61
.89
.62
.551.11.74
1.751.571.15
3.113.783.924.21
4.204.28
1.07.85
1.151.13
.97
.951.181.19
.95
.851.23
2.302.732.843.11
3.353.61
.84
.84
.84
.84
.90
.90
.90
.90
.98
.98
.98
4.244.403.242.63
3.093.68
.451.00.98.67
.821.62.98.25
.501.23.59
6.606.527.309.17
12.0110.59
2.723.333.482.48
2.522.792.792.50
1.972.142.20
4.363.65.96
6.093.08
- . 122.321.742.15
- . 5 11.46.63
1.49
- . 9 21.50.74
1 Individuals' saving, in addition to personal holdings, covers saving of unincorporated business, trustand pension funds, and nonprofit institutions in the forms specified. Prior to 1951, separate data on corpo-rate pension fund investments are not available and are reflected in the various components of indi-viduals' saving.
2 Includes currency, demand deposits, and time and savings deposits.3 Does not include net purchases by brokers and dealers or by other individuals financed by bank loans.4 Includes armed forces leave bonds and other U. S. Government bonds (except savings bonds) andall securities issued by State and local governments.5 Mortgage debt to institutions on 1- to 4-family nonfarm dwellings.6 Largely attributable to purchases of automobiles and other durable consumer goods, although includ-ing some debt arising from purchases of other consumption goods. The other segments of individuals'debt have been allocated to the assets to which they pertain, viz., saving in insurance and securities.
7 Not available separately. See footnote 1.NOTE.—In addition to the concept of saving shown above, there are other concepts of individuals' saving,
with varying degrees of coverage, currently in use. The series with the most complete coverage, the per-sonal saving estimates of the Department of Commerce, is derived as the difference between personal incomeand expenditures. Conceptually, Commerce saving includes the following items not included in Securitiesand Exchange Commission saving: Housing net of depreciation, and farm and unincorporated businessinvestment in inventories and plant and equipment, net of depreciation and net of increases in mortgageand other debt to corporations and financial institutions. Government insurance is excluded from theCommerce saving series. For a reconciliation of the two series, see Survey of Current Business, July 1957.
Revisions for 1955-57 in the consumer credit statistics of the Board of Governors of the Federal ReserveSystem have not yet been incorporated into these estimates.
Detail will not necessarily add to totals because of rounding.Source: Securities and Exchange Commission.
132
Digitized for FRASER http://fraser.stlouisfed.org/ Federal Reserve Bank of St. Louis
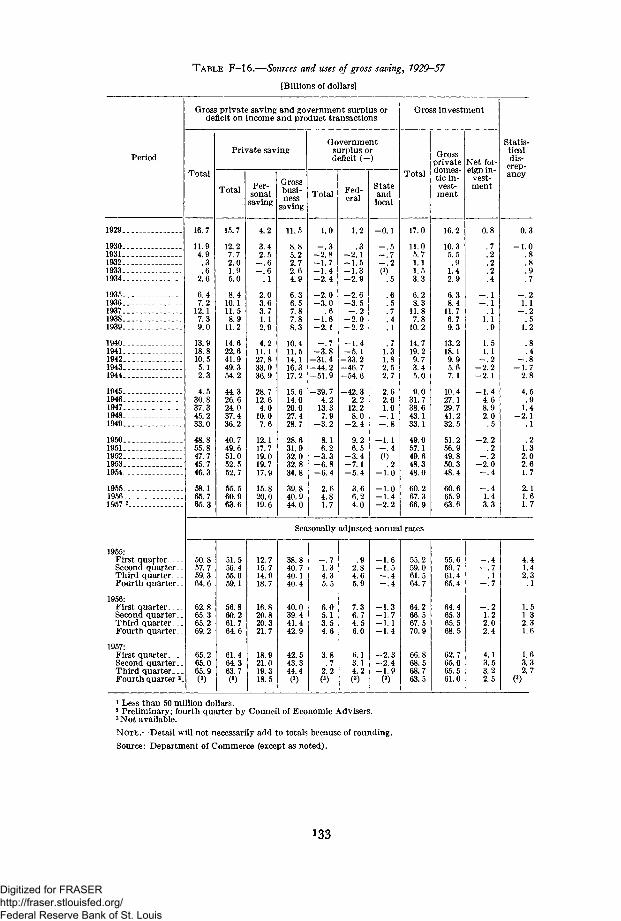
TABLE F—16.—Sources and uses of gross saving, 1929—57
[Billions of dollars]
Period
1929._
1930..1931..1932..1933..1934..
1935..1936..1937..1938..1939..
1940..1941..1942..1943..1944..
1945..1946..1947..1948..1949..
1950..1951..1952..1953..1954-.
1955..1956..1957 2.
1955:First quarterSecond quarter. _Third quarterFourth quarter-.
1956:First quarter.Second quarter. .Third quarter - _Fourth quarter-
1957:First quarterSecond quarter..Third quarter . . .Fourth quarter 2.
Gross private saving and government surplus ordeficit on income and product transactions
Total
16.7
11.94.9.3.6
2.6
6.47.2
12.17.39.0
13,918.810.55.12.3
4.530.837.345.233.0
48.855.847.745.746.3
58.165.765.3
Private saving
Total
15.7
12.27.72.01.95.0
8.410.111.58.9
11.2
14.622.641.949.354.2
44.326.624.037.436.2
40.749.651.052.552.7
55.560.963.6
Per-sonalsaving
4.2
3.42.5
2.03.63.71.12.9
4.211.127.833.036.9
28.712.64.0
10.07.6
12.117.719.019.717.9
15.820.019.6
Grossbusi-ness
saving
11.5
5.22.72.64.9
6. 36.57.87.8
10.411.514.116.317.2
15.614.020.027.428.7
28.631.932.032.834.8
40.944.0
Governmentsurplus ordeficit (-)
Total
1.0
- . 3- 2 . 8- 1 . 7- 1 . 4- 2 . 4
- 2 . 0- 3 . 0
.6- 1 . 6- 2 . 1
- . 7- 3 . 8-31.4-44.2-51.9
-39.74.2
13.37.9
- 3 . 2
8.16.2
- 3 . 3- 6 . 8- 6 . 4
2.64.81.7
Fed-eral
1.2
.3- 2 . 1- 1 . 5- 1 . 3- 2 . 9
-2.6-3.5- . 2
-2.0-2.2
- 1 . 4- 5 . 1
-33.2-46.7-54.6
-42.32.2
12.28.0
- 2 . 4
9.26.5
- 3 . 4- 7 . 1- 5 . 4
3.66.24.0
Stateandlocal
- 0 . 1
- . 5- . 7- . 2(9
.5
.5
.7
.4
.1
.71.31.82.52.7
2.62.01.0
- . 1
- 1 . 1- . 40)
.2- 1 . 0-1 .0- 1 . 4- 2 . 2
Gross investment
Total
17.0
11.05.71.11.53.3
6.28.3
11.87.8
10.2
14.719.29.73.45.0
9.031.738.643.133.1
49.057.149.648.348.0
60.267.366.9
Grossprivatedomes-tic in-vest-ment
Net for-eign in-
vest-ment
16.2
10.35.5.9
1.42.9
6.38.4
11.76.79.3
13.218.19.95.67.1
10.427.129.741.232.5
51.256.949.850.348.4
60.665.963.6
.7
.2
.2
.2
.4
i
!i1.1
1.51.1
- . 2- 2 . 2- 2 . 1
- 1 . 44.68.92.0.5
- 2 . 2.2
- . 2- 2 . 0
- . 4
- . 41.43.3
Seasonally adjusted annual rates
50.857.759.364.6
62.865.365.269.2
65.265.065.9(3)
51.556.455.059.1
56.860.261.764.6
61.464.363.7(3)
12.715.714.918.7
16.820.820.321.7
18.921.019.318.5
38.840.740.140.4
40.039.441.442.9
42.543.344.4(3)
- . 71.34.35.5
6.05.13.54.6
3.8.7
2.2(3)
.92.84.65.9
7.36.74.56.0
6.13.14.2(3)
- 1 . 6- 1 . 5
- . 4A
- 1 . 3- 1 . 7- 1 . 1-1 .4
- 2 . 3-2 .4- 1 . 9
(3)
55.259.061.564.7
64.266.567.570.9
66.868.568.763.5
55.659.761.465.4
64.465.365.568.5
62.765.065.561.0
- . 4- . 7
.1- . 7
- . 21.22.02.4
4.13.53.22.5
Statis-ticaldis-
crep-ancy
0.3
-1.0
.7
- . 21.1
- . 2.5
1.2
.4- . 8
-1.72.8
4.5.9
1.4- 2 . 1
.1
.21.32.02.61.7
2.11.61.7
4.41.42.3.1
1.51.32.31.6
1.63.32.7
1 Less than 50 million dollars.2 Preliminary; fourth quarter by Council of Economic Advisers.3 Not available.
NOTE.—Detail will not necessarily add to totals because of rounding.
Source: Department of Commerce (except as noted).
133
Digitized for FRASER http://fraser.stlouisfed.org/ Federal Reserve Bank of St. Louis
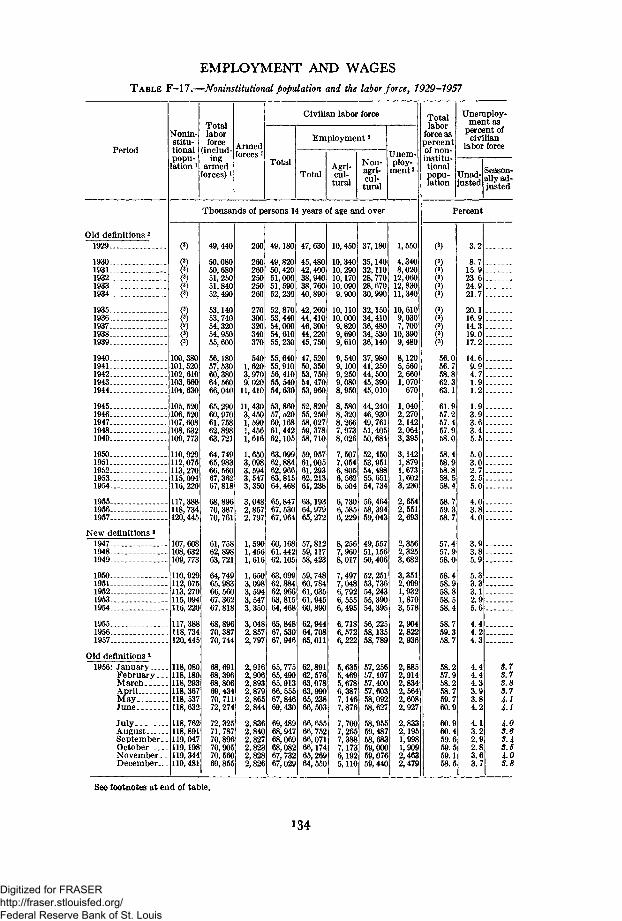
EMPLOYMENT AND WAGESTABLE F-17.—Noninstitutional population and the labor force, 1929-1957
Period
Nonin-stitu-tionalpopu-lation l
Totallaborforce
(includ-ing
armedforces)
Armedforces J
Civilian labor force
Total
Employment2
TotalAgri-cul-
tural
Non-agri-cul-tural
Unem-ploy-
ment2
Totallabor
force aspercentof non-institu-tionalpopu-lation
Unemploy-ment as
percent ofcivilian
labor force
Unad-justed
Season-ally ad-justed
Thousands of persons 14 years of age and over Percent
Old definitions 21929..
1930..1931.1932..1933..1934..
1935-1936-.1937-.1938-
1940-.1941..1942-.1943-1944-.
1945-1946-.1947..1948-1949-
1950-1951-1952-1953-1954-.
1955..1956..1957..
New definitions 2
194719481949
1950-1951-1952..1953..1954..
1955-1956-1957-
Old definitions 2
1956: JanuaryFebruary._-MarchAprilMayJune
JulyAugustSeptember..OctoberNovember-.December...
8
00
100,380101, 520102, 610103, 660104,630
105, 520106, 520107, 608108, 632109, 773
110,929112,075113,270115,094116,220
117,388118, 734120,445
107, 608108, 63r109, 773
110, 929112, 075113, 270115, 094116, 220
117,388118, 734120,445
118,080118,180118, 293118,367118, 53:118,632
118, 762118,891119,047119,198119,344119, 481
49, 440
50,08050,68051, 26051,84052,490
53,14053,74054,32054,95055,600
56,18057, 53060,38064,56066,040
65,29060,97061,75862,89863,721
64,74965,98366, 56067,36267,818
68,89670,38770, 761
61, 758
3, 721
64,74965,98366,56067,36267,818
68,89670,38770, 744
68,39668,80669,43470, 71172,274
72,32571, 78770,89670,90570,56069,855
260
260260250250260
270300320340370
5401,6203,9709,02011,410
11, 4303,450I,!"1, 4561,616
1,6503,0983,5943,5473,350
3,0482,8572,797
1,5901,4561,616
1,6503,0983,5943,5473,350
3,0482,8572,797
2,9162,9062,8932,8792,8652,844
2,8362,8402,8272,8232,8282,826
49,180
49,82050,42051,00051,59052,230
52,87053,44054,00054, 61055, 230
55,64055, 91056, 41055,54054,630
53,86057, o2060,16861,44262,105
63,09962,88462,96663,81564,468
65,84767, 53067,964
60,16861, 44262,105
63,09962,88462,96663,81564,468
65, 84867,53067, 946
65, 77565,49065,91366,55567,84669, 430
69, 48968,94768,06968,08267, 73267,029
47,630
45,48042,40038,94038,76040,890
42,26044,41046,30044,22045,750
47, 52050, 350.53, 75054, 47053,960
52,82055,25058,02769,37858,710
59, 95761,00561.29362,21361,238
63,19364,97965,272
57, 81259,11758,423
59, 74860,78461,03561,94560,890
62,94464,70865, Oil
62,89162,57663,07863,99065,23866, 503
66, 65566,75266,07166,17465,26964, 550
10,450
10,34010,29010,17010,0909,900
10,11010,0009,8209,6909,610
9,5409,1009,2509,0808,950
8,5808,3208,2667,9738,026
7,5077,0546, 8056,5626,604
6,7306,5856,229
8,2567,9608,017
7,4977,0486,7926,5556,495
6,7186,5726,222
5,6355,4695,6786,3877,1467,876
7,7007,2657,3887,1736,1925,110
37,180
35,14032,11028, 77028,67030,990
32,15034, 41036, 48034,53036,140
37, 98041,25044,50045,39045,010
44,24046,93049, 76161,40550,684
52,45053,95154,48855, 65154,734
56,46458,39459,043
49, 55751,15650,406
52, 25153, 73654, 24355,39054, 395
56, 22558,13558, 789
57,25667,10757,40057,60358,09258,627
58,95559,48768,68359,00059,07659,440
1, 550
4,3408,02012,06012,83011,340
10,6109,0307,70010,3909,480
8,1205,5602,6601,070670
1,0402,2702,1422,0643,395
3,1421,8791, 6731,6023,230
2,6542,5512,693
2,3562,3253,682
3,3512,0991,9321,8703,578
2,9042,8222,936
2,8852,9142,8342,5642,6082,927
2,8332,1951,9981,9092,4632,479
()C3)(3)
56.056.758.862.363.1
61.967.257.457.968.0
58.458.958.858.558.4
58.759.358.7
57.457.958.0
58.458.958.858.558.4
58.759.358.7
58.257.968.258.759.760.9
60.960.459.659.559.158.5
3.2
8.715.923.624.921.7
20.116.914.319.017.2
14.69.94.71.91.2
1.93.93.63.45.5
5.03.02.72.55.0
4.03.84.0
3.85.9
5.33.33.12.95.6
4.44.24.3
4.44.44.33.93.84.2
4.13.22.92.83.63.7
S.7S.7S.8S.7
4-0S.6S.4S.54-0S.8
See footnotes at end of table.
134
Digitized for FRASER http://fraser.stlouisfed.org/ Federal Reserve Bank of St. Louis
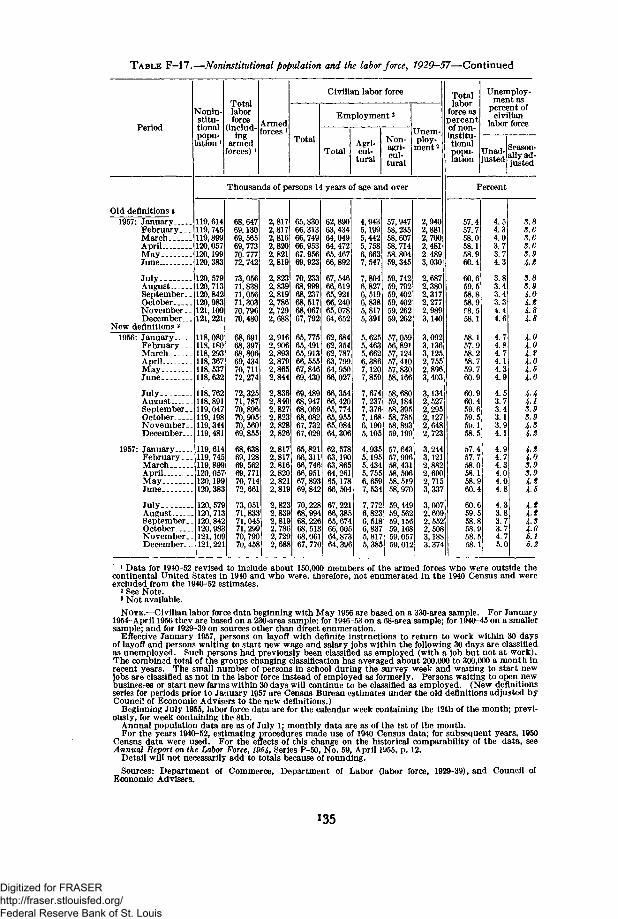
TABLE F-17.—Noninstitutional population and the labor force, 1929-57—Continued
Period
Old definitions t1957: January
February._.MarchAprilMayJune..
JulyAugustSeptember.OctoberNovember.December..
New definitions 21956: January
FebruaryMarchAprilMayJune
JulyAugustSeptember.OctoberNovember.December..
1957: JanuaryFebruary ..MarchAprilMayJune
JulyAugustSeptember.October . . .November.December.
Slonin-stitu-tionalpopu-ation l
Totallaborforce
(includ-ing
armedforces)
Armedforces *
Civilian labor force
Total
Employment2
TotalAgri-cul-
tural
Non-agri-cul-tural
Unem-ploy-
ment2
Thousands of persons 14 years of age and over
119,614119, 745119,899120,057120,199120,383
120, 579120, 713120,842120,983121,109121, 221
118,080118,180118, 293118,367118, 537118,632
118, 762118,891119,047119,198119,344119, 481
119,614119,745119,899120,057120,199120,383
120, 579120, 713120,842120,983121,109121,221
68,64769,13069, 56569, 77370. 77772, 742
73, 05671,83871,05671,30370,79670, 480
68,69168,39768,80669, 43470, 71172,274
72,32571, 78770,89670,90570, 56069, 855
68,63869,12869, 56269, 77170, 71472, 661
73,05171,83371,04571,29970, 79070,458
2,8172,8172,8162,8202,8212,819
2,8232,8392,8192,7862,7292,688
2,9162,9062,8932,8792,8652,844
2,8362,8402,8272,8232,8282,826
2,8172,8172,8162,8202,8212,819
2,8232.8392,8192,7862,7292,688
65,83066, 31366, 74966,95367. 95669,923
70,23368,99968,23768,51768,06767,792
65, 77565,49165, 91366, 55567,84669, 430
69,48968,94768,06968,08267, 73267,029
65,82166,31166, 74666,95167,89369, 842
70,22868,99468,22668,51368,06167, 770
62,89063,43464,04964, 47265, 46766,892
67, 54666, 61965, 92166,24065,07864,652
62,68462,35462, 78763,79964,95066,027
66,35466, 42065, 77465, 95565,08464,306
62, 57863,19063.86564. 26165,17866,504
67,22166, 38565, 67466,00564,87364,396
4,9435,1995,4425,7586,6637,547
7,8046,8276,5196,8385,8175,391
5,6255,4635,6626,3867,1207,859
7,6747,2377,3767,1686,1905,105
4,9355,1955,4345,7556,6597,534
7,7726,823G, 5186,8375,8175,385
57,94758, 23558,60758, 71458. 80459,345
59, 74259, 79259, 40259, 40259, 26259,262
57,05956,89157,12457, 41057,83058,166
58, 68059,18458,39558, 78558, 89359,199
57, 64357,99658, 43158,50658, 51958,970
59, 44959, 56259,15659,16859,05759,012
2,9402,8812,7002,4812.4893,030
2,6872,3802,31"2,27'2,9893,140
3,0923,1363,1252,7552,8963,403
3,1342,5272,2952,1272,6482,723
3,2443,12'2,8822,6902,7153,337
3,0072,6092,5522,5083,1853,37'
Totallabor
force aspercentof non-institu-tionalpopu-lation
Unemploy-ment as
percent ofcivilian
labor force
Unad-justed
Season-ally ad-justed
Percent
57.457.758.058.158.960.4
60.659.558.858.9f8.558.1
58.157.958.258.759.760.9
60.960.459.659. 559.158.5
67.457.758.058.158.960.4
60.659.558.858.958.558.1
4.54.34.03.3.4.
773
3.83.3.3.4.4.
4.4.4.4.44
433
44346
787139
574
3.13.94.1
444444
4
973008
33̂ 83345
770
3.8S.6S.6S.6S.94.2
S.8S.94.04.24-84.8
4.04.04.24.04.54.6
4-44.1S.9S.94.S4.2
4.24.0S.9S.94.24.5
4.24.24.S4.65.15.2
1 Data for 1910-52 revised to include about 150,000 members of the armed forces who were outside thecontinental United States in 1940 and who were, therefore, not enumerated in the 1940 Census and wereexcluded from the 1940-52 estimates.
2 See Note.3 Not available.
NOTE.—Civilian labor force data beginning with May 1956 are based on a 330-area sample. For January1954-April 1956 thev are based on a 230-area sample; for 1946-53 on a 68-area sample; for 1940-45 on a smallersample; and for 1929-39 on sources other than direct enumeration.
Effective January 1957, persons on layoff with definite instructions to return to work within 30 daysof layoff and persons waiting to start new wage and salary jobs within the following 30 days are classifiedas unemployed. Such persons had previously been classified as employed (with a job but not at work).The combined total of the groups changing classification has averaged about 200,000 to 300,000 a month inrecent years. The small number of persons in school during the survey week and waiting to start newjobs are classified as not in the labor force instead of employed as formerly. Persons waiting to open newbusinesi-es or start new farms within 30 days will continue to be classified as employed. (New definitionsseries for periods prior to January 1957 are Census Bureau estimates under the old definitions adjusted byCouncil of Economic Advisers to the new definitions.)
Beginning July 1955, labor force data are for the calendar week containing the 12th of the month; previ-ously, for week containing the 8th.
Annual population data are as of July 1; monthly data are as of the 1st of the month.For the years 1940-52, estimating procedures made use of 1940 Census data; for subsequent years, 1950
Census data were used. For the effects of this change on the historical comparability of the data, seeAnnual Report on the Labor Force, 1954, Series P-50, No. 59, April 1955, p. 12.
Detail will not necessarily add to totals because of rounding.
Sources: Department of Commerce, Department of Labor (labor force, 1929-39), and Council ofEconomic Advisers.
135
Digitized for FRASER http://fraser.stlouisfed.org/ Federal Reserve Bank of St. Louis
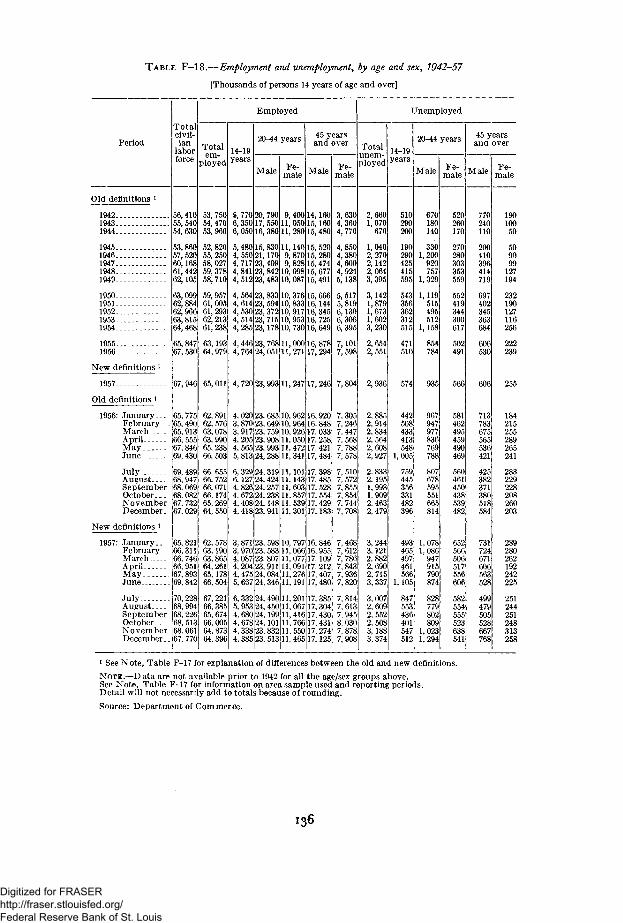
TABLE F—18.—Employment and unemployment, by age and sex, 1942—57
[Thousands of persons 14 years of age and over]
Period
Totalcivil-ian
laborforce
Old definitions *
194219431944
19451946 _'___194719481949
19501951195219531954
1955
1956
New definitions i
1957
Old definitions i1956: January. . .
February .March .. .AprilMayJune
JulyAugustSeptemberOctoberNovemberDecember.
New definitions 1
1957: JanuaryFebruaryMarchAprilMayJune
JulyAugustSeptemberOctoberNovemberDecember. .
Totalem-
ployed
56,41055, 54054, 630
53,86057,52060,16861, 44262,105
63,09962,88462,96663,81564,468
65,84767, 530
67, 946
65, 77565, 49065, 91366, 55567, 84669, 430
69, 48968, 94768, 06968, 082
r,73267, 029
65, 82166,31166, 74666, 95167, 89369, 842
70, 22868, 99468, 2261,513
68. 06167, 770
Employed
53,75054,47053, 960
52, 82055, 25058, 02759, 37858, 710
59, 95761, 00561,29362, 21361, 238
63,19364,979
65, 011
62, 89162, 57663, 07863,99065, 23866, 503
66, 65566, 75266, 07166,17465, 26964,550
62, 57863,19063, 86564, 26165,17866, 504
67, 22166, 38565, 67466, 00564,87364,396
14-19years
5,770 20,790 9,40014,1606,35017,55011,05015,1606, 050 16, 380 11, 280 15, 480
5,480 15,4,4, 717 23;4, 841 23,4,, 512 23,
564 23, 833 10, 376 15, 666614 23, 594 10, 833 16,144530 23, 372 10,917 16, 345514 23, 715 10, 953 16, 725285 23,178 10, 730 16, 649
4,446 23,76811,00016,8784, 764 24, 05111, 271
20-44 years
Male
\, 830 11,140 15, 520170
C409i, 842 10,098 15, 6771,483 10,087 15, 491
4, 720 23,993 11, 247 17, 246
4, 020 23, 685 10, 962 16,3,870 23,'3, 917 23, 759 10, 926 17,4,205 23,'4,565 23,99311,47217,5, 813 24, 288 11, 341
329 24, 319 11,101
4,4,672 24,23811.4,4,418 23,941 11,
332 24, 490 11, 201953 24,45011,067
,199678 24,101338 23,832 11,385 23,513 11,465
Fe-male
17, 398127 24, 424 11,143 17, 485826 24,25711,60317,528
17, 554408 24,14811,539 17,429
17,183
,857,539,301
3, 871 23, 598 10, 797 16, 8463, 970 23,4, 087 23, 807 114,204 23,911 114,4755,607 24,34611
583 11, 066 16, 955, 07',091
11, 27,191
17, 38517, 304
680 24,199 11,41617,43011, 766 17, 431
550 17, 27417,125
45 yearsand over
Male
17,294
i, 920964 16, 848
.033050 17, 258
',42117, 484
17,10917.212
',40717, 480
'617,
Fe-male
Totalunem-ployed
3,6304,3604,770
4,8504,3804,6004,9245,138
5,5175,8196,1306,3066,395
7,1017,598
7,804
7,3057,2467.44'7,5687,7887,578
7,510
7, 8557,8547,7447,708
7,4687,6127,7867,8437,9367,820
7,8147,6137,9458,0307,8787,908
Unemployed
2,6601,070
670
1,0402,2702,1422,0643, 39f
3,1421,8791,6731,6023,230
2,6542,551
2,936
2,8852,9142,8342,5642,6082,927
2,8332,19)1,9981,9092,4632,479
3,2443,1212,8822,6902,7153,337
3,0072,6092,5522,5083,1883,374
14-19years
510290200
190290425415595
543356362312515
471510
574
442508433413548
1,005
759445356331482396
493465497461566
1,105
84'55343640154'512
20-44 years
Male
670180140
3301,200
920757
1,329
1,119515495512
1,158
854784
935
967947977836769788
807678595551
1,0781,086947915790874
828779802809
1,0231,294
Fe-male
520260170
270280303353559
552419344300617
502491
566
581462495459490469
560461450438539482
652566506517556606
582554555523638541
45 yearsand over
Male
770240110
200410396414719
697402345363
606530
606
713783675565536421
425382371380518584
731724671606563528
479505528667768
Fe-male
19010050
509099
127194
232190127116256
222239
255
184215255289265241
283229228208260203
289280262192242225
251244251248313258
1 See Note, Table F-17 for explanation of differences between the old and new definitions.
NOTE.—Data are not available prior to 1942 for all the age/sex groups above.See Note, Table F-17 for information on area sample used and reporting periods.Detail will not necessarily add to totals because of rounding.
Source: Department of Commerce.
I36
Digitized for FRASER http://fraser.stlouisfed.org/ Federal Reserve Bank of St. Louis
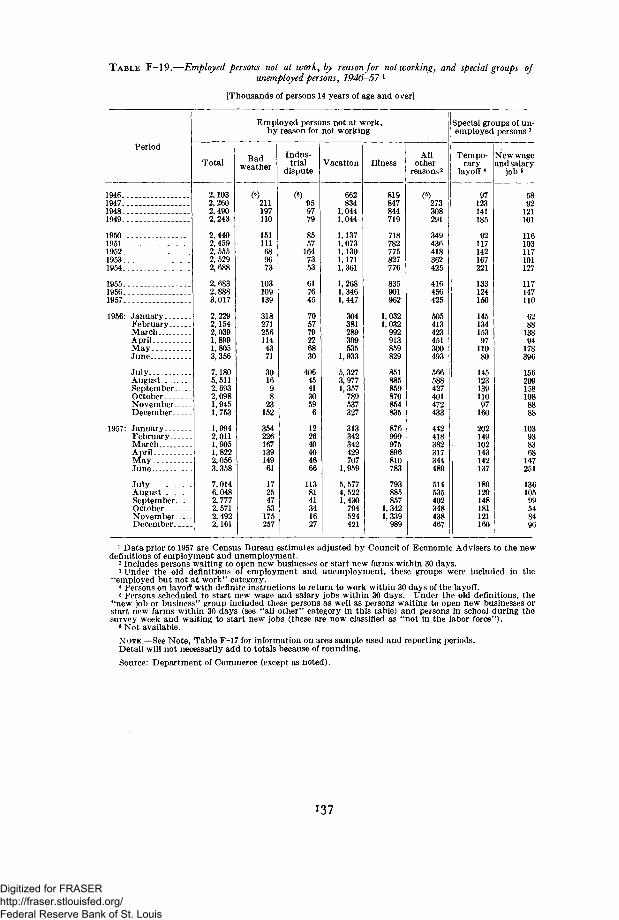
T A B L E F—19.—Employed persons not at work, by reason for not working, and special groups of
unemployed persons, 7946-57 l
[Thousands of persons 14 years of age and over]
Period
1946,.1947..1948..1949-.
1950-.1951-.1952-.1953-1954.
1955.1956.1957.
1956: JanuaryFebruary...MarchApril. _MayJune
JulyAugustSeptember..OctoberNovember._December _.
1957: JanuaryFebruary...MarchAprilMayJune
JulyAugustSeptember..OctoberNovember..December..
Employed persons not at work,by reason for not working
1,9942,0111,9051,8222,0563,358
7,0146,0482,7772,5712,4922,161
Badweather
Indus-trial
dispute
959779
8557
1647353
617645
705779226830
406454130596
1226404046
1138141341627
Vacation
662834
1,0441,044
1,1371,0731,1301,1711,361
1,2681,3461,447
304381289399535
1,933
5,3273,9771,357789537327
313342342429707
1,959
5,5774,5221,430
794524421
Illness
819847844719
718782775827776
835901962
1,0321,032992913859
851885859870854835
876999975896810
793885857
1,3421,339
Allother
reasons2
)273308291
349436418362425
416456425
505413423451300493
566588427401472433
442418382317344489
514535402348438467
Special groups of un-employed persons 3
Tempo-rary
layoff 4
97123141185
92117142167221
133124150
1451341539711080
14512313911097160
202149102143142137
129148181121160
New wageand salary
job»
5892
121101
116103117101127
117147110
6288
13894
178396
156209158108
10393
147251
13610599548496
1 Data prior to 1957 are Census Bureau estimates adjusted by Council of Economic Advisers to the newdefinitions of employment and unemployment.
2 Includes persons waiting to open new businesses or start new farms within 30 days.3 Under the old definitions of employment and unemployment, these groups were included in the
"employed but not at work" category.4 Persons on layoff with definite instructions to return to work within 30 days of the layoff.5 Persons scheduled to start new wage and salary jobs within 30 days. Under the old definitions, the
"new job or business" group included these persons as well as persons waiting to open new businesses orstart new farms within 30 days (see "all other" category in this table) and persons in school during thesurvey week and waiting to start new jobs (these are now classified as "not in the labor force").
s Not available.
NOTE.—See Note, Table F-17 for information on area sample used and reporting periods.Detail will not necessarily add to totals because of rounding.
Source: Department of Commerce (except as noted).
137
Digitized for FRASER http://fraser.stlouisfed.org/ Federal Reserve Bank of St. Louis
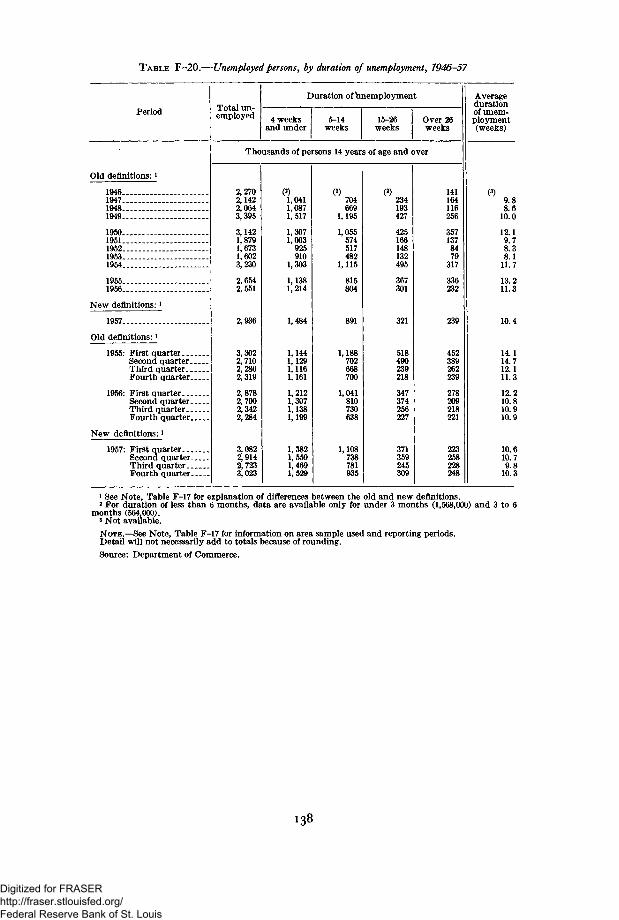
T A B L E F—20.—Unemployed persons, by duration of unemployment, 1946—57
Period
Old definit ions:1
1946194719481949
19501951195219531954
19551956
N e w definitions: i
1957
Old definitions:»
1955: First quarter _Second quarterThird quarterFourth quarter
1956: First quarterSecond quarterThird quarterFourth quarter
New definitions:1
1957: First quarter.Second quarterThird quarterFourth quarter
Total un-employed
Duration of Vinemployment
4 weeksand under
5-14weeks
15-26weeks
Over 26weeks
Thousands of persons 14 years of age and over
2,2702,1422,0643,395
3,1421,8791,6731,6023,230
2,6542,551
2,936
3,3022,7102,2862,319
2,8782,7002,3422,284
3,0822,9142,7233,023
1,0411,0871,517
1,3071,003
925910
1,303
1,1381,214
1,484
1,1441,1291,1161,161
1,2121,3071,1381,199
1,3821,5591,4691,529
704669
1,195
1,055574517482
1,115
815804
891
1,188702668700
1,041810730638
1,108738781935
234193427
425166148132495
367301
321
518490239218
347374256227
371359245309
141164116256
3571378479
317
336232
239
452389262239
278209218221
223258228248
Averagedurationof unem-ployment(weeks)
(3)9.88.6
10.0
12.19.78.38.1
11.7
13.211.3
10.4
14.114.712.111.3
12.210.810.910.9
10.610.79.8
10.3
1 See Note, Table F-17 for explanation of differences between the old and new definitions.2 For duration of less than 6 months, data are available only for under 3 months (1,568,000) and 3 to I
months (564,000).» Not available.NOTE.—See Note, Table F-17 for information on area sample used and reporting periods.Detail will not necessarily add to totals because of rounding.
Source: Department of Commerce.
138
Digitized for FRASER http://fraser.stlouisfed.org/ Federal Reserve Bank of St. Louis
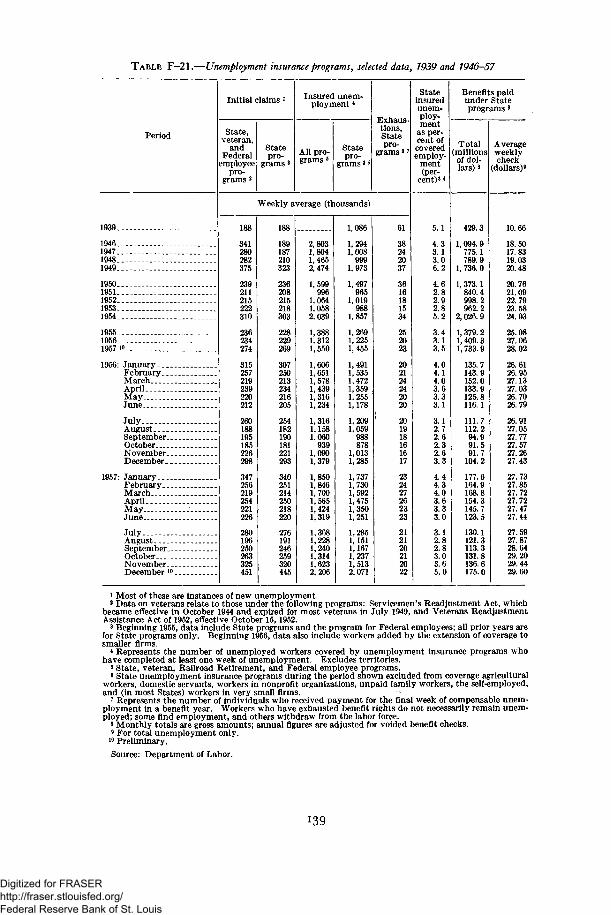
TABLE F-21.—Unemployment insurance programs, selected data, 1939 and 1946—57
Period
1939..
1946..1947..1948.1949.
1950 _1951.1952.1953.1954.
1955.1956.1957 1
1956: January. _February.MarchAprilMayJune
JulyAugustSeptember.OctoberNovember-December..
1957: January. .February.MarchAprilMayJune
JulyAugustSeptember...OctoberNovember. __December 10.
State, iveteran,
andFederal
employeepro-
grams 2
Initial claims 1
Statepro-
grams 3
Insured unem-ployment *
All pro-grams 5
Statepro-
grams 3
Exhaus-tions,Statepro-
grams 3
Weekly average (thousands)
188
341280282375
239211215222310
236234274
315257219239220212
260188195185226298
347256219254221226
280196250263325451
188
189187210323
236208215218303
228229269
307250213234216205
254182190181221293
340251214250218220
276191246259320445
2,8031,8041,4652,474
1,599996
1,0641,0582,039
1,3881,3121,550
1,6061,6511,5781,4391,3161,234
1,3161,1581,060939
1,0901,379
1,8501,8461,7001,5651,4241,319
1,3681,2281,2401,3141,6232,206
1,086
1,2941,008999
1,973
1,497965
1,019988
1,857
1,2691,2251,455
1,4911,5351,4721,359 .1, 2551,178
1,2091,059988878
1,0131,285
1,7371,7301,5921,4751,3501,251
1,2851,1511,1671,2371,5132,071
38242037
3616181534
252023
202124242020
201918161617
232427262323
212120212022
Stateinsuredunem-ploy-ment
as per-cent ofcoveredemploy-
ment(per-
cent) 3 <
5. 1
4.33.13.06.2
4.62.82.92.85.2
3.43.13.5
4.04.14.03.63.33.1
3.12.72.62.32.63.3
4.44.34.03.63.33.0
3.12.82.83.03.65.0
Benefits paidunder Stateprograms 3
Totalmillionsof dollars) s
429.3
1,094.9775.1789.9
1,736.0
1, 373.1840.4998.2962.2
2,026. 9
1, 379. 21,409.31,733.9
135.7143.9152.0133.9125.8116.1
111.7112.294.991.591.7
104.2
177.6164.9168.8154.3145.7123.5
130.1121.3113.3131.8136.6175.0
Averageweeklycheck
[dollars)'
10.66
18.5017.8319.0320.48
20.7621.0922.7923.5824.93
25.0827.0628.02
26.6126.9527.1327.0326.7026.79
26.9127.0527.7727.5727.2627.43
27.7327.8527.7227.7227.4727 Ai
27.5927.8728.6429.2029.4429.60
1 Most of these are instances of new unemployment.2 Data on veterans relate to those under the following programs: Servicemen's Readjustment Act, which
became effective in October 1944 and expired for most veterans in July 1949, and Veterans ReadjustmentAssistance Act of 1952, effective October 15, 1952.
3 Beginning 1955, data include State programs and the program for Federal employees; all prior years arefor State programs only. Beginning 1956, data also include workers added by the extension of coverage tosmaller firms.
4 Represents the number of unemployed workers covered by unemployment insurance programs whohave completed at least one week of unemployment. Excludes territories.
5 State, veteran, Railroad Retirement, and Federal employee programs.8 State unemployment insurance programs during the period shown excluded from coverage agricultural
workers, domestic servants, workers in nonprofit organizations, unpaid family workers, the self-employed,and (in most States) workers in very small firms.
7 Represents the number of individuals who received payment for the final week of compensable unem-ployment in a benefit year. Workers who have exhausted benefit rights do not necessarily remain unem-ployed; some find employment, and others withdraw from the labor force.
8 Monthly totals are gross amounts; annual figures are adjusted for voided benefit checks.9 For total unemployment only.
10 Preliminary.
Source: Department of Labor.
139
Digitized for FRASER http://fraser.stlouisfed.org/ Federal Reserve Bank of St. Louis
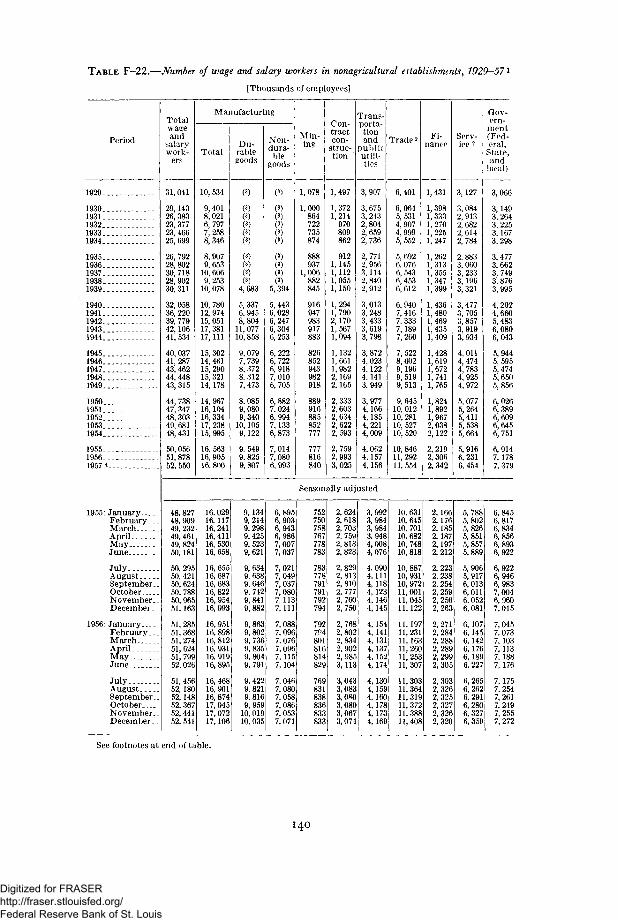
TABLE F-22.—Number of wage and salary workers in nonagr{cultural establishments, 1929-57 *
[Thousands of employees]
Period
1929
1930193119321933.1934
193519361937.19381939
19401941194219431944
19451946194719481949
19501951195219531954
195519561957 4
1955: JanuaryFebruary. -MarchAprilMayJune
JulyAugustSeptember-OctoberNovember.December.
1956- January . . . .February. .MarchAprilMayJune
JulyAugustSeptember.OctoberNovember.December.
Total
andsalarywork-
ers
31, 041
29,14326, 38323, 37723, 46625, 699
26, 79228, 80230, 71828, 90230,311
32, 05836, 22039, 77942,10641, 534
40, 03741, 28743, 46244, 44843, 315
44, 73847, 34748, 30349, 68148, 431
50, 05651, 87852, 550
Manufacturing
Total
10, 534
9,4018,0216,7977,2588,346
8,9079, 653
10, 6069,253
10, 078
10, 78012, 97415, 05117, 38117,111
15,30214, 46115, 29015, 32114,178
14. 96716,10416, 33417, 23815, 995
16. 56316,90516, 800
Du-rablegoods
(3)
(3)
(3)
(3)
( 3 )
(3)
(3)
(3)
(3)
4,683
5,3376,9458,804
11, 07710, 858
9,0797,7398, 3728, 3127,473
8,0859,0809,340
10,1059,122
9,5499,8259,807
Non-dura-ble
goods
(3)
( 3 )(3)
(3)
( 3 )
(3)
(3)
( 3 )(3)
5,394
5,4436,0286,2476,3046,253
6,2226,7226,9187,0106, 705
6,8827,0246,9947,1336,873
7,0147,0806,993
Min-ing
1,078
1,000864722735874
888937
1,006882845
916947983917883
826852943982918
889916885852111
111816840
Con-tractcon-
struc-tion
1,497
1,3721,214
970809862
9121,1451,1121,0551,150
1,2941,7902, 1701,5671,094
1,1321,6611,9822,1692,165
2,3332,6032,6342,6222,593
2,7592,9933,025
Trans-porta-tionand
publicutili-ties
3,907
3,6753,2432,8042,6592,736
2,7712.9563,1142,8402,912
3,0133,2483,4333,6193,798
3,8724,0234,1224,1413,949
3,9774,1664,1854,2214,009
4,0624,1574.156
Trade2
6,401
6,0645,5314,9074,9995,552
5,6926,0766, 5436,4536,612
6,9407,4167,3337,1897,260
7,5228,6029,1969,5199,513
9,64510, 01210, 28110, 52710, 520
10, 84611,29211,554
Fi-nance
1,431
1,3981,3331.2701,2251,247
1,2621,3131,3551,3471,399
1,4361,4801,469I, 4351,409
1,4281,6191.6721,7411,765
1,8241,8921,9672,0382,122
2,2192,3062,342
Serv-ice 2
3,127
3,0842,9132,6822,6142,784
2,8833,0603,2333,1963,321
3,4773,7053,8573,9193,934
4,0114,4744,7834,9254,972
5,0775,2645,4115,5385,664
5, 9166,2316,454
Gov-ern-
ment(Fed-eral,
State,and
local)
3,066
3,1493,2643.2253,1673,298
3,4773,6623,7493,8763,995
4,2024,6605,4836,0806,043
5,9445,5955,4745,6505, 856
6, 0266,3896,6096,6456,751
6,9147,1787,379
Seasonally adjusted
48, 82748, 90949, 23249, 46149, 82450,181
50, 29550, 42150, 62450,78850, 96551,163
51, 28551, 36851, 27451, 62451, 79952,026
51, 45652. 18052,14852, 36752, 44152, 541
16, 02916,11716, 24116,41116, 53016, 658
16,65516,68716, 68316, 82216, 95416, 993
16, 95116, 89816, 81216, 93116, 91916, 895
16, 46816, 90116, 87417,04517,07217,106
9,1349,2149,2989,4259,5239,621
9,6349.6389,6469,7429,8419,882
9,8639,8029,7369,8359,8049,791
9,4229,8219,8169,959
10,01910, 035
6,8956,9036,9436,9867,0077,037
7,0217,0497,0377,0807,1137,111
7,0887,0967.0767,0967,1157,104
7,0467,0807,0587,0867,0537,071
752750758767778783
783778791791792794
7927P4801816814829
769831838836833833
2,6242,6182,7032,7592,8132,823
2,8292,8132,8102,7772,7602,750
2,7682,8022,8342,9022,9853,113
3,0433,0833,0803,0803,0673,074
3, 9923,9843,9843,9484,0084,076
4,0904,1114,1184,1234,1464,145
4,1544, 1414, 1314,1374,1524,174
4,1304,1594,1604,1784,1734,169
10, 63110, 64510, 70110, 68210,74810, 818
10, 88710, 93110, 97211,00111,04511,122
11,19711,23111,16311,26011,25311,307
11,30311,36411,31911,37211,38811,408
2,1662,1762,1852,1872,1972,212
2,2232,2382,2542,2592,2562,263
2,2712,2842,2882,2892,2992,305
2,3032,3262,3252,3272,3262,320
5, 7885,8025,8265,8515,8575,889
5,9065,9176,0136,0116,0526,081
6,1076,1456,1426,1766,1896,227
6,2656,2626,2916,2806,3276,359
6,8456,8176,8346,8566,8936,922
6,9226,9466,9837,0046,9607,015
7,0457.0737, 1037,1137.1887,176
7,1757,2547,2617,2497,2557,272
See footnotes at end of table.
14O
Digitized for FRASER http://fraser.stlouisfed.org/ Federal Reserve Bank of St. Louis
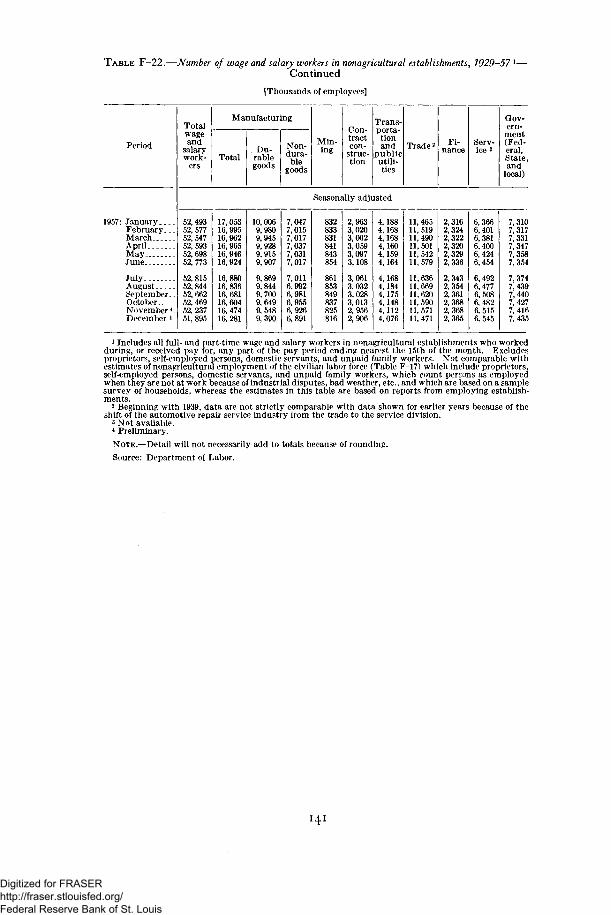
T A B L E F-22.—Number of wage and salary workers in nonagi (cultural establishments, 1929-57 1—Continued
[Thousands of employees]
Period
Totalwageand
salarywork-
ers
Manufacturing
TotalDu-rablegoods
Non-dura-ble
goods
Min-ing
Con-tractcon-
struc-tion
Trans-porta-tionand
publicutili-ties
Trade 2 Fi-nance
Serv-ice 2
Gov-ern-
ment(Fed-eral,State,and
local)
Seasonally adjusted
1957: JanuaryFebruaryMarchAprilMayJune
JulyAugustSeptember..OctoberNovember4-December 4_
52, 49352, 57752, 54752, 59352, 69852, 773
52, 81552, 84452, 66252, 46952, 23751, 895
17,05316, 99516, 96216, 96516, 94616, 924
16,88016,83616, 68116,60416, 47416, 281
10,0069,9809,9459,9289,9159,907
9,8699,8449,7009,6499,5489,390
7,0477,0157,0177,0377,0317,017
7,0116,9926,9816,9556,9266,891
832833831841843854
861853849837825816
2,9633,0203,0623,0593,0973,108
3,0613,0323,0283,0132,9562,906
4,1884,1684,1684,1604,1594,164
4,1684,1844,1754,1484,1124,076
11,46511, 51911,49011,50111, 54211, 579
11, 63611, 66911,62011, 59011, 57111, 471
2,3162,3242,3222,3202,3292,336
2,3432,3542,3612,3682,3682,365
6,3666,4016,3816,4006,4246,454
6,4926,4776,5086,4826,5156,545
7,3107,3177,3317,3477,3587,354
7,3747,4397,4407,4277,4167.435
1 Includes all full- and part-time wage and salary workers in nonagricultural establishments who workedduring, or received pay for, any part of the pay period ending nearest the 15th of the month. Excludesproprietors, self-employed persons, domestic servants, and unpaid family workers. Not comparable withestimates of nonagricultural employment of the civilian labor force (Table F-17) which include proprietors,self-employed persons, domestic servants, and unpaid family workers, which count persons as employedwhen they are not at work because of industrial disputes, bad weather, etc., and which are based on a samplesurvey of households, whereas the estimates in this table are based on reports from employing establish-ments.
2 Beginning with 1939, data are not strictly comparable with data shown for earlier years because of theshift of the automotive repair service industry from the trade to the service division.
3 Not available.4 Preliminary.
NOTE.—Detail will not necessarily add to totals because of rounding.
Source: Department of Labor.
Digitized for FRASER http://fraser.stlouisfed.org/ Federal Reserve Bank of St. Louis
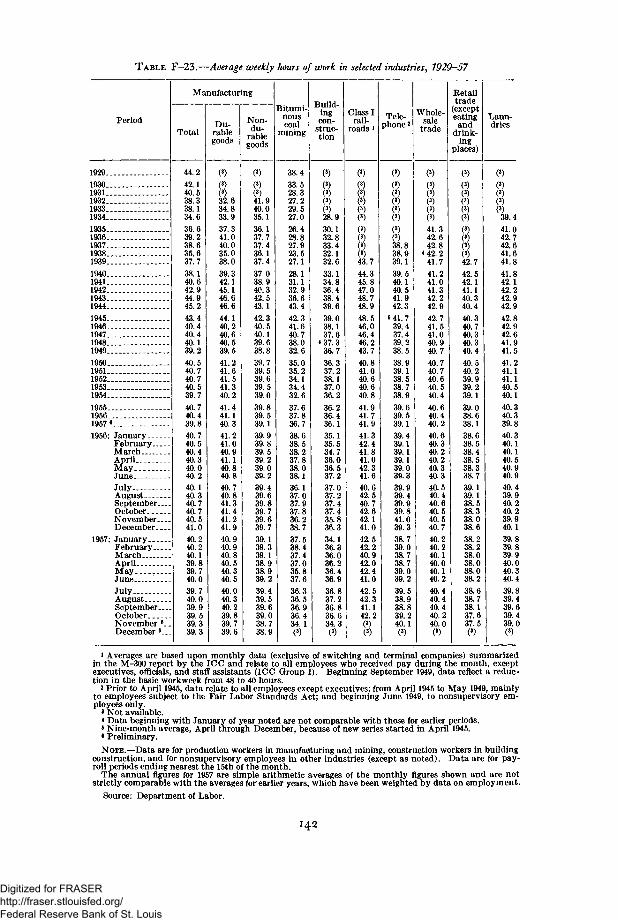
TABLE F-23.—Average weekly hours of work in selected industries, 1929-57
Period
19291930 - .19311932193319341935193619371938193919401941194219431944194519461947...194819491950195119521953 .-1954
19551956 __._1957 6
1956: JanuaryFebruaryMarchAprilMayJuneJulyAugustSeptember...OctoberNovember.. .December. _.
1957: JanuaryFebruaryMarchAprilMayJune . - . -July. . . .AugustSeptember...OctoberNovember 6 .December 6..
Manufacturing
Total
44.2
42.140.538.338.134.636.639.238.635.637.738.140.642.944.945.2
43.440.440.440.139.2
40.540.740.740.539.740.740.439.840.740.540.440.340.040.240.140.340.740.740.541.0
40.240.240.139.839.740.039.740. 039.939.539.339.3
Du-rablegoods
()32.634.833.9
37.341.040.035.038.039.342.145.146.646.6
44.140.240.640.539.541.241.641.541.340.241.441.140.341.241.040.941.140.840.840.740.841.341.441.241.940.940.940.840.540.340.5
40.040.340.239.839.739.6
Non-du-
rablegoods
Bitumi-nouscoal
mining
()41.940.035.136.137.737.436.137.4
37.038.940.342.543.1
42.340.540.139.638.839.739.539.639.539.0
39.839.539.139.939.839.539.239.039.239.439.639.839.739.639.7
39.139.339.138.938.939.2
39.439.539.639.038.738.9
38.4
33.528.327.229.527.026.428.827.923.527.128.131.132.936.643.4
42.341.640.738.032.6
35.035.234.134.432.6
37.637.836.7
38.638.538.237.838.038.136.137.037.937.836.238.737.538.437.437.035.837.6
36.336.536.936.434.1
Build-ingcon-
struc-tion
()28.9
30.132.833.432.132.6
33.134.836.438.439.6
39.038.137.6
<37.336.7
36.337.238.137.036.2
36.236.436.135.135.534.736.036.537.237.037.237.437.435.836.334.136.336.036.236.436.9
36.837.236.836.634.3
Class Irail-
roads iTele-
phone 2
()43.7
44.345.847.048.748.9
48.546.046.446.243.740.841.040.640.640.8
41.941.741.941.342.441.841.042.341.640.642.540.742.642.141.042.542.240.942.042.441.0
42.542.341.142.2
Whole-sale
trade
()38.838.939.1
39.540.140.541.942.3
5 41.739.437.439.238.5
38.939.138.538.738.9
39.639.539.139.439.139.139.139.039.339.939.439.939.841.039.3
38.739.038.738.739.039.2
39.538.938.839 240.1
41.342.642.8
4 42.241.741.241.041.342.242.942.741.541.040.940.7
40.740.740.640.540.4
40.640.440.2
40.640.340.240.240.340.3
40.540.440.640.540.540.740.240.240.140.040.140.2
40.440.440.440.240.0
Retailtrade
(excepteatingand
drink-ing
places)
()42.7
42.542.141.140.340.4
40.340.740.340.340.4
40.540.239.939.239.1
39.038.638.138.638.538.438.538.338.739.139.138.538.338.038.6
38.238.238.038.038.038.2
38.638.738.137.637.5
Laun-dries
()39.441.042.742.641.641.8
41.842.142.242.942.9
42.842.942.641.941.5
41.241.141.140.540.1
40.340.339.840.340.140.140.540.940.9
40.439.940.240.239.940.139.839.839.940.040.340.4
39.839.439.639.439.0
)
1 Averages are based upon monthly data (exclusive of switching and terminal companies) summarizedin the M-300 report by the ICC and relate to all employees who received pay during the month, exceptexecutives, officials, and staff assistants (ICC Group I). Beginning September 1949, data reflect a reduc-tion in the basic workweek from 48 to 40 hours.
2 Prior to April 1945, data relate to all employees except executives; from April 1945 to May 1949, mainlyto employees subject to the Fair Labor Standards Act; and beginning June 1949, to nonsupervisory em-ployees only.
3 Not available.< Data beginning with January of year noted are not comparable with those for earlier periods,s Nine-month average, April through December, because of new series started in April 1945.6 Preliminary.
NOTE.—Data are for production workers in manufacturing and mining, construction workers in buildingconstruction, and for nonsupervisory employees in other industries (except as noted). Data are for pay-roll periods ending nearest the 15th of the month.
The annual figures for 1957 are simple arithmetic averages of the monthly figures shown and are notstrictly comparable with the averages for earlier years, which have been weighted by data on employment.
Source: Department of Labor.
142
Digitized for FRASER http://fraser.stlouisfed.org/ Federal Reserve Bank of St. Louis
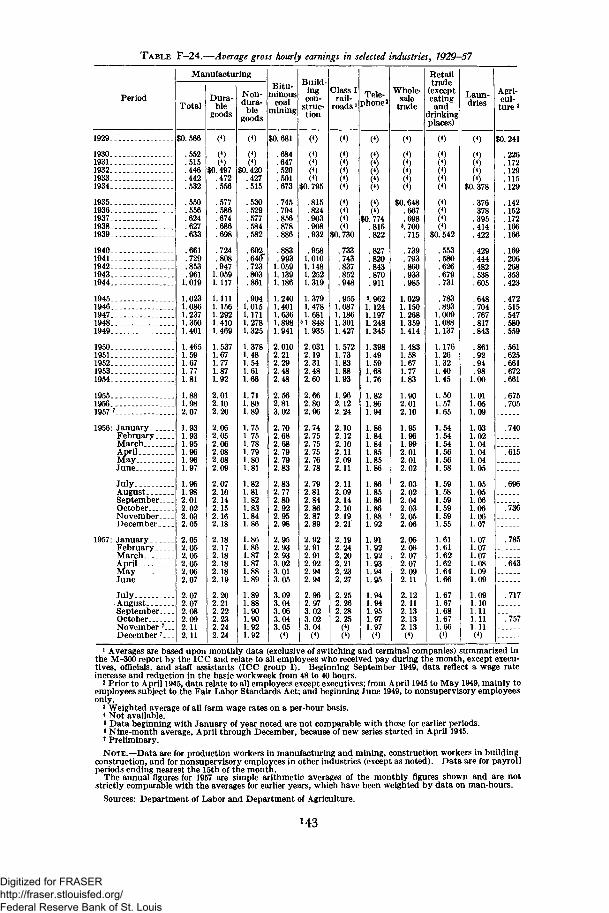
TABLE F-24.—Average gross hourly earnings in selected industries, 1929-57
Period
1929.
19301931193219331934
19351936193719381939
19401941194219431944
19451946194719481949
19501951195219531954
195519561957 i
1956: January._.FebruaryMarchAprilMayJune
JulyAugustSeptemberOctoberNovemberDecember
1957: JanuaryFebruaryMarchAprilMayJune
JulyAugustSeptemberOctoberNovember 7__.December 7
Manufacturing
Total
$0. 566
.552
.515
.446
.442
.532
.550
.556
.624
.627
.633
.661
.729
.853
.9611.019
1.0231.0861.2371.3501.401
1. 4651.591.671.771.81
1.881.982.07
1.931.931.951.961.961.97
1.961.982.012.022.032.05
2.052.052.052.052.062.07
2.072.072.082.092.112.11
Dura-ble
goods
()$0.497
.472
.556
.577
.586
.674
.724
.808
.9471.0591.117
1.1111.1561.2921.4101.469
1.5371.671.771.871.92
2.012.102.20
2.062.052.062.082.082.09
2.072.102.142.152.162.18
2.182.172.182.182.182.19
2.202.212.222.232.242.24
Non-dura-
blegoods
Bitu-minous
coalmining
()$0,420
.427
.515
.530
.529
.577
.584
.582
.723
.803
.861
.9041.0151.1711.2781.325
.378
.48
.54
.61
.71
.80
.75
.75
.78
.79
.80
.81
.82
.81
.82
.83
.84
.88
.90
.90
.92
.92
$0,681
.647
.520
.501
.673
.745
.794
.856
.878
.059
.139
.186
.240.401.636.898.941
2.0102.212.292.482.48
2.562.813.02
2.702.682.682.792.792.83
2.832.772.802.922.952.98
2.952.932.933.023.013.05
3.093.043.063.043.05
Build-ingcon-
struc-tion
()$0. 795
.815
.824
.903
.908
.932
.9581.0101.1481.2521.319
1.3791.4781.6811.8481.935
2.0312.192.312.482.60
2.662.802.96
2.742.752.752.752.762.78
2.792.812.842.862.872.89
2.922.912.912.922.942.94
2.962.973.023.023.04
JlassIrail-
roadsTele-
phone2
()$0. 730
.733
.743
.837
.852
.948
.9551.0871.1861.3011.427
1.5721.731.831.881.93
1.962.122.24
2.102.122.102.112.092.11
2.112.092.142.102.192.21
2.192.242.202.212.232.27
2.252.262.282.25
()$0. 774
.816
.822
.827
.820
.843
.870
.911
6.9621.1241.1971.2481.345
1.3981.491.591.681.76
1.821.861.94
1.861.841.841.851.851.86
1.861.851.861.861.881.92
1.911.921.921.931.941.95
1.941.941.951.971.97
Whole-sale
trade
Retailtrade
(excepteating
anddrinkingplaces)
$0.648.667.698
5.700.715
.739
.793
.860
.933
.985
1.0291. 1501.2681.3591.414
1.4831.581.671.771.83
1.902.012.10
1.951.961.992.012.012.02
2.032.022.042.032.052.06
2.062.062.072.072.092.11
2.122. 112.132.132.13
()$0. 542
.553
.580
.626
.679
.731
.783
.8931.0091.0881.137
1.1761.261.321.401.45
1.501.571.65
1.541.541.541.561.561.58
1.591.581.591.591.591.55
1.611.611.621.621.641.66
1.671.671.681.671.66
Laun-dries
()$0.378
.376
.378
.395
.414
.422
.429
.444
.482
.538
.605
.648
.704
.767
.817
.843
.861
.92
.94
.981.00
1.011.051.09
1.031.021.041.041.041.05
1.051.051.061.061.061.07
1.071.071.071.081.091.09
1.091.101.111.111.11
Agri-cul-
ture 3
$0,241
.226
.172
.129
.115
.129
.142
.152
.172
.166
.166
.206
.268
.353
.423
.472
.515
.547
.580
.559
.561
.625
.661
.672
.661
.675
.705
.740
"."615
.696
.736
.785
.643
.717
'."757
1 Averages are based upon monthly data (exclusive of switching and terminal companies) summarized inthe M-300 report by the ICC and relate to all employees who received pay during the month, except execu-tives, officials, and staff assistants (ICC group I). Beginning September 1949, data reflect a wage rateincrease and reduction in the basic workweek from 48 to 40 hours.
2 Prior to April 1945, data relate to all employees except executives; from April 1945 to May 1949, mainly toemployees subject to the Fair Labor Standards Act; and beginning June 1949, to nonsupervisory employeesonly.
3 Weighted average of all farm wage rates on a per-hour basis.• Not available.8 Data beginning with January of year noted are not comparable with those for earlier periods.6 Nine-month average, April through December, because of new series started in April 1945.7 Preliminary.
NOTE.—Data are for production workers in manufacturing and mining, construction workers in buildingconstruction, and for nonsupervisory employees in other industries (except as noted). Data are for payrollperiods ending nearest the 15th of the month.
The annual figures for 1957 are simple arithmetic averages of the monthly figures shown and are notstrictly comparable with the averages for earlier years, which have been weighted by data on man-hours.
Sources: Department of Labor and Department of Agriculture.
143
Digitized for FRASER http://fraser.stlouisfed.org/ Federal Reserve Bank of St. Louis
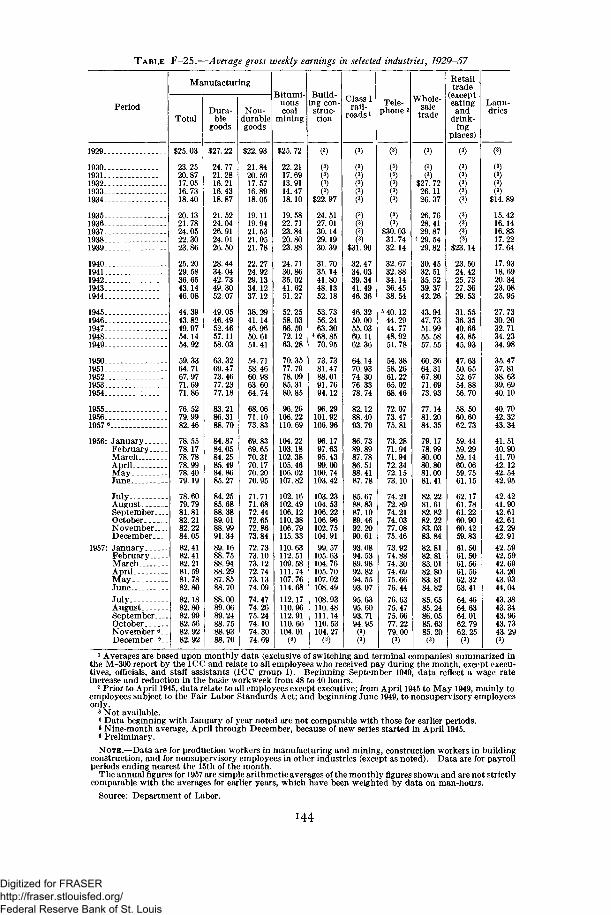
TABLE F-25.—Average gross weekly earnings in selected industries, 1929—57
Period
Manufacturing
TotalDura-
blegoods
Non-durablegoods
Bitumi-nouscoal
mining
Build-ing con-struc-tion
Class Irail-
roads lTele-
phoneWhole-
saletrade
Retailtrade
(excepteating
anddrink-
ingplaces)
Laun-dries
1929--
1930..1931-.1932-.1933-.1934..
1935..1936_.1937-_1938..1939_.
1940-.1941-.1942_.1943..1944_.
1945..1946-.1947..1948-.1949-.
1950-.1951-.1952-.1953-.1954-.
1955...1956—1957 •_.
1956: JanuaryFebruaryMarchAprilMayJune
JulyAugustSeptember...OctoberNovember...December. __
1957: JanuaryFebruaryMarchAprilMayJuneJulyAugustSeptember...OctoberNovember 6.December 6 .
$25.03
23.2520.8717.0516.7318.40
20.1321.7824.0522.3023.86
25.2029.5836.6543.1446.08
44.3943.8249.9754.1454.92
59.3364.7167.9771.6971.86
76.5279.9982.46
78. 5578.1778.7878.9978.4079.19
78.6079.7981.8182.2182.2284.05
82.4182.4182.2181.5981.7882.80
82.1882.8082.9982.5682.9282.92
$27. 22
24.7721.2816.2116.4318.87
21.5224.0426.9124.0126.50
28.4434.0442.7349.3052.07
49.0546.4952.4657.1158.03
63.3269.4773.4677.2377.18
83.2186.3188.70
84.8784.0584.2585.4984.8685.27
84.2585.6888.3889.0188.9991.34
89.1688.7588.9488.2987.8588.70
88.0089.0689.2488.7588.9388.70
$22. 93
21.8420.5017.5716.8918.05
19.1119.9421.5321.0521.78
22.2724.9229.1334.1237.12
38.2941.1446.9650.6151.41
54.7158.4660.9863.6064.74
68.0671.1073.83
69.8369.6570.3170.1770.2070.95
71.7171.6872.4472.6572.8673.84
72.7373.1073.1272.7473.1374.09
74.4774.2675.2474.1074.3074.69
$25. 72
22.2117.6913.9114.4718.10
19.5822.7123.8420.8023.88
24.7130.8635.0241.6251.27
52.2558.0366.5972.1263.28
70.3577.7978.0985.3180.85
96.26106. 22110. 69
104. 22103.18102. 38105. 46106.02107. 82
102.16102. 49106.12110.38106. 79115. 33
110.63112.51109. 58111.74107. 76114.68
112.17110.96112.91110. 66104.01
()$22. 97
24.5127.0130.1429.1930.39
31.7035.1441.8048.1352.18
53.7356.2463.30
4 68. 8570.95
73.7381.4788.0191.7694.12
96.29101.92106. 96
96.1797.6395.4399.00100.74103. 42
103. 23104. 53106.22106.96102. 75104. 91
99.57105.63104. 76105. 70107. 02108. 49
108.93110.48111.14110.53104. 27
()$31. 90
32.4734.0339.3441.4946.36
46.3250.0055.0360.1162.36
64.1470.9374.3076.3378.74
82.1288.4093.79
86.7389.8987.7886.5188.4187.78
85. 6788.8387.1089.4692.2090.61
93.0894.5389.9892.8294.5593.07
95.6395.6093.7194.95
()$30. 0331.7432.14
32.6732.8834.1436.4538.54
5 40.1244.2944.7748.9251.78
54.3858.2661.2265.0268.46
72.0773. 4775.81
73.2871.9471.9472.3472.1573.10
74.2172.8974.2174.0377.0875.46
73.9274.8874.3074.6975.6676.44
76.6375.4775.6677.2279.00
()$27. 7226.1126.37
26.7628.4129.87
4 29. 5429.82
30.4532.5135.5239.3742.26
43.9447.7351.9955.5857.55
60.3664.3167.8071.6973.93
77.1481.2084.35
79.1778.9980.0080.8081.0081.41
82.2281.6182.8282.2283.0383.84
82.8182.8183.0182.8083.8184.82
85.6585.2486.0585.6385.20
()$23.14
23.5024.4225.7327.3629.53
31.5536.3540.6643.8545.93
47.6350.6552.6754.8856.70
58.5060.6062.73
59.4459.2959.1460.0659.7561.15
62.1761.7861.2260.9060.4259.83
61.5061.5061.5661.5662.3263.41
64.4664.6364.0162.7962.25
)
()$14. 89
15.4216.1416.8317.2217.64
17.9318.6920.3423.0825.95
27.7330.2032.7134.2334.98
35.4737.8138.6339.6940.10
40.7042.3243.34
41.5140.9041.7042.1242.5442.95
42.4241.9042.6142.6142.2942.9142.5942.5942.6943.2043.9344.0443.3843.3443.9643.7343.29
1 Averages are based upon monthly data (exclusive of switching and terminal companies) summarized inthe M-300 report by the ICC and relate to all employees who received pay during the month, except execu-tives, officials, and staff assistants (ICC group I). Beginning September 1949, data reflect a wage rateincrease and reduction in the basic workweek from 48 to 40 hours.
2 Prior to April 1945, data relate to all employees except executive; from April 1945 to May 1949, mainly toemployees subject to the Fair Labor Standards Act; and beginning June 1949, to nonsupervisory employeesonly.
3 Not available.4 Data beginning with January of year noted are not comparable with those for earlier periods.* Nine-month average, April through December, because of new series started in April 1945.6 Preliminary.
NOTE.—Data are for production workers in manufacturing and mining, construction workers in buildingconstruction, and for nonsupervisory employees in other industries (except as noted). Data are for payrollperiods ending nearest the 15th of the month.
The annual figures for 1957 are simple arithmetic averages of the monthly figures shown and are not strictlycomparable with the averages for earlier years, which have been weighted by data on man-hours.
Source: Department of Labor.
144
Digitized for FRASER http://fraser.stlouisfed.org/ Federal Reserve Bank of St. Louis
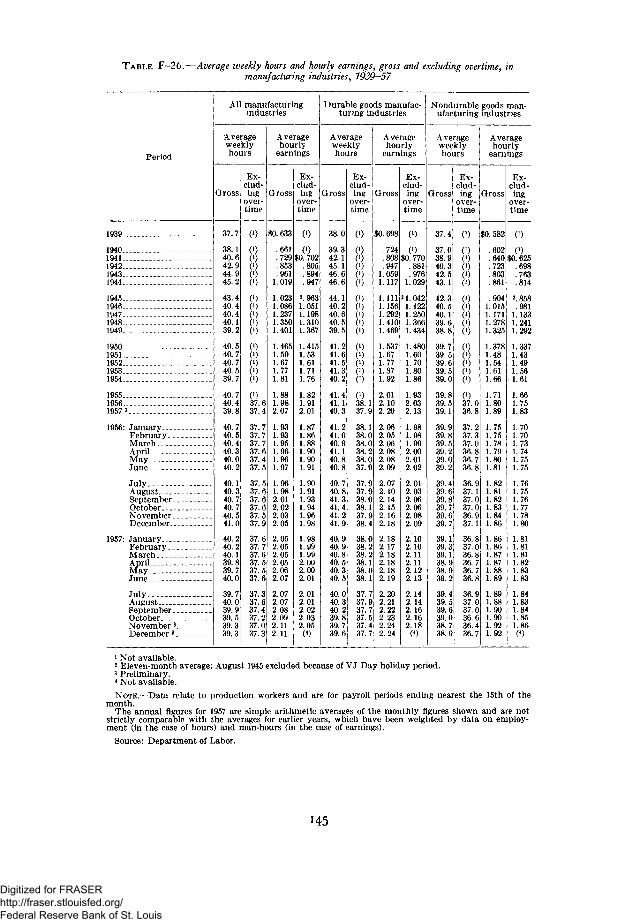
T A B L E F-26.—Average weekly hours and hourly earnings, gross and excluding overtime, inmanufacturing industries, 1939-57
Period
All manufacturingindustries
Averageweeklyhours
Gross
37.7
38.140.642.944.945.2
43.440.440.440.139.2
40.540.740.740.539.7
40.740.439.8
40.740.540.440.340.040.2
40.140.340.740.740.541.0
40.240.240.139.839.740.0
39.740.039.939.539.339.3
Ex-clud-ing
ovei-time
0)
0)0)0)(00)0)0)0)(00)0)0)0)0)(0(037.637.4
37.737.737.737.637.437.5
37.537.637.637.637.537.9
37.637.737.637.537.537.6
37.337.637.437.237.037.3
Averagehourly
earnings
Gross
$0,633
.661
.729
.853
.9611. 019
1.0231.0861.2371.3501.401
1.4651.591.671.771.81
1.881.982.07
1.931.931.951.961.961.97
1.961.982.012.022.032.05
2.052.052.052.052.062.07
2.072.072.082.092.112.11
Ex-clud-ing
over-time
0)
(0$0. 702
.805
.894
.947
2.9631.051
<
.198L.3101.367
L. 415L. 531.611.711.76
1.821.912.01
I. 871.86L.88L.901.90L. 91
1.901.91L93L.94L. 961.98
L.98L. 991.992.002.002.01
2.012.012.022.032.05
Durable goods manufac-turing industries
Averageweeklyhours
Gross
38.0
39.342.145.146.646.6
44.140.240.640.539.5
41.241.641.541.340.2
41.441.140.3
41.241.040.941.140.840.8
40.740.841.341.441.241.9
40.940.940.840.540.340.5
40.040.340.239.839.739.6
Ex-clud-ing
over-time
0)
0)0)0)(0(0(')0)0)(00)0)0)0)0)0)0)38.137.9
38.138.038.038.238.037.9
37.937.938.038.137.938.4
38.038.238.238.138.038.1
37.737.937.737.537.437.7
Averagehourly
earnings
Gross
$0. 698
.724
.808
.9471.0591.117
1.1111.1561.2921.4101.469
1.5371.671.771.871.92
2.012.102.20
2.062.052.062.082.082.09
2.072.102.142.152.162.18
2.182.172.182.182.182.19
2.202.212.222.232.242.24
Ex-clud-ing
over-time
0)
0)$0. 770
.881
.9761.029
21.0421.1221.2501.3661.434
1. 4801.601.701.801.86
1.932.032.13
1.981.981.992.002.012.02
2.012.032.062.062.082.09
2.102.102.112.112.122.13
2.142.142.162.162.18
(*)
Nondurable goods man-ufacturing industries
Averageweeklyhours
Gross
37.4
37.038.940.342.543.1
42.340.540.139.638.8
39.739.539.639.539.0
39.839.539.1
39.939.839.539.239.039.2
39.439.639.839.739.639.7
39.139.339.138.938.939.2
39.439.539.639.038.738.9
Ex-clud-ing
over-time
0)
0)0)0)(0(00)(00)(00)0)0)0)0)0)
0)37.036.8
37.237.337.036.836.736.8
36.937.137.037.036.937.1
36.837.036.836.736.736.8
36.937.037.036.636.436.7
Averagehourly
earnings
Gross
$0.582
.602
.640
.723
.803
.861
.9041.0151.1711.2781.325
1.3781.481.541.611.66
1.711.801.89
1.751.751.781.791.801.81
1.821.811.821.831.841.86
1.861.861.871.871.881.89
1.891.881.901.901.921.92
Ex-clud-ing
over-time
0)
0)$0.625
.698
.763
.814
2.858.981
1.1331.2411.292
1.3371.431.491.561.61
1.661.751.83
1.701.701.731.741.751.75
1.761.751.761.771.781.80
1.811.811.811.821.831.83
1.841.831.841.851.86(4)
1939
19401941194219431944
19451946194719481949
19501951195219531954
1955195619573
1956: JanuaryFebruary. .MarchAprilMayJune
JulyAugustSeptember.OctoberNovember.December..
1957: JanuaryFebruary. . .MarchAprilMayJune
JulyAugustSeptember .OctoberNovember 3.December 3 .
1 Not available.2 Eleven-month average; August 1945 excluded because of VJ Day holiday period.3 Preliminary.4 Not available.
NOTE.—Data relate to production workers and are for payroll periods ending nearest the 15th of themonth.
The annual figures for 1957 are simple arithmetic averages of the monthly figures shown and are notstrictly comparable with the averages for earlier years, which have been weighted by data on employ-ment (in the case of hours) and man-hours (in the case of earnings).
Source: Department of Labor.
145
Digitized for FRASER http://fraser.stlouisfed.org/ Federal Reserve Bank of St. Louis
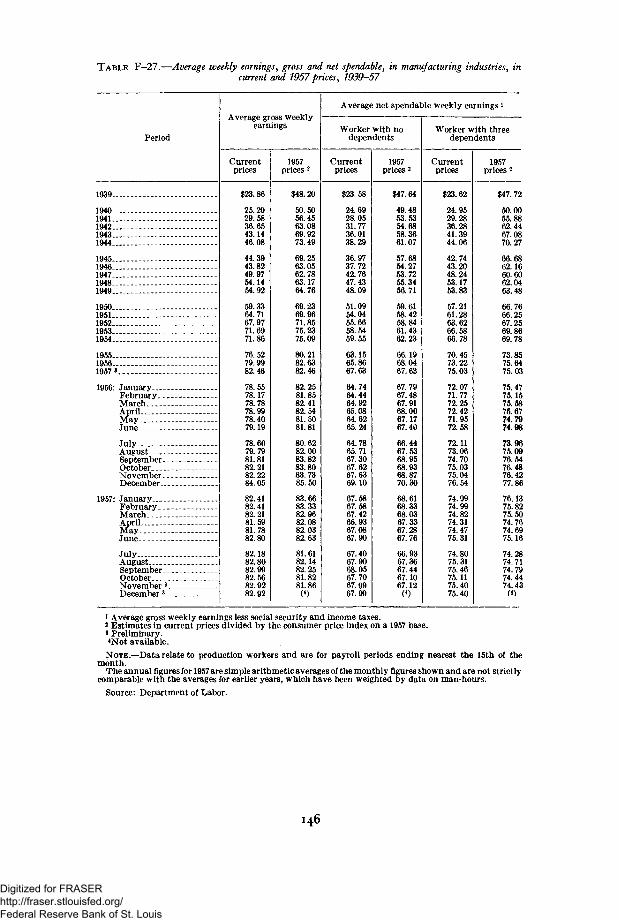
TABLE F—27.—Average weekly earnings, gross and net spendable•, m manufacturing industries, incurrent and 1957 prices, 1939-57
Period
1939 _ - .
1940194119421943 . . . .1944
19451946194719481949
19501951 _195219531954 .
195519561957 3
1956: January -_FebruaryMarchAprilMay - -June . _ .
July .AugustSeptemberOctoberNovemberDecember
1957* JanuaryFebruaryMarch _ _ _AprilMayJune
JulyAugustSeptember _OctoberNovember 3_-December 3
Average gross weeklyearnings
Currentprices
$23.86
25.2029.5836.6543.1446.08
44.3943.8249.9754.1454.92
59.3364.7167.9771.6971.86
76.5279.9982.46
78.5578.1778.7878.9978.4079.19
78.6079.7981.8182.2182.2284.05
82.4182.4182.2181.5981.7882.80
82.1882.8082.9982.5682.9282.92
1957prices 2
$48.20
50.5056.4563.0869.9273.49
69.2563.0562.7863.1764.76
69.2369.9671.8575.2375.09
80.2182.6382.46
82.2581.8582.4182.5481.5081.81
80.6282.0083.8283.8083.7385.50
83.6683.3382.9682.0882.0382.63
81.6182.1482.2581.8281.86
(*)
Average net spendable weekly earnings i
Worker with nodependents
Currentprices
$23.58
24.6928.0531.7736.0138.29
36.9737.7242.7647.4348.09
51.0954.0455.6658.5459.55
63.1565.8667.63
64.7464.4464.9265.0864.6265.24
64.7865.7167.3067.6267.6369.10
67.5867.5867.4266.9367.0867.90
67.4067.9068.0567.7067.9967.99
1957prices 2
$47.64
49.4853.5354.6858.3661.07
57.6854.2753.7255.3456.71
59.6158.4258.8461.4362.23
66.1968.0467.63
67.7967.4867.9168.0067.1767.40
66.4467.5368.9568.9368.8770.30
68.6168.3368.0367.3367.2867.76
66.9367.3667.4467.1067.12
(4)
Worker with threedependents
Currentprices
$23.62
24.9529.2836.2841.3944.06
42.7443.2048.2453.1753.83
57.2161.2863.6266.5866.78
70.4573.2275.03
72.0771.7772.2572.4271.9572.58
72.1173.0674.7075.0375.0476.54
74.9974.9974.8274.3174.4775.31
74.8075.3175.4675.1175.4075.40
1957prices 2
$47.72
50 0055.8862.4467.0870.27
66.6862 1660.6062.0463.48
66 7666.2567.2569.8669.78
73.8575.6475.03
75.4775 1575.5875 6774.7974.98
73.9675.0976.5476.4876.4277.86
76.1375.8275.5074.7674.6975.16
74.2874.7174.7974.4474.43
(*)
1 Average gross weekly earnings less social security and income taxes.2 Estimates in current prices divided by the consumer price index on a 1957 base.3 Preliminary.4Not available.
NOTE.—Data relate to production workers and are for payroll periods ending nearest the 15th of themonth.
The annual figures for 1957 are simple arithmetic averages of the monthly figures shown and are not strictlycomparable with the averages for earlier years, which have been weighted by data on man-hours.
Source: Department of Labor.
146
Digitized for FRASER http://fraser.stlouisfed.org/ Federal Reserve Bank of St. Louis
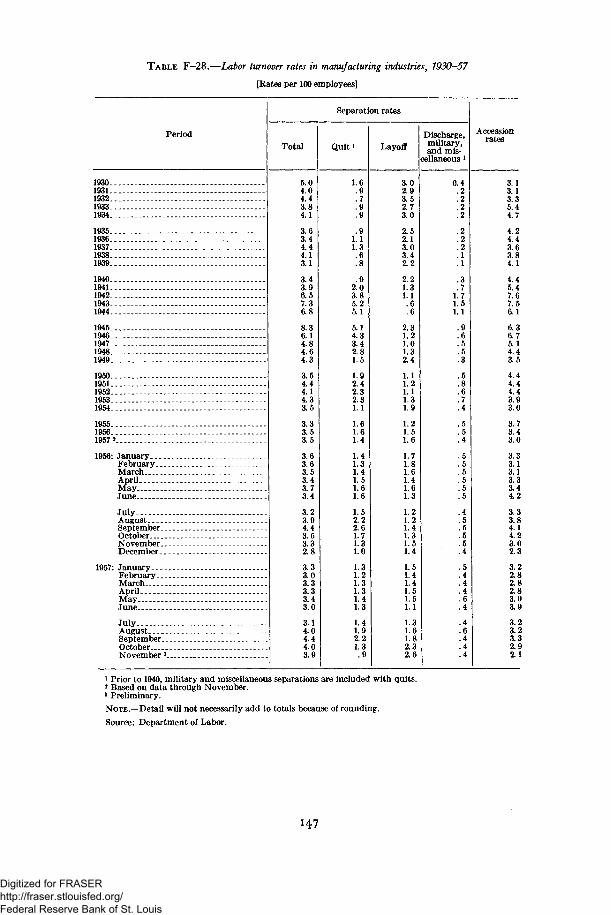
TABLE F-28.—Labor turnover rates in manufacturing industries, 1930-57
[Rates per 100 employees]
Period
1930..1931..1932..1933..1934..
1935-.1936..1937..1938..1939..
1940..1941-.1942-.1943..1944..
1945..1946.1947..1948.1949.
1950..1951.1952.1953.1954.
1955...1956.-.1957 2.
1956: January...February-MarchAprilMayJune
JulyAugustSeptember..OctoberNovember.December..
1957: January...February.MarchAprilMayJune
JulyAugustSeptember. . .OctoberNovember 3..
Separation rates
Total
5.04.04.43.84.1
3.63.44.44.13.1
3.43.96.57.36.8
8.36.14.84.64.3
3.54.44.14.33.5
3.33.53.5
3.63.63.53.43.73.4
3.23.94.43.53.32.8
3.33.03.33.33.43.0
3.14.04.44.03.9
Quit i
1.6. 9.7. 9.9
.91.11.3
.6
. 8
.92.03.85.25.1
5.14.33.42.81.5
1.92.42.32.31.1
1.61.61.4
1.41.31.41.51.61.6
1.52.22.61.71.31.0
1.31.21.31.31.41.3
1.41.92.21.3
. 9
Layoff
3.02.93.52.73.0
2.52.13.03.42.2
2.21.31.1
.6
. 6
2.31.21.01.32.4
1.11.21.11.31.9
1.21.51.6
1.71.81.61.41.61.3
1.21.21.41.31.51.4
1.51.41.41.51.51.1
1.31.61.82.32.6
Discharge,military,and mis-
cellaneous l
0.4. 2. 2. 2. 2
. 2
. 2
. 2
. 1
. 1
. 3
.71.71.51.1
.9
.6
. 5
. 5
. 3
. 5
. 8
.6
.7
.4
. 5
. 5
. 4
. 5
. 5
. 5
. 5
. 5
. 5
.4
. 5
. 5
. 5
. 5
.4
. 5
.4
.4
.4
.6
.4
.4
.6
.4
. 4
. 4
Accessionrates
3.13.13.35.44.7
4.24.43.63.84.1
4.45.47.67.56.1
6.36.75.14.43.5
4.44.44.43.93.0
3.73.43.0
3.33.13.13.33.44.2
3.33.84.14.23.02.3
3.22.82.82.83.03.9
3.23.23.32.92.1
1 Prior to 1940, military and miscellaneous separations are included with quits.2 Based on data through November.3 Preliminary.
NOTE.—Detail will not necessarily add to totals because of rounding.
Source: Department of Labor.
147
Digitized for FRASER http://fraser.stlouisfed.org/ Federal Reserve Bank of St. Louis
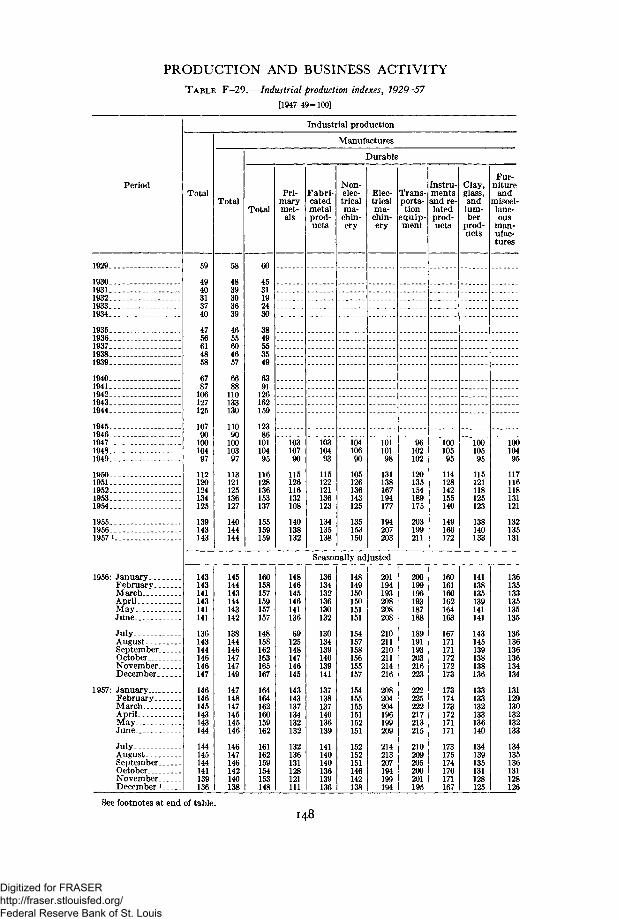
PRODUCTION AND BUSINESS ACTIVITYTABLE F-29.—Industrial production indexes, 1929—57
[1947-49=100]
Period
Industrial production
Total
Manufactures
Total
Durable
Total
Pri-marymet-als
Fabri-catedmetalprod-ucts
Non-elec-tricalma-
chin-ery
Elec-tricalma-
chin-ery
Trans-porta-tion
equip-ment
Instru-mentsand re-1latedprod-ucts
Clay,glass,andlum-ber
prod-ucts
Fur-niture
andmiscel-lane-ous
man-ufac-tures
1929
19301931193219331934
19351936193719381939
19401941194219431944
19451946194719481949
19501951195219531954
195519561957
1956: January. .February.MarchAprilMayJune
JulyAugustSeptemberOctoberNovemberDecember
1957: January....February-MarchAprilMayJune
JulyAugustSeptemberOctoberNovemberDecember i
59
4940313740
4756614858
6787
106127125
10790
10010497
112120124134125
139143H3
143143141143141141
136143144146146147
146146145143143144
144145144141139136
110133130
1109010010397
113121125136127
140144144
4531192430
3849553549
6391126162159
1238610110495
116128136153137
155159159
10310790
115126116132108
140138132
10310493
115122121136123
134135138
10410690
105126136143125
135153150
101101
131138167194177
194207203
96102102
120135154
203199211
10010595
114128142155140
149166172
Seasonally adjusted
10010595
115121118125123
138140133
145144143144143142
138144146147147149
147148147145145146
146147146142140138
160158157159157157
148158162163165167
164164162160159162
161162159154153148
148146145146141136
69125148147146145
143143137134132132
132136131128121111
136134132136130132
130134139140139141
137138137140136139
141140140136139136
148149150150151151
154157158156155157
154155155151152151
152152151146142138
201194193208208208
210211210211214216
208204204196199209
214213207194199194
200199196193187188
189191193203216223
222225222217213215
210209205200201195
160161160162164163
167171171172172173
173174173172171171
173175174170171167
141138135139141141
143145139138138136
133133132133136140
134139135131128125
10010495
117116118131121
132135131
136135133135135135
136136136136134134
131129130132132133
134135136131128126
See footnotes at end of table.I48
Digitized for FRASER http://fraser.stlouisfed.org/ Federal Reserve Bank of St. Louis
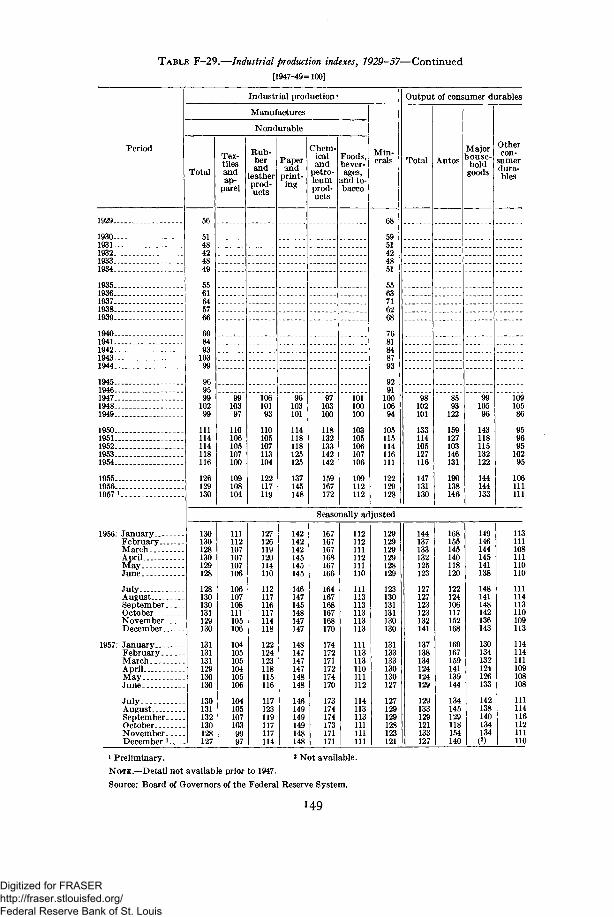
TABLE F-29.—Industrial production indexes, 1929-57—Continued
[1947-49=100]
Period
1929
19301931—193219331934-
19351936—_ .19371938 .1939 .
1940. -194119421943—1944
194519461947 ..19481949
19501951 — -19521953.1954
195519561957 J
1956: JanuaryFebruaryMarchAprilMayJune
JulyAugustSeptemberOctoberNovemberDecember
1957: JanuaryFebruaryMarchAprilMavJune .- .
JulyAugustSeptemberOctoberNovemberDecember l
Industrial production •
Manufactures
Nondurable
Total
56
5148424849
5561645766
69849310399
96959910299
111114114118116
126129130
Tex-tilesandap-parel
9910397
110106105107100
109108104
Rub-berand
leatherprod-ucts
10610193
110105107113104
122117119
Paperandprint-ing
96103101
114118118125125
137145148
Chem-icalandpetro-leumprod-ucts
97103100
118132133142142
159167172
Foods,bever-ages,
and to-bacco
101100100
103105106107106
109112112
Min-erals
68
5951424851
5563716268
7681848793
929110010694
105115114116111
122129128
Output of consumer durables
Total
98102101
133114105127116
147131130
Autos
8593122
159127103146131
190138146
Majorlouse-holdgoods
9910596
143118115132122
144144133
Othercon-sumerdura-bles
10910586
95969510295
106111111
Seasonally adjusted
130130128130129128
128130130131129130
131131131129130130
130131132130128127
111112107107107106
106107108111105106
104105105104105106
1041051071039997
127126119120114110
112117116117114118
122124123118115116
117123119117117114
142142142145145145
146147145148147147
148147147147148148
146149149149148148
167167167168167166
164167168167168170
174172171172174170
173174174173171171
112112111112111110
111113113113113113
111113113110111112
114113113111111111
129129129129128129
123130131131130130
131133133130130127
127129129128123121
144137133132125123
127127123123132141
137138134124124129
129133129121133127
168155145140118120
122124106117152168
169167159141139144
134145129118154140
149146144145141138
148141148142136143
130134132124126133
142138140134134
113111108111110110
111114113110109113
114114111109108108
111114116112111110
1 Preliminary. 2 Not available.
NOTE.—Detail not available prior to 1947.
Source: Board of Governors of the Federal Reserve System.
149
Digitized for FRASER http://fraser.stlouisfed.org/ Federal Reserve Bank of St. Louis
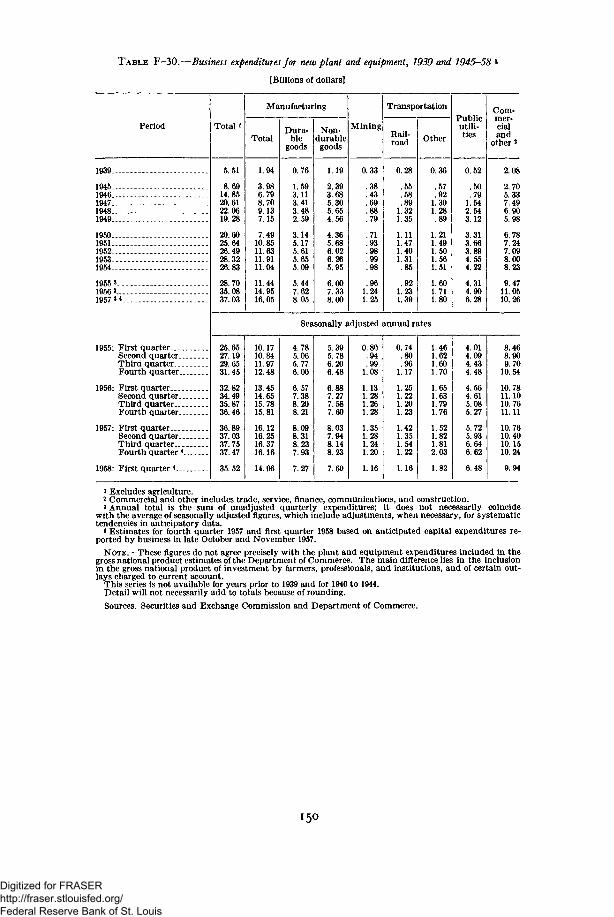
TABLE F-30.—Business expenditures for new plant and equipment, 1939 and 1945-58
[Billions of dollars]
Period
1939
1945194619471948 -- - -1949 .
1950 - - . . -1951195219531954
1955 3
195631957 3 4
1955: First quarterSecond quarterThird quarterFourth quarter.
1956: First quarterSecond quarterThird quarterFourth quarter
1957: First quarterSecond quarter.Third quarterFourth quarter 4
1958: First quarter *
Total i
5.51
8.6914.8520.6122.0619.28
20.6025.6426.4928.3226.83
28.7035.0837.03
Manufacturing
Total
1.94
3.986.798.709.137.15
7.4910.8511.6311.9111.04
11.4414.9516.05
Dura-ble
goods
0.76
1.593.113.413.482.59
3.145.175.615.655.09
5.447.628.05
Non-durablegoods
1.19
2.393.685.305.654.56
4.365.686.026.265.95
6.007.338.00
Mining
0.33
.38
.43
.69
.88
.79
.71
.93
.98
.99
.98
.961.241.25
Transportation
Rail-road
0.28
.55
.58
.891.321.35
1.111.471.401.31.85
.921.231.39
Other
0.36
.57
.921.301.28.89
1.211.491.501.561.51
1.601.711.80
Publicutili-ties
0.52
.50
.791.542.543.12
3.313.663.894.554.22
4.314.906.28
Com-mer-cialand
other 2
2.08
2.705.337.496.905.98
6.787.247.098.008.23
9.4711.0510,26
Seasonally adjusted annual rates
25.6527.1929.6531.45
32.8234.4935.8736.46
36.8937.0337.7537.47
35.52
10.1710.8411.9712.48
13.4514.6515.7815.81
16.1216.2516.3716.16
14.96
4.785.065.776.00
6.577.388.208.21
8.098.318.237.93
7.27
5.395.786.206.48
6.887.277.587.60
8.037.948.148.23
7.69
0.80.94.99
1.08
1.131.281.261.28
1.351.281.241.20
1.16
0.74.80.96
1.17
1.251.221.201.23
1.421.351.541.22
1.16
1.461.621.601.70
1.651.631.791.76
1.521.821.812.03
1.82
4.014.094.434.48
4.564.615.085.27
5.725.936.646.62
6.48
8.468.909.70
10.54
10.7811.1010.7611.11
10.7610.4010.1510.24
9.94
1 Excludes agriculture.2 Commercial and other includes trade, service, finance, communications, and construction.3 Annual total is the sum of unadjusted quarterly expenditures; it does not necessarily coincide
with the average of seasonally adjusted figures, which include adjustments, when necessary, for systematictendencies in anticipatory data.
* Estimates for fourth quarter 1957 and first quarter 1958 based on anticipated capital expenditures re-ported by business in late October and November 1957.
NOTE.—These figures do not agree precisely with the plant and equipment expenditures included in thegross national product estimates of the Department of Commerce. The main difference lies in the inclusionin the gross national product of investment by farmers, professionals, and institutions, and of certain out-lays charged to current account.
This series is not available for years prior to 1939 and for 1940 to 1944.Detail will not necessarily add to totals because of rounding.Sources: Securities and Exchange Commission and Department of Commerce.
I5O
Digitized for FRASER http://fraser.stlouisfed.org/ Federal Reserve Bank of St. Louis
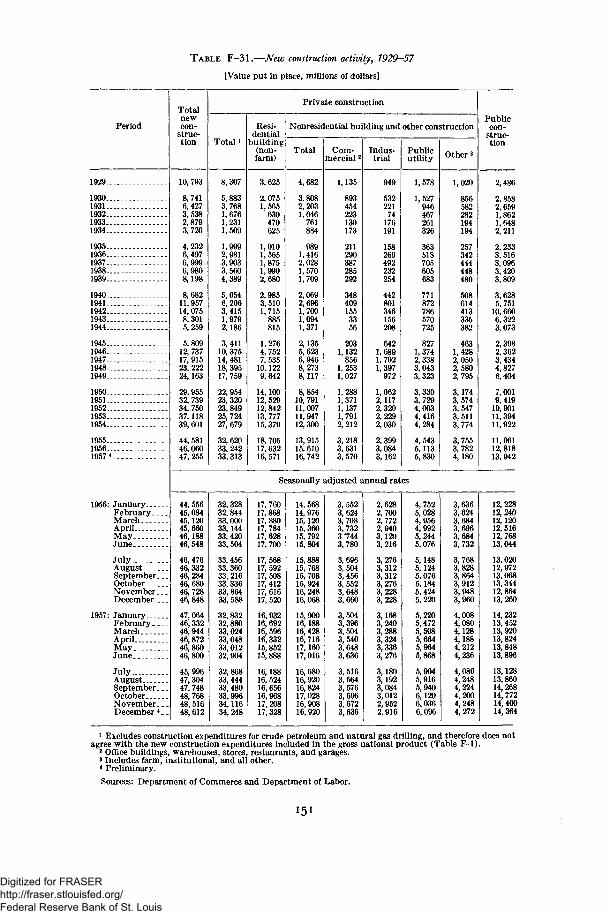
TABLE F-31.—New construction activity, 1929-57
[Value put in place, millions of dollars]
Period
1929..
1930..1931-1932-1933..1934..
1935-1936-1937-1938-1939-
1940-1941-1942..1943-1944-
1945..1946-1947-1948..1949-
1950..1951-1952..1953..1954..
1955..1956-1957*
1956: JanuaryFebruary. . .MarchAprilMayJune
JulyAugustSeptember.OctoberNovember..December-
1957: JanuaryFebruary. _MarchAprilMayJune
JulyAugustSeptember.OctoberNovember.December 4
Totalnewcon-
struc-tion
10, 793
8,7416,4273, 5382,8793,720
4,2326,4976,9996,9808,198
8,68211,95714, 0758,3015, 259
5,80912, 73717, 91523,22224,163
29,95532, 73934, 75037,11839,601
44, 58146,06047, 255
Private construction
Total i
Resi-dential
building(non-farm)
44, 55645,08445,12045,66046,18846, 548
46, 47646,33246,28446,68046, 72846, 848
47,06446,33246,94446, 87246,86046,800
45, 99647, 30447, 74848, 76848, 51648, 612
8,307
5, 8833,7681,6761,2311,509
1,9992,9813,9033,5604,389
5,0546,2063,4151,9792,186
3,41110, 37514, 48118, 39517, 759
22, 95423,32023,84925, 72427, 679
32,62033, 24233, 313
3, 625
2,0751,565630470625
1,0101,5651,8751,9902,680
2,9853,5101,715885815
1,2764,7527,53510.1229,642
14,10012,52912, 84213, 77715, 379
18, 70517,63216, 571
Nonresidential building and other construction
Total Com-mercial 2
4,682
3.8082,2031,046761884
1,4162,0281,5701,709
2,0692,6961,7001,0941,371
2,1355,6236,9468,2738,117
8,85410, 79111,00711,94712,300
13, 91515, 61016, 742
1,135
454223130173
211290387285292
3484091553356
2031,132856,2531,027
,371,137,7912,212
3,2183,6313,570
Indus-trial
949
53222174176191
158266492232254
442801346156208
6421,6891,7021,397
972
1,0622,1172,3202,2292,030
2,3993,0843,162
Publicutility
1,578
1,527946467261
363518705605683
771872786570725
8271,3742,3383,0433,323
3,3303,7294,0034,4164,284
4,5435,1135,830
Other 3
1,020
856582282194194
257342444448480
508614413335382
4631,4282,0502,5802,795
3,1743,5743,5473,5113,774
3,7553,7824,180
Seasonally adjusted annual rates
Publiccon-
struc-tion
32,32832,84433,00033,14433,42033, 504
33, 45633,36033, 21633, 33633,86433, 588
32,83232, 88033,02433, 04833, 01232,904
32,86833,44433, 48033, 99634,11634, 248
17,76017,86817,88017, 78417, 62817,700
17,56817, 59217, 50817, 41217, 61617,520
16,93216, 69216,59616,33215,85215,888
16,18816, 52416,65616,96817,20817, 328
14,56814, 97615,12015,36015, 79215, 804
15,88815, 76815, 70815, 92416, 24816, 068
15,90016,18816, 42816, 71617.16017,016
16, 68016,92016,82417,02816,90816,920
3,5523,6243,7083,7323 7443,780
3, 6963,5043,4563,5523,6483,660
3,5043,3963,5043,5403,6483,636
3.5163,5643,5763,6963,6723,636
2,6282,7002,7722,9403,1203,216
3,2763,3123,3123,2763,2283,228
3,1683,2403,2883,3243,3363,276
3,1803,1923,0843,0122,9522,916
4,7525,0284,9564,9925,2445,076
5,1485,1245,0765,1845,4245,220
5,2205,4725,5085,6645,9645,868
5,9045,9165,9406,1206,0366,096
3,6363,6243,6843,6963,6843,732
3,7683,8283,8643,9123,9483,960
4,0084,0804,1284,1884,2124,236
4,0804,2484,2244,2004,2484,272
2,486
2,8582, 6591,8621,6482,211
2,2333, 5163,0963,4203,809
3,6285, 75110,6606,3223,073
2,3982,3623,4344,8276,404
7,0019,41910,90111,39411,922
11, 96112, 81813, 942
12,22812,24012,12012, 51612,76813,044
13,02012, 97213,06813, 34412,86413,260
14,23213,45213, 92013,82413,84813,896
13,12813,86014, 26814, 77214,40014,364
1 Excludes construction expenditures for crude petroleum and natural gas drilling, and therefore does notagree with the new construction expenditures included in the gross national product (Table F- l ) .
2 Office buildings, warehouses, stores, restaurants, and garages.3 Includes farm, institutional, and all other.4 Preliminary.
Sources: Department of Commerce and Department of Labor.
Digitized for FRASER http://fraser.stlouisfed.org/ Federal Reserve Bank of St. Louis
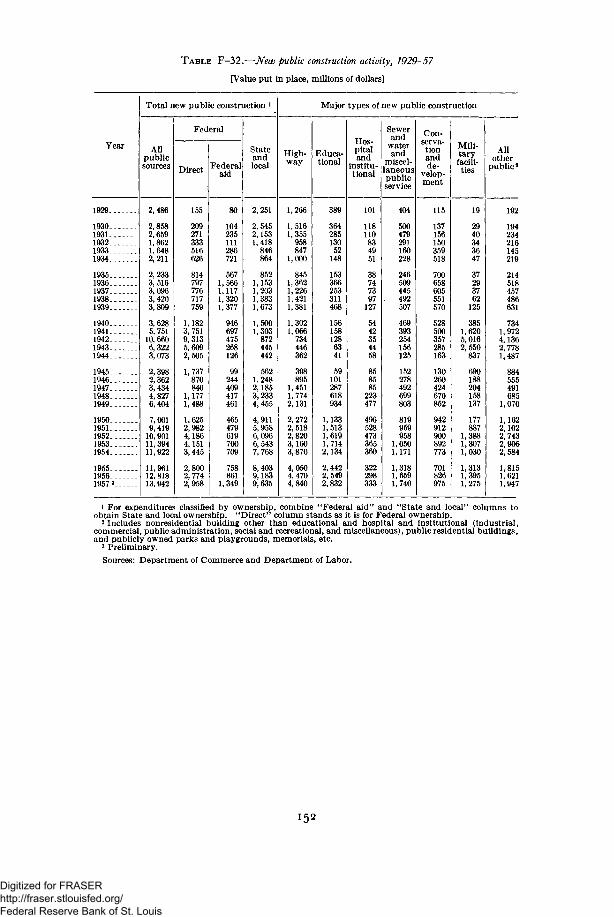
TABLE F-32.—New public construction activity, 1929-57
[Value put in place, millions of dollars]
Year
1929
19301931193219331934
19351936193719381939
19401941194219431944
19451946194719481949
19501951195219531954
195519561957 3
Total new public construction i
Allpublicsources
2,486
2,8582,6591,8621,6482,211
2,2333,5163,0963,4203,809
3,6285,751
10,6606,3223,073
2,3982,3623,4344,8276,404
7,0019,41910,90111,39411,922
11,96112, 81813, 942
Federal
Direct
155
209271333516
814797776717759
1,1823,7519,3135,6092,505
1,737870840
1,1771,488
1,6252,9824,1864,1513,445
2,8002,7742,958
Federalaid
80
104235111286721
5671,5661.1171,3201,377
946697475268126
244409417461
465479619700709
758861
1,349
Stateandlocal
2,251
2,5452,1531,418846864
8521,1531,2031,3831,673
1,5001,303872445442
5621,2482,1853,2334,455
4,9115,9586,0966,5437,768
8,4039,1839,635
Major types of new public construction
High-way
1,266
1,5161,355
958847
1,000
845,362,226,421,381
,302,066734446362
398895
1,4511,7742,131
2,2722,5182,8203,1603,870
4,0504,4704,840
Educa-tional
389
36428513052148
153366253311468
1561581286341
59101287618
1,1331,5131,6191,7142,134
2,4422,5492,832
Hos-pitaland
institu-tional
101
118110834951
38747397
127
5442354458
858585
223477
496528473365360
322298333
Sewerand
waterand
miscel-laneouspublicservice
404
500479291160228
246509445492507
469393254156125
152278492699803
819959958
1,0501,171
1,3181,6591,740
Con-serva-tionandde-
velop-ment
137156150359518
700658605551570
528500357285163
130260424670852
942912900892773
701826975
Mili-taryfacili-ties
19
2940343647
37293762
125
3851,6205,0162,550
837
188204158137
177887
1,3881,3071,030
1,3131,3951,275
Allother
publica
192
194234216145219
214518457486631
7341,9724,1362,7781,487
884555491685
1,070
1,1622,1022,7432,9062,584
1,8151,6211,947
1 For expenditures classified by ownership, combine "Federal aid" and "State and local" columns toobtain State and local ownership. "Direct" column stands as it is for Federal ownership.
2 Includes nonresidential building other than educational and hospital and institutional (industrial,commercial, public administration, social and recreational, and miscellaneous), public residential buildings,and publicly owned parks and playgrounds, memorials, etc.
3 Preliminary.
Sources: Department of Commerce and Department of Labor.
Digitized for FRASER http://fraser.stlouisfed.org/ Federal Reserve Bank of St. Louis
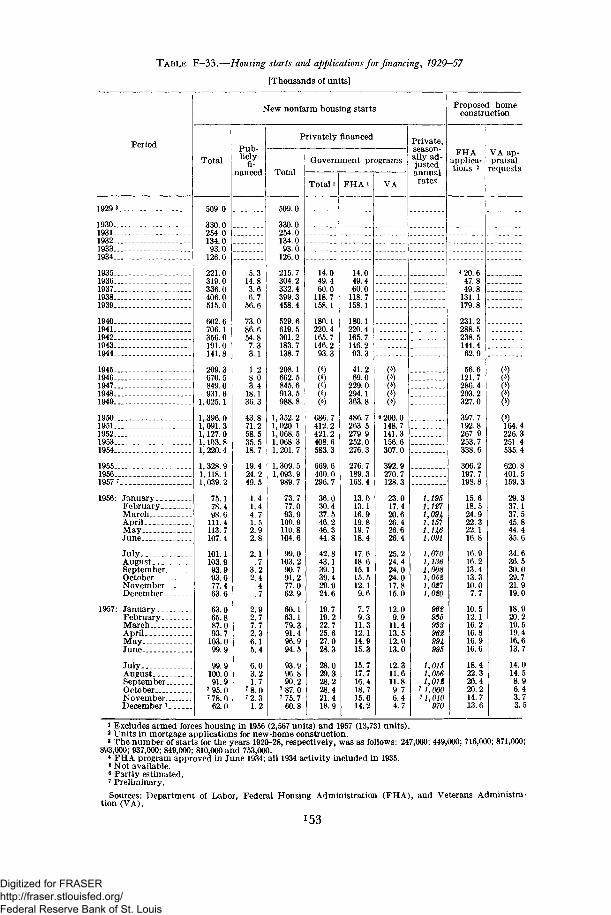
TABLE F-33.—Housing starts and applications for financing, 1929-57
[Thousands of units]
Period
New nonfarm housing starts
TotalPub-licly
fi-nanced
Privately financed
Total
Government programs
Total i F H A i VA
Private,season-ally ad-justedannualrates
Proposed homeconstruction
FHAapplica-tions 2
VA ap-praisal
requests
1929 3. 509.0 509.0
19301931193219331934
330.0254.0134.093.0
126.0
221.0319.0336.0406.0515.0
602.6706.1356. 0191.0141.8
209.3670.5849.0931.6
1, 025.1
1, 396.01, 091. 31,127. 01,103. 81,220. 4
1, 328.91,118.11,039.2
75.178.498.6
111.4113.7107. 4
101.1103.993.993.677.463.6
63.065.887.093.7
103.0
99.9100.091.9
7 95.07 78.0
62.0
330.0254.0134.093.0
126.0
215.7304.2332.4399.3458.4
529. 6619.5301.2183.7138.7
208.1662.5845.6913. 5
1935..1936..1937..1938..1939..
1940..1941..1942..1943..1944..
1945..-1946.—1947..-1948.—1949.—
1950..1951..1952..1953..1954..
1955..1956..1957 7
1956: JanuaryFebruaryMarchAprilMayJune
JulyAugustSeptember..OctoberNovember..December..
1957: January __February.MarchAprilMayJune
JulyAugustSeptember. _OctoberNovember..December 7_
5.314.83.66.7
56.6
73.086.654.87.33.1
1.28.03.4
18.136.3
43.871.258.535.518.7
19.424.249.5
1.41.44.71.52.92.8
2.1.7
3.22.4.4.7
2.92.77.72.36.15.4
6.03.21.7
7 8.07 2.3
1.2
1, 352. 21, 020.11,068. 51,068. 31, 201. 7
1,309. 51, 093. 9
989.7
73.777.093.9
109.9110.8104.6
99.0103.290.791.277.062.9
60.163.179.391.496.994.5
93.996.890.2
7 87.07 75.7
60.8
14.049.460.0
118.7158.1
180.1220.4165.7146.293.3
686.7412.2421.2408.6583.3
669.6460. 0296.7
36.030.437.546.246.344.8
42.843.139.139.429.924.6
19.719.222.725.627.028.3
28.029.328.228.421.418.9
14.049.460.0
118.7158.1
180.1220.4165.7146.293.3
41.269.0
229.0294.1363.8
486.7263.5279.9252.0276.3
276.7189.3168.4
13.013.116.919.819.718.4
17.618.615.115.512.19.6
7.79.3
11.312.114.915.3
15.717.716.418.715.014.2
()0)()
6 200. 0148.7141.3156.6307.0
392.9270.7128.3
23.017.420.626.426.626.4
25.224.424.024.017.815.0
12.09.9
11.413.512.013.0
12.311.611.89.76.44.7
1,1951,1271,09 k1,1571,1461,091
1,0701,1361,0081,0521,0271,020
935933962994995
1,0151,0561,012
7 1,00011,010
970
* 20. 647.849.8
131.1179.8
231.2288.5238.5144.462.9
56.6121.7286.4293.2327.0
397.7192.8267.9253.7338.6
306.2197.7198.8
15.618.524.922.322.116.8
16.916.213. 413.310.07.7
10. 512.116.216.816.916.6
18.422.320.420.214.713.6
()164.4226.3251.4535.4
620.8401.5159.3
29.337.137.545.844.435.6
34.636.530.029.721.919.0
18.920.219.519.416.613.7
14.014.58.96.43.73.5
1 Excludes armed forces housing in 1956 (2,567 units) and 1957 (13,731 units).2 Units in mortgage applications for new-home construction.» The number of starts for the years 1920-28, respectively, was as follows: 247,000; 449,000; 716,000; 871,000;
893,000; 937,000; 849,000; 810,000 and 753,000.* FHA program approved in June 1934; all 1934 activity included in 1935.8 Not available.6 Partly estimated.7 Preliminary.
Sources: Department of Labor, Federal Housing Administration (FHA), and Veterans Administra-tion (VA).
153
Digitized for FRASER http://fraser.stlouisfed.org/ Federal Reserve Bank of St. Louis
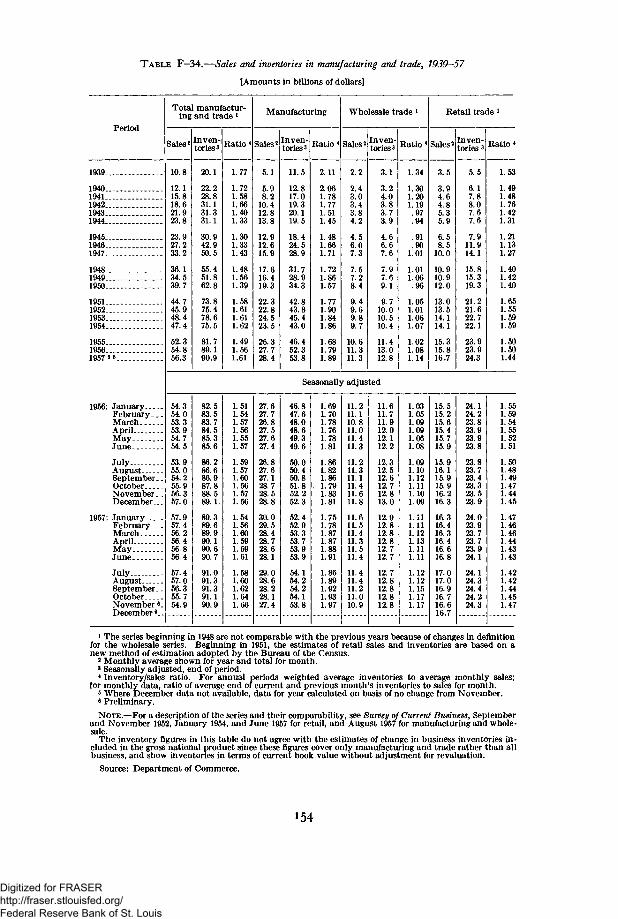
TABLE F-34.—Sales and inventories in manufacturing and trade, 1939-57
[Amounts in billions of dollars]
Period
Sales 2
1939....
1940...1941....1942....1943....1944....
1945....1946....1947....
1948—1949—1950—
1951...1952...1953...1954...
1955—1956—1957 * •
1956: JanuaryFebruary. _.MarchAprilM a y . . . . —June
JulyAugustSeptember.OctoberNovember..December...
1957: JanuaryFebruary. _.MarchAprilMayJune
JulyAugustSeptember.OctoberNovember6
December6.
Total manufactur-ing and trade l
10.8
12.115.818.621.923.8
23.927.233.2
36.134.539.7
44.745.948.447.4
52.354.856.3
Inven-tories 3
20.1
22.228.831.131.331.1
30.942.950.5
55.451.862.8
73.875.478.675.5
81.789.190.9
Ratio
1.77
.72
.58
.66
.40
.33
.30
.33
.43
.48
.56
.39
,58.61.61.62
.49
.56
.61
Sales 2
Manufacturing
Inven-tories 3
5.1
5.98.2
10.412.813.8
12.912.615.9
17.616.419.3
22.322.824.523.5
26.327.728.4
11.5
12.817.019.320.119.5
18.424.528.9
31.728.934.3
42.843.845.443.0
46.452.353.8
Ratio •
2.11
2.061.781.771.511.45
1.481.661.71
1.721.861.57
1.771.901.841.86
1.681.791.89
Wholesale trade l
Sales 2
2.2
2.43.03.43.84.2
4.56.07.3
7.57.28.4
9.7
10.611.311.3
Inven-tories 3
3.1
3.24.03.83.73.9
4.66.67.6
7.97.69.1
9.710.010.510.4
11.413.012.8
Ratio *
1.34
1.301.201.19.97.94
.91
.901.01
1.011.06.96
1.051.011.061.07
1.021.081.14
Retail trade 1
Inven-tories 3
3.5
3.94.64.85.35.9
6.58.5
10.0
10.910.912.0
13.013.514.114.1
15.315.816.7
5.5
6.17.88.07.67.6
7.911.914.1
15.815.319.3
21.221.622.722.1
23.923.924.3
Ratio *
Seasonally adjusted
54.354.053.353.954.754.5
53.955.054.255.956.357.0
57.957.456.256.456.856.4
57.457.056.355.754.9
82.583.583.784.585.385.6
86.286.686.987.888.589.1
89.389.689.990.190.690.7
91.091.391.391.190.9
] .511.541.571.561.551.57
L. 59.57.60
L. 56L. 57L. 56
L. 54L. 56L. 60L.591.59L. 61
L. 58L601.62L.64L.66
27.627.726.827.527.627.4
26.827.627.128.728.528.8
30.029.528.428.728.628.1
29.028.628.228.127.4
46.847.648.048.649.349.6
50.050.450.851.852.252.3
52.452.953.353.753.953.9
54.154.254.254.153.8
1.691.701.781.761.781.81
1.861.821.86
. 1.791.831.81
1.751.781.871.871.881.91
1.861.891.921.931.97
11.211.110.811.011.411.3
11.211.311.111.411.611.8
11.611.511.411.311.511.4
11.411.411.211.010.9
11.611.711.912.012.112.2
12.312.512.612.712.813.0
12.912.812.812.812.712.7
12.712.812.812.812.8
1.031.051.091.091.061.08
1.091.101.121.111.101.09
1.111.111.121.131.111.11
1.121.121.151.171.17
15.515.215.615.415.715.9
15.916.115.915.916.216.3
16.316.416.316.416.616.8
17.017.016.916.716.616.7
24.124.223.823.923.923.8
23.823.723.423.323.523.9
24.023.923.723.723.924.1
24.124.324.424.224.3
1.53
1.491.481.761.421.31
1.211.131.27
1.401.421.40
1.651.551.591.59
1.501.501.44
1.551.591.541.551.521.51
1.501.481.491.471.441.45
1.471.461.461.441.431.43
1.421.421.44L451.47
1 The series beginning in 1948 are not comparable with the previous years because of changes in definitionfor the wholesale series. Beginning in 1951, the estimates of retail sales and inventories are based on anew method of estimation adopted by the Bureau of the Census.
2 Monthly average shown for year and total for month.3 Seasonally adjusted, end of period.4 Inventory/sales ratio. For annual periods weighted average inventories to average monthly sales;
for monthly data, ratio of average end of current and previous month's inventories to sales for month.fi Where December data not available, data for year calculated on basis of no change from November.6 Preliminary.
NOTE.—For a description of the series and their comparability, see Survey of Current. Business, Septemberand November 1952, January 1954, and June 1957 for retail, and August 1957 for manufacturing and whole-sale.
The inventory figures in this table do not agree with the estimates of change in business inventories in-cluded in the gross national product since these figures cover only manufacturing and trade rather than allbusiness, and show inventories in terms of current book value without adjustment for revaluation.
Source: Department of Commerce.
154
Digitized for FRASER http://fraser.stlouisfed.org/ Federal Reserve Bank of St. Louis
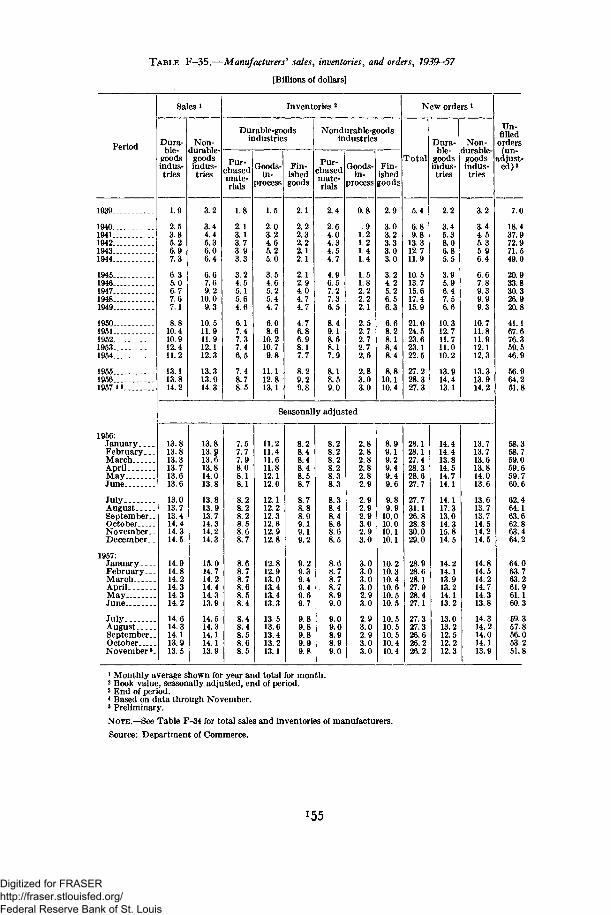
TABLE F-35.—Manufacturers* sales, inventories, and orders, 1939—57
[Billions of dollars]
Period Dura-ble-
goodsindus-tries
Non-durable-
goodsindus-tries
Pur-chasedmate- jrials
Inventories2
Durable-goodsindustries
Goods-in-
process
Fin-ishedgoods
Nondurable-goodsindustries
Pur-chasedmate-rials
Goods-in-
process
Fin-ishedgoods
Total
New orders *
Dura-ble-
goodsindus-tries
Non-durable
goodsindus-tries
Un-filledorders(un-
adjust-ed) 3
1940—1941....1942....1943—.1944....
1945...1946...1947—1948—1949—
1950—1951—1952...1953...1954...
1955...1956...1957 * *.
1956:JanuaryFebruary . . .MarchAprilMayJune
JulyAugustSeptember..OctoberNovember.December. .
1957:JanuaryFebruary . .MarchAprilMayJune
JulyAugustSeptember.OctoberNovember5
1.9
2.53.85.26.97.3
6.35.06.77.67.1
8.810.410.912.411.2
13.113.814.2
3.2
3.44.45.36.06.4
6.67.69.2
10.09.3
10.511.911.912.112.3
13.313.914.3
1.8
2.13.13.73.93.3
3.24.55.15.64.6
6.17.47.37.46.5
7.48.78.5
1.5
2.03.24.65.25.0
3.54.65.25.44.7
6.08.6
10.210.79.8
11.112.813.1
2.1
2.22.32.22.12.1
2.12.94.04.74.7
4.76.86.98.17.7
8.29.2
2.4
2.64.04.34.54.7
4.96.57.27.36.5
8.49.18.68.17.9
8.18.59.0
0.8
1.21.21.41.4
1.51.82.22.22.1
2.52.72.72.72.6
2.83.03.0
2.9
3.03.23.33.03.0
3.24.25.26.56.3
6.68.28.18.48.4
8.810.110.4
5.4
6.89.8
13.312.711.9
10.513.715.617.415.9
21.024.523.623.122.5
27.228.327.3
2.2
3.45.38.06.85.5
3.95.96.47.56.6
10.312.711.711.010.2
13.914.413.1
Seasonally adjusted
13.813.813.313.713.613.6
13.013.713.414.414.314.5
14.914.814.214.314.314.2
14.614.314.113.913.5
13.813.913.613.814.013.8
13.813.913.714.314.214.3
15.014.714.214.414.313.9
14.514.314.114.113.9
7.57.77.98.08.18.1
8.28.28.28.58.68.7
8.68.78.78.68.58.4
8.48.48.58.68.5
11.211.411.611.812.112.0
12.112.212.312.612.912.8
12.812.913.013.413.413.3
13.513.613.413.213.1
8.28.48.48.48.58.7
8.78.88.99.19.19.2
9.29.39.49.49.69.7
9.89.89.89.99.8
8.28.28.28.28.38.3
8.38.48.48.68.68.5
8.68.78.78.78.99.0
9.09.08.98.99.0
2.82.82.82.82.82.9
2.92.92.93.02.93.0
3.03.03.03.02.93.0
2.93.02.93.03.0
8.99.19.29.49.49.6
9.89.9
10.010.010.110.1
10.210.310.410.610.510.5
10.510.510.510.410.4
28.128.127.428.328.627.7
27.731.126.828.830.029.0
28.928.628.127.928.427.1
27.327.326.626.226.2
14.414.413.814.514.714.1
14.117.313.014.315.814.5
14.214.113.913.214.113.2
13.013.212.512.212.3
3.2
3.44.55.35.96.4
6.67.89.39.99.3
10.711.811.912.112.3
13.313.914.2
13.713.713.613.814.013.6
13.613.713.714.514.214.5
14.814.514.214.714.313.8
14.314.214.014.113.9
7.0
18.437.972.971.549.0
20.933.830.326.920.8
41.167.676.359.546.9
56.964.251.8
58.358.759.059.659.760.6
62.464.163.662.863.464.2
64.063.763.261.961.160.3
59.357.856.053.251.8
1 Monthly average shown for year and total for month.2 Book value, seasonally adjusted, end of period.3 End of period.* Based on data through November.5 Preliminary.
NOTE.—See Table F-34 for total sales and inventories of manufacturers.
Source: Department of Commerce.
155
Digitized for FRASER http://fraser.stlouisfed.org/ Federal Reserve Bank of St. Louis
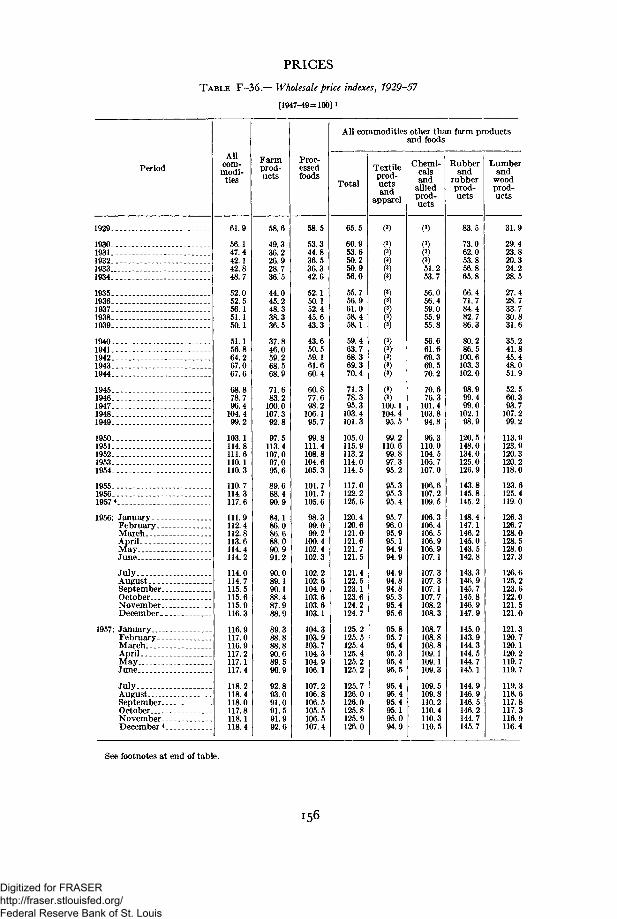
PRICESTABLE F-36.— Wholesale price indexes, 1929-57
[1947-49=100] i
Period
1929
19301931 . .193219331934 .
19351936193719381939 . .
19401941194219431944 . _ _ - . _
1945 .1946194719481949
195019511952 -19531954
195519561957*
1956: J a n u a r yFebruary _.MarchAprilMayJuneJulyAugust __ -SeptemberOctober -NovemberDecember
1957: JanuaryFebruary. .March. __AprilMayJune
JulyAugustSeptember _OctoberNovemberDecember 4
Allcom-modi-
ties
61.9
56.147.442.142.848.7
52.052.556.151.150.1
51.156.864.267.067.6
68.878.796.4
104.499.2
103.1114.8111.6110.1110.3
110.7114.3117.6
111.9112.4112.8113 6114.4114.2
114.0114.7115.5115.6115.9116.3
116.9117.0116.9117 2117.1117.4
118.2118.4118.0117 8118.1118.4
Farmprod-ucts
58.6
49.336.226.928 736.5
44 045.248.338 336.5
37.846.059 268.568.9
71.683.2
100.0107.392 8
97.5113.4107.097 095.6
89.688.490.9
84.186.086.688 090.991.2
90.089.190.188.487.988.9
89.388.888.890 689 590.9
92.893.091.091 591.992.6
Proc-essedfoods
58.5
53.344.836.536.342.6
52.150.152.445.643.3
43.650.559.161.660.4
60.877.698.2
106.195.7
99.8111.4108.8104.6105.3
101.7101.7105.6
98.399.099.2
100.4102.4102.3
102.2102.6104.0103.6103.6103.1
104.3103.9103.7104.3104.9106.1
107.2106.8106.5105.5106.5107.4
All commodities other than farm productsand foods
Total
65.5
60.953.650.250.956.0
55.756.961.058.458.1
59.463.768.369.370.4
71.378.395.3
103.4101.3
105.0115.9113.2114.0114.5
117.0122.2125.6
120.4120.6121.0121.6121.7121.5
121.4122.5123.1123.6124.2124.7
125.2125.5125.4125.4125.2125.2
125.7126.0126.0125.8125.9126.0
Textileprod-uctsand
apparel
w(3)(3)(3)
(3)
(3)
100.1104.495.5
99.2110.699.897.395.2
95.395.395.4
95.796.095.995.194.994.9
94.994.894.895.395.495.6
95.895.795.495.395.495.5
95.495.495.495.195.094.9
Chemi-calsand
alliedprod-ucts
?(3)51.253.7
56.056.459.055.955.8
56.661.669.369.570.2
70.676.3
101.4103.894.8
96.3110.0104.5105.7107.0
106.6107.2109.5
106.3106.4106.5106.9106.9107.1
107.3107.3107.1107.7108.2108.3
108.7108.8108.8109.1109.1109.3
109.5109.8110.2110.4110.3110.5
Rubberand
rubberprod-ucts
83.5
73.062.053.856.865.8
66.471.784.482.786.3
80.286.5
100.6103.3102.0
98.999.499.0
102.198.9
120.5148.0134.0125.0126.9
143.8145.8145.2
148.4147.1146.2145.0143.5142.8
143.3146.9145.7145.8146.9147.9
145.0143.9144.3144.5144.7145.1
144.9146.9146.5146.2144.7145.7
Lumberand
woodprod-ucts
31.9
29.423.820.324.228.5
27.428.733.730.831.6
35.241.845.448.051.9
52.560.393.7
107.299.2
113.9123.9120.3120.2118.0
123.6125.4119.0
126.3126.7128.0128.5128.0127.3
126.6125.2123.6122.0121.5121.0
121.3120.7120.1120.2119.7119.7
119.3118.6117.8117.3116.9116.4
See footnotes at end of table.
i 5 6
Digitized for FRASER http://fraser.stlouisfed.org/ Federal Reserve Bank of St. Louis
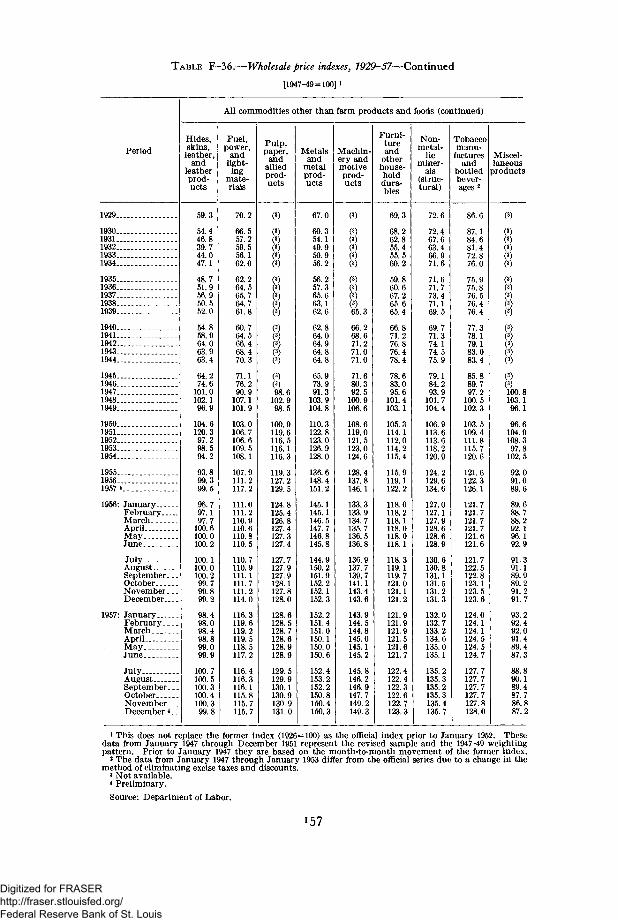
TABLE F-36.—Wholesale price indexes, 1929-57—Continued
[1947-49=100]i
Period
All commodities other than farm products and foods (continued)
Hides,skins,leather,
andleatherprod-ucts
Fuel,power
andlight-
ingmate-rials
Pulp,paper,
andalliedprod-ucts
Metalsand
metalprod-ucts
Machin-ery andmotiveprod-ucts
Furni-tureand
otherhouse-holddura-bles
Non-metal-
licminer-
als(struc-tural)
Tobaccomanu-factures
andbottledbever-
Miscel-laneous
products
1929
19301931193219331934
19351936193719381939
19401941.194219431944
19451946194719481949
19501951195219531954
19551956.1957*
1956: JanuaryFebruary..MarchAprilMayJune
JulyAugustSeptemberOctoberNovember-December.
1957: JanuaryFebruary.MarchAprilMayJune
JulyAugustSeptemberOctoberNovemberDecember
59.3
54.446.839.744.047.1
48.751.956.950.552.0
54.858.964.063.963.4
64.274.6
101.0102.196.9
104.6120.397.298.594.2
93.899.399.5
96.797.197.7100.6100.0100.2
100.1100.0100.299.799.899.2
98.498.098.498.899.099.9
100.7100.5100.3100.4100.3
70.2
66.557.259.556.162.0
62.264.565.764.761.8
60.764.566.468.470.3
71.176.290.9
107.1101.9
103.0106.7106.6109.5108.1
107.9111.2117.2
111.0111.2110.9110.6110.8110.5
110.7110.9111. 1111.7111.2114.0
116.3119.6119.2119.5118.5117.2
116.4116.3116.1115.8115.7115.7
()98.6
102.998.5
100.9119.6116.5116.1116.3
119.3127.2129.5
124.8125.4126.8127.4127.3127.4
127.7127.9127.9128.1127.8128.0
128.6128.5128.7128.6128.9128.9
129.5129.9130.1130.9130.9131.0
67.0
60.354.149.950.956.2
56.257.365.663.162.6
62.864.064.964.864.8
65.973.991.3
103.9104.8
110.3122.8123.0126.9128.0
136.6148.4151.2
145.1145.1146. 5147.7146. 8145.8
144.9150.2151.9152.2152.1152. 3
152.2151.4151.0150.1150.0150.6
152.4153.2152.2150.8150.4150.3
()65.3
66.268.671.271.071.0
71.680.392.5
100.9106.6
108.6119.0121.5123.0124.6
128.4137.8146.1
133.3133.9134.7135. 7136.5136.8
136.9137.7139.7141.1143.4143.6
143.9144.5144.8145.0145.1145.2
145.8146.2146.9147.7149.2149.3
69.3
68.262.855.455.560.2
59.860.667.265.665.4
71.276.876.478.4
78.683.095.6
101.4103.1
105.3114.1112.0114.2115.4
115.9119.1122.2
118.0118.2118.1118.0118.0118.1
118.3119.1119.7121.0121.1121.2
121.9121.9121.9121.5121.6121.7
122.4122.4122.3122.6122.7123.3
72.6
72.467.663.466.971.6
71.671.773.471.169.5
69.771.374.174.575.9
79.184.293.9
101.7104.4
106.9113.6113.6118.2120.9
124.2129.6134.6
127.0127.1127.9128.6128.6128.9
130.6130.8131.1131.5131.2131.3
132.0132.7133.2134.6135.0135.1
135. 2135.3135.2135.3135.4135.7
86.6
87.184.681.472.876.0
75.975.876.576.476.4
77.378.179.183.083.4
85.889.797.2
100.5102.3
103.5109.4111.8115.7120.6
121.6122.3126.1
121.7121.7121.7121.7121.6121.6
121.7122.5122.8123.1123. 5123.6
124.0124.1124.1124.5124.5124.7
127.7127.7127.7127.7127.8128.0
()100.8103.196.1
96.6104.9108.397.8
102.5
92.091.0
89.688.788.292.196.192.9
91.391.189.989.291.291.7
93.292.492.091.489.487.3
88.890.189.487.786.887.2
1 This does not replace the former index (1926=100) as the official index prior to January 1952. Thesedata from January 1947 through December 1951 represent the revised sample and the 1947-49 weightingpattern. Prior to January 1947 they are based on the month-to-month movement of the former index.2 The data from January 1947 through January 1953 differ from the official series due to a change in themethod of eliminating excise taxes and discounts.3 Not available.
* Preliminary.Source: Department of Labor.
'57
Digitized for FRASER http://fraser.stlouisfed.org/ Federal Reserve Bank of St. Louis
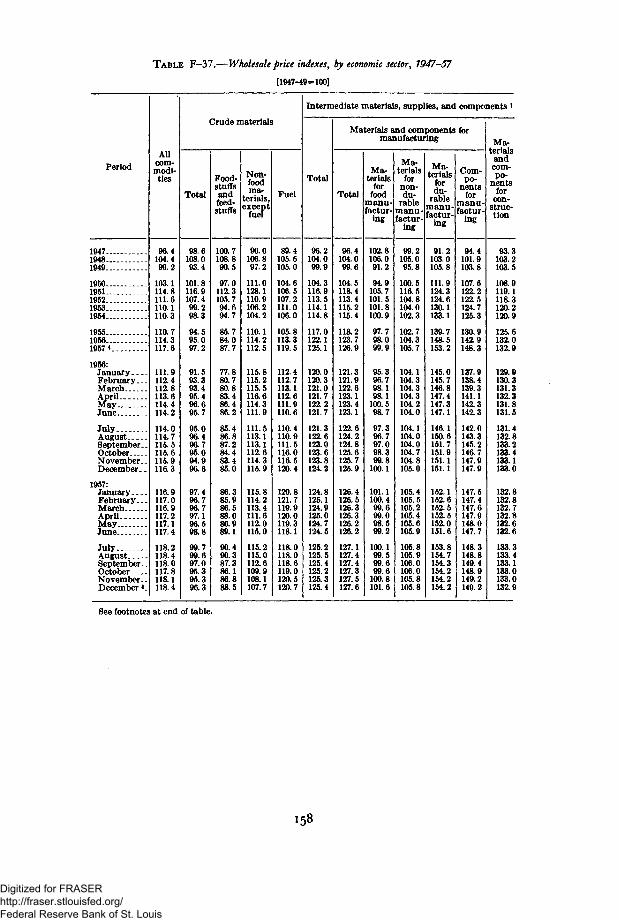
T A B L E F—37.—Wholesale price indexes, by economic sector, 1947—57
[1947-49=100]
PeriodAll
com-modi-ties
Crude materials
Total
98.6108.093.4
101.8116.9107.499.298.3
94.595.097.2
91.593.393.495.496.695.7
95.096.496.795.094.996.6
97.496.796.797.196.598.8
99.799.697.095.395.396.3
Food-stuffsand
faoAieeu-stuffs
100.7108.890.5
97.0112.3105.794.694.7
85.784.087.7
77.880.780.883.486.486.2
85.486.887.284.483.485.0
86.385.986.588.086.989.1
90.490.387.386.186.888.5
Non-foodma-
terials,except
fuel
96.0106.897.2
111.0128.1110.9106.2104.2
110.1114.2112.5
115.8115.2115.5116.6114.3111.9
111.5113.1113.1112.6114.3115.9
115.8114.2113.4111.6112.0115.0
115.2115.0112.6109.9108.1107.7
Fuel
Intermediate materials, supplies, and components *
Total
Materials and components formanufacturing
Total
Ma-terials
forfood
manu-factur-
ing
Ma-terials
fornon-du-
rablemanu-factur-
ing
Ma-terials
fordu-
rablemanu-factur-
ing
Com-po-
nentsfor
manu-factur-
ing
Ma-terials
andcom-po-
nentsfor
con-struc-tion
194719481949
19501951195219531954
1955.—19561957*
1956:January—February..MarchAprilMayJune
JulyAugustSeptember.OctoberNovember-December. .
1957:January - . .February. .MarchAprilMayJune
JulyAugustSeptember.October—.November.December *
96.4104.499.2
103.1114.8111.6110.1110.3
110.7114.3117.6
111.9112.4112.8113.6114.4114.2
114.0114.7115.5115.6115.9116.3
116.9117.0116.9117.2117.1117.4
118.2118.4118.0117.8118.1118,4
89.4105.6105.0
104.6106.5107.2111.0106.0
105.8113.3119.5
112.4112.7113.1112.6111.9110.6
110.4110.9111.5116.0116.5120.4
120.8121.7119.9120.0119.3118.1
118.0118.0118.6119.0120.5120.7
96.2104.099.9
104.3116.9113.5114.1114.8
117.0122.1125.1
120.0120.3121.0121.7122.2121.7
121.3122.6123.0123.6123.8124.2
124.8125.1124.9125.0124.7124.5
125.2125.5125.4125.2125.3125.4
96.4104.0
104.5118.4113.4115.2115.4
118.2123.7126.9
121.3121.9122.6123.1123.4123.1
122.6124.2124.8125.6125.7125.9
126.4126.5126.3126.3126.2126.2
127.1127.4127.4127.3127.5127.6
102.8106.091.2
94.9105.7101.5101.8100.9
97.798.099.9
95.396.798.198.1
100.59a 7
97.396.797.098.399.8
100.1
101.1100.499.699.098.599.2
100.199.599.699.6
100.8101.6
99.2105.095.8
100.5116.5104.8104.0102.3
102.7104.3105.7
104.1104.3104.3104.3104.2104.0
104.1104.0104.0104.7104.8105.0
105.4105.5105.2105.4105.6105.9
105.8105.9106.0106.0105.8105.8
91.2103.0105.8
111.9124.3124.6130.1133.1
139.7148.5153.2
145.0145.7146.8147.4147.3147.1
146.1150.6151.7151.9151.1151.1
152.1152.6152.5152.5152.0151.6
153.8154.7154.3154.2154.2154.2
94.4101.9103.8
107.6122.2122.5124.7125.3
130.9142.9148.3
137.9138.4139.3141.1142.3142.3
142.0143.3145.2146.7147.9147.9
147.5147.4147.6147.9148.0147.7
148.3148.8149.4148.9149.2149.2
93.3103.2103.5
108.9119.1118.3120.2120.9
125.6132.0132.9
129.9130.3131.3132.3131.8131.5
131.4132.8133.2133.4133.1133.0
132.8132.8132.7132.8132.6132.6
133.3133.4133.1133.0133.0132.9
See footnotes at end of table.
158
Digitized for FRASER http://fraser.stlouisfed.org/ Federal Reserve Bank of St. Louis
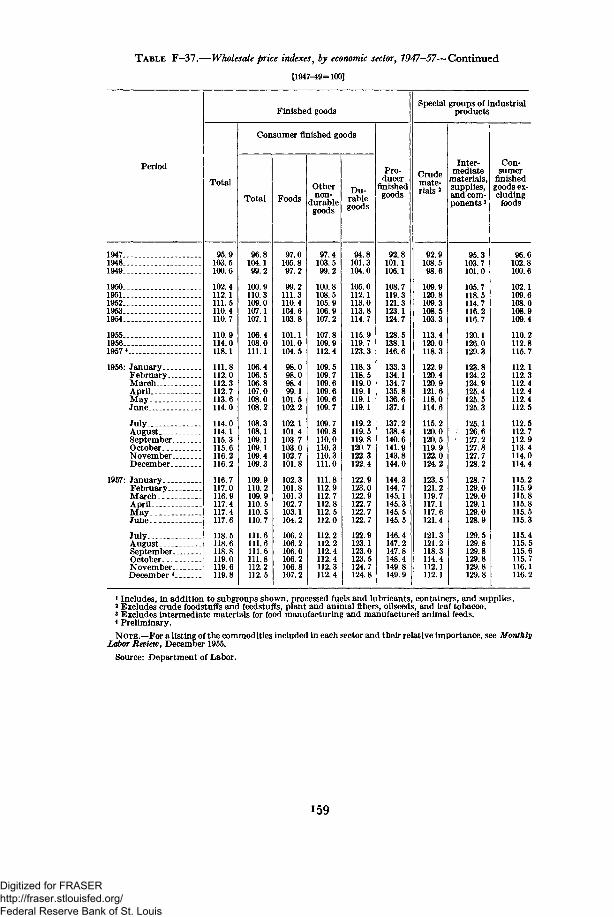
TABLE F-37.— Wholesale price indexes, by economic sector, 1947-57— Continued
[1947-49=100]
Period
Finished goods
Total
Consumer finished goods
Total Foods
Othernon-
durablegoods
Du-rablegoods
Pro-ducer
finishedgoods
Special groups of industrialproducts
Crudemate-rials 2
Inter-mediate
materials,supplies,and com-ponents 3
Con-sumer
finishedgoods ex-cluding
foods
194719481949
19501951195219531954
1955195619574
1956: JanuaryFebruary...MarchAprilMayJune
JulyAugustSeptember.OctoberNovember.December .
1957: JanuaryFebruary. .MarchAprilMayJune
JulyAugustSeptember-OctoberNovember-December 4
95.9103.5100.6
102.4112.1111.5110.4110.7
110.9114.0118.1
111.8112.0112.3112.7113.6114.0
114.0114.1115.3115.6116.2116.2
116.7117.0116.9117.4117.4117.6
118.5118.6118.8119.0119.6119.8
96.8104.199.2
100.9110.3109.0107.1107.1
106.4108.0111.1
106.4106.5106.8107.0108.0108.2
108.3108.1109.1109.1109.4109.3
109.9110.2109.9110.5110.5110.7
111.6111.6111.6111.8112.2112.5
97.0105.897.2
99.2111.3110.4104.6103.8
101.1101.0104.5
98.098.098.499.1
101.5102.2
102.1101.4103.7103.0102.7101.8
102.3101.8101.3102.7103.1104.2
106.2106.2106.0106.2106.8107.2
97.4103.599.2
100.8108.5105.9106.9107.2
107.8109.9112.4
109.5109.7109.6109.6109.6109.7
109.7109.8110.0110.3110.3111.0
111.8112.9112.7112.8112.5112.0
112.2112.2112.4112.4112.3112.4
94.8101.3104.0
105.0112.1113.0113.8114.7
115.9119.7123.3
118.3118.5119.0119.1119.1119.1
119.2119.5119.8120.7122.3122.4
122.9123.0122.9122.7122.7122.7
122.9123.1123.0123.5124.7124.8
92.8101.1106.1
108.7119.3121.3123.1124.7
128.5138.1146.6
133.3134.1134.7135.8136.6137.1
137.2138.4140.6141.9143.8144.0
144.3144.7145.1145.3145.5145.5
146.4147.2147.8148.4149.8149.9
92.9108.5
109.9120.8109.3108.5103.3
113.4120.0118.3
122.9120.4120.9121.6118.0114.6
115.2120.0120.5119.9122.0124.2
123.5121.2119.7117.1117.6121.4
121.3121.2118.3114.4112.1112.1
95.3103.7101.0
105.7118.5114.7116.2116.7
120.1126.0129.3
124.2124.9125.4125.5125.3
125.1126.6127.2127.8127.7128.2
128.7129.0129.0129.1129.0128.9
129.5129.8129.8129.8129.8129.8
96.6102.8100.6
102.1109.6108.0108.9109.4
110.2112.8115.7
112.1112.3112.4112.4112.4112.5
112.5112.7112.9113.4114.0114.4
115.2115.9115.8115.8115.5115.3
115.4115.5115.6115.7116.1116.2
1 Includes, in addition to subgroups shown, processed fuels and lubricants, containers, and supplies.2 Excludes crude foodstuffs and feedstuffs, plant and animal fibers, oilseeds, and leaf tobacco.3 Excludes intermediate materials for food manufacturing and manufactured animal feeds.* Preliminary.NOTE.—For a listing of the commodities included in each sector and their relative importance, see Monthly
Labor Review, December 1955.
Source: Department of Labor.
159
Digitized for FRASER http://fraser.stlouisfed.org/ Federal Reserve Bank of St. Louis
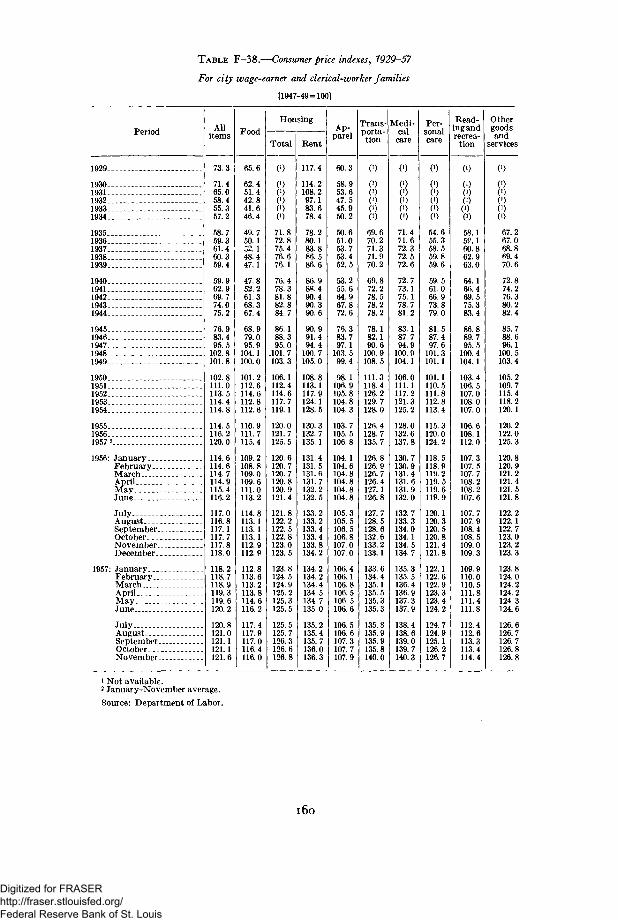
TABLE F-38.—Consumer price indexes, 7929-57
For city wage-earner and clerical-worker families
[1947-49=100]
Period
1929
19301931193219331934
19351936193719381939
19401941194219431944
19451946194719481949
19501951195219531954
19551956195721956: January
FebruaryMarchAprilMayJune
JulyAugustSeptemberOctoberNovemberDecember
1957: JanuaryFebruaryMarchAprilMayJune
JulyAugustSeptemberOctoberNovember
Allitems
73.3
71.465.058.455.357.2
58.759.361.460.359.4
59.962.969.774.075.2
76.983.495.5
102.8101.8
102.8111.0113.5114.4114.8
114.5116.2120.0
114.6114.6114.7114.9115.4116.2
117.0116.8117.1117.7117.8118.0
118.2118.7118.9119. 3119.6120.2
120.8121.0121.1121.1121.6
Food
65.6
62.451.442.841.646.4
49.750.1
48. 447.1
47.852.261.368.367.4
79.095.9
104.1100.0
101.2112.6114.6112.8112.6
110.9111.7115.4
109.2108.8109.0109.6111.0113.2
114.8113.1113.1113.1112.9112. P
112.8113.6113.2113.8114.6116.2
117.4117.9117.0116.4116.0
Housing
Total Rent
0)
(00)0)0)(')
71.872.875.476.676.1
76.478.381.882.884.7
86.188.395.0
.101. 7103.3
106.1112.4114.6117.7119.1
120.0121.7125.5
120.6120.7120.7120.8120.9121.4
121.8122.2122.5122.8123.0123.5
123.8124.5124.9125.2125.3125.5
125.5125.7126.3126.6126.8
117.4
114.2108.297.183.678.4
78.280.183.886.5
8S.490.490.390.6
90.991.494.4
100.7105.0
108.8113.1117.9124.1128.5
130.3132.7135.1
131.4131.5131.6131.7132.2132.5
133.2133.2133.4133.4133.8134. 2
134.2134.2134.4134.5134.7135.0
135.2135.4135.7136.0136.3
Ap-parel
60.3
58.953.647.545.950.2
50.651.053.753.452.5
53.255.664.967.872.6
76.383.797.1
103.599.4
98.1106.9105.8104.8104.3
103.7105.5106.8
104. 1104.6104.8104.8104.8104.8
105.3105.5106.5106.8107.0107.0
106.4106.1106.8106.5106.5106.6
106.5106.6107.3107.7107.9
Trans-porta-tion
Medi-calcare
0)
0)(00)0)0)
69.670.271.371.970.2
69.872.278.578.278.2
78.182.190.6
100.9108.5
111.3118.4126.2129.7128.0
126.4128.7135.7
126.8126.9126.7126.4127.1126.8
127.7128.5128.6132.6133.2133.1
133.6134.4135.1135.5135.3135.3
135.8135.9135.9135.8140.0
0)(00)0)(0
71.471.672.372.572.6
72.773.175.178.781.2
83.187.794.9
100.9104.1
106.0111.1117.2121.3125.2
128.0132.6137.8
130.7130.9131.4131.6131.9132.0
132.7133.3134. 0134.1134.5134.7
135.3135.5136.4136.9137.3137.9
138.4138.6139.0139.7140.3
Per-sonalcare
0)
(00)0)(00)
54.655.358.559.859.6
59.561.066.973.879.0
81.587.497.6
101.3101.1
101.1110.5111.8112.8113.4
115.3120.0124.2
118.5118.9119.2119.5119.6119.9
120.1120.3120.5120.8121.4121.8
122.1122.6122.9123.3123.4124.2
124.7124.9125.1126.2126.7
Read-ing andrecrea-tion
0)
0)0)(00)0)
58.15P. 160.862.963.0
64.166.469.575.383.4
86.889.795.5
100.4104.1
103.4106.5107.0108.0107.0
106.6108.1112.0
107.3107. 5107.7108.2108.2107.6
107.7107.9108.4108.5109.0109.3
109.9110.0110.5111.8111.4111.8
112.4112.6113.3113.4114.4
Othergoodsand
services
0)
0)0)0)0)0)
67.267.068.869.470.6
72.874.276.380.282.4
85.788.696.1
100.5103.4
105.2109.7115.4118.2120.1
120.2122.0125.3
120.8120.9121.2121.4121.5121.8
122.2122.1122.7123.0123. 2123.3
123.8124.0124.2124.2124.3124.6
126.6126.7126.7126.8126.8
1 Not available.2 January-November average.Source: Department of Labor.
160
Digitized for FRASER http://fraser.stlouisfed.org/ Federal Reserve Bank of St. Louis
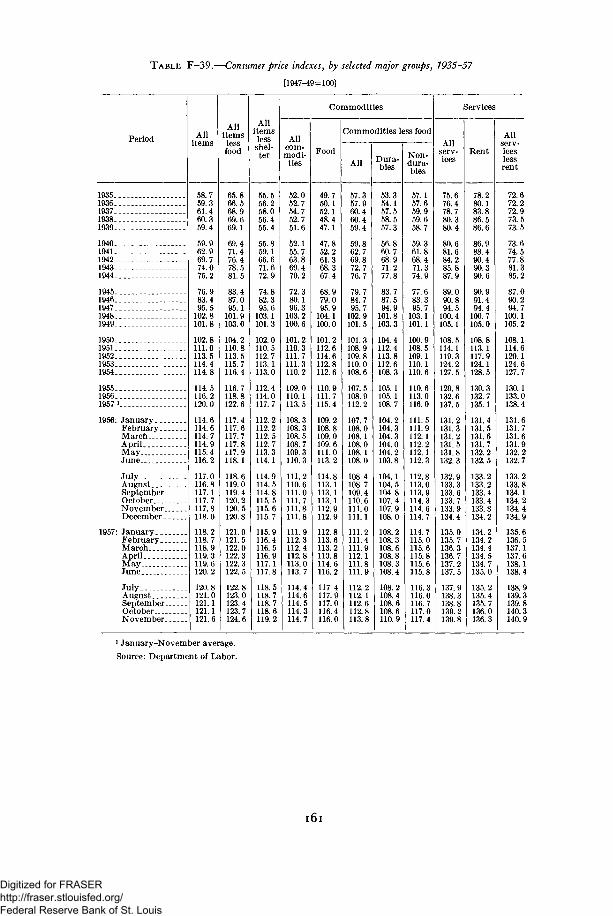
TABLE F—39.—Consumer price indexes, by selected major groups, 1935-57
[1947-49=100]
Period
1935..1936..1937..1938-.1939..
1940-1941.1942.1943_1944.
1945.1946.1947.1948-1949.
1950-1951.1952.1953.1954.
1955.1956.1957 1
1956: January. _February.MarchAprilMayJune
JulyAugustSeptemberOctoberNovemberDecember
1957: January._February .MarchAprilMayJune
JulyAugustSeptemberOctoberNovember
Allitems
58.759.361.460.359.4
59.962.969.774.075.2
76.983.495.5
102.8101.8
102.8111.0113. 5114.4114.8
114.5116.2120.0
114.6114.6114.7114.9115.4116.2
117.0116.8117.1117.7117.8118.0
118.2118.7118.9119.3119.6120.2
120.8121.0121.1121.1121.6
Allitemslessfood
65.866.568.969.669.1
69.471.476.478.581.5
83.487.095.1
101.9103.0
104.2110.8113.5115.7116.4
116.7118.8122.6
117.4117.6117.7117.8117.9118.1
118.6119.0119.4120.2120.5120.8
121.0121.5122.0122.3122.3122.5
122.8123.0123.4123.7124.6
Allitemslessshel-ter
55.556.258.056.455.4
55.859.166.671.672.9
74.882.395.6
103.1101.3
102.0110.5112.7113.1113.0
112.4114.0117.7
112.2112.2112. 5112.7113.3114.1
114.9114.5114.8115.5115.6115.7
115.9116.4116.5116.9117.1117.8
118.5118.7118.7118.6119.2
Commodities
Allcom-modi-
ties
52.052.754.752.751.6
52.155.763.869.470.2
72.380.196.3
103.2100.6
101.2110.3111.7111.3110.2
109.0110.1113.5
108.3108.3108.5108.7109.3110.3
111.2110.6111.0111.7111.8111.8
111.9112.3112.4112.8113.0113.7
114.4114.6114.5114.3114.7
Food
49.750.152.148.447.1
47.852.261.368.367.4
68.979.095.9
104.1100.0
101.2112.6114.6112.8112.6
110.9111.7115.4
109.2108.8109.0109.6111.0113.2
114.8113.1113.1113.1112.9112.9
112.8113.6113.2113.8114.6116.2
117.4117.9117.0116.4116.0
Commodities less food
All
57.357.960.460.459.4
59.862.769.872.776.7
79.784.795.7
102.9101.5
101.3108.9109.8110.0108.6
107.5108.9112.2
107.7108.0108.1108.0108.1108.0
108.4108.7109.4110.6111.0111.1
111.2111.4111.9112.1111.8111.9
112.2112.1112.6112.8113.8
Dura-bles
53.354.157.558.557.3
56.860.768.971.277.8
83.787.594.9
101.8103.3
104.4112.4113.8112. 6108.3
105.1105.1108.7
104.2104.3104.3104.0104.2103.8
104.1104.5104.8107.4107.9108.0
108.2108.3108.6108.8108.3108.4
108.2108.4108.6108.6110.9
Non-dura-bles
57.157.659.959.658.7
59.361.868.471.374.9
77.683.395.7
103.1101.1
100.9108.5109.1110.1110.6
110.6113.0116.0
111.5111.9112.1112.2112.1112.3
112.8113.0113.9114.3114.6114.7
114.7115.0115.6115.8115.6115.8
116.3116.0116.7117.0117.4
Services
Allserv-ices
75.676.478.780.380.4
80.681.684.285.887.9
89.090.894.5
100.4105.1
108.5114.1119.3124.2127. 5
129.8132.6137.5
131.2131.3131.2131.5131.8132.3
132.9133.3133.6133.7133.9134.4
135.0135.7136.3136.7137.2137.5
137.9138.3138.8139.2139.8
Rent
78.280.183.886.5
86.988.490.490.390.6
90.991.494.4
100.7105.0
113.1117.9124.1128.5
130.3132.7135.1
131.4131.5131.6131.7132.2132.5
133.2133.2133.4133.4133.8134.2
134.2134.2134.4134.5134.7135.0
135.2135.4135.7136.0136.3
Allserv-iceslessrent
72.672.272.973.573.5
73.674.577.881.385.2
87.090.294.7
100.1105.2
108.1114.6120.1124.6127.7
130.1133.0138.4
131.6131.7131.6131.9132.2132.7
133.2133.8134.1134.2134.4134.9
135.6136.5137.1137.6138.1138.4
138.9139.3139.8140.3140.9
1 January-November average.
Source: Department of Labor.
161
Digitized for FRASER http://fraser.stlouisfed.org/ Federal Reserve Bank of St. Louis

MONEY SUPPLY, CREDIT, AND FINANCETABLE F-40.—Deposits and currency, 1929-57
[Billions of dollars]
End of period >Total
depositsand
currency
54.753.648.445.442.648.152.757.656.859.964.771.179.1
100.5123.4151.4176.4167.5172.3172.7173.9180.6189.9200.4205.7214.8221.0226.4231.7217.2216.1217.8217.4217.4219.7217.5219.1220.1220.9222.9226.4222.4221.1221.5224.3224.2224.9225.2225.0225.4226.9227.0231.7
Total excluding U.
Total
54.653.247.944.941.546.351.356.455.858.163.370.076.391.3
112.4130.2150.8164.0170.0169.1169.8176.9186.0194.8200.9209.7216.6222.0227.3214.4211.6210.8212.4211.2213.6213.3212.8214.1216.6217.2222.0219.9218.0217.2219.6218.4219.7221.0220.0220.9223.0223.3227.3
S. Government deposits J
Demand deposits and
Total
26.424.621.920.419.823.127.031.029.631.836.242.348.662.979.690.4
102.3110.0113.6111.6111.2117.7124.5129.0130.5134.4138.2139.7138.2136.0132.8131. 5133.1131.6133.0132. 7131.9132.8135.1136.3139.7136.9134.4132.6134.7132.7133.3134.3132.9133.3134.9135.7138.2
currency
Demanddeposits
adjusted 3
22.821.017.415.715.018.522.125.524.026.029.834.939.048.960.866.975.983.387.185.585.892.398.2
101.5102.5106.6109.9111.4109.7108.9105. 6104.4106.1104.2104.7105.2104.5105.4107.4108.3111.4109.5107.0105.2107.3104.8105.6106.6105.1105. 6107.2107.2109.7
Cur-rency
outsidebanks
3.6
3.64.54.74.84.7
4.95.55.65.86.4
7.39.6
13.918.823.526.526.726.526.125.425.426.327.528.127.928.328.328.527.127.227.227.027.428.327.427.527.427.728.028.327.427.427.427.427.927.827.827.827.827.828.528.5
Timede-
posits <
28.228.726.024.521.723.224.225.426. 226.327.127.727.728.432.739.848.554.056.457.558.659.261.565.870.475.378.482.289.178.478.879.379.379.680.680.780.981.381.580.982.282,983.684.684.985.786.486.787.187.788.187.689.1
u. s.Gov-ern-
mentde-
posits *
19291930193119321933-.1934193519361937193819391940-.-19411942194319441945194619471948194919501951195219531954195519561957«1956: January
February. . .MarchAprilMayJuneJulyAugustSeptember. .OctoberNovember..December. .
1957: JanuaryFebruary. . .MarchAprilMayJuneJuly*August«September«Octobers.. .November 8.December «.
0.2.3.5.5
1.01.8.5.2.0
1.51.12.89.2
11.021.225.63.52.33.64.1
3.73.95.64.85.14.44.5I. 42.84.57.05.06.26.14.26.36.04.35.74.52.53.14.34.75.85.24.24.94.53.93.84.4
1 End-of-year, June and December 1956, and December 1957 figures are for call dates. Other data (includ-ing those for June 1957) are for the last Wednesday of the month.
2 Includes holdings of State and local governments.3 Includes demand deposits, other than interbank and U. S. Government, less cash items in process of
collection.* Includes deposits in commercial banks, mutual savings banks, and Postal Savings System, but ex-
cludes interbank deposits.6 Includes U. S. Government deposits at Federal Reserve Banks and commercial and savings banks and,
beginning with 1938, includes U. S. Treasurer's time deposits, open account.« Preliminary; December estimates by Council of Economic Advisers.NOTE.—Detail will not necessarily add to totals because of rounding.Source: Board of Governors of the Federal Reserve System (except as noted).
l 6 2
Digitized for FRASER http://fraser.stlouisfed.org/ Federal Reserve Bank of St. Louis
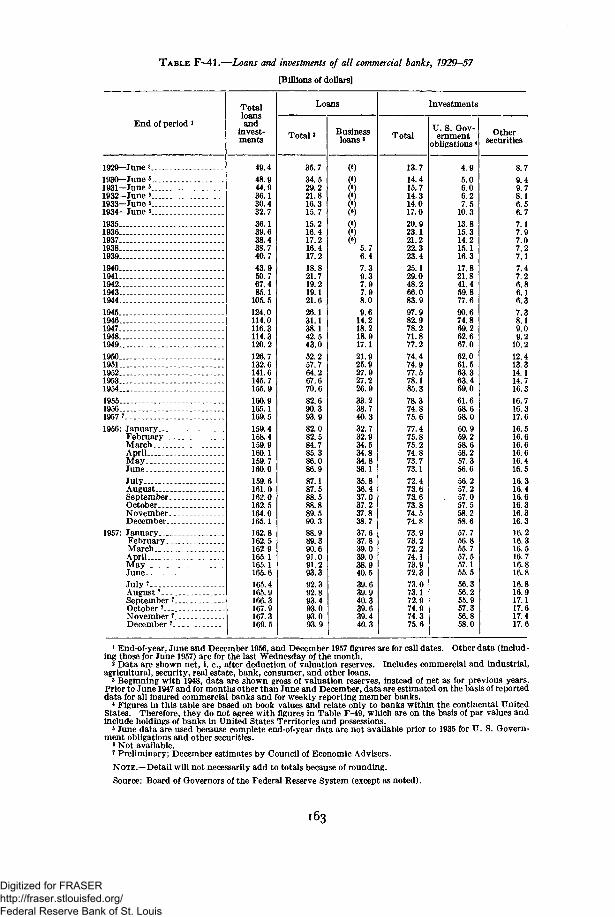
TABLE F—41.—Loans and investments of all commercial banks, 1929—57
[Billions of dollars]
End of period 1
Totalloansand
invest-ments
Loans
Total3 Businessloans3
Investments
TotalU. S. Gov-ernment
obligations <Other
securities
1929—Junes _.1930—Junes1931—June*1932-June*1933—June* _.1934—June*19351936193719381939194019411942194319441945194619471948194919501951195219531954195519561957 71956: January
February. . .MarchAprilMayJuneJulyAugustSeptember..OctoberNovember..December...
1957: JanuaryFebruary..MarchAprilMayJuneJuly?August7
September IOctober 7_...November 7
December 7.
49.448.944.936.130.432.736.139.638.438.740.743.950.767.485.1
105.5124.0114.0116.3114.3120.2126.7132.6141.6145.7155.9160.9165.1169.5159.4158.4159.9160.1159.7160. 0159.6161.0162.0162.5164.0165.1162.8162. 5162.9165.1165.1165.6165.4165.9166.3167.9167.3169.5
35.734.529.221.816.315.715.216.417.216.417.218.821.719.219.121.626.131.138.142.543.052.257.764.267.670.682.690.393.982.082.584.785.386.086.987.187.588.588.889.590.388.989.390.691.091.293.392.392.893.493.093.093.9
5.76.47.39.37.97.98.09.6
14.218.218.917.121.925.927.927.226.933.238.740.332.732.934.534.834.836.135.836.437.037.237.838.737.637.839.039.038. 940.5
40.3
39.440.3
13.714.415.714.314.017.020.923.121.222.323.425.129.048.266.083.997.982.978.271.877.274.474.977.578.185.378.374.875.677.475.875.274.873.773.172.473.673.673.874.574.873.973.272.274.173.972.373.073.172.974.974.375.6
4.95.06.06.27.5
10.313.815.314.215.116.317.821.841.459.877.690.674.869.262.667.062.061.563.363.469.061.658.658.060.959.258.658.257.356.656.257.257.057.558.258.657.756.855.757.557.155.556.356.255.957.356.858.0
8.79.49.78.16.56.77.17.97.07.27.17.47.26.86.16.37.38.19.09.2
10.212.413.314.114.716.316.716.317.616.516.616.616.616.416.516.316.416.616.316.316.316.216.316.516.716.816.816.816.917.117.617.417.6
1 End-of-year, June and December 1956, and December 1957 figures are for call dates. Other data (includ -ing those for June 1957) are for the last Wednesday of the month.
2 Data are shown net, i. e., after deduction of valuation reserves. Includes commercial and industrial,agricultural, security, real estate, bank, consumer, and other loans.
3 Beginning with 1948, data are shown gross of valuation reserves, instead of net as for previous years.Prior to June 1947 and for months other than June and December, data are estimated on the basis of reporteddata for all insured commercial banks and for weekly reporting member banks.
< Figures in this table are based on book values and relate only to banks within the continental UnitedStates. Therefore, they do not agree with ngures in Table F-49, which are on the basis of par values andinclude holdings of banks in United States Territories and possessions.5 June data are used because complete end-of-year data are not available prior to 1935 for U. S. Govern-ment obligations and other securities.
6 Not available.7 Preliminary; December estimates by Council of Economic Advisers.NOTE.—Detail will not necessarily add to totals because of rounding.Source: Board of Governors of the Federal Reserve System (except as noted).
163
Digitized for FRASER http://fraser.stlouisfed.org/ Federal Reserve Bank of St. Louis
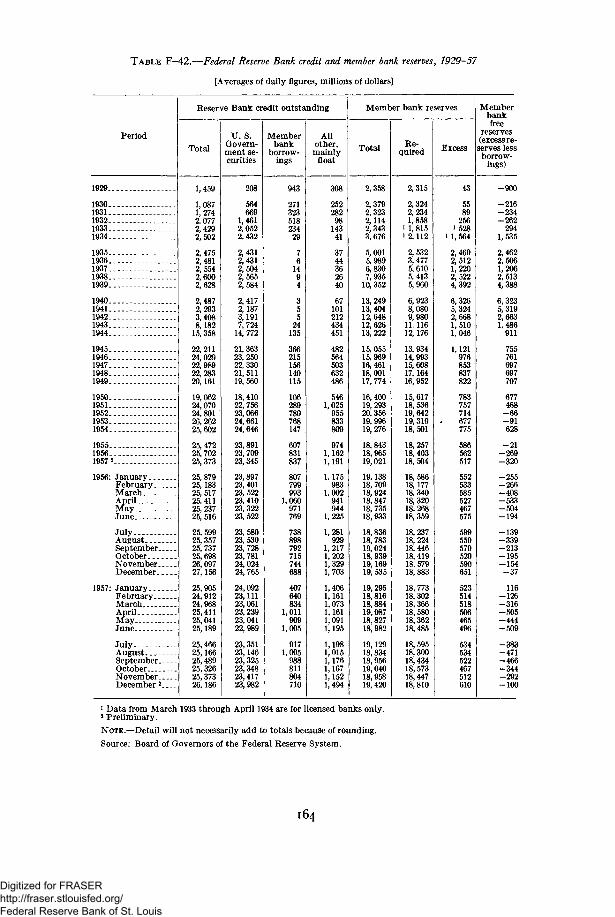
TABLE F-42.—Federal Reserve Bank credit and member bank reserves, 1929-57
[Averages of daily figures, millions of dollars]
Period
1929
19301931193219331934
19351936193719381939
19401941194219431944
19451946194719481949
19501951195219531954.
1955195619572
1956: JanuaryFebruary..MarchAprilMayJune
JulyAugustSeptember-OctoberNovember-December..
1957: January. . .February. _MarchApril _MayJune
JulyAugustSeptember .OctoberNovember-December 2
Reserve Bank credit outstanding
Total
1,459
1,0871,2742,0772,4292,502
2,4752,4812,5542,6002,628
2,4872,2933,4088,182
15, 358
22, 21124, 02922, 98922, 28320,161
19, 06224,07024, 80126, 26225,602
25, 47225, 70225,373
25, 87925,18325, 51725, 41125,23725, 516
25, 59925, 35725, 73725,69826, 09727,156
25,90524,91224, 96825,41125,04125,189
25,46625,16625,48925,32625, 37326,186
U. S.Govern-ment se-curities
208
564669
1,4612,0522,432
2,4312,4312,5042,5652,584
2,4172,1873,1917,724
14, 772
21,36323, 25022, 33021, 51119, 560
18, 41022, 75623,06624, 66124, 646
23, 89123, 70923,345
23, 89723, 40123, 52223, 41023,32223,522
23, 58023.53023, 72823, 78124, 02424, 765
24,09223, 11123,06123,23923,04122, 989
23,35123,14623,32523,34823,41723, 982
Memberbank
borrow-ings
943
271323518234
29
76
1494
355
24135
366215156140115
106289780768147
607831837
807799993
1,060971769
738898792715744688
407640834
1,011909
1,005
9171,005
988811804710
Allother,mainly
float
308
252282
9814341
3744362640
67101212434451
482564503632486
5461,025
955833809
9741,1621,191
1,175983
1,002941944
1,225
1,281929
1,2171,2021,3291,703
1,4061,1611,0731,1611,0911,195
1,1981,0151,1761,1671,1521,494
Member bank reserves
Total
2,358
2,3792,3232,1142,3433,676
5,0015,9896,8307,935
10, 352
13, 24913, 40412, 64812,62613, 222
15,05515, 96916, 46118,00117, 774
16,40019,29320,35619,99619, 276
18. 84318,96519,021
19,13818, 70918, 92418.84718, 73518, 933
18, 83618, 78319, 02418, 93919,16919, 535
19,29518,81618,88419,08718,82718, 982
19,12918,83418,95619,04018,95819,420
Re-quired
2,315
2,3242,2341,858
i 1,815i 2,112
2,5323,4775,6105,4135,960
6,9238,0809,980
11.11612,176
13,93414,99315,60817,16416,952
15, 61718, 53619,64219, 31918,501
18, 25718, 40318,504
18,58618,17718, 34018,32018,26818, 359
18,23718, 22418, 44618, 41918, 57918, 883
18,77318,30218, 36618,58018,36218,485
18, 59518,30018,43418, 57318,44718,810
Excess
43
5589
256i 528
i 1, 564
2,4692,5121,2202,5224,392
6,3265,3242,6681,5101,046
1,121976853837822
783757714677775
586562517
552533585527467575
599559579520590651
523514518506465496
534534522467512610
Memberbankfree
reserves(excess re-serves lessborrow-
ings)
- 9 0 0
- 2 1 6- 2 3 4- 2 6 2
2941,535
2,4622,5061,2062,5134,388
6,3235,3192,6631,486
911
755761697697707
677468
- 6 6- 9 1628
- 2 1- 2 6 9- 3 2 0
- 2 5 5- 2 6 6- 4 0 8- 5 3 3- 5 0 4- 1 9 4
- 1 3 9- 3 3 9- 2 1 3- 1 9 5- 1 5 4
- 3 7
116- 1 2 6- 3 1 6- 5 0 5- 4 4 4- 5 0 9
- 3 8 3- 4 7 1- 4 6 6- 3 4 4- 2 9 2- 1 0 0
1 Data from March 1933 through April 1934 are for licensed banks only.3 Preliminary.
NOTE.—Detail will not necessarily add to totals because of rounding.
Source: Board of Governors of the Federal Reserve System.
164
Digitized for FRASER http://fraser.stlouisfed.org/ Federal Reserve Bank of St. Louis
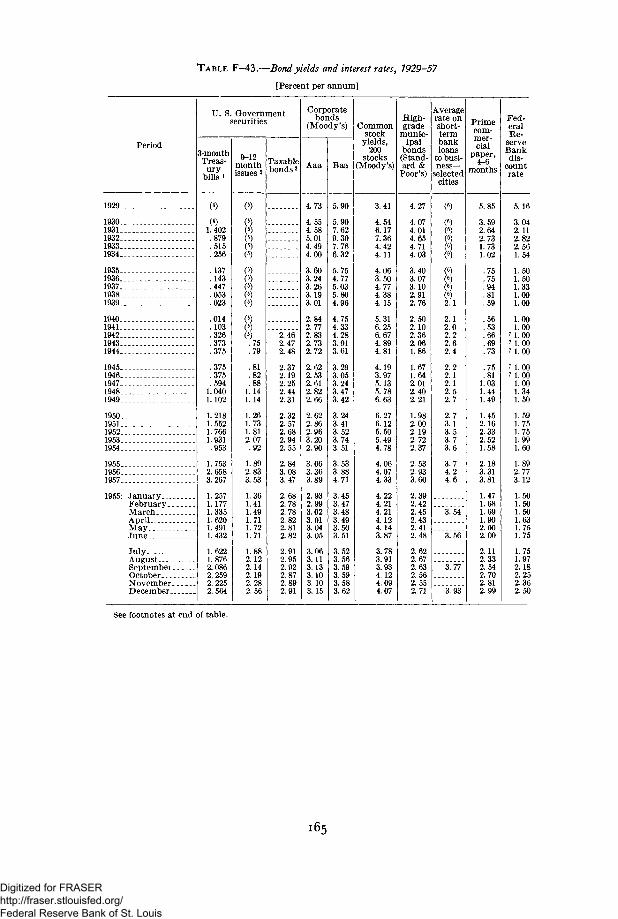
TABLE F-43.—Bond yields and interest rates, 1929-57
[Percent per annum]
Period3-monthTreas-
urybills i
1929
19301931193219331934
19351936193719381939
19401941194219431944
19451946194719481949
19501951195219531954
195519561957
1955: JanuaryFebruaryMarchAprilMayJune
JulyAugustSeptemberOctoberNovemberDecember
U. S. Governmentsecurities
()1.402.879.515.256
.137
.143
.447
.053
.023
.014
.103
.326
.373
.375
.375
.375
.5941.0401.102
1.2181.5521.7661.931.953
1.7532.6583.267
1.2571.1771. 3351.6201.4911.432
1.6221.8762.0862.2592.2252.564
9-12monthissues 2
Taxablebonds3
().75.79
.81
.82
.881.141.14
1.261.731.812.07.92
1.892.833.53
1.361.411.491.711.721.71
1.882.122.142.192.282.56
2.462.472.48
2.372.192.252.442.31
2.322.572.682.942.55
2.843.083.47
2.682.782.782.822.812.82
2.912.952.922.872.892.91
Corporatebonds
(Moody's)
4.73
4.554.585.014.494.00
3.603.243.263.193.01
2.842.772.832.732.72
2.622.532.612.822.66
2.622.862.963.202.90
3.063.363.89
2.932.993.023.013.043.05
3.063.113.133.103.103.15
Baa
Commonstock
yields,200
stocks(Moody's)
5.90
5.907.629.307.766.32
5.754.775.035.804.96
4.754.334.283.913.61
3.293.053.243.473.42
3.243.413.523.743.51
3.533.884.71
3.453.473.483.493.503.51
3.523.563.593.593.583.62
3.41
4.546.177.364.424.11
4.063.504.774.384.15
5.316.256.674.894.81
4.193.975.135.786.63
6.276.125.505.494.78
4.064.074.33
4.224.214.214.124.143.87
3.783.913.934.124.094.07
High-grade
munic-ipal
bonds(Stand-ard &
Poor's)
Averagerate onshort-termbankloans
to busi-ness-
selectedcities
4.27
4.074.014.654.714.03
3.403.073.102.912.76
2.502.102.362.061.86
1.671.642.012.402.21
1.982.002.192.722.37
2.532.933.60
2.392.422.452.432.412.48
2.622.672.632.562.552.71
()2.1
2.12.02.22.62.4
2.22.12.12.52.7
2.73.13.53.73.6
3.74.24.6
3.56
3.77
3.93
Primecom-mer-cial
paper,
months
5.85
3.592.642.731.731.02
.75
.75
.94
.81
.56
.53
.66
.69
.73
.75
.811.031.441.49
1.452.162.332.521.58
2.183.313.81
1.471.681.691.902.002.00
2.112.332.542.702.812.99
Fed-eralRe-
serveBankdis-
countrate
5.16
3.042.112.822.561.54
1.501.501.331.001.00
1.001.00
7 1.007 1.00
7 1.00
7 1.007 1.00
1.001.341.501.591.751.751.991.60
1.892.773.12
1.501.501.501.631.751.75
1.751.972.182.252.362.50
See footnotes at end of table.
165
Digitized for FRASER http://fraser.stlouisfed.org/ Federal Reserve Bank of St. Louis
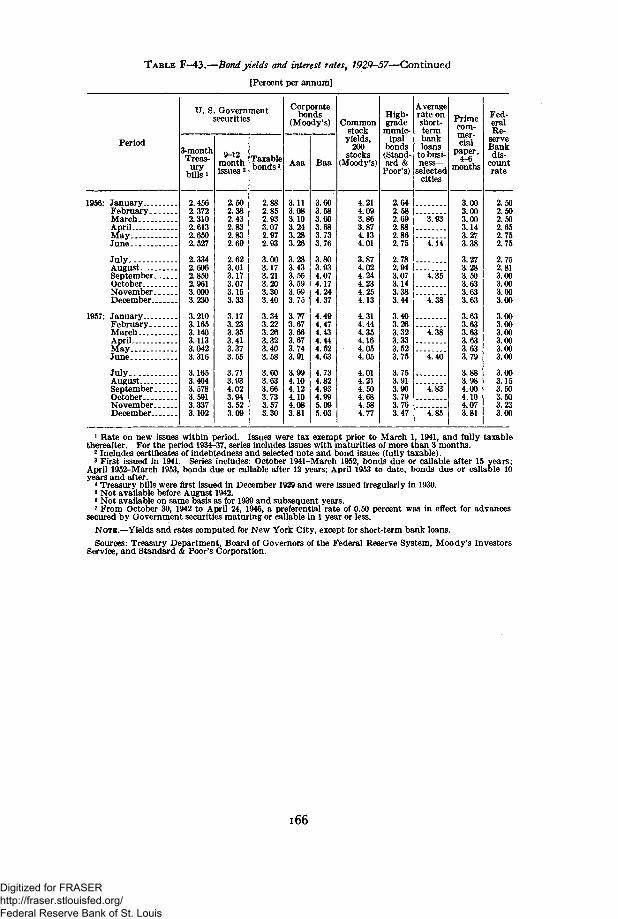
TABLE F-43.—Bond yields and interest rates, 1929-57—Continued
[Percent per annum]
Period
1956: January.FebruaryMarchAprilMayJune
Ju ly . - -AugustSeptemberOctoberNovemberDecember
1957: JanuaryFebruaryMarchAprilMayJune .-
July.-August.. _.SeptemberOctoberNovemberDecember
U. S. Governmentsecurities
3-monthTreas-
urybills i
2.4562.3722.3102.6132.6502.527
2.3342.6062.8502.9613.0003.230
3.2103.1653.1403.1133.0423.316
3.1653.4043.5783.5913.3373.102
9-12month Taxable
bonds3
2.502.382.432.832.832.69
2.623.013.173.073.153.33
3.173.233.353.413.373.55
3.713.934.023.943.523.09
2.882.852.933.072.972.93
3.003.173.213.203.303.40
3.343.223.263.323.403.58
3.603.633.663.733.573.30
Corporatebonds
(Moody's)
Aaa
3.113.083.103.243.283.26
3.283.433.563.593.693.75
3.773.673.663.673.743.91
3.994.104.124.104.083.81
Baa
3.603.583.603.683.733.76
3.803.934.074.174.244.37
4.494.474.434.444.524.63
4.734.824.934.995.095.03
Commonstock
yields,200
stocks(Moody's)
4.214.093.863.874.134.01
3.874.024.244.234.254.13
4.314.444.354.164.054.05
4.014.214.504.684.584.77
High-grade
munic-ipal
bonds(Stand-ard &
Poor's)
Averagerate onshort-termbankloans
to busi-n e s s -
selectedcities
2.642.582.692.882.862.75
2.782.943.073.143.383.44
3.403.263.323.333.523.75
3.753.913.903.793.763.47
3.93
4.14
4.35
4.38
4.38
4.40
4.83
4.85
Primecom-mer-cial
paper,4-6
months
3.003.003.003.143.273.38
3.273.283.503.633.633.63
3.633.633.633.633.633.79
3.883.984.004.104.073.81
Fed-eralRe-
serveBankdis-
countrate
2.502.502.502.652.752.75
2.752.813.003.003.003.00
3.003.003.003.003.003.00
3.003.153.503.503.233.00
1 Rate on new issues within period. Issues were tax exempt prior to March 1, 1941, and fully taxablethereafter. For the period 1934-37, series includes issues with maturities of more than 3 months.
2 Includes certificates of indebtedness and selected note and bond issues (fully taxable).3 First issued in 1941. Series includes: October 1941-March 1952, bonds due or callable after 15 years;
April 1952-March 1953, bonds due or callable after 12 years; April 1953 to date, bonds due or callable 10years and after.
* Treasury bills were first issued in December 1929 and were issued irregularly in 1930.* Not available before August 1942.« Not available on same basis as for 1939 and subsequent years.7 From October 30, 1942 to April 24, 1946, a preferential rate of 0.50 percent was in effect for advances
secured by Government securities maturing or callable in 1 year or less.
NOTE.—Yields and rates computed for New York City, except for short-term bank loans.
Sources: Treasury Department, Board of Governors of the Federal Reserve System, Moody's InvestorsService, and Standard & Poor's Corporation.
166
Digitized for FRASER http://fraser.stlouisfed.org/ Federal Reserve Bank of St. Louis
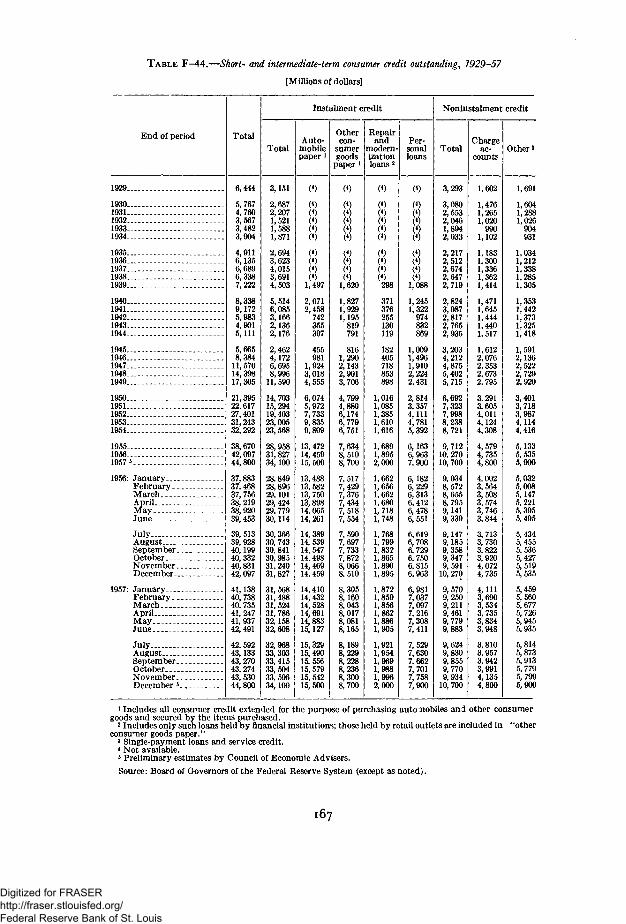
T A B L E F—44.—Short- and intermediate-term consumer credit outstanding^ 1929-57
[Millions of dollars]
End of period
1929
19301931193219331934
19351936193719381939
19401941194219431944
19451946194719481949 .
19501951195219531954
195519561957 5
1956: January . , . .February__MarchAprilMayJune
JulyAugustSeptember.OctoberNovember.December..
1957: JanuaryFebrua ry . .MarchAprilMayJune
July -AugustSeptember.OctoberNovember.December».
Total
6,444
5,7674,7603,5673,4823,904
4,9116,1356,6896,3387,222
8,3389,1725,9834,9015,111
5,6658,384
11,57014,39817,305
21,39522,61727,40131,24332,292
38,67042,09744, 800
37,88337.46837, 75638, 21938, 92039,453
39, 51339, 92840,19940, 33240, 83142, 097
41,13840, 73840. 73541, 24741, 93742,491
42. 59243,13343, 27043. 27443, 53044,800
Instalment credit
Total
3,151
2,6872,2071,5211,5881,871
2,6943,6234,0153,6914,503
5,5146,0853,1662,1362,176
2,4624,1726,6958,996
11,590
14, 70315,29419,40323,00523,568
28,95831,82734,100
28,84928,89629,10129, 42429,77930,114
30, 36630, 74330, 84130, 98531, 24031, 827
31,56831,48831, 52431, 78632,15832,608
32,96833,30333,41533,50433, 59634,100
Auto-mobilepaper i
(4)
(4)(4)(4)(4)(4)
(4)(4)(4)(4)
1,497
2,0712,458
742355397
455981
1,9243,0184,555
6,0745,9727,7339,8359,809
13, 47214, 45915,500
13,48813, 58213, 75013, 89814,06514, 261
14, 38914, 53914, 54714, 49814, 46914,459
14, 41014, 43214, 52814,69114,88315,127
15,32915,49015.55615, 57915,54215,500
Othercon-
sumergoods
paper l
(4)
(4)(4)(4)(4)(4)
(4)(4)(4)(4)
1,620
1,8271,9291,195
819791
8161,2902,1432,9013,706
4,7994,8806,1746,7796,751
7,6348,5108,700
7,5177,4297,3767,4347,5187,554
7,5907,6977,7337,8728,0668.510
8,3058,1608,0438,0178,0818,165
8,1898,2298,2288,2368,3008,700
Repairand
modern-izationloans2
(4)
(4)(4)(4)(4)(4)
(4)(4)(4)(4)298
371376255130119
182405718853898
1,0161,0851,3851,6101,616
1,6891,8952,000
1,6621,6561,6621,680,718
1,748
L,7681,7991,8321,865L,8901,895
1,8721,8591,8561,862L,8861,905
L, 921L, 9541,9691,9881,9962,000
Per-sonalloans
(4)
(4)(4)(4)(4)(4)
(4)(4)(4)(4)
1,088
1,2451,322
974832869
1,0091,4961,9102,2242,431
2,8143,3574,1114,7815,392
6,1636,9637,900
6,1826,2296,3136,4126,4786,551
6,6196,7086.7296,7506.8156,963
6,9817,0377,0977,2167,3087,411
7,5297,6307,6627,7017,7587,900
Noninstalment credit
Total
3,293
3,0802,5532,0461,8942,033
2,2172,5122,6742,6472,719
2,8243,0872,8172,7652,935
3,2034,2124,8755,4025,715
6,6927,3237,9988,2388,724
9,71210. 27010, 700
9,0348,5728,6558,7959,1419,339
9,1479,1859,3589,3479,591
10, 270
9,5709,2509,2119,4619,7799,883
9,6249,8309,8559,7709,934
10,700
Chargeac-
counts
1,602
1,4761,2651,020
9901,102
1,1831,3001,3361,3621,414
1,4711,6451,4441,4401,517
1,6122,0762,3532,6732,795
3,2913,6054,0114,1244,308
4,5794,7354,800
4,0023,5643,5083,5743,7463,844
3,7133,7303,8223,9204,0724,735
4,1113,6903,5343,7353,8343,948
3,8103,9573,9423,9914,1354,800
Others
1,691
1,6041,2881,026
904931
1,0341,2121,3381,2851,305
1,3531,4421,3731,3251,418
1,5912,1362,5222,7292,920
3,4013,7183,9874,1144,416
5,1335,5355,900
5,0325,0085,1475,2215,3955,495
5,4345,4555,5365,4275,5195,535
5,4595,5605,6775,7265,9455,935
5,8145,8735,9135,7795,7995,900
1 Includes all consumer credit extended for the purpose of purchasing automobiles and other consumergoods and secured by the items purchased.
2 Includes only such loans held by financial institutions; those held by retail outlets are included in "otherconsumer goods paper."
3 Single-payment loans and service credit.* Not available.5 Preliminary estimates by Council of Economic Advisers.
Source: Board of Governors of the Federal Reserve System (except as noted).
167
Digitized for FRASER http://fraser.stlouisfed.org/ Federal Reserve Bank of St. Louis

TABLE F-45.—Instalment credit extended and repaid, 1946-57
[Millions of dollars]
Period
Total
Ex-tended
Re-paid
Automobilepaper
Ex-tended
Re-paid
Other consumergoods paper
Ex-tended
Re-paid
Repair andmodernization
loans
Ex-tended
Re-paid
Personalloans
Ex-tended
Re-paid
1946194719481949
19501951195219531954
195519561957
1956: JanuaryFebruaryMarchAprilMayJune
JulyAugustSeptemberOctoberNovemberDecember
1957: JanuaryFebruaryMarchAprilMayJune
JulyAugustSeptemberOctoberNovemberDecember *_>_
1956: JanuaryFebruaryMarchAprilMayJune
JulyAugust ..SeptemberOctoberNovemberDecember
1957: JanuaryFebruaryMarchAprilMayJune
JulyAugustSeptemberOctoberNovemberDecember L _
8,49512,71315, 58518,108
21, 55823,57629,51431, 55831,051
39,03940,06342,300
2,8952,9373,3203,3493,4893,412
3,3543,5513,0323,4513,4493,824
3,0902,9763,3473,5943,7483,674
3,8373,7043,3883,5453,4394,000
3,3373,2863,3703,2983,168
3,2843,3953,2853,3793,5123,451
3,4753,5063,4233,4693,5333,546
3,5983,5903,5443,5413,5583,600
6,78510,19013,28415, 514
18, 44522, 98525, 40527, 95630,488
33,64937,19440,100
1,9693,6925,2176,967
8,5308,95611,76412, 98111,807
16, 74515,56316,700
1,4432,7494,1235,430
7,0119,05810,00310,87911,833
13, 08214, 57615,600
3,0774,4985,3835,865
7,1507,4859,1869,2279,117
10,63411,59011,600
2,6033,6454,6255,060
6,0577,4047,8928,6229,145
9,75110, 71411,400
423704714734
835841
1,2171,3441,261
1,3881,5681,500
200391579
717772917
1,1191,255
1,3151,3621,400
3,0263,8194,2714,542
5,0436,2947,3478,0068,866
10,27211,34212,600
Unadjusted
3,0042,8903,1153,0263,1343,077
3,1023,1742,9343,3073,1943,237
3,3493,0563,3113,3323,3763,224
3,4773,3693,2763,4563,3473,500
1,1941,2371,3771,3451,4091,391
1,3401,3941,1561,2931,2271,200
1,2581,2151,3801,4681,5131,494
1,5631,4671,3641,4041,2501,300
1,1781,1431,2091,1971,2421,195
1,2121,2441,1481,3421,2561,210
1,3071,1931,2841,3051,3211,250
1,3611,3061,2981,3811,2871,300
77676385192698191S
9231,009897
1,0771,1101,359
802763846901
1,016998
9951,022927976
1,0201,300
893851904868897882
887902861938916915
1,007908963927952914
971982928968956
1,000
93103119130151139
139148138155138115
96101111123147133
143150138141123100
120109113112113109
119117105122113110
119114114117123114
127117123122115100
832834973948948964
9521,000841926974
1,150
934897
1,0101,1021,0721,049
1,1361,065959
1,0241,0461,300
Seasonally adjusted
2,9792,9652,9563,1033,0893,071
3,1393,1113,1783,1713,1913,241
3,2953,2573,2563,2843,3143,339
3,3833,3423.4203,3583,3953,400
1,3481,3801,3261,3081,2731,217
1,2321,2641,2301,2981,3531,334
1,4221,4081,3751,3721,3641,359
1,3851,3571,3951,4391,4071.400
1,1881,1861,1571,2361,2341,188
1,2211,2001,2171,2601,2381,251
1,3141,2841,2721,2951,3061,289
1,3181,2761,3191,3171,2921,300
938925901996960888
9721,008956996
1,0471,003
931960928935993
1,004
9951,025970909961
1,000
853840845883868886
913891938909935953
943933936908920952
964977990946982
1,000
121129128134139130
130133131137133123
124129123123135128
130137127126120100
118112109116113112
120115110117109111
117121113117122120
125117124118113100
891903931932926933
950990968948979991
9981,009997
1,0391,0411,055
1,0881,0711,0521,0671,0701,100
2,5393,4053,9574,335
4,6605,7516,5937,3368,255
9,50110, 54211,600
813787889849882891
884911820905909
1,002
916841950983
1,018964927985989
1,100
820827845868874885
885905913885909926
921919935964966978
976972987977
1,0081,000
1 Preliminary; December by Council of Economic Advisers.
Source: Board of Governors of the Federal Reserve System (except as noted).
168
Digitized for FRASER http://fraser.stlouisfed.org/ Federal Reserve Bank of St. Louis
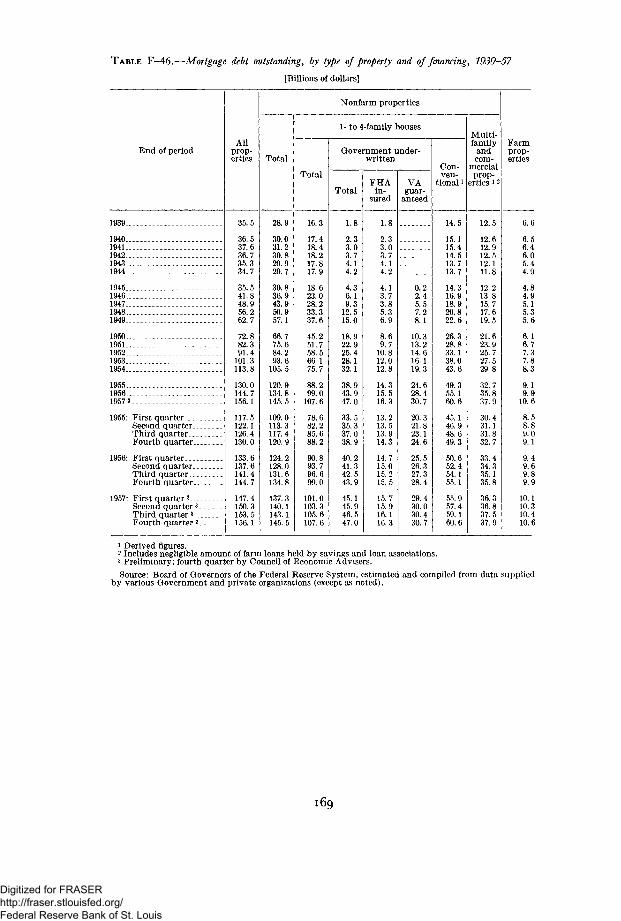
TABLE F-46.—Mortgage debt outstanding, by type of property and of financing, 1939-57
[Billions of dollars]
End of period
1939
19401941194219431944
1945 . . .1946194719481949
19501951 ,195219531954
195519561957 3
1955: First quarterSecond quarterThird quarterFourth quarter.-- - -
1956: First quarter _ _ . . .Second quarter. - -Third quarterFourth quarter.- . . . .
1957: First quarter 3Second quarter 3
Third quartersFourth quarter 3
Allprop-erties
35.5
36.537.636.735.334.7
35.541.848.956.262.7
72.882.391.4
101 3113.8
130.0144.7156.1
117.5122.1126.4130.0
133.6137.6141.4144.7
147.4150.3153.5156.1
Nonfarm properties
Total
28.9
30.031.230.829.929.7
30.836.943.950.957.1
66.775.684.293.6
105.5
120.9134.8145.5
109.0113.3117.4120.9
124.2128.0131.6134.8
137.3140.1143.1145.5
1- to 4-family houses
Total
16.3
17.418.418.217.817.9
18.623.028.233.337.6
45.251.758.566.175.7
88.299.0
107.6
78.682.285.688.2
90.893.796.699.0
101.0103.3105.6107.6
Government under-written
Total
1.8
2.33.03.74.14.2
4.36.19.3
12.515.0
18.922.925.428.132.1
38.943.947.0
33.535.337.038.9
40.241.342.543.9
45.145.946.547.0
FHAin-
sured
1.8
2.33.03.74.14.2
4.13.73.85.36.9
8.69.7
10.812.012.8
14.315.516.3
13.213.513.914.3
14.715.015.215.5
15.715.916.116.3
VAguar-
anteed
0.22.45.57.28.1
10.313.214.616.119.3
24.628.430.7
20.321.823.124.6
25.526.327.328.4
29.430.030.430.7
Con-ven-
tional 1
14.5
15.115.414.513.713.7
14.316.918.920.822.6
26.328.833.138.043.6
49.355.160.6
45.146.948.649.3
50.652.454.155.1
55.957.459.160.6
Multi-family
andcom-
mercialprop-
erties ! 2
12.5
12.612.912.512.111.8
12.213.815.717.619.5
21.623.925.727.529.8
32.735.837.9
30.431.131.832.7
33.434.335.135.8
36.336.837.537.9
Farmprop-erties
6.6
6.56.46.05.44.9
4.84.95.15.35.6
6.16.77.37.88.3
9.19.9
10.6
8.58.89.09.1
9.49.69.89.9
10.110.310.410.6
1 Derived figures.2 Includes negligible amount of farm loans held by savings and loan associations.3 Preliminary; fourth quarter by Council of Economic Advisers.
Source: Board of Governors of the Federal Reserve System, estimated and compiled from data suppliedby various Government and private organizations (except as noted).
169
Digitized for FRASER http://fraser.stlouisfed.org/ Federal Reserve Bank of St. Louis
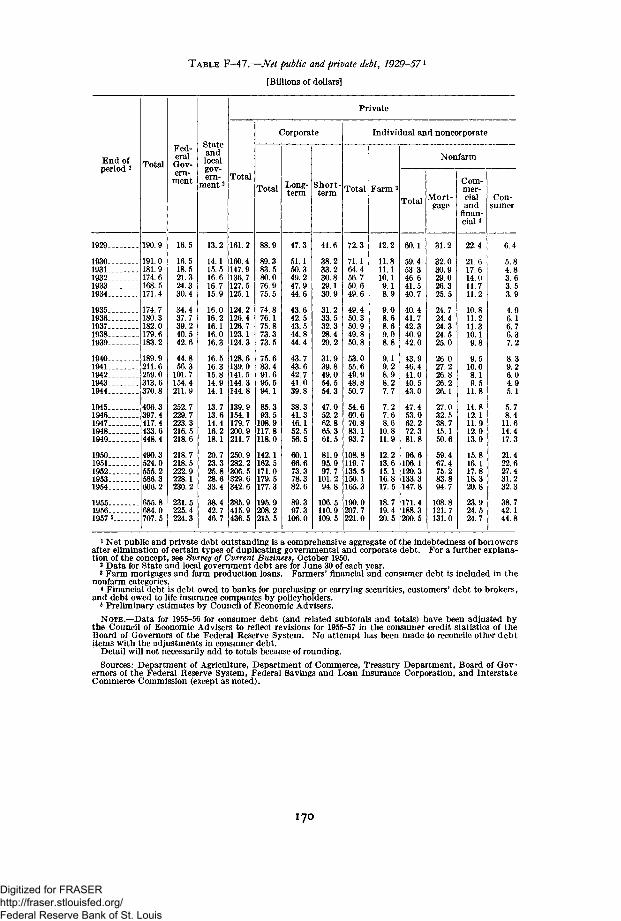
TABLE F-47.—Net public and private debt, 1929-57 l
[Billions of dollars]
End ofperiod 2 Total
1929-.
1930_.1931--1932._1933.-1934..
1935-.1936-.1937-1938-.1939..
1940..1941-.1942..1943-.1944--
1945..1946-.1947..1948-.1949-.
1950..1951..1952..1953..1954..
1955..1956..1957«.
190.9
191.0181.9174.6
i.5171.4
174.7180.3182.0179.6183.2
211. 6259.0313.6370.8
406.3397.4417.4433.6448.4
490.3524.0555.2586.3606.2
655.8684.0707.5
Fed-eralGov-ern-ment
Stateandlocalgov-ern-
ment2
16.5
16.518.521.324.330.4
34.437.739.240.542.6
44.856.3
101.7154.4211.9
252.7229.7223.3216.5218.6
218.7218.5222.9228.1230.2
231.5225.4224.3
Total
13.2
14.115.516.616.715.9
16.016.216.116.016.3
16.516.315.814.914.1
13.713.614.416.218.1
20.723.325.828.633.4
38.442.746.7
Private
Total
161.2
160.4147.9136.7127.5125.1
124.2126.4126.7123.1124.3
128.6139.0141.5144.3144.8
139.9154.1179.7200.9211.7
250.9282.2306.5329.6342.6
385.9415.9436.5
Corporate
89.383.580.076.975.5
74.876.175.873.373.5
75.683.491.695.594.1
85.393.5
108.9117.8118.0
142.1162.5171.0179.5177.3
195.9208.2215.5
Long-term
Short-
47.3
51.150.349.247.944.6
43.642.543.544.844.4
43.743.642.741.0
38.341.346.152.556.5
60.166.673.378.382.6
89.397.3
106.0
Total
41.6
38.233.230.829.130.9
31.233.532.328.429.2
31.939.849.054.554.3
47.052.262.865.361.5
81.995.997.7
101.294.8
106.5110.9109.5
Individual and noncorporate
Farm 3
72.3
71.164.456.750.649.6
49.450.350.949.850.8
53.055.649.948.850.7
54.660.670.883.193.7
108.8119.7135.5150.1165.3
190.0207.7221.0
12.2
11.811.110.19.18.9
9.08.68.69.0
9.19.28.98.27.7
7.27.68.6
10.811.9
12.213.615.116.817.5
18.719.420.5
Nonfarm
Total
60.1
59.453.346.641.540.7
40.441.742.340.942.0
43.946.441.040.543.0
47.453.062.272.381.8
96.6106.1120.3133.3147.8
171.4188.3200.5
Mort-gage
31.2
32.030.929.026.325.5
24.724.424.324.525.0
26.027.226.826.226.1
27.032.538.745.150.6
59.467.475.283.894.7
108.8121.7131.0
Com-mer-cialand
finan-cial*
22.4
21.617.614.011.711.2
10.811.211.310.1
9.510.08.19.5
11.8
14.812.111.912.913.9
15.816.117.818.320.8
23.924.524.7
Con-sumer
6.4
5.84.83.63.53.9
4.96.16.76.37.2
8.39.26.04.95.1
5.78.4
11.614.417.3
21.422.627.431.232.3
38.742.144.8
1 Net public and private debt outstanding is a comprehensive aggregate of the indebtedness of borrowersafter elimination of certain types of duplicating governmental and corporate debt. For a further explana-tion of the concept, see Survey of Current Business, October 1950.
2 Data for State and local government debt are for June 30 of each year.3 Farm mortgages and farm production loans. Farmers' financial and consumer debt is included in the
nonfarm categories.* Financial debt is debt owed to banks for purchasing or carrying securities, customers' debt to brokers,
and debt owed to life insurance companies by policyholders.5 Preliminary estimates by Council of Economic Advisers.
NOTE.—Data for 1955-56 for consumer debt (and related subtotals and totals) have been adjusted bythe Council of Economic Advisers to reflect revisions for 1955-57 in the consumer credit statistics of theBoard of Governors of the Federal Reserve System. No attempt has been made to reconcile other debtitems with the adjustments in consumer debt.
Detail will not necessarily add to totals because of rounding.
Sources: Department of Agriculture, Department of Commerce, Treasury Department, Board of Gov-ernors of the Federal Reserve System, Federal Savings and Loan Insurance Corporation, and InterstateCommerce Commission (except as noted).
170
Digitized for FRASER http://fraser.stlouisfed.org/ Federal Reserve Bank of St. Louis
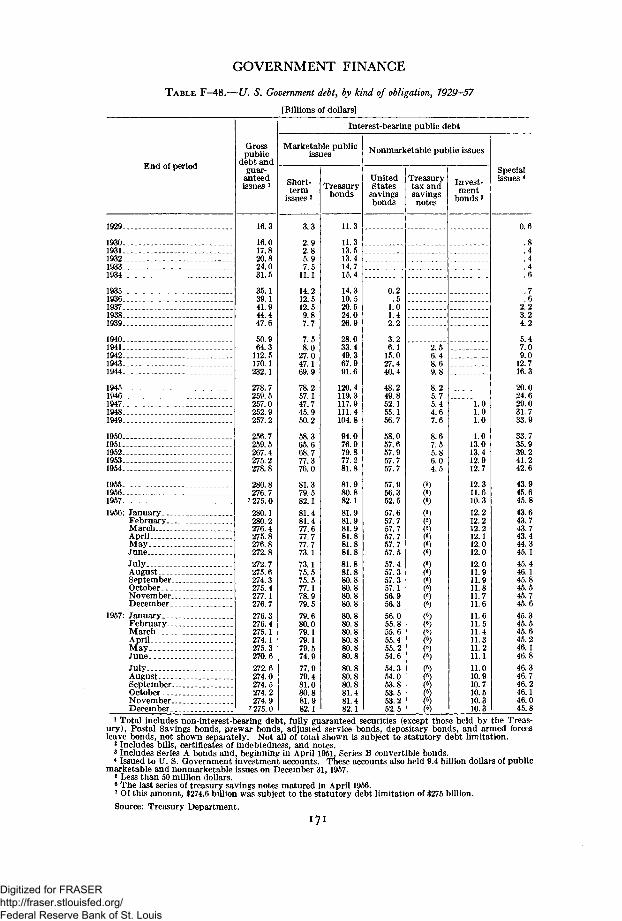
GOVERNMENT FINANCE
TABLE F—48.—U. S. Government debt, by kind of obligation, 1929—57
[Billions of dollars]
End of period
1929
19301931193219331934 .
19351936193719381939
19401941194219431944
19451946194719481949
19501951195219531954
1955195619571956: January. . .
February.MarchAprilMayJuneJulyAugustSeptember..OctoberNovember..December..
1957: JanuaryFebruary...MarchAprilMayJuneJulyAugustSeptember..OctoberNovember..December..
Grosspublic
debt andguar-
anteedissues J
16.3
16.017.820.824.031.5
35.139.141.944.447.6
50.964.3
112.5170.1232.1
278.7259.5257.0252.9257.2
256.7259.5267.4275.2278.8
280.8276.7
7 275.0280.1280.2276.4275.8276.8272.8272.7275.6274.3275.4277.1276.7276.3276.4275.1274.1275.3270.6272.6274.0274.5274.2274.9
7 275.0
Interest-bearing public debt
Marketable publicissues
Short-term
issues2
3.3
2.92.85.97.5
11.1
14.212.512.59.87.7
7.58.0
27.047.1
78.257.147.745.950.2
58.365.668.777.376.0
81.379.582.181.481.477.677.777.773.173.175.575.577.178.979.579.680.079.179.179.574.977.979.481.080.881.982.1
Treasurybonds
11.3
11.313.513.414.715.4
14.319.520.524.026.9
28.033.449.367.991.6
120.4119.3117.9111.4104.8
94.076.979.877.281.8
81.980.882.181.981.981.981.881.881.881.881.8
80.880.880.880.880.8
80.881.481.482.1
Nonmarketable public issues
UnitedStates
savingsbonds
0.2.5
1.01.42.2
3.26.1
15.027.440.4
48.249.852.155.156.7
58.057.657.957.757.7
57.956.352.557.657.757.757.757.757.557.457.357.357.156.956.356.055.855.655.455.254.654.354.053.853.553.252.5
Treasurytax andsavingsnotes
2.56.48.6
8.25.75.44.67.6
8.67.55.86.04.5
Invest-ment
bonds 3
1.01.01.0
1.013.013.412.912.7
12.311.610.312.212.212.212.112.012.012.011.911.911.811.711.611.611.511.411.311.211.111.010.910.710.510.310.3
Specialissues 4
.4
.4
.4
.7
.62.23.24.2
5.47.09.0
12.716.3
20.024.629.031.733.9
33.735.939.241.242.6
43.945.645.843.643.743.743.444.345.145.446.145.845.545.745.6
45.345.545.645.246.146.846.346.746.246.146.045.8
1 Total includes non-interest-bearing debt, fully guaranteed securities (except those held by the Treas-ury), Postal Savings bonds, prewar bonds, adjusted service bonds, depositary bonds, and armed forcesleave bonds, not shown separately. Not all of total shown is subject to statutory debt limitation.
2 Includes bills, certificates of indebtedness, and notes.3 Includes Series A bonds and, beginning in April 1951, Series B convertible bonds.4 Issued to U. S. Government investment accounts. These accounts also held 9.4 billion dollars of public
marketable and nonmarketable issues on December 31, 1957.5 Less than 50 million dollars.6 The last series of treasury savings notes matured in April 1956.7 Of this amount, $274.6 billion was subject to the statutory debt limitation of $275 billion.
Source: Treasury Department.
171
Digitized for FRASER http://fraser.stlouisfed.org/ Federal Reserve Bank of St. Louis
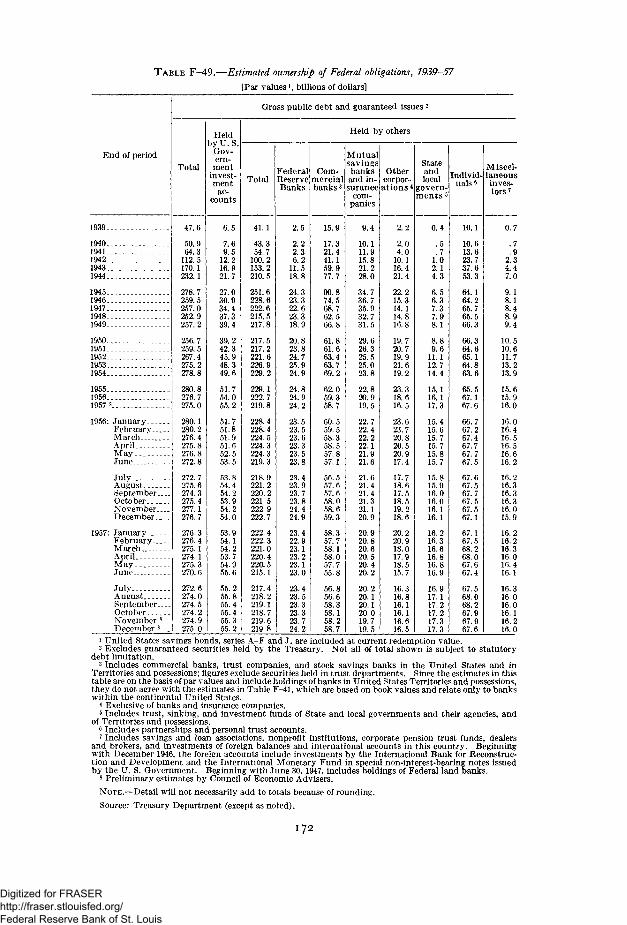
TABLE F-49.—Estimated ownership of Federal obligations, 1939-57
[Par values», billions of dollars]
End of period
1939-
1940.1941-1942-1943-1944-
1945-1946-1947-1948-1949.
1950-1951_1952-1953-1954-
1955-1956-1957 s
1956: JanuaryFebruaryMarchAprilMayJune
JulyAugustSeptemberOctoberNovemberDecember
Gross public debt and guaranteed issues 2
Total
Heldby U.S.
Gov-ern-
mentinvest-ment
ac-counts
47.6
50.964.3
112.5170.1232.1
278.7259.5257.0252.9257.2
256.7259.5267.4275.2278.8
280.8276.7275.0
280.1280.2276.4275.8276.8272.8
272.7275.6274.3275.4277.1276.7
1957: January 276.3February 276.4March 275.1April 274.1May 275.3June 270.6
JulyAugustSeptemberOctoberNovember 8__December s--_
272.6274.0274.5274.2274.9275.0
6.5
7.69.5
12.216.921.7
27.030.934.437.339.4
39.242.345.948.349.6
51.754.055.2
51.751.851.951.652.553.5
53.854.454.253.954.254.0
53.954.154.253.754.955.6
55.255.855.455.455.355.2
Held by others
TotalFederalReserveBanks
41.1
43.354.7
100.2153.2210.5
251.6228.6222.6215.5217.8
217.5217.2221.6226.9229.2
229.1222.7219.8
228.4228.4224.5224.3224.3219.3
218.9221.2220.2221.5222.9222.7
222.4222.3221.0220.4220.5215.1
217.4218.2219.1218.7219.6219.8
Come mercial
banks3
2.5
2.22.36.2
11.518.8
24.323.322.623.318.9
20.823.824.725.924.9
24.824.924.2
23.523.523.623.323.523.8
23.423.923.723.824.424.9
23.422.923.123.223.123.0
23.423.523.323.323.724.2
Mutualsavingsbanksand in-surance
com-panies
15.9
17.321.441.159.977.7
90.874.568.762.566.8
61.861.663.463.769.2
62.059.358.7
60.559.558.358.557.857.1
56.557.657.658.058.659.3
58.357.758.158.057.755.8
56.856.658.358.158.258.7
Stateandlocal
ations * govern-ments 5
9.4
10.111.915.821.228.0
34.736.735.932.731.5
29.626.325.525.023.8
22.820.919.5
22.722.422.222.121.921.6
21.621.421.421.321.120.9
20.920.820.620.520.420.2
20.220.120.120.019.719.5
Othercorpor-
2.2
2.04.0
10.116.421.4
22.215.314.114.816.8
19.720.719.921.619.2
23.318.616.5
23.623.720.820.520.917.4
17.718.617.518.519.218.6
20.220.918.017.918.515.7
16.316.816.116.116.616.5
0.4
.5
.71.02.14.3
6.56.37.37.98.1
9.611.112.714.4
15.116.117.3
15.415.615.715.715.815.7
15.815.916.016.016.116.1
16.216.316.616.816.816.9
16.917.117.217.217.317.3
Individ-
10.1
10.613.623.737.653.3
64.164.265.765.566.3
66.364.665.164.863.6
65.567.167.6
66.767.267.467.767.767.5
67.667.567.767.567.567.1
67.167.568.268.067.667.4
67.568.068.267.967.967.6
Miscel-laneousinves-tors?
.7
.92.34.47.0
9.18.18.48.99.4
10.510.611.713.213.9
15.615.916.0
16.016.416.516.516.616.2
16.216.316.316.316.015.9
16.216.216.316.016.416.1
16.316.016.016.116.216.0
1 United States savings bonds, series A-F and J, are included at current redemption value.2 Excludes guaranteed securities held by the Treasury. Not all of total shown is subject to statutorydebt limitation.3 Includes commercial banks, trust companies, and stock savings banks in the United States and inTerritories and possessions; figures exclude securities held in trust departments. Since the estimates in thistable are on the basis of par values and include holdings of banks in United States Territories and possessions,they do not agree with the estimates in Table F-41, which are based on book values and relate only to bankswithin the continental United States.
4 Exclusive of banks and insurance companies.5 Includes trust, sinking, and investment funds of State and local governments and their agencies, andof Territories and possessions.6 Includes partnerships and personal trust accounts.7 Includes savings and loan associations, nonprofit institutions, corporate pension trust funds, dealersand brokers, and investments of foreign balances and international accounts in this country. Beginningwith December 1946, the foreign accounts include investments by the International Bank for Reconstruc-tion and Development and the International Monetary Fund in special non-interest-bearing notes issuedby the U. S. Government. Beginning with June 30, 1947, includes holdings of Federal land banks.
8 Preliminary estimates by Council of Economic Advisers.NOTE.—Detail will not necessarily add to totals because of rounding.Source: Treasury Department (except as noted).
172
Digitized for FRASER http://fraser.stlouisfed.org/ Federal Reserve Bank of St. Louis

TABLE F-50.—Federal budget receipts and expenditures and the public debt, 1929-1959
[Millions of dollars]
Year
Fiscal year:1929
19301931193219331934
19351936193719381939
19401941194219431944
19451946194719481949
195019511952.19531954
1955 -1956_1957 31958*1959*
Calendar year:19461947 -19481949
19501951195219531954
195519561957 5
Net budgetreceipts 1
3,861
4,0583,1161,9242,0213,064
3,7304,0694,9795,6154,996
5,1447,10312, 55521,98743,635
44, 47539, 77139, 78641, 48837, 696
36, 49547, 56861,39164,82564,655
60,39068,16571,02972, 40074, 400
38, 56840,38940,86437, 514
37,30652, 97964,84063, 84161,171
63,35870,99472, 400
Budget ex-penditures
3,127
3,3203,5774,6594,623
6,5218,4937,7566,7928,858
9,06213,26234, 04679, 40795, 059
98, 41660, 44839, 03233,06939, 507
39, 61744,05865, 40874, 27467, 772
64, 57066, 54069,43372, 78873,934
41,08037,95535,62341,106
37, 72856,33770, 68272, 99764,854
66,12967, 21671,800
Surplus ordeficit ( - )
734
738-462
- 2 , 735- 2 , 602- 3 , 630
- 2 , 791- 4 , 425- 2 , 777-1,177- 3 , 862
- 3 , 918-6,159
- 2 1 , 490-57,420-51,423
-53,941-20 , 676
7548,419
-1,811
-3,1223,510
-4,017- 9 , 449-3,117
-4,1801,6261,596-388
466
-2,5122,4345,241
- 3 , 592
-422- 3 , 358-5,842-9,157-3,683
- 2 , 7713,779
600
Public debtat end of
year 2
16, 931
16,18516, 80119, 48722, 53927, 053
28, 70133, 77936, 42537,16540, 440
42, 96848, 96172, 422136, 696201, 003
258, 682269, 422258, 286252,292252, 770
257,357255,222259,105266, 071271, 260
274,374272, 751270, 527271,200271, 200
259,149256,900252,800257,130
256, 708259,419267, 391275,168278, 750
280, 769276, 628274,898
1 Gross receipts less refunds of receipts and transfers of tax receipts to the Federal old-age and survivorsinsurance trust fund, the Federal disability insurance trust fund, the railroad retirement account, and thehighway trust fund.2 Excludes guaranteed obligations. The change in the public debt from year to year reflects not onlythe budget surplus or deficit but also changes in the Treasury's cash balances, the effect of certain trust fundtransactions, and direct borrowing from the public by certain Government enterprises.
3 Preliminary.* Estimate.5 Estimated by Council of Economic Advisers from data through January 15, 1958. May therefore differ
from figures in Treasury Department monthly statement of receipts and expenditures to be released aboutJanuary 20, 1958.
NOTE.—Detail will not necessarily add to totals because of rounding.Sources: Treasury Department and Bureau of the Budget (except as noted).
173
Digitized for FRASER http://fraser.stlouisfed.org/ Federal Reserve Bank of St. Louis

TABLE F—51.—Federal budget receipts by source and expenditures by function, fiscal years 1946-59
[Millions of dollars]
Fiscalyear
1946194719481949-.-.
19501951195219531954
195519561957 3 . . .1958<-.-1959'-.-
Budget receipts by source
Total
39,77139,78641,48837,696
36,49547, 56861,39164,82564,655
60,39068,16571,02972,40074,400
Indi-vidualincometaxes
16,15717,83519,30515,548
15,74521,64327,91330,10829,542
28,74732,18835,62037,20038,500
Corpo-rationincometaxes
11,8338,5699,678
11,195
10,44814,10621, 22521,23821,101
17,86120,88021,16720,38520,400
Excisetaxes
6,9997,2077,3567,502
7,5498,6488,8519,8689,945
9,1319,9299,0558,8989,280
Allother
re-ceipts i
4,7826,1755,1503,451
2,7523,1713,4013,6104,068
4,6505,1695,1885,9176,220
Budget expenditures by function
Total
60,44839,03233,06939,507
39,61744,05865,40874,27467, 772
64,57066,54069,43372,78873,934
Majorna-
tionalsecurity
43,20714,37211,77112,907
13,00922,44445,96351,83047,872
42,08941,82544,41444,87145,836
Veter-ans'serv-icesand
bene-fits
4,4167,3816,6546,726
6,6465,3424,8634,2984,256
4,4574,7564,7935,0345,012
Agri-cul-tureandagri-
cultu-ral re-sources
7471,243
5752,512
2,783650
1,0452,9362,557
4,4114,9134,5824,9244,601
Inter-est
4,8165,0125,2485,445
5,8175,7145,9346,5836,470
6,4386,8467,3087,8677,869
Allother
expend-itures 2
7,26211,0228,820
11,917
11,3619,9077,6038,6276,618
7,1768,1998,336
10,09110,616
Budgetsurplusor defi-cit ( - )
-20,676754
8,419-1,811
-3,1223,510
-4,0L7-9,449-3,117
-4,1801,6261,596-388
466
1 Includes employment taxes, estate and gift taxes, customs revenues, and miscellaneous receipts.2 Includes expenditures for international affairs and finance (excluding military assistance and defense
support under the mutual security program), labor and welfare, natural resources, commerce and housing,and general government; also includes adjustment to daily Treasury statement (for actuals) and allowancefor proposed legislation and contingencies (for estimates).
3 Preliminary.< Estimate.
NOTE.—Detail will not necessarily add to totals because of rounding.
Sources: Treasury Department and Bureau of the Budget.
174
Digitized for FRASER http://fraser.stlouisfed.org/ Federal Reserve Bank of St. Louis
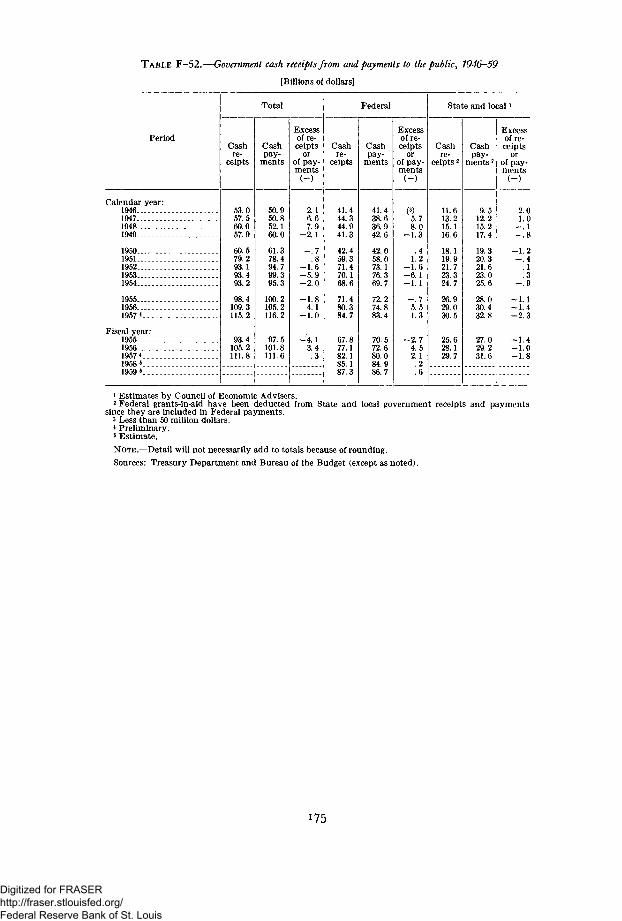
T A B L E F-52.—Government cash receipts from and payments to the public, 1946-59
[Billions of dollars]
Period
Calendar year:1946194719481949
1950195119521953 - .1954
195519561957*
Fiscal year:195519561957*1958 5
1959*
Total
Cashre-
ceipts
53.057.560.057.9
60.579.293.193.493.2
98.4109.3115.2
93.4105.2111.8
Cashpay-
ments
50.950.852.160.0
61.378.494.799.395.3
100.2105.2116.2
97.5101.8111.6
Excessof re-ceipts
orof pay-ments
2.16.67.9
- 2 . 1
- . 7.8
- 1 . 6- 5 . 9- 2 . 0
- 1 . 84.1
- 1 . 0
Z. 4.3
Federal
Cashre-
ceipts
41.444.344.941.3
42.459.371.470.168.6
71.480.384.7
67.877.182.185.187.3
Cashpay-
ments
41.438.636.942.6
42.058.073.176.369.7
72.274.883.4
70.572.680.084.986.7
Excessof re-ceipts
orof pay-ments
5.78.0
- 1 . 3
.41.2
- 1 . 6- 6 . 1- 1 . 1
- . 75.51.3
- 2 . 74.52.1.2.6
State and local*
Cashre-
ceipts 2
11.613.215.116.6
18.119.921.723.324.7
26.929.030.5
25.628.129.7
Cashpay-
ments 2
9.512.215.217.4
19.320.321.623.025.6
28.030.432.8
27.029.231.6
Excessof re-ceipts
orof pay-ments
2.01.0
- . 1- . 8
- 1 . 2- . 4
. 1
.3- . 9
- 1 . 1- 1 . 4- 2 . 3
- 1 . 4- 1 . 0- 1 . 8
1 Estimates by Council of Economic Advisers.2 Federal grants-in-aid have been deducted from State and local government receipts and payments
since they are included in Federal payments.3 Less than 50 million dollars.* Preliminary.8 Estimate.
NOTE.—Detail will not necessarily add to totals because of rounding.
Sources: Treasury Department and Bureau of the Budget (except as noted).
175
Digitized for FRASER http://fraser.stlouisfed.org/ Federal Reserve Bank of St. Louis
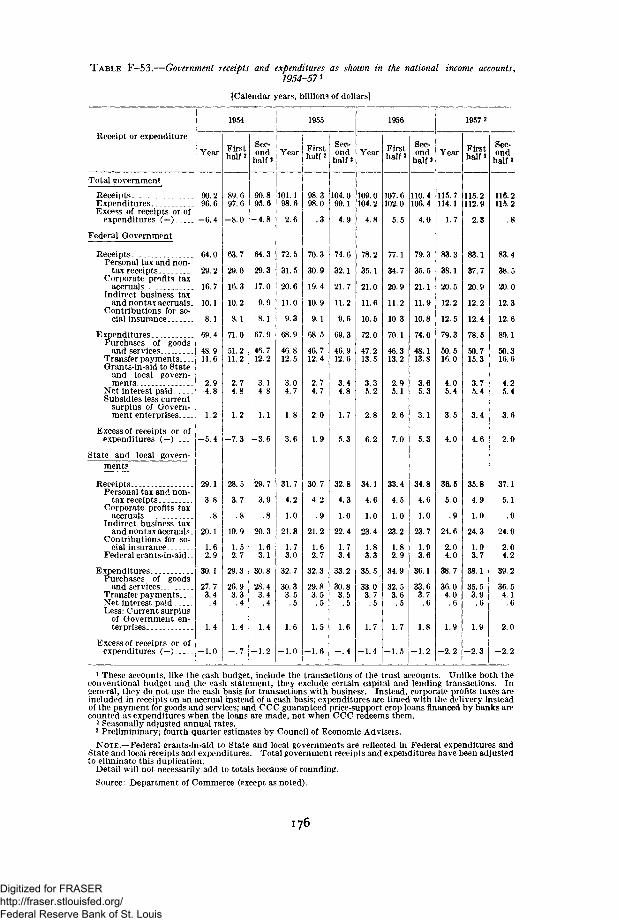
TABLE F—53.—Government receipts and expenditures as shown in the national income accounts,1954-57!
[Calendar years, billions of dollars]
Receipt or expenditure
Total government
ReceiptsE xpendituresExcess of receipts or of
expenditures (-)
Federal Government
ReceiptsPersonal tax and non-
tax receiptsCorporate profits tax
accrualsIndirect business tax
and nontax accruals.Contributions for so-
cial insurance
ExpendituresPurchases of goods
and servicesTransfer paymentsOrants-in-aid to State
and local govern-ments
Net interest paidSubsidies less current
surplus of Govern-ment enterprises
Excess of receipts or ofexpenditures (—).
State and local govern-_____
ReceiptsPersonal tax and non-
tax receiptsCorporate profits tax
accrualsIndirect business tax
and nontax accruals.Contributions for so-
cial insuranceFederal grants-in-aid - -
E xpendituresPurchases of goods
and services. - -Transfer payments. _Net interest paidLess: Current surplus
of Government en-terprises
Excess of receipts or ofexpenditures (—)
Year
90.296.6
64.0
29.2
16.7
10.1
8.1
69.4
48.911.6
2.94.8
1.2
-5.4
29.1
3.8
20.1
1.62.9
30.1
27.73.4
.4
1.4
-1.0
1954
Firsthalf 2
1955
89.697.6
- 8 . 0
63.7
29.0
51.211.2
2.74.8
1.2
- 7 . 3
28.5
19.9
1.52.7
29.3
26.93.3
.4
1.4
Sec-ond
half 2
90.895.6
- 4 . 8
64.3
29.3
17.016.3
10.2
8.1 I 8.1
71.0 67.9
46.712.2
3.14.8
- 3 . 6
29.7
3.9
20.3
1.63.1
30.8
28.43.4
1.4
- 1 . 2
Year
101.198.6
2.G
72.5
31.5
20.6
11.0
9.3
68.9
46.812.5
3.04.7
1.8
3.6
4.2
1.0
21.8
1.73.0
32.7
30.33.5
.5
- 1 . 0
Firsthalf 2
.3
70.3
19.4
10.9
9.1
68.5
46.712.4
2.74.7
2.0
31.7 i 30.7
4.2
21.2
1.62.7
32.3
29.83.5.5
1.5
- i .e
Sec-ond
half 2
104.099.1
4.9
74.6
32.1
21.7
11.2
9.6
69.3
46.912.6
3.44.8
5.3
32.8
4.3
1.0
22.4
1.73.4
33.2
30.83.5
.5
1.6
- . 4
Year
109.0104.2
4.8
78.2
35.1
21.0
11.6
10.5
72.0
47.213.5
3.35.2
2.8
6.2
34.1
4.6
1.0
23.4
1.83.3
35. 5
33.03.7
.5
1.7
- 1 . 4
1956
Firsthalf
J07.6102.0
5.5
77.1
34.7
20.9
11.2
10.3
70.1
46.313.2
2.95.1
2.6
7.0
33.4
4.5
1.0
23.2
1.82.9
34.9
32.53.6
.5
1.7
- 1 . 5
Sec-ond
half >
110.4106.4
4.0
79.3
35.5
21.1
11.9
10.8
74.0
48.113.8
3.65.3
3.1
5.3
34.8
4.6
1.0
23.7
1.93.6
36.1
33.63.7
.6
1.8
- 1 . 2
Year
115. 7114.1
1.7
83.3
38.1
20.5
12.2
12.5
79.3
50.516.0
4.05.4
3.5
4.0
36.6
5.0
. 9
24.6
2.04.0
38.7
36.04.0.6
1.9
- 2 . 2
1957 3
Firsthalf a
115.2112.9
2.3
83.1
37.7
20.9
12.2
12.4
78.5
.50.715.3
3.75.4
3.4
4.6
35.8
4.9
1.0
24.3
1.93.7
38.1
35.53.9.6
1.9
- 2 . 3
Sec-ond
half*
116.2115.2
.8
83.4
38.5
20.0
12.3
12.6
80.1
50.316.6
4.2
5.4
3.6
2.9
37.1
5.1
.9
24.9
2.04.2
39.2
36.54.1
2.0
- 2 . 2
1 These accounts, like the cash budget, include the transactions of the trust accounts. Unlike both theconventional budget and the cash statement, they exclude certain capital and lending transactions. Ingenera], they do not use the cash basis for transactions with business. Instead, corporate profits taxes areincluded in receipts on an accrual instead of a cash basis; expenditures are timed with the delivery insteadof the payment for goods and services; and CCC guaranteed price-support crop loans financed by banks arecounted as expenditures when the loans are made, not when CCC redeems them.
2 Seasonally adjusted annual rates.3 Prelimininary; fourth quarter estimates by Council of Economic Adviseis.
NOTE.—Federal grants-in-aid to State and local governments are reflected in Federal expenditures andState and local receipts and expenditures. Total government receipts and expenditures have been adjustedto eliminate this duplication.
Detail will not necessarily add to totals because of rounding.
Source: Department of Commerce (except as noted).
I 76
Digitized for FRASER http://fraser.stlouisfed.org/ Federal Reserve Bank of St. Louis

T A B L E F—54.—Reconciliation of Federal Government receipts and expenditures as shown in thenational income accounts with receipts and expenditures as reported in the consolidated cash state-ment and the conventional budget^ fiscal years 1955-57
[Fiscal years, billions of dollars]
Receipts or expenditures 1955 1956 1957
National income accounts
Receipts
Expenditures
Excess of receipts or of expenditures (—)
Reconciliation of receipts
Receipts as shown in the national income accounts
Less:Excess of taxes included in national income accounts over cash collections:
PersonalCorporate profitsOther
Federal Government contributions to:Employee retirement fundsVeterans life insurance funds
Federal Government employee contributions to employee retirement funds.
67.268.1
- 1 . 0
76.169.7
Plus:Realization upon loans and investmentsInterest, dividends, and other earningsProceeds from sale of Government property.Recoveries and refundsDistrict of Columbia revenuesMiscellaneous adjustments
Equals: Federal receipts from the public (consolidated cash receipts)
Less: Trust fund receipts
Plus:Intragovernmental transactions
Receipts from exercise of monetary authority
Equals: Conventional budget receipts
Reconciliation of expenditures
Expenditures as shown in the national income accountsLess:
Federal Government contributions to:Employee retirement fundsVeterans life insurance funds
Federal Government employee contributions to employee retirement funds.Accrued interest on savings bonds and Treasury billsCommodity Credit Corporation guaranteed nonrecourse loans (net change).Miscellaneous adjustments
67.2
.3
.4
.4
.6
.2
.2
67.8
9.5
2.1.0
60.4
Plus:Loans and other adjustments, government enterprises
Federal National Mortgage Association secondary market operations. __Other
Interest received and proceeds of government sales netted out of nationalincome expenditures
District of Columbia expendituresPurchase of land and existing assetsTrust and deposit fund expenditures, not included in national income
expenditures.Miscellaneous adjustments
Decrease in clearing accountIssuance of International Monetary Fund notesOther
Equals: Federal payments to the public (consolidated cash expenditures)
Less:Trust fund expendituresGovernment-sponsored enterprise expenditures (net)
Plus:Intragovernmental transactions rAccrued interest and other noncash expenditures (net)
Equals: Conventional budget expenditures
68.1
.0
.1
.5
.5- 1 . 0- . 4
.9- . 11.0
.2
.1
.5- . 2
.1- . 2- . 1
70.5
8.5.1
2.1.6
6.4
76.1
.3
.4
.5
.6
.2
.3
77.1
11.7
2.7.0
68.2
69.7
.2
.1
.6
.4- . 4
1.7.1
1.6
.2
.1
.8- . 2- . 3- . 2
.3
72.6
9.4.3
2.7.9
81.476.2
5.3
81.4
- . 2- . 3
.6
.5
.0
.7
.3
.5
.4
.4
.2
.1
82.1
3.2.0
71.0
76.2
.5
.0
.7
.6- . 2
.4
2.71.01.7
.2
.1
.51.7
.7
.3
64.6 66.5
13.0.0
3.2- . 8
69.4
NOTE.—Detail will not necessarily add to totals because of rounding.
Sources: Department of Commerce, Bureau of the Budget, and Treasury Department.
177
Digitized for FRASER http://fraser.stlouisfed.org/ Federal Reserve Bank of St. Louis

TABLE F—55.—State and local government revenues and expenditures, selected fiscal years, 1927-56
[Millions of dollars]
Fiscal year 1
1927
1932193419361938 .
19401942194419461948
1950195219531954
1955.1956
Revenues by source 2
Total
7,271
7,2677,7138,5049,228
9,60910,41810,90812,35717,251
20,91125,18127, 30629,013
31,07334,667
Prop-ertytaxes
4,730
4,4874,0764,0934,440
4,4304,5374,6044,9866,126
7,3498,6529,3759,967
10,73511, 749
Salesandgross
re-ceiptstaxes
470
7521,0081,4841,794
1,9822,3512,2892,9864,442
5,1546,3576,9277,276
7,6438,691
Indi-vidualincometaxes
70
7480
153218
224276342422543
788998
1,0651,127
1,2371,538
Corpo-ration
netincometaxes
92
7949
113165
156272451447592
593846817778
744890
Reve-nuefromFed-eralGov-ern-
ment
116
2321,0511,057
800
945858954855
1,861
2,4862,5662,8702,966
3,1313,335
Allotherreve-nue 3
1,793
1,6431,4491,6041,811
1,8722,1232,2692,6613,685
4,5415,7636,2516,897
7,5848,465
Expenditures by function 2
Total
7,210
7,7657,1817,6448,757
9,2299,1908,863
11,02817,684
22, 78726,09827, 91030,701
33,72436,711
Edu-cation
2,235
2,3111,8312,1772,491
2,6382,5862,7933,3565,379
7,1778,3189,390
10,557
11,90713,220
High-ways
1,809
1,7411,5091,4251,650
1,5731,4901,2001,6723,036
3,8034,6504,9875,527
6,4526,953
Publicwel-fare
151
444889827
1,069
1,1561,2251,1331,4092,099
2,9402,7882,9143,060
3,1683,139
Allo the r 4
3,015
3,2692,9523,2153, .547
3,8623,8893,7374,5917,170
8,86710,34010,61911, 556
12,19613,397
1 Fiscal years not the same for all governments.2 Excludes revenues or expenditures of publicly owned utilities and liquor stores, and of insurance-trust
activities. Intergovernmental receipts and payments between governments in these categories are alsoexcluded.
3 Includes licenses and other taxes and charges and miscellaneous revenues.4 Includes expenditures for health, hospitals, police, local fire protection, natural resources, sanitation,
housing and community redevelopment, local recreation, general control, interest on general debt, andother and unallocable expenditures.
NOTE.—Data are not available for intervening years.See Table F-47 for net debt of State and local governments.Detail will not necessarily add to total because of rounding.
Source: Department of Commerce (Bureau of the Census).
178
Digitized for FRASER http://fraser.stlouisfed.org/ Federal Reserve Bank of St. Louis
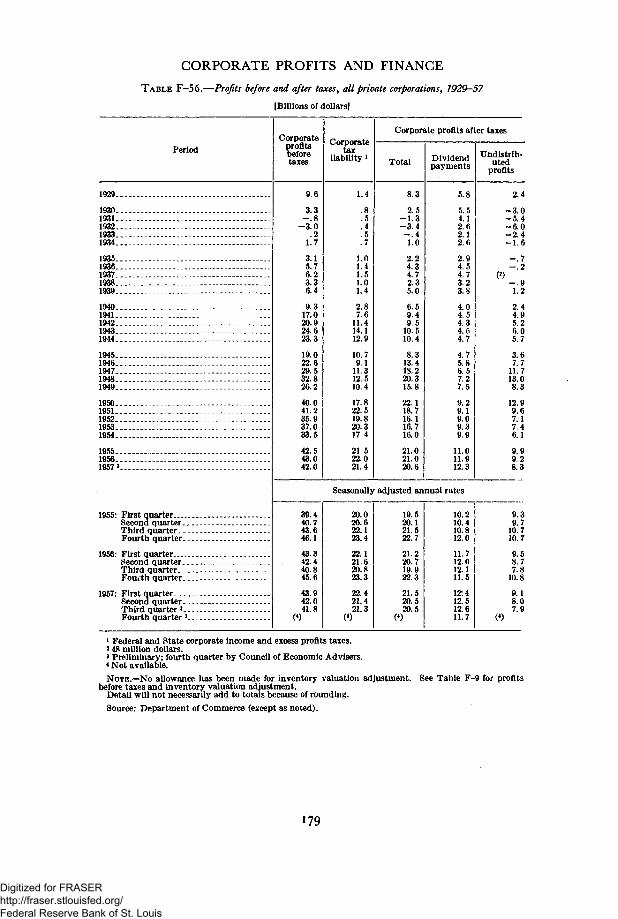
CORPORATE PROFITS AND FINANCE
TABLE F-56.—Profits before and after taxes, all private corporations, 1929—57
[Billions of dollars]
PeriodCorporate
profitsbeforetaxes
Corporatetax
liability »
Corporate profits after taxes
Total Dividendpayments
Undistrib-uted
profits
1929.
1930.1931.1932.1933.1934.
1935.1936.1937.1938.1939.
1040.1941.1942.1943.1914..
1945..1946..1947..1948..1949..
1950.1951..1952..1953..1954..
1955..1956..1957 3
1955: First quarterSecond quarter..Third quarter. _.Fourth quarter..
1956: First quarterSecond quarter..Third quarter...Fourth quarter..
1957: First quarterSecond quarter .Third quarter3..Fourth quarter 3.
9.6
3.3- . 8
- 3 . 0.2
1.7
3.15.76.23 46.49.3
17.020.924.623.3
19.022.629.532.826.2
40.041.235.937.033.5
42.543.042.0
1.4
.8
.5
.4
.5
.7
1.01.41.51.01.4
2.87.6
11.414.112.9
10.79.1
11.312.510.4
17.822.519.820.317.4
21.522.021.4
8.3
2.5- 1 . 3- 3 . 4- . 41.0
2.24.34.72.35.0
6.59.49.5
10.510.4
8.313.418.220.315.8
22.118.716.116.716.0
21.021.020.6
5.8
5.54.12.62.12.6
2.94.54.73.23.8
4.04.54.34.54.7
4.75.86.57.27.5
9.29.19.09.39.9
11.011.912.3
Seasonally adjusted annual rates
10.210.410.812.0
11.712.012.111.5
12:412.512.611.7
2.4
- 3 . 0- 5 . 4- 6 . 0- 2 . 4- 1 . 6
- . 7- . 2
- . 91.2
2.44.95.26.05.7
3.67.7
11.713.08.3
12.99.67.17.46.1
9.99.28.3
9.39.7
10.710.7
9.58.77.8
10.8
9.18.07.9
1 Federal and State corporate income and excess profits taxes.* 48 million dollars.3 Preliminary; fourth quarter by Council of Economic Advisers.< Not available.NOTE.—No allowance has been made for inventory valuation adjustment. See Table F-9 for profits
before taxes and inventory valuation adjustment.Detail will not necessarily add to totals because of rounding.
Source: Department of Commerce (except as noted).
179
Digitized for FRASER http://fraser.stlouisfed.org/ Federal Reserve Bank of St. Louis
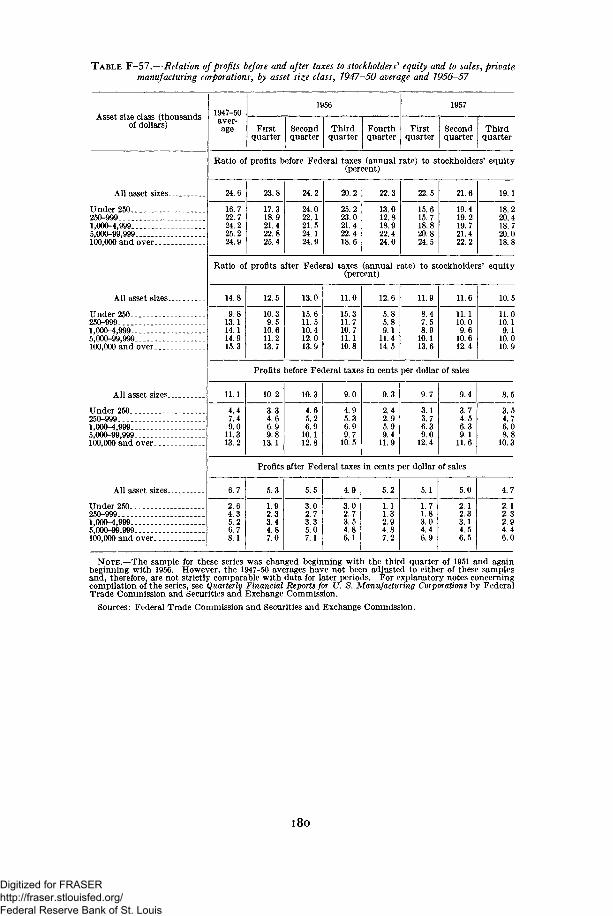
TABLE F—57.—Relation of profits before and after taxes to stockholders'' equity and to sales, privatemanufacturing corporations, by asset size class, 1947-50 average and 1956—57
Asset size class (thousandsof dollars)
All asset sizes
Under 250250-9991,000-4,9995,000-99,999100,000 and over
All asset sizes
Under 250250-9991,000-4,9995,000-99,999100,000 and over
All asset sizes
Under 250250-9991,000-4,9995,000-99,999100,000 and over
All asset sizes
Under 250250-9991,000-4,9995,000-99,999100,000 and over
1947-50aver-age
Ratio oi
24.6
16.722.724.225.224.9
Ratio ol
14.8
9.813.114.114.915.3
1956
Firstquarter
Secondquarter
Thirdquarter
Fourthquarter
profits before Federal taxes (annual(percent)
23.8
17.318.921.422.825.4
24.2
24.022.121.524.124.9
20.2
25.223.021A22.418.6
22.3
13.012.818.922.424.0
1957
Firstquarter
Secondquarter
Thirdquarter
rate) to stockholders' equity
22.5
15.615.718.820.824.5
21.6
19.419.219.721.422.2
r profits after Federal taxes (annual rate) to stockholder(percent)
12.5
10.39.5
10.611.213.7
13.0
15.611.510.412.013.9
11.0
15.311.710.711.110.8
12.6
5.85.89.1
11.414.5
11.9
8.47.58.9
10.113.6
11.6
11.110.09.6
10.612.4
19.1
18.220.418.720 018.8
s' equity
10.5
11.010.19.1
10.010.9
Profits before Federal taxes in cents per dollar of sales
11.1
4.47.49.0
11.313.2
6.7
2.64.35.26.78.1
10.2
3.34.66.99.8
13.1
10.3
4.65.26.9
10.112.8
9.0
4.95.36.99.7
10.5
9.3
2.42.95.99.4
11.9
9.7
3.13.76.39.0
12.4
9.4
3.74.56.39.1
11.6
Profits after Federal taxes in cents per dollar of sales
5.3
1.92 S3.44.87.0
5.5
3.02.73.35.07.1
4.9
3.02.73.54.86.1
5.2
1.11.32.94.87.2
5.1
1.71.83.04.46.9
5.0
2.12.33.14.56.5
8.5
3.54.76.08.8
10.3
4.7
2.12.32.94.46.0
NOTE.—The sample for these series was changed beginning with the third quarter of 1951 and againbeginning with 1956. However, the 1947-50 averages have not been adjusted to either of these samplesand, therefore, are not strictly comparable with data for later periods. For explanatory notes concerningcompilation of the series, see Quarterly Financial Reports for U. S. Manufacturing Corporations by FederalTrade Commission and Securities and Exchange Commission.
Sources: Federal Trade Commission and Securities and Exchange Commission.
180
Digitized for FRASER http://fraser.stlouisfed.org/ Federal Reserve Bank of St. Louis
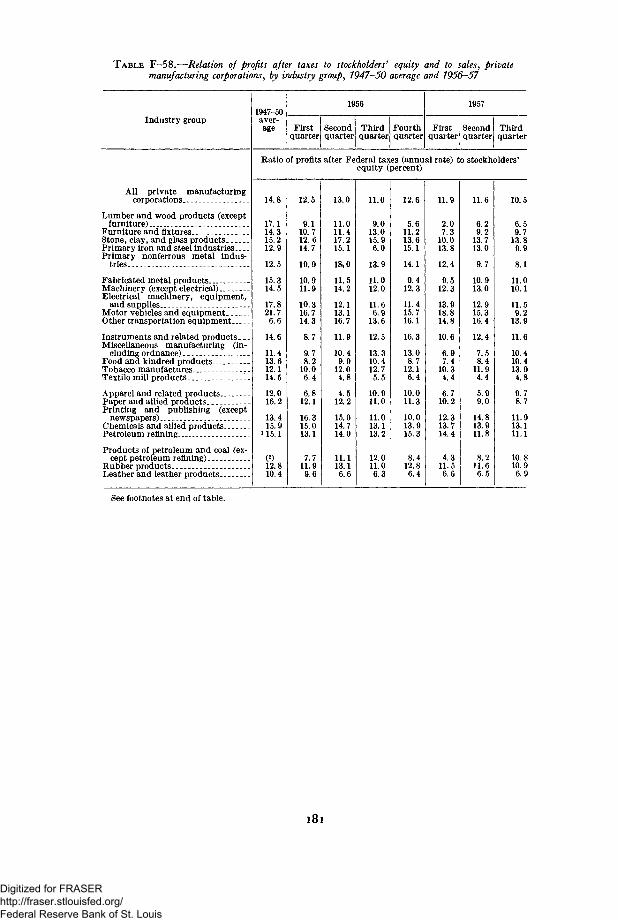
TABLE F-58.—Relation of profits after taxes to stockholders'1 equity and to sales, privatemanufacturing corporations, by industry group, 1947-50 average and 7956-57
Industry group1947-50aver-
1956
First iquarter
Second,quarter
Thirdquarter
Fourthquarter
1957
Firstquarter
Second iquarter
Thirdquarter
Ratio of profits after Federal taxes (annual rate) to stockholders'equity (percent)
All private manufacturingcorporations
Lumber and wood products (exceptfurniture)
Furniture and fixturesStone, clay, and glass productsPrimary iron and steel industriesPrimary nonferrous metal indus-
tries
Fabricated metal productsMachinery (except electrical)Electrical machinery, equipment,
and suppliesMotor vehicles and equipmentOther transportation equipment
Instruments and related products. _.Miscellaneous manufacturing (in-
cluding ordnance)Food and kindred productsTobacco manufacturesTextile mill products 1.
Apparel and related productsPaper and allied productsPrinting and publishing (except
newspapers)Chemicals and allied productsPetroleum refining
Products of petroleum and coal (ex-cept petroleum refining)
Rubber productsLeather and leather products
14.8
17.114.315.212.9
12.5
15.314.5
17.821.76.6
14.6
11.413.612.114.5
12.016.2
13.415.9
115.1
(2)12.810.4
12.5
9.110.712.614.7
19.9
10.911.9
10.316.714.3
8.7
9.78.2
10.06.4
6.812.1
16.315.013.1
7.711.99.6
13.0
11.011.417.215.1
18,0
11.514.2
12.113.116.7
11.9
10.49.9
12.04.8
4.512.2
15.014.714.0
11.113.16.6
11.0
9.013.015.96.0
13.9
11.012.0
11.66.9
13.6
12.5
13.310.412.75.5
10.911.0
11.013.113.2
12.011.06.3
12.6
5.611.213.615.1
14.1
9.412.3
11.415.716.1
16.3
13.08.7
12.16.4
10.011.3
10.013.915.3
8.412.86.4
11.9
2.07.3
10.013.8
12.4
9.512.3
13.918.814.8
10.6
6.97.4
10.34.4
6.710.2
12.313.714.4
4.311.56.6
11.6
6.29.2
13.713.0
9.7
10.913.0
12.915.316.4
12.4
7.58.4
11.94.4
5.99.0
14.813.911.8
8.211.66.5
10.5
6.59.7
13.8
8.1
11.010.1
11.59.2
13.9
11.6
10.410.413.94.8
9.78.7
11.913.111.1
10.810.9
See footnotes at end of table.
181
Digitized for FRASER http://fraser.stlouisfed.org/ Federal Reserve Bank of St. Louis
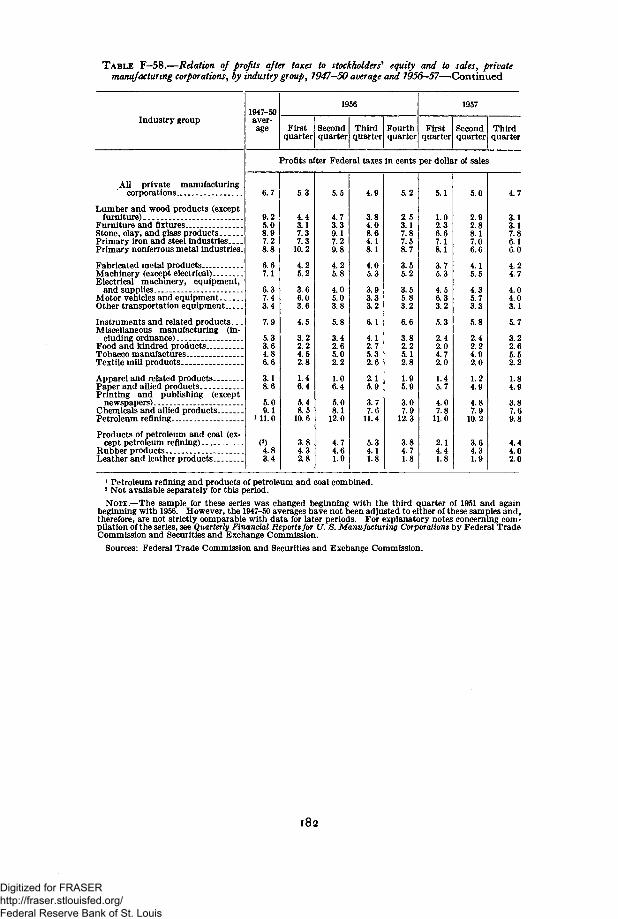
TABLE F-58.—Relation of profits after taxes to stockholders* equity and to sales, privatemanufacturing corporations^ by industry group, 7947-50 average and 1956-57—Continued
Industry group1947-50aver-age
1956
Firstquarter
Secondquarter
Thirdquarter
Fourthquarter
1957
Firstquarter
Secondquarter
Thirdquarter
All private manufacturingcorporations _..
Lumber and wood products (exceptfurniture) -
Furniture and fixturesStone, clay, and glass productsPrimary iron and steel industriesPrimary nonferrous metal industries
Fabricated metal productsMachinery (except electrical)Electrical machinery, equipment,
and supplies _Motor vehicles and equipmentOther transportation equipment
Instruments and related products...Miscellaneous manufacturing (in-
cluding ordnance)Food and kindred productsTobacco manufactures _.Textile mill products
Apparel and related products. _Paper and allied productsPrinting and publishing (except
newspapers)Chemicals and allied productsPetroleum refining.
Products of petroleum and coal (ex-cept petroleum refining).
Rubber productsLeather and leather products
6.7
9.25.08.97.28.8
6.67.1
6.37.43.4
7.9
5.33.64.86.6
3.18.6
5.09.1
111.0
(2)4.83.4
Profits after Federal taxes in cents
5.3
4.43.17.3
10.2
4.25.2
3.66.03.6
4.5
3.22.24.52.8
1.46.4
5.48.5
10.6
3.84.32.8
5.5
4.73.39.1
9.8
4.25.8
4.05.03.8
5.8
3.42.65.02.2
1.06.4
5.08.1
12.0
4.74.61.9
4.9
3.84.08.6
8.1
4.05.3
3.93.33.2
6.1
4.12.75.32.6
2.15.9
3.77.6
11.4
5.34.11.8
5.2
2.53.17.8
8.7
3.55.2
3.55.83.2
6.6
3.82.25.12.8
1.95.9
3.07.9
12.3
3.84.71.8
per dollar of sales
5.1
1.02.36.6
8.1
3.75.3
4.56.33.2
5.3
2.42.04.72.0
1.45.7
4.07.8
11.0
2.14.41.8
5.0
2.92.88.1
6.6
4.15.5
4.35.73.3
5.8
2.42.24.92.0
1.24.9
4.87.9
10.2
3.64.31.9
4.7
3.13.17.86.16.0
4.24.7
4.04.03.1
5.7
3.22.65.52.2
1.84.9
3.87.6
4.44.02.0
1 Petroleum refining and products of petroleum and coal combined.2 Not available separately for this period.NOTE.—The sample for these series was changed beginning with the third quarter of 1951 and again
beginning with 1956. However, the 1947-50 averages have not been adjusted to either of these samples and,therefore, are not strictly comparable with data for later periods. For explanatory notes concerning com-pilation of the series, see Quarterly Financial Reports for U. S. Manufacturing Corporations by Federal TradeCommission and Securities and Exchange Commission.
Sources: Federal Trade Commission and Securities and Exchange Commission.
182
Digitized for FRASER http://fraser.stlouisfed.org/ Federal Reserve Bank of St. Louis
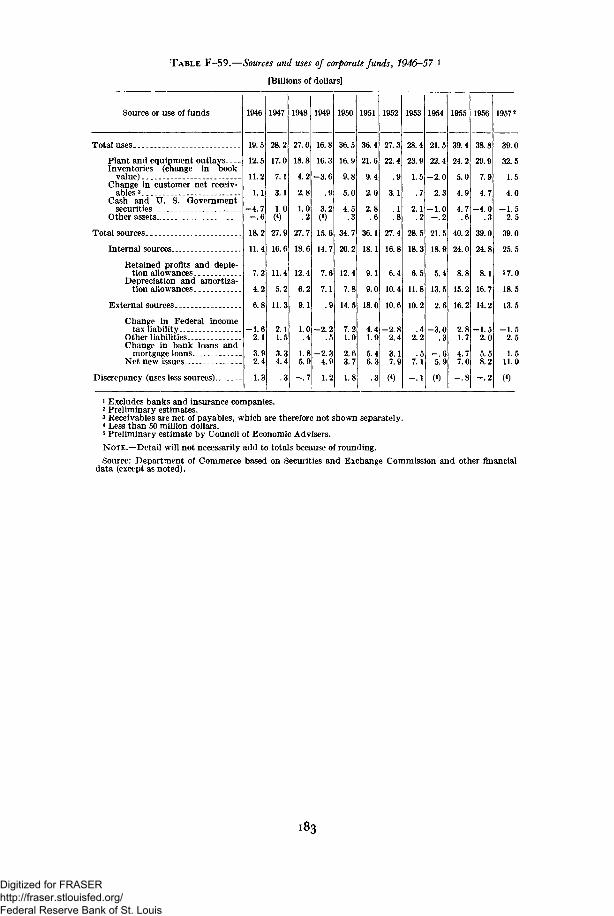
TABLE F-59.—Sources and uses of corporate funds, 1946-57 l
[Billions of dollars]
Source or use of funds
Total uses.
Plant and equipment outlaysInventories (change in book
value)Change in customer net receiv-
ables 3Cash and U. S. Government
securitiesO ther assets
Total sources
Internal sources..
Retained profits and deple-tion allowances
Depreciation and amortiza-tion allowances
External sources
Change in Federal incometax liability
Other liabilitiesChange in bank loans and
mortgage loansNet new issues
Discrepancy (uses less sources)..
1946
19.5
12.5
11.2
1.1
-4.7-.6
18.2
11.4
7.2
4.2
6.8
-1.62.1
3.92.4
1.3
1947
28.2
17.0
7.1
3.1
1.0(4)
27.9
16.6
11.4
5.2
11.3
2.11.5
3.34.4
.3
1948
27.0
18.8
4.2
2.8
1.0.2
27.7
18.6
12.4
6.2
9.1
1.0.4
1.85.9
-.7
1949
16.8
16.3
-3.6
.9
3.2(4)
15.6
14.7
7.6
7.1
.9
-2.2.5
-2.34.9
1.2
1950
36.5
16.9
9.8
5.0
4.5.3
34.7
20.2
12.4
7.8
14.5
7.21.0
2.63.7
1.8
1951
36.4
21.6
9.4
2.0
2.8.6
36.1
18.1
9.1
9.0
18.0
4.41.9
5.46.3
.3
1952
27.3
22.4
.9
3.1
.1
.8
27.4
16.8
6.4
10.4
10.6
-2.82.4
3.17.9
(4)
1953
28.4
23.9
1.5
.7
2.1.2
28.5
18.3
6.5
11.8
10.2
.42.2
.57.1
-.1
1954
21.5
22.4
-2.0
2.3
-1.0-.2
21.5
18.9
5.4
13.5
2.6
-3.0.3
-.65.9
(4)
1955
39.4
24.2
5.0
4.9
4.7.6
40.2
24.0
8.8
15.2
16.2
2.81.7
4.77.0
-.8
1956
38.8
29.9
7.9
4.7
-4.0.3
39.0
24.8
8.1
16.7
14.2
-1.52.0
5.58.2
-.2
19572
39.0
32.5
1.5
4.0
- 1 . 52.5
39.0
25.5
»7.0
18.5
13.5
2.5
1.511.0
1 Excludes banks and insurance companies.2 Preliminary estimates.3 Receivables are net of payables, which are therefore not shown separately.* Less than 50 million dollars.^ Preliminary estimate by Council of Economic Advisers.
NOTE.—Detail will not necessarily add to totals because of rounding.
Source: Department of Commerce based on Securities and Exchange Commission and other financialdata (except as noted).
183
Digitized for FRASER http://fraser.stlouisfed.org/ Federal Reserve Bank of St. Louis
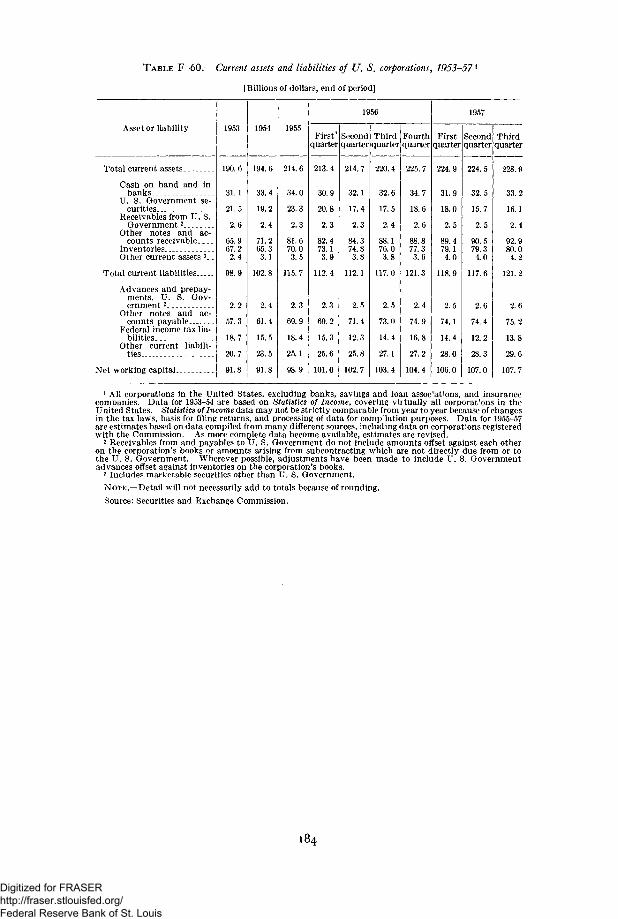
TABLE F-60.—Current assets and liabilities of U. S. corporations, 1953-57 *
[Billions of dollars, end of period]
Asset or liability
Total current assetsCash on hand and in
banksU. S. Government se-
curitiesReceivables from U. S.
Government2
Other notes and ac-counts receivable
InventoriesOther current assets 3.
Total current liabilities
Advances and prepay-ments, U. S. Gov-ernment 2
Other notes and ac-counts payable
Federal income tax lia-bilities
Other current liabili-ties
Net working capital
1953
190.6
31.1
21.5
2.6
65.967.22.4
98.9
2.2
57.3
18.7
20.7
91.8
1954
194.6
33.4
19.2
2.4
71.265.33.1
102.8
2.4
61.4
15.5
23.5
91.8
1955
214.6
34.0
23.3
2.3
81.670.03.5
115.7
2.3
69.9
18.4
25.1
98.9
1956
First*quarter
213.4
30.9
20.8
2.3
82.473.13.9
112.4
2.3
69.2
15.3
25.6
101.0
Secondquarter
214.7
32.1
17.4
2.3
84.374.83.8
112.1
2.5
71.4
12.3
25.8
102.7
Thirdquarter
220.4
32.6
17.5
2.4
88.176.03.8
117.0
2.5
73.0
14.4
27.1
103.4
Fourthquarter
225.7
34.7
18.6
2.6
88.877.33.6
121.3
2.4
74.9
16.8
27.2
104.4
1957
Firstquarter
224.9
31.9
18.0
2.5
89.479.14.0
118.9
2.5
74.1
14.4
28.0
106.0
Secondquarter
224.5
32.5
15.7
2.5
90.579.34.0
117.6
2.6
74.4
12.2
28.3
107.0
Thirdquarter
228.9
33.2
16.1
2.4
92.980.04.2
121.2
2.6
75.2
13.8
29.6
107.7
1 All corporations in the United States, excluding banks, savings and loan associations, and insurancecompanies. Data for 1953-54 are based on Statistics of Income, covering virtually all corporat'ons in theUnited States. Statistics of Income data may not be strictly comparable from year to year because of changesin the tax laws, basis for filing returns, and processing of data for comp lation purposes. Data for 1955-57are estimates based on data compiled from many different sources, including data on corporations registeredwith the Commission. As more complete data become available, estimates are revised.
2 Receivables from and payables to U. S. Government do not include amounts offset against each otheron the corporation's books or amounts arising from subcontracting which are not directly due from or tothe U. S. Government. Wherever possible, adjustments have been made to include U. S. Governmentadvances offset against inventories on the corporation's books.
3 Includes marketable securities other than U. S. Government.
NOTE.—Detail will not necessarily add to totals because of rounding.
Source: Securities and Exchange Commission.
184
Digitized for FRASER http://fraser.stlouisfed.org/ Federal Reserve Bank of St. Louis
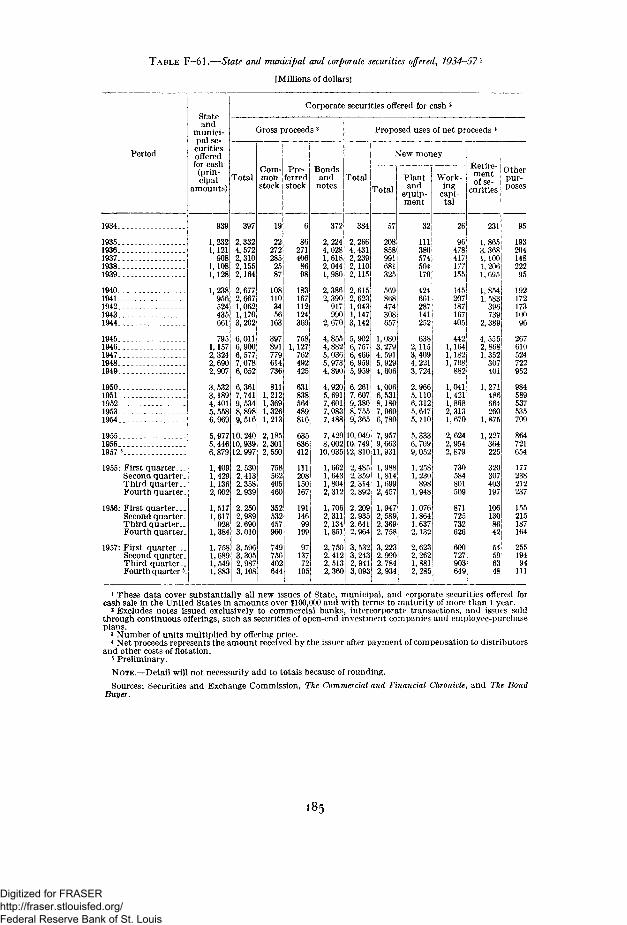
T A B L E F-61.—State and municipal and corporate securities offered, 1934-57'*
[Millions of dollars]
Period
Stateand
munici-pal se-curitiesofferedfor cash(prin-cipal
amounts)Total
Corporate securities offered for cash 2
Gross proceeds 3
Com-monstock
Pre-ferredstock
Bondsand
notesTotal
Proposed uses of net proceeds *
New money
Total
57
208858991681325
569868474308657
1,0803,2794,5915,9294,606
4,0066,5318,1807,9606,780
7,9579,663
11,931
1,9881,8141,6992,457
1,9472,5892,3692,758
3,2232,9902,7842,934
Plantand
equip-ment
32
111380574504170
424661287141252
6382,1153,4094,2213,724
2.9665,1106,3125,6475,110
5, 3336,7099,052
1,2581,230
8981,948
1.0761,8641,6372,132
2,6232.2621,8812,285
Work-ing
capi-tal
Retire-mentof se-
curities
Otherpur-poses
1934
19351936193719381939
19401941194219431944
19451946194719481949
19501951195219531954
195519561957 5
1955: First quarter._Second quarter.Third quarter._Fourth quarter
1956: First quarter. _.Second quarter.Third quarter..Fourth quarter.
1957: First quarter . .Second quarter.Third quarter-.Fourth quarter
939
1,2321,121908
1,1081,128
1,238956524435661
7951,1572,3242,6902,907
3,5323,1894,4015,5586"~"
397
2,3324,5722,3102,1552,164
2,6772,6671,0621,1703,202
6,0116,9006,5777,0786,052
6,3617,7419,5348,8989,516
5,977 10, 2405, 446 10,9396, 879 12, 997
1,4091,4291,1362,002
1,5171,617928
1,384
1, 7581,6891,5491,883
2,5302,4132,3582,939
2,2502,9892,6903,010
3,5963,3052,9873,108
222722852587
1081103456163
397891779614736
8111,2121,3691,3261,213
2,1852,3012,550
758562405460
352532457960
74975640:644
271406
183167112124
7581,127762492425
631838564489816
635636412
111208150167
19114699199
9713772105
372
2,2244,0281,6182,0441,980
2,3862,390
91"990
2,670
4,8554,8825,0365,9734, 890
4,9205,6917,6017,0837,488
384
2,2664,4312,2392,1102,115
2,6152,6231,0431,1473,142
5,9026,7576,4666,9595,959
6,2617,6079,3808, 7559,365
7, 420 10, 0498, 002 10, 74910,035 12, 810
1,6621,6431,8042,312
1,7062,3112,1341,851
2,7502,4122,5132,360
2, 4852,3592,3142,892
2,2092,9352,6412,964
3,5323,2432,9413,093
26
96!478!417177155
145J207187)16714051
, |1,182i1, 708882
1,04111, 42l|1, 868j2, 313i1, 670;
2,6242,954!2, 8791
730584801,5091
871 j725732626
600
90316491
231
1, 865|3,3681,1001, 206!l,69oj
1,8541,583396739
2, 3891
4, 555]2, 868:1,352307!401
1, 271486664260
1,875
1,227364225
320!307403197
10613086421
545963!
95
19320414822295
19217217310096
267610524722952
984589537535709
864721654
177238212237
155215187164
25519494111
1 These data cover substantially all new issues of State, municipal, and corporate securities offered forcash sale in the United States in amounts over $100,000 and with terms to maturity of more than 1 year.
2 Excludes notes issued exclusively to commercial banks, intercorporate transactions, and issues soldthrough continuous offerings, such as securities of open-end investment companies and employee-purchaseplans.
3 Number of units multiplied by offering price.4 Net proceeds represents the amount received by the issuer after payment of compensation to distributors
and other costs of flotation.5 Preliminary.
NOTE.—Detail will not necessarily add to totals because of rounding.
Sources: Securities and Exchange Commission, The Commercial and Financial Chronicle, and The BondBuyer.
185
Digitized for FRASER http://fraser.stlouisfed.org/ Federal Reserve Bank of St. Louis
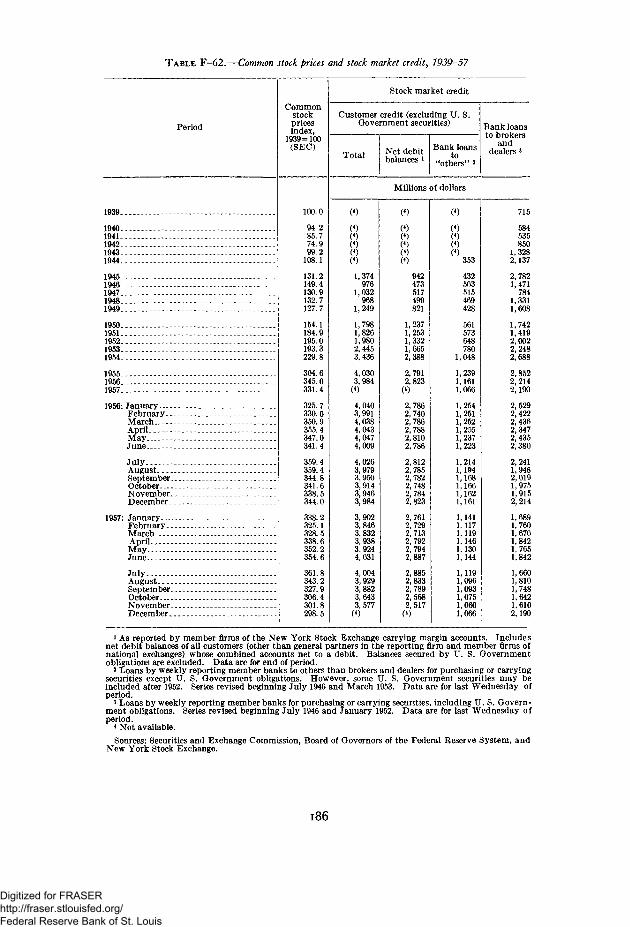
TABLE F-62.—Common stock prices and stock market credit, 1939-57
Period
Commonstockpricesindex,
1939=100(SEC)
Stock market credit
Customer credit (excluding U. S.Government securities)
Total Net debitbalances J
Bank loansto
"others" 3
Bank loansto brokers
anddealers *
Millions of dollars
1939
19401941194219431944
19451946194719481949
19601951195219531954
195519561957
1956: January.-.-February..MarchAprilMayJune
JulyAugustSeptember.October.—November.December _
1957: January—February..MarchAprilMayJune
JulyAugustSeptember.October---.November.December.
100.0
94.285.774.999.2
108.1
131.2149.4130.9132.7127.7
154.1184.9195.0193.3229.8
304.6345.0331.4
325.7330.0350.9355.4347.0341.4
359.4359.4344.8341.6338.5344.0
338.2325.1328.5338.6352.2354.6
361.8343.2327.9306.4301.8298.5
(*)0)(4)
1,374976
1,032968
1,249
1,7981,8261,9802,4453,436
4,0303,984
()
4,0403,9914,0384,0434,0474,009
4,0263,9793,9503,9143,9463,984
3,9023,8463,8323,9383,9244,031
4,0043,9293,8823,6433,577
942473517499821
1,2371,2531,3321,6652,388
2,7912,823)
2,7862,7402,7862,7882,8102,786
2,8122,7852,7822,7482,7842,823
2,7612,7292,7132,7922,7942,887
2,8852,8332,7892,5682,517
()
()353
432503515469428
561573648780
1,048
1,2391,1611,066
1,2541,2511,2521,2551,2371,223
1,2141,1941,1681,1661,1621,161
1,1411,1171,1191,1461,1301,144
1,1191,0961,0931,0751,0601,066
715
584535850
1,3282,137
2,7821,471784
1,3311,608
1,7421,4192,0022,2482,688
2,8522,2142,190
2,5292,4222,4362,3472,4352,380
2,2411,9482,0191,9751,9152,214
1,6891,7601,6701,8421,7651,842
1,6601,8101,7481,6421,6102,190
1 As reported by member firms of the New York Stock Exchange carrying margin accounts. Includesnet debit balances of all customers (other than general partners in the reporting firm and member firms ofnational exchanges) whose combined accounts net to a debit. Balances secured by U. S. Governmentobligations are excluded. Data are for end of period.
2 Loans by weekly reporting member banks to others than brokers and dealers for purchasing or carryingsecurities except U. S. Government obligations. However, some U. S. Government securities may beincluded after 1952. Series revised beginning July 1946 and March 1953. Data are for last Wednesday ofperiod.
3 Loans by weekly reporting member banks for purchasing or carrying securities, including U .S . Govern-ment obligations. Series revised beginning July 1946 and January 1952. Data are for last Wednesday ofperiod.
* Not available.
Sources: Securities and Exchange Commission, Board of Governors of the Federal Reserve System, andNew York Stock Exchange.
186
Digitized for FRASER http://fraser.stlouisfed.org/ Federal Reserve Bank of St. Louis
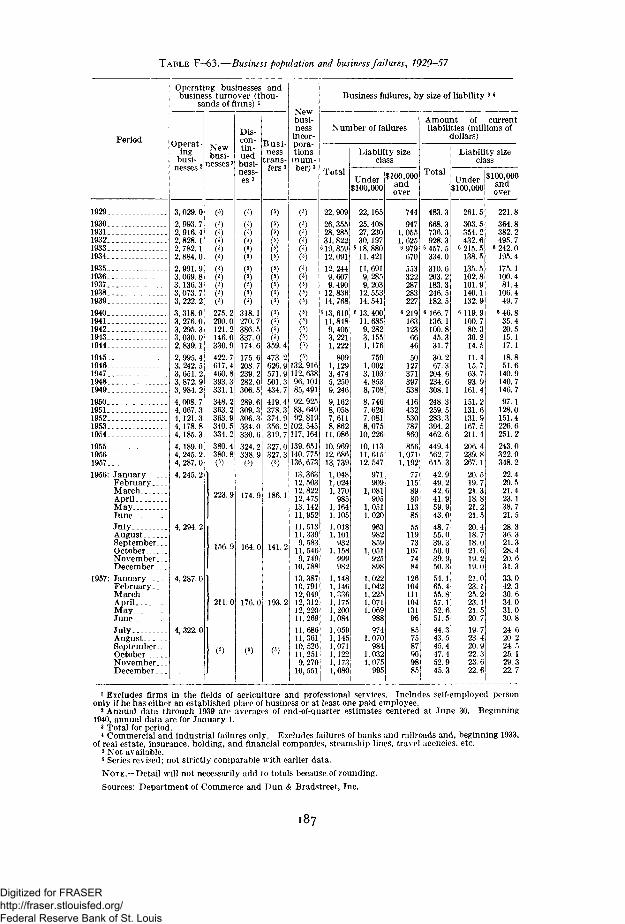
TABLE F-63.—Business population and business failures, 1929-57
Period
1929
19301931193219331934
19351936193719381939
19401941194219431944
19451946194719481949
19501951195219531954
1955195619571956: January
FebruaryMarchAprilMayJuneJulyAugustSeptember. __OctoberNovemberDecember
1957: JanuaryFebruaryMarch. __AprilMayJuneJulyAugustSeptember.. _OctoberNovember,._December _̂
Operating businesses andbusiness turnover (thou-
sands of firms) i
Operat-ing
busi^nesses2
Newbusi-
nesses3
3, 029. 0
2, 993. 72, 916. 42, 828. 12, 782.12, 884. 0
2,991.93, 069. 83, 136. 33, 073. 73, 222. 2
3,318.93, 276. 03, 295. 33, 030. 02, 839.1
2, 995. 43, 242. 53,651.23, 872. 93, 984. 2
4, 008. 74, 067. 34,121.34, 178. 84,185. 3
4,189. 04, 245. 24, 287. 0
4, 245. 2
4, 294. 2
4, 287. 0
4, 322. 0
275.2290.0121.2146.0330.9
422.7617.4460.8393.3331.1
348.2363.2363.9340. 5334.2
380.4380.8
223. '
Dis-con-tin-uedbusi-ness-es 3
Busi-ness
trans-fers3
211.0
318.1270.7386.5337.0174.
175.6208.7239.2282.0306.5
289.6309.3306.3334.0330.6
324.2338.9
174.'
176.0
C5)(5)
()359.4473.2626.9571.9501.3434.7
419.4378.3374.9356. 2319.7
327.0327.3
186.1
193.2
Newbusi-ness
incor-pora-tions(num-ber)3
()132, 916112,63896, 10185, 491
92, 92583, 64992, 819102, 545117,164
139, 651140, 775136,673
13, 36312, 50312, 82212, 47513,14211,952
11,51311,3399,58311, 5469,74910, 788
13, 38710,79112,04912,31212, 22011,26911,68611,36110,52611,2519,27010,551
Business failures, by size of liability 3
Number of failures
TotalUnder
$100,000
22,909
26, 35528, 28531, 82219, 85912, 091
12, 2449,6079,490
12, 83614, 768
'13,61911,8489,4053,2211,222
1, 1293,4745,2509,246
9,1628,0587, 6118,862
11,110, 96912, 68613, 739
1,0481,0241, 170985
1,1641,105
1,0181,101932
1,158999982
1,1481,1461, 3361,1751,2001,084
1,0591,1451,0711,1221,1731,080
Liability sizeclass
22,165
25, 40827, 23030, 197
1 18, 88011,421
11, 6919, 2859,20312, 55314, 541
' 13, 40011, 6859,2823,1551, 176
7591,0023,1034, 8538,708
8,7467,6267,0818,075
10, 226
10,11311,61512, 547
971909
1,081905
1,0511,020
963982859
1,051925
1,0221,0421, 2251,0711,069988
9741,070984
1,0321, 075995
and
i
744947
1, 0551,6256 979670
553322287283227
6 2191631236646
50127371397538
416432530787
8561,0711,192
7711589801138555119731077484
12610411110413196
857587909885
Amount of currentliabilities (millions of
dollars)
Total
483.3
668.3736.3928.3
B 457. 5334.0
310.6203.2183. 3246.5182. 5
6 166. 7136.1100.845.331.7
30.267.3
204.6234.6308.1
248.3259.5283.3394.2462.6
449.4562.7615.3
42.949.242.641.959.943.0
48.755.039.350.039.950.354.165.455.857.152.651.5
44.343.545.447.452.945.3
Liability sizeclass
Under$100,000
261.5
303.5354.2432.6
e 215. 5138.5
135. 5102.8101.9140.1132.9
6 119.9100.780.330.214.5
11.415.763.793.9
161.4
151.2131.6131.9167.5211.4
206.4239.8267.1
20.519.721.318.821.221.520.418.718.021.619.219.0
21.023.125.223.121.520.7
19.723.420.922.323.622.6
$100,000andover
221.8
364.8382.2495. 7
6 242. 0195.4
175.1100.481.4
106.449.7
M6.835.420.515.117.1
18.851.6
140.9140.7146.7
97.1128.0151.4226.6251.2
243.0322.9348.2
22.429.521.423.138.721.5
28.336.321.328.420.631.3
33.042.330.634.031.030.824.620.224.525.129.322.7
* Excludes firms in the fields of agriculture and professional services. Includes self-employed persononly if he has either an established plane of business or at least one paid employee.
2 Annual data through 1939 are averages of end-of-quarter estimates centered at June 30. Beginning1940, annual data are for January 1.
3 Total for period.* Commercial and industrial failures only. Excludes failures of banks and railroads and, beginning 1933,
of real estate, insurance, holding, and financial companies, steamship lines, travel agencies, etc.5 Not available.6 Series revised; not strictly comparable with earlier data.
NOTE.—Detail will not necessarily add to totals because of rounding.
Sources: Department of Commerce and Dun & Bradstreet, Inc.
187
Digitized for FRASER http://fraser.stlouisfed.org/ Federal Reserve Bank of St. Louis
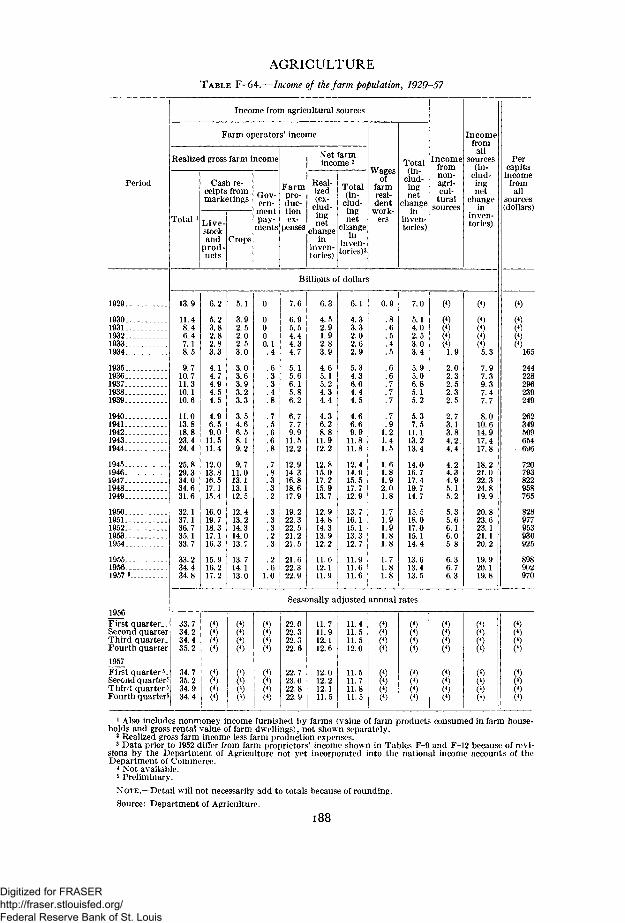
AGRICULTURETABLE F-64.—Income of the farm population, 1929-57
Period
1929
19301931 . .193219331934
1935..193619371938 . -1939
19401941194219431944
1945J946.1947 _ -_1948. . .1949
19501951195219531954
195519561957 «
1956First quarter..Second quarterThird quarter.Fourth quarter1957First quarter».Second quarter'Third quarter *Fourth quarter^
Income from agricultural sources
Farm operators' income
Realized gross farm income
Total i
13.9
11.48.46 47.18.5
9.710 711.310.110.6
11.013.818.823 424.4
25.829.334.034.631 6
32 137.136 735.133.7
33.234 434.8
33.734.234.435.2
34.735.234.934.4
Cash re-ceipts frommarketings
Live-stockand
prod-ucts
6.2
5.23.82 82.83.3
4.14 74.94.54.5
4.96.59.0
11 511.4
12 013.816.517.115 4
16 019.718 317.116.3
15.916 217.2
(4)(4)(<)(4)
(4)(4)(4)(4)
Crops
5.1
3.92.52 02.53.0
3.03 63.93.23.3
3.54 66.58 19.2
9 711.013.113.112 5
12 413.214 314.013 7
13. 714 113.0
(4)(4)(4)(4)
(4)(4)(4)(4)
Gov-ern-
mentpay-
ments
0
0000.1
.4
.633
.4
.8
.75
.668
7.8. 3.3
2
3. 3
3.2
3
.26
1.0
(4)(4)(4)(4)
(4)(4)(4)(4)
Farmpro-duc-tionex-
penses
Net farmincome 2
Real-ized(ex-
clud-
netchange
minven-tories)
Total(in-
clud-ingnet
changein
tories)3
Billions of dollars
7.6
6.95.54 44.34.7
5.15 66.15.86.2
6.77 79.9
11 512 2
12 914.316.818 617 9
19 222.322 521.221 5
21.622 322.9
6.3
4.52.91 92.83.9
4.65 15.24.34.4
4.36.28.8
11.912.2
12 815.017.215.913 7
12 914.814.313.912.2
11.612 111.9
6.1
4.33.32.02.62.9
5.34 36.04.44.5
4.66.69.9
11 811.8
12 414.915.517 712 9
13 716.115 113.312 7
11.911 611.6
Wagesnf
farmresi-dent
work-ers
0.9
.8
.6
.5
.4
.5
.66
.7
.7
.7
.7
.91.21 41.5
1 61.81.92.01 8
1 71.91.91.81.8
1.71 81.8
Total(in-
ingnet
changein
inven-tories)
7.0
5.14.02 53.03.4
5.95 06.85.15.2
5.37.5
11.113 213.4
14 016.717.419.714 7
15 518.017 015.114.4
13.613 413.5
Seasonally adjusted annual rates
22.022.322.322.6
22.723.022.822.9
11.711.912.112.6
12.012.212.111.5
11.411.511.512.0
11.511.711.811.5
(4)(4)(4)(4)
(4)(4)(4)(4)
(4)(4)(4)(4)
(4)(4)(4)(4)
Incomefromnon-agn-cul-
turalsources
(4)
(4)
(4)(4)(4)
1.9
2.02 32 52.32.5
2.73 13.84 24 4
4 24.34.95.15 2
5 35.66 16.05 8
6.36 76.3
(4)(4)(4)(4)
(4)(4)(4)(4)
Incomefromall
sources(in-
clud-ingnet
changein
tories)
(4)
(4)(4)(4)(4)
5.3
7.97 39 37.47.7
8.010 614.917 417 8
18 221.022.324 819 9
20 823.623 121.120 2
19.920 119.8
(4)(4)(4)(4)
(4)(4)(4)(4)
Percapitaincome
fromall
sources(dollars)
(4)
(4)(4)(4)(4)
165
244228296239249
262349509654696
720793822958765
828977953930925
898902970
(4)(4)(4)(4)
(4)(4)(4)(4)
1 Also includes nonmoney income furnished by farms (value of farm products consumed in farm house-holds and gross rental value of farm dwellings), not shown separately.
2 Realized gross farm income less farm production expenses.3 Data prior to 1952 differ from farm proprietors' income shown in Tables F-9 and F-12 because of revi-
sions by the Department of Agriculture not yet incorporated into the national income accounts of theDepartment of Commerce.
4 Not available.5 Preliminary.
NOTE.—Detail will not necessarily add to totals because of rounding.
Source: Department of Agriculture.
188
Digitized for FRASER http://fraser.stlouisfed.org/ Federal Reserve Bank of St. Louis
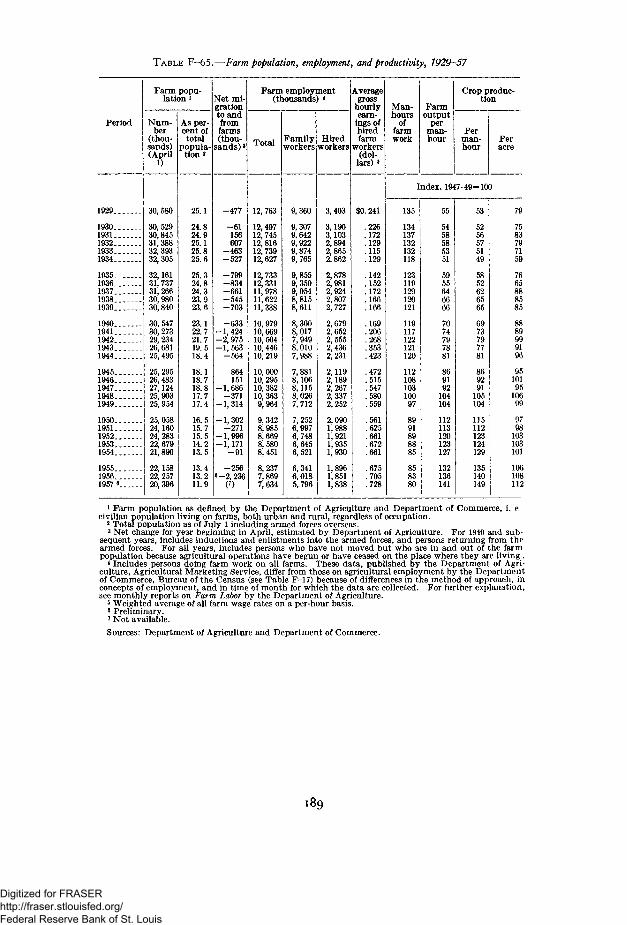
TABLE F-65.—Farm population, employment, and productivity, 1929-57
Period
1929
19301931193219331934
19351936193719381939
19401941194219431944
194519461947. . . .19481949
19501951195219531954
195519561957 6
Farm popu-lation »
Num-ber
(thou-sands)(April
1)
As per-cent oftotal
populat i s
30,580
30,52930,84531,38832, 39332, 305
32,16131, 73731, 26630, 98030,840
30, 54730, 27329, 23426, 68125,495
25, 29526, 48327,12425,90325, 954
25, 05824,16024, 28322, 67921,890
22,15822, 25720,396
Net mi-grationto andfromfarms(thou-
sands)8
25.1
24.824.925.125.825.6
25.324.824.323.923.6
23.122.721.719.518.4
18.118.718.817.717.4
16.515.715.514.213.5
13.413.211.9
-477
- 6 1156607
-463-527
-799-834-661-545-703
-633-1,424- 2 , 975-1,563
-564
151-1,686
-371-1,314
-1,302-271
-1,996-1,171
- 9 1
-2568-2,236
Farm employment(thousands) *
Total workers workers
12, 763
12,49712, 74512,81612, 73912, 627
12, 73312, 33111, 97811,62211, 338
10, 97910,66910, 50410, 44610, 219
10,00010, 29510, 38210,3639,964
9,3428,9858,6698,5808,451
8,2377,8697,634
Family
9,360
9,3079,6429,9229,8749,765
9,8559,3509,0548,8158,611
8,3008,0177,9498,0107,988
7,8818,1068,1158,0267,712
7,2526,9976,7486,6456,521
6,3416,0185,796
Hired
Averagegross
hourlyearn-
ings ofhiredfarm
workers(dol
lars)
3,403
3,1903,1032,8942,8652,862
2,8782,9812,9242,8072,727
2,6792,6522,5552,4362,231
2,1192,1892,2672,3372,252
2,0901,9881,9211,9351,930
1,8961,8511,838
$0. 241
.226
.172
.129
.115
.129
.142
.152
.172
.166
.166
.169
.206
.268
.353
.423
.472
.515
.547
.580
.559
.561
.625
.661
.672
.661
.675
.705
.728
Man-hours
offarmwork
Farmoutput
perman-hour
Crop produc-tion
Perman-hour
Peracre
Index, 1947-49=100
135
134137132132118
123119129120121
119117122121120
11210810310097
8991898885
858380
55
5458585351
5955646666
7074797881
869192104104
112113120123127
132136141
53
5256575149
5852626565
6973797781
869291105104
115112123124129
135140149
79
7583797159
7665888585
9510195
106
9798
103103101
106108112
1 Farm population as defined by the Department of Agriculture and Department of Commerce, i. e.civilian population living on farms, both urban and rural, regardless of occupation.
2 Total population as of July 1 including armed forces overseas.3 Net change for year beginning in April, estimated by Department of Agriculture. For 1940 and sub-
sequent years, includes inductions and enlistments into the armed forces, and persons returning from thearmed forces. For all years, includes persons who have not moved but who are in and out of the farmpopulation because agricultural operations have begun or have ceased on the place where they are living .
* Includes persons doing farm work on all farms. These data, published by the Department of Agri-culture, Agricultural Marketing Service, differ from those on agricultural employment by the Departmentof Commerce, Bureau of the Census (see Table F-17) because of differences in the method of approach, inconcepts of employment, and in time of month for which the data are collected. For further explanation,see monthly reports on Farm Labor by the Department of Agriculture.
5 Weighted average of all farm wage rates on a per-hour basis.6 Preliminary.7 Not available.
Sources: Department of Agriculture and Department of Commerce.
189
Digitized for FRASER http://fraser.stlouisfed.org/ Federal Reserve Bank of St. Louis
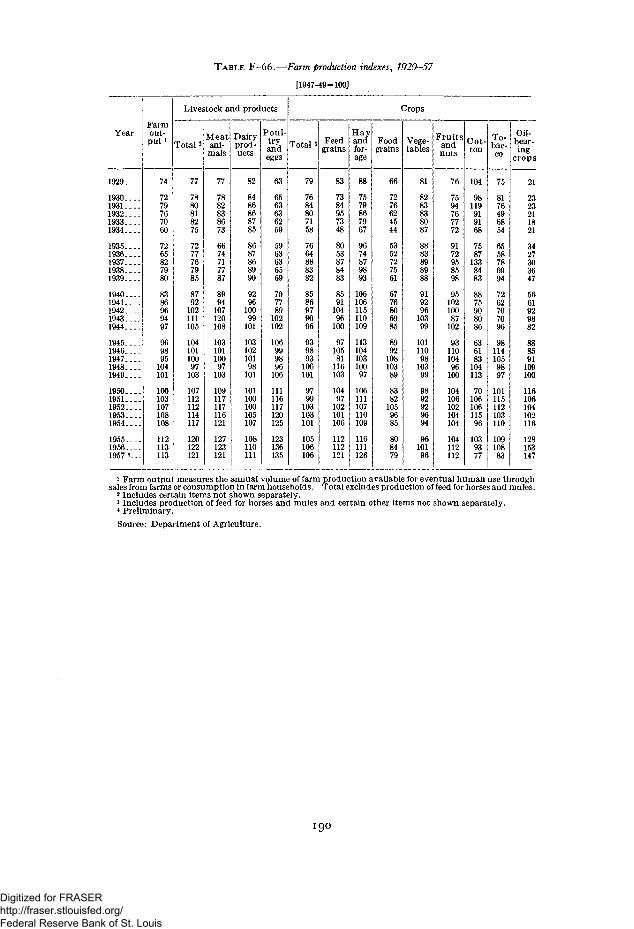
TABLE F-66.—Farm production indexes, 1929-57
[1947-49=100]
Year
1929
19301931193219331934
19351936193719381939
19401941194219431944
19451946194719481949
19501951195219531954
195519561957*.--
Farmout-put 1
74
7279767060
7265827980
8386969497
969895104101
100103107108108
112113113
Livestock and products
Total 2
77
7880818275
7277767985
8792102111105
10410110097103
107112112114117
120122121
Meatani-mals
77
7882838673
6674717787
8994107120108
10310110097103
109117117116121
127123121
Dairyprod-ucts
82
8486868785
8687868990
929610099101
10310210198101
101100100105107
108110111
Poul-tryandeggs
63
6563636259
5963636569
707789102102
106999896106
111116117120125
123136135
Crops
Total 3
79
7684807158
7664888382
8586979096
939893106101
9799103103101
105106106
Feedgrains
83
7384957348
8053878483
859110496100
9710581116103
10497102101106
112112121
Hayandfor-age
88
7579867967
9674879893
106106115110109
11310410310097
106111107110109
116111126
Foodgrains
66
7276624544
5352727561
6776806985
899210810389
83821059685
808479
Vege-tables
81
8283838087
8883898988
91929610399
1011109810399
9892929694
9610196
Fruitsandnuts
76
7594767772
9172958598
9510210087102
9311010496100
104106102104104
104112112
Cot-ton
104
98119919168
75871338483
8875908086
636183104113
7010610611596
1039377
To-bac-co
75
8176496854
6558786994
7262707096
981141059897
101115112103110
10910883
Oil-bear-ing
crops
21
2323211821
3427303647
5661929882
888591109100
116106104102116
128153147
1 Farm output measures the annual volume of farm production available for eventual human use throughsales from farms or consumption in farm households. Total excludes production of feed for horses and mules.
2 Includes certain items not shown separately.3 Includes production of feed for horses and mules and certain other items not shown separately.4 Preliminary.
Source: Department of Agriculture.
Digitized for FRASER http://fraser.stlouisfed.org/ Federal Reserve Bank of St. Louis
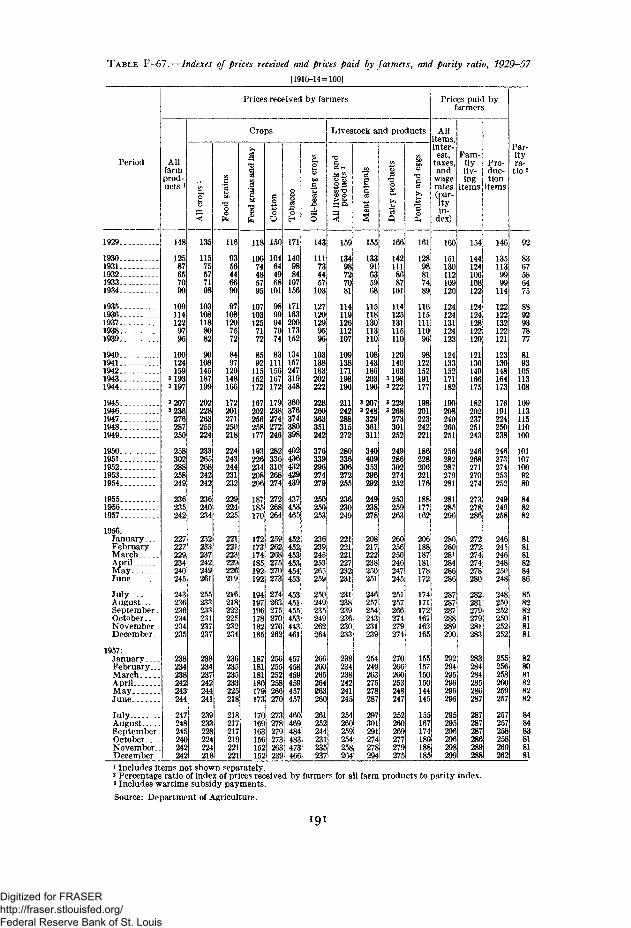
T A B L E F—67.—Indexes of prices received and prices paid by farmers, and parity ratio, 1929-57
[1910-14= 100]
Period
1929
19301931193219331934.
19351936193719381939
1940 .1941194219431944._ . _
1945 - .1946194719481949
19501951 .195219531954
1955 . .19561957
1956:January...FebruaryMarchAprilMay...June ...
JulyAugust ...September.OctoberNovember.December.
1957:JanuaryFebruary...MarchApril. .MayJune
JulyAugustSeptember.OctoberNovember. .December
Allfarmprod-ucts i
148
12587657090
1091141229795
100124159
3 1933 197
3 207»236276287250
258302288258249
236235242
227227229234240245
243236236234234235
238234238242243244
247248245240242242
£A
ll
135
11575577198
1031081188082
90108145187199
202228263255224
233265268242242
236240234
232233237242249261
255233233231237237
238234237242244241
239233228224224218
1fei
1116
9356446690
971081207572
8497120148166
172201271250218
224243244231232
229224225
221221223229226219
216218222225232234
236235235233225218
218217217219221221
Prices received by farmers
Crops
g05xn.9I1118
10674485795
1071031257172
8592115152172
167202256258177
193226234208206
187185170
172173174185192192
194197196178182185
187181181180179173
170169163156152152
ton
Cot
150
104644968101
9899947074
83111156167172
179238274272246
282336310268274
272268264
259262268275270273
274263275270270262
256255252258266270
273278279273263239
I
Tot
171
1409884107156
171163200173152
134157247319348
360376374380398
402436432429439
437453465
452452453453454453
453451455453443461
457458459459457457
460469484483473466
COfto
bfl
.5
bear
Oil-
143
111734457103
1271201299596
103138183202222
228260363351242
376339296274279
250250253
236239245253265259
250249235249262264
266260265264263260
261252244231235237
Livestock and products
o5 *-<
tock
luct
:A
ll
159
13498727081
114119126112107
109138171198196
211242288315272
280336306272255
236230249
221221221227232231
231238239236230233
238234238242241245
254260259254258264
g'IC3
s
155
13391635968
115118130113110
108143186203190
3 2073 248329361311
340409353296292
249238278
208217222238250251
246257254243231239
254249263275278287
297301291274278294
CO
rodi
ft
Dai
166
1421118687101
114125131115110
120140163
3 1983 222
3 2293 268273301252
249286302274252
253259263
260256250246247245
251257266274279274
270266260253248247
252260269277279275
75
M05
TJCJa
1161
12898817489
11611511111096
98122152191177
198201223242221
186228206221176
188177162
206188187181178172
174171172167163165
155157150150144145
155167174180188185
Prices paidfarmers
Allitems,inter-est,taxes,andwagerates(par-ityin-dex)
160
151130112109120
124124131124123
124133152171182
190208240260251
256282287279281
281285296
280280281284286286
287287287288289290
292294295296296296
295295296296298299
Fam-ilyliv-ing
items
154
144124106108122
124124128122120
121130149166175
182202237251243
246268271270274
273278286
272272274274278280
282281279279281283
283284284285286287
287287287286289288
Lby
Pro-duc-tionitems
146
1351139999114
122122132122121
123130148164173
176191224250238
246273274253252
249249258
246245246248250248
248250252250252252
255256258260259257
257257258258260262
Par-ityra-tio 2
92
8367586475
SS92937877
8193105113108
109113115110100
1011071009289
848282
818181828486
858282818181
828081828282
848483818181
1 Includes items not shown separately.2 Percentage ratio of index of prices received by farmers for all farm products to parity index.3 Includes wartime subsidy payments.
Source: Department of Agriculture.
Digitized for FRASER http://fraser.stlouisfed.org/ Federal Reserve Bank of St. Louis
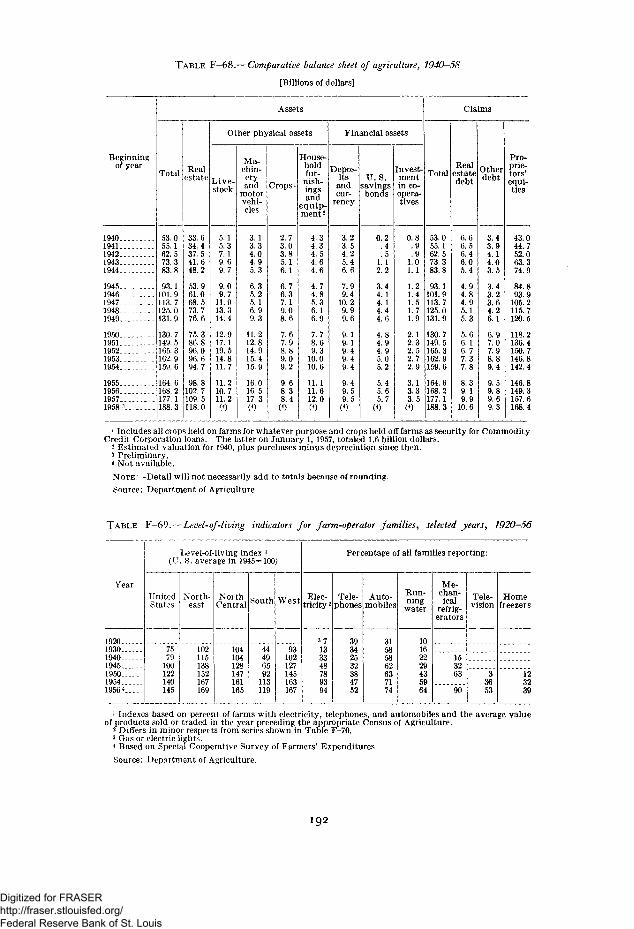
TABLE F-68.—Comparative balance sheet of agriculture, 1940-58
[Billions of dollars]
Beginningof year
19401941194219431944
19451946194719481949
19501951195219531954._
1955195619571958 3
Assets
Total
53.055.162.573.383.8
93.1101.9113. 7125. 0131.9
130. 7149. 5165. 3162.9159.6
164.6168.2177.1188.3
Realestate
33.634. 437.541.648.2
53.961.068.573.776.6
75.386.896.096.694.7
98.8102.7109. 5118.0
Other physical assets
Live-stock
5.15.37.19.69.7
9.09.7
11.913.314.4
12.917. 119. 514.811.7
11.210.711.2(4)
Ma-chin-eryand
motorvehi-cles
3.1o n
4.04.95.3
6.35.25. 16.99.3
11.212.814.915.415.9
16.016.517.3(4)
Crops i
2.73.03.85.16.1
6.76.37.19.08.6
7.67.98.89.09.2
9.68.38.4
(4)
House-holdfur-
nish-ingsand
equip-ment2
4.34.34.54.64.6
4.74.85.36. 16.9
7.78.69.3
10.010.6
11.111.612.0(4)
Financial assets
Depos-itsandcur-
rency
3.23.54.25.46.6
7.99.4
10.29.99.6
9.19.19.49.49.4
9.49.59.5
(4)
U. S.savings
bonds
0.2.4. 5
1.12.2
3.44.14.14 44.6
4.84.94.95.05.2
5.45.65.7
0)
Invest-mentin co-opera-tives
0.8. 9.9
1.01.1
1.21.41.51. 71.9
2.12.32. 52.72.9
3.13.33.5
(*)
Total
53.055.162.573.383.8
93.1101.9113.7125.0131.9
130.7149.5165.3162.9159.6
164.6168.2177.1188.3
Claims
Realestatedebt
6.66.56.46.05.4
4.94.84.95.15.3
5.66.16. 77.37.8
8.39.19.9
10.6
Otherdebt
3.43.94.14.03.5
3.43.23.64.26.1
6.97.07.98.89.4
9.59.89.69.3
Pro-prie-tors'equi-ties
43.044.752.063.374.9
84.893.9
105.2115. 7120.5
118.2136.4150.7146.8142.4
146.8149.3157.6168.4
1 Includes all crops held on farms for whatever purpose and crops held off farms as security for CommodityCredit Corporation loans. The latter on January 1, 1957, totaled 1.6 billion dollars.
2 Estimated valuation for 1940, plus purchases minus depreciation since then.3 Preliminary.* Not available,NOTE:—Detail will not necessarily add to totals because of rounding.Source: Department of Agriculture.
TABLE F-69.- - Level-oj-living indicators for farm-operator families, selected years, 1920-56
Year
19201930194019451950195419564
Level-of-living index '(U. S. average in 1945=100)
UnitedStates
North-east
75 10279
100122140145
115138152167169
NorthCentral
104104128147161165
South
44496592
113119
West
93102127145163167
Percentage of all families reporting:
Elec-tricity 2
3 7133348789394
Tele-phones
39342532384752
Auto-mobiles
31585862637174
Run-ningwater
10162229435964
Me-chan-ical
refrig-erators
153263
90
Tele-vision
33653
Homefreezers
123239
1 Indexes based on percent of farms with electricity, telephones, and automobiles and the average valueof products sold or traded in the year preceding the appropriate Census of Agriculture.
2 Differs in minor respects from series shown in Table F-70.3 Gas or electric lights.4 Based on Special Cooperative Survey of Farmers' Expenditures.Source: Department of Agriculture.
192
Digitized for FRASER http://fraser.stlouisfed.org/ Federal Reserve Bank of St. Louis
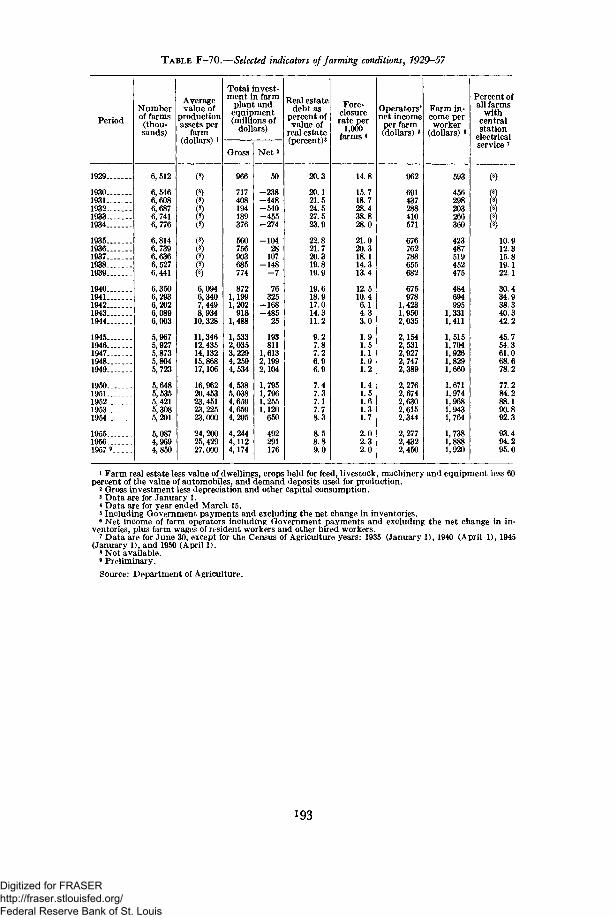
T A B L E F—70.—Selected indicators of farming conditions, 1929—57
Period
1929
19301931193219331934
1935193619371938..1939
19401941194219431944
1945.1946194719481949
19501951195219531954
195519561957 9
Numberof farms(thou-sands)
6,512
6,5466,6086,6876,7416,776
6,8146,7396,6366,5276,441
6,3506,2936,2026,0896,003
5,9675,9275,8735,8045,723
5,6485,5355,4215,3085,201
5,0874,9694,850
Averagevalue of
productionassets per
farm(dollars) i
(8)
(8)(8)(8)(8)(8)
(8)(8)(8)(8)(8)
6,0946,3407,4498,934
10,328
11,34612,43514,13215,86817,106
16,96220,45323,45123,22523,000
24,20025,42927,000
Total invest-ment in farm
plant andequipment(millions of
dollars)
Gross
966
717408194189376
560756903685774
8721,1991,202
9181,488
1,5332,0353,2294,2594,534
4,5385,0384,6594,6594,295
4,2444,1124,174
Net a
50
-238-448-540-455-274
-10428
107-148
- 7
76325
-168-485
25
193811
1,6132,1992,104
1,7951,7961,2551,120
650
492291176
Real estatedebt as
percent ofvalue of
real estate(percent)'
20.3
20.121.524.527.523.9
22.821.720.319.819.9
19.618.917.014.311.2
9.27.87.26.96.9
7.47.37.17.78.3
8.58.89.0
Fore-closurerate per
1,000farms 4
14.8
15.718.728.438.828.0
21.020.318.114.313.4
12.510.46.14.33.0
1.91.51.11.01.2
1.41.51.61.31.7
2.02.32.0
Operators'net income
per farm(dollars) «
962
691437288410571
676762788655682
675978
1,4231,9502,035
2,1542,5312,9272,7472,389
2,2762,6742,6302,6152,344
2,2772,4322,450
Farm in-come perworker
(dollars) «
:
]]
593
456298203266360
423487519452475
484694995
1,3311,411
,515L, 704[,9261,829L, 660
1,671L, 9741,9681,9431,764
L, 7381,888L,920
Percent ofall farms
withcentralstation
electricalservice 7
(8)
(8)(8)(8)(8)(8)
10.912.315.819.122.1
30.434.938.340.342.2
45.754.361.068.678.2
77.284.288.190.892.3
93.494.295.0
' Farm real estate less value of dwellings, crops held for feed, livestock, machinery and equipment less 60percent of the value of automobiles, and demand deposits used for production.
2 Gross investment less depreciation and other capital consumption.3 Data are for January 1.4 Data are for year ended March 15.5 Including Government payments and excluding the net change in inventories.8 Net income of farm operators including Government payments and excluding the net change in in-
ventories, plus farm wages of resident workers and other hired workers.7 Data are for June 30, except for the Census of Agriculture years: 1935 (January 1), 1940 (April 1), 1945
(January 1), and 1950 (April 1).s Not available.9 Preliminary.
Source: Department of Agriculture.
193
Digitized for FRASER http://fraser.stlouisfed.org/ Federal Reserve Bank of St. Louis
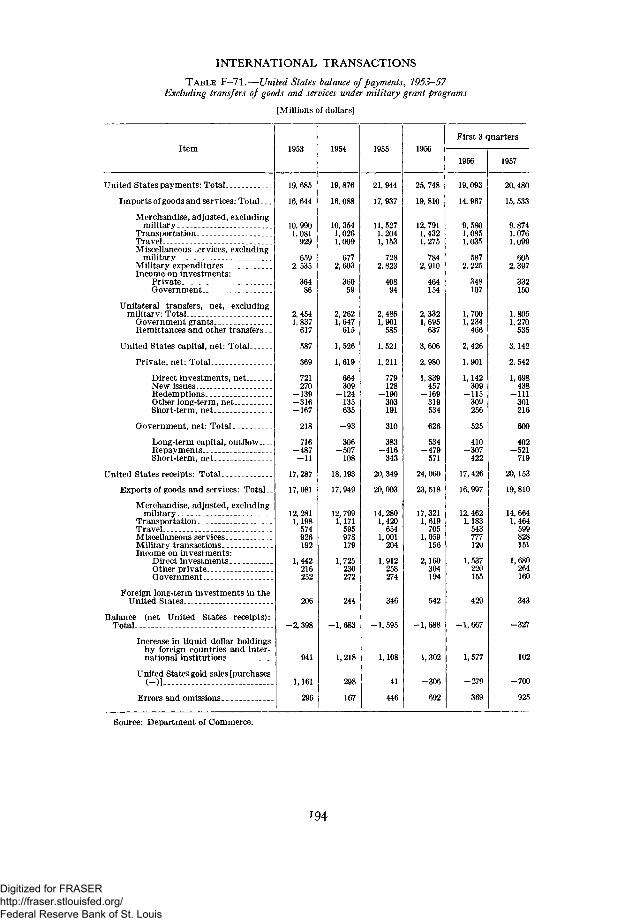
INTERNATIONAL TRANSACTIONS
TABLE F-71.—United States balance of payments, 1953-57Excluding transfers of goods and services under military grant programs
[Millions of dollars]
Item
United States payments: Total
Imports of goods and services: Total
Merchandise, adjusted, excludingmilitary
TransportationTravelMiscellaneous services, excluding
militaryMilitary expendituresIncome on investments:
PrivateGovernment
Unilateral transfers, net, excludingmilitary: Total
Government grantsRemittances and other transfers. _
United States capital, net: Total
Private, net: Total
Direct investments, netNew issuesRedemptionsOther long-term, netShort-term, net
Government, net: Total
Long-term capital, outflowRepaymentsShort-term, net
United States receipts: Total
Exports of goods and services: Total..
Merchandise, adjusted, excludingmilitary
TransportationTravelMiscellaneous servicesMilitary transactionsIncome on investments:
Direct investmentsOther privateGovernment
Foreign long-term investments in theUnited States
Balance (net United States receipts):Total
Increase in liquid dollar holdingsby foreign countries and inter-national institutions
United States gold sales [purchases(-)]
Errors and omissions
1953
19, 685
16, 644
10,9901,081929
6592,535
36486
2,4541,837617
587
369
721270
-139-316-167
218
716-487-11
17, 287
17,081
12, 2811,198574926192
1,442216252
206
-2,398
941
1,161
296
1954
19, 876
16, 088
10, 3541,0261,009
6772,603
36059
2,2621,647615
1,526
1,619
664309
-124135635
-93
306-507108
18,193
17,949
12, 7991,171595978179
1,725230272
244
-1,683
1,218
298
167
1955
21, 944
17, 937
11, 5271,2041,153
7282,823
40894
2,4861,901585
1,521
1,211
779128
-190303191
310
383-416343
20,349
20, 003
14, 2801,420654
1,001204
1,912258274
346
-1, 595
1,108
41
446
1956
25, 748
19, 810
12, 7911,4321,275
7842,910
464154
2,3321,695637
3,606
2,980
1,839457
-169319534
626
534-479571
24,060
23,518
17, 3211,619705
1,059156
2,160304194
542
-1,688
1,302
-306
692
First 3 quarters
1956
19,093
14, 967
9,5801,0851,035
5872,225
348107
1,7001,234466
2,426
1.901
1,142309
-115309256
525
410-307422
17, 426
16,997
12, 4621,183543777120
1,537220155
429
-1,667
1,577
-279
369
1957
20, 480
15, 533
9,8741,0761,099
6052,397
332150
1,8051,270535
3,142
2,542
1,698438
-111301216
600
402-521719
20,153
19, 810
14,6641,464599828151
1,680264160
343
-327
102
-700
925
Source: Department of Commerce.
194
Digitized for FRASER http://fraser.stlouisfed.org/ Federal Reserve Bank of St. Louis
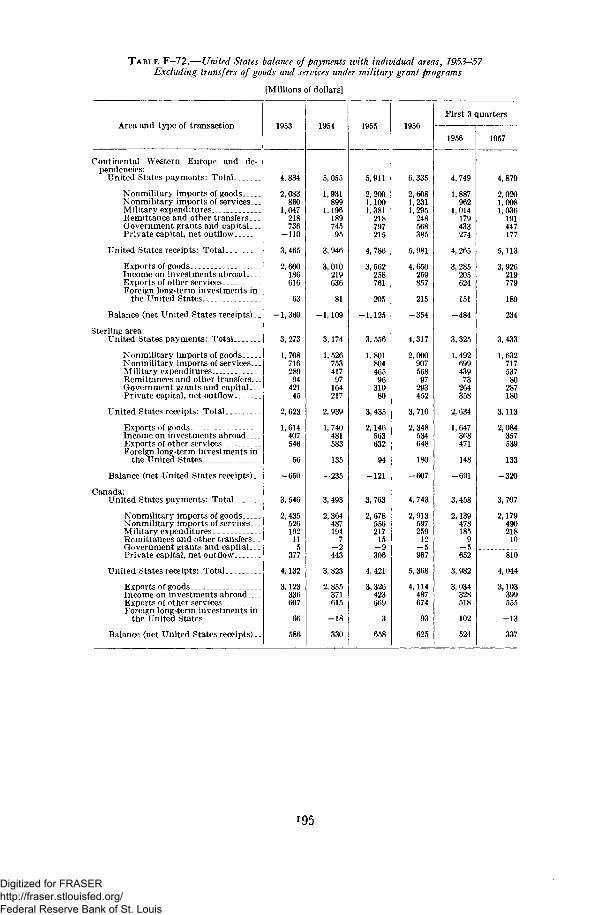
TABLE F—72.—United States balance of payments with individual areas, 1953—57Excluding transfers of goods and services under military grant programs
[Millions of dollars]
Area and type of transaction
Continental Western Europe and de-pendencies:
United States payments: Total-. .
Nonmilitary imports of goodsNonmilitary imports of services.._Military expendituresRemittance and other transfers...Government grants and capital.._Private capital, net outflow
United States receipts: Total _
Exports of goods _ _ .Income on investments abroadExports of other servicesForeign long-term investments in
the United States
Balance (net United States receipts)..
Sterling area:United States payments: Total . .. .
Nonmilitary imports of goodsNonmilitary imports of services...Military expenditures .Remittances and other transfers.._Government grants and capitalPrivate capital, net outflow
United States receipts: Total
Exports of goodsIncome on investments abroadExports of other servicesForeign long-term investments in
the United States
Balance (net United States receipts)..
Canada:United States payments: Total
Nonmilitary imports of goodsNonmilitary imports of services.._Militarv expendituresRemittances and other transfers. _Government grants and capital...Private capital, net outflow
United States receipts: Total
Exports of goodsIncome on investments abroadExports of other services „ .Foreign long-term investments in
the United States
Balance (net United States receipts) _.
1953
4,834
2,083860
1,047218736
- 1 1 0
3,465
2,600186616
63
- 1 , 3 6 9
3,273
1,70871628994
42145
2,623
1,614407546
56
- 6 5 0
3,546
2,435526192115
377
4,132
3,123336607
66
586
1954
5,055
1,931899
1,19618974595
3,946
3,010219636
81
- 1 , 1 0 9
3,174
1,52675341797
164217
2,939
1,740481583
135
- 2 3 5
3,493
2,364487194
2443
3,823
2,855371615
- 1 8
330
1955
5,911
2,2001,1001,381
218797215
4,786
3,562258761
205
- 1 , 1 2 5
3,556
1,80180446596
31080
3,435
2,146563632
94
- 1 2 1
3,763
2,678556217
15Q
306
4,421
3,326423669
3
658
1956
6,335
2,6081,2311,295
248568385
5, 981
4,650259857
215
- 3 5 4
4,317
2,00090756897
293452
3,710
2,348534648
180
- 6 0 7
4,743
2,913597259
12
967
5,368
4,114487674
93
625
First 3 quarters
1956
4,749
1,887962
1,014179433274
4,265
3,285205624
151
- 4 8 4
3,325
1,492699439
73264358
2,634
1,647368471
148
- 6 9 1
3,458
2,139478185
9
652
3,982
3,034328518
102
524
1957
4,879
2,0201,0081,036
191447177
5,113
3,926219779
189
234
3,433
1,63271753780
287180
3,113
2,084357539
133
- 3 2 0
3,707
2,179490218
10
810
4,044
3,103399555
— 13
337
195
Digitized for FRASER http://fraser.stlouisfed.org/ Federal Reserve Bank of St. Louis
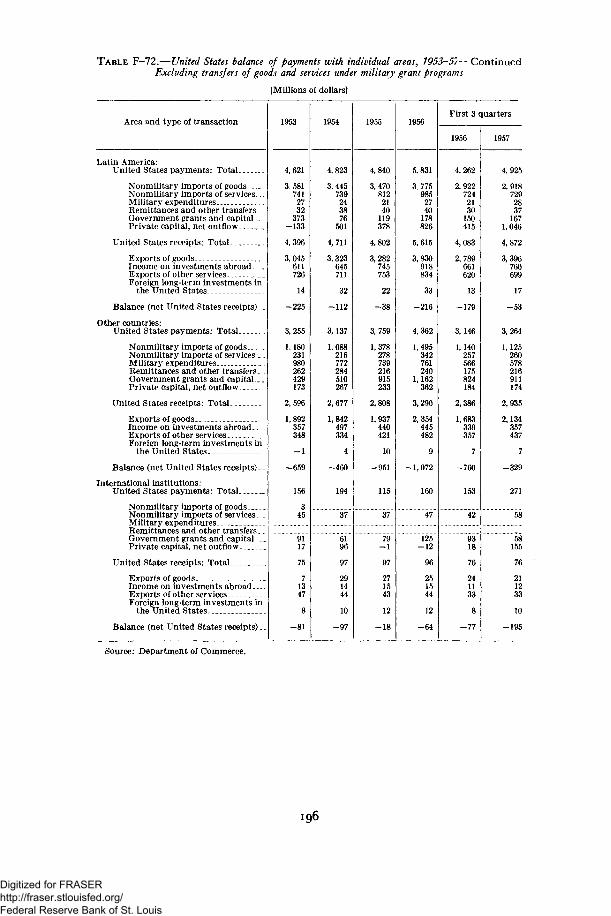
TABLE F—72.—United States balance of payments with individual areas, 1953-57—ContinuedExcluding transfers of goods and services under military grant programs
[Millions of dollars]
Area and type of transaction
Latin America:United States payments: TotaL
Nonmilitary imports of goods .Nqnmilitary imports of services ..Military expendituresRemittances and other transfers .Government grants and capital _Private capital, net outflow _
United States receipts: Total
Exports of goods ..Income on investments abroad.. _Exports of other servicesForeign long-term investments in
the United States
Balance (net United States receipts) .
Other countries:United States payments: Total
Nonmilitary imports of goods.- ..Nqnmilitary imports of services _ .Military expendituresRemittances and other transfers.Government grants and capital .. _Private capital, net outflow
United States receipts: Total
Exports of goodsIncome on investments abroad..Exports of other servicesForeign long-term investments in
the United States
Balance (net United States receipts)-.
International institutions:United States payments: Total
Nonmilitary imports of goods.,.. _Nqnmilitary imports of services. .Military expendituresRemittances and other transfers..Government grants and capital _ _Private capital, net outflow
United States receipts: Total.
Exports of goodsIncome on investments abroad..-.Exports of other servicesForeign long-term investments in
the United States
Balance (net United States receipts).
1953
4,621
3.5817412732373
-133
4,396
3,045611726
14
-225
3,255
1, 180231980262429173
2,596
1,892357348
-1
-659
156
9117
75
71347
8
-81
1954
4,823
3,445739243876501
4,711
3,323645711
32
-112
3,137
1,088216772284510267
2,677
1,842497334
-460
194
1955
4,840
3,4708122140119378
4,802
3,282745753
22
-38
3,759
1,378278739216915233
2,808
1,937440421
10
-951
115
"37"
79-1
97
271543
12
-18
1956
5. 831
3 7759852740178826
5,615
3,830918834
33
-216
4,362
1,495342761240
1,162362
3,290
2,354445482
-1,072
160
47
125-12
251544
12
-64
First 3 quarters
1956
4,262
2,9227242130150415
4,083
2,789661620
13
-179
3,146
1,140257566175824184
2,386
1,683339357
7
-760
153
"42"
-77
1957
4,925
2,9187292837167
1,046
4,872
3,396760699
17
-53
3,264
1,125260578216911174
2,935
2,134357437
7
-329
271
""58
58155
76
211233
10
-195
Source: Department of Commerce.
196
Digitized for FRASER http://fraser.stlouisfed.org/ Federal Reserve Bank of St. Louis
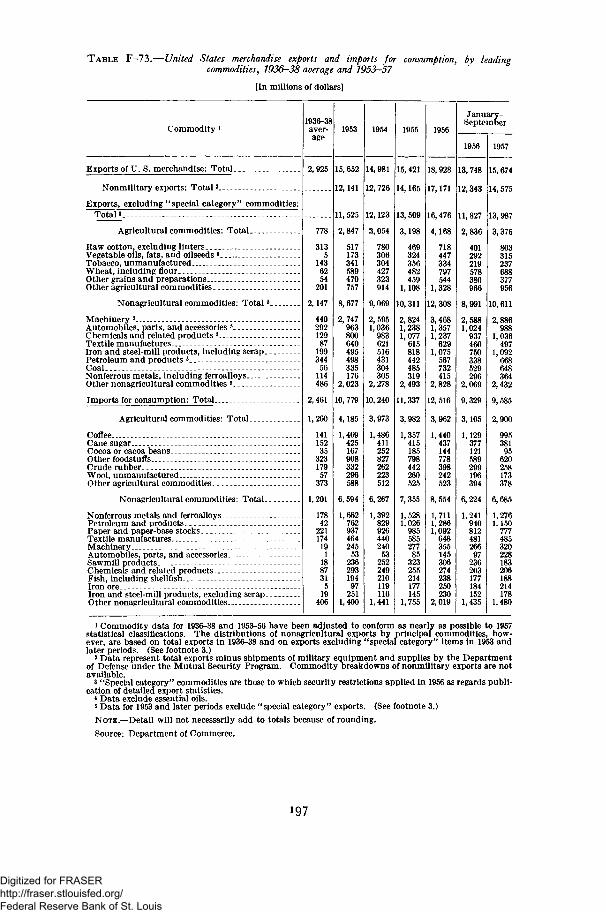
TABLE F—73.—United States merchandise exports and imports for consumption, by leadingcommodities, 1936-38 average and 1953-57
[In millions of dollars]
Commodity 1
Exports of U. S. merchandise: Total.
Nonmilitary exports: Total2
Exports, excluding "special category" commodities:Total»
Agricultural commodities: Total.
Raw cotton, excluding lintersVegetable oils, fats, and oilseeds «.Tobacco, unmanufacturedWheat, including flourOther grains and preparationsOther agricultural commodities- - -
Nonagricultural commodities: Total5.
Machinery s
Automobiles, parts, and accessories 5
Chemicals and related products 5
Textile manufacturesIron and steel-mill products, including scrap.Petroleum and products 5
CoalNonferrous metals, including ferroalloysOther nonagricultural commodities 5
Imports for consumption: Total
Agricultural commodities: Total-
CoffeeCane sugarCocoa or cacoa beansOther foodstuffsCrude rubberWool, unmanufacturedOther agricultural commodities.
Nonagricultural commodities: Total..
Nonferrous metals and ferroalloysPetroleum and productsPaper and paper-base stocksTextile manufacturesMachineryAutomobiles, parts, and accessoriesSawmill productsChemicals and related productsFish, including shellfishIron oreIron and steel-mill products, excluding scrap_Other nonagricultural commodities
1936-38aver-age
2,925
778
3135
1436254
201
2,147
44029212987
19934456
114486
2,461
1,260
14115235
32317957
373
1,201
17842
221174191
188731
519
406
1953
15,652
12,141
11, 525
2,847
517173341589470757
8,677
2,747963800640495498335176
2,023
10, 779
4,185
1,469425167908332296588
6,594
1,6627629374642455323629319497251
1,400
1954
14, 981
12,726
12,123
3,054
780306304427323914
9,069
2,5951,036983621516431304305
2,278
10,240
3,973
1,486411252827262223512
6,267
1,39282992644024053252249210119116
1,441
1955
15,421
14,165
13, 509
3,198
469324356482459
1,108
10,311
2,8241,2381,077615818442485319
2,493
11,337
3,982
1,357415185798442260525
7,355
1,5281,02698558527785323255214177145
1,755
1956
18,928
17,171
16,476
4,168
718447334797544
1,328
12,308
3,4681,3571,237629
1,075567732415
2,828
12, 516
3,962
1,440437144778398242523
8,554
1,7111,2861,092648355145306274238250230
2,019
January-September
1956 1957
13,748
12,343
11,827
2,836
401292219578380966
8,991
2,5881,024
937460750338529296
2,069
9,329
3,105
1,129377121589299196394
6,224
1,24194081248126697236203177184152
1,435
15, 674
14, 575
13,987
3,376
803315237688377956
10, 611
2,886988
1,036497
1,092668648364
2,432
9,585
2,900
99538195620258173378
1,2761,150777485320228183206188214178
1,480
1 Commodity data for 1936-38 and 1953-56 have been adjusted to conform as nearly as possible to 1957statistical classifications. The distributions of nonagricultural exports by principal commodities, how-ever, are based on total exports in 1936-38 and on exports excluding "special category" items in 1953 andlater periods. (See footnote 3.)
2 Data represent total exports minus shipments of military equipment and supplies by the Departmentof Defense under the Mutual Security Program. Commodity breakdowns of nonmilitary exports are notavailable.
3 "Special category" commodities are those to which security restrictions applied in 1956 as regards publi-cation of detailed export statistics.
* Data exclude essential oils.s Data for 1953 and later periods exclude "special category" exports. (See footnote 3.)NOTE.—Detail will not necessarily add to totals because of rounding.Source: Department of Commerce.
197
Digitized for FRASER http://fraser.stlouisfed.org/ Federal Reserve Bank of St. Louis

TABLE F—74.—U. S. Government grants and credits, excluding military supplies and services,by areas, total postwar period and fiscal years 1953-57
[Millions of dollars]
Item Total
WesternEurope(includ-
ingGreece
andTurkey1)
East-ern
Europe
NearEast,
Africa,and
SouthAsia 2
Vietnam,Laos,Cam-bodia,China,
andKorea 3
OtherAsiaand
Pacific
LatinAmer-ica *
Otherinter-
nationalinstitu-
tionsand un-specified
Gross new grants:Total postwar period 5...Fiscal year 1953Fiscal year 1954Fiscal year 1955Fiscal year 1956Fiscal year 1957
Reverse grants and returnson grants:
Total postwar period 5__Fiscal year 1953Fiscal year 1954Fiscal year 1955Fiscal year 1956Fiscal year 1957
Net new grants:Total postwar period 5_.Fiscal year 1953Fiscal year 1954Fiscal year 1955Fiscal year 1956Fiscal year 1957
New credits:Total postwar period 5__Fiscal year 1953Fiscal year 1954Fiscal year 1955Fiscal year 1956Fiscal year 1957
Repayments:Total postwar period «„Fiscal year 1953Fiscal year 1954Fiscal year 1955Fiscal year 1956Fiscal year 1957
Net new credits:6
Total postwar period 5_.Fiscalyear 1953Fiscal year 1954Fiscal year 1955Fiscal year 1956Fiscal year 1957
Total net grants and credits:Total postwar period 5__Fiscal year 1953Fiscal year 1954Fiscal year 1955Fiscal year 1956Fiscal year 1957
32,9252,0461,6812,0391,7771,782
1,46910585536366
31, 4561,9411,5971,9861,7141,717
13, 023635624444475431
4,539528501460512639
8,485107124
-16-37
-208
39, 9402,0491,7211,9701,6771,508
21, 3121,4611,0031,059630469
1,2349480495162
20,0771,367923
1,010579406
8,9422571671128947
2,507402371234275289
6,435-145-204-121-186-242
26,5131,222719889392165
1,070
39
1,031
123
70-4-4-5-5
1,100- 4105
-15
1,490142277281316273
13882213
1,353134275278314270
905107578911290
24812171217134
65795397795
-43
2,009229314356409227
310270532623733
3,962309268531613733
264
13021111
134- 22
-14216
4,096307267530655749
3,5407443447097
3,508734244
1,0763511781145125
67551341007187
402-1683
-197437
3,9105612524144134
4602534547795
1,06535415957106
4602534547795
1,48522827615887152
7475360106129121
73817521652
-4331
1,19819925010734126
1,06535415957106
228
1792134142
506
- 5')
- 1 4- 2
1,11540365944104
1 Includes European Coal and Steel Community, European Payments Union, European ProductivityAgency, and Organization for European Economic Cooperation.
2 Includes United States contribution to United Nations for Palestine Relief.3 Includes United States contribution to United Nations Korean Reconstruction and Relief Adminis-
tration.* Includes United States contribution to Organization of American States.5 Postwar period covers July 1, 1945 through June 30, 1957. Excludes United States subscriptions to
International Bank for Reconstruction and Development and International Monetary Fund.6 Does not include $2,257 million prior grants converted into credits in the postwar period (Western
Europe $1,970 million, Eastern Europe $222 million, Near East and Africa $11 million, China $50 million,and Latin America $3 million), Western Europe $1,000 million in fiscal year 1954, and Latin America $1million in fiscal year 1957.
7 Less than $500,000.
NOTE.—Detail will not necessarily add to totals because of rounding.
Source: Department of Commerce.
198
Digitized for FRASER http://fraser.stlouisfed.org/ Federal Reserve Bank of St. Louis
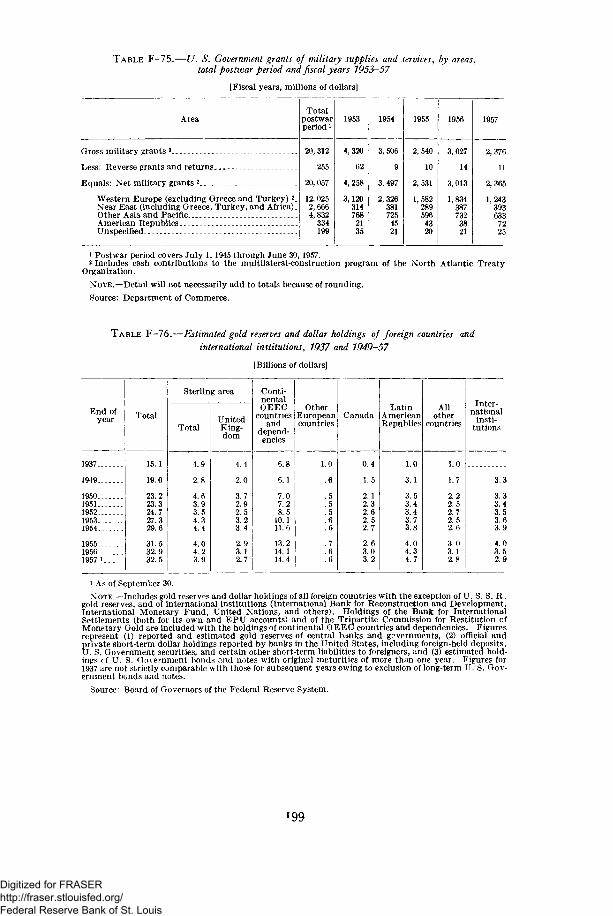
TABLE F—75.—U. S. Government grants of military supplies and services, by areas,total postwar period and fiscal years 1953—57
[Fiscal years, millions of dollars]
Area
Gross military grants 3
Less: Reverse grants and returns
Equals: Net military grants 2
Western Europe (excluding Greece and Turkey)2 .Near East (including Greece, Turkey, and Africa).Other Asia and PacificAmerican RepublicsUnspecified
Totalpostwarperiod1
20,312
255
20, 057
12,0252,6664,832
334199
1953
4,320
62
4,258
3,120314768
2135
1954
3,506
9
3,497
2,326381725
4521
1955
2,540
10
2,531
1,582289596
4320
1956
3,027
14
3,013
1, 834387732
3821
1957
2,376
11
2,365
1,243393633
7225
1 Postwar period covers July 1, 1945 through June 30, 1957.2 Includes cash contributions to the multilateral-construction program of the North Atlantic Treaty
Organization.
NOTE.—Detail will not necessarily add to totals because of rounding.
Source: Department of Commerce.
TABLE F—76.—Estimated gold reserves and dollar holdings of foreign countries andinternational institutions, 1937 and 1949-57
[Billions of dollars]
End ofyear
1937
1949
19501951195219531954
195519561957 1
Total
15.1
19.0
23.223.324.727.329.6
31.532.932.5
Sterling area
Total
4.9
2.8
4.63.93.54.34.4
4.04.23.9
UnitedKing-dom
4.4
2.0
3.72.92.53.23.4
2.93.12.7
Conti-nentalOEEC
countriesand
depend-encies
6.8
6.1
7.07.28.5
10.111.6
13.214.114.4
OtherEuropeancountries
1.0
.6
.5
.5
.5
.6
.6
.7
.6
.6
Canada
0.4
1.5
2.12.32.62.52.7
2.63.03.2
LatinAmericanRepublics
1.0
3.1
3.53.43.43.73.8
4.04.34.7
Allother
countries
1.0
1.7
2.22.52.72.52.6
3.03.12.8
Inter-national
insti-tutions
3.3
3.33.43.53.63.9
4.03.52.9
1 As of September 30.NOTE.—Includes gold reserves and dollar holdings of all foreign countries with the exception of U. S. S. R.
gold reserves, and of international institutions (International Bank for Reconstruction and Development,International Monetary Fund, United Nations, and others). Holdings of the Bank for InternationalSettlements (both for its own and EPU accounts) and of the Tripartite Commission for Restitution cfMonetary Gold are included with the holdings of continental OEEC countries and dependencies. Figuresrepresent (1) reported and estimated gold reserves of central banks and governments, (2) official andprivate short-term dollar holdings reported by banks in the United States, including foreign-held deposits,U. S. Government securities, and certain other short-term liabilities to foreigners, and (3) estimated hold-ings of U. S. Government bonds and notes with original maturities of more than one year. Figures for1937 are not strictly comparable with those for subsequent years owing to exclusion of long-term U. S. Gov-ernment bonds and notes.
Source: Board of Governors of the Federal Reserve System.
199
Digitized for FRASER http://fraser.stlouisfed.org/ Federal Reserve Bank of St. Louis