ERP Appendixes Jan 1952 1
12
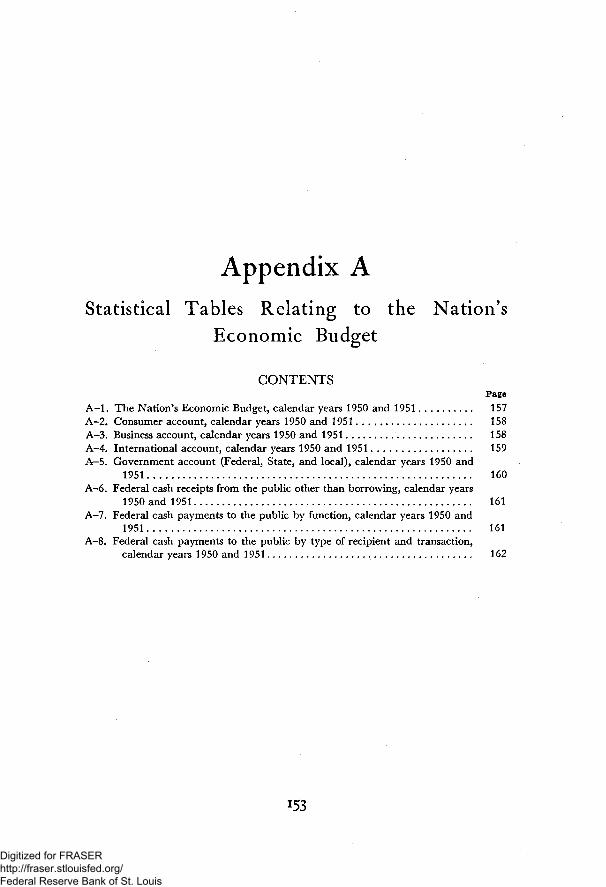
Appendix A Statistical Tables Relating to the Nation's Economic Budget CONTENTS Page A-l. The Nation's Economic Budget, calendar years 1950 and 1951 157 A-2. Consumer account, calendar years 1950 and 1951 158 A-3. Business account, calendar years 1950 and 1951 158 A-4. International account, calendar years 1950 and 1951 159 A—5. Government account (Federal, State, and local), calendar years 1950 and 1951. . 160 A-6. Federal cash receipts from the public other than borrowing, calendar years 1950 and 1951 161 A-7. Federal cash payments to the public by function, calendar years 1950 and 1951 161 A-8. Federal cash payments to the public by type of recipient and transaction, calendar years 1950 and 1951 162 153 Digitized for FRASER http://fraser.stlouisfed.org/ Federal Reserve Bank of St. Louis
-
Upload
fraser-federal-reserve-archive -
Category
Documents
-
view
216 -
download
0
Transcript of ERP Appendixes Jan 1952 1
Appendix AStatistical Tables Relating to the Nation's
Economic Budget
CONTENTSPage
A-l. The Nation's Economic Budget, calendar years 1950 and 1951 157A-2. Consumer account, calendar years 1950 and 1951 158A-3. Business account, calendar years 1950 and 1951 158A-4. International account, calendar years 1950 and 1951 159A—5. Government account (Federal, State, and local), calendar years 1950 and
1951. . 160A-6. Federal cash receipts from the public other than borrowing, calendar years
1950 and 1951 161A-7. Federal cash payments to the public by function, calendar years 1950 and
1951 161A-8. Federal cash payments to the public by type of recipient and transaction,
calendar years 1950 and 1951 162
153
Digitized for FRASER http://fraser.stlouisfed.org/ Federal Reserve Bank of St. Louis

Digitized for FRASER http://fraser.stlouisfed.org/ Federal Reserve Bank of St. Louis
The Na t ion ' s Economic Budge t
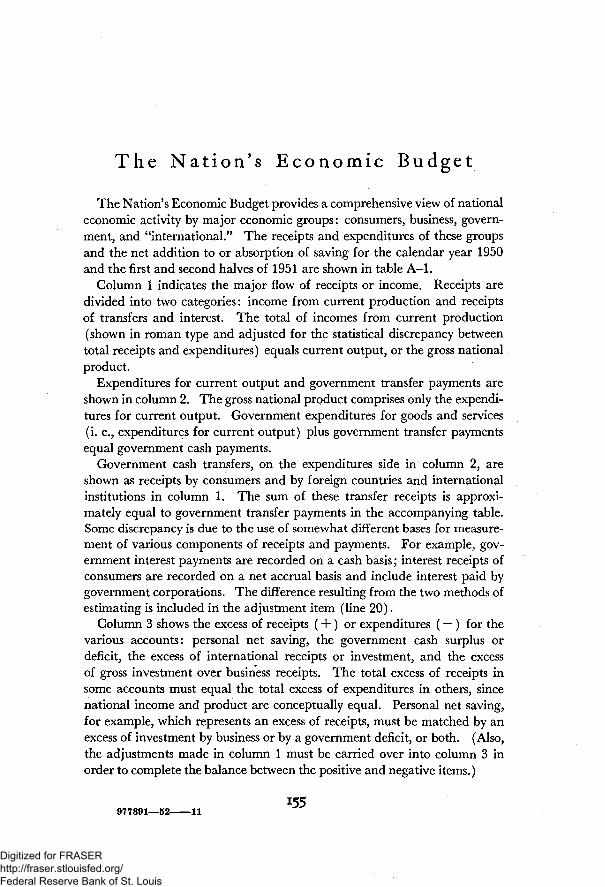
The Nation's Economic Budget provides a comprehensive view of nationaleconomic activity by major economic groups: consumers, business, govern-ment, and "international." The receipts and expenditures of these groupsand the net addition to or absorption of saving for the calendar year 1950and the first and second halves of 1951 are shown in table A-l.
Column 1 indicates the major flow of receipts or income. Receipts aredivided into two categories: income from current production and receiptsof transfers and interest. The total of incomes from current production(shown in roman type and adjusted for the statistical discrepancy betweentotal receipts and expenditures) equals current output, or the gross nationalproduct.
Expenditures for current output and government transfer payments areshown in column 2. The gross national product comprises only the expendi-tures for current output. Government expenditures for goods and services(i. e., expenditures for current output) plus government transfer paymentsequal government cash payments.
Government cash transfers, on the expenditures side in column 2, areshown as receipts by consumers and by foreign countries and internationalinstitutions in column 1. The sum of these transfer receipts is approxi-mately equal to government transfer payments in the accompanying table.Some discrepancy is due to the use of somewhat different bases for measure-ment of various components of receipts and payments. For example, gov-ernment interest payments are recorded on a cash basis; interest receipts ofconsumers are recorded on a net accrual basis and include interest paid bygovernment corporations. The difference resulting from the two methods ofestimating is included in the adjustment item (line 20).
Column 3 shows the excess of receipts ( - f ) or expenditures ( — ) for thevarious accounts: personal net saving, the government cash surplus ordeficit, the excess of international receipts or investment, and the excessof gross investment over business receipts. The total excess of receipts insome accounts must equal the total excess of expenditures in others, sincenational income and product are conceptually equal. Personal net saving,for example, which represents an excess of receipts, must be matched by anexcess of investment by business or by a government deficit, or both. (Also,the adjustments made in column 1 must be carried over into column 3 inorder to complete the balance between the positive and negative items.)
X55977891—52 11
Digitized for FRASER http://fraser.stlouisfed.org/ Federal Reserve Bank of St. Louis

While the summary table on the Nation's Economic Budget gives a com-prehensive view of recent economic changes, additional detail on receiptsand expenditures is needed for analytical purposes, as is shown in the tablesthat follow. More complete statistics for recent years on national incomeand product and their components can be found in the National IncomeSupplement to the Survey of Current Business, July 1951. Data relating tothe cash budget of the Federal Government are from the Budget of theUnited States.
156
Digitized for FRASER http://fraser.stlouisfed.org/ Federal Reserve Bank of St. Louis

TABLE A—1.—The Nation's Economic Budget, calendar years 1950 and 1951
[Billions of dollars, seasonally adjusted annual rates]
Economic group
CONSUMERS
1. Disposable income arising fromcurrent production
8. Government transfers and net inter-est payments ..
3 Disposable personal income4! Personal consumption expendi-
tures ----5 Personal saving (-J-)
BUSINESS
6. Retained receipts from currentproduction
7. Gross private domestic invest-ment
8 Excess of investment ( — )
INTERNATIONAL
9 Cash loans abroad10. Net foreign investment- _.11. Excess of receipts (+) or in-
vestment (— ) _
GOVERNMENT (FEDERAL, STATE, ANDLOCAL)
12 Tax payments or liabilitiesIS. Adjustment to cash basis
14. Cash receipts from the public... .15. Purchases of goods and services. _16 Government transfer payments.
17. Cash payments to the public18. Excess of receipts (+) or
payments (— )
ADJUSTMENTS
19. For receipts relating to grossnational product 2 _ ^
80. Other adjustments 3
21. Gross national product
1950
Re-ceipts
185.2
19.0
804.3
29 7
-.1
69 8-9.0
60.8
.......
-2.1+8.9
282.6
Ex-pendi-tures
193.6
48.9
-2.3
42.518 8
61.3
282.6
Excessof re-ceipts(+) or
ex-pendi-tures
~+'ib~7~
JQ 2
+88
— 5
—2 1+8.9
1951, first half
Re-ceipts
202.8
16.4
819 S
27 6
.5
90 5—18.8
78.3
+2 4+10.1
323.4
Ex-pendi-tures
205.0
62.8
-1.4
56.914.7
71.6
323.4
Excessof re-ceipts(+) or
ex-pendi-tures
~+~U~s~
-35.8
+1 7
+6.7
+2.4+10.1
1951, second half 1
Re-ceipts
209. 6
16 6
886 4
33 2
.8
87 4—7.8
80.8
+5.6
330.3
Ex-pendi-tures
203.8
54.8
1.6
70.115 8
85.3
330.3
Excessof re-ceipts(+) or
ex-pendi-tures
"+88'.~6
-81.6
-1.4
-6.1
+5.5
i Estimates based on incomplete data; fourth quarter by Council of Economic Advisers.« These adjustments bring the estimates on the receipts side into agreement with those on the expendi-
tures side of the accounts. They include the statistical discrepancy less "subsidies less current surplus ofgovernment enterprises." The statistical discrepancy represents the difference between the two inde-pendent estimates of gross national product: income received from current output and expenditures forthis output. "Subsidies less current surplus of government enterprises" are included in national income,but not in the gross national product.
3 "Other adjustments" are net and are the amount necessary for balancing the excess of receipts (+) withthe excess of expenditures (—). They are required because some items of government cash payments areeither not recorded in private receipts at all (such as purchases of existing assets), or they are recorded ina different time period from that in which payment is made. Government cash receipts also include someitems not deducted from private incomes, or deducted in a different period.
NOTE.—Items relating to current production of goods and services are shown in roman type. Transferpayments and receipts and other items not included in the gross national product are shown in italics.Detail will not necessarily add to totals because of rounding.
Sources: Based on the national income and product statistics of the Department of Commerce and onFederal cash receipts from and payments to the public estimated by the Bureau of the Budget and theTreasury Department. See also footnote 1.
Digitized for FRASER http://fraser.stlouisfed.org/ Federal Reserve Bank of St. Louis

TABLE A-2.—Consumer account, calendar years 1950 and 1951
[Billions of dollars, seasonally adjusted annual rates]
Receipts or expenditures
Personal income arising from current production of goods and services:Wage and salary receipts and other labor incomeFarm proprietors' income . _B usiness and professional income 2_. _. _ _DividendsPrivate interest and rental incomeBusiness transfer payments _ .
Total — . . . -Plus:
Net interest paid by governmentDividend on National Service Life Insurance -_ ._Other government transfers to individuals
Equals: Total personal incomeLess* Personal tax and nontax payments
Equals: Disposable personal income -. _ _Less* Personal consumption expenditures 3
Equals* Personal net saving (+)
ADDENDUM
Personal income arising from current production . -Less: Personal tax and nontax payments _„ _
Equals* Disposable income arising from current production
1950
146.413.722.39.2
13.4.8
205, 7
4.72.7
11.6
224.720.5
204.3193.6
+10.7
205.720.5
185. 2
Total i
169.817.023.69.5
14.1.8
234.8
4.8.5
11.2
251.328.4
222.8204.4
+18.5
234.828.4
206.4
1951
Firsthalf
166.516.423.89.2
13.8.8
230.5
4.8.3
11.3
247.027.7
219.3205.0
+14.3
230.527.7
202.8
Secondhalf'
173 017 623 49 8
14 2g
238 8
4 8.8
11 0
255 629 2
226 4203 8
+22 6
238 829 2
209 6
1 Estimates based on incomplete data; fourth quarter by Council of Economic Advisers.2 Includes adjustment for inventory valuation.-3 For detail, see appendix table B-4.
NOTE.—Detail will not necessarily add to totals because of rounding.Source: See table A-l.
TABLE A-3.—Business account, calendar years 1950 and 1951
[Billions of dollars, seasonally adjusted annual rates]
Receipts or investment
Corporate profits before taxLess* Corporate tax liability 3
Dividend payments
Equals* Corporate undistributed profitsPlus* Capital consumption allowances 3
Corporate inventory valuation adjustment 4
Equals: Retained business receipts from current productionLess: Gross private domestic investment: «
New constructionResidential (nonfarm) _ - _Other private construction
Producers' durable equipmentChange in inventories
Total
Equals* Excess of receipts (+) or investment (— ) .
1950
41.418.69 2
13 621.2
—5.1
29.7
22 112.69 5
22.54 3
48.9
—19 2
Total »
44 826 79 5
8 623 5
—1 7
30 4
22 210 811 427 69 1
58 8
—28 4
1951
Firsthalf
48 629 o9 2
10 422 8
—5 6
27 g
23 211 911 326 613 1
62 8
—35 2
Secondhalf i
41 024 49 8
6 824 22 2
33 2
21 29 8
11 428 65 0
54 8
—21 6
1 Estimates based on incomplete data; fourth quarter by Council of Economic Advisers,2 Federal and State corporate income and excess profits taxes.3 Includes capital consumption allowances on noncorporate capital, including residences.* The adjustment measures the excess of the value of the change in the volume of nonfarm business in-
ventories, valued at average prices during the period, over the change in the book value.* For additional detail, see appendix table B-5.
NOTE.—Detail will not necessarily add to totals because of rounding.Source: See table A-l.
158
Digitized for FRASER http://fraser.stlouisfed.org/ Federal Reserve Bank of St. Louis

TABLE A-4.—International account, calendar years 1950 and 1951
[Billions of dollars, annual rates]
Receipts or investment
Receipts:U. S. Government cash long-term loans (net)2 - _ _Plus: Cash payments to International Monetary Fund and Inter-
national Bank _ „ _,
Equals: U. S. Government cash transfers on loans (foreign receipts).
Investment:Surplus of exports of goods and services _. .Less: Net unilateral transfers: fi
Government 6 _. . _ _. .Private
Equals: Net foreign investment . _. __ .. __
Excess of receipts (+) or investment (— )
1950
0.28 -.3
-.1
2.3
4.15
-2.3
+2.2
Total »
0.3
(<)
.3
5.0
4.54
.1
+ 2
1951
Firsthalf
0.3
(4)
.3
3.6
4.64
—1.4
+1 7
Secondhalf1
0.2
(4)
.2
6.5
4.4.4
1.6
—1.4
1 Estimates based on incomplete data; fourth quarter by Council of Economic Advisers.2 Includes only cash withdrawals under loan agreements. Does not include noncash transactions such
as lend-lease and surplus property credits.3 In 1950, the International Monetary Fund returned 262 million dollars in cash to the U. S. Treasury
in exchange for United States notes.4 Less than 50 million dollars.6 Net unilateral transfers are included with government or private expenditures for goods and services.For example, remittances (gifts) made by American citizens to relatives or charitable groups abroad areincluded with consumer expenditures. Government aid in the form of grants is included in governmentpurchases of goods and services. Thus, net unilateral transfers must be deducted from the export surplusto avoid double counting.6 Unilateral aid included in appendix table A-8 is on a Daily Treasury Statement basis and is gross.
NOTE.—Detail will not necessarily add to totals because of rounding.Source: See table A-l.
159
Digitized for FRASER http://fraser.stlouisfed.org/ Federal Reserve Bank of St. Louis
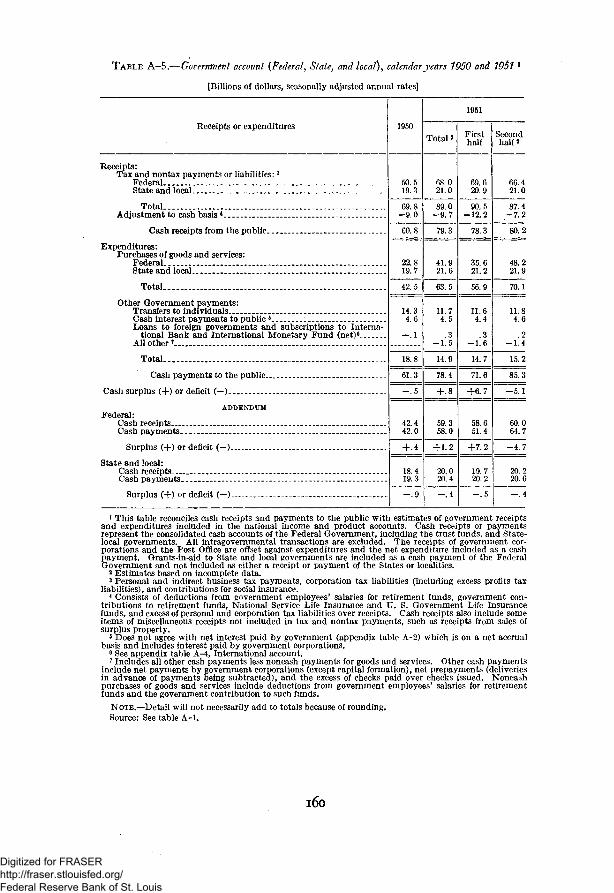
TABLE A-5.—Government account (Federal, State, and local), calendar years 1950 and 1951 J
[Billions of dollars, seasonally adjusted annual rates]
Eeceipts or expenditures
Receipts:Tax and nontax payments or liabilities: 3
FederalState and local _
TotalAdjustment to cash basis *
Cash receipts from the public
Expenditures:Purchases of goods and services:
FederalState and local
Total _
Other Government payments:Transfers to individualsCash interest payments to public 8
Loans to foreign governments and subscriptions to Interna-tional Bank and International Monetary Fund (net)6
All other »
Total
Cash payments to the public
Cash surplus (+) or deficit (— ) . . ...
ADDENDUMFederal:
Cash receiptsCash payments
Surplus (+) or deficit (— ) _
State and local:Cash receiptsCash payments
Surplus (+) or deficit (— )
1950
50 519.3
69.8-9 0
60 8
22.819 7
42.5
14 34.6
—.1
18.8
61.3
-.5
42.442 0
+.4
18.419.3
— 9
Total 2
68 021.0
89.0—9 7
79 3
41.921 6
63.5
11 74.5
.3—1.5
14.9
78.4
+.8
59.358 0
+1.2
20 020.4
— 4
1951
Firsthalf
69 620.9
90.5— 12 2
78 3
35.621 2
56.9
11 64 4
.3-1.6
14.7
71.6
4-6 7
58.651 4
+7.2
19 720.2
— 5
Secondhalf 2
66.421.0
87.4—7.2
80.2
48.221.9
70.1
11.84.6
.2-1.4
15.2
85.3
-5.1
60.064.7
-4.7
20.220.6
— 4
1 This table reconciles cash receipts and payments to the public with estimates of government receiptsand expenditures included in the national income and product accounts. Cash receipts or paymentsrepresent the consolidated cash accounts of the Federal Government, including the trust funds, and State-local governments. All intragovernmental transactions are excluded. The receipts of government cor-porations and the Post Office are offset against expenditures and the net expenditure included as a cashpayment. Grants-in-aid to State and local governments are included as a cash payment of the FederalGovernment and not included as either a receipt or payment of the States or localities.
2 Estimates based on incomplete data.3 Personal and indirect business tax payments, corporation tax liabilities (including excess profits tax
liabilities), and contributions for social insurance.4 Consists of deductions from government employees' salaries for retirement funds, government con-
tributions to retirement funds, National Service Life Insurance and U. S. Government Life Insurancefunds, and excess of personal and corporation tax liabilities over receipts. Cash receipts also include someitems of miscellaneous receipts not included in tax and nontax payments, such as receipts from sales ofsurplus property.
5 Does not agree with net interest paid by government (appendix table A-2) which is on a net accrualbasis and includes interest paid by government corporations.
6 See appendix table A-4, International account.7 Includes all other cash payments less noncash payments for goods and services. Other cash payments
include net payments by government corporations (except capital formation), net prepayments (deliveriesin advance of payments being subtracted), and the excess of checks paid over checks issued. Noncashpurchases of goods and services include deductions from government employees' salaries for retirementfunds and the government contribution to such funds.
NOTE.—Detail will not necessarily add to totals because of rounding.Source: See table A-l.
160
Digitized for FRASER http://fraser.stlouisfed.org/ Federal Reserve Bank of St. Louis

TABLE A-6.—-Federal cash receiptsfrom the public other than borrowing, calendar years 1'950 and 1951
[Billions of dollars, seasonally adjusted annual rates]
Source
Direct taxes on individuals . __ _ _ _Direct taxes on corporationsEmployment taxes _ __Excises and customs _ _Deposits by States, unemployment insuranceVeterans' life insurance premiums _OtherLess: Refunds of receipts
Total Federal cash receipts from the public
1950
19.29.93.48.61.2.5
1.7-2.2
42.4
Total i
27.216.54.39.21.5.5
2 2-2.1
59.3
1951
Firsthalf
26.616.54.29.21.4.6
2 1—2. 1
58.6
Secondhalf»
27.816.54.49.21.6.5
2.2-2.1
60.0
i Estimates based on incomplete data.
NOTE.—Detail will not necessarily add to totals because of rounding.Source: See table A-l.
TABLE A—7.—Federal cash payments to the public by function., calendar years 1950 and 1951
[Billions of dollars, seasonally adjusted annual rates]
Function
Military services ___International security and foreign relationsVeterans' services and benefits.. _ - _ _ _ _ _ _ _ _ _Social security, welfare, and healthAgriculture and agricultural resourcesInterest _OtherDeduction from Federal employees' salaries for retirementClearing account for outstanding checks and telegraphic reports
Total Federal cash payments to the public
1950
13.54.08.93.31.34.37.1-.4
42.0
Total i
30.64 86.04 4.9
4.27.4
— . 4.1
58 0
1951
Firsthalf
25.45.05.94 3.7
4.16.3
— . 4—.1
51.4
Secondhalfi
35.84.66.14.51.04.38.5-.4
.3
64.7
i Estimates based on incomplete data.NOTE.—Detail will not necessarily add to totals because of rounding.Source: See table A-l.
161
Digitized for FRASER http://fraser.stlouisfed.org/ Federal Reserve Bank of St. Louis
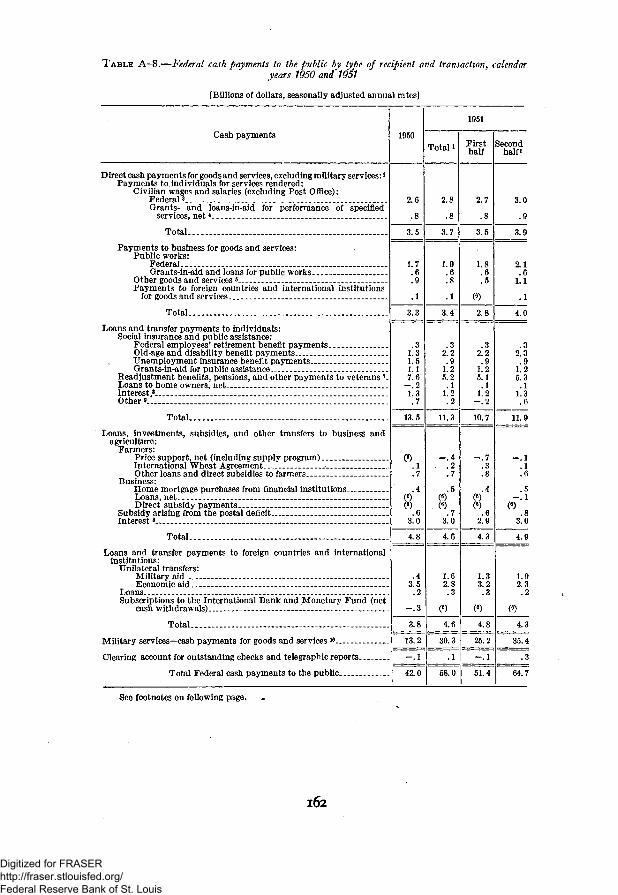
TABLE A~8.—Federal cash payments to the public by type of recipient and transaction, calendaryears 1950 and 1951
[Billions of dollars, seasonally adjusted annual rates]
Cash payments
Direct cash payments for goods and services, excluding military services: 2
Payments to individuals for services rendered:Civilian wages and salaries (excluding Post Office):
Federal 3Grants- and loans-in-aid for performance of specified
services, net * _ _.
Total
Payments to business for goods and services:Public works:
FederalGrants-in-aid and loans for public works
Other goods and services 5 :Payments to foreign countries and international institutions
for goods and services . _ _ _
Total
Loans and transfer payments to individuals:Social insurance and public assistance:
Federal employees' retirement benefit payments ...Old-age and disability benefit paymentsUnemployment insurance benefit paymentsGrants-in-aid for public assistance
Readjustment benefits, pensions, and other payments to veterans 7.Loans to home owners, netInterest^8 _Other «_ .
Total
Loans, investments, subsidies, and other transfers to business andagriculture:
Farmers:Price support, net (including supply program)International Wheat AgreementOther loans and direct subsidies to farmers _.
Business:Home mortgage purchases from financial institutions .Loans, netDirect subsidy payments
Subsidy arising from the postal deficitInterest 8_-
Total
Loans and transfer payments to foreign countries and internationalinstitutions:
Unilateral transfers:Military aidEconomic aid
LoansSubscriptions to the International Bank and Monetary Fund (net
cash withdrawals) .
Total
Military services — cash payments for goods and services ̂
Clearing account for outstanding checks and telegraphic reports..
Total Federal cash payments to the public
1950
2 6
.8
3.5
1 7.6.9
.1
3 3
.31 31.51.17.6"
— .21.3.7
13 5
(6).1.7
.4(6)
(66
3.0
4.8
.43 5.2
-.3
3.8
13.2
-.1
42.0
Total *
2 8
.8
3.7
1 9.6.8
.1
3 4
.32 2.9
1.25.2.1
1.2.2
11 3
—.4.2.7
.5(6)(6)
73.0
4.6
1.62 8.3
(6)
4.6
30.3
.1
58.0
1951
Firsthalf
2 7
.8
3.5
1 8.6.5
(6)
2 8
.32 2.9
1.25.1.1
1.2— 2
10 7
— 7.3.8
.4(6)
CO.6
2.9
4.3
1.33 2.3
(6)
4.8
25.2
—.1
51.4
Secondhalfi
3 0
.9
3 9
2 1.6
1.1
.1
4 0
.32 3
91.25.3
11.3
6
11 9
— l16
5— 1
(«).8
3.0
4.9
1.92 3.2
(6)
4.3
35.4
.3
64.7
See footnotes on following page.
162
Digitized for FRASER http://fraser.stlouisfed.org/ Federal Reserve Bank of St. Louis
1 Estimates based on incomplete data.2 Differs from the national-income concept of "government purchases of goods and services" by exclud-ing, in addition to military services, farm price-support expenditures, and unilateral aid to foreign coun-tries. Grants to States and localities for public works, here included as a Federal expenditure, would beincluded in the national-income accounts as a State and local expenditure. There are other less significantdifferences between the two concepts.3 Excludes payroll deductions for Federal employees' retirement.
* Includes all grants-in-aid and loans to public bodies for purposes other than public works and publicassistance. Includes, in addition, one-third of Federal expenditures for veterans' tuition, books, andsupplies.
* This figure is obtained as a residual by deducting all other expenditures from total cash payments to thepublic. Owing to the fact that data are incomplete for calendar year 1951, the residual is subject to a highmargin of error.6 Less than 50 million dollars.
7 Includes cashing of terminal leave bonds, retired pay of military personnel, and National Service andGovernment Life Insurance refunds and benefits in addition to veterans' pensions and readjustment bene-fits. Includes only one-third of payments for veterans' tuition, books, and supplies.
8 Includes a small amount of interest on tax refunds in addition to interest on the public debt. Interestpaid to business includes over 100 million dollars of interest paid each year by the Federal Government toState and local governments. Interest in appendix table A-2 is net, and is on an accrual rather than acash basis; it includes interest paid by State and local governments and by government corporations.
9 During the period shown, represents in large part some of the transactions of the Federal Home LoanBanks.
10 Excludes retired pay and redemption of Armed Forces Leave Bonds which are included above as pay-ments to veterans.
NOTE.—Detail will not necessarily add to totals because of rounding.Source: See table A-l.
163
Digitized for FRASER http://fraser.stlouisfed.org/ Federal Reserve Bank of St. Louis

Digitized for FRASER http://fraser.stlouisfed.org/ Federal Reserve Bank of St. Louis