ERIC ACC. NO. Ellie REPORT RESUME IS DOCUMENT … · Ellie REPORT. RESUME. IS DOCUMENT COPYRIGHTED?...
330
OE FORM 6000, 2169 DEPARTMENT OF HEALTH. EDUCATION. AND WELFARE OFFICE or EDUCATION ERIC ACC. NO. ED 043 791 Ellie REPORT RESUME IS DOCUMENT COPYRIGHTED? YES 0 NO 1E ERIC REPRODUCTION RELEASE? yEB 0 NO 0 LEVEL OP AVAILABILITY 1E1 io nu CH ACC. NO. AA 000 626 P.A. 24 PURL. DATE ISSUE Aug 70 RIEMAR71 AUTHOR Fitzpatrick, Edmund W. . TITLE Model for Designing a System to Individualize Instruction and Guarantee Learning. Final Report. SOURCE COPE BBB02043 INSTITUTION (SOURCE) Sterling Institute, Washington D.C. SP. AG. CODE BBB02778 SPONSORING AGENCY NCERD (DHEW/OE), Washington, D.C. EDRS PRICE 1.25;16.55 CONTRACT NO. GRANT NO. REPORT NO, BUREAU NO. BR-8-0447 AVAILABILITY JOURNAL CITATION DESCRIPTIVE NOTE 329p. DESCRIPTORS *Curriculum Development; *Course Organization; *Individualized Instruction; *Learning Processes; *Educational Technology; Educational Research; Economics; Behavioral Objectives; Teaching Models IDENTIFIERS ABSTRACT This final report concerns a pioneering, three-year curriculum development project dedicated to translating recent learning theory and laboratory findings into operational practice in an existing educational institution. This project produced a highly successful and unique course that teaches two semesters of economics that students can master in from six weeks to one semester's time. In the course, students negotiate individual learning contracts with instructors, making decisions on what they will study, what media they will use, and how fast they expect to progress. Detailed performance specifications were prepared first, and then media were selected and materials developed that would most effectively and efficiently meet those specifications. The report explains how the course was developed, including the rationales, methods, and procedures which were empirically tested.. Only a few educational development projects comparable to this in scope and goals have been conducted. None appears to have been documented in the form of ;developmental model for use by others, as is done here. (Certain pages may not ibe reproducible due to marginal legibility.) (Author/DB) op 0 670.390
Transcript of ERIC ACC. NO. Ellie REPORT RESUME IS DOCUMENT … · Ellie REPORT. RESUME. IS DOCUMENT COPYRIGHTED?...

OE FORM 6000, 2169DEPARTMENT OF HEALTH. EDUCATION. AND WELFARE
OFFICE or EDUCATION
ERIC ACC. NO.
ED 043 791
Ellie REPORT RESUME
IS DOCUMENT COPYRIGHTED? YES0 NO 1E
ERIC REPRODUCTION RELEASE? yEB 0 NO 0LEVEL OP AVAILABILITY 1E1 io nu
CH ACC. NO.
AA 000 626
P.A.
24
PURL. DATE ISSUE
Aug 70 RIEMAR71AUTHORFitzpatrick, Edmund W. .
TITLE
Model for Designing a System to Individualize Instruction and Guarantee Learning.Final Report.
SOURCE COPE
BBB02043
INSTITUTION (SOURCE)
Sterling Institute, Washington D.C.SP. AG. CODE
BBB02778
SPONSORING AGENCY
NCERD (DHEW/OE), Washington, D.C.EDRS PRICE1.25;16.55
CONTRACT NO. GRANT NO.
REPORT NO, BUREAU NO.BR-8-0447
AVAILABILITY
JOURNAL CITATION
DESCRIPTIVE NOTE
329p.DESCRIPTORS
*Curriculum Development; *Course Organization; *Individualized Instruction;*Learning Processes; *Educational Technology; Educational Research; Economics;Behavioral Objectives; Teaching Models
IDENTIFIERS
ABSTRACTThis final report concerns a pioneering, three-year curriculum development projectdedicated to translating recent learning theory and laboratory findings intooperational practice in an existing educational institution. This project produceda highly successful and unique course that teaches two semesters of economics thatstudents can master in from six weeks to one semester's time. In the course,students negotiate individual learning contracts with instructors, making decisionson what they will study, what media they will use, and how fast they expect toprogress. Detailed performance specifications were prepared first, and then mediawere selected and materials developed that would most effectively and efficientlymeet those specifications. The report explains how the course was developed,including the rationales, methods, and procedures which were empirically tested..Only a few educational development projects comparable to this in scope and goalshave been conducted. None appears to have been documented in the form of;developmental model for use by others, as is done here. (Certain pages may not
ibe reproducible due to marginal legibility.) (Author/DB)
op 0 670.390

.00
MODEL FOR DESIGNING A SYSTEM TO INDIVIDUALIZE
INSTRUCTION AND GUARANTEE LEARNING:
A FINAL REPORT
Educational Technology Centerof Sterling Institute, Inc.2600 Virginia Avenue, N.W.Washington, D.C. 20037
August 1970
000
e,7Z./477
c'2Y.
FINAL REPORT
Contract'No. N00600-68-750
MODEL FOR DESIGNING A SYSTEM TO INDIVIDUALIZEINSTRUCTION AND GUARANTEE LEARNING
Edmund W. FitzpatrickEducational Technology Centerof Sterling Institute, Inc.2600 Virginia Avenue, N.W.Washington, D.C. 20037
August 1970
U.S. DEPARTMENT OFHEALTH, EDUCATION, AND WELFARE
Office o_ f EducationNational Center for Educational Research and Development
CDUCATIONAT, TECHNOLOGY CENTER

PREFACE
,
I
.
The project reported here has major implicationsfor many of our urgent educational problems. It deals withIlLhe process of how to "guarantee" learning. The process orcurriculum development model, employed in the project evolvedon the hard testing ground of operational reality--where manyfine theoretical models have met with sharp defeat.
The model is radically different from the conventional,approach of designing instruction, so it is understandablethat the "course" it produced is radically different fromother courses. Both the model and the course represent abold attempt to make a greatly needed quantum jump in educa-tional practice. The results of the project--supported byempirical data--are highly positive and very gratifying tothose who dedicated their efforts to its success.
Educators who are familiar with projects of this typeknow. the high risks of failure involved. And if indeed failureoccurs, it takes place in the showcase of day to day schooloperations and involves many students, instructors, and admini-strative staff. Yet the risk is directly related to the poten-tial gain, such as that which resulted from this project.
This project was initiated and funded by the U,S.Office of Education's Division Of Comprehensive and VocationalResearch (National Center for Educational Research andDevelopment) out of a firm belief that such risks must be takenif there, is to be progress. Risk taking, even for the bestreasons, is not easy for any organization, particularly afederal agency involved in the sensitive field of education.Recognition should be given to Mr. Robert E. Pruitt, Directorof the Division of Comprehensive and Vocational Research, andDr. Richard B. Otte, the Project Officer for this project, fornot only their courage but the quality of their personal involve-ment'in the project from its start to its completion.
. The project was conducted in cooperation with theU.S. Naval Academy, with Dr. Jesse Koontz the Project Officerfor the Navy.
EDUCATIONAL TECHNOLOGY' CENTER

TABLE OF CONTENTS
ABSTRACT
LIST OF ILLUSTRATIONS
Chapter
I. INTRODUCTION 1
II. PROJECT PLANNING 5
iv
The Systems ApproachPreliminary Planning
III. PREPARE COURSE DESCRIPTION 14
Define Target PopulationResources and ConstraintsMacro-Planning Chart
IV. DEFINE BEHAVIORAL OBJECTIVES 23
BackgroundProject ActivitiesNature of the ProblemAttempts at ResolutionSummary of Successful Approach
V. PREPARE TEST ITEMS 49
Rationale for Test-Item DesignProcedural Considerations
VI. SEQUENCE INSTRUCTIONAL ACTIVITIES 55
Sequencing Concept AreasSequencing TopicsSequencing RemediationSequencing EnrichmentSequencing Other Activities
-1- CDUCA.TLONAL TECHNOLOGY CENTER

Chapter
VII. SELECT THE MEDIA 65
Problems EncounteredThe New SchemeStep' 1: Micro-Criteria AnalysisStep 2: Macro-Criteria Analysis
Level of ConcernProgramming StrategyInstructor - Student -Media InteractionsUtilization of Macro-Criteria
VIII. PREPARE MATERIALS 86
Presentation StrategiesMaterials SpecificationsProducing the MaterialsPreliminary TryoutsComments on Parallel Development
IX. COURSE EVALUATION . 102
Two-Semester ProcessA Methodological IssueValidation TrialEvaluation SemestorStaffing, Organization, and Costs
X. CONCLUSIONS AND RECOMMENDATIONS 123
Major ConclusionUsefulness of the ModelRecommendations
r.DucaTzoNAL TECHNOLOGY CENTER

APPENDICES
A. Description of Components of the,Course
B. Comments on Media Applications
C. Sample of Items from Kit for Materials Preparers
D. Economics Course Outline
E. Excerpt from List of Summarized Objectives
F. Excerpt from TR-5.31, "Preliminary Tryouts:Economics Course"
G. Excerpt from TR-5.35, "Preliminary ValidationReport for Multi-Media Economics Course"
H. Internal Memorandum #87-R, "Explanation ofMaterials Revision Process Based on EmpiricalResults"
I. Excerpt from TR-5.39, "Final Validation Report"
J. Excerpt from TR-5.40, "Final Evaluation Report"
-
EDUCA.TLONAL TECHNOLOGY CENTER

ABSTRACT
This final report concerns a pioneering, three-year
curriculum development project dedicated to translating recent
laming theory and laboratory findings into operational
practice in an existing educational institution. This project
produced a highly successful and unique course that teaches
two semesters of economics that students can master in from
six weeks to one semester's time. In the course, students
negotiate individual learning contracts with instructors,
making decisions on what they will study, what media they will
use, and how fast they expect to progress. Detailed perfor-
mance specifications were prepared first and then media were
selected and materials developed that would most effectively
and efficiently meet those specifications.
The report explains how the course was developed, including
the rationales, methods, and procedures which were empirically
tested. Only a few educational development projects comparable
to this in scope and goals have been conducted. None appears
to have been documented in'the form of developmental model for
use by others, as is done here.
-iv-
EDUCATIONAL TECHNOLOGY CENTER

LIST OF ILLUSTRATIONS
Figure
1. Instructional Systems as Subsystems
2. Model for a Single Instructional System
I3. Macro Planning Chart for Concept Area I
I 4. Top Three Levels of Hierarchy Chart inEarly Stage of Development
5. Example of a Performance Objective
6. Example of a Criterion Test Item
7. Major Hierarchical Groupings of Objectives
8. Alternative Sequencing of Concept Areas
9. Micro Sequencing for Concept Area One
10.. Micro-Criteria for Use in Media Selection
11. Media Analysis and Selection Process
12. Illustration of Evaluation Concept Employed
13. Project Organization
-v-
CDUCATIONAL TIOCIINOLOGY CIENTIM

CHAPTER
INTRODUCTION
In early 1967, the Educational Technology Center of
Sterling Institute initiated in Washington, D.C., a major,
pioneering Multi-Media Curriculum Development Project. The
sponsors of the MMCD project were the U.S. Office of Education
and the U.S. Navy. The purpose of the project was to produce
the "best possible" educational course "by utilizing simultan-
eously each of several recent advances in the state of the
art of educational technology."1 The advances to be utilized
were identified as the following:
. Systems and operations analysis in planning
. Identifying and stating educational and trainingobjectives
. Rationales for media employment
. Research in techniques for the programming andutilization of materials in' the several media
. Empirical process of materials revision2
The solicitation material expressed the fact that
primarily these advances were (a) of a theoretical nature or
(b) based on experiments that have yet to be applied in
operating environments. The problem, from the standpoint of
project activities, was to translate this research into
1U.S. Navy Purchasing Office,.solicitation material
for procurement N00600 -68 -B- -0022, Step 1, July 20, 1967.
2Ibid.11/...11 -1-CDUCAT/ONAL TECHNOLOGY CEN'Ili'a

technology--i.e., to apply these advances in a real-life,
operational setting under the constraints of time, money,
manpower, and the limits of knowledge, to produce the "best
possible" course.
The Educational Technology Center (ETC) proposed a
conceptual model and a detailed technical approach that sought
to reflect the latest advances in educational technology and
educational research.3 The technical approach took the form
of a detailed plan that described how the new theoretical and
experimental advances would be applied in the project.
The course that resulted from this project has proved
to be very successful. The course is both validated and
replicable. The course, which is currently in operation,
has been described by the Educational Technology Center with
the following paragraphs:
A highly individualized, "multi-media" introductoryeconomics course that virtually guarantees learning has'been developed by the Educational Technology Center ofSterling Institute. This course, developed under thejoint sponsorship of the U.S. Office of Education andthe U.S. Navy, has been operationally tested at theU.S. Naval Academy in Annapolis, Maryland, sinceJanuary, 1969. While senior economists state thatthe course teaches two semesters of economics, somestudents complete the course in one third of a semester,
3Educational Technology Center, Development of a
Multi-Media Course in Economics for the United States NavalAcademy: Technical Proposal 1 (Washington, D.C.: SterlingInstitute, 1967). TITITIFFEFr referred to as TechnicalProposal 1.)
-2-
EDUCATIONAL TECHNOLOGY CENTER

and all students can complete it in a single semester.A variety of media. are employed, including self-
, instructional audio packages, self-instructionalprinted packages, computer-based simulation models
I on commercial time-sharing systems, and 16 mm. film.
In the course, students negotiate learning contractswith instructors, making decisions on what they willstudy, what media they will use, how fagt they expectto progress, and so forth. The student can largelydetermine what enrichment activities, if any,,he willtake part in or conduct, including any he wishes tooriginate himself. Essentially, all that is requiredfor a student to "pass" the course is that he be. ableto pass a series of comprehensive criterion-referencedtests relating to core requirements.
The course consists of four major concept areas,Basic Economics, Macro Economics, Micro Economics, andDomestic and International Issues. These concept areasconsist of thirty-five topics organized into over 100core and enrichment "segments." Each segment, averagingabout thirty to fifty minutes of student learning time,is designed to produce specific, measurable learning.
Criterion-referenced pretests and post tests areused for course units. and concept areas. Practiceproblems and illustrations are embedded in the learning.Self-tests are strategically located so students canevaluate their own progress. In responding to practiceproblems and other test items, the student uses a small,portable response device called a QRS (Quick ResponseSystem). A light comes on only when a student pressesthey key for'the correct answer. At the same time, theQRS maintains a record of both incorrect and correctresponses, in the form of a computer-processable punchedcard.4
4Paragraphs provided by the Educational Technology
Center, Washington, D.C., January 5, 1970.
-3-
ientiCATIO7Att. TEciugoLocw cENTER

In the semester ending in January of 1970, ninety-
.eight percent of the students achieved eighty percent or
more of the core objectives of the course, and some ninety
percent of the students *achieved a substantial number of
enrichment objectives (i.e., earned sufficient enrichment
points to raise their grade level to a "B" or more).5
Appendix A provides a description of the components of the
course, while Appendix B provides comments on media appli-
cations in the course.
5The Academy gave a grade of "C" if a student achieved
all of the core objectives and a "B" or an""A" depending onhow many enrichment objectives he also achieved. The over-whelming majority of students earned B's and A's.
-4-
EDUCATIONAL TRCDNOLOGY CENTER

CHAPTER II
PROJECT PLANNING
Perhaps the fundamenthl reason for the success of the
Multi-Media Curriculum Development Project was the philosophy
underlying its preliminary planning and subsequent management.
This philosophy may be referred to as the "systems approach."
It included the view that a primary function of project
planning and management was to optimize among alternatives in
most effectively and economically achievihg the specified
goals. Thus, the identification of alternatives and alloca-
tion of resources in a way judged to be optimal were activities
growing out of this philosophy.
Since the systems approach was the guiding philosophy
in planning and managing the project, it is important that the
view of this approach, as held by the project management, be
described before specific project planning and manageMent
activities are dealt with.
-5-
1::1UCATIONAL TECJINOLOGY CENThii

The Systems Approach
The systems approach may be defined as the applica-
tion of scientific methods and tools to the prediction and
comparison of the values, effectiveness, and costs of a set
of alternative courses of action involving man-machine
systems.1
The systems approach seeks to take into account
the interrelationships of all significant elements of a
problem and of its solution--hence the term "system."
A system must be goal-directed. In education, the goal
is learning. It is important to be able to know if a system
is achieving its goals. More specifically, it should be possible
to measure (a) when and how well a specific goal is being
met by the system and m which system elements are contribu-
ting in an acceptable way toward meeting that goal. This calls
for precision in designing a new system or identifying the
significant elements in an.existing system. In addition, it
also calls for a "feedback loop," i.e., a means for measuring
effectiveness, for evaluating the results, and for modifying or\
revising the system, as necessary, to better meet the goal..
)( 1-Donald W. Meals, "Heuristic Models for SystemsPlanning," Phi Delta Kansan, January, 1967.
-6-EDUCATIONAL TECUNOLOGY CENTER

Note that the term "systems," as used in "systems
approach," is plural. This underlines a key concept of the
systems approach, namely that every system is a subsystem of
a larger system. Our concern may be with a University's
School of Education as an instructional system, or we may be
concerned with a specific course taught by a specific
instructor in one department of that school. In any case, it
is important to recognize, for planning and management, that
each of these instructional systems is a subsystem of a larger
system, and therefore must be responsive to the needs (or
"constraints ") of that larger system. An illustration of this
relationship is given in Figure 1.
UniversityINSTRUCTIONALSYSTEMS
School
vamml Department
Course
Fig. 1.--Instructional Systems as Subsystems
ODUCATIONAL TECIINOLOGY CroNTER

The concept illustrated in Figure 1 is intended to
aid the planner-manager to broaden the scope of variables he
must consider as possibly relevant to a problem or its solu-
tion. The objective is to guard against overlooking key
variables, which Goodladv for example, believes to be a
primary cause of the practical ineffectiveness 'of much of the
curriculum research beimg reported today.2 It must be clearly
understood that each "system" operates within an "environment"
that is at least partially created by the larger system of
which it is a part.
Let us consider the position of the instructor at a
university. An instructor cannot develop a course and present
it at a university with complete disregard for his fellow
faculty membersi.the department, the school, and other factors.
While he may have much freedom in creating his course, he must
take into account the constraints imposed by the "larger
system." If he.fails to do .this, his course may "fail." 3
There is a relationship between the goals stated and
the system needed to accomplish the goals. In a university,
the goals of each school should be a subset cf the university
2John I. Goodlad, "Curriculum: State of the Field,"
Review of Educational Research, XXXIX, No. 3 (Washington, D.C.:American Educational Research Association, 1969), 367-375.
3Indeedd it may be argued that the major reason for
the failure of innovation after innovation in our school systemshas been because some of the most relevant variables are beingoverlooked.
EDUCATIONAL TECHNOLOGY CENTER

goals. Similarly, the goals of a department should 'be a
subset of the goals of the school. The point is that the
goals selected for the larger system have an impact on what
are acceptable goals for the smaller systems (i.e., subsystems)
of which it is composed. In designing an instructional system,
one of the first activities is to ascertain the general goals
of the larger system (e.g., the economics department) to
help ensure that goals specified for a smaller system (e.g.,
a course within the department) will be compatible. Having
specified "compatible" goals, a system can be designed with
a higher probability of meeting them.4
In the systems approach, system elements--people,
materials, equipment, procedures', strategies, etc.--must be
justified or justifiable, in a measurable way, in terms of
their contributions, quantitatively and qualitatively, to
achieving the specified goals. The feedback-evaluation-
revision process is intended to determine how well a particu-
lar component is performing. If the performance is below the
minimum acceptable level, the element must be modified or
eliminated (perhaps to be replaced with some alternative).
4It is not at all unusual for an organization to havegoals that are entirely unrealistic in terms of the systemwhich exists. For example, the system needed to "cradieetecrime" in a city may have little relationship to the existingsystem.
-9-
EDUCATIONAL TECHNOLOGY CENTER

Applying this to the design of an instruction system
would mean that if the student-learning goals were not
achieved the system elements would be evaluated and modified
6r replaced as necessary to improve overall system performance.
It would mean that all components of the systemincluding
teachers and administrators--would be held accountable for
performing certain functions in an acceptable way.
Preliminary Planning
The systems approach, as described above, provided
the framework for planning and conducting the Multi-Media
Curriculum Development Project. Within this framework, a
conceptual model of the end-product of the project was
prepared and a detailed plan for producing that product was
laid out.
Conceptual Model
It was concluded, after reviewing the solicitation
material provided by the government, that it would be appropriate
to develop a multi-media/methods course which reflected the
-10-
1:1DHCATZONATA TECHNOLOGY CCNTR12

model shown in Figure 2. 5 It was stated in the proposal
that a course produced in conformance with this model would
have the following characteristics:
. Course content would support specific behavioralobjectives.
. Types and conditions of learning judged most efficientin inducing the specified behaviors wcolld largelydetermine the media and methods to be employed.
. Measures of attainment of behavioral objectiveswould be quantitative, and while testing situationsmight vary, all test results would be maintained incomputer storage.
. The computer would use test results in conjunctionwith other data to generate prescriptions of learningpackages for students.
. Each learning package would be empirically validated.
. Characteristics of the individual sample of behavioralobjectives would provide the basis of each student'slearning package.
. At the end of a particular package, the student wouldreceive almost emmediate knowledge of results, workat his own pace, and have a high degree of successin the learning situation.
. Much of the instructional material would be of aself-instructional nature. 6
5 Model for a Single Course Instructional System from"Designing an Organic Curriculum," paper prepared by R.M.Morgan and D.S. Bushnell (Bureau of Research, U.S. Office ofEducation, Washington, D.C., 1966).
'6 Educational Technology Center, Development of a Multi-Media Course in Economics for the United States Naval Academy:Technical Proposal 1 (Washington, D.C.: Sterling Institute,1967), p.
BDUCAT/ONA T., TECHNOLOGY CENTER

COURSECONTENT
LEARNER
METHOD/MEDIAINPUTPRESCRIPTION
SPECIFICBEN AVIORALOBJECTIVES
MEASUREMENTATTAINMENTOFSEM AVIORAI-OEJECTIVES
COMPUTERSTORAGE
METHOD/MEDIAMODULES
PI
O AUDIO -TAPE
LAS DEMOS
SWIM FILM
SELECTED TEXT
TUTOR
O SIMULATION
ITV
SLIDE/TAPE
GROUP DISC.
CAI
LECTURE
O WORK PROJECT
Fig. 2.--Model for a Single Instructional System
Source: Model for a Single Course Instructional System from "Designing anOrganic Curriculum," paper prepared by R.M. Morgan and D.S. Bushnell(Bureau of Research, U.S. Office of Education, Washington, D.C., 1966).

Program Plan
The preliminary planning activities produced a complete
"Program plan" for producing a course resembling the model.
This plan included task descriptions, staffing estimates,
budgets, schedules, and other comparable items bearing on
time, money, manpower, and techniques. A total of fourteen
tasks were defined, to be accomplished in three phases over
three years. The names of the tasks planned were:
1. Prepare Course Descriptions2. Define Core Behavioral Objectives3. Sequence Core Behavioral Objectives4. Specify Additional Behavioral ObjectivesS. Prepare Test Itens6. Prepare Criterion Referenced Tests7. Prepare Norm Referenced Tests8. Select Media9. Prepare Materials
10. Develop Evaluation Plan11. Write and Debug Computer Programs12. Course Validation and Design Document Revision13. Revise Material:;14. Prepare Final Report
-13-
EDUCATIONAL TECHNOLOGY CENTER

CHAPTER III
PREPARE COURSE DErCRIPTION
The first formal task, based on the program plan, was
to "Prepare a Course Description." The scope of thiS task was
much larger than its title implies, since it was directed
toward defining the general goals of the new course, the envir-
onment within which the new course would be presented, the
characteristics of the target population, and other major
variables and constraints that applied to the development of
the course.
Define Target Population
'A primary consideration in designing any instructional
program is who the program is for and what these students will
be like when they start the program. The characteristics of
the target population have implications for virtually all
aspects of the program design and, for this reason, it is
important to "define" the target population at an early stage
in the design activities.
The specific characteristics of the target group,
including the degree of homogeneity or heterogeneity, provide
information needed to most effectively make decisions in
such areas as the following:
EDOCATDONAL TECHNOLOGY CENTER

1. Knowledges and skills to exclude because the targetgroup possesses them
2. Entry competencies to plan for in knowledge-skillareas pertinent to the'program
3. Probable areas for prerequisite deficiencies
4. Attitudes to contend with, positive and negative,including level of achievement motivation
5. Probable differences in learning rates or amountsof,learning per unit of time
6. Appropriateness of different instructional strate-gies, including media applications
The importance of such information for decision-
making was fully understood in the MMCD Project. Accordingly,
formal steps were taken to obtain all "readily available"
information regarding the target population for the new multi-
media economic analysis course at the Naval Academy.
The types of information sought may be summarized as
follows:1
I. Size and location
a) Size of target population and rate of increaseor decrease
b) Location of the group
c) The instructional "unit" size (e.g., 1,000freshmen college students, thirty studentsper class and six classes), if one current'exists
1It should be emphasized that this refers to informa-
tion sought. This does not mean each item of desired informa-tion was obtained.' Only "readily available" data were
enuewrrom.r. Tam Noway CENTER ---Ined, and these were verY limited

2. Achidvement
a) Scores (mean, range, and standard deviation)on standardized, national achievement tests
b) Scores (mean, range, and standard deviation)on validated local achievement tests, and onany. tests that will provide information aboutachievement levels in those areas that thecourse will deal with.
3. Interests, aptitudes, and personality
a) Expressed interests of the group
b) Group interests as measured on valid tests
c) Aptitudes as measured on valid tests.
d) Valid data about personality characteristicsof group members
(1) Rate of learning(2) Style of learning(3) Autonomy needs(4) Affiliation needs(5) Achievement motivation(6) Anxiety level(7) Cautiousness(8) Original thinking
.(9) Personal relations
4. Socio-economic information
-16-
IlUCATICKSTATa TIOCIINCI LOGY CRLIT PAZ o

Resources and Constraints
Much of the effort relating to the prepa'ration of the
Course Description document involved identifying possibly
relevant resources and constraints, as was originally planned.
It is of much benefit to all subsequent planning if key resources
and constraints can be identified early in the project, as was
the case in the MMCD Project.
Constraints are the limitations imposed on a project
from any source. The most common constraints in the project
were limitations of:
. time
money
. personnel
. knowledge
These constraints were of 'constant concern in the
preliminary planning and subsequent. course management; they
were identified and reflected in the original program planning
and were continuously monitored in subsequent project activities.
There were a number of other constraints, however,
that played an important part in project activities. The
target population represented a major constraint. The developed
course had to be tailored to the entry chaiacteristics of the
students. Further,the course had to present a process which
-17-EDUCATIONAL TECHNOLOGY CENTER

enabled the student to successfully complete the course within
a time limit. And the students and instructors had to subjec-
tiirely find the course "acceptable."
Another type of constraint that was of key importance
was the policies of the Academy and the specific department
for which the course was being developed. Existing policy
had to either be observed or changed. If it was ignored, there
was the risk of finding out too late that it should have been
observed. In order for a developmental project to be success-
ful, the support of the top decision-makers is usually essen-
tial. When policy is obviously outdated, it is probably better
to influence a change at the top rather than to risk, ignoring
it at the operation level.
Other constraints taken into account included the
relationship of the proposed oourse to other courses the
amount of study time the target students may have, the
operating structure and procedures of the organization within
which the course was to operate, the number and characteristics
of the teachers, and so on. (The kinds of constraints that
will apply and their relative significance will, of course,
vary from project to project.) It was thought to be very
important to have a clear idea of what actually constituted a
constraint and what aid not (i.e., was something that could be
changed).
-.18-
FDUCATION'AL !MCI INOLUCY ClaiT

Macro-Planning Chart
A major development was the emergence of the Macro-
Planning Chart. During the early weeks of the project, it
became apparent that some form of visual planning tool was
needed so that various parts of the course could be viewed
in perspective. It was believed that such a tool would also
serve as an aid in analyzing time-topic relationships and
media-usage logistics. Since, in general, (a) the fifty-minute
class -your was familiar to instructors and (b) few single
learning events could be expected to exceed fifty minutes in
the developed course, it was decided to construct a chart that
divided all of the student time available for-the course'
into fifty-minute "segments. "' This chart was given the name
"Macro-Planning Chart." The construction of the Macro-
Planning Chart is further explained in the paragraphs below.
Under the contract, a student was to spend six fifty-
minute hours a week studying "core" material and three fifty-
minute hours a week studying "enrichment" material or
"remedial" material, or some combination of both. Since there
were seventeen weeks in the semester, the total number of "core"
hours required for the new course was 102 (i.e., six hours per
week times seventeen weeks). Similarly, it was expected that
fifty-one "remedial" hours and fifty -one "enrichment" hours
(i.e., three hours per week times seventeen weeks, for-each)
-19-
EDUCATIONAL TECHNOLOGY CENTER

would be provided. Each such fifty-minute hour was termed a
"segment." In the course, therefore, there were to be 102
core segments, fifty-one enrichment segments, and fifty-one
remedial segments.
This segmentation plan was applied to each of the
major concept areas (groups of instructional topics particu-
larly related in some way). Figure 3 shows the Macro-Planning
Chart that was produced for Concept Area I of the course.
Note that there were four enrichment segments provided, twelve
core segments, and five remedial segments.
The Macro-Planning Chart prepared for a concept area
indicated the number of fifty-minute student hours, or segments,
that could be devoted to enrichment, core, and remedial
instruction. The segments were looked upon as "time buckets"
which were to hold instructional activities, primarily in the
form of instructional topics. The names of specific instruc-
tional topics were assigned to specific course segments. in
Concept Area I, for example, the topic "Specialization" was
assigned. segments numbered C6 and C7. A minimum of twenty
percent of all segments were reserved for testing and counsel-
ling, with the percentage varying for given concept areas.
-20-
EDUCATIONAL TECHNOLOGY CENTER

Cl C2 C3
E
C4
E
,
E
Enrichment Hours/Segments
I CS.
E
CS
Core Hours/Segments
C9
Remedial Hours/Segments
Fig. 3.--Macro Planning Chart for Concept Area I
C11 C12

The Macro-Planning Chart provided a rough "time limit"
for specific instructional topics. If one topic were assigned
two segments, this would mean that a total of 100 (fifty plus
fifty) instruction/learning minutes were available for that
topic. If two instructional topics were assigned to the same
segment, it meant that fifty minutes of instruction/learning
time had to be divided between the two topics. The effect was
to cause decision-making based on trade-off analyses. Questions
were raised about the relative importance of different topics
and what was important and not important within a given topic.
The Macro-Planning Chart proved to be highly useful in
connection with determining the detailed sequencing of events
included in the course. It became the "drafting board" of the
detailed instructional sequencing (sequencing is discussed in
a later section of this report).
-22-
EDUCATIONAL TECHNOLOGY CENTER

CHAPTER IV
DEFINE BEHAVIORAL OBJECTIVES
Perhaps the most critical task in the design of an
iinstructional system sl.to determine the behavioral objeo-
i tives. During the first phase of the MMCD Project, by far
the greatest amount of effort was devoted to establishing and
gaining agreement on the behavioral objectives. Indeed, of
any problems encountered during the MMCD Project, those asso-
ciated with the performance of this task were unquestionably
the most difficult to resolve.
As Gagne-' has pointed out, nearly every writer who has
attempted to describe the factors to be taken into account in
designing instructional programs has paid attention to
defining objectives.1 Gagng, in his The Conditions of
Learning, lists "learning objectives" as having the first
priority in.educational decisions. 2In the project, a major
problem was encountered in trying to gain agreement on behavioral
1Robert M. Gagne, "The Analysis of InstructionalObjectives for the Des4gn of Instruction," Teaching Machinesand Programd Learning, II: Data and Directions, ed. byRobert Glaser (Washington, D.C.: DAVI, NEA, 1965) , pp. 21-65.
2Robert M. Gagn, The Conditions of Learnin4 (NewYork: Holt, Rinehart and Winston, Inc. , 1965), p. 263.
-23-
EDUCATIONAL TECHNOLOGY CENTER

objectives. Since this problem has been widespread, the
general background to the problem is stated before the
attempts to resolve it are discussed.
Background
Robert F. Mager's Preparing Objectives for Programmed
Instruction is perhaps the most widely used reference by
persons seeking to define behavioral *Gbjectives for their
education or training programs.3 This text, however, applies
only when the objectives have been established, since it
describes only how to state the objectives. Some who have
used this text have confused the process of stating objec-
tives with the process of deciding what objectives to state.
The literature is rich with material on how to state objec-
tives. The situation is quite different regarding how to
establish and gain agreement on objectives, a process which
must precede stating the objectives.
One of the key factors contributing to an apparent
emphasis on stating objectives versus establishing objectives
would seem to be the setting in which instructional objec-
tives were first employed on a meaningful scale. This envi-
ronment was military training research, particularly on the
training of electronic technicians. One of the first things
3 R.F. Mager, Preparing Objectives for ProgrammedInstruction (San Francisco: Fearon Publishers, 1."6-T-T.
CDUCATIONAL TECHNOLOGY CENTER

done in planning such training was to "identify" the objec-
tives. The objectives were identified by analyzing the task
for which the person or persons were to be trained. This
i"task analysis" produced, in turn, a "task description''
iwhich stated what a person does to satisfactorily perform the
task. Behavioral objectives were "identified" from the
performances specified in such task descriptions.
. This process of establishing the instructional objec-
tives was appropriate in such military training situations,
and the process works well where training for specific jobs
is concerned. It was not until attempts were made to-transfer
this process to "education" that severe difficulties were
encountered. While training is often thought of as directed
toward a specific job, education tends to be viewed as a
process which prepares a person to live in a desired society
of the future.4
It is much easier to gain agreement on what
an "electronics technician" must be able to do than what a
"good citizen" must be able to do.
4 For a discussion of the philosophical basis ofeducation and the implications for education, see Melvin M.Tumin's article, "Education and Educators in a ChangingSociety (Part One)" in Preparing Educators to Meet EmergingNeeds, ed. by Edgar L. Morphet and David L. Jesser (NewYork: Citations Press, Scholastic Magazine, Inc., 1969).
POOR ORIGINAL COPY- BET'AVAILABLE AT TIME FILMED
EDUCATIONAL TECHNOLOGY CENTER

In the occupational training situation, the scope of
variables to be considered may be relatively narrow, and
philosophical variables may not enter into consideration.
The task description, in any case, can serve as the control-
ling document in that situation.
In education, it is very difficult to even gain
agreement on what the task is, let alone its description.
While people can agree on broad generalities of what a
"desired future" should be, it has been a major problem to
obtain agreement on the specific operational implications of
such a future for the present educational process. The
method for "preparing instructional objectives," as developed
from the research on military training, does not provide the
mechanism for establishing "educational" behavioral objectives.
Moreover, an examination of the general body of literature in
the field of education fails to reveal that a satisfactory
mechanism has been developed for gaining interpersonal or
inter-group agreement on specific behavioral objectives for
"educational" curricula. 5
5The terms "interpersonal" and "inter-group" refer
to persons in different disciplines or at different schools,who have an opportunity to freely reject or to accept and useagiven set of behavioral objectives.
-26-
EDUCATIONAL TECHNOLOGY CENTER

The need for establishing measurable objectives for
education has been argued for nearly fifty years, the Winnetka
Plan during the 1920's being one of the earliest attempts at
producing such objectives as part of a complete program. 6
Ralph W. Tyler's work at the University of Chicago in the
1940's provided an important impetus for developing techniques
for establishing educational behavioral objectives.? A notable
outcome of this impetus was Benjamin Bloom's "taxonomy"
published in 1956, which was one of the first attempts to
produce a comprehensive list of educational objectives for
general use. 8This and the subsequent taxonomies of educa-
tional objectives represent a major step in translating abstract
goals of education to more specific meaning.
6 See, for example, C. Washborne, Mabel Vogel, andW.S. Gray, "A Survey of Winnetka Public Schools," Journal ofEducational Research Supplementary Educational MonographINW-7----
7 See R.W. Tyler, Basic Principles of Curriculum andInstruction: Syllabus for Education 3 05 (Chicago: Univer-sity of Chicago Press, 1950)) and R.W. Tyler, "The Functionsof Measurement in Improving Instruction," Educational Measure-ment, ed. by E.F. Lindquist (Washington, D.C.: AmericanCouncil on Education, 1950).
8B.S. Bloom, ed., Taxonomy of Educational Objectives(New York: Longmans, Green, 1956 ')..
-27-
EDUCA.TIONAL TECHNOLOGY CENTER

While Bloom's taxonomy proves to be a useful guide to
different classes of objectives, it does not provide opera-
tional-level objectives. Moreover, the objectives it.lists
'ave been criticized for being ambiguous and, in general, not
meeting the criteria for "good" behavioral objectives. as
'described by Mager and others. 9 Nor doei the taxonomy face
the issue of how to gain agreement on specific behavioral
objectives.
Edling's review in 1968 of the research concerning
educational objectives suggests that few, if any, researchers
are investigating the question of how to gain interpersonal
or inter-group agreement on sets of behavioral objectives. 10
The literature continues to imply that the basic problem
is how to state behavioral objectives, rather than how to
establish them and gain agreement on them.
It is, nevertheless, an open secret among educational
researchers that. there have been a series of failures in
attempts to specify educational behavioral objectives that
are acceptable to the group of educators who would be
expected to employ the objectives. In general, the failures
9 mmSee, for example, Gagne's "The Analysis ofInstructional Objectives for the Design of Instruction," p.
10 Jack V. Edling, "Educational Objectives andEducational Media," Review of Educational Research, XXXVIII,No. 2 (1968).
-28-EDUCATIONAL TECHNOLOGY OPNTI3R

are fewer in the hard sciences where the "task" can be agreed
upon (e.g., arithmetic, physics), but are the rule in the
social sciences and humanities (particularly when the instruc-
tion is aimed at high school or college students), where each
instructor might visualize the "task" in a different way.
Human beings, of course, are not prone to publish information
about their unsuccessful activities.
Maguire published the results of an experiment that
concerned a critical issue in designing curricula in the
humanities and social sciences--the differences in value
judgments by teachers as regards specific, randomly selected
educational objectives. 11While his study is a contribution,
it was, nevertheless, a paper and pencil "laboratory" experi-
ment. Nobody really had, anything to ,lose, unlike the actual
curriculum design situations where a person may believe his
professional reputation is at stake.
Project Activities
The first phase of the Multi-Media Curriculum
Development Project concerned preparing a definition, or set
of specifications, for the desired course. A major part of
these specifications consisted of educational behavioral
11 Thomas 0. Maguire, "Value Components of Teachers'Judgments of FAucational Objectives," AV Communication Review,XVI, No. 1 (Spring, 1968).
KOLICATIONAL .V10011NOLOGY

objectives. In the second phase of the project, material was
prepared to meet the specifications. The materials also were
subjected to tryout-revision cycles until they produced the
'learning called for by the behavioral objectives. Phase
Three required fully-operational tryouts and a formal evalu-
ation of the highly individualized new course. In this course,
the students have a voice in what behavioral objectives they
will pursue, and some students complete two semesters_of
economics in one-third of a semester.
Economics instructors from a number of universities
took part in producing the behavioral specifications for the
course. All told, about twenty economists had a voice in the
course design. They represented a wide range of different
theoretical views and practical experience in economics, with
both the Friedman school andthe Keynesian school represented.
There were differences in personalities, politics, approach
to lifer and view of what is "good" economics. It was
reasonable to expect great differences in value judgments
on individual educational objectives.
Under the contract, the new course was to teach to
the same objectives as the comparable, existing course at
the U. S. Naval Academy, though new points of emphasis could
be provided. Theoretically, then, the behavioral objectives
-30-
EDUCATIONAL TECHNOLOGY CENTFR

could be established, at least in part, through information
about the existing economics course. It was soon found that
no two instructors were in fact teaching 'the same.introductory
economics course.
The process of establishing behavioral objectives
began with gaining agreement on limits of student study time,
the instructional topics to be included in the course and
the average amount of student learning time to be devoted to
each topic, as reflected in the Macro Planning Chart. This
proceeded without difficulty. The next step was to establish
tha specific behavioral objectives of the topics; that is, to
specify the terminal behavioral objectives, intermediate
behavioral objectives, and entry behavior requirements for
each topic. Problems were encountered almost immediately as
this step got underway.
Nature of the Problem
A major problem was the difficulty encountered by
some individuals of thinking in terms of what the student
would be expected to do. In such cases, the way of thinking
tended to concern instructor objectives, media objectives,
and content coverage. Such thinking proved to be very
resistant to change, despite attempts by behavioral special-
ists to reorient such thinking to "learner" objectives,
-31-EDUCATE02TATa THCIENOLOGY CENTER

A second problem was the belief that students learn
what the instructor covers. The conventionally -- taught course
at the Naval Academy "covers" two semesters of ecenoMics in
one semester. The belief was held that the students do learn
the material presented conventionally, though there'are
individual differences in the quality of the learning. Since
educational technology should enable the students to learn
faster and better, it was believed by the faculty that behav-
ioral objectives should be prepared for all of the material
now covered conventionally.
A third problem concerned how to delineate a course
that would satisfy all of the economics faculty teaching the
course. Each instructor seeks to teach the best economics
course he can. This results in differences in the emphasis
given to various points, differences in actual subject matter
covered, and differences in the sequencing of the instruction.
The developed course, it was found, must include the normal.
substance plus the instructors' variations in subject coverage
and points of emphasis, if it is to be considered fully
acceptable in terms of content coverage to each instructor.
Such an approach, it is clear, would produce a "super-size"
course.
-32-
EDUCATIONAL. TECHNOLOGY CENTER

A fourth problem concerned the human desire to take
advantage of the course development opportunity by creating
the highest quality course possible, with each part of the
course being "powerful" in its own right.' While this may or
may not contribute to an effective course, it alone can
increase the size of the course over any comparable conven-
. tional course because it seeks to achieve the "ideal" course,
as seen by the faculty--i.e., all of the content the faculty
would like to teach but do not have sufficient time to include
in the courses they were then teaching.
The effect of these various problems was to cause
packages of behavioral objectives to be repeatedly viewed by
Academy faculty as incomplete, and therefore unacceptable, in
terms of the desired content coverage. Course size grew as
"content gaps" were filled by preparing additional behavioral
objectives to meet the particular demands of individual
instructors.
This was the nature of the overall problem of estab-
lishing behavioral objectives as encountered very early in
the first phase of the project. As soon as the problem became
apparent, a series of attempts were made to resolve it. Finally,
a technique evolved which, in fact, did resolve the problem.
--33-
ZDUCATLONAL TECHNOLOGY CJ NTP:12

Attempts at Resolution
Several approaches to establishing behavioral objec-
tives were tried which proved to be unsuccessful in this
project. However, each unsuccessful approach provided new
information which finally led to producing a successful.
approach. Accordingly, the unsuccessful attempts, as well.
as the successful one, are described below.
Approach #1
The start of the first phase of the project was delayed
by the government some six months, causing original arrangements
for subject matter experts (i.e., economics instructors) to be
lost. (Since all subject matter experts were economics instruc-
tors, they will be referred to simply as "economists" in the
subsequent material.) As a result, the project was begun with
fewer economists on the ETC staff than had been planned. Given
this situation, it was decided to use a larger percentage of
the non-economist staff members in,helping to generate behav-
ioral objective's. These staff specialists were trained
behavioral analysts, could write feasible, measurable, and
observable objectives, and had individually begun the study
of economics as part of their preliminary project activities.
Similarly, all economists were asked to follow an ETC-prescribed
program to orient themselves toward educational technology and
Writing behavioral objectives.
-34-
tr.TATCATIONAT. TECRNOLOOY CENTER

The Educational Technology Center's economists
and the economics faculty readily agreed on topics and general
goals for the topics. Much time was spent discussing how
ma,iterial in a topic was to he "handled." The ETC economists
then conveyed a description of the goals for a given topic
to a behavioral analyst, also referring him to material in
standard economics texts and other sources that would be
relevant. The behavioral analyst was to analyze the relevant
material in terms of the stated goals and then to prepare
behavioral objectives that represented a feasible translation
of the goals. Each analyst was expected to interact fre-
quently with the ETC economist responsible for his assigned
topic, as a means of ensuring that goals were being translated
to acceptable behaviors.
This approach did not work, despite many revisions of
it Economists, whether with ETC or the economics faculty,
found difficulty agreeing among themselves on which specific
behavioral objectives,' from among those prepared, should be
considered "acceptable." On the other hand, the economists
did agree that the problem resulted from non-economists
attempting to prepare the behavioral objectives. The
behavioral analysts, though, stated that the economists could
not commumicate to them the behavicirs they wanted, but made
general references to content and how it should be treated.
135-
EDUCATION:1 TECHNOLOGY CENT ER

As a means of attacking the problem, steps were taken
to (a) increase the quality of communication among the
economists and between the analysts and the economists and
(b) provide more intensive training of economists in the
meaning and preparation of behavioral objectives. To increase
the quality of communication, (1) extensive meetings were
held before, during, and after behavioral objectives were
prepared for a particular topic, (2) detailed writeups were
prepared by the economists for each topic (each writeup was
supposed to contain the terminal behavioral objectives for
the topic), and (3) lengthy audio-taped oral statements be-
tween parties regarding "agreed-upon" content requirements
and terminal behaviors were made.
None of these, however, was effective. It seemed that
the economists could not write behavioral objectives accept-
able to the behavioral specialists, and the behavioral spe-
cialists could not write behavioral objectives acceptable to
the economists. In general, the analysts continued to talk
"measurable behaviors," while the economists continued to talk
"content." While there was much talk between them, there was
little communication.
The economists believed that the way to resolve the
problem was for them to tutor the analysts in economics so
that the analysts could understand what'the economists we2:e
trying to tell them. The analysts, on the other hand, were
-36-EDUCATIONAL TECHNOLOGY °ENTER

convinced that the economists still had not accepted the
Ilion of behavioral objectives and that, until they did,
there could be no real progress. The analysts stressed that,
at minimum, the economists must prepare the specific, terminal
performance(behavioral)objectives for each topic.
Much effort was spent attempting to teach economists
how to write "good" behavioral objectives. In general, the
more teaching experience an economist had, the more difficulty
he appeared to have in accepting or writing behavioral objec-
tives (but there'were some very notable exceptions to this).
Thiscreated an awkward situation in which the junior econo-
mists, in the view of behavioral specialists, acquired an
understanding of behavioral objectives--indeed, were able to
write "good" objectives--long before the senior economists did.
The initial reaction of the senior economists toward
behavioral objectives was largely unfavorable, and this
attitude seemed to persist throughout approach #1. During
this period of several weeks, no senior economist was able to
write objectives that, according to the behavioral specialists,
were unambiguous, measurable, observable, and feasible. (Some
senior economists later became very proficient in this.) In
any case, from reviewing the work of the behavioral specialists,
the economists reached the conclusion that behavioral objectives
-37-
EDUCATIONAL TECHNOLOGY CENTER

prepared by non-economists could never be satisfactory. The
primary reasons given by the economists were that the analysts
often missed the point, often emphasized the wrong. things,
and continuously left important things out (i.e., there were
Igaps in content coverage).
i
Approach 02
As the number of economists on the project team grew,
it became possible to initiate a new approach which, it was
hoped, would produce behavioral objectives which the senior
economists--particularly the faculty that taught the course- -
would find acceptable. Approach 02 :,alled for creating work
teams consisting of one junior economist and one behavioral
analyst, who would work under the cognizance of a senior
economist. It was reasoned that the junior economist could
help insure acceptance from the senior economists while the
analyst would make sure that the behavioral objectives were
properly written.
The same problems that were found in approach 41
quickly emerged in approach *2. There seemed to be the same
inability to prepare "acceptable" behavioral objectives.
In desperation, senior economists were preparing larger and
larger descriptions of topics for use of the two-man teams,
but the senior economists still found themselves unable to
provide the terminal behavioral objectives that met the
-38-EDUCATIONAT, TECIINOPOOY CENTER

standards of the behavioral analysts. Meanwhile, the junior
economists who were paired with analysts learned to write
fairly good behavioral objectives, in the judgment of the
Ibehavior specialists.
This approach also did not work. Attempts to "orient"
the senior economists to behavioral objectives continued
almost constantly, but with no apparent success. The failure
of this approach led to approach #3.
Approach 43
This approach called for a senior behavioral scientist
to be paired with a senior economist. Together, they would
write the behavioral objectives for a topic, and both partici-
pants had to agree on the specific r,bjectives before they
could complete a topic. The behavioral scientist's role was
to guide the economist into producing or accepting the
behavioral objectives that defined the senior economist's
interpretation of the topic'sgoals and scope of content.
While the output of approach 43 was judged by the economists
to be the best thus far, it proved to be extremely taxing
on the participants and therefore could not be continued.
While this approach was being discontinued, approach #4
became possible.
-39-
EDUCATIONAL TRCTINOLOGY CENTER

Approach #4
In this approach, narrative descriptions of topics
were virtually discarded. Instead, reliance was placed on
!preparing behavioral "hierarchy charts" that defined topics.1
IThe concept of a hierarchy chart as used in approach #4
evolved out of the failure of narrative information, both
written and oral, to communicate among team members. At
first,' the hierarchy charts were strictly the province of
the behavioral analysts who used them in attempting to define
the structure of a topic. More specifically, after an econo-
mist described a topic, the behavioral analyst would then
attempt to translate this information into behavioral objec-
tives, and he would arrange these objectives in a hierarchical
fashion to indicate presumed relationships of the indicated
competencies, including the dependency relationships, pre-
requisite competencies, etc.
Senior economists, whether With ETC or the economics
faculty, had declined hierarchy charts because they did not
convey, in their view, the full range of content required.
Gradually, however, the charts became the working document
of communication between senior economists and the analysts
and between junior and senior economists. Soon the charts
began to inclxide the more detailed descriptions of content
required by the economists. At the same time, the behavior
-40- EDUCATIONAL TECHNOLOGY CENTER

I
or behaviors that would demonstrate if a person has that
knowledge werelas before, stated in the charts. As a result,
economists and analysts were both satisfied, because the
charts communicated equally well with both groups. Since
each box on a hierarchy chart included (a) description of
content and (b) one or more behavioral strtements, the charts
could readily communicate with people of widely different
backgrounds, including administrators, instructors, psycholo-
gists, and students.
Prior to the use of approach t4, if an economist did
not like the behavioral objectives for a topic, the aPalyst
generally was blamed. As a result, the economists found that
they agreed in not liking behavioral objectives produced by
non-economists. Significantly, it was on content grounds, not
"behavioral" grounds, that economists rejected the objectives.
The emerging form of the hierarchy charts allowed
economists to state in creating a chart for a topic, all of
the "content" he believed was critical. And there was no
requirement placed on the economist that he must state the
content in a format resembling a behavioral objective. This
would cone later, with help from a behavioral specialist.
-41--
EDUCATIONAL TECHNOLOGY CENTER

The economists were asked to generate charts
that sought to relate the content items in a hierarchical
fashion. Thus, an economist's first-cut, content-only
version of a hierarchy chart for a topic would typically
I have a pyramidal appearance, as indicated in Figure 4. This
I "topic structure" proved to be an important prerequisite for
the next step, specifying the actual behaviors.
Content
Statement
Content
Statement
Content
Statement
.....1,,AM4...T,ft4 +,4001=01,0V4
Content
StatementEIMolDeftl*J..r..m*AMINmJ
1Statement Statement
Content dontent
Fig. 4 .--Top three levels of hierarchy chartin early stage of developuent.
-42-
EDUCAT/ONAL TECHNOLOGY CENTER

A content-only hierarchy chart produced by an econo-
mist might include twenty, fifty, or 100 content boxes. With
this preliminary version done,*the economist would be joined
by a behavioral specialist. The role of the behavioral
specialist was to work with the economist to (a) create one
or more "behaviors" for each content-box, that would demon-
strate that the student "possessed" that content; (b) insure,
to the extent possible, that the organization of the chart
reflected competency hierarchies, and (c) produce learning
time estimates for each box on the chart '(since the students
had to be able to acquire the behaviors in the learning time
available to them).
This working relationship proved to be very harmonious
between analysts,and.economists. Each chart went through mazy
iterations before a balance was found between content, behav-
iors, and amount of student time allocatable to a given topic.
The primary strength of these charts was that they graphically
described the status of the development of a topic's speci-
fications at a given time. There was no longer the question
of content versus behavior. Both content and behavior were
required for every box included in a chart, and while the
content was the primary responsibility of the economists, the
analyst was held responSible for the quality and integrity of
the behavioral components of the chart. A chart served as a
-43-EDUCATIONAL CENTER

constant visual referrent which reflected all decisions
to-date for a topic.. As such, the charts came to symbolize
cooperation and results, and quickly became the primary
working document and means of communication between the
analysts and economists.
As stated earlier, the senior economists always
believed that they were in basic agreement with each other
about what the topics should contain--that the lack of
understanding of economics on the part of the analysts was
the cause of the "acceptance" problem. The hierarchy charts
made it possible for a senior economist and a behavioral
specialist to mutually approve a chart. When such approval
was given, formal behavioral objectives were then written
for each box in A chart. Such objectives werecarefully
reviewed by the cognizant senior economist and others for
conformance to the cha'rt and for other characteristics of
quality. However, when the behavioral objectives produced
in this fashion were reviewed by other senior economists- -
whether they were on the Center's staff, were outside econom-
ics consultants, or were faculty members at the Naval Academy
--the objectives were typically criticized on the grounds of
content.
It gradually beCame clear to the non-economist members
of the project'that no senior economist could happily or
-44-
ETIGCATIONAL TECHNOLOGY CENTER

comfortably accept completely the behavioral objectives
produced by another economist. The extent of the disagree-
ment among senior economists became apparent only when some
senior economists, working with analysts, began to "sign off"
on specific behavioral objectives. Thus, the conflict
shifted to senior economist versus senior. economist.
This conflict was never completely resolved. However,
it was capable of being controlled, and the hierarchy charts
proved to be the basic means of obtaining this control. Once
a senior economist agreed on how much stuilent time was to be
allocated to a topic, he had accepted a limit as to what the
student could be expected to learn during that time. It was
recognized that a strAent could not be expected to learn
everything about a topia, all other considerations aside.
The charts same into use as instruments of negotia-
tion between the senior economists. Each box in a chart
recorded the learning time. for the content-behavior ii speci-
fied. Once the total learning time in a chart equalled the
amount of student learning time allocated to the topic, it
was not possible to add something new to a chart without
taking something else away. As a result, when a senior
economist criticized a chart for not containing something, he
was asked to indicate what he would eliminate from the chart
so that his desired content could be added.
-45-
EDUCATIONAL TECHNOLOGY CENTER

It soon became apparent to the senior economists
that each would. have to compromise on what he personally
wanted to see in the charts. Behavioral specialists worked
closely with the senior economists in effecting tradeoffs
that the economists agreed upon. The charts became the
documentation of the agreement, not only between the analysts
and the economists, but also among the economists. When
hierarchy charts had been agreed to in this fashion, general
approval of the behavioral objectives produced from such
charts became almost automatic. Approval'of the charts
became almost synonymous with approval of the behavioral
objectives.
then it was clear early in approach fo4 that seniorf
economists would not accept each other's work products,
certain significant changes ware made in the project team
organization and in the decision-making structure. Strong
behavioral specialists were moved into key positions above or
equal to senior economists and they were given expanded
decision-making authority. This change did not permit theG
behavioral specialists to dictate content or behaviors.
Rather, it gave the behavioral specialists direct control
over certain proceedings, including the handling of disagree-
ments among the economists. For example,.economists were
constantly temPted to go back and revise work done months
-46-
CDUCATIOXAL TriCRNOLOGY CENTER

earlier--including work that they themselves may have already
revised two or three times. Management-level behavioral
specialists established hard and fast dates after which a
work product was "frozen" (i.e., could ncJt be changed except
by authority of the Project Director) and otherwise exerted
direct control over decision-making.
This organizational change, coupled with the use of
hierarchy charts, proved to be very effective. The apparent
competitiveness between economist and economist seemed to
subside. Behavioral specialists gained increased respect
in the eyes of the economists, after having been viewed for
so long as the cause of the problem.
Approach 64 was used to complete the task of speci-
fying the requirements for the new multi media economics
course. The approach appeared to be more successful the
longer it was used, as team members became experienced in it
and made refinements.
Summary of Successful Approach
In summary, a satisfactory., workable method for
establishing educational behavioral objectives and for gaining
inter-personal and inter-group agreement on them evolved in
the project. The elements of this method were as follows:
-47-
EDUCATIONAL TECUNOLOGY CENTER

1
1. General goals for the course were specified.
2. The ins:.ructional topics to make up the coursewere listed.
3. For each topic, a statement of key point6 ofemphasis and desired areas of content andbehavior was prepared as a guide for directionand scope.
4. Maximum student time was determined and allccatedto specific topics.
5. A "hierarchy chart" was prepared for each topic,and each box in such a chart included (a) astatement of course content and (b) a statementof one or more behaviors that would demonstratean understanding of that content.
6. The hierarchy chart for a topic was used as themedium for negotiating differences amongdecision-makers and for documenting the finalforms of the "approved" learning requirementsfor the topic.
7. Formal behavioral objectives were prepared inconformance to the hierarchy charts.
-48-
h.DucATiontr, TECHNOLOGY CENTER

CHAPTER V
PREPARE TEST ITEMS
There were no major problems encountered in the
I'
preparation of test items. The task was performed veryI
I similarly to the way in which it was planned. There was,
however, a significant rationale employed in task performance
that, it was concluded, played an important part in the suc-
cess of the task. This rationale deserves particular reference.
Rationale for Test item Design
It was established early in the Project that a criter-
ion test item was to be essentially a "mirror image" Of the
behavioral objective for which it was prepared and it had to
be an objective measure. In other words, the exact criterion
behavior specified in the behavioral objective was to actually
be a part of the test item. This had the effect of forcing
specificity in the behavioral objectives. Every criterion
behavior stated in the behavioral objective had to be explicit,
measurable, feasible, unambiguous, etc., because that behavior,
perhaps exactly as stated, was the "answer" to the associated
test item. All behavioral objectives, as a result, provided
"answers" (Le., very explicit descriptions or examples Of
criterion behavior) which were to be used.in the associated
test items or used as models for similar responses.
IIIDUCATIONAG TECHNOLOGY OENTRIZ

The precision required in no way meant that test items
could not sample a behavior that applied to a class of condi-
tions. For example, a behavioral objective might state that
the student will he able "to solve equations of the following
type," under specified conditions. Examples of the' type of
equation would have to be provided (with a description of the
"correct response" to each such example) , along with an indi-
cation of the minimum acceptable level of performance and a
statement of the conditions under which the student would have
to perform. In such a case, test items would be modeled after
the sample equations and other'information in the statement of
the behavioral objective.
Another advantage of the 'mirror image" approach
concerned the content validity of the test items--in other
words, with the question of whether or hot the test items
were measuring the same behaviors as called for by the behav-
ioral objectives. This approach enabled "face validity"
judgments to he unequivocally made by subject matter experts,
1Teaching to behavioral objectives should not beconfused with "teaching to the test." It is'simPle toillustrate the difference. A behavioral objective mayspecify that the student will be able to add two or moresingle-digit numbers. A student who achieved this objectivewill be able to add 1 and 9, 2 and 4, 6 and 3, or anyother combination of single digit numbers. In "teaching
-50-
anuciyamtr- TECHNOLOGY CENTIi7R

Procedural Considerations
There were, of course, minor procedural changes which
took place. The preparation of the first test item at the
time the behavioral objective was being prepared was. considered
to be a very important procedural modification. This seemed to
make the process of establishing behavioral objectives a little
I easier, by helping to establish the nature of the criterion
behavior. (In other words, some people can write "good" test
questions easier than they can write "good" behavioral objec-
tives. They may prepare test items as a way of "exploring"
the kind of behavior that the objective should call for. When
they "recognize" what is required, they may then write a
behavioral objective that represents a class of feasible test
items.)
Three or more criterion test items were prepared for
each performance objective. (Figure 5 illustrates a performance
objective while Figure 6 gives a criterion test item for the
objective.) A criterion test item was intended to answer
to the test," the student would learn to add only the singledigit numbers that appeared on the test. The student mightbe able to add 2 and 4 but unable to add 2 and 3.
A pool of criterion-referenced test items was pre-pared for each behavioral objective included in the Multi-Media Economics Analysis Course. Each such test itemrepresented a "sample" of the desired, criterion behavior.From the pool, test items were drawn to construct pre-tests,post tests, and imbedded tests. These tests were used todetermine whether or not the student possessed a specifiedbehavior. Instruction is aimed at behavioral objectives.Tests merely measure whether or not objectives are met.
-51-
EDUCATIONAL TECHNOLOGY CENTER

;
the question: Has the-student achieved the related learning
objective? The items yielded a yes or no answer for each
objective. Test items were subjected to essentially the same
type of review process as performance objectives. The test
items had to be reviewed and approved by several subject
matter experts and a tests and measurement specialist before
they were permitted to go into the test item pool. They were
also subjected to revision based on student tryout results.
Test items were used to construct pre-tests, post-tests,
practice tests, and learning-imbedded tests, all of which
are elements of the multi-media course.
-52-
IlrilICATTONAL TIOCHNOTAXIY CENTIOR

2753 Conditions: Given alternative graphs concerning
total demand for money and asked
which graph shows the total demand
for money as a function of interest
rate for a given level of income,
Performance: The student will select a graph
equivalent to the following:
Dm
Money
Criterion: 'Implicit
Pig. 5.--Example of a Performalice Objective
IEDUCATIONA L TECHNOLOGY CENTER

2753 A Which graph shows the correct configuration for
the total demand for money as a function of
interest rate for a given level of income?
3.
3.
(a)
Money
I.
Dra
money
(c) (d)
i
r'.....=MIM1
(b)
Money
Dm
...................... .11.1,....M
ANSWER: b
Money
Fig. 6.--Example of a Criterion'Test Item
-54-
131)1JCATIONAL 1`01111NOLOOY C131111CH

CHAPTER VI
SEQUENCE INSTRUCTIONAL ACTIVITIES
The "sequence of instructional activities".referS to
the order in which students interact with units of content.
The literature regarding instructional sequencing demonstrates
that there are no conclusive data on how it should be done.1
Helmer, after reviewing sequence theory development, concluded:
Adequate teaching algorithms which specify the stepsto be taken in order to construct an instructionalsequence in the presence of a given set of educationalends and a given set of circumstances,,and with someassurance of efficiency, do not exist.4
Despite the lack of agreement in the literature on
how sequencing should be approached or performed, little
difficulty was encountered conceptually or operationally in
the task performance.
1See, for example, David J. Klaus, "An Analysis ofProgramming Techniques," Taachina lachincts and ProgrammedLearning, II: Data and Directions, ed. by Robert Glaser(Washington, D.C.: Department of Audiovisual Instruction,1965), pp. 141-143.
2Ralph T. Helmer, "Conditions of Learning inMathematics: Sequence Theory Devaloment," Review of Edu-cational Research, XXXIX, No. 1, 1969, 506.
-55-
mucwrioNitr. TECHNOLOGY CENTER

The Macro-Planning Chart (described in Part III),
prepared in connection with allocating student learning time
to instructional topics, proved to be an effective first step
in sequencing the instruction. The MPC provided the initial,
"general" sequence of the topics expected to be included in
the course.
An effective second step in sequencing was the pre-
paration of the hierarchy charts, with their great emphasis on
entry-level behaviors, intermediate behavioral objectives, and
terminal behavioral objectives. At the point where all hierarchy
charts were "approved," the entire course could be viewed
as sequenced in a hierarchy of competencies, from the entry-
level competencies to the final competencies to be taught in
the course.
Sequencing Concept Areas
As would be expected, the relationships among com-
petencies to be learned (behavioral objectives) were not
linear. Rather, at the concept area level as well as the
topic level, the relationships resembled a series of pyramids.
The four major "pyramids" of objectives represented the four
major concept areas and were related in the fashion illustrated
in Figure 7. Note how the pyramids, or major concept areas,
themselves are hierarchically related. It was necessary, it
-56-
EnucATtomtr. Tocrucoractoir CENTER

was judged, for a student to achieve the objectives in Concept
Area 1 (pyramid 1, Figure 7) before he could begin (possess
tine entry behavior for) either Concept Area 2 or Concept Area 3
(pyramids 2 or 3). Similarly, it was thought that the student
had to have achieved the objectives in both Concept Area 2 and
Concept Area 3 before he was qualified to begin Concept Area 4.
Fig. 7.--Major Hierarchical Groupings of Objetives
-57-
EDUCATIONAL TECHNOLOGY CENTER

In terms of the course presentation, then, a student
could study concept areas in either order shown below in
Figure 8. While either concept area sequence was'theoretically
as appropriate as the other, Sequence "A" (Figure 8) was select-
ed for use in presenting the course during the period of the
Concept AreaSequence "A"
(Ascending Order)
Concept AreaSequence "B"
(Ascending Order)
4 4
3 2
2 3
1 1
Pig. 8.--Alternative Sequencing of Concept Areas
project. The decision not to allow both sequences (i.e., so
the student could elect his preference) was made to avoid
possible problems during the preliminary presentations of the
course. In particular, there was the concern that no avoidable
risks be taken in administration while materials were under-
going 'preliminary testing and validation. The intent was to
prevent contaminating the materials--tryout results with
negative effects of operational problems.
-SR- RDUCATFONAL TECHNOLOGY CENTER

Sequencing Topics
As suOested by the pyramids in Figure 7, each concept
area consisted of hierarchically-related topics. Many possible
;sequences of topics existed for each concept area. Again, for
I very practical considerations, decisions were made to select
only certain sequencing alternatives for use in the course.
It was concluded that it would not be feasible to provide all
possible topic-sequencing options, considering media-materials
logistics, student management, and other factors. The same
concern with avoiding risks of administrative problems during
materials testing also prevailed.
Sequencing Eemediation
The decision was made during pre-contract planning that
the function of remedial learning was t6 support core learning.
Two types of remediation were considered possible, "prerequi-
sites" remediation and "regular" remediation.
Prerequisites remodiation had to do with assumptions
about entry behavior. Let us say that we assume in the course
that all students can use graphs in some specific way. Through
a pretest, we may find that some few students cannot use graphs
as assumed. A "prerequisites" remediation topic (e.g., "Using
Graphs") might be necessary for this situation.
EDUCATIONAL. TECHNOLOGY CENTER

Regular remediation had to do with learning problems
encountered by students who apparently had the prerequisite
behaviors. An example might be the case where a student had
/difficulty in solving a problem of a given type. He may be
'referred to a "regular" remediation package that teaches the
desired problem solving behaviors in a different style or at
a lower level of difficulty than in the original learning
activity.
The Macro-Planning Chart had set aside an average of
about three hours per week for prerequisite or regular reme-
diation. However, no remediation "topics" of any kind were
assigned to the segment buckets in the Macro-Planning Chart.
It was believed to be impossible to judge in advance, with
any acceptable degree of accuracy; either the prerequisite or
the regular remediation requirements. It was decided that the
more cost-effective approach would be to empirically determine
the remedial learning requirements.
While no remediation topics were specified, a remedia-
tion option was left open following each pretest (prerequisite
remediation) and each post test (regular remediation).
Sequencing Enrichment
Enrichment learning objectives were not, in the main,
defined in a separate task from determining the core learning
objectives. As described earlier, it proved to be very diffi-
-60-
CDUCATIONAL TECHNOLOGY CENTER

cult to keep the size of the course, as implied by the behav-
ioral objectives specified, within bounds. It was estimated
that sufficient behavioral objectiVes for a five-semester
jeconomics course were generated. About two semester's worth
/were selected to be the "core" objectives of the Multi-Media
'Economic hnalysis Course.: Many enrichment objectives were
selected from the remainder. Other enrichment objectives were
developed specifically as "enrichment."
In the MMCD Project, the behavioral objectives were
stated at a very specific level, requiring perhaps ten minutes,
in most cases, for a student to achieve the objective, assuming
he had the prerequisite competencies. It was not possible to
pick this isolated objective and that isolated objective, etc.,
and call them "enrichment." There had to be a valid "behav-
ioral path" to every objective in the course, which meant that
all prerequisite competencies to achieving an objective, whether
it was core or enrichment, had to be provided. Thus, enrich-
ment objectives also had to form "instructional topics," and
either a core segment or another enrichment segment provided
the entry behavior for a given enrichment topic. As with
core topics, an enrichment topic could require one or more.
segments. The sequencing of the enrichment was based on such
dependency relationships. .
-61-
EDUCATIONAL TECHNOLOGY CENTER

,o
Sequencing Other Activities
The sequencing activity also included determining when
pretests and post tests should be given, when counseling should
Ii be available, and what options existed for the student at
1 specific points in the course. Sequencing decisions were
recorded in the form of a "Micro-Sequencing Chart" for each
concept area. Figure 9 shows such a chart.
-62-
EDUCATIONAL TECHNOLOGY CENTER

Achieved criterion,to core path or'other enrichment
To additional enrichment
ITT-71 11E-1 Fara1 2
ri 3L----J
Satis-lactor-5.
Unsatis-tactorT------1
vAchieved criterion, To review & retestto core r.,thor ,_ To additional enrichmentFther enrichment ..:.; "*"47
-----1 r----1 XT214t;-*N.....5..a_t_taf.Jaatary_c-F.15E-1 t--j 5E-2 r--- \I... TCP /f
..-
0'1' U nsatisfactor
,
est
I To Cli
0
8
0
0CJ
z
ti
3R-1
sites Re-
C4 I C6 U C7 L C8 C9
II
E = EnrichmentC = CoreR = RemedialT = TestCP = Counsel & Prescribe
Fig. 9.--Micro-Sequencing for Concept Area One
,tiSMTOaCtOry1C1
Unsat:4sfact.ory
11R-1Remedia-tion &V?test

In the Micro-Sequencing Chart shown in Figure 9, the
first segment (C1) was a group orientation session. The
second segment (C2) was a pretest, the third segment (C3) was
a counseling session, when pretest scores and learning con-i
!tracts were discussed, the fourth (CS) was a self-instructional
i.segment, and so on. If the student progressed at an acceptable
rate, whien he passed the post test of segment C11, he had an
option of taking certain enrichment segments or continuing on
to more core segments.
No matter how far a student progrdssed in the course,
as long as his rate of progress was acceptable, he could
exercise his option to take any enrichment material he had
earlier decided not to take. This "continuing option" is
not shown in Figure 9. Also, neither the "student-generated"
enrichment learning activities nor the "instructor-generated"
enrichment learning activities are represented there. Such
enrichment was to be generated during the course, to be respon-
sive to the special needs or desires of groups of students or
individual' students. This type of enrichment tends to revolve
around issues that are currently making headlines, which the
students perceive as "relevant."
-64-
iinue.vnox.tr. TmemsioLocir CENPER

CHAPTER VII
SELECT THE MEDIA
Very little has been produced in the past fifty years
concerning when to use what instructional media. In his review
of instructional design and media selection factors Saettler
points out that the predominant type of media study conducted
has been the media comparison study, usually yielding a finding
of no significant difference.' He concurs with the observations
by Knowlton that these studies were not actually research on
media because their experimental designs did not provide for
separating the physical characteristics of the media from the
sign vehicles of the message they carried.2 Lumsdaine and May
in their review of media research have stressed the inherent
limitations of such media comparision studies.3
1Paul Saettler, "Design and Selection Factors" Reviewof Educational Research 38: 115-128; April 1968.
2James Q. Knowlton, "A Socio- and Psycho-LinguisticTheory of Pictorial Communication" (Bloomington: IndianaUniversity, Division of Educational i4edia and Audio VisualCenter, 1964).
3A. A. Lumsdaine and M. A. May, "Mass Communicationand Educational Media," Annual Review of Psychology., XVI,(1965), 475-534,
-65--
PAXICATIONAL TECIINOLOOY OlaNTEK

A monograph by. Briggs and others reviewed media
research and commented in some detail on its shortcomings.4
Studies were classified into (1) comparative effectiveness
studies, (2) utilization studies, and 13) basic studies, for
each of seven classes of media. As to the value of the
research findings in making specific media choices, it was
concluded that "neither laboratory nor media studies has
Provided complete enough information to eliminate the uncer-
tainties involved in making such choices...neither the learning
psychologist nor the classroom teacher can justify such
decisions entirely on the basis of present research evidence."5
A significant step in the direction of developing a
comprehensive and systematic media selection procedure is seen
in the work of Gagne and Briggs. Gagne developed a hierarchical
model of eight types of learning, and defined the particular
`Leslie J. Briggs., et al: Instructional Media: AProcedure for the Design of Multi-Modia Instruction, A CriticalReview of Research, and Suquestions for Future Research,Monogram No. 2 (Pittsburgn: American Institutes for Research,1967).
5Ibid., pp. 137-138.
-66-EIDECATLOINAL TECHNOLOGY CENTER

conditions (of learning) found necessary to facilitate each
type.6 Media are to be selected which can best produce the
conditions of learning required. It is assumed that different
media would be required to produce different conditions of
learning.
Briggs developed a procedure, based on Gagn6's model,
which called for analyzing behavioral objectives to identify
the types and conditions of learning involved, determining the
instructional events that would provide the desired conditions
of learning, and then matching the characteristics of the
instructional events with the characteristics of media.7 The
procedure described by Briggs was attempted in the Multi-
Media Curriculum Development Project.
6Robert M. Gagn4i, The Conditions of Learning (New York:Molt, Rinehart and Winston, Inc., 1965).
7Briggs, et al., Instructional Media.
-67-
CDUCATIONAL TEC:SINOLOGY' 01107THR

Problems Encountered
The original media-selection plan was found to have'
deficiencies as applied in the project. It may beof.interest
to summarize the problems encountered before describing the
new plan that emerged.
The effect of using the media-selection plan was to
cause media that were "not preferred" to be eliminated from
consideration, while leaving a group of acceptable media or
media-mixes from which the final selections had to be made.
In the media-selection analysis, however, an unacceptable
medium or media-mix could become acceptable simply by adding
a supplementary medium or otherwise changing the media-mix.
Many permutations were possible.
There was always .the question of where to draw the
line in terms a different mixes that might be considered.
For example, assume a CAI carrel included a cathode ray tube,
a slide projector, an audio output device, a hardcopy output
device, a keyboard input, a light pen input, and some
pre-printed material for the student. Such a carrel alone
could result in over one hundred different possible media-mixes.
Thus,- there was always an ample supply of media combinations
that could provide satisfactorily for particular conditions of
learning.
-68-
EDUCATIONAL TECIIXOLOGY CENTSR

Another factor in the mediaselection analysis was
the homogeneity of the learning conditions that seemed called
for throughout the various parts of the course. This seemed
to be the logical result of the great similarity in the
characteristics of the content and what students were to do
with it (i.e., the behaviors) from segment to segment of the
course. Accordingly, it was possible, if one chose to do so,
to select a single media-mix, from among the alternatives
available, for use in rather lengthy sequences of instruction.
It also became clear that there had to be "trade-
offs" made throughout the course, since resources are not
unlimited. For example, media "A" may cost twice as much as
media "B" (actually, the cost ratio can be fifteen or more to
one), and it will. be "better," we judge, than media "B."
Questions arose, such as: (1) regardless of value, is there
enough money available to even consider media "A"?, (2) how
much "better" does a medium have to be to justify paying
twice the cost (and what criteria, with what reliability,
should be used in making the decisions), and (3) should resources
be evenly devoted to mediating the different parts of the course
or is it better to concentrate resources on mediating a portion
of the course, to produce the greatest average learning.
-69-
EDUCATIO NAL TECHNOLOGY CENTER

Still another factor was that the plan seemingly did
not give sufficient emphasis to the administrative-operational
setting in which the course would be presented. All told, it
appeared that the original media selection plan focused largely,
on the theoretical aspects of learning, somewhat at the
expense of environmental factors that can have a major effect
on the learning outcomes.
The New Scheme
It was concluded that the media selection plan orig-
inally proposed did not go far enough. In general, it seemed
that the scope of variables implied by the original plan was
too narrow, and there was no mechanism to weight the vari-
ables in terms of' their relative importance. As a result, .
the media selection approach underwent a revision. A two-
step media selection plan emerged.
Media selection criteria were derived from the variables
.which would determine media "effectiveness." One class of
criteria was derived from the requirements of specific
learning situations, and these may be called the "micro"
criteria. A second group of criteria, often overlooked, was
derived from the general environment in which the learning
situations were to be provided. These may-be termed the
"macro" criteria.
-70-EDUCATIONAL THCHNOLOGY CENTER

Step 1. micro-Criteria Analysis
There were several steps in this analysis, which was
directed toward determining which classes of media could be
used in particular instructional sequences. This analysis
assumed that performance objectives had been explicitly
defined and sequenced and; that the sequencing (or sequences)
reflected hierarchies of competencies called for by groups of
objectives. The analysis began by examining each individual
objective in a sequence to determine the basic requirements
of the learning called for. This analysis sought to determine
the specific stimulus requirements, response requirements, and
other requirements for producing the desired learning.
Theoretically, these requirements for learning, as
determined by this analysis, had to be provided for through.
the instructional strategy, if the learning was to be efficient
or to take place at all. The major parts of an instructional
strategy included (a) the characteristics of the message to be
presented; (b) the characteristics of the possible responses
from the student, including the desired response; (c) the
requirements for receiving and analyzing the adequacy of the
response; (d) the characteristics of the feedback to the student;
and, finally, (f) the technique of programming all of these.
Categories (a) through (d) above were the "requirements for
-71-
EDUCATIONAL TECHNOLOGY CENTER

learning" that the micro-analysis sought to determine, since
they established what capabilities the selected media must have.
In!other words, they produced the micro-criteria for use in
the media selection process. Figure 10 gives examples of
the kinds of micro-criteria that may be produced.
The result of the micro-criteria analysis was a
statement of the media capability requirements. (A. distinc-
tion was made between the absolute requirements and the "nice-
to-have" capabilities--an Ettempt was made to never confuse
the two.)
A list of types of media feasible for consideration
in the learning program was compiled. The major characteris-
tics of classes of such media were then delineated. At this
point, it was possible to compare the media capability require-
ments.with the characteristics of media feasible for consider-
ation. This produced two groups of media, one that was
"acceptable" and one that was "unacceptable," based on
attempts to match requirements with capabilities. This
concluded the micro-criteria analysis.
Before describing the next step, a comment is in order.
The more logically appealing media selection approaches call
for an analysis that is conceptually similar to that described
above. Some specify that an analysis of great depth and
detail be conducted, while others are much less demanding.
-72-
17.13UCAIONAL TECTINOLOCIr CENTER

A. Stimulus Characteristics
1. Visual
a) Black and Whiteb) Colorc) Stilld) Motion
2. Aural
a) Voice gradeb) Hi-fi
3. Referability
4. Three-dimensional
5. Coding complexity
B. Response Characteristics
1. Spoken2. Written3. Covert4. Practice5. Creative6. Time factors
C. Level of Abstraction
1. Real2. Synthetic3. Symbolic
D. Media Function
1. Present stimulus
2. Direct attention
3. Provide model ofexpected performance
4. Furnish externalprompts
5. Guiding thinking
6. Inducing transfer
7. Assessing attain-ment
8. Providing feedback
E. Type of Objective
1. Core2. Remedial3. Enrichment
F. Learning Situation
1. Group2. Individual
Fig. .--Micro-Criteria For Use in Media Selection
-73-
EOLTCATIONA.L TECHNOLOGY CENTER
!

All of these approaches, though, are trying to make some sort
of effective match between the learning conditions and the
media characteristics. But it is at this stage in. the media
selection approach that the process seems to break down.
Having isolated a group of media which at least theoretically
could meet the requirements for a given instructional sequence,
it would appear that selections could now be made, taking into
account basic considerations of price and durability, and that
one could be confident of the result. The result, in fact,
could be failure of the media strategy and the learning program
that used it.
Approaches which go little or no further than what has
been termed the micro analysis are essentially seeking to
optimize at the subsystem level. (In other words, much like
strengthening one link in a chain without knowing how strong
the other links are.) Such approaches court failure by ignor-
ing or only making passing mention of the general environment
in which the learning is to be provided. To ignore the broad
context or general environment, from which important media
selection criteria may be derived, is to seriously endanger
the success of any media selection scheme. The next step
dealt with such environmental considerations.
-74-
EDUCATIONAL TECHNOLOGY CENTER

Step 21, Macro-Criteria Analysis
Macro-criteria were derived from elements of the
/general environment in which the learning was to be provided.
The relationship between the micro-and macro-criteria and how
they were derived is illustrated in Figure 11. The figure also
shows that micro-criteria produced candidate media, but the
final selection from among the candidates was done using the
macro-criteria. The first major consideration in deriving
macro-criteria was the "level of concern," since it was a
basic requirement in identifying the goals, resources, and
constraints that could affect media selection and utilization.
Level of Concern
The level of concern for media decision-making may be
a single concept, a single lesson, a complete instructional
unit, a complete course, or for that matter, a department or
an entire school. The higher the level, the broader the goals
are, the more resources that can be applied, and the fewer
constraints that cannot be relaxed. Goals of the school have
an impact on the goals of the diviiion, and the division's
goals give general direction to the department's goals, and so
on. Goals determine how resources will be allocated and, there
fore, they influence the .constraints that will pertain to the
media program. .Formal and 'informal' administrative policies and
-75-
EDUCATIONAL TECHNOLOGY CENTER

Behavioral:Objectives
Type of Learning
Learning Objectives
Stimulus-ResponsePerformance Analysis
Micro-Selection MediaCriteria Characteristics
CandidateMedia
Feasible Media Goals, Resources,General Strategies,and Constraints
V
Candidate Media Er,' Macro-SelectionCharacteristics Criteria
Selected Media
Fig, 11.--Media Analysis and Selection Process

practices reflect goals, and the success of the media program
is going to depend in large part on how it supports the goals
ofIthe next higher level. Obviously, if a planned media
program for a department is at odds with explicit or .implicit
division .policy, it is highly probable that the program will
encounter some significant obstacles.
There is little value, for example, in v:smeone specify-
ing media for a self-instructional program if this type of
program is unacceptable at the school in the first place.
Conversely, one may find that he is selecting media for a
demonstration project which could lead to an entire school
system adopting a self-instructional course in a given subject.
The policy on expansion and dissemination of the results of a
media selection-utilization project should be clearly under.,
stood..
Being attentive to the level of concern in the MMCD
project helped to determine.the written and unwritten policies
and goals within which the media program would operate. To
the extent possible, all pertinent policies and goals were
made explicit for purposes of media planning. In some areas,
there was no identifiable policy, and the media planner had
an opportunity to influence its formulation at the appropriate
time.
-77-
ItOUCATIONAL. icciirroLoav CHNTER

Clearly identifying the resources available for. media
utilization was equally important. The resources available
were often not immediately apparent. It was important to
i
differentiate between resources required to initiate.a media
strategy' and the resources required to operate it. (If
materials are going to be produced for sophisticated equipment,
for example, then a great deal of funds may be required to
provide the program.)
Some media programs can be very costly to maintain
(e.g., those using computer-assisted instruction). Types of
resources that were considered include the following:
. Funds availablewhat sources, how probable that theywill actually be provided, what dates will they beavailable, etc.
Personliel available who are they, can the releasedate be guaranteed in writing, what are theirinterests and capabilities, part time or full-time, etc.
. Time availablewhen is the media program required,what target dates must be met, etc.
. Hardware available--what media are now available hereor from elsewhere, what is lease price versuspurchase price, what information services and otherservices are available for the media, are specialskills reouired to operate the media, what areoperational capabilities, procedures, and costs, etc.
. Software availablewhat materials are availablehere or elsewhere for the different media, at whatcost and with what quality, That materials would beuseful if modified, etc.
-78-
131)U4 ATIONAr. . TOW} 1140 LOGY C ItNTIat

Constraints are more or less the opposite side of the
resources coin. While the lack of a needed resource in
sufficient quantities is a constraint, it was alSo important
not to take certain things for granted and, as a result, fail
to uncover significant obstacles. One may be interested in
iinnovative programs, for example, but the rest of the faculty
might like the current approach.
Programming Strategy
Another key source of macro-criteria was the instruc-
tional programming strategy. It was almost impossible to
consider programming strategy without classes of media coming
to mind. Once a decision was made on programming strategy,
though, some media were automatically ruled out. Similarly,
once the media were selected, certain programming strategies
could no longer be considered. For example, computer-based
simulations were selected to demonstrate to students how
various concepts and principles relate to each other in an
econometric model under conditions which the student himself
may vary. Many variables may be handled and the relationships
among them may be extremely complex, yet the model can be
easily and quickly manipulated by the student at a computer
terminal. This programming technique might never have been
considered by someone completely ignorant of computer capabili-
ties. Thinking imaginatively about how specific media could
-79-CDUCATIONAL TI CHISIOLOOV CENTen

be used helped to develop new programming approaches, and as
many alternative approaches as possible were generated and
considered before the final selection was made.
An important point is that all programming approaches
considered had to be compatible with the stimulus-response-
feedback requirements that grew out of the analysis of the
performance objectives. And of equal importance was the
requirement that they reflect the characteristics of the target
population of students. Alternative programming approaches
had to be analyzed in relation to these an other factors
constituting the overall instructional strategy. The various
factors, of course, were interactive, so the selection of the
final "configuration" of factors was done through an iterative
process. This process was directed toward meeting the perfor-
mance.objectives in the most cost-effective manner and within
the framework of the policies and goals that prevailed.
Instructor-Student-Media Interactions
The importance of defining selection-utilization
criteria that will generate acceptance of the new media
strategy has been demonstrated by the number of media programs
which have failed in their initial stages because the faculty
or students involved did not like them. The matter of
instructor-student-media interaction, which is the primary
-80-17. DucAT I o T., TM iNoLOGY cENTKIL

1,
basis for acceptability or non-acceptability, was dealt with in
the final step of the macro-analysis. It was a critical part
of the overall instructional strategy.
Acceptance Interrelationshins.--It was very important
!not to ignore that students and teachers have opinions and1
attitudes - -sometimes very strong ones--regarding the appropri-
ateness of various instructional media. The grades, that a
student has been getting will influence his media likes and
dislikes. (The ghetto child, for example, may have entirely
different perceptions of specific media and the role they
should play than the suburban child.) Also, the teacher will
have his own criteria as to what constitutes "acceptable"
media. 1!e may believe that the purpose of media is to help
him to teach better and be concerned about attempts to "replace
the teacher" in some media applications. Or he may be eager
to experiment with new approaches and new roles. Teachers
will differ somewhat as to viewpoint, but as a group their
attitudes toward a new media program can grow more positive
or more negative, depending on how they are personally affected.
A new media program involves the students and the
teachers. If the nature of this involvement is disliked by
either party, the success of the program is jeopardized. If
the students do not like the program, negative comments will
-81-
elMJCIATIONAL TEOHNOLOGY CENTKI2

soon be heard from the teachers. And, certainly, if the
teachers are unhappy in their roles, this attitude is highly
likely to pervade the student group. It is important; then,
to take account of student variables which can promote accep-
tance on the part of the students and define a role that is
acceptable to the teacher.
Student Variables.--Many student variables entered into
the planning and decision-making for a media strategy. Many
of the same variables important to the des.ign of instructional
messages were considered because it was necessary to avoid
media that could constrain or otherwise affect the message in
undesired ways. Media which did not distort the message but,
rather, facilitated its delivery under the required conditions
were preferred.
-82-
ISDUCATEOSAL. ECIINOGOOY CONTOR

Instructor Variables.--The instructor variables were
of a somewhat different kind but were considered equally
important for a new program to be successful. The primary
question was what role the instructor would play in a new media
strategy, and this, it was thought, would depend on many
factors. The following were considered:
. How much total time would the instructor spend with(a) students individually and (b) groups of students?
. What activities would he be engaged in, as a percent-age of the total time?
Would his role have more prestige and/or more paythan the conventional role?
. Are the instructors qualified to fulfill therequirements of the role?
. Can the instructors learn any necessary new skills
under the conditions (time, money, etc.)?
. Will there be an increase or decrease in the overallworkload of the instructors?
. How much freedom and decision-making authority willthe instructors have in the new program? aft
. How much confidence do the instructors now have that
a proposed student-media-materials logistics planwill be adequately supported by the school adminis-
trators?
. What is the media history of the school (e.g., havemedia been available and have they been nsed)?
This list could be made quite lengthy, but it should be
sufficient to illustrate.some factors considered to be impor-
tant in gaining teacher acceptance.'
-83-
DUC:ATIQNAI. TRCHNOLOGY CIENTBK

Any proposed media program can cause anxiety among
teachers who are uncertain as to how they might be affected,!
particularly if self-instructional media are involved. It is
understandable that a new media program may be seen as a major
threat by the teachers and be in various ways resisted until
an acceptable role for teachers has been defined and communi-
cated to the teaching staff.
Utilization of Macro-Criteria
The macro-criteria that were derived in the MMCD
Project are summarized below. (In another situation, other
macro-criteria may he more important.) In reviewing these
criteria, it is easy to recall media that might be acceptable
or unacceptable in terms of a single criterion. Certain media,
however, will meet a given criterion better than some others,
or for less implied costs than others.
. Self-pacing--high priority must be placed on_studentsproceeding at their own pace.
. Self-managementwithin broad limits, the studentshould be able to manage his own time and exertcontrol over his own learning situation.
. Cognitive structure--it is desirable to be able todemonstrate patterns and inter-relationships inproblem-solving, real-world simulation circumstances.
. Motivation--the management of motivation should beenhanced by media (i.e., the media must reflectstudent characteristics).
-84-
IIDUCA110NAL TKO INOLOGY ONNTER

. Administration operationthe media strategy mustfit within the administrative and operationalconstraints imposed by, the environment.
. Acceptability--the media strategy must be acceptableto the faculty who will be affected and 'to thestudents for whom it is intended.
. Implied costs--the implied costs of the mediastrategy, for both development and utilization, mustbe within the reach of available resources.
. Noveltythe novelty effect of certain media ormedia sequences should be exploited (a simple changeof the media is often refreshing and motivating tothe student).
. Sequencing media usage by the student and transitionsfrom one medium to another must appear unhurried,smooth, and rational to the student.
The macrocriteria that should be employed will vary
from situation to situation, simply because the variables will
differ between situations. This is important, since what is
desired is a media program that will meet the requirements of
a given situation. The list of specific variables that could
be important at the macro level could be quite lengthy_.
In the MCD Project, care was taken to properly weight
the variables in accordance with their probable contributions to
media effectiveness. For example,'"acceptability" of the media
strategy to faculty and students was considered tical in
the M!4CD Project, and selection criteria required to insure
such acceptability was heavily weicihted,
POOR ORiGiMAL CAA:- 8 AYAil ARV' AT TiPAC' FILM
EDUCATIONAL TECHNOLOGY CENTER

CHAPTER VIII
PREPARE MATERIALS
in a review of the research on curriculum materials,
Popham distinguished between projects that produced admonitionsi
and projects that produced materials, stating:1
.
To state it bluntly, it takes more than admonitionsfrom curriculum seers, even if they are accompanied bypolished curriculum guides, to alter the procedures ofbusy educational practitioners. The educational reformerwho eloquently urges classroom teachers to change theirpractices may receive the accolades of the educationalcommunity, but the educational reformer who provides aset of usable curriculum materials for the teacher ismore likely to modify what goes on in the classroom.'
The preparation of materials concerned four
'critical activities:
1. Developing the presentation- feedback strategyfor each media -mix selected
2. Generating materials specifications
3. Producing the materials
4. Trying out the material with students and revisingit as indicated by an analysis of the empiricalresults.
These activities had to be effectively performed within
hard and fast time limitations. On a specific day, the semester
would begin, the students would arrive, and the Multi-Media
1W. James Popham, "Curriculum flaterials," Review ofjAucational Research, XXXIX, No. 3 (1969), 319.
-86-EDUCATIONAL TECHNOLOGY CENTER

Economic Analysis Course had to be "ready" for them. "Ready"
meant that confidence in its instructional benefits had
already been obtained through preliminary testing This in
turn, meant that one to two htmdred student-hours of.material
had to be generated and reach a "pre-validated" form during
about a three-month period.
-87-
COUCATIONAL TFAIIINOLOGV CENTER

Presentation Strategies
It was decided that Gagne''s theoretical descriptions
of conditions of learning for types of learning wo'uld serve as
general models for the presentation strategies of the media?
This meant that, as a first step, the type of learning called
for by each behavioral objective in an instructional segment
had to be determined. Each "segment of objectives" was care-
fully reviewed and each objective labeled with an identifica-
tion of one of Gagn's eight types of learning.
The great preponderance of objectives was judged to
be Type 8 (Problem Solving) and Type 7 (Principle Learning),
the two highest types of learning according to Gagr4's hier-
archy. Type 6 (Concept Learning) was third in frequency of
usage and Type 5 (Multiple-Discrimination Learning) was fourth.
None of the objectives.was judged to be Type 1 through Type 4.
For purposes of materials development specifications,
it proved to be difficult and impractical to differentiate
between Principle Learning and Problem Solving. In other
words, it was difficult to find general criteria for the
materials developers to follow which would adequately differ-
entiate between how materials should be developed where
2Robert M. Gagne, The Conditions of Learning (New York:Holt, Rinehart and Winston, Inc., 1965).
-88--kIMICATIONAK, TRCIINOLOGY CaNT1112

Principle Learning is called for versus where Problem Solving
is called for. .There is as much variability in learning within
each of these two types of learning as there is between the two
types.
There are "simple" principles and there are "difficult"
principles. Similarly, there are "simple" problems to solve
and there are "difficult" problems to solve. The amount of
guidance required can vary within either type of learning.
Gagne anticipated some difficulty of this type when he stated:
In a fundamental sense, the capability learned byproblem solving (Type 8) is no different from that which
may he learned by combining subordinate principles inthe manner described as Type 7 learning. Both hinds oflearning result in the establishment of higher-orderprinciples. The two kinds of learning appear to differonly in the nature and amount of guidance provided byverbal instructions.3
As a result, the .materials specifications combined
Types 7 and 8 learning. into one explanation of conditions of
learning, i.e., into one learning paradigm. In applying the
guidelines that were a part of the explanation, the individual
materials preparer was given room for exercising his best
judgment and for being creative in .applying the paradigm in
producing materials.
The conditions of learning, then, were translated into
learning paradigms for types of learning. These paradigms were
p. 164.
-89-MAR 7.MONA r. TFX:11N014001- CP,VT14.2

not given to the materials developers.4 Rather, the paradigms
were used to prepare examples of learning materials that embody
the paradigms; and these examples were given. Three materials
samples were prepared for the use of the materials preparers.
Sample g concerned higher-prder principle learning (Type 8,-
Problem Solving and Type 7 - Principle Learning); Sample B
concerned Concept Learning (Type 6); and Sample C concerned
multiple-discrimination learning (Type 5). Materials developers
were informed that Sample A was to be generally followed for
all objectives labeled "A," Sample B for all those labeled "B,"
and Sample C for all those labeled "C."
Translating the learning paradigms to materials samples,
however, required a number of decisions on treatment variables.
Decisions had to be made 'concerning:
. Use of "Organizers"
. Step Size
. Relevant Practice
. Knowledge of Results
. Sequencing within segments
. Formatting
. Pacing
4Phrases such as "learning paradigms" were rarely usedin communication with materials prepared or with anyone whowas not a part of the project tear.
IMUCATIONAT. TWEINOLOOT CENTER

The learning paradigms (based on Gagn's descriptions
of conditions of learning) implied the use of "organizers" to
focus attention, indicate relevance, provide perspective, give
a "roadmap" of the planned learning path--all directed toward
facilitating transfer and otherwise increasing the efficiency
of learning.5 There is evidence that the use of organizers
can markedly increase learning efficiency. 6 Organizers were
used in introducing the learning, during the learning, and
following the learning.
The decisions to be made on "step size" were considered
crucial to the ultimate appropriateness and acceptability of
the materials. Briggs points out that there is no common
understanding of what "step size" means:
There is no standard definition of "size of step."In programed instruction it has referred variously to(a) how difficult a resoonse is to make, (h) how large areading segment is presented before a response is required,(c) how much progress toward the goal is represented byone frame, (d) how long it takes the learner to make aresponse, (e) whether or not the student responds correctly,and (f) how frequently reinforcement occurs. 7
5 Ibid.
6See the review by Popham, "Curriculum Materials," 323;also see Arden Grotelueschen, "Effects of DifferentiallyStructural Introductory Materials and Learning Tasks onLearning and Transfer," American Educational nesearch Journal,V (1968), 191-202.
7Leslie J. Briggs, "Learner Variables and EducationalMedia," Revieu_fal_Zi7=eUov-,10,1 Pge:%ug132 XXXVIIT, No. 2 (1969),165-166.
-91-CDUCATFONAL TECHNOLOGY CENTER

In the MMCD Project, "step size" was defined as the
amount of learning required by the student to proceed from
achieving one behavioral objective to achieving the next
behavioral objective in the same learning sequence. Thus,
"step size" was related to measurable behavior change. As
indicated below in the discussion of pacing, the students
were nevertheless individually given much control over the
"step size" they actually used.
Relevant practice was imbedded in the learning material
for every objective, whether an intermediate behavioral objec-
tive or a terminal behavioral objective. Moreover, self-tests
were strategically inserted in learning sequences, which had
the dual benefit of giving the student feedback on his perfor-
mance and letting him further Practice the correct performance.
About three or four practice situations (usually problems to
solve) were included in a ten-minute learning sequence for a
behavioral objective. The next behavioral objective in the
hierarchical learning sequence would, in its instructional
material, build on the just-learned behavior, often providing
additional practice of the previous behavior or otherwise
reinforcing that behavior. At the end of an instructional
segment (about fifty minutes average learning time, but with
great individual variation in time), the self-test provided
additional practice of desired behavior taught in the segment.
-92-itOUCATiONAL TBC1INOLOGY CSIVTICH

Knowledge of results, it was concluded, should be
provided as soon as possible. A student response board was,
therefore, among the media selected. This device is used by
the student during the majority of instructional sequences
Iwhen the medium is not one or more humans (such as in counseling
sessions or seminars). The board gives him immediate feedback
on his practice problems and on all self-tests (as he is taking
each test). In the event a student's response is incorrect
with regard to a given problem or test item, he is expected
to follow the suggested learning prescription associated with
the incorrect response.
Sequencing within individual segments did not involve
difficult decisions. A typical instructional segment might
include from six 'to ten behavioral objectives. Individual
materials preparers prepared complete segments (and, in some
cases, complete topics having a number of segments). If the
relationships among the behavioral objectives in a segment
allowed for someminor sequencing options, the materials
preparer was generally given the fr.eedom to select the option
that most suited him and any creative ideas he had in mind.
Formatting decisions were considered to be of very
great importance. The "format" included the physical layout
of the printed page, the tone and rate of the spoken word in
an audio tape, the nature of a computer printout, and a host:
of general considerations regarding these and other media.-91- EnucA rLo 41 f Tsai Noway CENTER

It was believed that a "pleasing" image was important for the
materials, that its absence would have a negative effect on
the learning. It was not concluded that materials had to be
elaborate.
Since one of the major objectives, of courser was to
individualize instruction, it was decided that the student
should largely control his own learning pace, provided he is
progressing at the minimum acceptable pace. In order to
facilitate such self-pacing, the learning materials were to be
prepared so that a student could use them at different rates
and amounts of interaction. (It was felt that a student should
be able to use the materials as best suited his own "learning
style.) Accordingly, it was decided to have a "high speed"
path through the materials, plus a slower, highly structured
path., Also, it was decided to provide for multiple entry points
in the material and to allow the student a degree of control
over the sequencing of the, instructional events he participated
in.
Materials Specifications
It was concluded that the only way in which the
materials preparation schedule could be met was through a
massive "parallel" production of virtually the entire 100 to
200 hours of the course. The schedule allowed only three
-94- EGOCATIONAL TECHNOLOGY CENTER

months for developing the presentation-feedback strategies,
generating the detailed materials specifications, producing
the materials, and trying out and revising the materials until
they achieved a satisfactory prevalidation quality.
The present project staff alone was unable to carry
out such a major undertaking, so it was decided that outside
resources would have to be utilized. An assumption was made
that only experienced college instructors in economics would
have sufficient knowledge and judgment to be able to prepare
learning materials that met the specifications that would be
provided. It was decided (1) that such economist-writers
should be sought to supplement similar economist-writers
already on the project, (2) a materials specifications "kit"
should be prepared for each part of the course and used by
the economist-writers, and (3) a training program should be
developed for all of the economist-writers, to train them in
how-to prepare materials to meet the specifications.
The decisions regarding presentation strategies were
largely documented in the form of materials samples. However,
certain explanatory materials and guidelines were also
provided for the use of selected materials developers. The
materials samples, explanatory materials, and guidelines
were put together in a "kit" for the economist-writers. Kits
were essentially alike; however, each kit also contained
-95-EDUCATIONAL. TECHNOLOGY CENTER

specifications for a unique portion of the course. Thus, each
kit was "tailored" for the economist-writer in terms of the
part or parts of the course he was preparing.
A kit contained the following items;8
1. Economics Course Outline
2. Behavioral objectives and sample test items foreach segment for which the economist-writer wasto prepare materials.
3. One or more materials samples, including anexample of a completed self instructional segment.
4. A list of the summarized behavioral objectivesfor the entire course. (This helped the economistunderstand how a given topic fit into the coursestructure. It was also hc)pful in preventingomissions and redundancies of material.)
5. A statement of guidelines for economist-writers.These were general guidelines for the self-instructional printed materials.
6. Instructional exercise answer patterns. Economistsreceived copies of these so that they couldprovide for various self-testing and controlledtesting exercises in their materials, using astudent response board.
7. "Notes to Economists." These were the noteseconomist-writers received as an aid to them indeveloping materials. Many of these notes calledfor the develoement of subordinate behaviors inconnection with learning to achieve a higher-level behavioral objective.
listed.
8 See Appendix C for samples of some of the items
_96-
EDUCATIONAL TECIINOWD V CENTER

t. "Final Checklist: Economics Course Materials."The economist-writer was asked to use this check-list to make sure he followed the guidelinesgiven to him.
Economics instructors from a number of universities
invited to participate as writers. A one-day orientation
Iprogram was provided for those instructors who indicated an
interest in participating: At this orientation, the philosophy
of the course was discussed and materials development specifi-
cations reviewed. An outline of the entire course (see
Appendix D) was given to each participant at the outset. This
was supplemented by summary listing of all of the objectives
(cognitive domain) of the course, broken down by topic and by
segment within topic (see Appendix E). Thus, if an economist
felt his forte was in a particular topic, he could quickly
review the summarized objectives for that topic and decide if
the topic had more than usual'interest to him. (Normally,
if an economist selected a topic, he prepared materials for
all of the segments constituting it, but there were some
exceptions in tha case of some very large topics.)
The economist-writers left "the orientation program
with tentative writing assignments. A few decided that they
did not want to participate after further reviewing the infor-
mation they were given. Others immediately began their
assignments.
-97-
CDUCATIONAL TECTINOLOGY CENTER

Producing the Materials
About twenty economists from a number of universities
participated in the materials specification and prdparation
process. Some worked on a full-time basis while others worked
part time. The economics faculty and technology consultants
were from the following universities:
American University
George Washington University
Harvard University
Nova University
The Catholic University of America
University of Maryland
University of Pittsburgh
University of Toronto
I 4
One of the functions of the economist-writer was
to review the performance objectives and test items he received
for accuracy and content validity. Materials released by the
economist-writer were given the following treatment:
1. A behavioral check by a behavioral specialistusing a checklist
2. Preliminary editing
3. A final instructional check by an economicsprofessor with extensive recent experienceteaching introductory economics
-98-cnocATtomAT., THOHNOLOCIV CENTHR

4. rinal editing by a professional editor
5. Printing and duplication of packages for in-housepreliminary tryouts
Part of the training given to the economist-writers
was in the form of a critique of the manuscripts they sub-
mitted. Perhaps one-half of the economists who began to prepare
materials for a topic witlidrew on their own accord or were
asked to withdraw. In nearly all of these cases, certain
qualitative criteria were not being met by the 'materials
developer. Typically, the person was a poor writer or he
found writing to be a very laborious task.
The preliminary editing of the work received from the
economists varied from a near rewrite to relatively minor
changes. Good initial writing on the part of the economists
could save substantial costs for the time and manpower required
to revise it. The good, fast writers far outperformed their
colleagues. In terms of expenditure per "unit" of material,
one good writer-might cost only one-third as much as an
"average" writer and, in addition, meet due dates.
Preliminary Tryouts
The last step of the materials preparation task was
to conduct the preliminary tryouts and to revise the materials
based on the results. College students who generally resembled
-99-
EOUCAT1O1VA TECHNOLOGY CENTER

the students at the Naval Academy in respect to academic
background and Achievement were used for preliminary testing
of the material. These students "took" course materials in
the same sequence as the midshipmen were to take them, but
lone to two months prior to. when they would be given to the
'midshipmen.
The main purpose of these tryouts was to discover
ambiguities, information gaps, terminology problems, prereq-
uisite inadequacies, or any other problem that may hinder
achievement of the performance objectives.' Materials that
did not produce the desired learning were revised until they
did. An interview technique was used in conjunction with item
analysis and other techniques to identify where students
encountered problems in the learning process. It was necessary
to go.through several tryout-revision cycles in some cases
before an instructional segment was satisfactory. (Appendix F,
an excerpt from a project technical report, describes the
procedures used for the preliminary tryouts.)
The way in which learning packages were constructed
made it possible to identify with great precision where a
change had 'to be made in a segment to improve it. In the
Self-Instructional Printed Packages, for example, an analysis
of performance on the criterion test could. indicate the
segment, page within the segment, paragraph on the page, and
sentence in the paragraph that caused the learning difficulty.
-100- EDUCATIONAL TECHNOLOOY CENTER

Comments on Parallel Development
The materials preparation process described above
proved to be virtually trouble-free. Even though two
semesters worth of mostly self-instructional course materials
had to be produced in four months, this time span proved to
be comfortable. Due dates were given to each writer that took
into account the possibility that (a) he would meet the due
date but his work would be of little if any value or (b) he
would miss the due date by several weeks. Sufficient time was
always reserved to either (a) reassign the work to an
economist-writer who always produced acceptable work or
0)) completely redo the material using core members of the
project team.
While the materials were prepared in parallel, they
were used in a linear sequence in the preliminary tryouts.
In the MMCD Project, materials that needed to be ready soon
for such tryouts always had the highest priority internally
for needed edits, rewrites, reviews, typing, and duplicating.
-101-
EDUCATIONAL TEcIINCLOCV CENTER

CHAPTER IX
COURSE EVALUATION
It may be argued that informal evaluation defeats the
purposes of evaluation because it yields data which are of
dubious value for decision-making purposes. Hastings describes
the purposes of evaluation as the collection of information--
1. To be used as feedback to innovators for furtherrevision of materials and methods
2. To provide information as input for decision-making by the schools about the adootion ofcourse-content improvement packages1
A definition of "evaluation" that resembles Nasting's
description is offered by Alkin:
Evaluation is the process of ascertaining the decisionareas of concern, selecting appropriate information, andcollecting and analyzing information in order to reportsummary data useful to decision-makers in selecting amongalternatives.2
In reviewing the literature in curriculum evaluation,
Baker points out that as a subject matter "it has not yet been
1J. Thomas Hastings, "Curriculum Evaluation: The Whyof the Outcomes," Journal of Educational Measurement, II, No. 1(Spring, 1966) , 27-28.
2Marvin C. Alkin, "Evaluation Theory Development,"Evaluation Comment, II, Noel (1969), 2.
-102-
EDUCATIONAL Tr.cemor.00v etra4:17.R

I
defined and bounded."3 He stresses the "considerable
divergence" on many aspects of evaluation but points to an
important area of agreement:
Establishing an empirical basis for the revision andrefinement of facilities, materials and methods appearsto be a common objective of evaluation models.4
Stufflebeam proposed a CIPP (Context, Input, Process,
Product) model for evaluation purposes, that helps to imple-
ment this type of approach.5 Similarly, Provus described a
"discrepancy model" that is directed toward decision-making,.
outlining five stages: (1) definition, (2) installation,
(3) process, (4) product, and (5) cost-benefit analysis.6
Stufflebeam emphasizes that formal evaluations are
typically poorly done/ and he suggests a number of reasons why:
'Robert L. Baker, "Curriculum Evaluation," Review ofEducational Research, XXXIX, No. 3 (1969), 339.
4Ibid., p. 347.
5Daniel L. Stufflebeam, "The Use and Abuse of Evalua-tions in Title III and a Description of a Proposed CIPP(Context, Input, Process, Product) Model for Evaluation ofTitle III Projects." An address delivered at the NationalSeminar on Innovations sponsored by the Net-tering Foundationand the U.S. Office of Education, Honolulu, Hawaii, July 1967.
614. Provus, "Evaluation of Ongoing Programs in thePublic School System," Educational Evaluation: New Roles,Ilgy Means, ed. by R. W. Tyler, Sixty-eighth Yearbook of theNational Society for the Study of Education, Part II (Chicago:NSEE, 1969) , pp. 242-283.
-143-
---1EDUCATIONAL TECIINOLOGY CIMTEE

. educators dislike evaluation
. they are untrained in it
. it ha's not been done in the past
. good guidelines are lacking
. evaluation results have not been used?
In a comparable vein, Stake criticizes the way in
;which formal evaluations are being done, pointing out that
they tend to be characterized by one or more of the following:
. checklists
. structured visitation by peers
. controlled comparisons
. standardized testing of students8
The evaluation task in the Multi-Media Curriculum
Development Project was both planned and imlemented within
the framework recommended by the above researchers. In other
words, an empirically-based decision-oriented process was
employed. The evaluation task was a major undertaking, second
only to establishing behavioral objectives in terms of man-
power utilization. It was also the longest task, involving
about a year and one-half to perform. While it presented
problems, they were primarily a matter of reasonable profes-
sional disagreements which were resolvable in an acceptable
manner and within an acceptable amount of time.
7Stufflebeam, "The Use and Abuse of Evaluations inTitle III and Description of Proposed CIPP Model for Evaluationof Title III Projects," p. 4.
8Robcrt E. Stake, "The Countenance of EducationalEvaluation," Teachers College Record, LXVITI, No. 7 (1967) , 1.
-104-EDUCATIONAL TECHNOLOGY CENTER

It should he mentioned that the results of the evalua-
tion process had major implications for all aspects of project
performance. A major function of evaluation was to determine
whether or not the instructional process was producing
learning that met established criterion performance levels.
The instructional process was to be revised when a perfor-
mance criterion was not met. See Figure 12 for an illustration
of the evaluation concept employed.
-105-
mucinro.Isur., TECH NOLOGY CENTER

1.9M.I.70.7t1.41Krakmeaset
L_____Students In PROCESSAivelbeamoiwestaaimrawwwwww.M.t.
Students Out
Revise
EvaluationResults
REVISION [
DECISIONS
Fig. 12.--Illustration of Evaluation Concept Emplpyed
EDUCATIONAL. TECHNOLOGY CENTER

Two-Semester Process
The preliminary tryouts preceded the validation trial.
Essentially the same tryout-revision process employed for the
preliminary tryouts was used in the validation trial. This
process is described in Appendix G ("Excerpt from TR-5:35:
Preliminary Validation Report for. Multi-Media Economics
Course"). A brief explanation of how empirical data were used
in deciding what revisions should be made is contained in
Appendix H ("Excerpt from I.M. f$7-R: Explanation of Materials
Revision Process Based on Empirical Results") .
It was believed that a course could not be "evaluated"
until it was "validated." "Validation " was directed toward
insuring that the instructional process produced the intended
learning outcomes. The Validation trial was a "complete
system test," while the preliminary tryouts were in effect
"subsystem tests." It does not necessarily follow that if
each subsystem performs satisfactorily independent of the
complete system that it will function satisfactorily as a
system component. Thus, a function of the validation trial
was to assess the extent to which the various components
(segments, topics, pre- and post-tests, counseling, seminars,
media, etc.) were integrated into an efficiently functioning
whole.
-107-
ROM A1 tO)Ar. TI U i NO LOCA. CMTI.12

Assuming that the integration is satisfactory, the
various course segments should produce roughly the same
achievement levels in the validation trial as they did in the
preliminary tryouts. If criterion performance levels are not
achieved in the validation trial, a decision must be Made as to
whether the rise in performance needed to inset criterion
performance is worth the cost of revising the course, given
the subjective probability that the course deficiency or defic-
iencies have been identified. Many variables, of course,
affect student performance, and it is often difficult to
ascertain with precision the reasons why student performance
is. below expectations.
"Evaluation," on the other hand, was directed toward
the question of how well a validated instructional system
operates within a given adminiStrative-operational environ-
ment. It was thought that a "validated" course could be
-disseminated to other educational institutions, where it
would probably be subjected to an "evaluation." A course
could be validated but fail the evaluation at the institution
for any number of reasons, such as incompatibility with
administrative policies and procedures, significant differences
in the comparable target populations, or different attitudes
on the part of the faculty. Accordingly, the process of
evaluation, as viewed in the MMCD rroject, was aimed at
-108-EDUCATIONAL TECHNOLOGY CENTER-I

determining how :sell 'a validated course "fits" at a given
institution. If the fit is not satisfactory, a decision must
be made regarding what changes might has made to produce a
good fit and if the costs of making such changes are acceptable.
1It was therefore concluded that there should be a
"validation semester" and an "evaluation semester" for the
new course. The validation semester, it was planned, would
be highly controlled, in the sense that all course options
would be tested, detailed responses would be cantured, and
great care would be exercised to ensure that if any students
did not do well in the course it could be determined, within
reasonable limits, if the instructional program wore at fault.
As in preliminary testing, it was always assumed that the
instructional program was at fault if a student encountered
learning difficulty, unless specific information indicated
that there was some other cause. (Stich information was
sometimes obtained in interviews with saudents.)
A Methodological Issue
DUring the validation semester, students were not
allowed to proceed through the course faster than a specified
rate. This was done as a matter of simplifying course admini-
stration and minimizing administrative-operational problems
100enucAproxu. Teo iNot.ocy oFINTER

while materials were-being tested. As a result, pre- and
post-testing and other events were scheduled for certain dates
throughout the semester. A student could not take a test or
participate in a special event prior to the first date for
which it was scheduled. Thus, wriile there were major dilfer-
ences in time spent studying (see page 16 of Appendix 11, no
student could complete the course before another student.
In the evaluation semester: on the other hand, it was
planned that the course would be presented in its "fully
operational mode." And this was, in fact, accomplished.
However, in connection with doing .the planning for this semes-
ter, a problem arose with regard to the evaluation methodology.
Consultants to the Naval Academy recommended a form of the
classical experimental design, in which there would he a
control group and an 'experimental group. A technical report
from ETC argued the merits of using a CIPP-type evaluation
approach, as indicated by this excerpt from it:
-3.10-
!MU( !ATIONAL TWCHNOLOCM

In the fully operational economic analysis course,as it is currently designed, students will be able toproceed through the course at their own pace, makemany of their own decisions on media usage and. optionalenrichment areas, and otherwise exert a significantdegree of control over when and how they study. In otherwords, the course is highly individualized in its intendedoperational state. It is very desirable that the coursebe evaluated in that highly individualized state.
A methodological problem can arise if one wishes toperform controlled media research during the "evaluationsemester." An experimental design necessarily calls forextensive control of variables. And only when an experi-ment is carefully controlled are its results of value.The typo of control generally required, however, isdirectly at odds with the concept of a highly individual-ized course. The very essence of a highly individualizedcourse--the flexibility and optionspresents the problem.It is possible to he faced with the alternetive of eitherconducting a carefully controlled experiment or evaluatinga'highly individualized course of instruction.
In the present case, it is of critical importance thatthe evaluation apply to the course as it will be operatingin the future. Any media studies conducted during theevaluation semester should disturb as little as possiblethe intended course operations. Only then will the resultsof the evaluation be useful. And of course, the results ofmedia studies which do not disturb the normal operationswill have greater valuator a curriculum development modelthan studies conducted in a temporary artificial atmosphere.
One last point should be made regarding evaluationmethodology. There is usually a "shakedown" period aftera new system is first placed into full operation. Duringthis period, it may become necessary to modify the systemslightly to overcome an unexpected problem. The previous
tiouvATzomr. TECHNOLOGY CENTIME

tryouts of the economics course have tended to validateits subsystems and. its plan of operation. The shakedownperiod for the operational course will be the evaluationsemester, which begins in September 1969. The evaluationmethodology must be such as to permit necessary changesto be made in the administration of the course ,duringthis period.
Evaluation activities may be described as fallinginto four basic categories:
1. Student performance2. Student and instructor acceptance3. Course management4. General operational environment
The ultimate measure of the success of a learningprogram is, of course, the performance of the studentsin achieving the learning objectives. -However, theother three categories of activities listed above areimportant in facilitating or hampering the achievementof the desired performance. Each of the four categoriesis discussed below in terms of objectives, data required,,method of data collection, and data analysis.9
The Academy and its consultants accepted and modified
CIPP evaluation approach that was proposed.
Validation Trial
The validation trial was conducted over a semester's
time, as planned. The following classes of data were collected:
. Learning time
. Learning-imbedded student responses
. Self-test student responses
9Bducational Technology Center, TR-5.37.
-112-
VOUCATEONAL TECHNOLOGY VENTER

Criterion post-test responsesMedium-use record per student
. Student course critique informationInstructor course critique informationCritical incidents
These data were analyzed and used as the bases for
course revisions. Appendix *G ("Excerpt from TR-5.39: Final
Validation Report") describes in detail the validation
activities and the results.
As stated earlier, the validation trial assumed that
the quality of the instructional segments had been confirmed
through the preliminary tryout-revision process. In that
process, some instructional segments went through as many as
five empirically-based revisions, though this was infrequent
(two or three ware typical) . It was important that the material
be virtually "pre-validated" for use in the validation trial
because only one empirically-based revision could result from
that trial. This was the case because all of the subjects
took the course at one time. A revision could not be
"re- tested" in the validation semester because there were no
more subjects available.10
10New subjects could not be easily brought in, sinceit might take a new subject a month or more to acquire theentry behavior necessary to test a revised segment locatedin the middle of the course.
'-113-
RDUCATIONAL TMINOLOOY (:ENTER

Since any revisions done following the validation
trial could not be properly tested before the evaluation
trial, extreme caution was exercised to prevent "over, -
revising." Over-revision was viewed as making changes in
" problem" material beyond those clearly indicated by .empirical
data. If material were modified without a clear-cut empirical
justification, it would be possible to make the material less,
effective than it was prior to this revision. Hence, tight
controls were employed to review revision rationales before
the material could leave the revision process.
Also, the standardization of the decision-making
rules as pertain to revisions was considered a requirement.
Decision-making guidelines were promulgated toward this end
and review points' in the revision process were establishedP-
Evaluation Semester
Evaluation activities fell into five areas:
1. Student Performance
2. Student and InstrUctor.Acceptance
3. Course.Management
4. Course Environment
5. Special Media Analyses
11An example of a decision-making 5uideline may befound in Appendix H ("Excerpt from I.M. M-R: Explanationof Materials Revision Process Based on Empirical Results") ,where a step -by -step decision-making procedure is described.
si EDUCATIONAL TocinvoLooy CENTER

Student Performance ''valuation
The primary purpose of this area of evaluation was to
determine the efficiency of instruction. Efficiency was
measured in terms of learning-time-taken and achiivement
scores on criterion-referenced examinations. Two classes of
data were required:
1. Achievement scores on criterion referencedexaminations, for each student on each controltest
2. Amount of learning time taken by each studenton each instructional segment.
The criterion-referenced control tests were admin-
istered to students by the course administrator, in an area
provided for such testing. A student was permitted to take
such a test as soon as he believed he could pass it. If he
failed to achieve criterion performance in two tries, he was
required to see his professor, who would rake a diagnosis
and prepare an individUal learning prescription.12 (This
arrangement was intended to deter students from taking
criterion tests more than once, without having studied, in
the hopes they might pass some by chance. It was also
intended to help identify, very early, the students who may
have a serious.learning problem which needed the diagnostic
skills of the instructor.) The final achievement score
12 Based on experience, the probability of thishappening was less than two per .cent.
-115-
KOUVATIO NA r., Ti-le I 1 NOLOGY C MN"' Er

obtained by a student on a control test was used as the
measure of his "performance."
Time-taken was recorded on a segment-by-segment basis
by each student. The student submitted his study time record
/to the Course Administrator at the time he took a control
test. The total study time accumulated prior to the student's
passing the control test constituted his learning time-taken
for the level of achievement he obtained as indicated by his
test score.
Student-Instructor Accentance Evaluation
It was thought to be very important to take into
account the attitudes and opinions of the students and the
instructors involved in the multi-media course. Even if the
course were effective from an instructional or learning stand-
point, it was also important that the course be "acceptable" to
those who are involved in it as instructors or students. There
are different levels of acceptance, ranging upward from barely
tolerable. The key level of acceptability, it was thought,
was the level at which a student or instructor would be willing
to continue with a course such as this in the next semester.
The purpose of this evaluation area w-s (a) to ascer-
tain if students and/or instructors were willing to continue
in a course designed as this one, and (b) to determine what
aspects of the course might be changed to increase the accept-
ability while meeting the learning objectives.
-116-EDUCATIONAL TKCIINOLOI:V ELN.I

Students' and instructors' comments on specific
aspects of the course, as well as the course in general, were
routinely solicited. The specific aspects of the bourse on
which comments were solicited included each media-materials
combinations and other planned instructional activities.
Critique sheets were issued with both instructor
materials and student materials and were otherwise made
available to the instructors and students. These sheets were
sufficiently structured so that information was solicited
regarding specific and general aspects of the course. ow-
ever, the reply requested was "open-ended," so that no
restrictions were placed on obtaining possible negative
comments.
Critique sheets turned in for evaluation purposes were
subjected to an analysis to determine (a) what:.1 pa=cts of the
course were reported as best liked art (b) what aspects were
negatively criticized. Absence of a negative response on an
aspect of the course was taken to imply that that aspect was
acceptable. The specific negative and positive comments
served as the partial basis for revising the course admini-
stration to increase the general level of acceptability.
-117-
s.mnicivprorrAr, Tgertts:oLocw ortsTert

Course Management
The course management concerns instructor-student-
media-materials logistics, schedules, learning prescriptions,
and other aspects of providing for and monitoring instruc-
tional activities. Course management planning was done by a
Course Administrator and the instructors within the context
of previously established course management policies and
procedures. A Course Administrator was responsible for admin-
istering the plan (he performed no instructional or formal
guidance function).
The purpose of this evaluation area was to assess the
adequacy of the course management plan and its administration
and to ascertain what improvements might be made. Accordingly,
information on problems that arose regarding course manage-
ment was needed. This information, it was decided, should
includa a description of the problem, the date it first was
detected, the circumstances under which it arose, what was
done about it, who was involved, and what future action seemed
advisable. The multi-media course instructors, the course
administrator, and the liaison personnel of the contractor
were each given a notebook and instructions fo.r recording
critical incidents. The data thus recorded are currently
being analyzed_ to determine how undesired events might be
avoirled in the future.
-118-111j1.C.VVIONAI,9'ECIIN01.0(;r0IINTIIR

General Operational. Brivironment
A highly individualized instructional program cannot
be designed without regard to the constraints that may be
imposed by the general environment in which the program is to
be carried out. Similarly, such acourse cannot be success-
fully introduced into a conventional educational environment
without the environment being changed to some extent. The
"environment," as used here, refers to policies, procedures,
staffing, facilities, and similar factors that constitute the
situation within which the program, or course, operates.
Several examples may be given of the kinds of
"conflicts" between the old and new often created by intro-
ducing such a course. A grading policy may have been estab-
lished only after long and careful deliberation, but a
question arises as to when "mid-term" grades should be sub-
mitted if a program is self-paced and students are at many
different places in the course. Similarly, a media-materials
resource center has a set of new requirements to meet when it
must serve a highly individualized, multi-media course.
The purpose of this area of evaluation in the MMCD
Project was to assess the effects of the course on its opera-
tional environment and the effects of the environment on the
-119--
ISDUCATiONAL TitCHNOLOGY CENTER.

operation of thu course. I was believed that such an
assessment would provide information regarding what changes
in the course or its environment might he advisable .to further
the learning goals.
Information re5Ftr(ling conflicts between the unitim2dia
course and its operational environment had to be recorded. The
recorded information was to include a description of the con-
flict, the date it was first detected, its implications, what
was done about it, and what future action seemed advisable.
The multi-media course instructors, the course administrator,
and the contractor liaison personnel each were given a notebook
and instructions for recording operational conflicts.
Staffing, Organization, and Costs
Some discussion of staffing, organization and general
allocations of resources by phase may be of value at this point.
As would be expected, the project was staffed with
professionals having a broad grasp of educational technology,
plus experience with innovative educational projects. Figure
13 gives the organization chart for most of the project.
Nearly every one of the sixteen persons indicated on the chart
was involved in one or more advanced development projects prior
to joining the MMCD Project.
-120-
4.)EDUCATIONAL. TECHNOLO(IY CENTER

(ProgramDirector
\ET:. Titzpatrickts.)
Systems Materialsf
Tests and Materials
Engineering Development ) I Measurement Specification
,.. eL. Motzel J. Kearney N. Furey T. Sutty
Production Confic;tTra.:\ On-SiteControl tion Control Coordination
/ Eccaomicsr Simulation
M. Selles A. Tripp11. node's
D. .FE,n 1 k__13._22bell--- _
A
(Economics
V. Fable
Data TestProcessing Subjects
0. Gerakisj . Robinson
Fig. 13.--Project Organization
Economics
T.Havriiesky
POOR ORIGINAL COPY - BESTAVARABLE AT TIME FILMED

Another characteristic of project personnel was that
most of them were qualified to perform more than one function
in the project. As a result, many of the staff took part in
,many tasks. Still another characteristic that deserves
I mention is that all but a few staff members had once been
full-time teachers.
The cost's of any curriculum development effort are
dependent on many things. Costs must be measured in terms of
resources expended. Based on the MMCD Project, the cost-ratios
for the three phases of the project were about 2:2:1, respec-
tively for phases I, II, and III. These cost ratios should
be viewed as simply a frame of reference.
In an extremely complex educational problem area, the
first phase might require a higher proportion of the total
resources than the 40% indicated by the above ratios.
In an uncomplicated situation, the proportion required for
the first phase might be less than 40 per cent. Similarly,
the proportionate cost of Phase II can rise or fall based
on the complexity and amount of the software that needs to be
developed.
-122-
EDUCATIONAL TECHNOLOGY CENTER

CHAPTER X
CONCLUSIONS AND RECOMMENDATIONS
It is appropriate that this report comment on the use-
/ fulness of the development model for other course developers.
Majot Conclusion
The value of the development model that has been
described in the previous chapters is suggested by the
characteristics of the course that was produced using it.
In other words, the course is the test of the model. A
summary of the Final Evaluation Report is given in Appendix J.
Note that among the students who completed the two-semester
course in six weeks were (a) the student who spent the least
amount of time studying and (b) the student who spent the most
amount of time studying. This demonstrates the flexibility of
the course in terms of the learning styles of individual
students. In this connection, note also that ninety-eight
percent of the students achieved eighty percent or more of
the core objectives and nearly all of them achieved sufficient
enrichment objectives to raise their grades one or more levels.
Further, student and instructor acceptance of the course each
semester it has been presented has been virtually unanimous
and without reservation.
-123-
EDUCATIONAL TEVIINOLOOV CENTRE

A course which can guarantee learning while earning
the acceptance of students and instructors alike is of con-
siderable importance. This course has the additional features,
however, of (a) requiring one-third as many instructors as
previously and (b) requiring one-third as much classroom usage
as previously. Reductions in learning time, number of instruc-
tors required, and classroom usage can be translated into sub-
stantial cost savings.
Further, the entire course is replicable, and not
dependent on non-transportable, high cost media, and its
modular design and structuring options permit a user to
tailor the course to his own circumstances. If necessary, the
course could be presented in a completely self-instructional
mode using only low-cost, battery-operated media that a child
could carry. Thus, this validated course could be sent to
places that have no economics instructors and no educational
facilities.' These characteristics of the course can also be
translated into substantial cost savings compared to con-
ventional educational practices.
1In cases where there are qualified economicsinstructors available, the course should not be structured ascompletely self-instructional, but should use an instructorto conduct seminars, to work with students individually onspecial projects, to do counseling, and to perform a number ofother valueae Junctions.
-124-
EDUCATIOXM. TWilicOLOGY CENTHR

In view of the results, it must be concluded that the
process by which the course was developed merits careful
consideration by other course developers.
Usefulness of the Model
The model resulting from the Mal Project provides
a number of benefits to the educational community, but the
model is not without its limitations. Some of the advantages
of the model will be discussed first, followed by a discussion
of certain apparent limitations.
Advantages of the Model
An important characteristic of the model is that it
is not theoretical but empirically-derived. This gives the
model much more authority than theoretical models, regardless
of the elaborateness of their rationales.
Another important aspect of the model is that its
starting point was the "state of th; art" of educational
technology. The project was planned using the leading or
most promising theoretical approaches to various aspects of
-125-
EDUCAT/ONA TWIWOLOGY CTINTICH

curriculum development and, in significant part, translated
that theory to technology? Thus, the model that was produced
represents an advancement in educational technology.
A third advantage of the model is that it provides
.information about techniques which were successful indivi-i
'dually and collectively. Some techniques may be successful
in isolation but unsuccessful when used in conjunction with
certain other techniques, rationales, or approaches. In the
model that was produced, such aspects are integrated, and
there is no question of compatibility.
A fourth advantage is that, in effect, the model
suggests what not to do. The development model, as reported
here, includes descriptions of approaches that did not work.
While one should not conclude that an approach which failed
in the MMCD Project will fail whenever and wherever it is
tried in the future, it probably has a greater likelihood of
failing than the approach found to be successful in the MMCD
Project.
2What is a "leading" theory or a "most promising"approach is a matter of judgement. The Educational TechnologyCenter judged that it used the leading or most promisingtheoretical approaches, based on a knowledge of the researchin the field of educational technology, including the resultsof projects funded by the Office of Education's Bureau ofResearch.
-126-
EMICATLONAL vstcHNobcmy inorrictt

Fifth, there is much flexibility "built into" the
model. For example, it is possible for each of the three
phases to be successfully conducted by an entirely, different
staff. And, indeed, this may 1)e very important because
different skill mixes are needed by project personnel in the
major phases. Accordingly, one organization could produce
the specifications for a new course (phase I), another
organization could develop the instructional materials (phase
II), a third organization could conduct the validation tryout
(part 1 of phase III), and any number of organizations could
then evaluate the course at their own institutions (part 2
of phase III).
A sixth point in favor of the model concerns the
philosophy that underlies it--namely, the systems thinking.
Systems thinking is an attitude, just as optimizing among
alternatives is primarily an attitude. This kind of thinking
can be applied by anyone concerned with planning and imple-
menting education and training programs. The somewhat sophis-
ticated modern management techniques that are part of the
systems approach require special training or experience before
one can hope to apply them successfully.
Finally, the development model is useful as a starting
point for others, as a framework for further improving the
model..
-127-
EDUCATIONAL TECIINOLOGY CENTER

Limitations
The development model that emerged is by no means a
panacea. While an important improvement over approaches that
have preceded it, it is nonetheless capable of being signi-
ficantly improved itself. Some of the more apparent'limita-
tins of the model are described below.
First, it is clear that the model requires highly
skilled professionalsbehavioral sef-entists, test and measure-
ment specialists, media specialists, systems engineers, 'etc.--
who are always in short supply. Also, it .may well be the case
that skill in using the model is as important as prior quali-
fications, perhaps including knowledge about the model. Zs a
result, it would seem that training programs to teach the
pertinent knowledges and skills required to use the model might
be necessary before any extensive use of the model could result.
Second, the management of the curriculum development
process was obviously an important element in the evolution of
the model and the success of the Multi-Media Economic Analysis
Course produced with it. The management approach used in the
MMCD Project is not uncommon in leading industrial organi-
zations. However, modern management techniques have by and
large not been applied in our state and local educational
systems. As a result, there are relatively few "modern
managers" available who know enough about education and
educational technology to conduct projects such as the
-128-
Knor:AritoNTAL TI CIIKOLOGV CHNTKR

MMCD Project. A serious question is raised of whether or not
such managerial expertise can be found in adequate supply in
the educaticnal community to manage major projects, that apply
a development model similar to the one reported here.
A third limitation is the amount of investment required
to use the development model. There is no "minimum" cost to
using it, but it seems clear that developing a course using
this model is going to cost more than developing a course in
the conventional fashion. It should be understood, however,
that only the initial costs may be higher. If the model is
used to produce a replicable course that guarantees learning
and this course is compared with a conventional lecture course,
the overall economic benefits of the replieable course that
guarantees learning may far surpass those of a good lecture
course. A replicable self-instructional course that guarantees
learning could be used throughout the country. There is no way
to replicate a live lecturer--he can only be in one place at a
time.
The fourth limitation is that the model needs to be
exercised under many different conditions, as a way of both further
testing the model and strengthening it on the basis of empirical
data.
-i29-
ISDUCATIONAL TECHNOLOGY OFINTitit

Recommendations
Empirically-derived curriculum development techniques
were in existence prior to the derivation of the 'curriculum
!development model reported here. Mcwever, a search of the
!literature yields valuable case histories, but no development
model per se. Accordingly, the model reported here appears to
have unique value because other empirically-derived models
cannot be found. This reason alone recommends that the
elements of the model, including techniques that worked and
techniques that did not work, be considered by the person
contemplating a curriculum development project.
In view of the success of the Multi-Media Economic
Analysis Course produced using the model, it is reasonable to
recommend that the model be used in further curriculum
development activities. This could have several advantages.
First, it could produce courses that guarantee learning,
which is a characteristic that few courses have. And such
courses could be acceptable to the students, teachers, and
administrators involved with them. In addition, further use of
-130-
EHUCATIONAL TECHNOLOGY CENTER

the model could help to "test" the model in more variedsituations. This would include different subject Metter,
different student populations, different resources and con-straints, etc. The model itself could be revised based on suchtryouts, so that it continues to be improved for futureapplication.
The model also could benefit from continuously incor-porating and translating to practice the results of newresearch on learning. For example, the ability to more
effectively individualize instruction can be enhanced throughfurther research on learning styles. Further research oncreativity or in the broad area of the affective domain couldalso benefit the model and thereby help to produce bettercurricula.
If the model were improved through contributions from
applications of the model in diverse situations and from
learning research, its utility would be similarly improved.
Presumably, it would provide, as a guide, many alternative
strategies at the key decision points, plus the criteria to
help the curriculum planner select the alternative that is
most appropriate to the requirements of his situation. This
could immensely strengthen the model as a decision-making aid.
-131-1:131.1eATIONAL TOCII:40160fl1 CM:NTH:It

However, with improvements, the model would become much
more complex than it currently is. It is therefore recommended
that the model be converted to the form of a computerrbased
simulation. This would permit curriculum planners to "test"
the probable effects of alternative decisions regarding their
planned curricula. Having the development model in the form
of a computer-based simulation would facilitate the use of the
model (since the computer can simultaneously manipulate many
variables) but also quickly facilitate modifying the model to
incorporate new information.
-132-
unuctivrroxm. TECRNOLOOT CENTER

!
APPENDIX A
Description of Components of the Course

COURSE MATERIALS
MULTI-MEDIA ECONWIC ANALYSIS COURSE
The Multi-Media Economic Analysis Course developed bythe Educational Technology Center of Sterling Instituteconsists of the following material:
o Seven (7) volumes of self-instructional texts
o Three (3) self-instructional audio-workbook packages
Eleven (11) computer-based simulation models.
o Nine (9) 16mm films
o Criterion-referenced pretests and post-tests foruse with the above instructional material
o' Instructor's Guide, Course Administrator's Guide,Student Handbooks
Self-Instructional Texts
The contents of the seven volumes of self-instructionaltexts are listed below. The approximate student study timerequired to master the material in each volume (i.e., tosuccessfully pass the associated criterion tests) is also
,given. Note that the last of the seven volumes is called"Enrichment."
Approx,. StudyVolume Time (hours) Content
8-11 Nature and Methods of EconomicsProduction PossibilitiesDemand, Supply, EquilibriumThe Circular Flow
II 10-16 The National Income AccountsThe Theory of Income Determination: Part IThe Theory of Income Determination: Part IIThe Role of Fiscal Policy in Income
Determination
III 8-11 The Role of Money & Banking in the Economy: :The Role of Money & Banking in the Economy:The Role of Money & Banking in the Economy:I:
IV 7-12 The Theory of Demand (Value)Costs of Production & Supply: The Short Run .
'Costs of Production & Supply: The Long RunIndustry Equilibrium in a PerfectlyCompetitive Market

Approx. StudyVolume Time (hours) Content
V *9-13 Monopoly MarketsMonopolistic CompetitionOligopoly MarketsThe Theory of Factor Demand and Supply_
VI 8-12 Specialization and TradeInternational Trade
Enrichment 7-9 A Spectrum of Economic Systemsr The Influence of Government and Foreign
Trade on National Income,
. The Product and Monetary Markets
Self-Instructional Audio-Workbook Packages
The Self-Instructional Audio-Workbook Packages serve as analternate media-mix for parts of the first three volumes of Self-Instructional Texts. Each package contains both a workbook andone or more cassette-type audio tapes. The contents of thepackages, and the approximate student study time, are:
Audio- Approx. StudyWorkbook Time (hours) Content
A
B
C
11/2 Demand, Supply, Equilibrium
21/2 The Theory of Income Determination: I
3 The Role of Money & Banking in theEconomy: III
Computer-Based Simulation Models
Eleven economic simulation models were tailored for use ona commercial time-shared computer system. The eleven simulations,all in macro economics, are listed below. The simulations may beused by the individual student or by groups of students (e.g., ademonstration before a group). A minimum of 35 minutes is recom-mended for exercising a simulation model.
o The Investment Multipliero A Model With Induced Investmento Fiscal and Monetary Policyo Government Tax and Expenditure Policieso The Demand Model With a Money Marketo Demand Model With a Foreign Sectoro The Complete Demand Modelo Full Employment Outputo Capacity Output and the Production Functiono Effective Demand and Potential Supplyo Aggregate Demand and Potential Money Supply

Motion Pictures
Nine films were rented for u.Je during the course. Thesefilms were selected because of their compatibility with courseobjectives. It is planned that other audio-visual materialsmay be specially developed for use in the course, perhapssupplanting one or more of these films. Each film is about30 minutes in length. The titles of the films, all of whichwere from the Coleman series The American Economy, are:
o Introducing the Price Systemo Gross 'National Product & Its Cousins: Part Io Gross National Product & Its Cousins: Part IIo How Money Expands and Contractso Banks for Bankers: The Federal Reserve Systemo Money and the "Fed": Part Io The Case of One Firmo The Case of Few Firms: Part Io The Case of Few. Firms: Part II
Criterion-Referenced Tests
Criterion-referenced pretests and post-tests are providedfor all of the material mentioned above.
. .
Instructor's Guide, Course Administrator's Guide, Student Handbook
These guides and handbook describe how the course is operatedand what options exist for the student, the instructor, and thecourse administrator. These materials tell how the course may beoperated in the fully self-paced mode.
Use Options
The course may be operated with only Self-Instructional texts.The "minimum" course shcuid include Vol. I (Basic Concepts) andVol. II (acro Economics) orVol. I and Vol. III (Micro Economics).Volumes I through VI, plus the Enrichment volume, constitute avery substantial course for one semester (and, in terms of weight,about 10-12 pounds of text). The Self-Instructional Audio Packagesare, as mentioned earlier, alternate media to some of the self-instructional material appearing in Volumes I through III.
If one adds the simulations, the 16mm films (or their sub-.
stitutes), and includes the recommended seminars and group discus-sions, the demands on the student's time similarly increase. Thesimulations, however, may challenge the most advanced student inthe course. Films are becoming available that will show economicprocCsses while they are happening in real life, an importantaspect of communicating relevance. And the seminars representcritical opportunities to integrate and synthesize learning, togeneralize to other situations, and employ group dynamics tootherwise stimulate the students.

APPENDIX 13
Comments on Media Applications

Self-Instructional Printed Packages with StudentResponse Boards
These packages combine large-step, linearprogramming and adjunctive programming. Specially-developedmodels served as guidelines for applying this hybrid program-ming style in developing materials for particular objectives.
Gret care was given to taking the studentfrom the knolm to the unknown, in providing him withample examples and illustrations, and in giving himsufficient practice of the desired performance.Learning-imbedded tests are used "in the learning" andat the end of each package there is a diagnostic self-test.
The Self-Instructional Printed Packages areused with a portable student response board, whichcan be used in the dormitory room, the library, theclassroomwherever the student studies best. Nearlyall test items included in a package; including thelearning-imbedded items and the diagnostic self-testitems, are programmed for the board. The studentresponds to multiple choice items by selecting anddepressing one of four response keys. If ha selectsthe correct answer, the indicator advances to thenext test item number. This "advance" informs thestudent that his answer was correct. If he selectsa wrong answer, the key remains depressed and theindicator does not advance. The indicator does notadvance until the correct answer is selected. Inthis way, the studentsis always given immediatefeedback on his response, whether incorrect or correct.
The response board has 15 different answerpattern settings, including a special setting for"control" tests - -that is, tests used for gradingpurposes. On the control test setting, the unitadvances each time a key is pressed and the studentgets no feedback during the test. An importantfeature of the student response board is that a com-puter processable punched card can be produced eachtime a test is taken. Such records are useful forvalidating learning materials as well as recordinga student's relative progress.
In summary, the Self-Instructional PrintedPackage with Student,Response Board was selected asthe primary instructional medium in the course becauseits characteristics best matched the micro and macro-media selectioa criteria.
POOR ORIGINAL COPY - BEST
AVAILABLE AT TIME FRAM

Self-Instructional Audio Packages
A Self-Instructional Audio Package consistsof cassette audio tape, a workbook, and a portable taperecorder. The student response board is used for thepractice problems and self-tests. These packagesemploy the same hybrid programming style as the Self-Instructional Printed Packages, but with certain addedfeatures. .These packages were programmed followingaudio-practice-audio-practice cycles. The idea was todeliver the audio in a crisp fashion, using a "largestep si.ze," unimpeded audio flow. No audio is given.during intervening practice and problem-solving periods.
The Self-Instructional Audio Packages wereselected for learning situations requiring explana-tions of complex graphs, where the audio can be usedto draw attention to and explain elements and re-lationships portrayed by such graphs. It was alsoassumed that some students would prefer audio-orientedinstruction or be able to learn from it easier thanfrom visually-oriented instruction.
Computer Simulations
An Economics Simulation Model consists of acomputer program which the student can exercise at acomputer terminal, a workbook which contains information about the model, and a cassette audio tape whichexplains in detail its workings and its relationshipto other parts of the course. There are approximatelytwelve such models..
The rationale for using simulation was toprovide for cognitive structures that transcend,integrate, unify, and reinforce the learning of groupsof related instructional topics and course segments:They are easily able to provide highly complex problem-solving activities dealing with variables from manydifferent parts of the course.
16mm Film
'These black and white films are approximatelyone-half.hour in length each and were selected fromColeman's "The American Economy" series. While motionpictures represent an extremely high-cost medium iforiginal films are produced, the opportunity to rentor purchase applicable films renders this mediumfeasible for possible use on a relatively extensivebasis. Films were selected that generally teach thesame student performance called for in some segmentsof thecourse. The films represent a different pro-gramming approach.

Seminars
There are simulation seminars, remedial semi-nars, and general or enrichment seminars. The role ofthe instructor is to serve as a seminar leader. Aseminar may involve from 2 or 3 students to 15 or 20
i students. .Seminars were selected for a number ofreasons, such as to provide a means for sharinginsights and experiences, to enhance group identifi-cation, and therefore to increase or maintain studentinterest and motivation.
Counseling
Counseling is done by the instructor, usually(aot always) in a one-to-one stlAent-instructorrelationship, and preferably with some degree of pri-vacy. Counseling sessions are viewed as criticalopportunities for the instructor to motivate studentsand to relate activities to their interests and goals.Counseling was selected as the only currently avail-able means of diagnosing the more difficult learningproblems and determining the enrichment learning needsof the very advanced student.
Lecture-Discussion
In the lecture-discussion situation, theinstructor first presents information, using audio-visual aids as appropriate. A brief group discussionfollows each key point presented. The lecture-discussion was selected primarily as a means ofenabling the instructor to stimulate, motivate, orotherwise cause enthusiasm over the course. A secon-dary reason for selection was to inform students ofwhat is to be expected in the course.
Tutor
In tutoring, the instructor, or an advancedstudent selected by the instructor, meets individuallywith a student having learning difficulties. Theindividual tutoring is aimed at well defined troublespots uncovered by tests. This is a very costlymedium selected only for use in last-resort remedialsituations, after a student has unsuccessfully usedother remedial media.
POOR ORIGINAL COPY-BEST
AVAILABLE AT TIME PH MED

Related Texts
The two best known introductory economicstexts are used as "related texts." The instructoris free to designate other materials as similarly"related." Related texts were selected as readilyavailable media for remedial purposes or enrichmentpurposes, depending on the specific learning pre-scription.
Comnuter-Based Test Analysis...
All pretests and post tests for core andremedial segments are automatically recorded oncomputer-processable punched cards, as a result ofthe use of the student response-feedback boards.These cards are pre-punched with each student'sidentification number.
This approach was selected as an efficientmeans of obtaining student performance data that canbe manipulated by a computer for analytical and record-keeping purposes. It allows the student to take atest at virtually any time, without an instructorbeing present. It also avoids problems of (1) tyingup expensive equipment during student "think" times,(2) creating Student cueuec at computer terminals,and (3) ceneral problems of logistics so often en-countered in testing.
POOR ORLSINAL COPY -3E:::',AVAILABLE AT TIME FILMED

APPENDIX C
Sample of Items from Kit for Materials Preparers

The sample includes the following:
#1. Materials Preparation Course Outline
This is the outline of the course givento the materials developers.
#2. Final Check List: Economics Course Materials
The economist-writer used this checklist tomake sure he.had followed the guidelines givento him.
#3. Guidelines for Economist-riters
These were general guidelines for use in developingthe S -i packages. Note that the type of learningfor each objective is indicated in this document.
#4. Notes to Economists
These are examples of the types of notes economist-writers received as an aid to them in developingmaterials. Many of these notes call for thedevelopment of subordinate behaviors for a be-havioral objective.
#S. Example of Detailed Behavioral Objectives, Testitems, and Hierarchy Charts in the Form They AreGiven to Materials Developers.
. ..
This example concerns the topic "Specialization,"which consists of two segments (segments-# 6 and # 7).An attempt was always made to assign all of thesegments in a given topic to the same materialsdeveloper.

MATERIALS PREPARATION
Course Outline
I Inroduction
A. Purpose of Course
To prepare you to prepare learner-centeredinstructional materials in accordance witha format specified for this project.
B. Scope of Course
1. The nature, scope, objectives and statusof the project.
2. The technical concept of individualizedinstruction.
3. Operational concept for individualizedinstruction.
4. The model learning package; the designof the model learning package; the rationale.
S. Given "inputs," prepare "outputs," reviewand analyze.
II The Nature, Scope, Objectives & Status of the Project
A. ESOE/NA - Multi Media Course Development
2. Model Development (OE)2. Fixed Price/Schedule3. Product Econ. Course (NA)4. Behaviorally Oriented - Briggs/Gagpe modelS. Status
a) completed (show materials and hieraichy)b) yet to do
- Phase IIPhase III
III Technical Concept
A. Behavioral HierarchyB. Individualized instructionC. Validated MaterialsB. Gagne's ModelE. Pitfalls and Misconceptions
POOR ORIGINAL COPY -BEST
AVAILAM.EAT TIME nuao

IV Operational Concept
A. Remedial, Core, EnrichmentB. DymediaC. Multi-media
V Format for Materials
A. Cover Page. Responsibility: Sterling/Tripp. Contents: See Illustration A
B. Table of Contents. Responsibility: Sterling/Tripp. Contents: See Illustration B
C. General Instructions. Responsibility: Sterling/Tripp. Contents: Prerequisite Segments
Dymedia SettingsPackage/Topic informationUse of Segment/Dymedia, etc.
(boilerplate mechanics)
D. Introduction to TopicResponsibility: Economists
. Contents: Brief Narrative (2-3 double spacedpages) stating in very direct terms
(1) the overall terminal objective of the topic(2) the significance of this topic; why it is
important, how it relates to other topics, etc.(3) how the topic presentation is organized, what
the student will learn first (Segment x),what he will learn next (Segment x +1), etc.
(4) pitfalls and/or difficulties (false friends!)which the student can expect to encounter.
Note: The purpose of this topic introductory'statement is to(1) motivate the learner(2) provide the learner with an "organizational
framework" and/or a perspective for learning.Tell him what he is expected to learn and why;alert him to problems of semantics, etc.
E. Segment Cover Page. Responsibility: Sterling/Tripp. Contents: See Illustration C

1
F. Introductory Statement. Responsibility: Economist,Contents: A brief introductory statement to the
segment -- same as topic introductionbut at the Segment level. Remember that thestudent may have read the topic introductionon a different day or study session; the seg-ment introduction may therefore repeat some ofthe idea in the topic introduction.
G. Objectives and Instructional Events. Responsibility: Economist
First Objective (bottom of hierarchy)(1) Question format(2) Narrative
. recallexplain terms, etc.
. present facts
. give examples/illustrations(3) Practice Problems(4) References to texts
Note:(1) "Recall
a. only what has been previously learned(reference the segment or objective)
b. may use "economics terms" which havebeen previously learned; distinguishfrom previous usages
c. all sub-concepts should be "recalled."
(2) "Explain terms"a. no economic terms -- build bridge from
everyday English to economic concept;no "economese."
b. explain what things are, what they arenot; what they include and what theyexclude; give definition or descriptionor illustration of all key phrases in"performance" part of objective.
(3) "Present facts" - or answer to questionin clear simple English
(4) "Examples and illustrations"a. give "for instances," work through
typical problems explaining stepsb. induce transfer by giving several examples
from different perspectivec. examples should be clear, concise and
relevantd. Interrelate with previous material.

(5) "Practice" .
a. Give 3-5 practice problems and/orquestions; "force" Atudent involve-ment and participation
b. Induce transfer by giving problems withdifferent backgrounds, etc.
c. Immediate knowledge of results throughDymedia; number sequentially throughoutsegment.
d. Motivate and interest students (thebehavioral objective simply states theactivity on the part of the Zearner whichwill be accepted as evidence of hishaving achieved the desired learning;it is the instructional events, and inparticular the "practice," which mustensure that the student really under-stands what he is doing when he makesthe required response.)
.
(6) "Reference to texts"Give references to standard text bookdiscussions of the. subject; at least toMcConnell, Samuelson.
H. Self Test and Prescription. Responsibility: Sterling/Furey - Economists. Contents: Segment tests to be provided;
economists review for content validityand recommend changes.
. Prescriptions: economists recommend "remedial study"for test items (or groups of test items)missed.
I. Topical Hierarchy. Responsibility: Sterling/Tripp
. Topic Summary. Responsibility: Economist. .Contents: one or two page narrative review of all
segments and objectives in the topic;overview; weave the pieces back together.
VT Inputs to Economists.
A. Course Segmentation Syllabus and behavioral objectivesfor other segments (as required). The economist isresponsible for ensuring that prerequisite materialhas either been covered in previous segments or ispresented in the'segment which he is preparing.
-q

B. Segment Topic Introductions
Preliminary versions will be provided; Economistshould read the introduction of all related segments,resolve outstanding questions he may have, and re-vise the introduction to the topics and/or segmentswhich he is preparing, as appropriate.
D.' Behavioral Objectives and hierarchy -
Review, any change must have prior OK of Fitzpatrick;use "change prooaftre."
E. Criterion Test Items
1. For reference only (i.e., not to be used forpractice or example problems)
2. Economist should review for content validityand revise as necessary; revisions of testitems require approval of M. Furey. -- submitwith recommended changes.
F. Segment Test
Preliminary test is provided; economist shouldreview for content validity, etc.; changes requireapproval of M. Furey -- submit with recommended changes.
VII Concept Summary
A. Input
1. Preliminaty introductions2. Notes to Economists3. Prelim. segment test4. B.O.ss and Hierarchy5. Criterion test items
Auxilliary6. Segmentation syllabus7. Model of output8. Other segment BO's as requested
POOR ORIGIN.:.LCOPY' 6EST
.AVAILABLE AT ; 1:i ""

1.
B. Output (deliverable item)
1. Final version of introductions2. Recommended changes in BO's and/or hierarchies3. Recommended changes to criterion
test items4. Instructional events for each objectiveS. Topic summary6. Discussion references and prescriptions
VIII Operating Procedure
A. Assign topic to economistB. Review intros, objectives and hierarchyC. Write Topic IntroD. Write Segment Intros
F. Recommend BO changes
G. Write Instructional EventsH. Review test items and recommend:
1. Segment tests and Prescription2. Criterion items review
I. Write SummariesJ. Review and format total packageK. Final review by in-house economists
XI 'Discussion of milestones, etc., importance of meetingcommitments:
XII Role and Responsibilities of Personnel
A. FitzpatrickB. FureyC. Tripp
XIII Miscellaneous
A. Creativity. Ideas. In the Example/Practice
B. No RoyaltiesPublic Domain
C. Copyright Problem

Illustration A
INTRODUCTION TO SPECIALIZATION
Learning Segments 6/7
Introduction to Economic Analysis
Prepared for the
United States Naval Academy
bySterling Institute of
Washington, D.C.

Illustration B
SPECIALIZATION
Contents
Page
Cover Page i
Table of Contents ii
eneral Instructions iii
Introduction to Topic 1.0
Segment X Cover Page
Introductory Statement 2.0
Objectives and Instructional Events 2._
0515 Description of Absolute Advantage0503 Identify Producer with Absolute Advantage0508 Description of Comparative Advantage
. 0520 Basis of Comparative Advantage0506 Identify Producer with Comparative Advantage0500 Identify Types of Advantagez and Basis for
advantages in various situations
Self Test-and Prescriptions
Segment Y Cover Page
Introductory Statement
2.*
3.0
Objectives and Instructional Events 3.
0510 Definition of Opportunity Cost0505 Basis for Specialization and Trade0519 Analyze Producers to determine basis for trade0521 Results of Specialization under conditions of
comparative advantage0517 Rationale for trade under conditions of
absolute advantage. 0507 Benefits of Specialization0509 Drawbacks of Specialization0501 Rationale for Specialization
Self Test and Prescription
Topic Hierarchy Chart ,
3.
4.
Topic Summary S.

Illustration C
SEGMENT 6
INTRODUCTION TO-SPECIALIZATION
(Part 1 of 2)
Dymedia Settings:
Learning - E
Self Test - L

FINAL CHECK LIST
Economics Course Materials
Introduction to Topic
4,..m.MMA A general statement of topic?
Relation to other topics?
that student will be able to do when he completes topic?
Sequence and/or organization of materials. to be presented?
Possible difficulties?
Introduction to Each Segment
Transition from topic introduction?
Segment Objectives in General
Every objective directly addressed?
Individual Objectives
Prerequisite concepts recalled and restated, ifcovered earlier?
goMlImmlIl
Prerequisite concepts explained in everyday terms,if not covered earlier?
No new technical terms used without explanation?
Examples in sufficient quantity (usually two or more)and diverse enough to stimulate generalization?
Practice problems in sufficient quantity (usuallythree or more) and drawn from diverse backgrounds?
Practice problems numbered sequentially throughoutthe segment, with first problem in each segmentnumbered "1 "?
Answer choices in practice problems so lettered as tofit Dymedia Answer pattern?
References to Samuelson and/or McConnell for each objective?..411.1
All test items reviewed and approved or changed?
Topic Summary
Checked against topic introduction?

Guidelines for Economist Writers
A. Genera) Instructions
1. Materials should be written in a clear, narrative style,in complete sentences in good English.
2. Writers should avoid the use of "economic jargon" whichcould confuse students in introductory economics courses.The materials, wit: only a few editorial revisions, willbe given- to the students just as the writers have preparedthem; therefore, it is imperative that the content iscorrect and readily understandable.
Handwritten manuscripts are acceptable, providing thewriting is iegible and on only every other line. Type-written manuscripts should be double spaced.
4. Writers must include of the objectives provided themin the mWETFrarg7--if-the writer is convinced that addi-tional information must be included in order to clarifyor enhance the prescribed objectives, then he shouldinclude such information. Additions are desirable andexpected as has been indicated in the "Notes to Econo-mists." Should the writer decide that a change in thewording of an ob::ective is imperative and that the newlanguage is not equivalent to that in the original version,then he should contact !r. Fitzpatrick (338-8800, Ext. 37)concerning the proposed change prior to incorporating itin the materials.
5. Test items A, B, C must not be used as illustrations andpractice problems as they Tave already been used in segmentand unit tests, pretests and post tests.
After the materials have been written, please indicateby writing "yes" or "nb" on each A, B, or C test itemwhether the item. tests the objective to which it is keyed.If the writer feels that a distractor is incorrect or thatthe item can be improved in any way, he should write allsuggestiohs, including new distractors, etc., below theitem.
6. In writing about eighty percent of the materials, writersshould follow steps 1 through 12 below. The other twentypercent will require a deviation in the steps as indicatedin steps 13 through 17 or in steps 18 through 21. Objec-tives requiring a change will be indicated in the segmentkit.
Special attention should be given to providing a richsupply of examples.(real-world, relevant) illustrative of
POOR ORIGINAL COPY-PrfAVAII 'ME
AT TIME r

the Principles or concepts to which the objectives of agiven topic are addressed. If copyright material is used,then permission should be obtained and the appropriatereferences given.
7. Be sure to complete the check list and return it with themanuscript and the original contents of the kit to SterlingInstitute.
B. Step: ,in the Preparation of Materials
1. Check the kit you receive to see that it contains:
a: Cover pageb. Table of contentsc. General instructionsd. Preliminary introduction to the topic and/or to the
segmente. Hierarchy chart for each segment in the topicf. Three test items (A, II, C) for each objective in each
segmentg. Segment test for each segmenth. Notes to Economistsi. A list of objectives requiring Sample B or C
2. Read the preliminary introduction, all objectives and testitems for the topic. This will provide a general overviewof the learnings the student must master and the type ofquestion he will be expected to answer when tested.
3. Read the "Notes to Economists." These notes are not allinclusive but point out lcarnings which should be reviewedor reeallad, or additional information which should beincluded to facilitate the learning of the objective. Itis recommended that the writer star or in some way markeach objective for whist) there is a note, as a reminder toconsider these suggestions 'when writing.
4. Begin the narrative with an introductory stateMbnt of afew sentences which relate the segment to the topic andlead in to the first objective (See Sample A, p. ). Thewriter may prefer to write an introduction to the topicprior to writing the introduction to the segment; however,it seems preferable to write the topic introduction afterthe materials have been completed to avoid the necessityof revisions.
5. Introduce the first objective (abbreviated Litle). Thismay be in the form of a question or of a title. Placethe number of the objectives to the left of whatever meansis used. (See Sample A, p. .)
TovbfAILABLEAT TIME.

6. Continue narrative. If it has been indicated that theobjective should be handled according to' ,Sample 13, thenfollow steps 13 through 17. If Sample C has been indi-cated, follow steps /,'through,f; . Otherwise, continueby recalling information previously learned or by ex-plaining new terms. The "Notes to Economists" shouldbe of assistance at this point. (See Sample A, p. .)
7. Present at least two examples or illustrations to clarifythe principle to be learned. In some instances, Wherethe objective is complex, as many as four, five or sixexamples may be necessary to illustrate all points. Theexamples should be relevant and interesting to collegestudents. If the writer has any unique devices or methodswhich he has found effective in teaching a particularobjective, he should feel free to include these.
8. State the definition, principle, etc.,'at an appropriatepoint, and enclose the statement in abox. Be sure thatthe language used is the same as or equivalent to thatused in the objective. (See Sample A, p. .)
9. Present two or more problems which require the applicationof the principle. The number of problems will vary withthe complexity of the principle, a Complex principle re-quiring a wide variety of applications.
10. .Provide answers in the narrative to those problems whichrequire the student to fill in blanks or place a check infront of an answer. Answers should immediately follow theproblem. (See Sample A, p. .)
Other problems should be keyed to a Dymedia setting.(See Sample A, p. .)
11. Provide a reference fOr additional information. (SeeSample A, p. .)
12. Continue narrative with a lead in to the next objective.If the objective should be handled according to Sample B,follow steps 13 through 17; if according to Sample C, followsteps 18 through 21. If no particular plan is recommended,repeat steps 5 through 12 until all the objectives havebeen accounted for.
13. Begin the narrative with examples of the concept to belearned. Then, link the examples to the concept. (SeeSample B. p. .)
14. Underline or enclose in a box the concept to be learned.

15. Provide at least two problems or items which appraiae thestudent's knowledge of the concept.
16. Supply answers to the above-mentioned items immediatelyfollowing them (preferably buried in the narrative).
17.. Indicate a reference to which the student may go for addi-tional information.
18. Give at least four (number will depend on the complexityof the subject) examples some of which do and some of whichdo not belong to the classification.
19. Indicate in the narrative which examples correctly or incor-rectly illustrate the concept and why.
20. Provide additional practice (at least 6 to 10 items) indiscriminating among appropriate and inappropriate examplesof the concept. Again, the number of examples will dependon the complexity of the concept.
21. Provide a reference to additional information which mayhelp the student who experiences difficulty.
22. Following the last objective in the segment, instruct thestudent to take the self-test and to follow the prescription for any re-learning which may be necessary. (SeeSample A, p. .)
23. Review the objectives, test items, hierarchy chart, Notesto Economists, etc., for the next segment.
24. Write a short introduction to the segment, relating it tothe previous segment and to the topic. (See Sample A, p. .)
25. Continue in the manner-outlined in steps 5 through 22 above.
26. When the last segment has been completed, write a generalintroduction to the topic including an overview of theterminal behaviors, the significance of the material, therelationship of this topic to other parts of the course,and mention of any difficulties which might be encounteredin learning the objectives. (See Sample A, p. .)
27. Write a brief summary of the topic, including the mainpoints of all the segments.
28. Complete the check list and return it, the kit, and yourmanuscript Lo ETC.

The narrative in Samples B and C differs from that used inSample A in that the former begins with examples or illustrationsof what is to be learned, whereas the latter asks the student torecall knowledge previously learned but pertinent to the newlearning. In Sample M the student is learning three concepts;in Sample C he is making multiple discriminations among examplesof a concept.
iobj #E3896
Sample i3
What are the three types of related goods?
There are many ways in which goods are related; e.g., ham,bacon, and pork are related because all originally were part ofa pig. In economics, there are different types of relationships.Eggs, cereal and waffles are three foods consumed by' many peoplefor breakfast. If the price of eggs increased, the demand forcereal and waffles would probably increase as these commoditieswere substituted for eggs for breakfast. T.here is an economicrelationship among eggs, cereal and waffles. One can be a sub-stitute for the other, so all three are known as substitute gods .
Let's consider the commodities, autos, tires and gasoline.Tires and gasoline cannot ba substituted for autos, but all threecommodities are related, economically speaking, for they complementeach other. Hence, these goods arc known as complementary cjoods.
The products, milk, bricks, and roses are not related econom-ically; hence, they are called indeoendent goods .
In economics, the three types of related goods are substitutegoods, complementary goods, and independent (unrelated) goods.
Can you name:the three types of related goods? Fill in theblanks in the following sentence with the names of the types ofrelated goods. pon't look back.
In economics, the three types of related goods aregoods, goods, and (or unrelated) goods.
Check your answers with those given in the box above.
If you need further instruction in this work, read McConnell,p. 65.

lObj. :0295
Sample CPOOR ORIGINAL COPY-BEST
.T 81,4er)
Identify examples_ogEroblems for micro-economicsanalysis
You have learned the definition of micro-economics. Can youidentify specific problems which would be categorized under micro-economics? Read the following economic problems.
la. A wildcat strike at the U.S. Steel Company plant inPittsburgh
b. The President's annual economic report to Congress
Is the, first example a problem for micro-economics analysis? Ifyou think that it is, you are right because the U.S. Steel Companyis an individual firm, and micro economics analysis is concernedwith problems related to individual firms. Exanible "b" is concernedwith the nation as a whole and would not be a problem for micro-economics analysis.
Look at some other examples. Check each problem for whichmicro-economics would be appropriate. As you make your decision,justify it (to your
c. The U.S. Chamber of Commerce suggesting ways tostimulate employment
d. A homeowner negotiating a loan agreement with his localbank
Did you check only "d"? The example giyen in "c" is concerned withthe nation's unemployment, not that of an individual firm; whereas,"d" is concerned with an individual.
Try to identify a few more examples of problems for micro-economics analysis. Set your. Dymedia at setting H. Be sure toinsert a new response card. Start with line 1 to correspond withproblem 1.
Label each of the following which is a problem suitable formicro-economics analysis "b" and each which is not suitable "a."
1. Mr. Irving R. Good was elected president of the ChicagoBoard of Trade.
2. The General Electric Plant in Daytona Beach laid of2000 workers, causing a grave employment problem.
3. The cost of living index in the U.S. rose one per cent inSeptember.
4. The Howard Johnson Corporation wants to expand its motelbusiness to include the Southwest.
5. Unemployment in the U.S. declined during July and August.6. The Columbia Broadcasting System purchased Rand McUally Co.
If you had any difficulty with the above, read r,cConnell,pp. 16-17.

Segment 19
1704 --1711 -1793 -
OBJECTIVIS ICE:DING SPECYAL--(Sample B or C)
Segment 32
Sample C NoneSample CSample C Segment 13
Segment 20,
None
Segment 21
None
Segment 22
1536 - Sample C1594 - Sample C
Segment 23
None
Segment 24
2038 - Sample B2041 - Sample B2042 - Sample C2044 - Sample B
Segment 25
. None
Segment 26
None
Segment 28
2126 - Sample C2151 - Sample B2196 - Sample B
Segment 29
None
Segment 30
None
Segment 31
None
None
Segment 34
None
Segment 35
None
Segment 36
- None
Segment 37
None
Segment 38
2570 - Sample B
Segment 40
2613 - Sample B
Segment 41
None
Segment 42
None
Segment 43
2747 - Sample B
Segment 44
2750 - Sample B
Segment 45
None
Segment 46
2760 - Sample B2763 - Sample B

Notes to Economists
S = Student
SEGMENT 19
Somewhere in this segment S must learn that incomeproduced is equal to income earned.
. Objectives
1740 Student may need to distinguish between"total value of production" learned in.objective 1349 and "total market value"of objective 1740.
S will need to learn meaning of terms:final, goods and services, and the lettersGNP.
S will need to learn that the market valueof a product is the same as its price.
1711 Possibly some examples of "illegal trans-actions" should be included.
1757 S will need to learn the term: intermediategoods.
1792 S will need an explanation of "present year."Is this fiscal or calendar? Does objectiverefer to "fin'al" goods and services"?
1703 Since S is asked to differentiate betweenexamples of "final" and "intermediate" goods,students should learn definitions of theseterms.
1716 The term "value added" should be related toproblem of "double counting" and to GNP.
1726 This method of obtaining GNP should berelated to method described in 1740. Fullexplanation of each method and their dif-ference p. required.

Notes to Economists
S s Student
MI
SEGMENT 20
Throughout this segment instructional materialsshould provide opportunities for S to learn the meaningof symbols such as Ig, In, etc.
Objectives
1631 Students may need an explanation of the term"economic welfare," and should relate thisto objectives 1698 and 1699 (Inflation andDeflation).
1695 Specific examples are needed, e.g., There. is a 10% increase in prices over a 12 month
period, and GNP is up 25 billion for thesame period. Is this a real change in GNP?

I
-Notes to Economists'
S = Student
SEGMENT 21
S must recall that income produced is equal to income,earned.
Objectives
1746 S will need an explanation of and examples ofthe term "capital improvement."
1797 S should learn the terms: depreciation,replacement investment, and capital stock.
1783 S should be informed that "capital consumption"is part of or related to "depreciation."
1715 S will need explanation of terms incorporatedand unincorporated businesses.
1753 Perhaps a definition is needed here and/oran explanation of how this is determined.
1788 S may need to know how this is determined.
1780 S should learn what is meant by the tern"net output (Value less depreciation)."

Objectives
Notes to Economists
S = Student
SEGMENT 22
1594 S will need to know or review formula;also needs' to learn the meaning of theterm "function" as in "savings function."
1536 Same comments as in 1594 but for "con-sumption function."
1522 S must learn formula 4 cd Y
1591 S must learn formula for this statement.

Nbtes to Economists
S = Student
SEGMENT 23
In this segment S should learn symbols MPS and-MPC and what they represent.

Notes to Economists
'S = Student
SEGMENT 24
Objectives
2037 S will need an explanation and examplesof the terms "real capital and capitalgoods."
i

Notes to Economists
S = Student
SEGMENT 25
Before learning the objectives for this segment,there should be a review of "opportunity costs."S should learn the meaning of the terms: level ofinvestment and profit.

Notes to Economists
S = Student
SEGMENT 26
Objectives
2008 S should learn Cr) » market interest rate.

Notes to Economists
S Student
0227 SEGMENT 28
I
Objectives
2123 Prior to learning this objective, S shouldreview meaning of : economic model,meaningful aggregates, consumption, andinvestment.

Notes to Economists
S = Student
.
SEGMENT 29
Objectives
. 2149 S should identify full employment levelof income on a graph in addition togiving verbal explanation of it.
2195 'S should reviewequilibrium' andpoint of market
2153 S should reviewaccount for theequilibrium.
the meaning of "marketbe able to identifyequilibrium on a graph.
the conditions whichexistence of market

Notes to Economists
S Student
SEGMENT 30
Objectives
2102 S must receive background informationconcerning "stock and flow" and how theyare related to the segment topics.
2125 S should review meaning of ex ante andex post.
2158 Before learning this objective S shouldreview the meaning of "leakages" and"injections" as they pertain to thecircular flow.
AN

SEGMENT 6
OBJECTIVES HIERARCHY
.
GL-7,70
"..
.
*
POOR ORIGINALCOPY- BESTAVAILABLE AT TIME . FILMEL
.
i
ft
.
r

ara..Mate:
Paso:
Revision U.
Revision Datann nONCe
1
051.5 Conditions: When asked to select from a list, the
correct description of what is meant by
"absolute advantage,"
41
.Performance: The student will be able to identify as
correct an answer equivalent to: "An
absolute advantage exists when, for the
same amount of physical inputs, a production
unit (nation, region, firm, etc.,) produces
a gieater output of a given commodity than
another production unit."
Criterion: Implicit.

TR .-
note:
Pace:
Revision *So. _ -------------------Revision Date -------------------
0515 A "Absolute advantage" exists when
a. For the same investment, a producer can accumulate
more factor or, resource inputs to increase production.
b. For the same amount of inputs, a nation can produce
more of a given output than another nation or region.
c. One producer still out-produces another, although
relatively deprived of a certain amount of factor
inputs. .
d. More of a product is produce4, regardless of the
amount of factor inputs.
.
ANSWER: b.
. .

rase:
Revision 'No.
Revision Date
0515B Which of the following best describes what is meant by
. absolute advantage?
I.
4
a. Two producers have different opportunity costs in
production.
b. Two producers have equal opportunity costs in
production.
c. Two producers have the same amount of physical1
inputs, but one produces more of the given output.
d. Absolute amounts of output are produded regardless
of resource inputs.
. ANSWER: C
.

oue;
Pasc:.
Revision No.
Revision r3te
0515C: Which of the following best completes this statement,
se " exists when given the
same amount of inputs, more output is produced by one
nation than by another for all products concerned.
a. Division of labor
b. Comparative advantage
c. Specialization
d. Absolute advantage
t
-..
ANSWER: d
.
t
:".

one:
Paso:
ROvision To,
. Revision Date
0515D Which of the following conditions most likely exists
when, given equal amounts of inputs, more of a product
is produced by one nation than by another?
t
a. Absolute advantage
b. Comparative advantage
c. Specialization
d.. a and c abovet
ANSWER: a .
04
Alm
'

'Date:
Paco;
Revision Vo.
Revision Date ........... .....
0503 Conditions: Given a table of hypothetical data about
two producers (countries, urban areas,
individuals) engaged in production of two
products wherein one producer has an
absolute advantage over the other in some,
or in all, proeucts,
Performance: The student will identify which producer.
has the absolute advantage.
Criterion: .

TR
Date:
Page:
Revision Vo..
Revision Date
0503 A Both Israel and Korea produce passenger car tires and
blankets. Study the following table carefully, and select
the alternative which best represents the pattern of
absolute advantage in the production of these goods by these
two nations.
(Note: Figures = 00 tires and blankets produced per fifty
man-hours.)
Nation Blankets Tires
Israel 30 80
Korea 40 30
a. Israel has an absolute' advantage in blankets as well
as passenger tires.
b. Korea has an absolute advantage in .both blankets and
passenger tires.
c. Korea has an absolute advantage in passenger tires,
while Israel has an ab-solute advantage in blankets.
d. Israel has an absolute advantage in passenger tires,
while Korea has an absolute advantage in blankets.
ANSWER: d.

0503 B Both Germany and Japan produce cameras and radios..
Study the following table carefully and select the
statement which best represents the pattern of
absolute advantage in the production of these
products by these two countries."0
(Note: Figures = 000 units/100 man-hours of production.)
ountry Cameras Radios
Germany
Lpan
75
56
65
70
a. Japah has an absolute advantage in both
cameras and radios.
b. Germany has an absolute advantage in cameras,
while Japan has an absolute advantage in
radios.
c. Japan has an absolute advantage in _cameras,.
while Germany has an absolute advantage.in
*- radios.
Neither Germany nor. Japan has an absolute
advantage in either cameras or radios.
ANSWER: b
POOR 01119INAt COPY BESTAVAMAKE AT TIME FILMED
O.

0503
commercial and military craft.
Both Boeing and Lockheed produce military and
commercial aircraft. Study tho table below and
select the statement which be; identifies the
pattern of absolute advantage in the production
of these aircraft by the two .:ompaaies.
(Note: Figures = the number of units produced/
hundred man-hours).
Firm I Military.
Commerciall
Lockheed
Boeing
36.
40 .
35
31
a. Neither Boeing nor Lockheed has an absolute
advantage in either type of aircraft.
b. Boeing has an absolute aavantage:in military
craft, while Lockheed has an absolute advantage
in commercial craft..
C. Lockheed has an absolUte advantage in military
crafts, while Boeing has an absolute advantage
in commercial craft.
d. Boeing has an absolute advantage in both
ANSWER: b POOR CIF9GINAL coPy. BEST
AVAIIABI.E AT TIME PI MEN

0503 D Both Bell Aerosystems, Inc. and Hughes Aircraft
'Corp. make fixed-wing and rotor-powered aircraft.
Study the following table carefully, and select
the statement given below, which best represents
the pattern of absolute advantage in the production
of these types of aircraft by the two companies..
(Note: figures represent the number of units
produced per month.)
Firm
ell
u hes
Fixed
300
500
_Rotor.
500
300 ,
a. ,Bell has an absolute advantage in fixed-
wing craft while Hughes%has an abselUte
advantage in rotor craft.
Both Bell and Hughes, hive an absolute advan-
tage in rotor craft. .a. Hughes has an absolute advantage in fixed-
wing craft while Bell has an absolute
advantage in rotor-powered craft.
Neither Bell nor Hughes has an absolute
advantage in either one of the two types
of craft.
ANSWER: C

rTR
Date:
Pace:
MovIslon Re.
ReVielou Date
0508 Conditions; Given several statements describing what
is meant by "comparative advantage,"i
. .
Performance: The student will select as. correct the
-statement equivalent to: "When two
productive units are producing the same two
products, and one productive unit produces
one of the products at a relatively lower
differential real cost than it produces the
other product, a condition of '.comparative
advantage-' is said to exist Eor the product
.which has the relatively lower differential
real cost even though an 'absolute advanta3
for this product may still exist for the oth .
producer."
Criterion: Implicit.
-- 7
POOR ORIGINAL COPY, BESTAVAILABLEAT TIME ruto

TR
Date:
Pace:
Revision Xo.
Revision Date
1 .
0508 A Which of the following correctly describes a condition
.
of comparative advantage?
a. Comparative advantage exists when aproduction unit
has absolute efficiency in the production of all goods
at all times.. .
b. Comparative advantage exists for the product with
lower real cost when one of two productive units, both
of which produce the same commodities, produces one
good at a relatively lower cost than it produces the
other, even though the other producer may have'an
absolute advantage for this good.
c. Comparative advantage. exists when a production unit
produces specified outputs at constant real:costs.0
d. Comparative advantage exists for that product foi.
.
which. one of twct productive units, both of which
are Producing the same products, has a smaller
absOlute advantage. .
ANSWER: b.
..

05088
TR .
Date;
Pose:
.
.
Rovision vo. ----------_ ---- . ----
Revision Date. --
Which of the following correctly describes a
condition of comparative advantage?
a. When one of two productive units, both of which
produce the same goods, produces one of the goods
at lower real costs than the other goods, a
comparative advntage exists for the product
with the lower cost, although the other producer
has an absolute advantage in that product.
b. When one of two production units has absolute
advantage in the production of all goods at all
times, a comparative advantage is said to exist.
c. When one of two production units is 'able to.
.
produce relatively greater amounts.of a good.
for relatively higher costs than the other.
producer, he is said to have a comparative
advantage.
d. Comparative advantage depends only on relative. .
.
costs; the higher the relative costs, the greater
the comparative advantage.
.
ANSWER: a ..

race:Revision 'no.
Revision pato
0508 C A comparative advantage is said to exist when a[
i
t
production unit:
IMP
a. Produces specified outputs at constant real costs.
b. Produces specified units of a given good at
relatively lower costs than those of another
product..
.
C. Has an absolute advantage in all goods at all
times.:
d. Has lower absolute costs than another unit
producing similar goods.
ANSWER: .b
{

TR
Datei
Pato:
Revision To..... ..
Revision Date
0520 Conditions: When asked to select from a list the factors
which lccount for the existence of a
comparative advantage in productiOn,
Performance: The student will identify as correct the
equivalent of, differences in technology,
,resource supplies, and climate.
Criterion: Implicit.
.t.

TR
Date:
Paso:
Revision 'No. --------------------
Revision Date
0520A What are the factors which account for the existence of
. .
, a c(mparative advantage in production?
i
a. Differences in technology
b. Differences in climate
C. Differences in resource supplies
d. All of the above
ANSWER: d
a
a
t
..
.04
..

.
0520 B What are the main factors which account for the
.1.
existence of a comparative advantage in production?
a. Differences in technology, resource supplies, and
climate.
b. Differences in resource supplies, demand, and
eduCation.
c. Differences in education, government aid, resource
allocation.
d. . Any of the above. .
ANSWER: a.
. AftkevRIPIN4L
Co.4
pi-aesrT TIME nut%

0520 C Differences in clir.iate, technology, and resource supplies
4 s
II
.
are factors which account for the existence of:. .
a. An absolute advantage in distribution.
b. An increase in resource allocation.
a. .A change in supply.
d. A comparative advantage in a product.
:
ANSWER: d.
Z
$
MI
POOR ORIGINALWAUAB[E COPY- BESTAABLE
AT TIMEFILMED
N
I

0520 D Which of the following is nql considered 4.o be a
factor in the existence of a comparative advantage in
production?
a. Differences in technology.
b. Difference in resource supplies.
C. Differences in climate.
d. Differences in tastes and preferences.
ANSWER: d. ,
.1.
a
0

Date:
Pao:
Revision to.
Revision Date
0506 Conditions: Given a table of outputs per unit of
labor for two products and two producers
(capital and land for this product being
equivalent for both producers),
Performance: The student will identify the product
which each producer has a comparative
advantage.
Criterion: Implicit.

0506 A
ot.
loate:
Paso:
Revision V°.
Revision Date
Both John and Simon own auto body shops, and both remove
dents and paint cars using a spray apparatus. Study
the following table carefully and identify the task
or tasks in which each man has a comparative advantage.
(Note: Figures represent units of output per man-hour.)
Firm,
Dents Paint
Simon 5. . 4
John 4 3_...,
a. John has a comparative advantage in removing
dents, while Simon has a comparative advantage
in painting cars:
b. Both John and Simon have a comparative
advantage in painting _cars.
c. Neither John nor Simon has a comparative
advantage in either task.
d. Simon has the advantage in removing dents:-
while John has the advantage in painting.
ANSWER: a

snDate:
'rase:F.ctvision'No.
Re IA3..1)1 Date
1
..
0506 B Both the Guarantee Computer Service Co. and the
Reliable Electronic =s Co. are engaged in computer
sales and service. Study the following table and
select the alternative which best describes the
pattern of comparative advantage in this case.
0.
(Figures represent units of output per 40 man-hours.)
S
'Firm Sales 1 Service1
Guarantee 14 12.
Reliable 12' 6
a. Guarantee has a comparative advantage in both
sales and service.
Guarantee has a comparative advantage in sales,
while Reliable has a comparative advantage in
service.
c. Guarantee has a comparative advantage in service,
..while Reliable has a comparative advantage in sales.
6. Neither Reliable nor Guarantee has an advantage
in, either type of business.
ANSWER& c
A3CVL ORIGINAL COPT- ttESi .
MANAUS WPM MAW

I
0506 C
.
Date:
Pose:
Revision 'No.
Revision Date
Hitt and Block both own farms on 'which they graze
cattle on part of the acreage and grow wheat on the
othei.. part. All the land is suitable for either activ-
ity. Study the following table and select the alternative
which best describes the pattern of comparative advan-
tage in this case. (Figures represent units of output
per man-hour.)
-Farmer Wheat Beef
Hitt 50 bu. 20
Block 70 bar.. 50
a. Block has a comparative advantage in wheat,
while Hitt has a comparative advantage in beef.
. b. Block has a comparative advantage in beef, while
Hitt has a comparative advantage in wheat.
C. Neither Block nor Hitt has a comparative advan-
stage in either product.
4. Block has a comparative advantage in both whiat
and beef.
ANSWER: b

0506 D
Vac:
Pace:
Revision 'No.
Revision Date .
Both Maryland and Louisiana produce tobacco and
peanuts. Study the following table carefully and
select the alternative which best describes the pattern
of comparative advantage in this case. (Figures
represent bushels of output per 10 man-hours.)
'State 1 Tobacco ; Peanuts
Maryland 60 80
1Louisiana 50 . 60
a. Maryland has a comparative advantage in peanuts,
while Louisiana has a comparative advantage in
tobacco.
b. Neither Maryland nor Louisiana has a comparative
advantage in .either crop'.
o. Maryland has a comparative advantage in tobacco,
ithile Louisiana ha's a comparative advantage in
peanuts.
d. Maryland has a comparative advantage in both crops.
ANSWER: a
.

Page:
Revision :Zo.
Revision Date
0500 Conditions: Given examples of: comparative, absolute
1 and no advantage and'a list of explana-
tions of why each type of advantage exists,
Performance: The student will:
(1) identify each type of advantage
correctly.
(2) identify the correct explanations of4 . -
why each type of advantage exists.
Criterion: Implicit.
. ..

Paco:
Revision go.
Revision pato
0500A Part One
Both Firm A and Firm B produce #20 and #30 oil. Each
wishes to use these two oils to produce a new product
which requires a mixture of these oils. The tables
below show the output of each kind of oil for each firm
using the same mixture ratio. Study the tables care-
fully. Then, answer the questions.
t
firm 20oil
f30oil
A. 40 30
B 40 .30
(2)....firm 020 00
1011 oil
A
B .
40 20.11....
30 40
(3)
firm' R20 030oil---__-===
oil
A 40 30
B 30 .20
(figures = barrels per 100 an hours)
Which of the following states correctly the advantage
illustrated by each table?
a. (1) illustrtes comparative advantage, (2) illus7:
trates absolute advantage, (3) illustrates no advantage.
b. (1) illustrates absolute advantage, (2) illustrates
comparative advantage, (3).illustrates no advantage.
c. (1) illustrates absolute advantage,' (2) illustrates
no advantage, (3) illustrates comparative advantage.
d. (1) illustrates no advantage, (2) illustrates
absolute advantage for each producer, (3) illustrates
comparative advantage.
ANSWER: d

Paces
Itovision
Revision Data
Study the following tables carefully.
0500A Part Two
The following tables refer to the situAtion in question0 .500 A Part Ope.
(1)
firm/t20 !C30Toil loll
40.
30 I 40-
(2)
firm!f20 ;30'Oil oil
40
B 4 30
30
20
(figures = barrels per 100 man hours)
(3)
firm 120 f30oil oil
A
B
40
40
30
30.......*=.1.41,
Which of the following best explains why each type of advantageexists in the relationships shown above?
a. Absolute advantage exists in ..(1.) because given the sameamount of facto* inputs, Firm A can produce more 120 oil and
. .rirm B can produce more f30 oil. Comparative advantageexists in (2) because Firm i has a greater absolute advantagein tn oil and Firm B has less absolute disadvantage in{30 oil. to advantage exists in (3) because both firms
-
'produce the same amounts of each commodity..
b...Comparative c.dvantage exists in Cl) because Pim A has ahigher relative output per factor input than Firm :6. Table..(2) is characterized by no advantage because each firmproduces equal 'amounts in at least one of their commodities.Absolute advantage exists in table (3), because each firm .
produces more 120 oil than f30 oil..
C. No advantage exists in (1).because Firm A produces as muchf20 oil as Firm .B produces 130 oil. Likewise, no advantageexists in the relationships shown in table (2) because A'produces as much f30 oil as Firm B produces 120 oil. Absolute
. advantage exists in (3) because each firm produces equalamounts of f20 oil and 430 oil.
Absolute advantage exists in (1) because given the sameoe facts ;nputc, 7.1rn
. and Firm A ca: produce :oe 130 oil. Coupc.Lative advantageexists In (2) because Fitia B has more of as absolute advan-tage in PO oil 0..rd r417m ? hes lAss of an ab4^lut:- eavA:nt;,gr:in f30 oil. No advantage. exists in (3) because both firmsproduce the same amount's of each cormodity..
ANSWER: a
.
POOR ORI6INAl: CO RY r,ESTAVAILABLE , AT TIME RIMEL.;

Date:
Page:
Revision No.
Revision Date
0500 B (1) K.O. Hitt and O.K. Punch own adjacent farms. Both use
part of their acreage for grazing beef cattle, and on
the other part they grow wheat. Both the price of
wheat and the price of beef are rising, and the men wish
to increase their income.
Study the tables below. Then, answer the questions.
rTarmer. Wheat Beef *Farmer Wheat Beef Farmer Wheat Beef6Nrr=/.trasftsaa ...hve.r....%ma.,m.:..
1
Hitt 700 350 : :Hitt 800* 450 Hitt 800 450;,.
Punch '700 350 Punch 700 600 Punch 700 300
(1) (2) (3)
Which of the following best describes the types of
advantage illustrated by the tables?
a. Table 1 illustrates comparative advantage; Table 2illustrates no advantage; Table 3 illustrates noadvantage.
Table 1 illustrates no advantage; Table 2 illustratesabsolute advantage; Table 3 illustrates comparativeadvantage.
c. Table 1 illustrates absolute advantage; Table 2illustrates no advantage; Table 3 illustratescomparative advantage,
4. Table 1 illustrates absolute Advantage; Table 2illustrates comparative advantage; Table 31.11ustratesno advantage.
ANSWER: b.
PODORIGINAL COT'
-Big
AVAILAIR.E
3114 MAID

Date:razc :
"ItcviNion 1;o.
ACV is ion Datc
0500 J3(i) (il(2) (a)
, - am ...
'Farmerr---___
I
..... . 7 w.dm =4Farmer ; Wheat Beef = Wheat Beef !Farmer Wheat Beef;
i.--.............,,,,,,,m, .i.a....a , A.. . 40 ..16 .01 .10,...4,1,..,.a.., ',v..... WI T.- f 1
1 .* i 1 1
Hitt 700 350 : Hitt 800 450 ,
800
Punch 700 :_ 350 1 Punch.s.
7001
Hitt.
7")^ '300:
4pti
I .. .1.
I I
660 : Punch
i- . . ma . a -- --
Which of the following correctly explains why each type
of advantage exists?
a. Comparative advantage exists in Table 1 because Punchhas a greater absolute advantage in wheat, while Hitthas less of an advantage in beef. No advantage existsin Table 2 because,Hitt and Punch have equal outputs of.,wheat and beef respectively. No advantage exists infable 3 because Hitt and Punch produce equal amounts ofbeef .and wheat respectively.
No advantage exists in"Table 1 because both firmsproduce the same amount of each commodity. Absoluteadvantage exists in Table 2 because given the sameamount of factor inputs, Hitt"can.produce more wheatand.Ptinch can produce more beef. Comparative advantageexists in Table 3 because Hitt ,has a greater absoluteadvantage in wheat, and Punch has less absolute disadvan-tage in beef.
e. Absolute advantage exists in Table I because both fi rmsproduce more wheat than beef. Comparative advantageexists in Table 2 because Hitt outproduces Punch inwheat, and Punch outproduces Hitt in beef. No.advantageexists in Table 3 because Hitt outproduces Punch in 'bothwheat and beef.
-.6. Comparative adva ntage exists in Table 1 because more
Wheat than beef is produced. kbsolute advantage existsin Table 2 because the wheat production of Hitt equalsthat of Punch in beef. No advantage exists Table 3because Hitt outproduces. Punch in Seth :heat an beef.
N4SWE b .
POOR ORIGINALCOPY. BESTAVARABLE
AT TIME 1:11,MED

Date:
Tale:
Revision V°.
Revisi4a Dato
.'4500C (1) Both Maryland and Louisiana produce tobacco'
and peanuts. However,:the farmers in both states
would like to specialize. Study the output tables
carefully, and then answer the questions.
(1)
State -Tcbacco Peanuts
Maryland
Louisiana
200
150
100
50
(Figures = Bu/10
(2)
!State obacco I Peanuts
Maryland
Louisiana,
50
50
100
100 I
(3)State Tobitcco Peanuts
Maryland
Louisiana
100
1 200
200.
50
Which of the following' lists identifies correctly
the type of advantage illustrated by each table?. . -
. .
a. Table 1 illustratesabsolute advantage; Table
2 illustrates no advantage; Table 3 illustrates
comparative advantage.
Table 1 illustrites no advantage) Table 2
vi
?4,1. ,illustrates absolute advantage; Table 3
.4.` ,z" illustrates Comparative advantage.040 ,
.
41,4r-.c. Table 1 illustrates comparative advantage;
'4.& 1r . . T able 2 illusLrates no advanLave; Table 3
O4,4,--,
0ck-
'i? . illustrates absolute advantage.C)gA .
1. Table 1 illustrates comparative advantage;
Table 2 illustrates absolute! advantage;
Table 3 illut;tratu:; nu advdntage.
ANSWER: a

Date:
Pose:
Revision Vo.
ilvision Date
500 C (2) Both Maryland and Louisiana produce tobacco and peanuts.However the farmers in both states would like to specialize.Study the following output tables carefully, and thenanswer the questions.
(1)
tate TobaccolPeanutsI
aryland 200 100-7
ouisiana 250 50
.1 .111
. Ca)State ITobacco Peanuts
I
Maryland 50 [ 100
Louisiana, 50 200
(Figures = bu./100 man-hours)
State Tobacco)Peanutr,
Maryland 100 f 200
Louisiana' 200 i 50
Which of the following correctly explains 'why each type ofadvantage exists, as illustrated in each table?
a. No advantage exists in (1) because Maryland producesas much tobacco as Barten_produces p9anuts. Absoluteadvantage exists in (2) because both Nary/and and Louisianaproduce more peanuts than tobacco. Comparative advantageexists in (3) because both Maryland and Louisiana have anadvantage in one product and a disadvantage in the other:
b. Absolute advantage exists in (1) because Marylandoutproduces Louisiana in both tobacco and peanuts. Noadvantage exists, in (2) because both Maryland and Louisianaproduce more' peanuts than tobacco. Comparative advantageexists in (3) because both Maryland and Louisiana have anadvantage in one product and a disadvantage in the other.
0.. Comparative advantage exists in (1) because Marylandproduces es much peanuts as Louisiana Produces tobacco.Absolute advantage exists in (2) because both states,produce more peanuts than tobacco. Comparative advantageexists in (3) because Louisiana produces .as much tobaccoas Maryland produces peanuts.
d. Comparative advantage exists in (1) because garylandhas a greater absolute advantage in peanuts, and Louisianahas less absolute disadvantage it: tobacco. No advantageexists in (2) because both' states produce 'the same amountof each product. Absolute advantage exists in (3) becausegiven the same amount of resource inputs, Maryland producesmore pe.tnuts, and pred:tecz more tobacco.
ANSWER:. d ORIGINAL toilEST-AVAIL
POOR-BitABLE Ai ruin m!meo

A #1L A0 :
is:Wit:lob Vo.
kliiiipion DAG
0500D(l) Both Pure and Blanc Brothers produce detergent and.bleach. Each wishes to produce a naw product usingboth detergent and bleach. The tables below show theoutput of bleach and detergent for each firm. Studythe tables carefully. Then, answer the questions.
)armDetergent eacn Firm :DetcrgentIBleach. ....---,...... .....
i1
Pure I 45 30 Pure 1 45eIl+ _.........
Blanc 45 30 Blanc! 25
4) (2)
(figuros ma l000powlds / 100 nan-hours)
10
45
s.
;Firm iDetergent 1Bleach;,......._____2........._______.
Pure 45 I 25
Blanc' 25 10
(i)
I.
Which of the following identifies correctly the type of advantageillustrated by each of.the tables given above?
a. Table 1 illustrates no advantage; Table 2 illustrates absoluteadvantage; Table 3 illustrates cOMparative advantage.
b. Table 1 illustrates comparative advantage; Table 2 illustrates.no advantage; Table 3 illustrates absolute advantage.
a. Table 1 illustrates comparative advantage; Table 2 illudtratesabsolute advantage; Table 3 illustrates no advantage.
4. Table 1-iflustiaies_aSS4utp_advantage.;.Tafile:2:illui_._comparative. &lvinige;,Tibie:3 illystrates no advantage.
--XNStitItt a
.
.
.
r . 7
.
,m, . .
.
...
.
a .- ..
POt.)P 00.<-,T.i ::.";;PY-BET
.kitii.A.T.E AT 1:4',AE FILMED .
.
. ..
a/.
.
.
I
..
.

sui;u:
ficviIiiwi Ep. --------------------Bev1.11on DL to ------------------
0500D(2) The following tables refer to the situation in question0500D(1).
firm1Deteruent._ -'
Pure 45
. Blanc 45. 1
(1)
b3eTtehl........._ I
30
..
. 30
rirm DotergentiBleach.
Pure 45 10
Blanc; 25 45
.(2)
;rim 'DetergjOiii.0--
. . .. ...
F Pure 45 I 25
Blanc/ 25 10
.
(3)
Which of the following correctly explains why each type of ..
advantage exists, as illustrated in the tables given above?. .
ia. Absolute advantage exists in (1) because both Pure and BlancBros. produce more detergent than bleach. Comparative.advantageexists in (2) because Pure produces more detercent% and BlancBros. produces more bleach. No advantage exists in (3) becausePure outproduces Blanc Bros. in both detergent and bleach.
b. No advantage exists in (1) because both firms produde the'same amount of each product. Absolute advantage exists in (2)because given the'same amount of resource inputs, Pure-produces more5etergent, and Blanc Bros. produces more bleach. Comparativeadvantage exists in (3) becauSe Pure has a greater absoluteadvantage in bleach; and Blanc pros. has lce.s absolute dis-advantage in detergent.
- .
C. No advantage exists in (1) because both Pure and Blanc Bros.produce the same amount of each product. Comparative advantage .
exists in (2) because Pure produces more detergent and Blanc Bros.produces more bleach. Absolute "advantage exists in (3) becausePure outproduces Blanc Bros.. in both detergent and bleach.
..
1. Comparative advantage exists in (1) because more detergent is-produced in comparison to bleach. No advantage exists in (2) .
because Pure has an advantage in one product, while Blanc Bros.has the advantage in the other. Absolute advantage exists in (3)because Pure outproduces Blanc Bros. in both products .
.. .
AnitVIE P.: t
.
.-
.
0
.. pc.,...kli,4.44.
ccoPY.c....
AVA/LABLEAT rmiE.
FILM11)

EVENT SHEET # 7
Principle Learning
Objective 0515
Segment 6
1. Inform Learner of performance required: Student is informeC that hewill identify the meaning of absolute advantage as: 'An absoluteadvantage exists when for the same amount of physical inputs, aproduction unit (nation, region, firm, etc.) produces a greater otitpt:t.,of a given commodity than another production unit."
2. 'Stimulate recall of component concepts: Student is asked what ismeant by physical inputs..
.
. . .
3. Verbal cueing: Suppose you are given the same amount of time, eflor:and investment, as your competition. You produce more than yourcompetition in the same commodity. What kind of advantage would you!fame?
4. Appraisal: .Test item 0515 A.
POOR. ORIGINAL copy - BESTAVAILABLE AT TIME At Mp

1
APPENDIX D
Economics Course Outline

r
0r-
j 004
006
008
010
012
014
016.
:4:gm:Att. 1.DNumber Segment Description1 Orientation
2
3
4
5
6
'7
Test: Pre-test for core segments 4 through 15
Counsel, prescribe
Core Learning
- Definition of nconomics- Economics a social science- Reason for studying nconomics- Micro & Macro levels of Econmics
Core Learning
- Sources of error in economic reasoning- Typical economic goals- Definition of eeonomic theory- Definition and advantages of economic models
Core Learning
- Specialization (Rationale). absolute advantage. comparative advantage
Core Learning
- Specialization. basis for trade. advantages and disadvantages. increased output (we] fare)
8 Core Learning
- Demand. definition. law of. graphical representations. determinant:s of DD. effect of changes of detevAinants
normal vers..s inferior goeL'sintra-relationships
POOR OR/GINALAVA COPY- BESTILABLE AT T/ME RUM
I See. pi...1 "1-1 7.or ki,v to syr..1:ols olow.
I/AH-M
/A-H-M
and

020
022..
024
023
030
032
:,ocimilt 1.1?Nunher
9
Sogmr!nt becription
Core Loarning
- Supplydefinitionlaw ofgraphical representationsdeterminants ofC SSeffect or .A dat(ranants,intra-ralationships
10 .Core Learning
-". definition
graphical representationsstability conditio:Is - implicationseffect of..SS and DD daterninants"excess" supply anf. &nandequilibrating proenss
11 Test and Counsel Unit test on core za5;1.entsWtiTiough-i6; prescription/counsel
3R-1 Re.Lediation - Lack of prerequisites learning tix.e(varies:t).e In lcncth).
5E-0 Test an.d Couns7.1 - Pretest of seg7ents 5F-1 an:R-2; prer.cribe
.5E-1 Enrichment
- ScarcityProduction possibilities
7 PP curves'daUnitionshapeuse
Law of increesing costs .Output possibilities
5P-2
5E-3
Enrielr.ent
Production possibilities (4plications)Effec* of chancing paranetersDevelo:-ed nationsinvestnsnt Cn.itura soods)
- Proeuction (PresInt goods)
Test and PriIcr;1, r Pre-test on enrichentsng:.enEs 5E-I trough 5E-2; prescrie
POOR ORIGINAL COPY- BESTAVAILABLEAT TIME FILMft)
and
and
and

aoc.1..
11330.),:ly..........___
V'
036
038
040
042
050
0'60I
052)
064,
...
058
......,...,....-__...,....---.-.-...-«-...------...---.... ......... ---.................................z..__.................._..__..f.cgment I,DJ
;
Nomb;-,r
5E-3
11111
12
13
14
15
16
SeCp1!...111:- DCSeriptioll._..-..--..- - - . --....-___-__...Test an& Pr;:scribe Pre-test on enriennent._____ _ ..... ........_segmenZts 11E- through 11E3; preneribe
Enrichment - Spectrum of Econcftic Systems
Enrichment - Spectrum of Economic Systems
Enrichment - Spectrum of Economic Sysems. ,
Testana Prescribe - Post test on enrichnentsegmer.ts 11E-1 through 11E-3
Remodiation Remedial learning and retest_......._......(remedial tine is variable in Iensth)
Core Learning
- Decision ilakers. Nouseholds. Pirrs. Governmz!nt
- Polo or Decision maker- Uses of. inco.s., etc.
Core Learning
-.flow ofresourcesroney inc=econsumption exyenditu-es
' . goods and ser7iess- flow betwesn households and fires- produe:. and resourea markets
Cora Learning
- Circular flow betwez:n decision =ake-sIntra-relationshi 11p of factors 4
circular '.low nod.,os
Gore Learning
- circular 'low ar.. tha t2oneLiz: systen. volunt o: flow. lea%ases. in
essential systam =.1A-..-___...."asiragatien s of in:ividale"
Test - Pose test on core: stv-iLni-s t - 15
POOR ORIGINAL COPY-RESTAVAILABLE AT TIME IRMO r
----.--qkta l itStrito-
I/P.-1I-:,

:1:6.CY--
072
;umhor
07Q
076
078
080
082
084
086
................._...........i3egJW-Int.7.
NoOxtr
17
15E-0
15E-1
15E-2
15E-3
15E-4
. Segment DescriptionwMcoaa
....M.(..
Couns.:4 - counsel and prescribe
Test_p0.Coymal. - Protest on enrichment segments G-I/H-:.:.
15B1 through 15B-3; proscribe
Bnrichment - Circular flow
Enriphnont - Circular flow
Enrichmnt " Circular flow
Tc!ptartd Couns:el - Post test on enrichment segment:.15E-1 through fgE-3; proscribe_
sminar411 - Kotivational
-17R-1 Rewndiation -.Remedial learning time Mixed. -
(vnrianie i lengths)

10t;
102
104
rr
Number.
18
19
20
21
Segment Description
TestandPresexibe - Protest on core segments 19- G-I/H.r..
26; prescribe
Core Learning (2.1/.2)
National Incone Neasurement and NationalIncome and Product Accounting .- Gross National Product (G.N.P..)
. Definition ("Standard')
. Exclusions frot GNP
. DoubJe counting
. Definition ("Value.Added")
Core Learning I I/A-H-
National Income Measurement and NationalIncoue and Product Accounting (Cont'd.)- Problems in Monetary :t.easurenent of GNP
. Inflation
. Deflation
. Real changas vs price changes
Core Learning
Nat'l Incore neasuramant & Product Accountinc(cont'd.)- Gross Private Investment
. Definition
. Non-investmnt.iter,sNet Private Irvastnent
. Definition
. Contrasted with cross privateinves!...x.ant
- Net National Product (N.X.P.)
. Contrasted with G.N.P.- National IAC0i-:0
. Defined
. Indirect 'nusiness taxes
. Contrasted: with H.N.P.- Personal laco=e (P.I.)
. Ccopared with- Transfer. Payants
DisFosa:nle rid)
- Personal Inco::e. 7a es Txp:I.
- Definitions of :,:ach-oe the PrincipalAccounting Concepts
AVAILABLE Al TiMc: FILMED
VA-H-n

. .. . . .
Illoa Sogm...nt... a. .4 %rift ftwo pmw.om...am.....r ..... w....w. 1.m...erer.wwww..411...%r
NUMIX:r Iltal0:10): Sagmcmt. Description
1 ) 22 Core Learning
110
I
112
114
1164
.!*
Behavioral Charactoristics'of Consumption andinvestment (C & I)- Savings
DefinedSavings function
- ConsumptionDefinedConsumption functionAutonomous consumptionInduced consumption
23 Core Learhing (2.5)
Consunption ana Investmant (contid.).= C + S
- 141'S
DefinedSlope of savings function
MPCDefinedSlope of consumption function
MPC + MPS 1.00- Computation of nps and MPC
24 Core Learning (2.5)
C & X (cont'd.)Investment
DefinedPlant investn;entEquipnent expendituresInventory.Purchase of homesDeterminants
Core Learning (2.5)
C.& I (cot'.)- Expected Profitt 2e=ined- interest - defined
Opportunity costsMarginal efficiency of
26 Core Learning (2.5)
POOR RIGINAL COPY BAVAIL AT TIME MA
C & I (contle..)intereft (contid.)
M.E.C. (cont'.)- M.E.C. schefuL,.
SZope of curveInfluc o rata
- Causes of ioiati2ity :nvestnent

1.
120
122
150
152
156
158
arm. m... .. -t. 1
Number Segment Dvscriptien
27 Test and Prescribe - Unit test on segments ).(:-26;prescribe
27R-1
EP?21ilar 2
BsTeAJAiLslength) and
Motivational
- Remedial learning time (varinble inretest
Core Learning (2.6)41.
Nat'l Income Eqnilibrinm Model (2.6)- Producer-Expectations
Consumar Zxpecta'-lions- C t X in a Two-Sector nodel- Aggregate Demand
. C & I schedule- Aggregate Supply
. Graphical representation
29 Coro Learning (2.6)
Nat'l Ineme Equilibrium ,Model (cont'd.)- Full Er.'.ploymz.nt IncomeUnelJployment
- Actual and Potential NNP- Income rc:uili:iriva
. Defined
. Graphica3 represents:tion
. Interpreted in ter.:-.s of surply anddemandIn two-sector model
30' Core Learning(2.6)
Nat 'l Income E:quilibrium Model (cont'd.)- Stocks and Flows- "Ex ante" savings s investment define.:
- - "Ex post" savinss defined- = I- Equilibrium Point of Income
31 Core Learning(2.6)
POOR RIGINALAVAILA LE AT TIME F
q
Nat'l Into; e Equilibrium :!oriel (cont'd.)S I
- Difference betwee n "Ex post" and "Ex ante"savingCor.seqw:nces of ex at S / ex ante I.
- ImplicationsS & I'approacl.1 cc7Tare1 with aqsresatesupply and 4.: and ap.proach
-.Rultiplier. Multiplier process. AlliceorMc :::!;seription
.rncii3a
Strat:.
G/11-1:.-;*
G/P D
nixed
I/A-11-nand
and
I/A-Y-.

162
.......
Segmnt D:!script3op
32 Coxo Learning (2d)
33
34
Nat'l /ncomt Equilibrium flodcl (cont'd.)- Nultiplicr (coned.)
Operation with respect to changes in IMultiplier adjustments on C & * diagral:
Ye .as a function of C, 14 and SUniqueness of Yo
- Effect of Over-optimism of producers- Effect of Over-pessimism of producers
Core Learning (2.8)
iiscal Volicy- Deflationary Gap; Inflationary Gap
Necessary conditionsOn C 1. I G diagramConsequences
BudgetBalanced budget defjnedBudget surplusBudgst deficit
- Stabilizing Econ=ic Fluctuations. Countercyclical fiscal policy
Core Lc.arning (2.2)
Piscal Policy (cont'd.):;:cononic Fluctuation (coned.)
. Taxes (T x ).- Defined- Effect on C, I, & Y,
. Coverne.ent expendP.;ures (G)-Defined-Effect on C, I, & Yo
. . G multiplier`.Tx neltIplier
. Changes in Tx and G to reach 'AtllEmploy:tent InconeStabiiizir effects of Tx and Gconpared
. Balanoe bclçet nultiplier
-why equal to 1.00
POOR ORIGINAL COPY.BEST
AVAILABLE AT TIME AIMED
Streq.c.
X/A-11-2:

1
168.
170
172
41
::g!!" " J) .
Nuftlxr Scqm!!n-c. Dm:cription35 Core Learning (2.9)
The Role of RoneyHoney as a mediun of exchange
Meaning of "runction as a medium ofexchange"Characteristics which allow poney tofunction thuslyExample of such.functibning
Money as Measure o ValueExample
Honey as Store of ValueExample
Money as Standard ofDeferrod PaymentExanple
MoneyDefinedFunctionsLocus of ValueThings which nay serve as.noneyRole of ooney in the econony
36 cora Learning (2.10)
The Money SupplyDemand Dcrosits
DefinitionPart of total money s4pplyForm of ::.oney
Assets, Liabilities !, :Ialanee Sheets.D.D. as as Liezility
Fractional, Reserve System.Dasic Oeration
37 Core Learning (2:10)
The ii6ney Supply (coned.) -
Fractional :teserve Systen (cont'd.)PremisesType of bank reserves (Ass=..ts)Require:: reserves
Settitc of requirementsExcess reserves
Source of loan fundsProblem - example
.
38 Care Learning
POOR ()RONALAVAILABLE AT TI
11
The Xoney Supply (cont'e.)Fractional.::eserve System (cont'd.)
Excess :testrves (coned.)Expans4on ratioPro".)2ems
PY.Bmw Reserve ::eficioncy
F MAID Near :'nlyDorineftExarp7.es of'

176
178
180
1g2
184
190
SCiirt_:11i: . !)1"
NVOX071
Segment Doscr:iptieln_
39 T(Tt_and_Counr;1 - Unit test on core segments28-38; prescribe
32E-0
32E-1
32E-3
32E-4 :
321.-5
39R-1
Test and,Coutlse - Pretest on enrichment segments32E-1 - 32E-4; prescribe
Throe and roar Sector Equilibrium
Effect Of expectations of individuzil decision-makers.Elaboration of the condition that .leakages equalsinjections, in the associated adjustment.process.The effect of induce invostY",nt on the multiplier.Additional numerical worl: with -the investmentmultiplier.The paradox of thrift.The foreign trade multiplier.Xntroduction of government into the nodal, and theimpacts of taxes and uoverniient spending.Additional nunerical work with the or sectorequilibriu:3 model.
Tnst and_Comnsel - Post test en enxichrent segmentsthrourill 32E-4.
Seminar t3 Xotivational
Remediation - Remedial learning tine (variablein leng6Yand retest
POOR ORIGAVAILABLE INAL COPY-
BESTAT IIMEFiLMED
G/?-D

SC gm.:!nt X.D
roabe Nu*ber
2
202
264
206
40
41
42
43
Core Learning
The Federal Resz)!Ve System'- American Banking System
CompetAtionPederal Reserve System
Description of PurposesDescription of Functions.Policy na%ing Body - tho,Board ofGovernors
FunctionsMethod of Choice of Governors
Member Banks
Core Learning
The PAeral Reserve System (cant' d.)- Controls of Ban% Reserves
Tools for ControlVariation or Reserve P.equirement
Effect of rtaisinc!Effect of Lowocing
Core Learning
The Federal Reserve System (cont'd.)- Variation of Discol:nt Rate
Effect of DecreasingEffect of Raising
- Open Market Opera'AonsOp:in Narkct Co:rmittesEffect of Open :!arkel; OperationsSecurities Transactions
Exarlples ?roblemsSumary - Quantitative
Credit ControlsCounter-cyclical Effects of ::onetary action=
.
Cora Learning
The Product and :Ionetary narkets- Transactions De::and for Noncy
DefinedMain Deter.: inant
Graphical Reprt,e0,nte'!onIndepande:;ov vis-a-vis interest Rats
Graphical %cpresantation
;'FOR ORIGINAL COPY-BEST. :sir AT TIME FILMED
and

. . . .
.....
Fcgmnntroml.ser 1'uL11).:!1: I Sociment W:ncTiption
209
210
.211
212
214
216
218
44
45
46
47
48
49
46E-0
Core Lverning
The product and %onctary Karkets (cont'd.)- Asset (ox spcculative) De:land for roney
LxplanaticmMain DeterminantNegative Slope - )rplanationGraphical W.:presentationBffect of Decline in Interest Rates
Core Learning
The Product and Ronetary Markets (cont'd.).Tetal In.mand for :-:coney
DefinedAs a Function of interest Rate;'Graphical
RepresentationShifts with Ince:n Level
- Supply of MoneySupply CurveDeloriAnation Supply
Determination of interest :-tate
Core Learning
The Pro:fnict and Monetary :!ar%ets (cont.)- Recall of level of invesnt as ::.est
volatile co::.ponent in deter:Ination orocnilibrix: level of jneee.
Deter:Anents of Level of Investrent- Relation between n.oney supp:_y, ratE, of
interest, and level o investilnt.Grapical representation of offedt of
change in noney supplyinf.lueace of monetary i.7oLicy on eqJiii-
.briu level of incona.
Core Learning Open
Test - Pout test on sagnents 19 throu; 47
Counsel -.Counsel and*prescribe
Test a- Counsel. - Protest on enricent segnents45 ris-1 throu'n 45-3-n; prescribe
POOR ORIGINAL ccirt-sesrAVAILABLEAT TIME FILMED
andI/A

222
224
226
228
210
Pumber Segment D:!seription..
46E-1 EnrIchivnt - Monetary and Product Markets. .
Equation o:;: cxchanc::Precautionary demand for moneyEffect of interest raies an transactions and
precautionary demnd for looneyRelationship between velocity and the
Keynesian demand for money
46E-2
46E-3
46E-4
49R-).
Enrichment - Monetary and Product Markets'(Anticipated)
Test and C9un.sel - Post test on enrichment segments46J-1 txough 66-)); prescribe
(P.:miner F4 - Potivational
Remediations - Remedial ,carnin tim:: (variable in
:POOR OR;GNALAVAILAB COPY- 8ESTLE Ai TIME FILMED
far:!te
1/71-11-Y.
G/P-D
Mixed.

302
304
4
346
3'-.
310
312
. .
.
3.1).
number Scqmina Dt.!;cription
50 Tent and Courw-el "'Pretest 'of sevAants 51-79;prescribe
51 Core Learning (3.1)
Demand ;:tonsumar MaximizationDefinition of UtilityTotal utility functionMarginal UtilityTotal - Marginal Utility. (relationship)Graphical illustrations-
.,Core Learning (3-) )
Demand & Consumer MaximizationParadox of valueConsumer equi)ihrium.Relationship of NU on Demand
. 52
3
54
Core Learning (3.3)
Price elasticity of deandElasticity coefficientsGraphical representations'Consumar behavior effects
Core Lf.arnirc (3.3)
Relation to total revenueYncone c3asticity of de::andSignificance of.' coefficientsLevels of Incona/donand
I/A
55 . Core. Learning (3.6)and
Short run costPlaced and variable costsAveragbd fixed and variable costs..Total cost - average total-costs--Curve analysis
56 Core Learning (3.6)ane
Narginal cost (S.R.)AVC and ATCbeterninents of MCCalculate 17.Relationships of curvast 3C, ATC, nc, VC, AVC,
VC, AS--C
%A.
CO.PV r3n.
AVAil.Eli. '1 .:.1 1004er

1:1601 ktgi...int. 1.1)1
1:00.,:l7 Vumber Segment 11:sciptim.:__........ ..............._ ..... .._
314 57 Coro Learning (3.6)._--.
316
318
310
322
324
326 61R7].
Definition of SR supply curveSignificance of curvo intercepts: I - AVC,MC - AC
Significiince of "SR Supply Curve". Segments:AVC to AC InterceptsBelow INC interceptAbove AC Intercept
Firm supply from supply_curve.
58 Core Learning (3.0)
..Definition of long runLong run cost curvesShort run to long rup curvesExpanding plant capacity
59 Core Learning (3.8)
Economies of scaleInternal/external - economies/diseconomiesShifts on and of LR-ATC curve
60 Core Learning (3.8)
Effect CO'. A I) - Long run & short runLRATC curve analysisSD curve analysis
Relationship between Spend LR-ATC curves
61 Test: and Counsel - Unit test on core segments51 through 69;prescribe
Se: in'ar 45'- Motivational
Reredietio - Remedial learning time (variable inTeriTEN) inTI retest
350 62 Core Learning (3.9/.10/.11)
Firm demand Indfistry demandIndustry equilbiriumMarginal & Average RevenueRelationships of above
352 63 Core Learning (3.9/.10/.11)
CostrricePricuSit & LR Ecuilibritr%neter.rlinants of LR S'Sit firm equilibriumMaxi:31.3&tion of Profit LR & Sit
POORAy Al
INAcopy.AT ph* pm*
G/P-D
:ixed
and

356
356
,.
362
364.
1;C:9:WA') t 1.1?)IIIII*.g.);.r
64
65
66
67 :
68
69
F6OR MINA). COPY.AVAI BLE AT TIME FILM
Scqm,:mt 0:!ncyiption
Core Learning (3:9/.10 .11)
Exit & Entry criteria Mt & SR)Rationale for dynamics of equilibriumConsequences of entry and exit
....1.............-,...
Core Learning (3.1/.10/.11)
Definition & characteristics of monopolyPim and Industry deanaElasticity of demand (monopoly)Shape of demand/average revenue curveDerivation of 1:12 from ARSignificance of R-MC intercept
Core Learning (3.9/.10/.41)
Consequences of changes in technologyConsequencesof changes in demandSR - equilibriumLR - equilibriumLR equilibrium in compati,tive and in rono-
polistic environment
Core Learning (3.9/.10/.11)
Definition of :.Ionopolistie ConpetitionFirm and Industry ElasticityCharacteristics of z,:) CurvesProduct. variation, selling expense price
competitionEffect c changes in selling expense on firm
& industry curvesEffect of AV on .firm and industry curvesEffect. of product va-iation on firm and
industry curves
Cord:'Learning (3.9/.10/.11) .-
Tangency solution of market equilibriumShort run equilibriumLong run equilibrium
.-
Core Learning (3.9/.10/.11)
Comparative price, quantity and profitequilibrium for industry under cinopolistic,Competitive and :4ono?olistic Co;Tefitivemarket.situations.
I
Pr.)
AdvantavJs and diseduantes of YonopolisticCompz,tition

r-.0.oa Smo'Att 1.1!
Ilookti Mumhf.:r .,SowilonL lw!ICK iption
.... ...... .. - . . .
70 Cora Learning (3.9/.10/.11)
Oligopolydefinitionchara&teristicsprice., quantity, selling cost, & product
Variation behavior:Nonequilibrating behaviorCollusion & price 1e;:51arship
368
370
372,
314
71 Core Learning (3.9/.10/.11)
,Compqrison of supply, dowind, cost and revenuecurves characteristic oK Competitive,Monopoly, Nonopolistic Ccmlp:tition.andOligopoly marhet situations.
Relationship of: P. q. &Win various marketsituations
72 I Test.and Counsnk - Unit tc:st on sow,...ents 62 through
Setaini9:2§ - Motivational
Remdiation - RUii learning tine (variab).e inand retest
72R-1:
StYW.
i/A-- 13, : :
4*.

f;nulannt.. 1.D.
Number . ;;egwent
74 Coro le,rnine (3.13)400
402
A04dl
406
408
410
75
76
7/
Marginal Physical ProductDemand for a factor
productivityfinal product
Derivod DemandDemand for a factor as a schedule
Core Learning (3.13)
Shifts in demand for factor inputsElasticity of demand for factor inputsSubstitution and Coivlon,enary effects'Effedt of P on a factorDerivation of Market Donand
Coro Learning (3.13)
Supply 'Iliac: eharactorintics oflandlnborcapital
Average factor costsNarginal factor costsIncome to factorsOpti;dzing action of resources
Core Learning (3.14)
Determinants.of the dc.:,tand for laborElasticity of denand for laborSources of demand for laborPiro, industry an4 aggregate mandEguilibrium n labor market
78 _Core Learning (3.18)
79
POOR ORAVAILABLE,
...Imperfections in Labor Marknt- Natural: Supply side, Demand side- Unnatural Sui:ply side, Demana side
Effects of impediments
Core Learning (3.19)
Distribution of :3XPSiza distribution
definitionsignificant factorsCause effect rationale
Yunctional distribution
INAL COPY -8Est. definitionfactorsAT TIME Funcue - effect rationale

... e . .044 N -1 ( ) .!;;*;iji.: t 1 I al
.:Msber Number - Segment Description......
411- 03 Tont r Post test on core segments S3 through 791
414
416
450
452
454
456
84
84R-1
86
Counsel - Counsel and prescribe
yeTediation - Remedial learning time (variable inlongth) and retest
Test and Counsel -- Pretest on segments 86 through. . .
94; prescribe
C1112. - The Theory and Benefits of Trade
Statement of comparative etc vanProblems identifying pattern of comparative advantage
Advantages of international trade andlending
Costs of international borrowing orltinding
Effect of trade on prices of goods andfactors of production
87 Core The Balance of Payments'
Basic balance of payments accountsDescription of debits and credits.
Capital inflows and outflowsEntries for specified intrnsctions
Why ba a
a2ance of pay::cntsBasic ba3anee
DefinitionChy a useful conceptImiportance of short-term capital
flows
88
POOR oRIGNALIAVAIL ABIg AT T
e
Strati.,
G-X/P
"always balances"
rnternatonal Adjust:r.ent Process
ff"Flielsrmcr,
Gold parityMeaningCompute. exchange rates given currency
prices in gold"C3assiear =od standard
kequirement.sRcasons axcl:nse rate fluctuated ;
narrow rani:Mercanti3ist view of.goldHurAc's specie-flow mechanism
As a m:tthod of adjupA.7:entimpact of gold Joss on money supplyC3assical vicw of economic adjustnt
process
i!-:

svgment I.D.MOW):
460 . 90
462 91.
464 ,
Segment Description
Coro - International Adjusthumt Process
Impact of change in money supply on anunder -employed economy
Ronsons why wages and prices arc"sticky downward"
Effect of changed incomes on demandfor imports
Numerical problemDifferences between Nume!s theory and theactual adjustment process which occurred
Core - The international Adjustment Process
Problems with classical gold exchangestandardToday's gold exchange standard
Difierences between pre- pnd post-1914 adjustment
Benefits from today's gold exchangesystem
Costs of today's gold exchangesystem
Determinants of the .levels of exports and-imports
Effect of changes in money supply andgovernment expenditures on the balanceof trade
Lora -.Correeang Payments Disequilibrium
Currency depreciation and appreciationMeaning ofEffect on exports anzl imports andbalance of pa,.ments
Effect on domei-tic economyTariffs, quotas andexport subsidies
Meaning oEffects on exports, imports, andbalanc< of trueEffect on domestic economy
92, cora Flexible ::xchang,-, Ratt.s
Flexible exchange to systemDescriptionSupply and d 7:.and for forexchancje.
Equilibrium and stabilityEenefitS ane costs cf a flexillla exchangerata sys Lem
POOR OR!
BLEGW44 PrBIST
FILMEn

oct,tmlwr
;09i..:*.!fi t. .r. )).
466 93
46B 94
41V 95
.412 96
414
416, 96R-1
. . . . . . .... . ....... .. . .. .. ... ....... , ... . .... ..... ...Ii Ne.C.PC:0» t Deli (")...i p( ion
4ICore (1f Y( ): i*.v.i.j.C:ii Ii.ons of scl.ec:::ed Polir:yVar.lables
Impact of tariff on a particular goodMerits of tariff vs. quotaMerits of tariffs vs . export subsidiesRevenue tariff, pro and conUse of tariffs to correct domesticunemploywzrit
Policy Applications and Problcms
Effect of fiscal and monetary policies onnational ibComa and the balance ofpayments
Problems in idontifying policy mixes tocounter specified domestic and paymentsdiffieu1ties
fl
Post test on segments' g6 through 94
:Counsel counsel and prescribe 6X/P
ikiroun Discussions
!Remediations - RemedialIreinUffiriiHE .10 u,5; t
IG/P-D
earning time (variable in Mixed
POO* OR1GNAViir Co
'4451E AT PI' -8ESTINEkMED

APPENDIX E
Excerpt from List of Summarized Objectives
1

SEGMENT 51
3,125 Definition of utility
3122 Selection of a graph illustrating total utility
3140 Definition of total utility
3121 Identification of the relationship of total utilityto quantity consumed, given a graph
3120 Definition of marginal utility
3113 Relationship between demand and marginal utility
3119 Explanation of why the marginal utility curve isdownward sloping .
.
3116 Identification of the marginal utility curve, givena total utility schedule
3117 Identification of the shapes of the total utility andmarginal utility functions, given,a description
3118 Correlation of MU and TU graphs

SEGMENT 52
3190 Explanation of the paradox of value
3110 Identification of the "consumer utility maximization"equation
:3111 Conditions for consumer equilibrium, given fixed incomeand prices
3112 Selection of the consumer equilibrium, given the marginalutilities and other data for two goods

SEGNENT 53
3:145 Identification of the "price elasticity of demand"formula
3346 Definition of price elasticity of demand
3344 Calculation of the price elasticity of demand for agiven point on a curve, given data
3342 Identification of a graph representing perfectinelasticity
3338 Consumer behavior regarding quantity demanded, whenprices decrease for a perfectly inelastic good
3341 Explanation of the elastic, unitary and inelasticranges on a given linear demand curve
3309 Identification of the elasticity points, given ademand curve and its corresponding total revenuecurve
3339 Effect on total revenue when the quantity purchasedincreases for a good having unitary elastic demand

SEGMENT 54
3333 Definition of income elasticity of.demand
3330 Selection of the "income elasticity of demand" formula
3334 Identification of the economic analysis - static
3335 Identification of the economic analysis - dynamic
3331 Significance of tests or incomes in demand analysis
3310 Definition of a normal good
3311 Definition of an inferior good
3328 Definition of the substitution effect
3329 Definition of a complementary good

SEGMENT 55
3623 Definition of "short run"
3621 Description of fixed costs
3622 Definition of variable costs for a firm
3615 Definition of average fixed cost
3614 Definition of average total cost in the short run
3616 Definition of average variable cost
3618 Relationship between "fixed cost" and the "short run"
3619 Component of variable cost and fixed cost
3620 Relationship between variable cost and production
3617 Characteristics of total cost
3613 Selection of a total cost curve for a given totalcost function
.

SEGMENT 56
3612 Definition of marginal cost
3609 Derivation of marginal costs, with reference tovariable costs
3610 Determinants of marginal cost
3611 Derivation of marginal cost with regard to total cost
3608 Calculation of the marginal cost given a firm's outputand total cost
3607 Relationships between total cost, average total cost,marginal cost, total variable cost, average variablecost, total fixed cost, and average fixed cost
41.

SEGMENT 57
3656 Identification of ATC, AVC and MC for specific levelsof output, given a graphical statement
3652 Identification of the relationships between the firm'scosts and receipts, given a market price for the pro-duct less than AVC and other data
3653 Significance of a situation, given a market pricebetween the minima of ATC and AVC and other-data
3654 Significance of a situation, given a market pricegreater than minimum ATC and other data
3630 identification of the quantity outputs to be suppliedat low and high prices, given data
3655 Completion of TR, TC, TP and MC and determination ofwhether a firm will supply the market with goods, givendata
3651 Identification of the condition underlying the willingnessto supply output to the market
3650 Identification of a firm's short-run supply function

SEGMENT 58
3C01 Definition of the long run
3802 Comparison of component costs in the long and shortruns
3804 Definition of the long-run average total cost curve
3821 Characteristics of "economics of scale" for a firm
3822 Identification of scale economies
3809 _Meaning of expansion of output for the individual firmin the long run
3807 Identification of the meaning of a shift in ATC, givenan example
3806 Identification of the long -run average total cost curve

SEGMENT 59
3816 Definition and/or effect of external economies
3819 Definition and/or effects of external diseconomies
3820 Description of and /or the effect of internal diseconomies
3817 Definition and/or effect of internal economies
3818 Identification of the role of economic factors inproduction
3813 Shape of a long-run average cost curve
3824 Factors which cause movements along and shifts of thelong-run average total cost curve
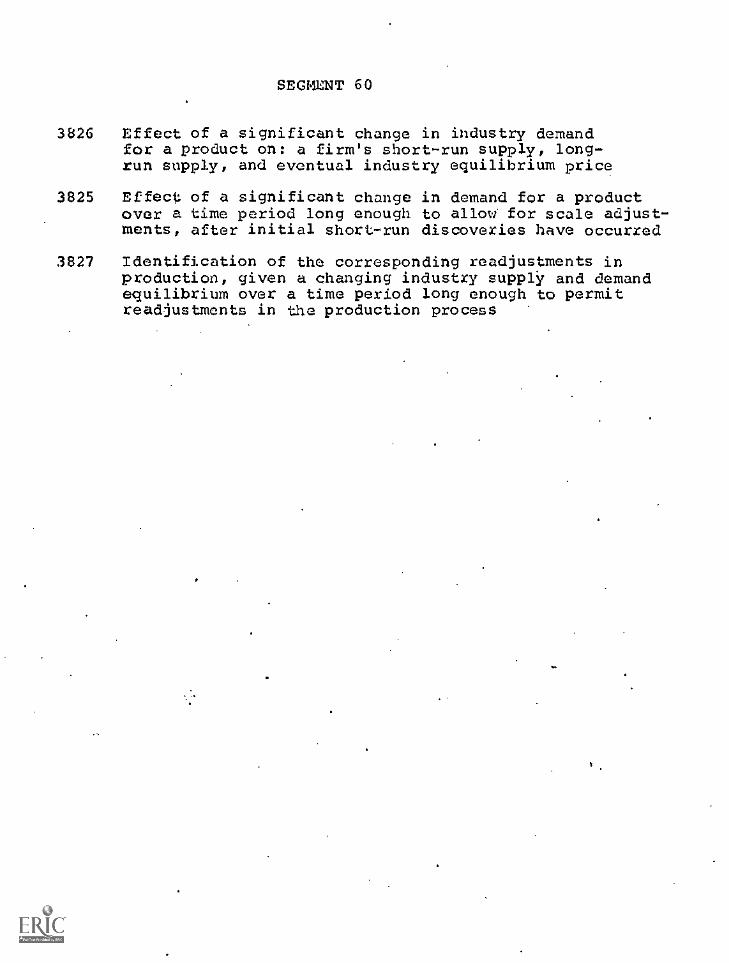
SEGMENT 60
3826 Effect of a significant change in industry demandfor a product on: a firm's short-run supply, long-run supply, and eventual industry equilibrium price
3825 Effect of a significant change in demand for a productover a time period long enough to allow for scale adjust-ments, after initial short-run discoveries have occurred
3827 Identification of the corresponding readjustments inproduction, given a changing industry supply and demandequilibrium over a time period long enough to permitreadjustments in the production process

SEGMENT/62
3PO4 Characteristics of a purely competitive market
3906 Determinant of industry demand in a purely competitivemarket
3915 Derivation of industry's supply
3908 Description of industry equilibrium in a purely com-petitive market
3907 Firm demand-industry demand relationship at the existingindustry equilibrium price
3909 Defintion of marginal revenue
3903 Graphical or verbal identification or marginal revenue
3902 Identification of average revenue given price andquantity information
3910 Definition of average revenue
3911 Relationship between the firm demand curve and themarginal revenue curve

SEGMENT 63
3902 Description of entrepreneurial behavior
3912 Identification of the profit maximizing output,given information on marginal cost, marginal revenueand output of an invidividual firm in a competitivemarket
3913 Selection of the short-run profit maximizing (or lossminimizing) output, given schedule relating totalreceipts and total costs to levels of output
3914 Selection of the short-run profit maximizing (or lossminimizing) output, given graphical illustrations ofcosts and revenue relationships for an individual firmin a short-run competitive market situation
3916 Identification of a firm-industry equilibrium situation,given graphical illustrations of industry demand andsupply relationships and a competitive firm's revenueand cost functions
3917 Description of short-run firm equilibrium
3918 Consequences of a change' in industry demand, in theshort run, in terms of output for maximizing profitin a competitive market situation
3920 Determinant of equilibrium in the long run
.3921 how a firm may maximize profit in the long run

SEGMENT 64
3922 Long-run criteria for entry and exit of a firm in anindustry
3923 Signficance of marginal cost intersecting the marginalrevenue curve at a point above and to the right of themarginal-cost/average-cost intersection
3924 Effect of a shift of industry demand in the long runon the equilibrating situation
3925 Dynamics of long-run equilibrium adjustment in a purecompetition
3926 Sequence of entry and exit in a purely competitiveindustry in the long run

SEGMENT 65
3947 Characterization of monopoly
3948 Description of natural monopoly
3949 Barriers to entry in a monopoly situation
3937 Derivation of the supply curve of a monopolist
3932 Relationship between industry and firm demand in themonopolistic market
3935 Relationship. of the marginal revenue curve to thedemand (average revenue) curve
3933 Relationship of the elasticity of a demand curve tofirm decision-making in a monopolistic market situation
3936 Derivation of the marginal revenue curve confrontinga monopolist, given P = a-bq as the average revenuecurve

SEGMENT 66
3939 Operational definition of the marginal revenue/marginalcost intercept
3929 Graphical identification of short-run profit maximizationand other parts in a monopoly situation
3940 Effect of technolgoical change on product production ina monopolistic market
3941 Effect of shifts in demand on price and quantity outputof a monopolistic firm
3942 Short-run readjustments for a monopolistic firm
3943 Average cost in long-run equilibrium in monopolisticand in competitive industries
3944 Comparison of price and quantity output for an industryunder conditions of monopolistic and competitive marketsin the long run

3950
3951
3952
SEGMENT 67
Description of a monopolistically competitive market
Characteristics of a monopolistic competitior
Characteristics of firm elasticity of demand in a mono-polistically competitive market
3953 Identification of a monopolistically competitive firm'ssubjective view of the relationship between its owndemand and industry demand
Rationale for price competitioncompetitive markets
Rationale for product variationcompetitive market
Rationale for advertising costs in monopolisticcompetition
Determinants of variations in the supply and demandcurves for a monoplistically competitive firm
Characteristics of cost curves (supply curves) in amonopolistically competitive market
3956
3957
3958
3959
3954
3960
3961
in monopolistically
in a monoplistically
Effect of price competition on the industry and on anindividu'al firm's supply and demand curves
Effect of product variation on the industry and on anindividual firm's supply and demand curves
3962 Effect of changes in selling costs on the industry andon the individual firm's supply and demand curves, ina monopolistically competitive market

SEGMENT 68
3964 Short-run equilibrium in a monopolistically com-petitive industry
3965 Long-run equilibrium in a monopolistically competitiveindustry
3963 Rationale and significance of the "tangency solution"of a monopolistically competitive market equilibrium

SEGMENT 69
3966 Relative price equilibrium points, in the long run,for an industry under monopolistic, competitive, andmonopolistically competitive market situations
3967 Relative quantity equilibria for an industry undermonopolistic, purely competitive and monopolisticallycompetitive market situations, where identical coststructures prevail
3968 Comparison of long-run profit situations at .equilibriumfor an industry under the three market situations (3967)
3969 Advantages and disadvantages of a monopolisticallycompetitive market

SEGMENT 70
3970 Definition of oligopoly as a market structure
3971 Demand interdependence in an oligopolistic market
3972 Price behavior in oligopoly
3973 Product variance behavior in oligopoly
, 3974 Oligopoly behavior with respect to quantity.variation
3975 Why sales competition (advertising) it; a type ofoligopoly behavior
3976 Oligopolistic market supply in both short-run andlong-run market periods
3977 Relationship between firm and industry deMand in anoligopolistic market
3978 Rationale for indeterminate equilibrium within anoligopolistic market structure
3979 Collusion in an oligopolistic market structure
.3980 Price leadership in an oligopolistic market structure
3981 Rationale for firm behavior in an oligopolistic marketstructuge

- SEGMENT 74
4001 Definition of marginal physical product
4002 Relationship between the marginal physical productivityand diminishing returns
4004 Graphical illustration for the marginal physical productcurve of a factor input which illustrates its relation-ship to dimishing returns
4003 Primary determinants underlying demand for a factorinput
4006 Explanation of the downward sloping factor demand curve
4007 Definition of the marginal revenue of a factor input
4008 Definition of derived demand
4009 Demand for a factor as a demand schedule

SEGMENT 75
4010 Causes of shifts in demand for input of a factor
4011 Determinants of elasticity of demand for factor inputs
4012 Substitution effect for factor inputs
4013 "Complomentarity effect" for factor inputs
4014 Effect of changes in the price of factor inputs on thedemand for the factor inputs
4015 Definition of market demand for any factor input
II.

SEGMENT 76
4016 Determinants of the supply of labor
4017 Determinants of the supply of capital
4018 Characteristics of the supply of land and determinantsof its value
4019 Basic assumption underlying the marginal productivitytheory
4021 Definition of marginal factor cost
4020 Definition of average factor cost
4022 Optimum use of single factor input
4023 Determination of the income receipts of the factors ofproduction
4024 When optimum use of all factor inputs occurs, underconditions of profit maximization behavior

SEGMENT 77
4406 Derivation of the demand for labor
4407 Relationship between the elasticity of demand for:labor and for the commodity produced
4405 Basisof a firm's demand for labor
4403 Sources of an industry's demand fox labor
4404 Description of the aggregate demand for labor employedwithin the economy
4401 Graphical relationship, under competitive conditions,between the firm's, industry's, and economy's demandfor labor
4400 Explanation of the equilibrium of supply and demandin the labor market

SEGMENT 78
4801 Assumptions underlying the purely competitive labormarket
4802 Basis for labor market imperfections
4803 Identification of the non-competing groups within thelabor market
4804 Rationale for wage differentials existing within thelabor market
4805 Differences between unnatural and natural impedimentswithin the labor market
4806 Natural impediments in the labor market
4807 Unnatural impediments within the labor market
4808 Unnatural impediments imposed upon the labor marketby management and management orggnizationsin an attemptto influence wage rate determination
4809 Management's rationale for lockouts
4810 Management's rationale in the formation of companyunions
4811 Rationale underlying discriminatory discharges of workersby employers
4812. Rationale underyling blacklisting practices as practicedby employers
4813 Graphical illustration of the wage rate effects desiredby management in their attempts to impose unnaturalimpediments into the labor market
4814 Rationale for restrictive union membership requirements
4815 Union's rationale underlying above equilibrium wagerates secured through collective bargaining arrangementswith managements
4816 Effect of restrictive union membership practices
4820 Effect of a situation where a union imposes restrictivemembership requirements, and has a collective bargainingagreement with .management at wages above the equilLbriumwage rate

SEGMENT 78(Continued)
4817 Graphical effeccs of restrictive union membershippractices
4824 Effect of a situation where the labor unions canrestrict the quantity of labor supply, and where thereare natural impediments to labor mobility
4822 Characteristics of legislation sought by management
4823 Characteristics of legislation sought by labor unions
4821 Etz'lonale underlying the lobbying efforts of managementaria organized labor

SEGMENT 79
4835 Operational definition of "rent"
4836 Operational definition of "land"
4833 Operational definition of "wages and salaries"
4834 Operational definition of "labor"
4832 Operational definition of "capital"
4830 Operational definition of "interest"
4931 Operational definition of "profits"M
4946 Operational definition of "entrepreneur"
4838 Definition of "functional distribution of aggregateincome"
4837 Significant factors underlying the functional distri-bution of GNP
4839 Recent trend in the functional distribution of income(e.g., the past twenty years), in the U.S.
4841 Operational definition of "size distribution ofaggregate income"
4843 Significant factors underlying unequal size distributionof GNP
4942' Factors which tend to ameliorate in inequalities in thesize distribution of income
4845 Methods of analyzing the distribution of GNP

gP SEGMENT 86
5046 Meaning of comparative advantage
5047 Identification of comparative advantage, given atable of outputs per unit of labor for two productsin two different nations
504$ Identification of comparative advantage in terms ofratio of exchange and of the good to be exported, givena situation
5049 Identification of the consumption possibilities curveafter engaging in international trade, given asituation
5050 Explanation of the advantage of international tradein a world economy
5051 Benefits derived from international lending
5052 Costs of international borrowing or lending
5053 Description of how prices of the internationally tradedgoods and the factors specific to them change with theintroduction of international trade, given an example
5054 Effect of opening free trade on the prices of goodsand the factors of production

SEGMENT 87
5099 Identification of the three accounts in the balanceof payments
5097 MecTling of capital outflow and capital inflow
5025 Description of debits and/or credits in our balance ofinternational payments accounts
5026 Identification of an entry in the U.S. balance of pay-ments which is not a credit (debit)
5027 How a particular transaction involving two entrieswould appear in the balance of payments accounts
5028 Sense in which the balance of payments will alwaysbalance
5029 Definition of the basic balance
5098 Reason why short-termseparately
5030 Why the basic balanceis a useful concept
capital flows are recorded
of payments deficit (or surplus)

SEGMENT 88
5004 Description of the economic thinking of the"mercantilists"
5001 Requirements a nation must meet in order to be onthe "classical" pre-1914 gold standard
5002 Identification of the price of a currency in termsof the dollar, given an example
5003 Reason why the price of one currency in terms ofanother could fluctuate within their narrow limits
1
under the pro-1914 gold standard
5005 Impact of a loss for gain) of one unit of gold onthe money supply of a country, subscribing to thepre-1914 gold standard, when that country's centralbank holds a fixed fraction of one unit of gold forevery X units of the money supply
5096 Summary of an important conclusion of classicaleconomists
5095 International adjustment process as presented in theHume specie flow mechanism
.5006 Description of Hume's specie flow mechanism

SEGMENT 89
5007 How demand for imports would change if incomes wereincreased
5008 Impact of a change in income on imports, given anexample
5010 Initial impact of a change in the money supply inan underemployed economy
5011 Reason why prices and wages don't fall immediatelyafter a reduction of the money supply or a reductionof government expenditures, or why falling prices andwages are usually accompanied by some unemployment
5013 Principle difference between Hume's specie flowmechanism and the way adjustment actually took placeunder the pre-1914 gold standard

SEGMENT 90
5009 How the volume of a nation's exports and importsdepends on the price and income levels of that nationand her trading partners
5012 Description of changes which occur in a country'sbalance of trade in response to a reduction (increase)in the money supply
5014 Why the gold exchange standard was a costly way toattain international equilibrium
5015 Major characteristics of today's gold exchangestandard
5016 Description of the adjustment of payments imbalancesunder the post-1914 gold exchange standard
5017 Major benefits derived from today's gold exchangesystem
5018 Major costs imposed by today's gOld exchange standard
5019 Main purpose of the International Monetary Fund (IMF)

SEGMENT 91
5032 Definition of "depreciate" and "appreciate"
5031 Distinction between an import tariff and an importquota
5034 Impact on expenditure patterns of a subsidy on allexports
5033 Impact on domestic spending patts.trns of a tariff onimports
5038 Impact on U.S. income of a U.S. subsidy of all exportsand a tariff on all imports or of a depreciation. ofthe dollar
5037 Impact on the balance of payments of depreciation ofa country's currency or a subsidy on all exports anda tariff on all imports
5035 Effect of depreciation of the dollar on U.S. exportsand on the income of U.S. exporters
5036 How depreciation of the dollar would affect U.S. importsand the income of producers of substitutes for U.S.imports
5039 Effect on the balance of payments and on employmentof a reduction in tariffs and quotas on imports andof reduction in subsidies on exports, or the effectof appreciation of currency.

SEGMENT 92
5020 Description of a "flexible exchange rate system"
5021 Relationship between the supply and demand for acountry's currency, the supply and demand of foreignexchange in the country, and the supply and demand forexports and imports
5022 Why, under a flexible exchange system, the price offoreign exchange must always converge to its equilibriumrate (where supply equals demand)
.5023 Major costs which would be imposed by a flexibleexchange rate system
. 5024 Major benefits of flexible exchange rates

SEGMENT 93
5055 Impact of a tariff on the import of a particulargood
5056 Statement which indicates which is to be preferred --a tariff or quota, and why
5057 Reasons why a subsidy on the output of a particularindustry is better than a tariff designed for the solepurpose of protecting that same industry
5058. Use(s) of tariff for revenue
5059 Use(s) of tariffs to eliminate unemployment

SEGMENT 94
5040 Impact of a decrease in government expenditure, anincrease in taxation or a contraction of the moneysupply on national income and the balance of payments
5041 Impact of an increase in government expenditure, adecrease in the level of taxation, or expansion ofthe money supply on national income and the balanceof payments
Policy tools to combat both a balance of paymentsdeficit and overfull employment which is causinginflation
5042
5043 Policies to combat both a balance of payments surplusand over -full employment
5044 Policies to combat a balance of payments deficit andunemployment
5045 Policies to combat a balance of payments surplus andunemployment

APPENDIX F
Excerpt from TR-5.31,
"Preliminary Tryouts: Economics Course"

POOR ORIGINAL COPY -. BESTAYMARA AT TIME FILMED
Preliminary Tryouts
The purpose of this document is to describe the preliminarytryouts of materials, including the materials revision process.Discussed in detail are the characteristics of the students in-volved in the trials, the gauging of each one's reactions to thematerials, the analysis of errors, and the preparation ofrevisions. Samples of forms used in the revision process, aswell as examples of actual revisions, have been incorporated inthis document. The preliminary tryouts arc one part of materialsvalidation and provide the first indication that students canand do learn from the materials/ as well as an indication ofpossible problem areas.
A. Target Population/Student Population
.. . Students participating in the preliminary tryoutswere Selected on the basis of their similarity to theAcademy midshipmen. The following criteria guided theirselection:
1.. Males, ages 19-232. Enrollment in college - preferably juniors3. Major - preferably engineering4. No previous college economics courses5. College Board scores, both Verbal and Math,
similar to those of the Academy midshipmen6. Willingness to complete the entire course,
including tests
The young men chosen for the tryouts are all between theages of 19 and 23. 'Each student is currently attendingone of the three local universities; namely, GeorgeWashington University, Georgetown University, andAmerican University. On the average, they are juniors,and their majors include engineering, psychology andEnglish. Like the Academy midshipmen, none has had acollege course in economics, and their average SATVerbal and Math scores are similar to the mean SATVerbal and Math scores of the midship=n. As evidenced
- by their continued, conscientious efforts and the factthat over half of them have completed forty segments/the students appear willing to complete the course.

B. Tha Tryouts
I. Orientation
The first session for each student consisted oforientation to the course and to the self-instructionalmaterials. Self-instructional packages were displayedand explanations. of the various parts of the S-Imaterial were given, such as the rationale for includingproblems in the materials (see Figure 1) and for givinga self-test (segment test) at the end of_oach segment.(see Figure 2).
Copies of McConnell, Samuelson and Bachl weredisplayed and explanation of their use in the coursewas given. Figure 3 shows two practice problems andindicates how they are directed to related texts foradditional explanation, if difficulty with the materialis encountered. In preliminary testing requests forfurther explanation were documented and considered inmaterials revisions:
An example of how related texts are referred toin prescriptions is shown in Figure 4. Note thatthen". prescriptions are part of the segment self-test.As in the case of the practice problems, if a studentin the preliminary tryouts stated that he needed help(such as from the references specified) it was
. documented for use in planning revisions.
POC!;''.COPY. BEST
A fic r TIME FILMED
01
1 McConnell, Campbell R. Economics, New York:McGraw-Hill Book Co., 1966.
Samuelson, Paul A. Economics, New York: McGraw-Hill Book Co., )967.
Bach,'George L. Economics, Englewood Cliffs,New Jersey: Prentice-Rall, Inc., 1968.
-2--

:
Now recall the elements of this equation byanswering the questions below. First set yourDymedia at."v."
1. In the consumption function C=Ca+bY, thesymbol bY stands for:
a.' The intercept with the Y axisb. Autonomous consumptionc.. Induced consumption
Total consumption
2. .In the consumption function C=Ca+bY, thesymbol Ca stands for:
a. Consumption resulting from changesin income
.b. Autonomous consumption
.c. Total consumptiond. The intercept: on the x axis
POOR ORIGINAL COPY -BESTAVAILABLE AT TIME FILMED
Ficiure 3.. Example of a practice problemsequence included in the instructionalmaterials for an objective.
-3-

Segment Test(23)
the learning materials in this segment and (2) your. instructor may use the information as the basis for
recommending future learning materials. After you havecompleted the test, please fill in the Student CritiqueSheet and turn it in to your instructor along with yourDymedia cards.
.
Dymedia to 4
Below are several questions based on the materialyou have just studied. You should not need more thanabout ten (10) minutes for this test. Set your Dymediato setting J and be sure to insert a record card. Youwill not be graded for your performance on this test;however, you must turn in your Dymedia card to yourinstructor because `(l) your performance will be used bymaterials design personnel as the basis for improving
kg
1. "Which of the follow.
ing is equal to MPS?
a. Difference between consumption and savings dividedby the change in income, or 41C -4S
AYb: Slope of the consumption function, or AC/ZSYc. Slope of the savings function, or IS S/A Yd. Change in the slope of the :,avings function, or
bS /t Y
3.
Which of the following is equal to MPC?
a. Slope of the savings function, or itS/a--b. Slope of the consumption function, or 4C4yc. .Difference between consumption and savings over the;.change,in income, or AC -AS
d. Change in the slope of IK-MPC function, or&eNC/may. .
Figure 2. Example of the type of instructions that.precede the test items in a segment self-.test.
LASPOOR ORIGINAL COZYMAKABLE AT
TIME Raiff)

Be certain you can identify savings. Check yourself1on the following questions.
3. The residual between disposable income receivedand money spent on final goods and services.isa definition of which of the following?
a. Transfer paymentsb. SavingsC. Total assetsd. Taxes
4. Which of the following correctly define (s)savings?
a. Stglit-C
b. Leftover disposable income after consumptionC. Disposable income not consumedd. All of the above
If your understanding of "savings" is still fuzzy,reread the above materials. For further explanation,see McCunnell, 119.
POORORIGINALCOPY-BESTAVAILABLE AT TIME MINED
Picture 3. Example of how students are directed torelated texts if they encounter diffi-bulty with practice problems and wantfurther explanation.
-5-

I
Segment Test 22
Prescription
If you missed any of the questions, it is stronglyrecommended that you review the material for theappropriate objective in this segment, and then checkthe references given below before you attempt furtherwork in this course.
question Contents Reference
1 .Definition of consumption Seq. 19, Obj. 1704Seg. 22, Obj. 1510McConnell, 165-6
2 Definition of savings Obj. 1504McConnell, 119
3 Identification of a savings Obj. 1594function graph McConnell, 220-2
Samuelson, 200-03
4
Figure 4. Example of how students are directed torelated texts if they encounter diffi -culty in the segment self-test.
-6-

Students were then sho..:m the Dymedia ResponseBoard and after some instruction proceeded to useit by attempting to answer a problem in the S-1 material. .
This demonstrated to the student how he receivesimmediate feedback when answering questions. Subjectsthen filled out the Dymedia cards. They were cautionedto be sure to record the time it tool: to go through asegment, and they were instructed to work at a steadypace. These records of time needed to complete a segmenthave served as the basis for a fair estimate of thelearning time required for each package.
Following the presentation of the methodologyof using the self-instructional materials came anexplanation of the use and importance of the student'Critique sheets, and the rationale for pre and posttests.
Throughout the orientation subjects wereencouraged to ask questions. They gave evidence ofenthusiasm by their impatience to get on with thepretest.
This format for orientation became the prototypefor the Academy orientation.
2. General Procedures
Each student learns the segments in sequence.This includes enrichment as well as core segments.Whenever segments are available on audio tape withworkbook, some students use this medium. Each proceedsat his own pace, and in general the followingprocedures are used.
The student receives an instructional package,the Student Critique Sheet, and the Dymedia ResponseBoard and cards. He proceeds to an appointed class-room, studies the materials, and takes the SOmentTest: Next, he fills out the critique sheet, andfinally, he returns the instructional materials, Dymediacards and critique sheet to the interviewer. Beforecontinuing with the next segment, he is debriefed by astaff member.
3. The Debriefing Interview
The purposes of the debriefing interview are:
a. To determine the general reaction tothe materials,
b. To determine exactly what a student. moans by his comments,
C. To discover the student's reasoning,when he makes an error,
-7-
POOR ORIGINAL COPY-BESTAVAILABLE AT TIME FILMED

d. To counsel the stuaent concerninghis progress and to prescribe remedialmeasures,
c.. To obtain information which .can serveas a, guide for revisions.
Remarks made by students during the interview arerecorded on the student critique sheet. For example,when a student has rated a segment as very good, itis essential to find out what in this particularsegment made it more appealing to him. Comments suchas, "The graphs helped," or "I liked having all theproblems in the segment related to one situation," giveclues for improving other segments. If a student hasremarked that an' explanation is not clear, then theinterviewer questions him in an effort to determine whythe explanation is not clear. It sometimes happens thata poorly constructed sentence is the cause of the:ambiguity. The Studcnt Critique Sheet points outproblems, and the interviewer seeks to find out thereasons for the problems.
The interview also serves as a time for counselingand prescription. After the student has completed each.unit or post test, his work is checked by the inter-viewer who discusses with him his test score, hisstrengths and weaknesses, making recommendations forremedial work. A student whose errors indicate thathe has not mastered the objectives for a segment2 isasked to rework that segment. Whenever possible, thesegment is given in an alternate meaum. The prescriptionmay consist of advising the student to continue withthe next segment. Should that be a segment devotedto testing, then the student is encouraged to spend anhour reviewing those segments included in the test.
To reiterate, in the student tryouts each subjectstudies the materials in sequence (as do the midshipmen),takes the test-and criticizes the materials, frequentlyoffering suggestions for improvement. In an interviewfollowing each segment he is encouraged to explain indetail his critique,, and any additional comments arenoted. The comments and suggestions for each segmentare collected and form the basis for any revisionswhich may be made.
. 3
R
1;4" 2 A segment requires approximately one hour of learning
0 time and consists of material pertaining to a group9M . of related objectives. A segment .is usually one part
0 a of a larger topic.
..8...
.

C. The Revision Process
Revisions arc made in order to facilitate the learning'of objectives and to improve the items by which thelearning is tested. Although the number of students par-ticipating in the preliminary trials is small, it cannotbe assumed that every error automatically requires a revision,but it can be assumed that every error requires that thematerials be scrutinized to determine whether revision isindeed necessary, and if so, how extensive it should be.
After six students have completed a segment, revisionof the material is begun. There are five steps in therevision process.3
The first step in the materials revision process isto record errors on Form B, the Segment Record, (Appendix A).Errors in both the learning problems and self-test, alongwith the correct answer are tallied. In order to identifythose objectives which have not been learned, theidentifying number of each objective is noted. Whenevererrors are recorded for an' objective, in both the learningand the self-test columns, that objective is flagged forimmediate attention.
From the sample Form 13 for Segment 9 (Appendix A), itis apparent that five objectives have been flagged (boxedand labeled A, B, C, etc.) indicating that students missedboth the problems in the learning materials and the relatedquestions in the self-test. Form 13 for Segment 9 alsoreveals according to the error tallies that students havenot learned other objectives; whereas, Form B for Segment 23shows only three possible areas of revision. Students findsome materials more difficult than others.
Step 2 of the revision process consists of reviewing. the Student Critique sheets (see Appendix 13) 8 includingthe interviMer's remarks, to ascertain as precisely aspossible the causes of the difficulties experienced. Inthe case of Objective 0833, Segment 9, students indicatedthat the explanation was not clear and that solving moreproblems might help in making the principles clearer.One student suggested underlining a word to emphasize it.In each case, the comments are noted on the Summary Sheetfor Suggested Revisions (Appendix C).
In step 3, the content for each objective and testitem which has caused some difficulty is reviewed in an
3 The revision of the audio tapes follows esfientiallythe same steps as those in the revision of theself-instructional packages. However, in general,the former revisions are made after two students
.have tried out the tapes.
.9.

o1
2
effort to determine the validity of the student reactionand also what revisions, if any, are necessary. Readingthe material for Objective 0833, Segment 9, revealed.that the explanation contained contradictory statementswhich were indeed confusing. Moreover, the main pointof the objective which was crucial to answering correctlyboth problems and self-test items was not emphasized.Both these facts were included on the Suggested RevisionsSheet. Sometimes the ;.aview of content indicates norevision is necessary, and this, too, is noted on theRevision Sheet.
Step 4 consists of making changes in light of thesuggested revisions. Vhenever a major revision, such asthe rewriting of content or the addition of problems isnecessary, the Summary of Suggested Revisions Sheet isgiven to an economist who makes the improvements. To datethe students have experienced little difficulty with theself-instructional materials, and few revisions have beenrequired. In the case of the above-mentioned Objective 0833of Segment 9, the summary of the objective was enclosed ina box (Appendix D) and an economist rewrote the explanationtO.euphasize the unpredictability of the situation. ForObjective 0835 a less complicated problem was inserted as426, and 26 became 27. In some instances, the economistmay decide to change the distractors in a question. Minorrevisions such as underlining a word or reconstructing a"claUse in a sentence are made by ETC personnel.
The final step in the revision process is trying outthe revision. Generally, one or two students take therevised segment, and then, the same process of critiquingand interviewing is followed. As yet, there has been noneed for a sedond revision; however, should the trialsreveal that students still do not learn effectively from.the revision, there would be additional revisions, as timepermits. The revised materials are then duplicated for theAcademy.
D. Results
To date the students involved in the preliminarytryouts have indicated that they find the instructionalmaterials very good. They like the format and the idea ofself- pacing. The logical organization of the material hasreceived most favorable commendations. Moreover, thestudents claim this is a key factor in their ability tounderstand and to remember the objectives.' The subjectscontinue to be amazed at how well they remember definitionsand principles without making a concentrated effort tomemorize. According to these students the problemsaccompanying each objective enable them immediately to apply

what they have learned and this 'immediate applicationstrengthens learning. The use of bymedia to giveimmedickte feedback concerning the correctness of,responses continues to evoke enthusiasm. The self-testChallenges them, and being able to discover specificallywhat has not been learned well to that point affords anopportunity to restudy specifically these points.Students have remarked that this is an efficient way tolearn.
.
The preliminary tryouts by students similar to the.
,
Academy midshipmen not only have provided informationnecessary for revision but also have proven that studentsdo learn economics by studying the materials.
1
Foos°MONA COPY -UST
AVAIABLEAT TIME titMED
. . .
,
elm
1

APPENDICES
TR-5 . 31
POOR ORIGINAL COPY - BESTAVAILABLE Al TIME FILMED
1:111'ATI (INA 1. Tr.1 1 I N01.04 :y (14NTI.:1? ..-.-----.

rot,itt.d &sive!? rieciatc, I Rece, rti I 0 rril
sr.:kit:v:11A)4.1t
A 13
1
2
3
4
5
6
7.7.77r,
raims.m. 4.
ow
14............
A...11
la
.41W.RAltaa24:40,&:
raj'1 14.
fr$13Int% Jillti
L2f
2%.fez.2i
firittilis7.1014W3i,
W11100.COMo.....
0
46.D
Oz 141Ant lizr'.14./:.:4 '11/Aei.. Sr.: f t I
1/
C
.1 w
..........
DO
....a......
.=m
._D
........
... T,mmir........ ...I;
(21... .....
J,01.0..10 E.11...AIARAIWI.M.1 ,...1,
0 0....C,a..'
...wlwsr,N.1.1011morkr ..FtAromme
O
0
000
AVAI-21..4E6T I
AT TIME FILMED
1PIrk!.

zetc, orci.7. oz. same rtuel7v 1:41. f st;641tint. I:f2y:
L VIA 1: A I II A 1 II C P.C:3 .
1c
2
3
4
5
6
7
9
10Aft311 to,
12
13
14
16
-18
20
21
2Z-23
25
2
- ...-......-
.......
6
Acre
44
lo
a
...
Pa.
74
L. :............ ............0 **PO ........ a
.10 .I

Student Critique Sheet
Segment Materials and Segment Tests
Content
1. Were the generalinstructions clear?
2. Were you aware at all timesof what you were to learn?
3. Which explanations were toowordy?
4. What word meanings, con-cepts, mathematicalrelationships, or informa-tion should you have had asprerequisites to learningthis material?
S. Which directions for workingproblems were ambiguous?
6. For which objectivesdo you need more problemsto solve?
7. Was it necessary tomemorize much informationin order to complete thesegment successfully?
8. What explanations orproblems are unnecessary?
9. What explanations wereambiguous or diLf-Loalte_understand?
10. For which objectives wasit necessary to study theadditional references?
46".rI, IC
:1,1 4''.
110...
40
*.Yes
235
11,14: ere, et. (
'7Segment Number v6&-
Student Number _747'4,4
No orNone
Questions, Comments, SuggestionPage Numbers, Etc.
/le ti° re-,. e ....4
POOR ORIGINAL coPr BestAmtemsAN Mft NNW'

1.
12.
13.
14.
15.
1.
2.
4.
5.
6.
7.
8.
9.
Was the learning organized?
Did the learning flow inlogical sequence?
What diagrams, tables orcharts were difficult toread?
What typos did younotice?
Where yol able to completethe learning segment in45 minutes?
SEGMENT TEST
Which diwtions were notclear or\fila4equate?
LS
Which questions failedto state exactly whatwas required?
For which questions didyou "psych out" theanswer?
For whichyou guess
questions didthe answer?
For which questions wereyou able to determine theanswers from informationgiven in another question?.
For which questions didyou find two correctalternatives?
In which questions did theformat cause you difficulty?
In which questions were thegraphs, tables or diagramsdifficult to read?
Which items tested you oncontent not included inthis segment?
YesNo orNone
Questions, Comments, Suggestions,Paye Numbers, Etc.
,4 ft ,:e an/
r.
PooRCOPY.BEsrAVAILABiE
AT rimEFILMEV
I

Which answers did youchange?
Why did you change?
II. Did your performanceon the segment testindicate that you hadlearned?
YesNo orNone
Questions, Comments, Suggcstions,Page Numbers, Etc.
inctiler.*/44(:- K4)(fe, //
el/la:4e /4
12., How would you rate the segment you have just finished? Compareit with other segments you have learned; Check the generalcategory. The descriptive phrases are there to help you decideon.a rating.
Poor Pair
4 can't learnfrom this.
Boring
Turns me off
Too much work
4
Good Ver Good Excellent
Boring inplaces, butgenerallyok.
Sometime's itturns me off
Too muchreading, butI learn
It's neitherbetter norworse thanothers.
the
Acceptable;. so-so
Takes a lot oftime, but Ilearn.
An improvementover the usual
Turns me onsometimes
It requires alot of readingbut I learnmore than froma text book.
It helps meto knew thatI got theanswers
Notjoljagatua.
Really turns meon
Learn a lot withnot too much trol.:
Would like all mycourses like this
Not at all boring

Student Critique Sheet
Segment Materials and Segment Tests
Content
1. Were the geneialinstructions clear?
2. Were you aware at all timesof what you were to learn?
3. Which explanations were toowordy?
4. What word meanings, con-cepts, mathematicalrelationships, or informa-tion should you have had asprerequisites to learning.this material?
5. Which directions for workingproblems were ambiguous?
6. For which objectives'do you need more problemsto solve?
7. Was it necessary tomemorize much informationin order to complete the,segment successfully?
9. What explanations orproblems are unnecessary?
9. What explanations wereambiguous or difficult tounderstand?
10. For which objectives wasit necessary to study theadditional references?
Yes
V
Segment Number 47
Student Number 3
No orNone
Questions, Comments, Suggestion.Page Numbers, Etc.

f Was the learning organized?
12. Did the learning flow inlogical sequence?
13. What diagrams, tables orcharts were difficult toread?
14. What typos did younotice?
15. Where you able to. complstethe learning segment in45 minutes?
SEGMENT TEST
1. Which directions were notclear GIN%adequate?
2. Which questions failedto state exactly whatwas required?
For which questions didyou "psych out" theanswer?
4. For which questions didyou, guess the answer?
5. For which questions wereyou able to determine the'answers from informationgiver in another question?'
6. -For which questions-didyou find two correctalternatives?
7. In which questions did theformat cause you difficulty?
S. In which questions were thegraphs, tables or diagramsdifficult to read?
9. Which items tested you oncontent not included inthis segment?
Yes
V
No orNone
p1
Questions, Comments, Suggestions,Page Numbers, Etc.

Which answers did youchange?
Why did you change?
11. Did your performanceon the segment testindicate that you hadlearned?
YesNo orNone
Qees Lions , Comments, Suggestions,Page Numbers , Etc.
12. Row would you rate the segment you have just finished? Compareit with other segments you have learned; Check the generalcategory. The descriptive phrases arc there to help you decide.... ,., ,........w.
Poor Pair Good Very Good./
Excellent
7 can't learh Boring in It's neither An improvement Really turns,:rom this. places, but
generallybetter norworse than the
over the usual on
Boring ok. A others. Turns me onsometimes
Learn a lot wnot too much
Turns me off Sometimes it Acceptable;turns me off. so-so it requires a Would like al
Too much work lot of reading courses likeToo much Takes a lot of but I learnreading, but time, but 1 more than fromI learn learn. a text book.
. Not at all bo..
. It helps meto know thatI cot theanswers
Not so boring
.
. ..
e
ithtro:a
1 mythis
inc,

%plea:(ivt.+No. r vi9o.
. ."1 .f(
11
541(7 ei.;;;?:311Z, d
i.$(11i11/10:3
e`f 4 ,oe:"J,ay:(010t
Irt.te I ..../Z:262.
1) 1:7 1: (e
7 t-%
Its- :4/ 4... 4;' e. i'.?" ett
-2 A^ 1 .1. .
,A;-0.- .t..si rri.t., ft., at - 1" :-/--- ..:-.(4'-...,:-%:*1:-. -.2W4i':7'.<.7,;(7;..
t .49,,/,..' .,:e.,.;,. .%.: --"."- .:: 45:7;:..f.Z.l..e.p.f., ..Z...e.%:,. ..".... t. e; .;-zr-ji 0
/ ;,,...4..t. ,,,,,,. ,...:-;.4.../I. (......, fe f.. ri I ".. ;.; ''',..,.., ,c, .41.1 ...:...
, ,., e, ,
a2:,-elLZ :.112!.:S. lAdA /7 e". (.... 1.1..e..; i...f .". ' ! '''.' .N A.l..'. ?t#...e. 4.. " 4 . 0' :
. , .,./..... .....,/.7....4 ,
zi i . A A. ./. . , , ,,,, . .. , /..---;.,,.G.....:... ,:. P. . :..*. *.,., ; ;,, ...s ....XX .e.! . t. .,..... c..:-.. 1..... .
67,4q...i..0 -1:- f A e ....eZz ...,...:(:.:. -::..A..: .....f,......s..r....<,..:, .,::...e...,..., 4...!.:::.c.. :..4 ,
3
frI.) I.
t ,4 A C., -tt
' t
vr: hei-s
/f ".14
/
. . :.? .-; /
I e : .
64.0:4 et 14.e.", fee ,e4; Az" :1 "
e aA./' ?f: f1 /I/ e*/;*/ % :=".
f?"/.
POOR ORIGINAL COPY-BESTAVAILABLE AT TIME MIMED

. e.0.230017f';
Okleciem 0, larict.::.. . 1
_i
ail.- cte_ ii. iel". 6
, e7}Se(a rie.c.r.,,,-1 IlVt/t4tP,ic,f, (... ,..
6 tt 1:21:10/;:it.
.L.
s'
/4-I
511ccicirbPlz.ti6n
,....,£1.1i4"141-41 l 7e7r1
....
vif :.!.-d - !::: , .-,' :'It- .*';-.tt, 11? ,/ :.-.: ;-/ -:.:( (e-....i.v ee /A,- / ,:, ., .e. %.
( i '.. , .
9;:Aa, AY x:-.1-/ I''..t. !.,. td (ha,v,,,x(i,?..;-4,6. ,-,n.e..--zie x-f.,4 4-.%4;ere;e: 0.6_,44. ert ---/ .. ,, 6,
444,.i.d..c,fee, 04 .C4-4:41.(1. vt:44:.;;.31- 1.24.4fts 14, a4,74,tt ;,,,:.,./...4 1,t ...4.= -.41a; 4.0-t.' if:t.,0-12 a.-.c C. ci 1...4".-4..e.Z stieeleC.444--5;, I
.1
POOR ORIGINALCOPY- BESTAVAILABLE
At TIME FILMED
I

Set oe,--*11/:-, qr-?":0111,5--2:4
LSO i:PaYna
S713 1;1 e2S.......-'=
4.4.
5
yosiiCN t . ..*11. *NO,
wormy=01.1--
(1:40 0 ti eert. /if (Tit Y r" ..".6 (J.::c r
;;4' I.) 1,11')'141:.11/. *ri bd":-ef.r.'''eY 1'64 44 AP(2)...i*
1
/7..;/), - fis,:reettez..v:
e'137"
POORORIONAL
COPY-BEST
AVA/14816AT TIME rue,

I
.
?±S.014/ sive
**4110'j 7"4/04/ SVPI
ii004
, 40'0 1,11.1/ .7( Olt
....1 ,er.. sw..ms........ rr..uo..N.III1"".."''t..... .../. '4. 0A 4° ! 4.; ;:a .
.
*it ttor,7,71) ,,Alrotr .................................--....2:::-.. C Y43 I Iti(
Z.) t atiVe stAt.
. e7rz;Z):d:11)S1
F/..-M14) it/1k: cyn., 41; 4 C ; 4." * -,1
(90;'(:::"1,

00cS
LAO. 0 08331 How do Expectations Ahout Prices Affect Currant. Supolv?
Anticipation of future price changes will often cause changesin current supply, but it is difficult to predict precisely whatsort of changes.
Consider how expectation of an increase in price might affectthe present supply of tires. (Remember that "supply" refers towhat producers place on the market, not necessarily to what they havein their warehouses.) A tire manufacturer might withhold partof his current stoex of tires from the market, hoping to sell themlater at the higher price and thus reducing, the current supply oftires. or he might decide to increase production and put more tires.on the market right away, thus increasing_ the current supply of tires.(He might take this latter course to ba sure that a large suppl:of his tires were available to the market from the very firstMoment of a price increase.)
'It should be noted that in either event supply will beincreased eventually, i.e., at the time the price increaseactually occurs. What is not certain is what happens to thecurrent supply when a price change is antrcipated.
Now test yourielf on two questions.
22. Bob expects the war to cut back the importation ofgood A. Bob, who produces good A domestically* figuresthat the price of good A will rite in the future. Whatwill be Bob's reaction in regard to the supply ofgood A?
a. Bob will supply less now but more later.b. Bob will supply more now but less later.c. Cannot predict without further information what
Bob will do.d. Bob will not change his current supply.
23. Jack, a manufacturer of radios, expects a flood ofJapanese radios to decrease radio prices. Jack will.probably
-
a. Not change his supplyb. Supply less at the present timec. Supply more at the present timed. Cannot predict without further information what
Jack will do
If the correct responses are not very clear to you, rereadthe above explanations and also consult:
...- McConnell, pp. 66-70Samuelson, pp. 61-63
c,

4
L2bj, 00331Row do Evectations About PKiCOS Affect Current Supply?
,tC JAL Ailtiefpation of future price changes will often causechanges in current supply, but it is difficult to
,.................Ylpredict precisely what sort of changes.
Consider how expectation of an imminent increaso in pricemight affect the present supply of tires. (Remember hat "supply". refers to what producers place on the market, net necessarily, towhat they have in their warehouses.)
A tire manufacturer would most likely withhold part of hiscurrent stock of tires from the market, hoping to sell them laterat the higher price. Thus, an expected price increase would tendto reduce the supply of tires, shifting the supply curve upwardand to the left.
I It is possible, however, that the tire manufacturer mightincrease his current supply of tiros to be sure that a largesupply of his tires would be available to the market from theVery first moment of a price increase. In this case, his supplycurve would shift downward to the right.
Thus, we cannot predict precisely how supply would-changein anticipation of future price changes.
It should be noted thatin either event supply will be in-creased eventually in response to an expected price increase, i.e.,at the time the price increase actually occurs. What is not certain iswhat happens to the current supply when a price change is anticipated.
Now test yourself on two questions.
22. Bob expects the war to cat back the importation of
good A. Bob, who produces good A domestically,figures that the price of good A will rise in thefuture. What will be Bob's reaction in regard tothe supply of good A?
a. Bob will supply less now but more later.b. Bob will supply more new but less later. _
C. Cannot predict without further informationwhat Bob will do
d. Bob Will not change his current supply.
23. John holds 100 shares of General Motors stock. Afavorable merger is announced and he expects theprice of the stock to rise sharply. John willprobably.:
a. Sell his stock immediatelyb. Sell his stock after the price risec. Retain his stock in anticipation of
the price rise(1. Cannot predict without further information
what John will do
If the correct responses arc not very clear to you, rereadthe above explanations and also consult:
MeConne11, pp. 66-70ent..tte.lr^t1 r.%

APPENDIX G
Excerpt from TR-5.35,
"Preliminary Validation Report
for Multi-Media Economics Course"

PRELIMINARY VALIDATION REPORT
Introduction
The purpose of this document is to report the results thus
far obtained from analysis of the data received from the vali-
dation tryouts of both the materials and tests for the Multi- -
Media Economics Couise. Of.necessity, since the course ended
so recently and all the data have not been available, the
results arc incomplete and are limited to core materials and.
selected tests for Concept Areas and Hence, some of
the figures reported herein may be substantially altered when
additional data only recently received are included.
The amount of learning which has taken place, in terms of
objectives learned, the time required by students to accomplish
this learning, and the percentage of students achieving this
learning are included. Some findings relative to item diffi-
culty and test reliability are also reported. Data used in
these analyses represent the performance of a group of students
at the USNA as well as that.Of a group of students engaged for
preliminary tryoUts in-house.
POOR ORIGINAL COPY -BEST
AVAILABLE AT TIME FILMED

Validation o5 Course Materials
Validation of the couzse materials rests on thb answer
to tee question, "Have the students learned ?" More specifically
validation answers these questions:
1. What percentage of the course objectives have beenlearned by what percentage of the students whohave studied the materials?
2. Does this learning represent an increase inknowledge over what was known prior' to studyingthe materials?
The number of objectives learned has been measured by student
performance on unit and post tests; whereas, learning gain is,
the difference in performande on pretests and post tests.
Pretests and post tests contain only criterion test items
for the terminal objectives of each segmerit in a concept area.
Data for this report were obtained from student performance
on the 'pretest and post test for Concept Area I and the same
two tests for Concept Area II.
Concept Area
Pretest 2 and Post test 16 are mace up of criterion test
items for 15 terminal objectives of Concept Area I. Since
-a terminal objective in Concept Area I has an average of 8
-enabling objectives supporting it, the 15 terminal objectives
represent the learning of a total of approximately 135 objectives.
Analysis of student performance on Post test 16 indicates
that more than 90 percent of all students who studied Concept
Area I of the Economics course had learned 75 percent, a total
P6ORCWIGINALCOPY:Bga
-2- AVAILABLEAT 11/41 FILMED

of approximately 101 of the objectiVes; about 78 percent of
these same students had learned 80 percent or approXimately a
total of 108 objectives, and 13 percent had learned 90 percent
or d total of approximately 121 objectives. Table 1 gives the
above information for each group of students, i.e., the
Midshipmen and the In.- -House students.
The above data do not necessarily represent new learning'
or one Of the purposes of Concept Area One is to call to the
student's attention certain basic economic facts with which he
may have been familiar from.previous experiences, but with which
he must be very familiar for this particular course. The mean
of Pretest 2 for all students, an alternate form of Post test 16,
is 5 terminal objectives; therefore, any student might have
-known an average of 5 terminal objectives, leaving him 10
new terminal objectives to learn. (There are 15 terminal objec-
tives in Concept Area I.) As indicated by the difference in
performance on Pretest 2 and Post test 16, the average gain for
all students was 7 out of 10 terminal objectives (70 percent
gain) or a total of 62 out of a possible total of 88 objectives.
TheUSNA students showed a slightly higher gain, 80 percent,
70 of a possible 88 objectives, or 8 of.10 terminal objectives.
Concept Area I represents the first three weeks' work in:
the course. During this period students had to adinst to now
materials as well as to a new approach to learning, and the
Post test served not only as a test of learning of economics
POOR ORIGINAL COPY-.BEST '--3-AVAILABLE AT TIME 'two

TABLE 1
Concept Area
Terminal Objectives Learned by Student Groups
in Percentages
USNA In-NOuseObjectives Students Students
90 - 12.5 13
80 80. 75
75 90 98.
ti
TABLE 2
Concept Area 11.
Terminal Objectives Learned b' Student Groups
in Percentages
ObjectivesUSNA
StudentsIn-HouseStudents
90 58 29
85 60
.80 90 100
.75 ..100 100
POOR ORIGINAL COPY - BESTAVAILABLE Al TIME FILMED
-4-

but also as a test of how effectively each hud adjusted to
the use of the new approach.
Concept. Arca II
.Pretest 18 and Post test 40 consist of criterion test
items for 37 terminal objectives of Concept Area II. Inasmuch
as each terminal objective in this concept area has an average
of 6 enabling objectives supporting it, the 37 terminal objec-r :1 ..
fives reprebent the learning of a tdtal of approximately 259
core objectives.
Analysis of the data from Post test 48 indicates that 100
percent of the students learned 75 percent of the objectives,
or,approxiamtely 194 of 259 objectives; about 92 percent of
all the students learned 80 percent or approximately 207 of
259 objectives; 84 percent of all the students learned 85
percent of all the objectives or about 220 of 259 objectives;
53 percent of all.the students learned 90 percent or approxi-
mately 233 of 259 objectives. Table 2 gives the above informa-
tion by groups of students.WO
fiord much new learning took place is represented by the
difference between student performance on Pretest 18 and on
. Post test. 48. The analysis of Pretest 18 gives a mean of.8,
signifying that any student could know an average of 8 of 37
terminal objectives in Concept Area II. This would leave 29
new terminal objectives or approximately 203 objectives to be
learned. The moan gain wis 25 (about 85 percent) of a possible
29 new terminal objectives or roughly 175 new objectives learned.
-5-

Student performance improved in Concept Area II seemingly
over that in Concept Area I....
i
learning Time
Learning time on a per segment basis varied widely among
the students. The range of learning time per segment in
Concept' Area 1 among the midshipmen was 18 to 75 minutes, with
a median of 50 minutes, while the range for in-house tryouts..:
. was 18 to 79 minutes, with a median of 30 minutes per segment.
in Concept Area I.:
L
For Concept Area II, the median learning time per segment.
for. USNA students was 30 minutes, with a range of 15 to 58
minutes per segment, while the range for the in-house students
itas 21 to 83 minutes per segment with a median time of 35
minutes. The learning time reported is for the self-instructional
package only.
Validation of Tests
Validity refers to, the faithfulness with which a test. .
measures what it purports to measure. Validity includes both
reliability and practicality.. .
Inasmuch as all test items in the Economics course are
criterion referenced (the item paraphrases or is written in
language equivalent to that of the objective), each item has
content validity. The items were judged valid by senior economists
from both the Naval Academy and Sterling Institute. Moreover,
-6-.

these iteinc wore judged as to validity. by the economist-writers
who prepared the materials. In addition, the, in- house prelimi-
. nary tryouts have shown that he items test.the objectives.
The tests are practical in that they are easily admini-
tered and scored, and it is possible, based on his performance,
to prescribe remedial work designed to help an individual
overcome his unique problems.J
1
I Some statistical evidence of the re).iabiltiy of some of
the tests has boon. obtained. When reviewing these coefficients
of reliability, the smallnesis of the sample size must be con-
sidered. However, using KuderRichardson Formula 20 reliability
coefficients of .63, .79, .91, .66 have been obtained. The.
analysis of tests in terms of reliability has only just begun.
Some studies of the level of difficulty of the items -
have also been initiated. Of some 170 items studied, approxi-
mately 88 percent have a level of difficulty of .80 or above.
For the purposes of this course such a low level of difficulty
is desirable, for theoretically every student should be able
to pass every item; hence, every item theoretically would have
a level of difficulty of 1.00. Similarly, the discrimination
index is low, and in many cases there is zero discrimination.. .
. :
Theoretically, this is desirable for all students should be
ablb.to pass every item in a course such as this.
As the materials are revised, both test items and tests
are also revised. Those items which indicate a high level of

difficulty or negative discrimination pr other .problems will
be carefully studied for defects and revised as indicated.
Although analysis of data is not completed, there is
some evidence that both the materials and the tests are valid
for this course.
1
,
POOR ORIGINAL COPY. UVAVAILABLE AT TIME PRAM .
I
I

APPENDIX H
Internal Memorandum #87-R,
"Explanation of Materials Revision
Process Based on Empirical Results"

1NMMAL MLWPAODM CV-A
POOR ORIGINAL COPY. UVkimoitioiDuri ,AVAtABLE AT TIME Fnmv
April 23, 1969
TO: Economics Project Staff
MIMI: E. W. Pitmpatrick
. SUBJECT: Explanation of materials revision process basedon empirical results
X. Purpose and Scope
'As you know, we are beginning the process of revisingmaterials based on validation data from the Naval. Academy.This memorandum is intended to document the proceduresthat affect the individuals who are actually making therevisions. There is no intention of describing some ofthe statistical analyses which will be done or of dis-cussing the inds of reports about the validation resultswhich we will be submitting. This memorandum should beof most use to the revisors, who will use ,the: revisionprocedures discussed, but will also serve as a generalexplanation for those team members who will need tococadinate their work with the revinorsi activities.
XX. Background Notes
A. The Data Problem
One of die problems we have had to contend withduring the validation tryouts at the Academy is not knowingif .students actually studied all of the material beforetaking a segment, unit,' or past test.1/ Another problem isthat we do not know, for sure, how long a student studieda particular learning segment. (Often students forget to*record their study time completely or try to recall, longafter the studying was done, how much time was devoted toeach segment.) The point is that we cannot pretend thevalidation data are better than they actually are. In makingrevision decisions based on validation data, therefore, wecannot afford to overlook the in-house preliminary tryoutresults ab one of the factors in making a final decision.
y In regard to a segment self-test, for example, the studentmay first take the test to find out what he does not know,then proceed to study the learning materials. Or he maystudy the material somewhat, take the test, and then re-study the material because ha did poorly on the test thefirst time. In any event, the punched card we get of hisresponses is from the first time he took the test.

Memo to Staff - E. W. Fit%patriek April 23, 1969
D. The matter of Flags
"flags" are used to indicate on segment, unit, and. post tests the items which were missed by more than ten percent
of the students. (A flag is a red "x" alongside of the testitem.) One flag is used to signal that between 11 and 20Zof the students missed the item; 2 flags signal when morethan 20% missed an item.
We would like to see 90/90 (i.e., 90 percent of thestudents achieving 90% of the objeetives) but there may beperfectly acceptable reasons why, say, a 90/75 arrangementis appropriate for a particular segment.
III. Revision Procednre.
.. The revision procedure may be said to consist of four
major steps. These steps are described below..
Step 1. Preparation
After selecting the segment to be reviewed, make sureyou have all of the completed forms that you need. Therewill be a Form E for the post test and, in most cases, aForm E for the unit test. There will be a Form 13 for thesegment self-test. Form E is the summary of student per-formance on a concept area "post test" or a "unit test" withina 'concept area. Form 13 summarizes student performance on asegment self-test. You should also have a copy of the unitand post tests, a well as copies of the student's andinstructor's critique-sheet responses.
Step 2. Post/Unit Test Notation
Now proceed to review the one or two form E's for-flags relating to your segment. It would be a good ideato note in the segment package those objectives whichreceived 1 flag and those objectives which received 2flags on either the unit test or the post test. An exampleof how this can be done is:
[Ul, P2 L Obj. 3216)
Step '3. Revision Requirements Analysis
At this point, you should review your flags .(the onesyou wrote for reference alongside of the objective nuMbers)in relation to the flags on Fonri 13, the results of thesegment self-test.
POOR:-...1:::,...fTY-BaT
AVAILABLEAT ilmE
FILMED

Memo to Staff - E. W. Fitzpatrick Apri3 23, 1969
A. If items (objectives) are flagged on Porn D butthere were no flags for the :,.._bated objective from a Form E,then you should consider the following:
(1) Xs the objective subsumed by another objectivewhich was tested on the unit and/or post test?If yes, you should see how well the studentsdid on the higher level objective.. If theydid well, perhaps no revision should be madeto the material for this lower-level objective.The assumption may be made that students whomissed the. related test item on the segmenttest reviewed the related learning materialbefore taking the unit or post test.
(2) Perhaps the objective is not subsumed byanother and that it simply was not among the-objectives p3.cked for inclusion in the unit.or post test. There S,s a limit to how bigthese tests can be, which restricts the sampleof objectives that can be tested. Nevertheless,it is still possible that students who missedthe objective on the segment test, reviewed therelated material (as they are directed to by theprescription after the segment test) sand wouldhave passed that part of the segment test ifthey had taken it again. Your good judgmentwill have to be exercised in these cases.
You' should also check the critique sheetssubmitted by the students and instructors tosee if there are apparent problems which re-quire revision., But be very cautious aboutmaking changes simply because gomtbody does notlike the way the material is written (or spoken,or displayed) because we may find, too late,that students cannot learn from changes we madeto satisfy one or two people.
B. If items (objectives) were flagged on a Form B (unitor post test) but not on Form B (segment test), then severalpossibilities shou)d be examined. The error could be due toinsufficient practice, so that retention suffered, or to lackof comparability among test items, or to poor data from thestudents (i.e., they didn't really spend time in studying) .
(1) Check for comparability of test items among thetests first. If it appears that the items aredifferent (i.e., testing different things or atdifferent levels of difficulty) , then you shouldrecommend that this he reviewed by Dr. Furey, and
. the material should be routed to her when ap-propriate.

Memo to Staff - E. W. Fitzpatrick April 23, 3.969
(2) If the test items are comparable, then theproblem may be one of either poor retentionor insufficient study on the part of thestudents. Examine the explanation,illustrations, examples, and exercises. Thenmake a judgment as to whether you couldeliminate the performance problem by revising(e.g., adding, deleting, substituting orotherwise changing) any or all of these elements.More practice is one of the best means to in-crease retention. You may judge, however, thatthe segment is adequate as it now stands andthat students should be specifically asked toreview this segment prior to the test.
C. If items (objectives) were flagged on both Form E (unitor post test) and Form 13, you have a good case for revising thesegment, assuming there are no contraindications. We must stillcontend with the question of whether the students who missed thetest items did so because they never bothered to werk.throughthe related segment. If you examine the material and suspect thatthis might have been the case, check our .in-house tryout resultsto see if they argue against the need for change.
Step 4. Final Review
The revisors themselves will be responsible for the finalreview of any segments they hive revised. Similarly, the Testand Measurement Specialist is responsible for final review ofrevised tests. nowever, in all cases involving a change incontent, one or more economists will serve as subject matterexperts, so that approvals can be made with some degree ofassurance in the content area.
Review Panel
In the event a drastic revision seems required, therecommendation will have to be submitted to the review panel.This panel will consist of at least three people: one revisor/economist, the measurement specialist, and myself. If theevldence supports the recommendation, the matter will bediscussed with the Academy economists and a final dispositionmade. A drastic revision would be a change of the followingtype:
S.
1. Othoi segments affected2. Complete re-write of a segment3. Deletion or addition of a segment4. Changing tile location of a segment
POOR ORIGINAL COPY.BESTAVAILABLEAT TIME mmeD

Memo to Staff - E. W. Fitzpatrick April 23, 1969
- General. Workflow
The general workflow may be summarized as follows:
[-
Test andMeasurementReview andRevision --jGon Data Analysel Revisedfig. Control
and 1're3iminary ---> and Materials 1-- * MaterialsAnalysis Revision
Control Forms Used
". Two forms are currently being used for control purposes.
"Review Action Sheet"- Used at the segment level,this is used to document the actual revisions made to thematerial, by whomever made the revisions. It is used torecord recommended changes and serves as a checklist ofthe disposition of such recommendations.
. "Segment Routing Log"- Used at the segment level,this log is used to record who received the segment, howlong the recipient held the segment, and how much time heapplied to it. This data will be used for several purposes,including workload projections.
Increased Economist Sunoert. .
Dr. Tom Havrileshy; one of our part-time economists,will be consulting with us this summer on a full-tinebasis, from.the second week in June until the end of thefirst week in September. Ne will be providing generalsupport to us as a subject matter expert and materialsrevisor.
Academy Coordination
We are seeking to get together with the Academyeconomists at the earliest opportunity to discuss changesin the course for the.Pall 19 69 semester. Their recom-mendations will have major implications for our revisionload this summer. This meeting should take place as soonas Professor cCusker returns from his overseas assignment,
rook ORIGINAL COPY-BESTAVAILABLE AT TIME FILMED

APPENDIX I
Excerpt from TR-5.39,
"Final Validation Report"
POOR ORIGINAL COPY-BEST64(A: ABLE AT TItAv FILMED

APPENDIX J
Excerpt from TR-5.40
"Final Evaluation Report

2. SUMMARY
The Multi-Media Economic Analysis Course in its fully
operational mode was presented at the United States Naval
Academy during the Fall Semester, 1969-70, to 39 randomly
selected third class (sophomore) and second class (junior)
Midshipmen who had not previously had any economics courses.
an the course, the students proceeded at their own pace and
iexercised options in the selection of media and enrichment,
and thus maintained a significant degree of control over when
and how they studied. Whenever students have such freedom of
choice, many questions arise concerning how well they learn,
whether they can complete the course in the required time,
whether they like having the responsibility for their learning,
etc. During the evaluation of the course these and similar
questions were investigated. Both the questions investigated
and the findings are presented below.
1. Did the Midshipmen achieve at the expected level of
performance?
Ninety-seven percent of the students achieved 80
percent or more of the core objectives of the course. Further-
more, 100 percent of the Midshipmen, in order to meet their
learning contracts, accomplished varying numbers of enrichment
objectives in addition to those in core. The Academy awarded
a grade of "C" to students who achieved the core objectives.

Ninety percent of the students earned sufficient option points
from their enrichment activities to obtain a final grade of
"A" or "B".
2. What was the relationship between a student's rank in
test performance and his rank in QPR, SATV and SATQ?
The correlations between rank in test performance
and rank in QPR, SATV and SATQ were low. Little or no rela-
tionship existed between a student's rank in test scores and
his rank in these variables. Since one of the objectives of
the project was to design an economics course in which any
Midshipman, regardless of his previous ranks or classifications,
could succeed at a specified level, the fact that there is
practically no correlation between a Midshipman's rank in
scores on tests in the Multi-Media Economic Analysis Course
and his rank in other variables seems to indicate the accom-
plishment of this goal.
-3-

3. Did the students sl'ow a gain in learning?
From both the practical and statistical points of
view all students showed a significant gain in learning. The
am1unt of new information acquired and the increase in their
ability to work with economic principles and concepts, as
reflected in the difference between the scores on pretests and
post tests, indicated a great increase in learning. In response
to questionnaires, the Midshipmen reported that as a result of
taking the course, they could perform better in activities such
as discussing economic problems with parents, read with greater
understanding newspaper stories related to economics, and
criticize economic policy with a reasoned, stronger basis for
their arguments.
4. Were the Midshipmen able to complete the_course in
one semester?
Although it is generally recognized that the Multi-
Media Economic Analysis Course is the equivalent of a two-
semester course, thirty-two percent of the students completed
the course six weeks before the end of the semester. All of
these students earned a final grade of A or B, which required
that they also achieve enrichment objectives. One objective
in designing the course was to produce course segments that
the median student in the conventional course could complete
in about 50 minutes' learning time. The median learning time

per segment for the Midshipmen in all concept areas was less
than 50 minutes, as were the mean and modal learning times.
The mean total learning time used by the Midshipmen for all
the core materials in the Multi-Media Economics Course was 51
hours and 29 minutes, only 10 to 15 hours more than the time
required for class attendance in the conventional course.
The Naval Academy student with the greatest total learning
time used 97 hours and 39 minutes for core materials, while
the one with the least used 30 hours.and 33 minutes.
Of considerable interest is the fact that both were
among the group who completed the course in only nine calendar
weeks. All others completed the economics course in one
semester.
All correlations between a Midshipman's total learning
time per test and his score on the corresponding test, as well
as between his rank in total learning time per post test and
his rank in SATV, SATQ and QPR, were low. Therefore, it may be
concluded that little or no relationship existed between total
learning time per test and any of these variables.
5. Did the five Midshipmen who made the highest scores
on each control test differ significantly from those five who
made the lowest scores in respect to mean total learning time?
What was the correlation between rank in test scores and rank
in learning time for each group? Was there any significant
difference between the groups in respect to mean QPR and mean
scores on SATV and SATQ?
-5-

The individuals included in the group making the five
highest scores or in the group making the five lowest scores
varied for every test. The mean total learning time of the
five Midshipmen making the lowest: scores was greater than that
of the five making the highest scores in six of the nine tests;
in the other three, the students with the highest scores had
the greatest mean total learning time. Although the mean
differences between the groups were statistically significant
in only two tests, almost all were significant from a practical
point of view because they usually amounted to an hour or more.
A student and instructor, knowing of this difference, mlght be
able to plan more efficient learning contracts.
The correlations between rank in test scores and rank
in total learning time for the five Midshipmen with the highest
test scores were either zero or less than .30 in all but two
tests. On those two, the correlations were -.62 and -.71,
indicating a high degree of inverse relationship between the
variables. In other words, on these tests students who scored
highest generally took the greatest amount of learning time.
Correlations between the same variables for the groups making
the lowest scores tended to be low and in three cases, the
correlations were negative. These findings indicated little
relationship between rank in test scores and rank in learning
time among the low-scoring groups.
In general, the Midshipmen who were among the five
making the highest scores on each test also scored higher on
SATV and SATQ and had higher QPR's than the five making the
-6-

lowest scores. The difference in the mean QPR's of the groups
was in all but one case statistically significant in favor of
those with the high scores. However, in only three or four
tests were the mean differences in SATV and SATQ scores statis-
tically significant in favor of the groups of high scorers.
Since the differences amounted to approximately 50 points,
they had practical significance also.
6. Did the five Midshipmen who used the greatest total
learning time differ significantly from the five who used the
least total learning time in respect to test scores? What
was the correlation between rank in learning time and rank in
test scores for each group? Was there any significant
difference between the groups in respect to mean 9141 and mean
SATV and SATQ scores?
The five Midshipmen using the least total learning
time usually had a mean test score slightly higher (always less
than 2 points) :than those using the greatest total learning time.
In no test was this difference either statistically or prac-
tically significant. These findings are typical of courses
requiring the mastery of a high percentage of core material.
Correlations between rank in total learning time per
test and rank in test scores for the group using the least total
learning time were, with one exception, low and were inclined to
be negative. The correlation between these variables on test
16 was -.84, indicating a high degree of inverse relationship.
Students who took the least total learning time for this test
-7..

tended to have the lowest scores. Correlations between rank
in total learning time per test and rank in test scores for
the group using the greatest total learning time also were
generally negative and low. However, on three teats the
correlations were +.89, +.87, and +.84, showing a high, direct
relationship between the two rankings. Students who used the
greatest total learning time for these tests tended to have the
lowest scores. In the case of test 11 the correlation of -.80
indicates that students who required the greatest total learning
time for this test tended to make the highest scores on it.
The personnel of the group of five Midshipmen using
the least learning time and of the group using the greatest
learning time varied from test to test. Although the mean QM
and the mean SATV and SATQ scores of the groups with the least
learning time were higher than those of the other groups, the
difference in the means for all three variables were generally
neither statistically nor practically significant. However, the
man differences in SATQ of about 50 points favoring the group
requiring the least total learning time for tests 72, 80 and 95
had both practical and statistical significance.
7. Did the group of Midshipmen who completed the course
six weeks before the end of the semester differ significantly
from the class as a whole in total learning time, test scores,
QPR, SATV or SATQ scores?
The group of Midshipmen who completed the Multi-Media
Economics Course in nine weeks were not different from the

class as a whole in total learning time, test scores, QPR,
SATV or SATQ scores. They probably were different in motiva-
tion. Both the Midshipman who used the greatest totaX learning
time for core content and the one who used the least were in
the group. Mcdeover, three others who were in the groups taking
the least total learning time per test and four who had been in
the groups taking the greatest total learning time completed
the course six weeks early. Eight of this group had been among
the 'five with the highest test scores; four had been among the
five with the lowest test scores. All statistical evidence
pointed to the fact that these students were like the rest of
the class in respect to total learning time, test scores, QPR,
SATV scores and SATQ scores.
8. What conclusions can be drawn from these findings
concerning the performance of the Midshipmen in the Multi-Media
Economic Analysis Course?
The findings of these studies present conclusive
evidence that the core materials in this economics course can
be achieved in one semester or less by Naval Academy students
similar to those in the experimental program at a 90/80 level
of performance and that many can complete additional enrichment
material at an equally high performance level within this same
time period. The self-pacing feature of the course permits
students who require a greater total learning time than thiir
classmates to complete the course in one semester or less, also.
These results imply that the design of the instructional
-9-

materials, which incorporated the sequencing of objectives, the
conditions suitable for the type of learning inherent in each
objective, and the reinforcement of correct responses, is sound.
Eliminating anv part of the design in revising this course could
result in less' spectacular student performance. On the basis
of the findings concerning the performance of the Midshipmen,
the Multi-Media Economics Course must be evaluated as highly,successful
in promoting efficient learning of economics by
students at the Naval Academy.
9. Did Midshipmen who used audio packages learn the
objectives for these segments as well as they learned those
presented in the printed texts? How did the performance of
these Midshipmen compare with that of the rest of the class in
respect to test scores and total learning time?
The Midshipmen who elected to use the audio tape-
workbook packages in general did not show great variation in
their performance on test items referenced to the segments in
the audio packages and'on test items referenced to segments
immediately preceding and immediately following the audio,
which were presented in another medium printed text.
Comparison of the mean scores of the group who used
the audio and of the rest of the class on items related to
those segments prepared in alternate media were not signifi-
cantly different, statistically or practically. On the whole,
the mean total learning time of the audio group was somewhat
less (5 - 10 minutes) than that of the rest of the class. For
-10-

one audio package the mean total learning time of the audio
group was 17 minutes less; for a different package it was 20
minutes greater. These differences would be important to a
busy Midshipman in deciding whether or not to try an audio
package.
10. Did the Midshipmen who viewed the films have sig-
nificantly better scores on test items related to the films?
Midshipmen who saw the films had a mean score on
items referenced to them in test 27 which was one point higher
than that of those not viewing the films. This difference was
both practically and statistically significant. The difference
in mean scores of viewers and non-viewers on items referenced
to films in tests 48 and 72 was statistically but not practi-
cally significant.
11. How effective were the computer simulations?
The course included eleven computer simulations of
economic systems. Somd of these simulations are meant to
challenge the most advanced student. No conclusions can be
drawn concerning the effectiveness of the simulations, since
the computer was usually down when a student needed it. With
down time rates reportedly running as high as 80 percent for
some students, students typically had to replan their schedules
several times in order to run one simulation.

12. What was the student reaction to the course as a
whole? What was the instructor's reaction?
Student reaction to the course was overwhelmingly
favorable. They found it neither too easy, nor too hard and
preferred the elf-instructional approach to the traditional
lecture approach. When asked to tell what they liked best
about the course, they responded most frequently that they liked
to be able to determine when, where, and how to study and to
decide what final grade to work for. in response to a request
for suggestions for improvement, they asked that more non-
mandatory seminars relating economic principles to current
policies and problems be held.
The instructor, too, was highly complimentary of the
course because it promoted the learning of .economics easily and
well. Although he likes the lecture method, he appreciated the
opportunity to work on a mo-e individual basis with students
which the self-instructional course afforded him. He, too,
suggested there should be seminars concerning current problems
and policies . (As the course is designed, the instructor
determines when seminars are to be held and their topics. This
may sugges': that "required" seminars should be built into the
course.)
13. What was student reaction to the films?
Reaction to the films was mixed. On the one hand,
a majority of the students said that the films were an effective
supplement to the course, and that they were relevant and
-12-

interesting; yet, a majority also reported under the category
of what was least liked about the films that they were boring
and a waste of time. There were other opinions expressed
which were just as contradictory. In view of this reaction,
the whole question of films should be reviewed.
14. What was student reaction to the audio tape-workbooli
packages?
Forty percent of the Midshipmen elected to use any
audio-packz.ge series. Two of them used all three of the series;
the others used one or two. About eighty percent of all the
students utilizing this medium were favorably impressed because
the tapes made learning easier for them and provided a change
in pace. Those who disliked the tapes said they could not
concentrate on economics while listening and found it difficult
to go back over material they did not understand. A majority of
those who used this medium suggested that more audio packages
should be included in the course.
15. What problems, if any, existed in the general oper-
ational environment of the course?
A self-paced, self-instructional course requires
that all materials and media be available to any student when
he is ready for them. Operating such a course in the normal
environment of the traditional school posed a number of prob-
lems in logistics. The Naval Academy solved many of these; how-
ever, a few such as coping with computer down-time apparently
remain unsolved. Since the films were rented, they could be
-13-

shown only et, a group, not individual, basis at a specified
time. Consequently, the content of the films was not always
congruent with that which the Midshipmen were learning. The
facility in which the films were viewed and the hours when
they could be seen were not completely satisfactory. The
security of the space in which all materials, including control
test and student records, were stored could not be ensured.
Some breakdown in communication between instructor and students
in respect to the scheduling of seminars and appointments was
experienced. All these were problems typically connected with
inaugurating a different type of course in any school.
3. STUDENT POPULATION AND LIMITATIONS TO DATA
In any detailed discussion of the Multi-media Economic
Analysis Course, the characteristics of the sample population
who took the course should be considered at the outset.
Thirty-nine Midshipmen at the United States Naval Academy, 13
second classmen (juniors) and 26 third classmen (sophomores),
were randomly selected by the Academy to take the course during
the Fall semester 1969-70. None of the students reported
having previously had a course in economics. Table 1 presents
the scores of the whole group on the SAT Verbal and the SAT
Quantitative, as well as their Cumulative Quality Point Rank
(QPR) as of 9/1/69. These data reveal a fairly wide range in
all three measures as would be found in a random sample. The
difference of 82 points between the mean score on the SATV and
-14-