ERA Research Report
36
November 11, 2015 ERA GROUP INCORPORATED ERA/NYSE Continuing Coverage: From Seashore to Deep Waters: Engines Roar of Era Investment Rating: Market Perform PRICE: $ 11.68 S&P 500: 2,081.72 DJIA: 17,758.21 RUSSELL 2000: 1,187.70 Era becomes an “Emerging Growth Company” after spin‐off from SEACOR Era to double its fleet size of medium‐heavy helicopters to serve the growing deep water market Operating revenues and profitability impacted by seasonality Sales, acquisitions, and diversification means reduced risk and more opportunities Grand opening of Houma super base signals commitment to Gulf Coast region Our 12‐month target price is $12.00 Valuation 2014 A 2015 E 2016 E EPS* $ 0.85 $ 0.69 $ 0.37 P/E 13.7x 17.0x 31.3x CFPS $ 3.89 $ 2.28 $ 3.04 P/CFPS 3.0x 5.1x 3.8x * Excluding non‐recurring items Market Capitalization Stock Data Equity Market Cap (MM): $ 239 52‐Week Range: $10.94 ‐ $24.92 Enterprise Value (MM): $ 254,639 12‐Month Stock Performance: ‐53.80% Shares Outstanding (MM): 20.50 Dividend Yield: Nil Estimated Float (MM): 16.55 Book Value Per Share: $ 22.50 6‐Mo. Avg. Daily Volume: 191,765 Beta: 0.47 Company Quick View: Since being spun off from Seacor Holdings, ERA has been making the fleet upgrades to be a big player in the oligopolistic offshore helicopter business. Era Group, Inc. is a Houston‐based company providing helicopter transportation and leasing services within and outside of the oil and gas industry. Era conducts global operations in the U.S., Brazil, Colombia, India, Norway, Spain, and the U.K., providing helicopter transporting, flightseeing, leasing, training, and other related services. Era operates in the energy equipment and services industry, and mainly provides services to the upstream oil and gas industry. Company Website: www.eragroupinc.com Analysts: Investment Research Manager: Adam Bubes Agnes Lee Artemis Ma Daniela Sosadiaz Luan Vo The BURKENROAD REPORTS are produced solely as a part of an educational program of Tulane University's Freeman School of Business. The reports are not investment advice and you should not and may not rely on them in making any investment decision. You should consult an investment professional and/or conduct your own primary research regarding any potential investment. Wall Street's Farm Team BURKENROAD REPORTS
-
Upload
adam-bubes -
Category
Documents
-
view
40 -
download
1
Transcript of ERA Research Report

November 11, 2015
ERA GROUP INCORPORATED
ERA/NYSE Continuing Coverage: From Seashore to Deep Waters:
Engines Roar of Era Investment Rating: Market Perform
PRICE: $ 11.68 S&P 500: 2,081.72 DJIA: 17,758.21 RUSSELL 2000: 1,187.70 Era becomes an “Emerging Growth Company” after spin‐off from SEACOR
Era to double its fleet size of medium‐heavy helicopters to serve the growing deep water market
Operating revenues and profitability impacted by seasonality
Sales, acquisitions, and diversification means reduced risk and more opportunities
Grand opening of Houma super base signals commitment to Gulf Coast region
Our 12‐month target price is $12.00
Valuation 2014 A 2015 E 2016 E
EPS* $ 0.85 $ 0.69 $ 0.37
P/E 13.7x 17.0x 31.3x
CFPS $ 3.89 $ 2.28 $ 3.04
P/CFPS 3.0x 5.1x 3.8x
* Excluding non‐recurring i tems
Market Capitalization Stock Data
Equity Market Cap (MM): $ 239 52‐Week Range: $10.94 ‐ $24.92
Enterprise Value (MM): $ 254,639 12‐Month Stock Performance: ‐53.80%
Shares Outstanding (MM): 20.50 Dividend Yield: Nil
Estimated Float (MM): 16.55 Book Value Per Share: $ 22.50
6‐Mo. Avg. Daily Volume: 191,765 Beta: 0.47
Company Quick View:
Since being spun off from Seacor Holdings, ERA has been making the fleet upgrades to be a big player in the oligopolistic offshore helicopter business. Era Group, Inc. is a Houston‐based company providing helicopter transportation and leasing services within and outside of the oil and gas industry. Era conducts global operations in the U.S., Brazil, Colombia, India, Norway, Spain, and the U.K., providing helicopter transporting, flightseeing, leasing, training, and other related services. Era operates in the energy equipment and services industry, and mainly provides services to the upstream oil and gas industry. Company Website: www.eragroupinc.com
Analysts: Investment Research Manager: Adam Bubes Agnes Lee Artemis Ma Daniela Sosadiaz Luan Vo
The BURKENROAD REPORTS are produced solely as a part of an educational program of Tulane University's Freeman School of Business. The reports are not investment advice and you should not and may not rely on them in making any investment decision. You should consult an investment professional and/or conduct your own primary research regarding any potential investment.
Wall Street's Farm Team
BURK
ENRO
AD R
EPO
RTS
4/1/13 4:47 PM

Era Group Incorporated (ERA) BURKENROAD REPORTS (www.burkenroad.org) November 11, 2015
2
Figure 1: 5‐year Stock Price Performance
Source: Yahoo Finance November 11, 2015
INVESTMENT SUMMARY
We gave Era Group Inc. a Market Perform rating with 12‐month target price of $12.00.
Based in Houston, Texas, Era Group is one of the largest helicopter operators in the world and the longest operating helicopter transport operator in the U.S. The Company’s helicopters primarily transport personnel to, from, and between offshore installations, drilling rigs, and platforms. In the year ended in December 31, 2014, approximately 67% and 15% of total operating revenues were earned in the U.S. Gulf of Mexico and Alaska, respectively. Helicopter services customers largely consist of international, major integrated, and independent oil and gas exploration, development and production companies. Era also provides services for customers in Brazil, Colombia, India, Norway, Spain, and the U.K. In addition, Era provides air medical services, search and rescue, and flightseeing tours, among other activities.
Despite the challenging oil and gas industry environment, Era will be prepared to face these poor macroeconomic conditions due to its ample liquidity. With new technology for deepwater drilling, the demand for helicopters continues since it is the fastest way to travel offshore. Because deepwater oil rigs are located rather far, heavy helicopters offer the best potential to help the Company grow. Also, with the grand opening of the new super base in Houma, Louisiana, Era has a chance to more effectively compete with other helicopter service providers. The Houma facility contains advanced equipment and infrastructure to keep Era relevant in the industry. The super base will become one of the premier heliports servicing the Gulf of Mexico. With oil prices projected to remain low, Era has the leverage to weather the storm in the next 12‐months.

Era Group Incorporated (ERA) BURKENROAD REPORTS (www.burkenroad.org) November 11, 2015
3
Table 1: Historical Burkenroad Ratings and Prices
Report Date Stock Price* Rating 12 Month Target Price
11/18/14 $24.92 Market Perform $30.00
*Price at time of report date
INVESTMENT THESIS
We anticipate a 12‐month target price of $12.00 with a Market Perform rating for Era Group. Era has benefited from certain exemptions as an “Emerging Growth Company” after its spin‐off. Despite the volatile oil market and seasonality in operating revenues, the Company expects to reduce risks with recent acquisitions and diversification. Era will stay committed to the Gulf Coast region, as shown in the opening of a new Louisiana super base, and will increase its fleet size of medium and heavy helicopters for growing opportunities in the deep water market.
Era becomes an “Emerging Growth Company” after spin‐off from SEACOR
On January 31, 2013, Era Group completed the spin‐off from SEACOR Holdings Inc., an international provider of support services to offshore transportation in the oil and gas industries. Under the symbol “ERA,” the Company became independent with its common stock traded on the New York Stock Exchange. According to the Jumpstart Our Business Startups Act, Era is defined as an “Emerging Growth Company.” This means the Company is eligible to take advantage of certain exemptions from various reporting requirements that are applicable to other public companies that are not “Emerging Growth Companies.” The Company will no longer need to comply with the disclosure obligations regarding executive compensation in the periodic reports and proxy statements. Era will also receive exemptions from the requirements of holding a non‐binding advisory vote on executive compensation and obtaining stockholder approval of any golden parachute payments.
Era to double its fleet size of medium‐heavy helicopters to serve the growing deep water market
Though Era Group offers a diverse fleet of helicopters, medium and heavy aircrafts are the most profitable. Larger aircrafts are typically used for deepwater offshore transportation and in providing search and rescue services, which carry higher margins. Due to increasing demand in deepwater operations, Era plans to increase its fleet of heavy helicopters from nine to 15. Further, the Company has the option to purchase up to 14 additional heavy helicopters. However, revenues from new aircraft typically lag several quarters for a period of up to 12 months.
Era Group Incorporated (ERA) BURKENROAD REPORTS (www.burkenroad.org) November 11, 2015
4
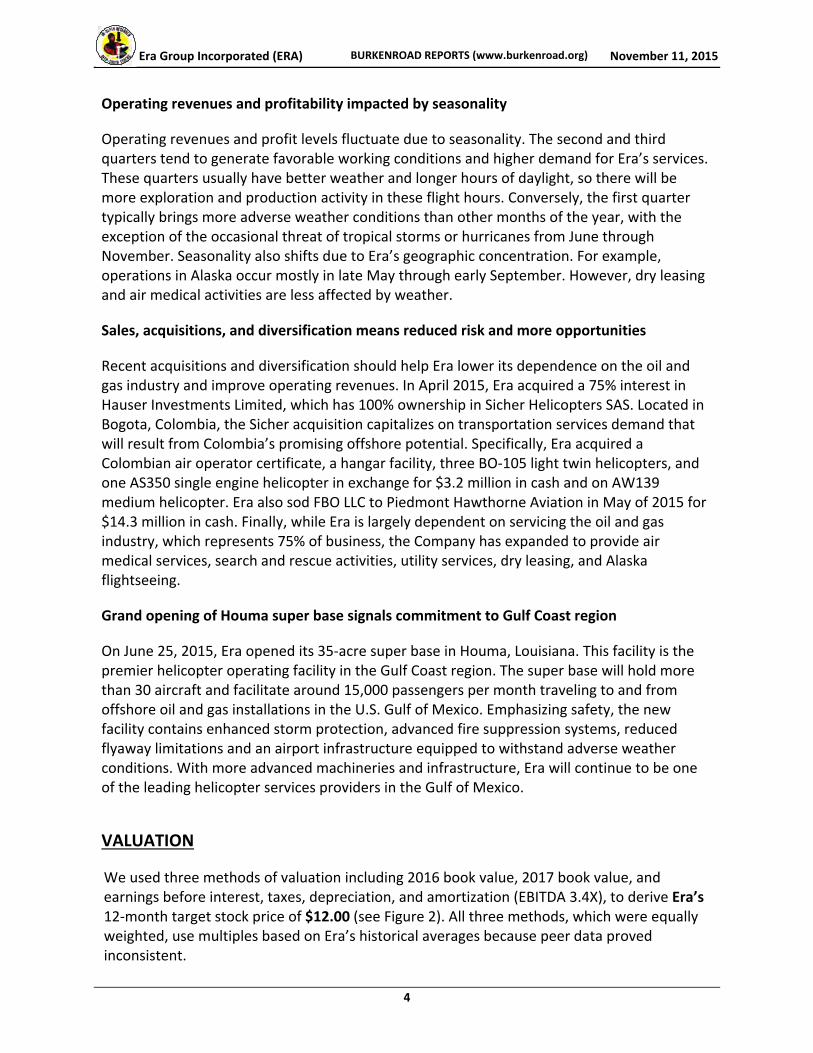
Operating revenues and profitability impacted by seasonality
Operating revenues and profit levels fluctuate due to seasonality. The second and third quarters tend to generate favorable working conditions and higher demand for Era’s services. These quarters usually have better weather and longer hours of daylight, so there will be more exploration and production activity in these flight hours. Conversely, the first quarter typically brings more adverse weather conditions than other months of the year, with the exception of the occasional threat of tropical storms or hurricanes from June through November. Seasonality also shifts due to Era’s geographic concentration. For example, operations in Alaska occur mostly in late May through early September. However, dry leasing and air medical activities are less affected by weather.
Sales, acquisitions, and diversification means reduced risk and more opportunities
Recent acquisitions and diversification should help Era lower its dependence on the oil and gas industry and improve operating revenues. In April 2015, Era acquired a 75% interest in Hauser Investments Limited, which has 100% ownership in Sicher Helicopters SAS. Located in Bogota, Colombia, the Sicher acquisition capitalizes on transportation services demand that will result from Colombia’s promising offshore potential. Specifically, Era acquired a Colombian air operator certificate, a hangar facility, three BO‐105 light twin helicopters, and one AS350 single engine helicopter in exchange for $3.2 million in cash and on AW139 medium helicopter. Era also sod FBO LLC to Piedmont Hawthorne Aviation in May of 2015 for $14.3 million in cash. Finally, while Era is largely dependent on servicing the oil and gas industry, which represents 75% of business, the Company has expanded to provide air medical services, search and rescue activities, utility services, dry leasing, and Alaska flightseeing.
Grand opening of Houma super base signals commitment to Gulf Coast region
On June 25, 2015, Era opened its 35‐acre super base in Houma, Louisiana. This facility is the premier helicopter operating facility in the Gulf Coast region. The super base will hold more than 30 aircraft and facilitate around 15,000 passengers per month traveling to and from offshore oil and gas installations in the U.S. Gulf of Mexico. Emphasizing safety, the new facility contains enhanced storm protection, advanced fire suppression systems, reduced flyaway limitations and an airport infrastructure equipped to withstand adverse weather conditions. With more advanced machineries and infrastructure, Era will continue to be one of the leading helicopter services providers in the Gulf of Mexico.
VALUATION
We used three methods of valuation including 2016 book value, 2017 book value, and earnings before interest, taxes, depreciation, and amortization (EBITDA 3.4X), to derive Era’s 12‐month target stock price of $12.00 (see Figure 2). All three methods, which were equally weighted, use multiples based on Era’s historical averages because peer data proved inconsistent.

Era Group Incorporated (ERA) BURKENROAD REPORTS (www.burkenroad.org) November 11, 2015
5
For the price over book value multiple, we chose Era’s current stock price over its most recent shareholders’ equity per share. We then estimated the target price by multiplying the multiple with Era’s forecasted shareholders’ equity per share in 2016 and 2017, respectively. We used price to book value ratio as an indicator because Era mainly derives revenue from its helicopter assets, which leads to high relevance between price and book value.
The third method forecasted the target price with the price over EBITDA multiple calculated using Era’s current price and earnings. We included depreciation in earnings which was significant considering Era’s dependence on equipment.
Figure 2: 12‐Month Target Price
INDUSTRY ANALYSIS
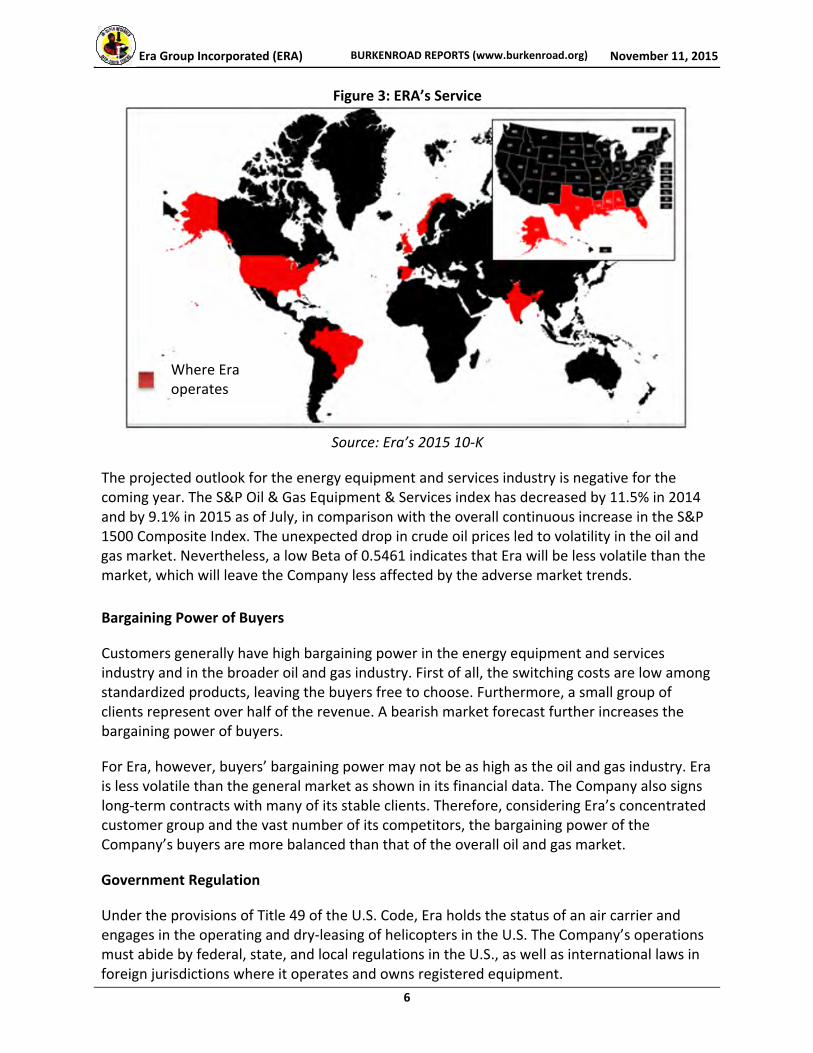
Era Group operates within the energy equipment and services industry and mainly provides services to the upstream oil and gas industry, which consists largely of oil and gas exploration, development, and production companies. Era also provides helicopter transportation, utility, medical, and emergency rescue services internationally, including the U.S., the U.K., Brazil, Colombia, India, Spain, and Norway (see Figure 3). Era is covered in the Standard and Poor's (S&P) Small Cap 600 index with a relatively small market capitalization of $421.5 million by the end of the second quarter of 2015. The Company’s major competitors include Bristow Group Inc. and PHI Inc.
Era Group Incorporated (ERA) BURKENROAD REPORTS (www.burkenroad.org) November 11, 2015
6
Figure 3: ERA’s Service
Source: Era’s 2015 10‐K
The projected outlook for the energy equipment and services industry is negative for the coming year. The S&P Oil & Gas Equipment & Services index has decreased by 11.5% in 2014 and by 9.1% in 2015 as of July, in comparison with the overall continuous increase in the S&P 1500 Composite Index. The unexpected drop in crude oil prices led to volatility in the oil and gas market. Nevertheless, a low Beta of 0.5461 indicates that Era will be less volatile than the market, which will leave the Company less affected by the adverse market trends.
Bargaining Power of Buyers
Customers generally have high bargaining power in the energy equipment and services industry and in the broader oil and gas industry. First of all, the switching costs are low among standardized products, leaving the buyers free to choose. Furthermore, a small group of clients represent over half of the revenue. A bearish market forecast further increases the bargaining power of buyers.
For Era, however, buyers’ bargaining power may not be as high as the oil and gas industry. Era is less volatile than the general market as shown in its financial data. The Company also signs long‐term contracts with many of its stable clients. Therefore, considering Era’s concentrated customer group and the vast number of its competitors, the bargaining power of the Company’s buyers are more balanced than that of the overall oil and gas market.
Government Regulation
Under the provisions of Title 49 of the U.S. Code, Era holds the status of an air carrier and engages in the operating and dry‐leasing of helicopters in the U.S. The Company’s operations must abide by federal, state, and local regulations in the U.S., as well as international laws in foreign jurisdictions where it operates and owns registered equipment.
Where Era operates

Era Group Incorporated (ERA) BURKENROAD REPORTS (www.burkenroad.org) November 11, 2015
7
In particular, Era must obey the regulations of the U.S. Department of Transportation and the Federal Aviation Administration. Additionally, the National Transportation Safety Board can investigate any helicopter accidents and recommend improved safety standards.
Citizens of the U.S. must register helicopters and meet citizenship requirements under the Federal Aviation Act. The Federal Aviation Act requires helicopter owners to comply with the following citizenship requirements: (1) Must be incorporated under the laws of the U.S. or of a state, territory or possession, (2) Must own or control 75% of its voting interests, and (3) at least two‐thirds of the board of directors and managing officers must be U.S. citizens.
In addition, Era has to follow federal, state, local, and international laws and regulations for environmental protection and occupational safety and health. The Federal Water Pollution Act, also known as the Clean Water Act, forces restrictions on the discharge of pollutants to the waters of the U.S. The Coastal Zone Management Act authorizes state development and implementation of certain programs to manage water pollutions to restore and protect coastal waters. In some cases, Era has to transport hazardous waste so the Company is subject to the Federal Resource Conservation and Recovery Act, which regulates the use, transportation, treatment, and storage of these wastes.
Era reduces its exposure to losses by using only well‐maintained facilities and equipment, and by implementing safety and environmental programs. As such, operations are currently in material compliance with all environmental laws and regulations. The Company believes these efforts will accommodate all reasonably foreseeable environmental regulation changes.
Key Industry Metrics
Three major industry drivers that impact helicopter service providers in the oil and gas industry include offshore rig count, the supply of helicopters in the industry, and the price of oil and gas.
Offshore Rig Count
Growth in the number of U.S offshore oil rigs is an essential metric in analyzing the health of the helicopter service industry. When the U.S. offshore rig count increases, the number of personnel needing transportation increases allowing helicopter transportation services to capture more profit generating opportunities. In the last year, the offshore rig count decreased roughly 25%, adversely impacting Era. Era’s 2015 second quarter flight hours in the Gulf of Mexico decreased by 21% relative to the second quarter of 2014 and revenue fell by 19% over the same period.
Helicopter Supply
Another key industry metric is the total numbers of helicopters in the industry. Currently, a surplus of helicopters exist. As a result, this oversupply lowers demand and decreases the value of helicopters.

Era Group Incorporated (ERA) BURKENROAD REPORTS (www.burkenroad.org) November 11, 2015
8
Price of Oil and Gas
Oil and gas prices greatly affect the helicopter services industry. Over the last year, oil and gas prices dropped drastically, causing oil and gas companies to decrease capital expenditures and abandon offshore rigs that are no longer profitable. Furthermore, the fall in oil and gas prices has reduced demand for oil and gas services.
Competitors
Era is a diversified Company; therefore, its competitors vary depending on the segment and geographical location. In the oil and gas equipment and services segment, Era’s biggest competitors in the U.S. Gulf of Mexico are Bristow Group Inc., PHI Inc., and Rotorcraft Leasing Company LLC. In Alaska, rivals include Erickson Air‐Crane, Inc. and PHI Inc. In Brazil, Lider Aviação Holding S.A., OMNI Táxi Aéreo Ltda., and Brazilian Helicopter Services Taxi Aéreo Ltda. dominate the market. In the air medical services segment, the Company competes against Air Methods Corporation, PHI, Air Medical Group Holdings, and hospital‐owned helicopters. Finally, in the financial leasing segment, Era competes against Element Financial Corp., Milestone Aviation, Waypoint Leasing, Lease Corporation International Aviation Limited, and Macquiarie Rotocaft Leasing.
The fragmented industry, along with the Company’s diversified operations, gives Era a competitive advantage over its rivals. Because only a few companies have significant market share, the competition is very intense and quality and feature‐oriented rather than price driven.
Barriers to Entry
The helicopter service industry presents high barriers of entry due to strict entry requirements such as initial large capital investments in high‐tech equipment, resource ownership, high operating costs, certifications, and safety regulations. These factors, along with high buyer bargaining power, prevent companies from entering the industry. Substitutes can occasionally be found in the market, but they do not possess all the added value that Era’s helicopters provide. Airplanes and crew boats may also be used for transport, but these options are usually inefficient and impractical in the oil and gas environment. Ultimately, the industry has high profits and startup costs, creating a strong barrier to entry.

Era Group Incorporated (ERA) BURKENROAD REPORTS (www.burkenroad.org) November 11, 2015
9
Figure 4: Era’s Competitors
Source: Era’s 10‐K
Bargaining Power of Suppliers
The bargaining power of suppliers for the industry is relatively more balanced than the power of buyers. Suppliers for the oil and gas equipment and services industry include aircraft engine and parts manufacturers, aircraft maintenance providers, and gasoline and petroleum wholesalers. Gasoline and petroleum price can vary drastically because of the recent volatility in the oil and gas market, which leads to less bargaining power. Aircraft maintenance providers and aircraft manufacturers, nevertheless, maintain a higher bargaining power with stable supplies.
Era relies on four helicopter manufacturers, including AgustaWestland, Sikorsky Aircraft Corporation, Bell Helicopters, and Airbus Helicopters Inc.
ABOUT ERA
Era Group, Inc. (“Era”) is a Houston‐based company engaged in providing helicopter transportation and leasing services within and out of the oil and gas industry. The Company was incorporated in Delaware on April 29, 1999, separated from SEACOR Holdings, Inc. in 2012, a global energy equipment and services provider. Era began trading on the New York Stock Exchange as an independent public company under the ticker symbol “ERA” on January 31, 2013. Era conducts global operations in the U.S., Brazil, Colombia, India, Norway, Spain, and the U.K., providing helicopter transporting, flightseeing, leasing, training, and other related services. The Company’s customers range from energy and utility companies, such as Anadarko Petroleum Corporation and Shell Pipeline Company, LP, to U.S. government agencies such as the Bureau of Safety and Environmental Enforcement. Era competes against operators in the Gulf of Mexico, Alaska, and Brazil, as well as a small number of air medical service and financial leasing companies.
$0 $50,000 $100,000 $150,000 $200,000 $250,000 $300,000 $350,000
Bristow Group Inc.
PHI INC
Erickson Air‐Crane
Air Methods Corporation
Element Financial Corp
ERA
Revenues 2Q‐2015
$0M $50M $100M $150M $200M $250M $300M $350M
Era Group Incorporated (ERA) BURKENROAD REPORTS (www.burkenroad.org) November 11, 2015
10
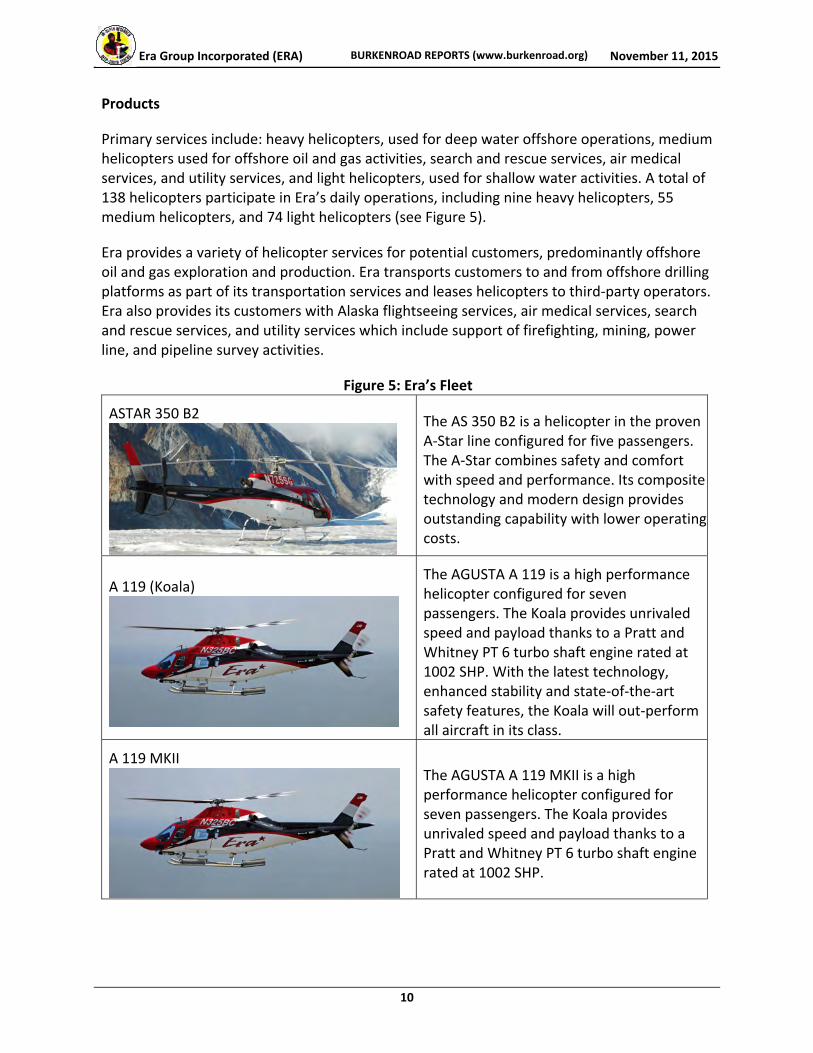
Products
Primary services include: heavy helicopters, used for deep water offshore operations, medium helicopters used for offshore oil and gas activities, search and rescue services, air medical services, and utility services, and light helicopters, used for shallow water activities. A total of 138 helicopters participate in Era’s daily operations, including nine heavy helicopters, 55 medium helicopters, and 74 light helicopters (see Figure 5).
Era provides a variety of helicopter services for potential customers, predominantly offshore oil and gas exploration and production. Era transports customers to and from offshore drilling platforms as part of its transportation services and leases helicopters to third‐party operators. Era also provides its customers with Alaska flightseeing services, air medical services, search and rescue services, and utility services which include support of firefighting, mining, power line, and pipeline survey activities.
Figure 5: Era’s Fleet
ASTAR 350 B2 The AS 350 B2 is a helicopter in the proven A‐Star line configured for five passengers. The A‐Star combines safety and comfort with speed and performance. Its composite technology and modern design provides outstanding capability with lower operating costs.
A 119 (Koala)
The AGUSTA A 119 is a high performance helicopter configured for seven passengers. The Koala provides unrivaled speed and payload thanks to a Pratt and Whitney PT 6 turbo shaft engine rated at 1002 SHP. With the latest technology, enhanced stability and state‐of‐the‐art safety features, the Koala will out‐perform all aircraft in its class.
A 119 MKIIThe AGUSTA A 119 MKII is a high performance helicopter configured for seven passengers. The Koala provides unrivaled speed and payload thanks to a Pratt and Whitney PT 6 turbo shaft engine rated at 1002 SHP.

Era Group Incorporated (ERA) BURKENROAD REPORTS (www.burkenroad.org) November 11, 2015
11
Light Twins
A 109 Power
The AGUSTA A 109 POWER is a twin‐engine high speed, high productivity helicopter configured for seven passengers. The 109 is well suited for the demanding offshore mission. It is the fastest helicopter in its class and is single Pilot IFR certified. Take‐off in category A from elevated helipads is made possible without any payload reduction.
EC 145
The EC145 offers multi‐mission capability in a medium‐class, twin‐engine helicopter. The aircraft’s speed, advanced glass cockpit, extra‐large cabin and exceptional visibility have made the EC145’s mark in the U.S. market. With its high‐set main and tail rotors, the EC145 ensures safe ground operations. Depending on customer requirements, the EC145 offers the versatility for either seven or nine passenger configuration.
EC 135 CPDS P2+
The EC 135 provides an outstanding work environment. There is room for five in the VIP configuration or up to seven passengers plus the pilot when used as a corporate shuttle. Luxury materials and practical fittings combine with extremely low noise and vibration levels to create a pleasant professional atmosphere.
Era Group Incorporated (ERA) BURKENROAD REPORTS (www.burkenroad.org) November 11, 2015
12
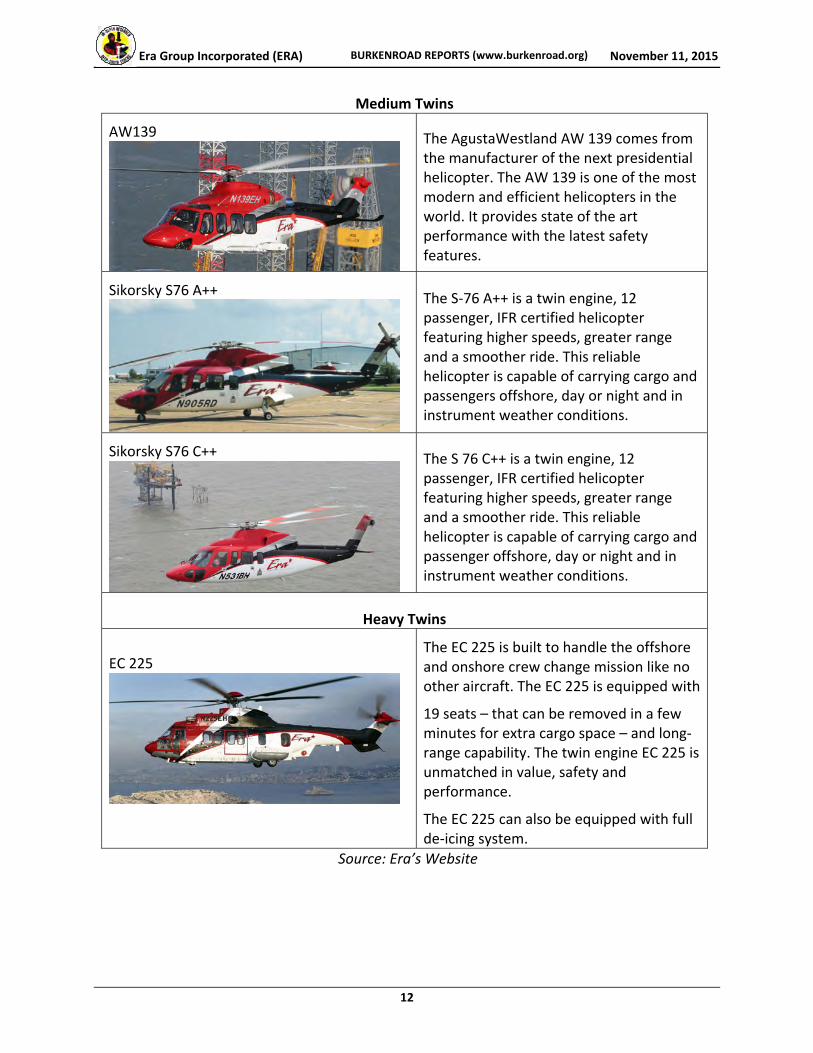
Medium Twins
AW139 The AgustaWestland AW 139 comes from the manufacturer of the next presidential helicopter. The AW 139 is one of the most modern and efficient helicopters in the world. It provides state of the art performance with the latest safety features.
Sikorsky S76 A++The S‐76 A++ is a twin engine, 12 passenger, IFR certified helicopter featuring higher speeds, greater range and a smoother ride. This reliable helicopter is capable of carrying cargo and passengers offshore, day or night and in instrument weather conditions.
Sikorsky S76 C++ The S 76 C++ is a twin engine, 12 passenger, IFR certified helicopter featuring higher speeds, greater range and a smoother ride. This reliable helicopter is capable of carrying cargo and passenger offshore, day or night and in instrument weather conditions.
Heavy Twins
EC 225
The EC 225 is built to handle the offshore and onshore crew change mission like no other aircraft. The EC 225 is equipped with
19 seats – that can be removed in a few minutes for extra cargo space – and long‐range capability. The twin engine EC 225 is unmatched in value, safety and performance.
The EC 225 can also be equipped with full de‐icing system.
Source: Era’s Website
Era Group Incorporated (ERA) BURKENROAD REPORTS (www.burkenroad.org) November 11, 2015
13
Acquisitions
In April 2015, Era entered the Colombian market with the acquisition of Sicher Helicopters SAS (“Sicher”). The Company currently wholly owns Sicher after acquiring a 75% interest of Hauser Investments Limited. Based in Bogota, Sicher is a leading helicopter operator in Colombia with a strong presence in the existing onshore oil and gas market. The acquisition of Sicher’s air operator certificate and operations should allow Era to capitalize on the growing demand for a new generation of helicopters designed to support international oil and gas companies operating in Colombia. Also, on May 1, 2015, the Company sold its fixed‐based operator (FBO) business at Ted Stevens Anchorage International Airport to Landmark Aviation, a company with a network of 68 fixed based operations in the U.S., Canada, and Western Europe. Piedmont Hawthorne Aviation, LLC, part of the Landmark Aviation network, acquired 100% of Era Group’s wholly owned subsidiary, Era FBO LLC, for $14.3 million in cash.
Since the acquisition of Aeróleo Taxi Aereo S/A (“Aeróleo”), Era faced multiple challenges to generate revenues from dry‐leasing operations in Brazil. Due to these financial difficulties, Aeróleo may have a hard time paying for the equipment lease obligations to Era, and/or necessitate an infusion of capital from Era to allow Aeróleo to continue to operate. As of June 30, 2015, Era had deferred the recognition of $37.1 million of revenues from Aeróleo due to liquidity issues.
Through arbitration, Era resolved a dispute with Aeróleo, with respect to the contractual shareholder rights related to any attempted sale or transfer of the other partner’s interests. On February 15, 2014, with consent, Aeróleo transferred 50% economic and 80% voting interest to a third party by definitive agreements. Due to this transaction, Aeróleo will be required to make payments to affiliates of the transferring partner in the form of severance and partial repayment of shareholder loans in the amount of $1.7 million. The transaction is subject to customary closing conditions. Obtaining judicial approval was delayed, which will cause the transaction to close during the second half of 2015. Era is expected to consolidate the financial results of Aeróleo upon consummation.
Era has also other subsidiaries such as Dart, Era Do Brazil, Era training center, and Heli‐Union Era Australia.
Competitive Advantage
Era’s main competitive advantage is in its positioning, safety standards, technology innovation, and experience.
Era was the first company in the U.S. Gulf of Mexico to receive Federal Aviation Administration (FAA) approval for an Airborne Radar Approach (ARA), positioning it as a leader in the industry. Era’s large operations, reliability, and efficiency have further the brand as a leading provider around the globe, especially in the Gulf of Mexico (with 13 strategically located bases) and Alaska, which are the Company’s primary areas of operation.
Era Group Incorporated (ERA) BURKENROAD REPORTS (www.burkenroad.org) November 11, 2015
14
The Company’s emphasis on safety measures and strong performance have been key factors to creating recognition and reliability within the industry and among customers. In order to support the customer’s needs and strengthen Era’s safety performance, the Company has acquired new helicopters and installed newer and safer technologies, such as the Supplementary Aviation Weather Reporting System (SAWRS). Era also implements department‐level programs on responsibility and safety.
Era’s capacity (138 heavy, medium, and light helicopters and offshore and onshore fuel facilities), history, integrity, and diversified portfolio help differentiate the Company from competitors.
Strategic Implementation
Era remains competitive by focusing on five strategic tactics. First, the Company focuses on safety and reliability. Era believes its customers prioritize these attributes when choosing a helicopter service. Second, Era stresses effective fleet utilization and management when upgrading its helicopter fleet. In order to remain current, Era regularly studies market conditions and changes in customer demand for helicopters, frequently acquiring new helicopter models and adopting newer and safer technologies. Furthermore, Era establishes close relationships with equipment manufacturers. Third, Era develops dry‐leasing opportunities, which allows customers to temporarily use Era’s helicopters without Era having to provide maintenance, or supply a crew. The Company’s superior and diverse fleets of helicopters drive this strategy. Fourth, Era consistently evaluates entry opportunities into new markets in order to increase its geographical reach. Lastly, Era focuses on its shareholders and maximizing shareholder value. The Company increases shareholder value by investing in growth opportunities, maintaining operational efficiency, and discontinuing unprofitable operations.
Financial Performance
The third quarter of fiscal year 2015 saw revenue of $69.74 million, a 23% decrease from the third quarter of fiscal year 2015. The decrease in revenue is directly attributed to the sale of Era’s FBO business in Alaska, as well as a decrease in the use of helicopters. Revenue in the third quarter of 2015 was $1.0 million lower than the second quarter due to fewer helicopters on contract in Alaska. Era acquired a 75% interest in Sicher helicopters at a cost of $3.2 million in cash and one AW139 helicopter. Other financial activities in the third quarter of 2015 include a 4% decrease in dry leasing revenues, compared to the third quarter in 2014, due to contracts which ended. Search and rescue revenue decreased 22% from the prior year’s third quarter, due to the end of a subscriber contract. Fortunately, Era added a SAR subscriber effective the fourth quarter of 2015 which should mitigate this loss. Air medical revenue declined 28% because of the conclusion of a contract, and flight seeing revenue decreased 3% as a result of fewer passengers flown.
Era Group Incorporated (ERA) BURKENROAD REPORTS (www.burkenroad.org) November 11, 2015
15
PEER ANALYSIS
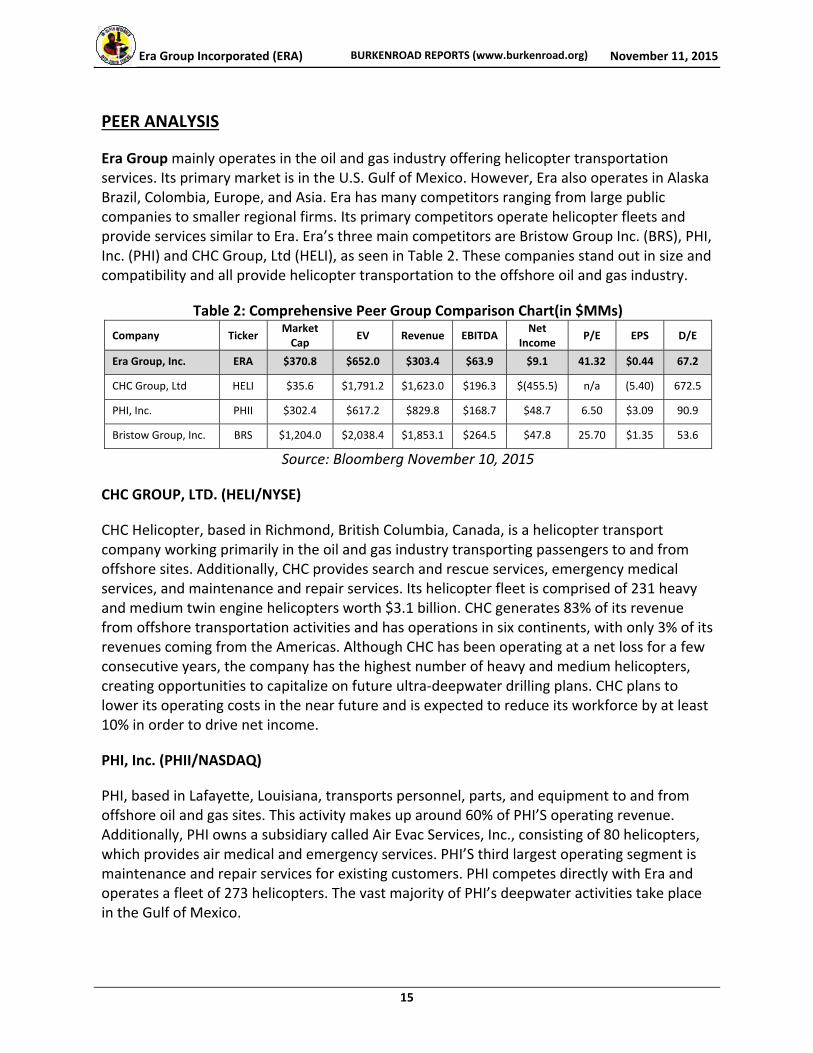
Era Group mainly operates in the oil and gas industry offering helicopter transportation services. Its primary market is in the U.S. Gulf of Mexico. However, Era also operates in Alaska Brazil, Colombia, Europe, and Asia. Era has many competitors ranging from large public companies to smaller regional firms. Its primary competitors operate helicopter fleets and provide services similar to Era. Era’s three main competitors are Bristow Group Inc. (BRS), PHI, Inc. (PHI) and CHC Group, Ltd (HELI), as seen in Table 2. These companies stand out in size and compatibility and all provide helicopter transportation to the offshore oil and gas industry.
Table 2: Comprehensive Peer Group Comparison Chart(in $MMs)
Company Ticker Market Cap EV Revenue EBITDA Net
IncomeP/E EPS D/E
Era Group, Inc. ERA $370.8 $652.0 $303.4 $63.9 $9.1 41.32 $0.44 67.2
CHC Group, Ltd HELI $35.6 $1,791.2 $1,623.0 $196.3 $(455.5) n/a (5.40) 672.5
PHI, Inc. PHII $302.4 $617.2 $829.8 $168.7 $48.7 6.50 $3.09 90.9
Bristow Group, Inc. BRS $1,204.0 $2,038.4 $1,853.1 $264.5 $47.8 25.70 $1.35 53.6
Source: Bloomberg November 10, 2015
CHC GROUP, LTD. (HELI/NYSE)
CHC Helicopter, based in Richmond, British Columbia, Canada, is a helicopter transport company working primarily in the oil and gas industry transporting passengers to and from offshore sites. Additionally, CHC provides search and rescue services, emergency medical services, and maintenance and repair services. Its helicopter fleet is comprised of 231 heavy and medium twin engine helicopters worth $3.1 billion. CHC generates 83% of its revenue from offshore transportation activities and has operations in six continents, with only 3% of its revenues coming from the Americas. Although CHC has been operating at a net loss for a few consecutive years, the company has the highest number of heavy and medium helicopters, creating opportunities to capitalize on future ultra‐deepwater drilling plans. CHC plans to lower its operating costs in the near future and is expected to reduce its workforce by at least 10% in order to drive net income.
PHI, Inc. (PHII/NASDAQ)
PHI, based in Lafayette, Louisiana, transports personnel, parts, and equipment to and from offshore oil and gas sites. This activity makes up around 60% of PHI’S operating revenue. Additionally, PHI owns a subsidiary called Air Evac Services, Inc., consisting of 80 helicopters, which provides air medical and emergency services. PHI’S third largest operating segment is maintenance and repair services for existing customers. PHI competes directly with Era and operates a fleet of 273 helicopters. The vast majority of PHI’s deepwater activities take place in the Gulf of Mexico.

Era Group Incorporated (ERA) BURKENROAD REPORTS (www.burkenroad.org) November 11, 2015
16
Bristow Group Inc. (BRS/NYSE)
Bristow is a helicopter transportation company in the offshore oil and gas industry. Bristow also performs search and rescue, and various aircraft support services. Bristow has the world’s largest helicopter training academy and the second largest air force behind the U.S. military. Bristow’s fleet consists of 48 small helicopters, 172 medium helicopters, 124 large helicopters, 70 training helicopters, and 79 fixed wing helicopters. As seen in Table 2, the company earns the highest revenue among Era’s competitors, most of it coming from overseas.
Milestone Aviation (Independent)
Milestone aviation is a helicopter leasing company that provides financing globally for oil and gas, EMS, search and rescue, police, government and forest operators. The company is a market leader with $3 billion in helicopters that are leased around the globe. Headquartered in Dublin, Ireland, Milestone has additional operations in Colts Neck, New Jersey and Columbus, Ohio in the U.S. In June 2015, GE Capital Aviation Services acquired the company.
Waypoint Leasing (Independent)
Waypoint Leasing is the largest independent global helicopter leasing company that provides operating lease and financing solutions to helicopter operators worldwide. Headquartered in Limerick, Ireland, Waypoint has leased and operated helicopters in more than 20 countries. The company differentiates itself with an experienced senior management team.
MANAGEMENT PERFORMANCE AND BACKGROUND
Era’s management group consists of individuals with substantial experience within the energy industry. Era is managed by nine executive officers under the governance of a Board of seven directors. Three committees, including Audit Committee, Compensation Committee, and Nominating and Corporate Governance Committee, oversee Era’s operations.
Management Compensation and Incentives
In an effort to retain experienced executives and attract new talent, Era implemented the Management Incentive Plan and 2012 Share Incentive Plan providing additional compensation as an incentive for officers to meet higher performance goals. The executive officers’ compensation includes cash compensation, cash bonuses, and equity compensation.
Return on Invested Capital
Return on invested capital (ROIC) evaluates a company’s performance by measuring the income generated relative to the total invested capital. A high ROIC demonstrates how efficiently a company is generating returns. ROIC is commonly compared to the cost of capital of the company to identify if there is value added. Table 3 shows the ROIC of Era in comparison with its peers over the last two years. Data prior to 2013 was excluded for more credibility because Era was not yet separated from SEACOR as an independent company. Era’s ROIC shows an increasing trend relative to its peers.

Era Group Incorporated (ERA) BURKENROAD REPORTS (www.burkenroad.org) November 11, 2015
17
Table 3: Quarterly ROIC of Era Group and Peers
Company 06/30/15 03/31/15 12/31/14 09/30/14 06/30/14
CHC GROUP, LTD. (105.04%) (15,508.95%) (1,099.12%) (369.62%) (1740.80%)
PHI, Inc. ‐ ‐ 8.87% 5.47% 5.46%
Bristow Group, Inc. 2.32% 4.42% 4.91% 5.36% 15.30%
Peer Average 2.32% 4.42% 6.89% 5.42% 10.38%
Era Group, Inc. 3.59% 5.58% 6.99% 3.52% 3.74%
Source: Thomson One October 2015 *CHC excluded from Peer Average calculation
Executive Officers
Christopher S. Bradshaw President and Chief Executive Officer (38)
Since February 2015, Christopher S. Bradshaw has served as the President and Chief Executive Officer of Era in succession of Sten F. Gustafson. Mr. Bradshaw had 13 years of experience in the financial services industry before joining Era. Mr. Bradshaw started his career in investment banking in 1999 and worked at PaineWebber Inc., Morgan Stanley & Co., and UBS Investment Bank through 2009. He then co‐founded U.S. Capital Advisors LLC as a Managing Partner and Chief Financial Officer. Mr. Bradshaw joined Era in 2012 as Executive Vice President and Chief Financial Officer. He has also been a member of the Board of Directors since February 2015.
Andrew L. Puhala Senior Vice President and Chief Financial Officer (45)
Andrew L. Puhala became the Senior Vice President and Chief Financial Officer of Era in September 2015. Mr. Puhala has over 20 years of work experience in the energy industry. After his college graduation, Mr. Puhala began his career at Baker Hughes and stayed for 15 years, serving in various senior management positions. He then joined AccessESP as Vice President and Chief Financial Officer. From early 2013, Mr. Puhala also worked at American Electric Technologies, Inc. as Senior Vice President and Chief Financial Officer for two years before joining Era.
Shefali A. Shah Senior Vice President, General Counsel and Corporate Secretary (43)
Shefali A. Shah has served as Era’s Senior Vice President, General Counsel and Corporate Secretary since March 2014 after serving as the Acting General Counsel and Corporate Secretary from Era’s spin‐off. Prior to joining Era, Ms. Shah worked at Hutchins, Wheeler & Dittmar, and P.C. from 1996 to 2002, and at Weil Gotshal & Manges LLP from 2002 to 2006. Ms. Shah also served as Senior Vice President, General Counsel and Corporate Secretary at Comverse Technology, Inc.
Era Group Incorporated (ERA) BURKENROAD REPORTS (www.burkenroad.org) November 11, 2015
18
Stuart Stavley Senior Vice President, Operations and Fleet Management (42)
Stuart Stavley has served as Era’s Senior Vice President of Operations and Fleet Management since October 2014. Joining Era in 1993, Mr. Stavley started as the Chief Inspector and Field AMT. From 2005 to 2008, he served as the Director of Maintenance and then as Director of Technical Services. Mr. Stavley also led Era’s Fleet Management division as Vice President and Senior Vice President from October 2010 to October 2014.
Paul White Senior Vice President, Commercial (40)
Paul White is Era’s Senior Vice President of Commercial. Early in his career at Era, Mr. White switched roles between Pilot, Check Airman, Senior Check Airman, and Assistant Chief Pilot CFR Part 135 and 133. Mr. White became Director of Training at the Era Training Center in 2007 and General Manager in 2008. Additionally, Mr. White served as Era’s Vice President, General Manager Gulf of Mexico from August 2010 to October 2012 and as Senior Vice President ‐ Domestic From October 2012 to October 2014.
Benjamin J. Slusarchuk Vice President, Corporate Development and Finance (32)
Benjamin J. Slusarchuk has served as Era’s Vice President of Corporate Development and Finance since December 2014, after serving as Vice President of Finance for a year. Mr. Slusarchuk started his seven‐year energy investment banking career at CIBC World Markets in 2005. He then joined Deutsche Bank’s Global Natural Resources Group as an Associate in 2011 prior to joining Era.
Cory Theriot Vice President, Safety & Quality Assurance (45)
In his early career, Cory Theriot served as an Aviation Insurance Risk Auditor at a subsidiary of Lloyds of London, identifying operational hazards and providing solutions for corresponding risks. He has conducted work in the oil and gas sectors worldwide. Before joining Era, Mr. Theriot also worked at Shell Oil Co. as an Aviation Manager, where he managed aviation contractors for over 13 years.
Jennifer Whalen Vice President and Chief Accounting Officer (41)
Jennifer Whalen assumed the role of Era’s Vice President and Chief Accounting Officer in August 2013, after serving as Era’s Controller for a year. Ms. Whalen started her career at PricewaterhouseCoopers LLP in assurance and moved to InFocus Corporation as the Manager of Accounting for two years. Prior to joining Era, Ms. Whalen had also served as Director of Accounting at nLIGHT Photonics Corporation.
Era Group Incorporated (ERA) BURKENROAD REPORTS (www.burkenroad.org) November 11, 2015
19
Michael May Chief Technology Officer
Michael May is the Chief Accounting Officer, a role he assumed in May 2013. Mr. May started his career as a technician in the U.S. Army. He switched among various information technology roles at Dresser, Inc., and Soma Tech. Then, from February 2011 to May 2013, Mr. May served as the IM Leader Business Solutions at GE.
Board of Directors
The Board of Directors consists of seven members, including
Charles Fabrikant, Non‐Executive Chairman of the Board
Christopher S. Bradshaw, Era’s Chief Executive Officer
Blaine V. ("Fin") Fogg, former Director of the Board at SEACOR
Steven Webster, former Director of the Board at SEACOR
Ann Fairbanks, Founder and Chairman of The Fairbanks Investment Fund
Christopher Papouras, President of Canrig Drilling Technology, Ltd.
Yueping Sun, Counselor for Yetter Coleman LLP
SHAREHOLDER ANALYSIS
As of October, 2015, Era Group had 20,582,391 shares outstanding and 19,434,777 shares floating. Era’s top ten stockholders control 63.72% of its shares outstanding.
Table 4 lists the top ten shareholders along with their respective percentage of ownership interest and change in ownership. Five out of the ten largest investors acquired more Era Group stock in the last period, two of which increased holdings by over 10%. The other five shareholders recently decreased their positions. The information given in Table 4 is essential for investors because adjustments by primary shareholders may have an impact on the market expectation for the value of Era’s stock.

Era Group Incorporated (ERA) BURKENROAD REPORTS (www.burkenroad.org) November 11, 2015
20
Table 4: Top Ten Shareholders as of October 9, 2015
No Investor Name % of Shares Outstanding
Latest Position Change
1 Wellington Management Company, LLP 13.49% (1.37%)
2 BlackRock Institutional Trust Company, N.A. 8.45% (0.84%)
3 Dimensional Fund Advisors, L.P. 7.43% 4.61%
4 Amici Capital, LLC 6.73% 21.15%
5 Century Management 6.30% (7.16%)
6 Senvest Management, LLC 5.25% 3.70%
7 Thomson Horstmann & Bryant, Inc. 4.27% 11.92%
8 Royce & Associates, LLC 4.07% (2.12%)
9 The Vanguard Group, Inc. 4.05% 1.13%
10 Fabrikant (Charles L) 3.68% (13.59%)
Source: Thomson One October 2015
Table 5 lists Era’s inside shareholders. The Table includes the name, position, total holdings, and the percentage of shares held relative to the total shares held by Era’s insiders. This table may give investors a better understanding of the stock’s prospects.
Table 5: Insider Holdings as of October 9, 2015
No Insider Name Title Total Holdings
Shares Outstanding (%)
1 Fabrikant (Charles L) Chairman of the Board 775,653 58.01%
2 Lorentzen (Oivind III) Director 164,232 12.28%
3 Gustafson (Sten L) Former Chief Executive Officer
85,542 6.40%
4 Bradshaw (Christopher Scott) Chief Executive Officer 73,556 5.50%
5 Shah (Shefali A) General Counsel 44,821 3.35%
6 Stavley (Stuart) Officer 38,797 2.90%
7 Webster (Steven A) Director 35,892 2.68%
8 White (Paul T) Officer 24,001 1.80%
9 Reguero (Robert) Officer 15,130 1.13%
10 Rowles (Randal Rock) Officer 15,000 1.12%
11 Fogg (Blaine V) Director 14,555 1.09%
12 Fairbanks (Ann O’Connor) Director 13,680 1.02%
13 Whalen (Jennifer Dawn) Officer 12,626 0.94%
14 Sun (YuePing) Director 11,805 0.88%
15 Papouras (Christopher Pashalis) Director 11,805 0.88%
Total 1,337,095 100.00%
Source: Thomson One October 2015

Era Group Incorporated (ERA) BURKENROAD REPORTS (www.burkenroad.org) November 11, 2015
21
Table 6 analyzes different styles of investors who own Era’s shares, with the corresponding number of investors and value of the invested capital. The Table includes information reflecting Era’s long term growth potential, indicating that Era has a relatively stable spread among different styles of investors.
Table 6: Investor Style as of October 9, 2015
Investment Style Investors Value ($MM)
Index 31 85.64
Core Growth 38 68.59
Hedge Fund 33 67.91
Core Value 26 67.72
Deep Value 16 50.78
Growth At A Reasonable Price (GARP) 29 27.41
Income Value 4 5.15
Broker‐Dealer 17 2.26
Sector Specific 1 1.46
Growth 10 1.42
Aggressive Growth 4 0.46
Specialty 1 0.00
Yield 1 0.00
Source: Thomson One October 2015
RISK ANALYSIS AND INVESTMENT CAVEATS
Era’s business is susceptible to many industry and Company risks that can be broken into three categories: operational risks, regulatory risks, and financial risks.
Operating Risks
Heavy Reliance on Offshore Oil and Gas
Approximately 75% of Era’s operating revenue stems from companies operating in offshore oil and gas exploration. Levels of offshore activity are historically volatile, moving with the cyclical patterns of oil and gas prices. When oil and gas prices drop for a long period of time, off shore activity decreases. As a result, demand for Era’s services decline, which creates pressure on prices.
Few Customers with Flexible Contracts
Dependence on few large customers and flexible contracts also pose a risk for Era. For example, Anadarko, BSEE, Shell, and Williams account for 48% of revenues. These companies have a significant impact on Era’s rates and demand. A contract loss or decrease in demand from any of these customers would have significant impact on Era’s Earnings.

Era Group Incorporated (ERA) BURKENROAD REPORTS (www.burkenroad.org) November 11, 2015
22
Also, Era’s contracts in the U.S. Gulf of Mexico and Alaska generally allow companies to cancel a contract at any point in time without penalty. Additionally these contracts do not lock in any specific amounts of services. Consequently, Era’s customers can decrease the number of helicopters in the contract at its own discretion. A large portion of Era’s operating costs are due to crew wages, insurance, and maintenance programs. These fixed costs must be paid regardless of whether Era’s helicopters are actively being used by the customer.
Unpredictable and Random Events
Various unforeseeable risks also impact Era. These risk include extreme weather conditions, crashes, injuries, mechanical failure, and damage to equipment and property. Most of these events would result in the loss of revenue, existing contracts, and customers. It is worth noting that Era has experienced these types of accidents before. In 2012 there were two EC225 helicopter ditchings in the industry, one of which was owned by Era but leased and operated by a third party. As a result, global operators suspended EC225 helicopter operations from October 2012 until July 2013.
Few Helicopter Manufacturers and Suppliers
Era uses three companies for fleet expansion and replacement. If any of these manufacturers experience production delays, Era’s helicopters do not get delivered on time. Also, Era’s suppliers sometimes have a shortage of aircraft parts needed for maintenance. Another risk is increased manufacturing costs that could be passed on to Era.
Mature Exploration and Production in U.S. Gulf of Mexico and Alaska
Approximately, 75% of Era’s revenue from oil and gas activities relate to services in the U.S. Gulf of Mexico and Alaska. These areas have been explored and drilled for many years and drilling opportunities are becoming harder to find. Although it is difficult to forecast the number of oil and gas prospects left in these regions, we know that the number is declining and could reach a point where operating in these regions are no longer economical.
Regulatory Risks
Foreign Ownership of Common Stock
Since Era is a U.S. company and operates mostly in the U.S., the U.S. Department of Transportation and Federal Aviation Administration require that 75% of Era’s outstanding voting stock be held by U.S. citizens. If Era does not follow this regulation it would be required to cease operating activities in the U.S.
Environmental Regulation and Liabilities
The government is becoming more strict than ever before in regulating the use of energy. These laws and regulations change often and are hard to predict. However, most of the laws and regulations reduce demand for hydrocarbon‐base fuels impacting the demand for Era’s services. These frequently changing regulations must be watched closely as they can increase costs and adversely affect Era’s business.

Era Group Incorporated (ERA) BURKENROAD REPORTS (www.burkenroad.org) November 11, 2015
23
Financial Risks
Capital Intensive Industry
Era’s needs a large sum of capital in order to expand its fleet. Unfortunately, Era does not generate enough cash from operations to raise additional funds. Consequently, Era may need to borrow money to raise capital, increasing interest expenses. Era could also raise capital by issuing new equity, resulting in diluted share prices. Thus, if Era’s funding is unfavorable, Era may have difficulty raising capital.
Foreign Currencies and Exchange Rates
Approximately 22% of Era’s revenues are derived internationally. Consequently, a large portion of purchasing and maintenance costs are paid in foreign currencies and are subject to exchange rate risks. However, international customers pay for Era’s services in the U.S. dollar. So when the U.S. dollar is strong Era’s rates increase but demand decreases among international customers.
Subsidiary Interest
Era has investments in five subsidiaries: Dart, Aeroleo, Era Do Brazil, Era Training Center, and Hell‐Union Era Australia. The Company owns 50% or less interest in each subsidiary. Era’s financial condition and profits can be impacted by the performance of these entities.
FINANCIAL PERFORMANCE AND PROJECTIONS
Era Group’s financial performance is aligned with the overall industry. Although Era may demonstrate less satisfying performance in the currently bearish market, it exhibits a promising future outlook and growth potential. We made several operating, investing, and financing assumptions in our forecasting of Era’s 12‐month target price of $12.00. These underlying assumptions are essential to the whole valuation model.
Operating Activities
We built a regression model to predict Era’s quarterly operating revenues from the third quarter of 2015 to the fourth quarter of 2016, and we used the average quarterly growth rate as the yearly growth rate to calculate annual revenues from 2017 to 2025. We employed seven variables in our regression model to arrive at the most accurate approximation. These variables include binomial seasonal factors, gas price, Era’s helicopter counts, oil rig counts of the Gulf of Mexico, occurrence of good events, and occurrence of credit crisis. We only considered the first quarter and the third quarter as seasonal factors because they proved to be much more relevant than the other two quarters. We also assumed that the impact of gas prices and helicopter counts would not become evident until several quarters later. In helicopter counts, we excluded light helicopters counts which was not a significant variable. We included occurrence of good events and credit crisis, which only occurred in the past, for the purpose of a better explained model.
Era Group Incorporated (ERA) BURKENROAD REPORTS (www.burkenroad.org) November 11, 2015
24
We forecasted Era’s administrative and general costs by building another regression model using historical revenues and seasonal factors as drivers. Operating costs, nevertheless, were calculated using a percentage of revenue because we expect stable future operating costs compared to revenues.
Investing Activities
We used the lace model to forecast the number of helicopters that the Company will own until 2024. Under the assumption that heavy helicopters generate the highest revenues, the lace model predicts future earnings using heavy helicopters as an index. Era’s heavy helicopters generate around 2.6 times the revenue generated by medium helicopters and around seven times the revenue generated by light helicopters. We divided the number of light and medium helicopters by the two multiples and arrived at the heavy helicopter indexes of the three types of helicopters, which added up to the lace rate. Lace rate is the equivalent number of heavy helicopters the Company owns. We derived a dollar lace rate by dividing revenues by the lace rate, which denotes how much revenue an equivalent heavy helicopter generates. Then, we calculated the growth rate of lace rates and applied this growth rate to future forecasts. Finally, the Company will have stable growth in the number of helicopters which provides a stable source of earnings and coincides with the Company’s operating metrics.
Financing Activities
In our forecast of Era’s financing activities, we expect that the Company will be able to utilize its operating revenues, deferred taxes, and credit revolver for future operations. According to the Company’s announcements, we forecast that it will pay off the $85 million long‐term debt, which matures in 2019, and issue $50 million more long‐term debt. We forecast proceeds from credit facility to be $30 million in 2016, $30 million in 2017, $25 million in 2018, and $65 million in 2019. Although Era will be issuing debt and borrowing from the credit facility, we believe that the Company will be able to repay its debt because it reinvests most of the money in revenue‐earning facilities.
SITE VISIT
On Friday, October 24, 2015, our team of analysts travelled to Lake Charles, Louisiana to visit Era’s headquarters. We arrived at the Era Training center where we were greeted by the Communication Coordinator, Melanie Landry, who led us to the conference room where we were introduced to Benjamin Slusarchuk, Vice President of Corporate Development and Finance. Mr. Slusarchuk ate lunch with us and allowed our team to ask questions about the Company.
Mr. Slusarchuk explained his background and his role within the Company and then provided our team with a Company overview. He mentioned the Company’s market capitalization of $340 million. We asked him to comment on Era’s price to book value ratio of approximately 0.60 and Mr. Slusarchuk pointed out that most companies in the oil and gas industry are trading below book value.

Era Group Incorporated (ERA) BURKENROAD REPORTS (www.burkenroad.org) November 11, 2015
25
We asked whether the Company had any plans to repurchase shares in order to drive the stock price closer to fair value. Mr. Slusarchuk said Era is in the midst of evaluating share buybacks. Next, Mr. Slusarchuk talked about Era’s areas of operations and commented on breaking developments in Brazil. The day before our visit, Aeroleo Taxi Aero, Era’s Brazilian joint venture, announced that Petrobras would be canceling its tender process for 4 EC225 heavy helicopters and 4 AW139 medium helicopters. The stock responded by plummeting over 16%. Mr. Slusarchuk mentioned that Petrobras may ultimately need a portion of those fleets. In the meantime, Era will be looking for a new home for these helicopters.
Our conversation then shifted to the current state of the industry. Mr. Slusarchuk stated that he has a bearish attitude towards the oil and gas market, and he does not expect a rebound until 2017. To mitigate that risk, Era is cutting costs by cutting employees and creating a more efficient training program. Mr. Slusarchuk emphasized that Era is armed to face this market because of its healthy leverage and ample liquidity. Following our discussion of the poor microeconomic condition, I asked Mr. Slusarchuk about the trend of upstream companies drilling further offshore. Mr. Slusarchuk explained that when oil companies move further offshore there is an exponential increase in demand for helicopters. “Since these longer flights take more fuel, typically less personal can be on a given helicopter, which leads to more trips,” he said. Mr. Slusarchuk helped us gain a better understanding of the industry and Era’s position in the market.
After the meeting with Mr. Slusarchuk, we were taken to one of the Flight Training Devices. These simulators help train the pilots and can simulate all possible flying conditions. Every member of our group had the opportunity to use the device. We all had a lot of fun with the simulated flight, although none of the flights were too successful. Lastly, we were taken to see the helicopters up close and we were surprised at just how big they were. All in all, the site visit was a unique and valuable experience.
Site Visit Photo

Era Group Incorporated (ERA) BURKENROAD REPORTS (www.burkenroad.org) November 11, 2015
26
INDEPENDENT OUTSIDE RESEARCH
Era Group is a small‐cap company underfollowed by wall street. Consequently, there is a shortage of information about Era circulating around the investment world. So, in order to maximize our knowledge of the Company before heading to meet with Era’s management, our team reached out to the few analysts covering the Company. We spoke with two analysts who wanted to stay anonymous. We first asked the analysts if they believed Era’s stock price has been unfairly correlated with the price of crude oil. Both analysts said Era’s stock price has been fairly correlated with the prices of oil and gas, citing recent earnings. One analyst emphasized that in the current macroeconomic environment there is an oversupply of helicopters. He also related that upstream companies frequently drop service companies that do not reduce rates during hard times. We continued to discuss the effect of oil and gas prices on the state of the industry and we asked the analysts how they thought oil prices would move in future. Both analysts hesitantly said they believe oil and gas prices will increase in the next six to 12 months, but they did not know to what extent.
Next, we asked the analysts whether they believed Era differentiates itself from its competitors. The consensus was that there is not much variation between helicopter service companies operating in the oil and gas industry. However, Era is well known for its safety measures in the industry, but it lacks some diversity in its fleet.
Then, we moved to the topic of oil and gas companies moving further offshore. Due to new technology and the prospect of drilling in deeper water, companies are drilling farther out in the ocean. This is a positive trend for helicopter services companies. As one of the analysts mentioned, as upstream oil and gas companies move further offshore, both flight time and demand for heavy helicopters increases. Additionally, the number of personnel needing transportation increases because deep water drilling is typically a bigger operation. The other analyst was wary about looking too optimistically at this trend. He wanted to make it clear that although oil and gas companies have been looking to drill further offshore, most companies are not exploring for new reserves in the current macroeconomic conditions.
Lastly, we brought up Era’s cheap trading price. Era’s market capitalization is roughly half of its book value. Theoretically, somebody could buy Era, liquidate all its assets and make a huge profit. I asked the analysts whether Era’s stock price was bound to rise and reach its fair value. They pointed out that Era has announced a plan to repurchase stock but the Company has been changing the amount of shares it intends to buy.
Ultimately, our independent outside research gave us new perspective on Era and the industry going into the site visit.
Era Group Incorporated (ERA) BURKENROAD REPORTS (www.burkenroad.org) November 11, 2015
27
ANOTHER WAY TO LOOK AT IT
ALTMAN Z‐SCORE
The Altman Z‐Score, created in 1968 by Edward Altman, analyzes a company’s risk of bankruptcy. The formula adds a weighted average of working capital/total assets, retained earnings/total assets, earnings before interest and taxes/total assets, market value of equity/ book value of total liabilities, and sales/total assets. A company with a score of 3.0 or higher has a low risk of default. A score between 1.8 and 2.99 signifies a risk of default in the next two years. And a score below 1.8 signals a high possibility of bankruptcy.
Many problems exist with the Z‐score Analysis: it only uses five factors, it was designed for manufacturing companies, it works poorly for financial companies, and its weight factors do not change with time. Era has a low Z‐Score of 0.73, indicating a high probability of bankruptcy. However, we do not believe the Altman Z‐score is a good indicator of bankruptcy for Era. The ratios used in calculating the Z‐score rely on total assets as a denominator. Era must have a large amount of assets to generate revenue. Ultimately, we don’t believe Era is at a high risk of default.
PETER LYNCH EARNINGS MULTIPLE VALUATION
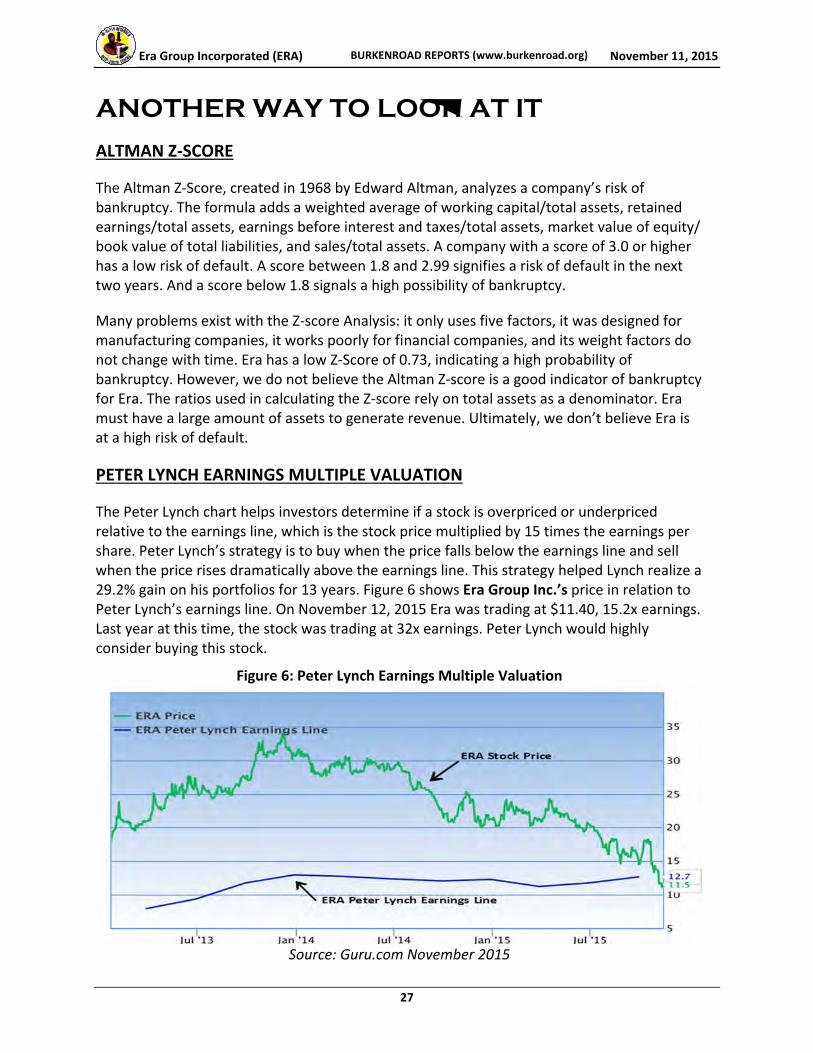
The Peter Lynch chart helps investors determine if a stock is overpriced or underpriced relative to the earnings line, which is the stock price multiplied by 15 times the earnings per share. Peter Lynch’s strategy is to buy when the price falls below the earnings line and sell when the price rises dramatically above the earnings line. This strategy helped Lynch realize a 29.2% gain on his portfolios for 13 years. Figure 6 shows Era Group Inc.’s price in relation to Peter Lynch’s earnings line. On November 12, 2015 Era was trading at $11.40, 15.2x earnings. Last year at this time, the stock was trading at 32x earnings. Peter Lynch would highly consider buying this stock.
Figure 6: Peter Lynch Earnings Multiple Valuation
Source: Guru.com November 2015

Era Group Incorporated (ERA) BURKENROAD REPORTS (www.burkenroad.org) November 11, 2015
28
WWBD? What Would Ben (Graham) Do?
Ben Graham, often referred to as the father of value investing, was a renowned American economist and investor. Graham developed a series of eight hurdles to evaluate a company. Six of the hurdles examine the company’s current value while the other two examine the target company’s future growth potential. To qualify as an attractive investment option for Graham, a stock must satisfy at least four out of the eight quantifiers.
Era Group passes six of the eight hurdles. With a 6.26% earnings to price yield and a 16.0 price to earnings ratio, Era passes the first and second hurdle. The third hurdle, which tests dividend yield, is not applicable because Era does not pay dividends. Era satisfies the fourth and the fifth hurdle with a stock price less than 1.5 times of its book value and with total debt less than its book value. Era fails the sixth hurdle with a current ratio less than two. Overall, the results from the first six hurdles suggest that Era’s stock is undervalued. The last two hurdles indicate that Era has high and stable earnings growth.
Therefore, the thorough Ben Graham analysis puts Era at the higher level of the “Attractive to Ben” rating, as Era passes six of the eight hurdles. This rating implies to potential investors that Era proves to be a safe investment choice with implicit value and strong future growth potential.
Figure 7: Ben Graham Dial

Era Group Incorporated (ERA) BURKENROAD REPORTS (www.burkenroad.org) November 11, 2015
29
Figure 8: Ben Graham Analysis
Earnings per share (ttm) 0.73$ Price: 11.68$
Earnings to Price Yield 6.26%
10 Year Treasury (2X) 4.64%
P/E ratio as of 2012 A ‐
P/E ratio as of 2013 A 35.2
P/E ratio as of 2014 A 24.9
Current P/E Ratio 16.0
Dividends per share (ttm) ‐$ Price: 11.68$
Dividend Yield 0.00%
1/2 Yield on 10 Year Treasury 1.16%
Stock Price 11.68$
Book Value per share as of 9/30/2015 23.62$
150% of book Value per share as of 9/30/2015 35.43$
Interest‐bearing debt as of 9/30/2015 242,873$
Book value as of 9/30/2015 478,507$
Current assets as of 9/30/2015 88,379$
Current liabilities as of 9/30/2015 61,446$
Current ratio as of 9/30/2015 1.4
EPS for year ended 2014 A 0.85$
EPS for year ended 2013 A 0.88$
EPS for year ended 2012 A (0.03)$
EPS for year ended 2014 A 0.85$ ‐3%
EPS for year ended 2013 A 0.88$ 3%
EPS for year ended 2012 A (0.03)$
Stock price data as of November 11, 2015
Yes
Hurdle # 3: A Dividend Yield of 1/2 the Yield on 10 Year Treasury
Hurdle # 4: A Stock Price less than 1.5 BV
No
Yes
Hurdle # 6: Current Ratio of Two or More
Hurdle # 7: Earnings Growth of 7% or Higher over past 5 years
No
Yes
Hurdle # 5: Total Debt less than Book Value
Hurdle # 8: Stability in Growth of Earnings
Yes
Yes
ERA Group Inc. (NYSE: ERA)
Hurdle # 1: An Earnings to Price Yield of 2X the Yield on 10 Year Treasury
Ben Graham Analysis
Yes
Hurdle # 2: A P/E Ratio Down to 1/2 of the Stocks Highest in 5 Yrs

Era Group In
corporated (ER
A)
BURKEN
ROAD REP
ORTS (www.burken
road
.org)
November 11, 2015
30
ERA Group Inc. (NYSE: ERA)
Quarterly and Annual Earnings
In thousands
For the period ended
2012 A
2013 A
2014 A
31‐M
ar‐15 A
30‐Jun‐15 A
30‐Sep‐15 A
31‐Dec‐15 E
2015 E
31‐M
ar‐16 E
30‐Jun‐16 E
30‐Sep‐16 E
31‐Dec‐16 E
2016 E
Operating revenues
272,921
$
298,959
$
331,222
$
67,415
$
70,738
$
69,741
$
69,739
$
277,633
$
65,694
$
68,957
$
76,251
$
71,009
$
281,910
$
Costs and expenses:
‐
Operating
167,195
186,612
204,373
43,605
39,784
43,007
44,037
170,433
41,441
42,277
46,949
44,839
175,505
Administrative
and general
34,785
38,924
43,987
9,743
10,779
11,238
7,870
39,630
7,874
7,454
8,016
8,018
31,361
Depreciation
42,502
45,561
46,312
11,602
11,398
12,186
12,068
47,254
12,221
12,374
12,527
12,680
49,801
Total costs and expenses
244,482
271,097
294,672
64,950
61,961
66,431
63,975
257,317
61,535
62,104
67,492
65,537
256,667
Gross profit
28,439
27,862
36,550
2,465
8,777
3,310
5,764
20,316
4,159
6,853
8,759
5,472
25,243
Gains on asset dispositions and impairments, net
3,612
18,301
6,101
3,388
(242)
1,813
4,959
Operating income (loss)
32,051
46,163
42,651
5,853
8,535
5,123
5,764
25,275
4,159
6,853
8,759
5,472
25,243
Other income (expense):
Interest income
910
591
540
251
317
232
68
868
41
62
106
130
339
Interest expense
(10,648)
(18,050)
(14,778)
(3,545)
(2,881)
(3,121)
(2,974)
(12,521)
(3,030)
(3,140)
(3,196)
(3,251)
(12,617)
Gain on debts extinguishment
264
(16)
248
SEACOR m
anagement fees
(2,000)
(168)
Derivative
gains (losses), net
(490)
(104)
(944)
(12)
(10)
8
(14)
Note receivable impairment
(2,457)
Foreign currency gains (losses), net
720
698
(2,377)
(2,960)
543
146
(2,271)
Gain on sale of FBO
12,946
12,946
Other, net
30
19
(4)
(9)
(9)
Total other
(11,478)
(17,014)
(20,020)
(6,002)
10,906
(2,751)
(2,907)
(754)
(2,989)
(3,078)
(3,090)
(3,122)
(12,279)
Income (loss) before income taxes and noncontrolling interest
20,573
29,149
22,631
(149)
19,441
2,372
2,857
24,521
1,170
3,775
5,669
2,350
12,964
Income tax expense (benefit)
Current
(51,213)
4,591
1,235
(55)
8,138
1,343
1,099
10,525
481
1,541
2,314
973
5,309
Deferred
58,511
7,136
7,050
Total Taxes
7,298
11,727
8,285
(55)
8,138
1,343
1,099
10,525
481
1,541
2,314
973
5,309
Net income before noncontrolling interest
13,275
17,422
14,346
(94)
11,303
1,029
1,758
13,996
689
2,234
3,355
1,377
7,655
Net income (loss) attributable to noncontrolling interest
(5,528)
Income (loss) before equity in earnings (losses) of 50% or less owned companies
7,747
17,422
14,346
(94)
11,303
1,029
1,758
13,996
689
2,234
3,355
1,377
7,655
Equity earnings (losses), net of tax
882
2,675
(145)
(198)
(376)
(719)
Net Income (loss)
7,747
18,304
17,021
(239)
11,105
653
1,758
13,277
689
2,234
3,355
1,377
7,655
Net Income (loss) attributable to noncontrolling interest in is subsidiary
40
401
96
197
228
208
633
Net Income (loss) attributable to Era Group Inc.
7,787
18,705
17,117
(42)
11,333
861
1,758
13,910
689
2,234
3,355
1,377
7,655
Accretion of redemption value on series A preferred stock
8,469
721
Net income (loss) attributable to common shares
(682)
$
17,984
$
17,117
$
(42)
$
11,333
$
861
$
1,758
$
13,910
$
689
$
2,234
$
3,355
$
1,377
$
7,655
$
Net income (loss) per common share:
Basic
Net income (loss)
(0.03)
$
0.88
$
0.85
$
(0.00)
$
0.56
$
0.04
$
0.09
$
0.69
$
0.03
$
0.11
$
0.16
$
0.07
$
0.37
$
Diluted
Net income (loss)
(0.03)
$
0.88
$
0.85
$
(0.00)
$
0.56
$
0.04
$
0.09
$
0.68
$
0.03
$
0.11
$
0.16
$
0.07
$
0.37
$
Weighted average shares outstanding:
Basic
24,500
20,489
20,073
20,196
20,274
20,260
20,293
20,293
20,359
20,422
20,485
20,546
20,546
Diluted
24,500
20,489
20,140
20,196
20,333
20,287
20,353
20,353
20,419
20,482
20,545
20,606
20,606
SELECTED COMMON‐SIZE AMOUNTS (as %
of Revenue)
Operating Costs
61.26%
62.42%
61.70%
64.68%
56.24%
61.67%
63.15%
63.15%
63.08%
61.31%
61.57%
63.15%
62.28%
Administrative
and general
12.75%
13.02%
13.28%
14.45%
15.24%
16.11%
11.29%
14.27%
11.99%
10.81%
10.51%
11.29%
11.12%
Gross profit
10.42%
9.32%
11.03%
3.66%
12.41%
4.75%
8.26%
7.32%
6.33%
9.94%
11.49%
7.71%
8.95%
Gains on asset dispositions and impairments, net
1.32%
6.12%
1.84%
5.03%
‐0.34%
2.60%
0.00%
1.79%
0.00%
0.00%
0.00%
0.00%
0.00%
Operating income (loss)
11.74%
15.44%
12.88%
8.68%
12.07%
7.35%
8.26%
9.10%
6.33%
9.94%
11.49%
7.71%
8.95%
Income (loss) before income taxes and noncontrolling interest
7.54%
9.75%
6.83%
‐0.22%
27.48%
3.40%
4.10%
8.83%
1.78%
5.47%
7.43%
3.31%
4.60%
Income (loss) before equity in earnings (losses) of 50% or less owned companies
2.84%
5.83%
4.33%
‐0.14%
15.98%
1.48%
2.52%
5.04%
1.05%
3.24%
4.40%
1.94%
2.72%
YEAR TO YEAR CHANGE
Operating revenues
5.72%
9.54%
10.79%
‐15.14%
‐18.30%
‐22.95%
‐6.63%
‐16.18%
‐2.55%
‐2.52%
9.33%
1.82%
1.54%
Operating Costs
2.76%
11.61%
9.52%
‐12.16%
‐27.24%
‐20.77%
‐3.79%
‐16.61%
‐4.96%
6.27%
9.17%
1.82%
2.98%
Gains on asset dispositions and impairments, net
n/a
406.67%
‐66.66%
n/a
‐107.71%
4216.67%
n/a
‐18.72%
n/a
n/a
n/a
n/a
n/a
Income (loss) before income taxes and noncontrolling interest
‐92.03%
41.69%
‐22.36%
‐102.34%
162.04%
‐59.75%
‐2.85%
8.35%
‐885.28%
‐80.58%
138.98%
‐17.75%
‐47.13%
Income (loss) before equity in earnings (losses) of 50% or less owned companies
n/a
124.89%
‐17.66%
‐102.43%
142.55%
‐82.54%
‐40.21%
‐2.44%
‐833.40%
‐80.23%
226.01%
‐21.69%
‐45.31%
Segment data pulled from Seacor (CKH)
2016 E
2015 E
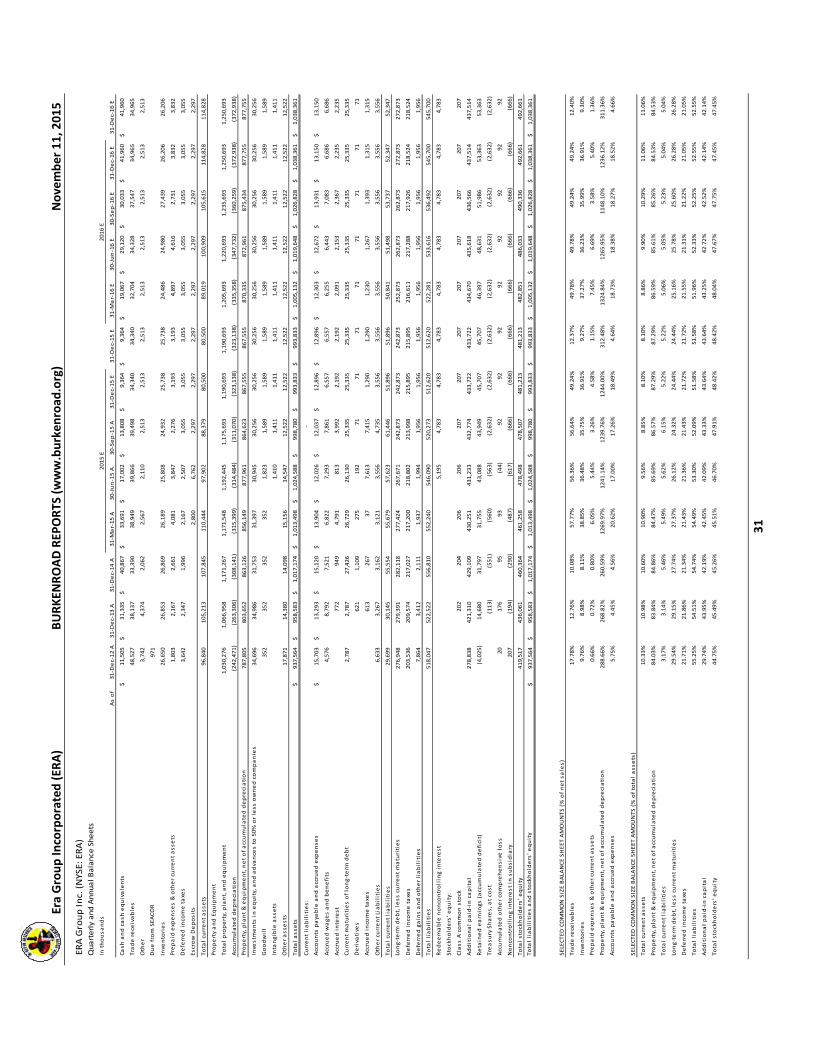
Era Group In
corporated (ER
A)
BURKEN
ROAD REP
ORTS (www.burken
road
.org)
November 11, 2015
31
ERA Group Inc. (NYSE: ERA)
Quarterly and Annual Balance Sheets
In thousands
As of
31‐Dec‐12 A
31‐Dec‐13 A
31‐Dec‐14 A
31‐M
ar‐15 A
30‐Jun‐15 A
30‐Sep‐15 A
31‐Dec‐15 E
31‐Dec‐15 E
31‐M
ar‐16 E
30‐Jun‐16 E
30‐Sep‐16 E
31‐Dec‐16 E
31‐Dec‐16 E
Cash and cash equivalents
11,505
$
31,335
$
40,867
$
33,691
$
17,002
$
13,808
$
9,364
$
9,364
$
19,067
$
29,120
$
30,033
$
41,960
$
41,960
$
Trade receivables
48,527
38,137
33,390
38,949
39,866
39,498
34,340
34,340
32,704
34,328
37,547
34,965
34,965
Other
3,742
4,374
2,062
2,567
2,110
2,513
2,513
2,513
2,513
2,513
2,513
2,513
2,513
Due from SEACOR
971
Inventories
26,650
26,853
26,869
26,189
25,808
24,932
25,738
25,738
24,486
24,980
27,439
26,206
26,206
Prepaid expenses & other current assets
1,803
2,167
2,661
4,081
3,847
2,276
3,193
3,193
4,897
4,616
2,731
3,832
3,832
Deferred income taxes
3,642
2,347
1,996
2,167
2,507
3,055
3,055
3,055
3,055
3,055
3,055
3,055
3,055
Escrow Deposits
2,800
6,762
2,297
2,297
2,297
2,297
2,297
2,297
2,297
2,297
Total current assets
96,840
105,213
107,845
110,444
97,902
88,379
80,500
80,500
89,019
100,909
105,615
114,828
114,828
Property and Equipment
Total property, plant, and equipment
1,030,276
1,066,958
1,171,267
1,171,548
1,192,445
1,175,693
1,190,693
1,190,693
1,205,693
1,220,693
1,235,693
1,250,693
1,250,693
Accumulated depreciation
(242,471)
(263,306)
(308,141)
(315,399)
(314,484)
(311,070)
(323,138)
(323,138)
(335,358)
(347,732)
(360,259)
(372,938)
(372,938)
Property, plant & equipment, net of accumulated depreciation
787,805
803,652
863,126
856,149
877,961
864,623
867,555
867,555
870,335
872,961
875,434
877,755
877,755
Investm
ents in equity, and advances to 50% or less owned companies
34,696
34,986
31,753
31,397
30,945
30,256
30,256
30,256
30,256
30,256
30,256
30,256
30,256
Goodwill
352
352
352
352
1,823
1,589
1,589
1,589
1,589
1,589
1,589
1,589
1,589
Intangible assets
1,410
1,411
1,411
1,411
1,411
1,411
1,411
1,411
1,411
Other assests
17,871
14,380
14,098
15,156
14,547
12,522
12,522
12,522
12,522
12,522
12,522
12,522
12,522
Total assets
937,564
$
958,583
$
1,017,174
$
1,013,498
$
1,024,588
$
998,780
$
993,833
$
993,833
$
1,005,132
$
1,019,648
$
1,026,828
$
1,038,361
$
1,038,361
$
Current liabilities:
‐
Accounts payable and accrued expenses
15,703
$
13,293
$
15,120
$
13,904
$
12,026
$
12,037
$
12,896
$
12,896
$
12,303
$
12,672
$
13,931
$
13,150
$
13,150
$
Accrued wages and benefits
4,576
8,792
7,521
6,822
7,293
7,861
6,557
6,557
6,255
6,443
7,083
6,686
6,686
Accrued interest
772
949
4,791
813
3,992
2,192
2,192
2,091
2,153
2,367
2,235
2,235
Current maturities of long‐term
debt
2,787
2,787
27,426
26,729
26,130
25,335
25,335
25,335
25,335
25,335
25,335
25,335
25,335
Derivatives
621
1,109
275
192
71
71
71
71
71
71
71
71
Accrued income taxes
613
267
37
7,613
7,415
1,290
1,290
1,230
1,267
1,393
1,315
1,315
Other current Liabilities
6,633
3,267
3,162
3,121
3,556
4,735
3,556
3,556
3,556
3,556
3,556
3,556
3,556
Total current liabilities
29,699
30,145
55,554
55,679
57,623
61,446
51,896
51,896
50,841
51,498
53,737
52,347
52,347
Long‐term
debt, less current maturities
276,948
279,391
282,118
277,424
267,671
242,873
242,873
242,873
252,873
262,873
262,873
272,873
272,873
Deferred income taxes
203,536
209,574
217,027
217,200
218,802
213,998
215,895
215,895
216,611
217,288
217,926
218,524
218,524
Deferred gains and other liabilities
7,864
3,412
2,111
1,937
1,994
1,956
1,956
1,956
1,956
1,956
1,956
1,956
1,956
Total liabilities
518,047
522,522
556,810
552,240
546,090
520,273
512,620
512,620
522,281
533,616
536,492
545,700
545,700
Redeemable noncontrolling interest
5,195
4,783
4,783
4,783
4,783
4,783
4,783
4,783
4,783
Stockholders' equity:
Class A common stock
202
204
206
206
207
207
207
207
207
207
207
207
Additional paid‐in capital
278,838
421,310
429,109
430,251
431,233
432,774
433,722
433,722
434,670
435,618
436,566
437,514
437,514
Retained earnings (accumulated deficit)
(4,025)
14,680
31,797
31,755
43,088
43,949
45,707
45,707
46,397
48,631
51,986
53,363
53,363
Treasury Shares, at cost
(113)
(551)
(560)
(563)
(2,632)
(2,632)
(2,632)
(2,632)
(2,632)
(2,632)
(2,632)
(2,632)
Accumulated other comprehensive loss
20
176
95
93
(44)
92
92
92
92
92
92
92
92
Noncontrolling interest in subsidiary
207
(194)
(290)
(487)
(617)
(666)
(666)
(666)
(666)
(666)
(666)
(666)
(666)
Total stockholders' equity
419,517
436,061
460,364
461,258
478,498
478,507
481,213
481,213
482,851
486,033
490,336
492,661
492,661
Total liabilities and stockholders' equity
937,564
$
958,583
$
1,017,174
$
1,013,498
$
1,024,588
$
998,780
$
993,833
$
993,833
$
1,005,132
$
1,019,648
$
1,026,828
$
1,038,361
$
1,038,361
$
SELECTED COMMON SIZE BALANCE SHEET AMOUNTS (% of net sales)
Trade receivables
17.78%
12.76%
10.08%
57.77%
56.36%
56.64%
49.24%
12.37%
49.78%
49.78%
49.24%
49.24%
12.40%
Inventories
9.76%
8.98%
8.11%
38.85%
36.48%
35.75%
36.91%
9.27%
37.27%
36.23%
35.99%
36.91%
9.30%
Prepaid expenses & other current assets
0.66%
0.72%
0.80%
6.05%
5.44%
3.26%
4.58%
1.15%
7.45%
6.69%
3.58%
5.40%
1.36%
Property, plant & equipment, net of accumulated depreciation
288.66%
268.82%
260.59%
1269.97%
1241.14%
1239.76%
1244.00%
312.48%
1324.84%
1265.95%
1148.10%
1236.12%
311.36%
Accounts payable and accrued expenses
5.75%
4.45%
4.56%
20.62%
17.00%
17.26%
18.49%
4.64%
18.73%
18.38%
18.27%
18.52%
4.66%
SELECTED COMMON SIZE BALANCE SHEET AMOUNTS (% of total assets)
Total current assets
10.33%
10.98%
10.60%
10.90%
9.56%
8.85%
8.10%
8.10%
8.86%
9.90%
10.29%
11.06%
11.06%
Property, plant & equipment, net of accumulated depreciation
84.03%
83.84%
84.86%
84.47%
85.69%
86.57%
87.29%
87.29%
86.59%
85.61%
85.26%
84.53%
84.53%
Total current liabilities
3.17%
3.14%
5.46%
5.49%
5.62%
6.15%
5.22%
5.22%
5.06%
5.05%
5.23%
5.04%
5.04%
Long‐term
debt, less current maturities
29.54%
29.15%
27.74%
27.37%
26.12%
24.32%
24.44%
24.44%
25.16%
25.78%
25.60%
26.28%
26.28%
Deferred income taxes
21.71%
21.86%
21.34%
21.43%
21.36%
21.43%
21.72%
21.72%
21.55%
21.31%
21.22%
21.05%
21.05%
Total liabilities
55.25%
54.51%
54.74%
54.49%
53.30%
52.09%
51.58%
51.58%
51.96%
52.33%
52.25%
52.55%
52.55%
Additional paid‐in capital
29.74%
43.95%
42.19%
42.45%
42.09%
43.33%
43.64%
43.64%
43.25%
42.72%
42.52%
42.14%
42.14%
Total stockholders' equity
44.75%
45.49%
45.26%
45.51%
46.70%
47.91%
48.42%
48.42%
48.04%
47.67%
47.75%
47.45%
47.45%
2016 E
2015 E
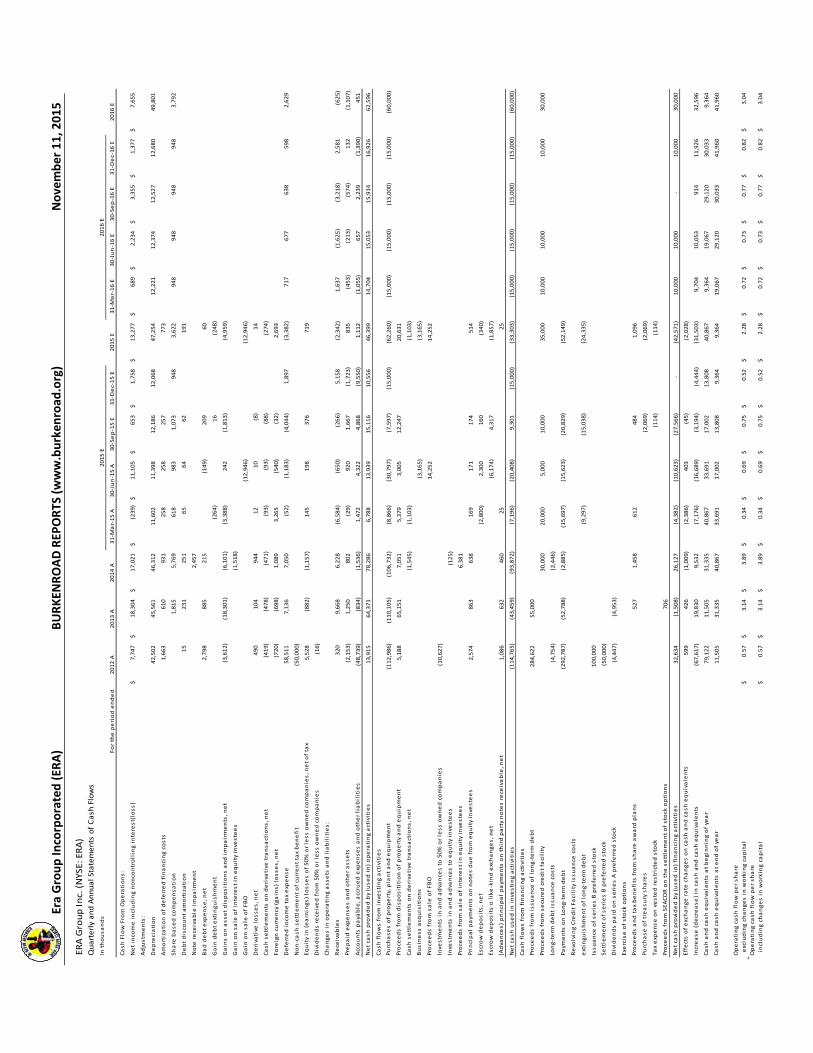
Era Group In
corporated (ER
A)
BURKEN
ROAD REP
ORTS (www.burken
road
.org)
November 11, 2015
32
ERA Group Inc. (NYSE: ERA)
Quarterly and Annual Statements of Cash Flows
In thousands
For the period ended
2012 A
2013 A
2014 A
31‐M
ar‐15 A
30‐Jun‐15 A
30‐Sep‐15 E
31‐Dec‐15 E
2015 E
31‐M
ar‐16 E
30‐Jun‐16 E
30‐Sep‐16 E
31‐Dec‐16 E
2016 E
Cash Flow From Operations:
Net income including noncontrolling interest(loss)
7,747
$
18,304
$
17,021
$
(239)
$
11,105
$
653
$
1,758
$
13,277
$
689
$
2,234
$
3,355
$
1,377
$
7,655
$
Adjustm
ents:
Depreciation
42,502
45,561
46,312
11,602
11,398
12,186
12,068
47,254
12,221
12,374
12,527
12,680
49,801
Amortization of deferred financing costs
1,663
610
931
258
258
257
773
Share based compensation
1,815
5,769
618
983
1,073
948
3,622
948
948
948
948
3,792
Debt discount amortization
15
231
251
65
64
62
191
Note receivable impairment
2,457
Bad debt expense, net
2,798
885
215
(149)
209
60
Gain debt extinguishment
(264)
16
(248)
Gains on asset dispositions and impairments, net
(3,612)
(18,301)
(6,101)
(3,388)
242
(1,813)
(4,959)
Gain on sale of interest in equity investees
(1,518)
Gain on sale of FBO
(12,946)
(12,946)
Derivative
losses, net
490
104
944
12
10
(8)
14
Cash settlements on derivative
transactions, net
(419)
(478)
(471)
(93)
(93)
(88)
(274)
Foreign currency (gains) losses, net
(720)
(698)
1,089
3,265
(540)
(32)
2,693
Deferred income tax expense
58,511
7,136
7,050
(52)
(1,183)
(4,044)
1,897
(3,382)
717
677
638
598
2,629
Non‐cash settlement of current tax benefit
(50,000)
Equity in (earnings) losses of 50% or less owned companies, net of tax
5,528
(882)
(1,157)
145
198
376
719
Dividends received from 50% or less owned companies
(16)
Changes in operating assets and liabilities:
Receivables
320
9,668
6,228
(6,584)
(650)
(266)
5,158
(2,342)
1,637
(1,625)
(3,218)
2,581
(625)
Prepaid expenses and other assets
(2,153)
1,250
802
(29)
920
1,667
(1,723)
835
(453)
(213)
(574)
132
(1,107)
Accounts payable, accrued expenses and other liabilities
(48,739)
(834)
(1,536)
1,472
4,322
4,868
(9,550)
1,112
(1,055)
657
2,239
(1,390)
451
Net cash provided by (used in) operating activities
13,915
64,371
78,286
6,788
13,939
15,116
10,556
46,399
14,704
15,053
15,914
16,926
62,596
Cash flows from investing activities
Purchases of property, plant and equipment
(112,986)
(110,105)
(106,732)
(8,866)
(30,797)
(7,597)
(15,000)
(62,260)
(15,000)
(15,000)
(15,000)
(15,000)
(60,000)
Proceeds from dispositition of property and equipment
5,188
65,151
7,051
5,379
3,005
12,247
20,631
Cash settlements on derivative
transactions, net
(1,545)
(1,103)
(1,103)
Business acquisitions
(3,165)
(3,165)
Proceeds from sale of FBO
14,252
14,252
Investm
ents in and advances to 50% or less owned companies
(10,627)
Investm
ents in and advances to equity investees
(125)
Proceeds from sale of interest in equity investees
6,381
Principal paym
ents on notes due from equity investees
2,574
863
638
169
171
174
514
Escrow deposits, net
(2,800)
2,300
160
(340)
Escrow deposits o like‐kind exchanges, net
(6,174)
4,317
(1,857)
(Advances) principal paym
ents on third party notes receivable, net
1,086
632
460
25
25
Net cash used in investing activities
(114,765)
(43,459)
(93,872)
(7,196)
(20,408)
9,301
(15,000)
(33,303)
( 15,000)
(15,000)
(15,000)
(15,000)
(60,000)
Cash flows from financing activities
Proceeds from issuance
of long‐term
debt
284,622
55,000
Proceeds from secured credit facility
30,000
20,000
5,000
10,000
35,000
10,000
10,000
10,000
30,000
Long‐term
debt issuance
costs
(4,754)
(2,446)
Paym
ents on Long‐term
debt
(292,787)
(52,788)
(2,885)
(15,697)
(15,623)
(20,829)
(52,149)
Revolving Credit Facility issuance
costs
extinguishment of long‐term
debt
(9,297)
(15,038)
(24,335)
Issuance
of series B preferred stock
100,000
Settlement of series B preferred stock
(50,000)
Dividends paid on series A preferred stock
(4,447)
(4,953)
Exercise of stock options
Proceeds and tax benefits from share award plans
527
1,458
612
484
1,096
Purchase of treasury shares
(2,069)
(2,069)
Tax expense on vested restricted stock
(114)
(114)
Proceeds from SEACOR on the settlement of stock options
706
Net cash provided by (used in) financing activities
32,634
(1,508)
26,127
(4,382)
(10,623)
(27,566)
‐
(42,571)
10,000
10,000
‐
10,000
30,000
Effects of exchange rate changes on cash and cash equivalents
599
426
( 1,009)
(2,386)
403
(45)
(2,028)
Increase (decrease) in cash and cash equivalents
(67,617)
19,830
9,532
(7,176)
(16,689)
(3,194)
(4,444)
(31,503)
9,704
10,053
914
11,926
32,596
Cash and cash equivalents at beginning of year
79,122
11,505
31,335
40,867
33,691
17,002
13,808
40,867
9,364
19,067
29,120
30,033
9,364
Cash and cash equivalents at end of year
11,505
31,335
40,867
33,691
17,002
13,808
9,364
9,364
19,067
29,120
30,033
41,960
41,960
Operating cash flow per share
excluding changes in working capital
0.57
$
3.14
$
3.89
$
0.34
$
0.69
$
0.75
$
0.52
$
2.28
$
0.72
$
0.73
$
0.77
$
0.82
$
3.04
$
Operating cash flow per share
including changes in working capital
0.57
$
3.14
$
3.89
$
0.34
$
0.69
$
0.75
$
0.52
$
2.28
$
0.72
$
0.73
$
0.77
$
0.82
$
3.04
$
2016 E
2015 E
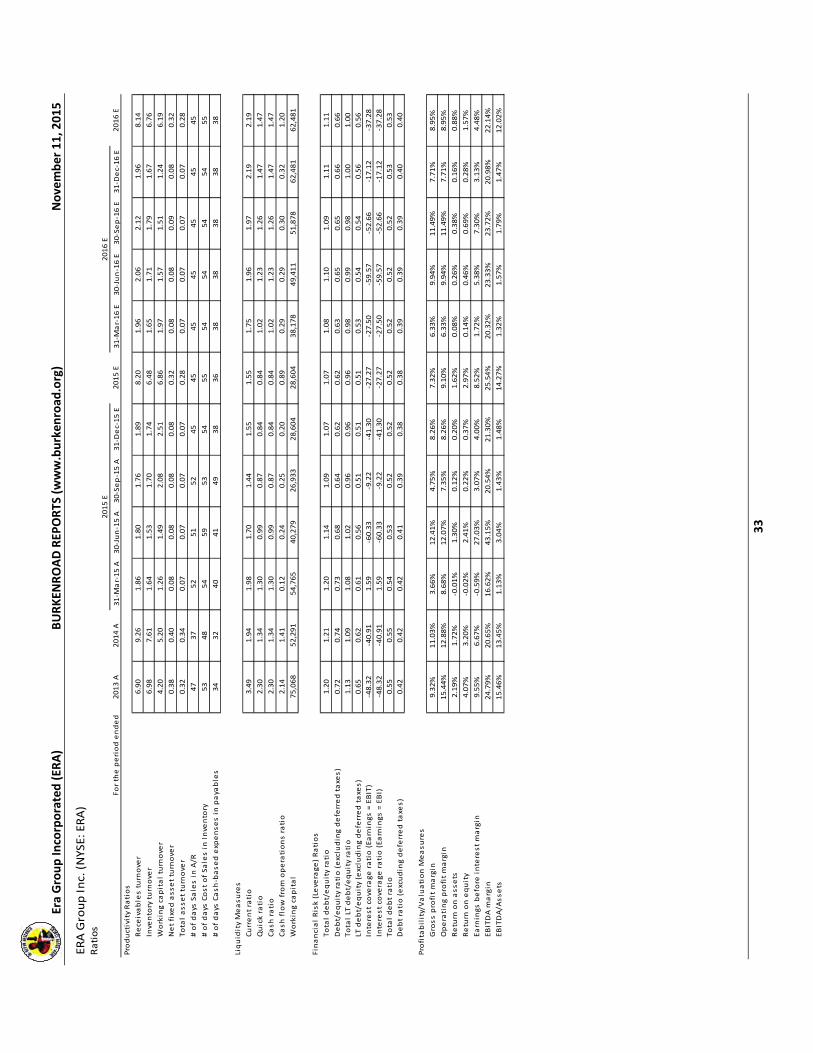
Era Group In
corporated (ER
A)
BURKEN
ROAD REP
ORTS (www.burken
road
.org)
November 11, 2015
33
ERA Group Inc. (NYSE: ERA)
Ratios
For the period ended
2013 A
2014 A
31‐M
ar‐15 A
30‐Jun‐15 A
30‐Sep‐15 A
31‐Dec‐15 E
2015 E
31‐M
ar‐16 E
30‐Jun‐16 E
30‐Sep‐16 E
31‐Dec‐16 E
2016 E
Productivity Ratios
Receivables turnover
6.90
9.26
1.86
1.80
1.76
1.89
8.20
1.96
2.06
2.12
1.96
8.14
Inventory turnover
6.98
7.61
1.64
1.53
1.70
1.74
6.48
1.65
1.71
1.79
1.67
6.76
Working capital turnover
4.20
5.20
1.26
1.49
2.08
2.51
6.86
1.97
1.57
1.51
1.24
6.19
Net fixed asset turnover
0.38
0.40
0.08
0.08
0.08
0.08
0.32
0.08
0.08
0.09
0.08
0.32
Total asset turnover
0.32
0.34
0.07
0.07
0.07
0.07
0.28
0.07
0.07
0.07
0.07
0.28
# of days Sales in A/R
47
37
52
51
52
45
45
45
45
45
45
45
# of days Cost of Sales in Inventory
53
48
54
59
53
54
55
54
54
54
54
55
e# of days Cash‐based expenses in payables
34
32
40
41
49
38
36
38
38
38
38
38
Liquidity Measures
Current ratio
3.49
1.94
1.98
1.70
1.44
1.55
1.55
1.75
1.96
1.97
2.19
2.19
Quick ratio
2.30
1.34
1.30
0.99
0.87
0.84
0.84
1.02
1.23
1.26
1.47
1.47
Cash ratio
2.30
1.34
1.30
0.99
0.87
0.84
0.84
1.02
1.23
1.26
1.47
1.47
Cash flow from operations ratio
2.14
1.41
0.12
0.24
0.25
0.20
0.89
0.29
0.29
0.30
0.32
1.20
Working capital
75,068
52,291
54,765
40,279
26,933
28,604
28,604
38,178
49,411
51,878
62,481
62,481
Financial Risk (Leverage) Ratios
Total debt/equity ratio
1.20
1.21
1.20
1.14
1.09
1.07
1.07
1.08
1.10
1.09
1.11
1.11
Debt/equity ratio (excluding deferred taxes)
0.72
0.74
0.73
0.68
0.64
0.62
0.62
0.63
0.65
0.65
0.66
0.66
Total LT debt/equity ratio
1.13
1.09
1.08
1.02
0.96
0.96
0.96
0.98
0.99
0.98
1.00
1.00
LT debt/equity (excluding deferred taxes)
0.65
0.62
0.61
0.56
0.51
0.51
0.51
0.53
0.54
0.54
0.56
0.56
Interest coverage ratio (Earnings = EBIT)
‐48.32
‐40.91
1.59
‐60.33
‐9.22
‐41.30
‐27.27
‐27.50
‐59. 57
‐52.66
‐17.12
‐37.28
Interest coverage ratio (Earnings = EBI)
‐48.32
‐40.91
1.59
‐60.33
‐9.22
‐41.30
‐27.27
‐27.50
‐59.57
‐52.66
‐17.12
‐37.28
Total debt ratio
0.55
0.55
0.54
0.53
0.52
0.52
0.52
0.52
0.52
0.52
0.53
0.53
Debt ratio (excuding deferred taxes)
0.42
0.42
0.42
0.41
0.39
0.38
0.38
0.39
0.39
0.39
0.40
0.40
Profitability/Valuation M
easures
Gross profit margin
9.32%
11.03%
3.66%
12.41%
4.75%
8.26%
7.32%
6.33%
9.94%
11.49%
7.71%
8.95%
Operating profit margin
15.44%
12.88%
8.68%
12.07%
7.35%
8.26%
9.10%
6.33%
9.94%
11.49%
7.71%
8.95%
Return on assets
2.19%
1.72%
‐0.01%
1.30%
0.12%
0.20%
1.62%
0.08%
0.26%
0.38%
0.16%
0.88%
Return on equity
4.07%
3.20%
‐0.02%
2.41%
0.22%
0.37%
2.97%
0.14%
0.46%
0.69%
0.28%
1.57%
Earnings before interest margin
9.55%
6.67%
‐0.59%
27.03%
3.07%
4.00%
8.52%
1.72%
5.38%
7.30%
3.13%
4.48%
EBITDA m
argin
24.79%
20.65%
16.62%
43.15%
20.54%
21.30%
25.54%
20.32%
23.33%
23.72%
20.98%
22.14%
EBITDA/Assets
15.46%
13.45%
1.13%
3.04%
1.43%
1.48%
14.27%
1.32%
1.57%
1.79%
1.47%
12.02%
2015 E
2016 E

THIS PAGE LEFT INTENTIONALLY BLANK

BURKENROAD REPORTS RATING SYSTEM
MARKET OUTPERFORM: This rating indicates that we believe forces are in place that would enable this company's stock to produce returns in excess of the stock market averages over the next 12 months.
MARKET PERFORM: This rating indicates that we believe the investment returns from this company's stock will be in line with those produced by the stock market averages over the next 12 months.
MARKET UNDERPERFORM: This rating indicates that while this investment may have positive attributes, we believe an investment in this company will produce subpar returns over the next 12 months. BURKENROAD REPORTS CALCULATIONS
CPFS is calculated using operating cash flows excluding working capital changes.
All amounts are as of the date of the report as reported by Bloomberg or Yahoo Finance unless otherwise noted. Betas are collected from Bloomberg.
Enterprise value is based on the equity market cap as of the report date, adjusted for long‐term debt, cash, & short‐term investments reported on the most recent quarterly report date.
12‐month Stock Performance is calculated using an ending price as of the report date. The stock performance includes the 12‐month dividend yield.
2015‐2016 COVERAGE UNIVERSE Amerisafe Inc. (AMSF) Bristow Group Inc. (BRS) CalIon Petroleum Company (CPE) Cal‐Maine Foods Inc. (CALM) Carbo Ceramics Inc. (CRR) Cash America International Inc. (CSH) Conn's Inc. (CONN) Crown Crafts Inc. (CRWS) Denbury Resources Inc. (DNR) EastGroup Properties Inc. (EGP) Era Group Inc. (ERA) Evolution Petroleum Corp. (EPM) The First Bancshares (FBMS) Globalstar (GSAT) Gulf Island Fabrication Inc. (GIFI) Hibbett Sports (HIBB) Hornbeck Offshore Services Inc. (HOS) IBERIABANK Corp. (IBKC) ION Geophysical Corp. (IO) Key Energy Services (KEG)
Marine Products Corp. (MPX) MidSouth Bancorp Inc. (MSL) Newpark Resources Inc. (NR) PetroQuest Energy Inc. (PQ) Pool Corporation (POOL) Powell Industries Inc. (POWL) Rollins Incorporated (ROL) RPC Incorporated (RES) Ruth’s Hospitality Group Inc. (RUTH) Sanderson Farms Inc. (SAFM) SEACOR Holdings Inc. (CKH) Sharps Compliance Inc. (SMED) Spark Energy Inc. (SPKE) Stone Energy Corp. (SGY) Sunoco LP (SUN) Superior Energy Services Inc. (SPN) Superior Uniform Group Inc. (SGC) Team Incorporated (TISI) Vaalco Energy Inc. (EGY) Willbros Group Inc. (WG)
PETER RICCHIUTI Director of Research Founder of Burkenroad Reports [email protected] ANTHONY WOOD Senior Director of Accounting [email protected]
DANIEL BROWNFIELD GRACE CAMMACK ALAN POSNER RUBEN FLORES DELGADO Associate Directors of Research
BURKENROAD REPORTS Tulane University New Orleans, LA 70118‐5669 (504) 862‐8489 (504) 865‐5430 Fax

To receive complete reports on any of the companies we follow, contact:Peter Ricchiuti, Founder & Director of Research
Tulane UniversityFreeman School of BusinessBURKENROAD REPORTS
Phone: (504) 862-8489Fax: (504) 865-5430
E-mail: [email protected] visit our web site at www.BURKENROAD.org
Printed on Recycled Paper
Named in honor of William B. Burkenroad Jr., an alumnus and a longtime supporter of Tulane’s business school, and funded through contributions from his family and friends, BURKENROAD REPORTS is a nationally recognized program, publishing objective, investment research reports on public companies in our region. Students at Tulane University’s Freeman School of Business prepare these reports.Alumni of the BURKENROAD REPORTS program are employed at a number of highly respected financial institutions including:ABN AMRO Bank · Aegis Value Fund · Invesco/AIM Capital Management · Alpha Omega Capital Partners · American General Investment Management · Ameriprise Financial · Atlas Capital · Banc of America Securities · Bank of Montreal · Bancomer · Barclays Capital · Barings PLC · Bearing Point · Bessemer Trust · Black Gold Capital· Bloomberg · Brookfield Asset Management · Brown Brothers Harriman Capital · Blackrock Financial Management · Boston Consulting Group · Buckingham Research · California Board of Regents · Cambridge Associates· Canaccord Genuity · Cantor Fitzgerald · Chaffe & Associates · Citadel Investment Group · Citibank · Citigroup Private Bank · City National Bank · Cornerstone Resources · Credit Suisse · D. A. Davidson & Co. · Deutsche Banc · Duquesne Capital Management · Equitas Capital Advisors· Factset Research · Financial Models · First Albany · Fiduciary Trust · Fitch Investors Services · Forex Trading · Franklin Templeton · Friedman Billings Ramsay · Fulcrum Global Partners · Gintel Asset Management · Global Hunter Securities · Goldman Sachs · Grosever Funds · Gruntal & Co. · Guggenheim Securities , LLC · Hancock Investment Services · Healthcare Markets Group · Capital One Southcoast · Howard Weil Labouisse Friedrichs · IBERIABANK Capital Markets · J.P. Morgan Securities · Janney Montgomery Scott · Jefferies & Co. · Johnson Rice & Co. · KBC Financial · KDI Capital Partners · Key Investments · Keystone Investments · Legacy Capital · Liberty Mutual · Lowenhaupt Global Advisors · Mackay Shields · Manulife/John Hancock Investments · Marsh & McLennan · Mercer Partners · Merrill Lynch · Miramar Asset Management · Moodys Investor Services · Morgan Keegan · Morgan Stanley · New York Stock Exchange · Perkins Wolf McDonnell · Piper Jaffray & Co. · Professional Advisory Services · Quarterdeck Investment Services · RBC · Raymond James · Restoration Capital · Rice Voelker, LLC · Royal Bank of Scotland· Sandler O'Neill & Partners · Sanford Bernstein & Co. · Scotia Capital · Scottrade · Second City Trading LLC · Sequent Energy · Sidoti & Co · Simmons & Co. · Southwest Securities · Stephens & Co. · Sterne Agee · Stewart Capital LLC · Stifel Nicolaus · Sun-Trust Capital Markets · Susquehanna Investment Group · Thomas Weisel Partners · TD Waterhouse Securities · Texas Employee Retirement System · Texas Teachers Retirement System · ThirtyNorth Investments · Thornburg Investment Management · Tivoli Partners · Tudor Pickering & Co. · Tulane University Endowment Fund · Turner Investment Partners · UBS · Value Line Investments · Vaughan Nelson Investment Management · Wells Fargo Capital Management · Whitney National Bank · William Blair & Co. · Zephyr Management