FINAL PROJECT REPORT - ERA
23
PROJECT REPORT 2001-12 FINAL PROJECT REPORT K.J. Stadt, V.J. Lieffers and B.D. Pinno Modelling light dynamics in boreal mixedwood forests
Transcript of FINAL PROJECT REPORT - ERA
PROJECT REPORT2001-12
FINAL PROJECT REPORT
K.J. Stadt, V.J. Lieffers and B.D. Pinno
Modelling light dynamics in boreal mixedwood forests

For copies of this or other SFM publications contact:
Sustainable Forest Management Network G208 Biological Sciences Building
University of Alberta Edmonton, Alberta, T6G 2E9
Ph: (780) 492 6659 Fax: (780) 492 8160
http://www.ualberta.ca/sfm
ISBN 1-55261-122-1
Modelling light dynamics
in boreal mixedwood forests
SFM Network Project: Spatially-explicit calibration of a light model for eastern and western boreal forests
by
K.J. Stadt, V.J. Lieffers and B.D. Pinno Dept. of Renewable Resources
University of Alberta Edmonton, Alberta
May 30, 2001

i
ABSTRACT
Over the past five years we have refined and tested a spatially-explicit light simulator (MIXLIGHT) for predicting the light available under boreal forest canopies. This model tracks the path of the sun or rays of light emanating from other parts of the sky through the canopy of individual trees. Beer-Lambert Law was used to estimate the reduction in light as the beam passed through the canopy. We built a user-friendly version of this model which should be useful for prediction of light in partial cut forests, or in situations where underplanting in planned. MIXLIGHT is available to be downloaded to and used by forest managers and regulators.
The second part of this report examines light competition between aspen and spruce during the sequence of aspen development and its implications for management and regulatory standards. Leaf area index and light transmission were estimated for aspen stands from 2 to 125 years old. Light transmission was lowest when stands reached a competitive bottleneck at 15-25 years and in some stands transmission was less than 5% of above canopy light. Transmission increased after this time. Hypothetical aspen stands with various stem configuration and heights were developed, and positions were identified that would meet or fail Alberta free-to-grow (FTG) standards. Light transmission was estimated at each position with the MIXLIGHT forest light simulator. As expected, positions in canopy gaps or at the northern sides of canopy gaps had higher light. In general, however, there was little difference in available light between positions that met or failed FTG criteria. Stand density and size of aspen trees in an area much larger than typical mil-hectare plots appears to be a better index to predict light transmission and spruce success in juvenile aspen stands, than FTG criteria. This suggests that FTG standards need to be re-examined for boreal mixedwood forests.
ACKNOWLEDGEMENT
We thank Ben Seaman, Jim Cuthbertson and Simon Landhäusser for assistance and Phil Comeau and Dave Patterson for suggestions on the FTG manuscript. Alberta Pacific Forest Industries, Manning Diversified Forest Products, Weldwood of Canada Ltd., Weyerhaeuser Canada, and NSERC and also provided funding for the development of this model.

1
DEVELOPMENT AND TESTING OF THE MIXLIGHT MODEL
Our original proposal was to refine and test a spatially-explicit light simulator for predicting the light available to in boreal forest stands. We built a user-friendly version of our model, MIXLIGHT, and have distributed it to forest researchers and managers. We have expanded the model to include the effects of understory vegetation, tested the model extensively in juvenile aspen stands, and are in the process of completing model testing in mature mixed-species stands in Alberta and Quebec. We have collected data for calibrating and testing a submodel for predicting red:far-red ratios, but we have to finish analyzing and implementing this phase of our proposal. We are also applying the model to evaluate regeneration standards for the forest industry.
The original implementation of the MIXLIGHT forest light simulator was in a relatively inaccessible DOS program. We rebuilt the code in Visual Basic, so the program runs in the Windows environment and has a much more user-friendly interface. The software is in use by other researchers and forest managers at the University of Alberta, Alberta Research Council, and Alberta Pacific Forest Industries, and has been distributed to other forestry companies and research groups through our web site (http://www.rr.ualberta.ca/research/Silviculture). MIXLIGHT Model Structure
MIXLIGHT’s modeling approach is to sample the overlying trees’ foliage by tracing numerous rays from starting points scattered across the sky hemisphere to the measurement point (P0) within the stand (Fig. 1A) (Stadt and Lieffers 2000). MIXLIGHT uses the light penetration eqation (Eq. 1) to calculate transmission along each of these rays based on the zenith (Z) and azimuth (α) orientation of the ray, the density of the foliage (Fj, in m2m-3) through which the ray passed, the degree to which this foliage area is oriented toward the light source (G[Z,χj], unit-less, where χj is a parameter describing the vertical inclination of the foliage (Campbell 1986)), and the length of the ray’s path (Sj, in m) through individual tree crowns (Fig. 1B) or the stand canopy (Fig. 1C).
[1] ∑
= =
−n
jjjj FSZG
eZT 1
],[
],[χ
α
By analogy with the Beer-Lambert Law (Swinehart 1955), we consider the product
G[Z,χj]SjFj (=-ln T) as the absorbance for the region j. Since absorbances are additive, the summation in Eq. 1 deals with any number of light absorbing regions (n) that intersect the light path, from a single canopy (n = 1, Fig. 1C) to an array of individual crowns (n = number of trees, Fig. 1B). The ray transmission values are weighted by the strength of the light source and averaged to give an estimate of the integrated light transmission (the ratio of below to above canopy light) at the measurement point. The individual crown approach (Fig. 1B) accounts for horizontal variation in overstory foliage and produces microsite light predictions, while the canopy scale approach (Fig. 1C) distributes foliage randomly throughout the canopy and produces stand-level predictions.

2
S1S2
Scanopy
B.
C.
Z
Z
P0
P2,1
P2,2
P1,1
P1,2
P0 P0
β
β
β
A. light rayssun
Fig. 1 MIXLIGHT Model Overview
Calibration of the foliage area density and foliage projection parameters is accomplished by inverting the modeling process for the simple case of sunlight shining through the crown of an isolated tree (Fig. 2). This is repeated at several times of day at different sun angles, so that the foliage area density and foliage projection parameters can be determined. Simulations are then carried out using these species-specific foliage parameters with the tree lists from the sites of interest.
θd
A. B. C.
h ’lc
h ’t
h’
radiometer wand
S
P2
P1
central axes
transects
sun
Fig. 2 MIXLIGHT model calibration

3
We evaluated a number of methods to modeling the effects of understory vegetation on light. A leaf area-based, Beer's Law approach with an empirical extinction coefficient for each species provided the best prediction. However, leaf area is seldom obtained in forest inventories. We tested the most commonly collected data, vegetation cover, and also obtained reasonable estimates of light using a simple model of vertical gap fraction, where transmission = 100 - percent cover. Leaf clumping and dispersion were significant in the forest understory environments we measured, so models using theoretical extinction coefficients based on a random leaf area distribution and a measured inclination distribution, like the overstory tree model described above, failed to provide accurate transmission estimates.
Model testing at the microsite level in Alberta and Quebec mixedwood forests is in progress. A number of technical challenges in mapping the crowns in the Alberta sites delayed this, but we have a working protocol, and the first of two, 5-hectare stands is mapped. The light data have already been collected for testing the spatial predictions of the model. We also have light transmission readings and stem maps from three Quebec sites to test. A demonstration of the effectiveness of the MIXLIGHT can be seen in the following diagram (Fig 3). A B
Fig. 3 Mixed species stand and light contour plot generated by MIXLIGHT

4
This is a simulation of the light available at breast-height in a mixed white spruce, lodgepole pine and aspen forest stand with a small gap. The 3-D picture (Fig 3A) was generated using the U.S. Forest Service's Stand Visualization System. You are viewing this stand from the angle the sun would be at noon in June. Output from our light model is to the right (Fig 3B). This is a top-view of the stand, showing the extent of the trees' crowns in light green (deciduous trees) and dark green (conifers). Contour lines, showing areas of equal light levels, are shown in other colours: the lighter the colour, the brighter the light. Notice that the area of brightest light is shifted to the north of the gap due to the sun angle at this time of year. This bright-light patch corresponds to the sun-angle view of the forest floor in the 3-D picture.
Red:far-red ratio was measured in Alberta and Quebec sites while obtaining the spatial transmission testing data. We have also measured the transmission of these spectra through leaves of the common boreal species (trembling aspen, balsam poplar, paper birch, white spruce, jack pine, lodgepole pine, and balsam fir). Our intent is now to build a submodel for predicting red:far-red ratio in sites of varying species composition.
An interesting application of the MIXLIGHT model was been the evaluation of Alberta's provincial regeneration standard for white spruce in mixedwood forests. Using another calibration and test of MIXLIGHT for juvenile aspen, we have been able to test the "free-to-grow" status of white spruce in its common association with aspen, as defined by current regulations. We've been able to recommend a much simpler standard, based on aspen basal area, since the dispersion of foliage in young aspen stands causes highly diffused light, with little spatial variation.
Once tested, the MIXLIGHT model will be ready for incorporation into a spatial stand-dynamics model such as (or similar to) SORTIE. Management Applications
• MIXLIGHT can be used to estimate the light transmission in boreal mixedwoods in stands of range of species compositions and structures. It is important for estimation of thresholds of light that will allow maximum height growth or survival of understory species such as white spruce.
• MIXLIGHT is particularly useful for where there is need to estimate light in exact positions relative to neighbors. Assessing competitive relationships for row plantings, strip cuts or free-to-grow assessments could be done easily with MIXLIGHT.
• The flexibility of the MIXLIGHT model allows for light estimation at different latitudes or height above the ground.
• MIXLIGHT could be used to supplement predictions of empirical-based growth and yield or succession models.
• MIXLIGHT can also be used to assess light the light regime of understory plants and determine their growth.
5
LIGHT DYNAMICS AND FREE-TO-GROW STANDARDS IN ASPEN-DOMINATED MIXEDWOOD FORESTS
Introduction
Aspen and white spruce are the dominant species in boreal mixedwood forests of western North America. Aspen regenerates clonally from sprouts and quickly dominates sites after disturbance; in contrast white spruce regenerates from seed and has slow juvenile growth rates. As the spruce has been considered to be the more valuable species, there has been concern about the competitive impacts of aspen on the spruce (Eis 1981, Comeau et al. 1993). It has generally been assumed that light is the resource most limiting to growth and survival of juvenile spruce in the boreal forests (Brand 1986, Tanner et al. 1996). While there has been work describing the light regime in various stages of boreal mixedwood forest development (Lieffers and Stadt 1994, Constabel and Lieffers 1996, Tanner et al. 1996, Messier et al. 1998, Lieffers et al. 1999), there has not been a comprehensive description of changes in light with stand age, particularly for the juvenile phase of stand development.
Distance dependent competition indices have been developed that attempt to quantify the
impacts of adjacent competitor on the growth of a subject tree (Brand 1986 ). In several provinces in Canada, including Alberta and British Columbia, provincial regulators have developed Free-to-grow (FTG) standards, i.e. a distant-dependent competition indices, that are used to regulate an acceptable level of competition from hardwoods. Achieving FTG status implies that the stand is limited only by site resources (Brand and Weetman 1986), the stand is successfully regenerated and contributing to the overall forest production (MacDonald and Weetman 1993). FTG status could also be considered a survival standard where the crop tree is expected to grow at a rate equal to that of natural stands (Alberta Environment 2000). Coniferous trees are considered FTG when adjacent hardwood or shrub species are sufficiently far away from the conifer crop tree that they are considered to have minimal or acceptable competitive effects, especially on the light resource. These standards are also intended to predict competition levels into the future and ensure that the conifer trees have acceptable levels of competition. The three main criteria used in determining FTG status are that the crop tree is a suitable species for the site, it has reached acceptable size relative to competitors and that competitor species are a given distance away from the subject tree (Brand and Weetman 1986).
In Alberta, performance surveys, which determine the FTG status of a plantation, are
carried out 8-14 years after harvesting. There are several versions of FTG standards: Prior to Jan. 2000 no competing hardwood tree could be greater than 2/3 the height of the conifer tree within a 1 m radius (Alberta Forest Service 1992). Since 2000, this radius has been increased to 2 m for coniferous stands (Alberta Environment 2000). Mixedwood FTG standards for the 2000 standards require that spruce trees be at least 1 m tall and be free of competing vegetation greater than 2/3 the height of the spruce tree, within a 270° arc, within a 1.5 m radius. To our knowledge, however, none of these standards have been justified for boreal mixedwood forests using either empirical data or simulations.
6
With the development of the MIXLIGHT forest light simulator (Stadt and Lieffers 2000) and its calibration and testing for juvenile aspen stands (Pinno 2000), it is possible to estimate the growing season light for various stand positions. Important thresholds for spruce regeneration with respect to light availability are 10 and 40% light. Mortality of spruce is likely below 10% light and there is virtually no increase in height growth above 40% of overstory light, although radial growth increases somewhat further at higher light (Logan 1969, Lieffers and Stadt 1994, Wright et al. 1998). Using MIXLIGHT, we can evaluate the light available at stand positions which meet or fail various FTG standards, and evaluate (based upon light thresholds from the literature) which standard best identifies a tree's likelihood of success with respect to light competition.
The three objectives of this study are to 1) describe the leaf area development and
understory light availability for aspen dominated stands in the boreal mixedwood forest; 2) determine the light available to conifer saplings under a canopy of hypothetical aspen stands of different size, density and spatial configuration with positions that meet or fail current FTG standards. This process will also allow testing of the importance of distance and direction of competitors as well as the average size and density of hardwoods within the stand; and 3) determine a simple mechanism to estimate light to provide a light competition-based FTG standard for spruce seedlings.
Methods
To develop a chronosequence of light transmission and leaf index for aspen stands, we gathered published data on light transmission or leaf area from a range of sites in northern and western Alberta (Lieffers and Stadt 1994, DeLong et al. 1997, Stadt and Lieffers 2000, Pinno 2000, DesRochers and Lieffers 2001,). Stands were from the boreal mixedwood BMd and BMe ecosites (Beckingham and Archibald 1996). Either measurements of light or leaf area index were determined in fixed area plots at each stand. Beer’s Law (Equation 1) was used, to estimate either light transmission or LAI, depending upon the source of data.
[1] I/Io = e-0.5*LAI Here, I = incident light below canopy, Io = incident light above canopy and LAI is the leaf area index for the stand. The coefficient of 0.5 is an approximate value for deciduous stands (Pierce and Running 1988, Jarvis and Leverenz 1983).
In order to examine FTG standards, hypothetical stands of young aspen trees were
developed for a variety of height and density classes. All of the individual tree characteristics such as crown length and width, leaf area and leaf area density were modeled based on stem diameter at 30 cm height (D30) (Pinno et al 2001). Three stands with different spatial arrangements of aspen trees were modelled: Stand 1 generally had a 2m spacing of dominant stems (ca. 2500 stems/ha, Fig. 4). Stand 2 was similar but had 3 m spacing (1109 stems/ha, Fig. 5). Stand 3 had a 2.5m spacing (ca. 1600 stems/ha) but had trees missing or added to create
7
various spatial arrangements to test the FTG standard that used the 270° arc free of trees (Fig. 6). Five different versions of each stand arrangement were created using trees of 3, 5, 7, 9 and 11cm D30. Tree heights varied from 4.1m tall at 3cm D30 to 11.9 m tall at 11cm D30. These 15 simulated stands (3 arrangements x 5 tree sizes) provided a wide range of densities and sizes to test FTG standards.
.
Fig. 4 Stand 1 with 2 X 2 m spacing of aspen trees (shown with crown sizes for 5 cm D30 ) trees. Numbered positions indicate the hypothetical position of spruce trees
that meet or fail various FTG standards.
8
Fig. 5 Stand 2 with 3 X 3 m spacing of aspen trees (shown with crown sizes for 5 cm D30) trees. Numbered positions indicate the hypothetical position of spruce trees
that meet or fail various FTG standards.
9
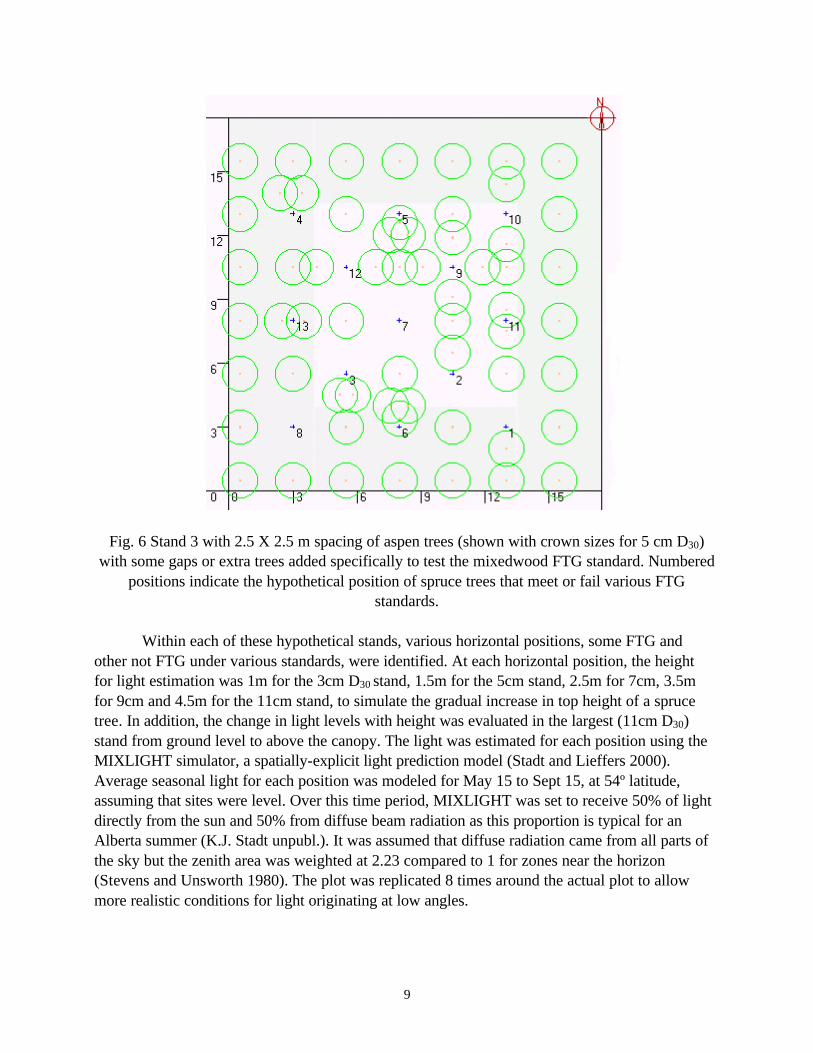
Fig. 6 Stand 3 with 2.5 X 2.5 m spacing of aspen trees (shown with crown sizes for 5 cm D30)
with some gaps or extra trees added specifically to test the mixedwood FTG standard. Numbered positions indicate the hypothetical position of spruce trees that meet or fail various FTG
standards.
Within each of these hypothetical stands, various horizontal positions, some FTG and other not FTG under various standards, were identified. At each horizontal position, the height for light estimation was 1m for the 3cm D30 stand, 1.5m for the 5cm stand, 2.5m for 7cm, 3.5m for 9cm and 4.5m for the 11cm stand, to simulate the gradual increase in top height of a spruce tree. In addition, the change in light levels with height was evaluated in the largest (11cm D30) stand from ground level to above the canopy. The light was estimated for each position using the MIXLIGHT simulator, a spatially-explicit light prediction model (Stadt and Lieffers 2000). Average seasonal light for each position was modeled for May 15 to Sept 15, at 54º latitude, assuming that sites were level. Over this time period, MIXLIGHT was set to receive 50% of light directly from the sun and 50% from diffuse beam radiation as this proportion is typical for an Alberta summer (K.J. Stadt unpubl.). It was assumed that diffuse radiation came from all parts of the sky but the zenith area was weighted at 2.23 compared to 1 for zones near the horizon (Stevens and Unsworth 1980). The plot was replicated 8 times around the actual plot to allow more realistic conditions for light originating at low angles.
10
In order to estimate light using stand characteristics, 17 young aspen stands from a range of heights and densities were identified from the BMd and BMe ecosites (Beckingham and Archibald 1996) in northern and western Alberta. Light was measured above the shrub layer inside the stand, then above the canopy, either on uniformly cloudy days or on sunny days between 11:00 and 14:00 local time. A light measurement consisted of a circular sweep of 15-20 light measurements using an 80 x 1cm quantum radiometer sensitive to photosynthetically active radiation (Model SF-80, Decagon Devices Inc., Pullman, WA). In a circular plot 2-3m in radius (plots with taller trees and lower density had a 3 m radius) surrounding the light measurement, D30 of each tree and mean height of dominants was determined. Light transmission (the ratio of the light inside the stand to the light outside) was regressed against mean height, density and basal area. The best equation was chosen based on R2 and examination of residuals. Size ranged from 1.3 to 10.0 cm D30 and 2,829 to 40,589 stems/Ha. Pinno (2000) provides more detailed information.
Results
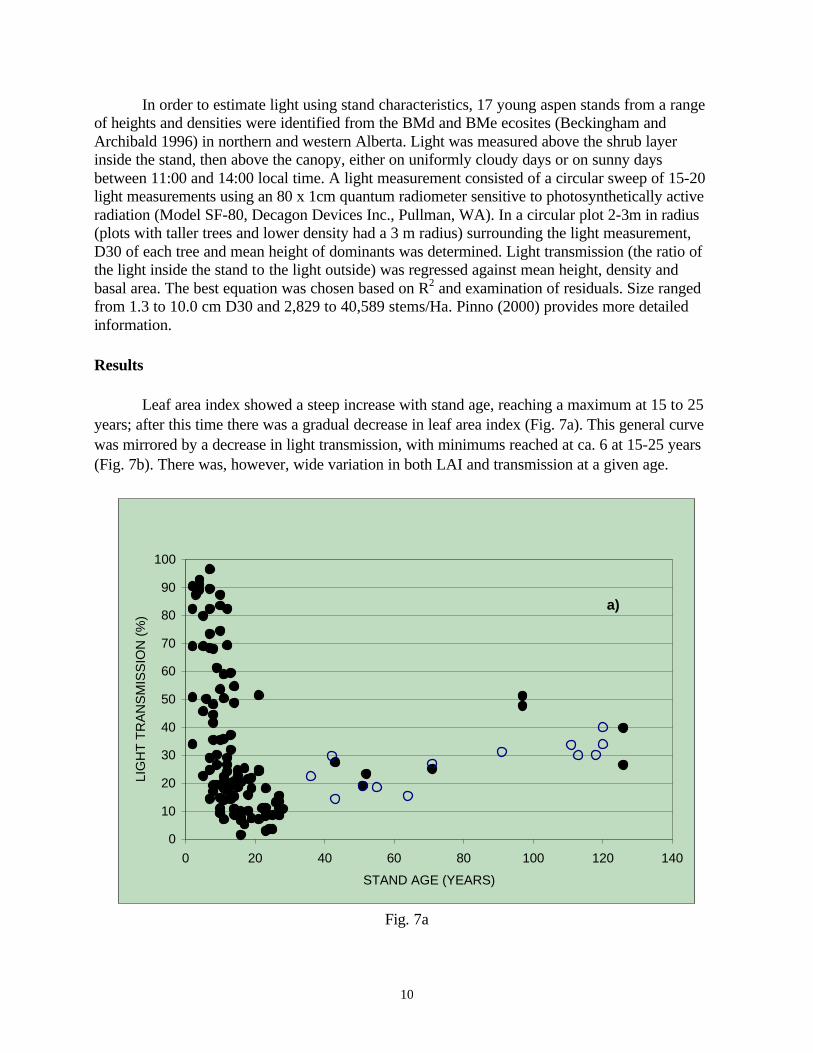
Leaf area index showed a steep increase with stand age, reaching a maximum at 15 to 25 years; after this time there was a gradual decrease in leaf area index (Fig. 7a). This general curve was mirrored by a decrease in light transmission, with minimums reached at ca. 6 at 15-25 years (Fig. 7b). There was, however, wide variation in both LAI and transmission at a given age.
a)
0
10
20
30
40
50
60
70
80
90
100
0 20 40 60 80 100 120 140
STAND AGE (YEARS)
LIG
HT
TR
AN
SM
ISS
ION
(%
)
Fig. 7a

11
b)
0
1
2
3
4
5
6
7
8
9
0 20 40 60 80 100 120 140
STAND AGE (YEARS)
LAI (
m2 m
-2)
Fig 7b.
Fig. 7 Light transmission (a) and leaf area index (b) in relation to age for aspen stands in Alberta. Data were from light transmission measurements (Lieffers and Stadt (1994)) - open symbols and
from leaf area estimates/measurements (DesRochers and Lieffers (2001), Stadt and Lieffers (2000), DeLong et al. 1996, Pinno et al. (2001)) - closed symbols.
Plots 1 and 2, both had uniform layout of trees with one tree missing (Figs. 1 and 2).
Positions where light was estimated were established N to S across the missing tree gap (1-5), diagonally between trees (6-8) and N to S (9-13) between trees. There were relatively small difference in light transmission between the positions that were classed as FTG; position 3 which would be categorized as FTG in all schemes actually had lower light transmission than position 5 (the N edge of the gap) that would not be FTG in any of the systems using a full circle. Overall, the largest differences in light transmission were seen as the aspen trees grew in size. The other striking difference was seen in the much greater light transmission with the 3 m spacing (Table 2) compared to the 2 m spacing (Table 1).
Plot 3 shows the different FTG scenarios using the 270º arc (Fig. 6). Trees were added in various positions to create situations where one, two or three trees were included within 1.5m of the 90º arc either on the N or S side of the queried point (1-6). Positions 7 and 8 were 2.5m away from any trees. Position 9 had 4 extra trees added within 1.5m. Positions 10 to 13 had 2 extra trees added at various distances and directions. The most important finding in these analyses was
12
the general decrease in light as the average size of trees in the plot increased (Table 3). Secondly, the center of the large gap had a 10-15% increase in transmitted light, relative to position 5 with the lowest light, where there were several trees immediately to the S. When extra trees were added on the N side (positions 2, 4 and 6) there was greater incident light compared to when extra trees were on the S (1, 3 and 5) indicating that for light availability, direction of the aspen trees may be more important than distance. The last column of Table 3 shows the light transmission for the 11cm D30 aspen stand when light was modeled for 44º latitude. With direct beam radiation coming more from the vertical, positions 7 and 8 in gaps had a relatively larger increases in light transmission compared to these positions when modelled at 54º latitude.
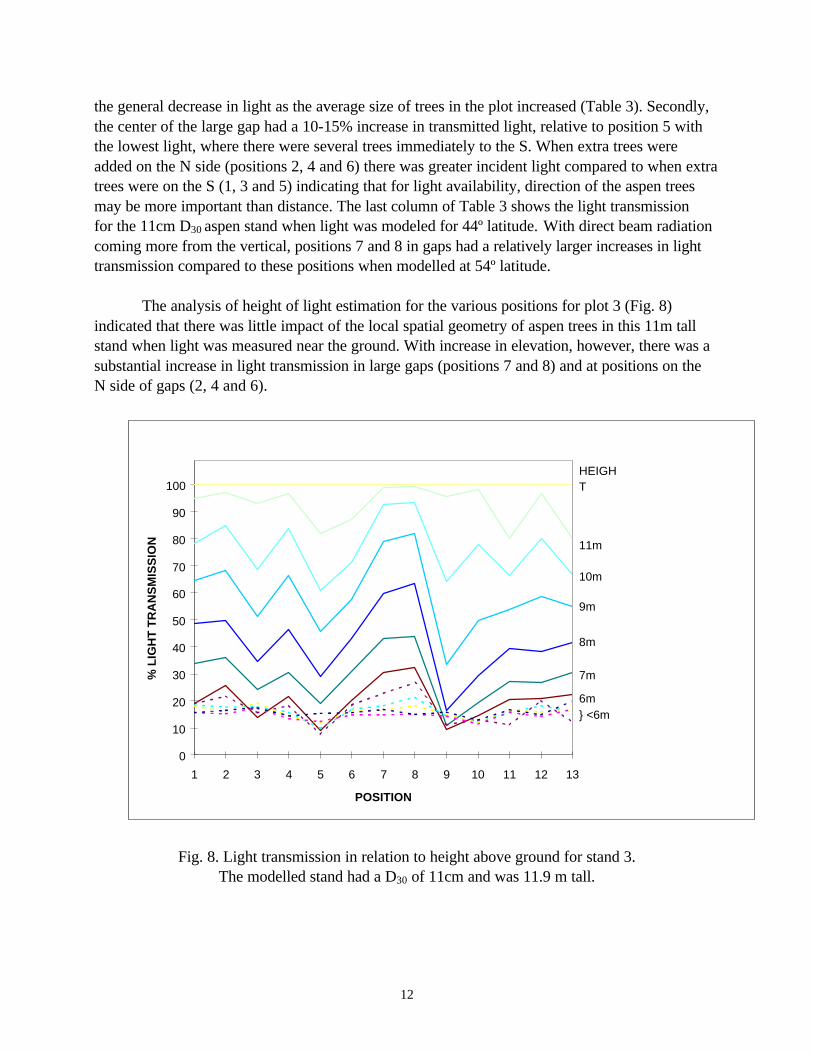
The analysis of height of light estimation for the various positions for plot 3 (Fig. 8)
indicated that there was little impact of the local spatial geometry of aspen trees in this 11m tall stand when light was measured near the ground. With increase in elevation, however, there was a substantial increase in light transmission in large gaps (positions 7 and 8) and at positions on the N side of gaps (2, 4 and 6).
0
10
20
30
40
50
60
70
80
90
100
1 2 3 4 5 6 7 8 9 10 11 12 13
POSITION
% L
IGH
T T
RA
NS
MIS
SIO
N
HEIGHT
11m
10m
9m
8m
7m
6m} <6m
Fig. 8. Light transmission in relation to height above ground for stand 3. The modelled stand had a D30 of 11cm and was 11.9 m tall.
13
The best stand characteristic for predicting light availability to white spruce was basal area (R2 = 0.869). We broke this down to average stem diameter at 30cm (D30) and density, as these are the measurements obtained in a regeneration assessment. Stand height and density were also good predictors of light transmission, owing to the close relationship between D30 and height. [2] I/Io = exp(-((0.0000109353 avD30
2*Density))0.80486)
where: av D30 is the average stem diameter at 30 cm height and density is in stems/ha. Stem size range from 1.3 to 10.0 D30 and density from 2,829 to 40,585 stems/ha. Use of quadratic mean D30 did not improve the fit. This equation is appropriate only for this data range. Discussion
The steep increase in leaf area (Fig. 7b) and steep decline in light transmission (Fig. 7a) with age in juvenile aspen stands appears to reach their maximum or minimum at about 15-25 years. The rapid and heavy development of LAI after disturbance appears to be related to the dense suckering of aspen from established roots systems (DesRochers and Lieffers 2001) and the fact that short aspen stands, have substantial horizontal overlap of crowns, thereby stacking more leaves into a given crown volume (Pinno et al 2001). Therefore, some juvenile stands had an LAI near 6 and transmitted less than 5% of above canopy light. This level of illumination would result in severe suppression or mortality of spruce saplings (Stadt and Lieffers 1994; Wright et al. 1998). Peterson and Peterson (1996) also reported an early peak in foliage biomass in young aspen stands.
LAI decreased and light transmission increased after about age 25. This decline in leaf area
with age has been reported for other species (Long and Smith 1992, Gower et al. 1996). Declining LAI, the importance of clumping of foliage in distinct crowns with age (Kucharik et al 1999), plus the development of crown shyness (Long and Smith 1992) results in increased light transmission and reduced competitive status of aspen in relation to understory spruce as stand age increases. It is possible that LAI may be underestimated in maturing stands because of this crown clumping; however, data derived from light transmission or from estimates of LAI appear to overlap (Fig. 7).
The light transmission data (Fig. 7a) suggest that in some aspen-dominated stands,
understory spruce go through a competitive bottleneck of low light conditions at 15 to 25 years. It is noteworthy, however, that some of the 15 to 25 year-old stands transmitted ca. 20% light, which is sufficient for survival and moderate height growth of spruce. This was also noted by Comeau (2001). With time, there is a gradual increase in light transmission, especially once spruce reach the height of the aspen canopy (see Fig. 8). If maximum spruce growth is required, a FTG survey may be beneficial to identify and treat stands heading for low-light (<10%) bottlenecks, but it seems that most stands recover by age 40 to provide the light necessary for reasonable spruce growth.
Based upon the analyses of stands 1, 2 and 3 (Tables 1, 2 and 3), there appear to be only
minor differences in light availability between acceptable and failing FTG positions. Centres of

14
large gaps and positions on the N side of gaps had slightly higher light transmission than positions on the S side of gaps. At high latitudes, the zone of higher solar radiation is offset from a canopy gap center (Canham 1988), and this is exacerbated as the height of trees increases. Also, as hardwood stems bend toward light gaps, it is likely that gaps 2 to 4 m across would eventually almost disappear as the trees grow. Thus, small scale and detailed distance dependent competition indices may not be good predictors of future light competition. Plot size for a competition index must, therefore change as competing trees became taller (Burton 1993). As much of the direct beam solar radiation over the growing season at high latitudes is lower than 45º from horizontal, the plot radius to estimate stand conditions affecting direct beam light should be at least equal to the height of the competitors. For practical purposes, however, any accurate estimate of stand density and tree size should suffice.
Table 1. Light transmission for aspen stands ranging from 3 to 11cm D30. Light was measured at 1 to 4.5m height, at different positions, for different Free-to-Grow criteria. Light estimation was for 50% diffuse light conditions from May 15 to Sept. 15, at 54º latitude. The spatial arrange of trees and the positions for light estimation for the stand with 2 X 2 m spacing shown in Fig. 4.
Position _Pass FTG Type1___ ______Mean D30/Height of Light Estimate_____ 1.5m 1m 1.5m 2.0m 3cm 5cm 7cm 9cm 11cm
270º 1.0m 1.5m 2.5m 3.5m 4.5m
1 (SG) Y N N N 85.2 58.6 35.1 18.1 8.1
2 (SG) Y Y N N 78.5 55.4 32.7 18.6 9.8
3 (CG) Y Y Y Y 86.0 60.2 35.3 18.4 9.6
4 (NG) Y Y N N 85.3 57.7 36.0 20.0 10.7
5(NG) Y N N N 87.1 63.1 37.3 20.9 11.2
6 (SEG) Y N N N 78.1 56.3 32.5 15.5 6.4
7 (CG) N Y N N 78.4 53.7 30.5 13.6 5.8
8 (NWG) Y N N N 82.4 56.0 33.3 16.8 6.5
9 (SG) Y N N N 85.3 57.5 32.8 13.8 5.7
10 (SG) Y N N N 81.8 58.4 33.5 15.7 6.6
11 (CG) N Y N N 76.7 52.9 30.7 16.5 6.5
12 (NG) Y N N N 77.7 54.9 30.8 15.8 7.3
13 (NG) Y N N N 83.4 57.8 32.9 14.7 6.0
1 The 1.5 and 270° FTG indicates that there are no deciduous trees greater than 2/3 height of the crop tree for 270° of a 1.5 m radius arc. The other definitions indicate 1, 1.5 or 2 m radius circular plots

15
Table 2. Light transmission for aspen stands ranging from 3 to 11cm D30. Light was measured at 1 to 4.5m height, at different positions, for different Free-to-Grow criteria. Light estimation was for 50%direct beam and diffuse light conditions from May 15 to Sept. 15, at 54º latitude. The spatial arrange of trees and the positions for light estimation for the stand with 2 X 2 m spacing shown in Fig. 5.
Position ___Pass FTG Type 1___ ______Mean D30/Height of Light Estimate___ 1.5m 1m 1.5m 2.0m 3cm 5cm 7cm 9cm 11cm
270º 1.0m 1.5m 2.5m 3.5m 4.5m
1 (SG) Y N N N 94.1 83.3 64.8 45.1 29.4
2 (SG) Y Y Y N 91.4 76.0 61.5 45.8 33.8
3 (CG) Y Y Y Y 95.9 82.7 65.8 53.3 38.5
4 (NG) Y Y Y N 94.7 81.1 67.0 53.3 42.5
5(NG) Y N N N 95.3 84.8 69.1 53.7 42.4
6 (SEG) Y N N N 89.1 80.6 62.2 45.0 30.9
7 (CG) Y Y Y N 88.3 76.9 60.0 44.2 31.5
8 (NWG) Y N N N 92.8 75.3 61.2 47.7 34.9
9 (SG) Y N N N 93.8 82.7 63.3 42.8 26.3
10 (SG) Y Y N N 87.1 78.9 63.0 46.6 30.5
11 (CG) Y Y Y N 88.6 73.7 57.5 42.1 28.3
12 (NG) Y Y N N 91.4 77.4 62.1 45.7 32.6
13 (NG) Y N N N 94.3 80.0 63.2 44.7 30.8
1See Table 1
Table3. Light transmission for aspen stands ranging from 3 to 11cm D30. Light was measured at 1 to 4.5m height, at different positions, for different Free-to-Grow criteria. Light estimation was for 50 direct beam and 50% diffuse light conditions from May 15 to Sept. 15, at 54º latitude. The column on the right indicates results for the same stand but at 44º latitude. The spatial arrange of trees and the positions for light estimation in the stand with 2.5 X 2.5 m spacing shown in Fig. 6
Position _____Pass FTG Type1___ ______Mean D30/Height of Light Estimate__________ 44º 1.5m 1m 1.5m 2.0m 3cm 5cm 7cm 9cm 11cm 11cm
270º ___ 1.0m 1.5m 2.5m 3.5m 4.5m 4.5m
1 1T-S Y N N N 85.6 67.8 49.2 31.2 18.9 19.3
2 1T-N Y N N N 87.6 67.3 48.9 31.6 19.8 22.9
3 2T-S Y Y N N 77.3 65.0 46.7 28.8 16.5 15.5
4 2T-N Y Y N N 88.7 61.7 42.8 27.2 17.3 20.2
5 3T-S Y N N N 75.9 54.4 34.7 18.6 9.3 9.5
6 3T-N Y N N N 87.7 65.2 48.4 30.3 18.2 21.2
7 Open Y Y Y Y 89.6 68.9 50.0 32.0 20.5 26.0
8 Open Y Y Y Y 91.6 69.5 52.0 35.5 24.7 27.5
9 4T N Y N N 81.6 63.6 42.0 24.8 12.6 11.1
10 2T-NS N Y N N 82.2 57.8 37.7 22.3 12.7 13.6
11 2T-NS N N N N 85.7 66.5 48.3 28.3 13.6 12.8
12 2T-EW N Y N N 89.4 68.1 48.0 30.7 19.7 19.6
13 2T EW N N N N 88.2 66.9 46.3 28.4 15.7 15.1
1See Table 1

16
The overall stand density and tree size (Tables 1, 2 and 3) is a much better estimator of light transmission than the FTG standards. As tree size has an impact on crown size and its leaf area, and density relates to the number of tree crowns that are packed into a given area, both density and size are strongly related to light transmission. In self-thinning juvenile stands, density and size are also tightly coupled, so either explains much of the change in light available with age (Pinno 2000). If planting or brushing treatments are applied, density and size may be uncoupled. Our predictive equation for light (Equation 2) is therefore driven by basal area, or its components, density and diameter squared. This equation is also reasonable owing to the well-established relationship between sapwood area and leaf area. In juvenile stands, up to 11 cm D30, most of the basal area is sapwood area, therefore, an increase in basal area should mean an increase in leaf area and a decrease in light transmission. As heartwood was beginning to develop in trees greater than 11 cm D30, Eq 2 should not be used beyond this size. Comeau (2001) also noted the clear relationship between light transmission and basal area of juvenile aspen stands.
This study (Fig. 7) did not follow the LAI trajectories of individual stands but was based
upon temporary sample plots of stands of a range of ages, and the stands were ‘grown’ in the analyses (Tables 1, 2, and 3) by simply changing the sizes of the trees. While we are not aware of density management diagrams for aspen, we anticipate that only stand 1 would be near the self-thinning line at 2500 stems/ha and 11 cm D30. While this technique for ‘growing’ stands has some limitations, the results from stand 2 suggest that 1100 well-spaced dominant trees/ha will deliver sufficient light to maintain good growth of the spruce. In this data set, 11cm D30 trees are approximately 25 years old and thus spruce in stand 2 would make it past the competitive bottleneck described above. While aspen does self thin rapidly, we have no mechanism to estimate the reduction in stand density with time.
As there are biodiversity and productivity benefits associated with mixed-species stands
(Man and Lieffers 1999), it is desirable to have FTG standards that allow maintenance of both species. The mixedwood FTG standard using the 270° arc was intended to allow some hardwoods within 1.5 m distance from the spruce. Virtually any position in Stand 1, except those positioned equidistant between the aspen trees, would meet this FTG standards. Assuming that all trees would still be alive by the time the stand reached 11 cm D30, MIXLIGHT suggests that this stand will have low light transmission (<10%) that would severely suppress or kill the spruce. Substituting 2500 stems/ha and a size of 11 cm D30 in Eq 2 also results in light levels of 7.3% for the stand. These results, therefore, suggest that the use of the 270° arc alone may not necessarily meet the FTG definition, even the lowest goal of a FTG grow standard, i.e. to ensure survival of the conifer tree. In contrast, however, complete removal of all aspen trees in the three plots would be needed to achieve the 2m radius definition of the conifer standard. This would achieve the opposite extreme, thereby eliminating aspen. This far surpasses the above survival standard definition of FTG. In summary, the FTG criteria based upon small plots do not necessarily indicate competitive impacts of aspen on the spruce as the aspen becomes taller. FTG in juvenile mixedwoods should be assessed from density and size of aspen estimated in a larger plot area. Timing of the survey relative to the time of competitive bottlenecks also appears to be critical. A survey at year 10 or earlier could likely identify stands approaching a competitive bottleneck.

17
REFERENCES Alberta Environment. 2000. Alberta regeneration survey manual. Alberta Environment. Forest
Management Division. Edmonton, AB.
Alberta Forest Service. 1992. Alberta regeneration survey manual. Alberta Forestry, Lands and Wildlife. Edmonton, AB.
Beckingham, J.D., I.G.W. Corns, and J.H. Archibald. 1996. Field guide to ecosites of west-central Alberta. Nat. Resour. Can., Can. For. Serv., Northwest Reg., North. For. Cent., Edmonton, AB. Special Rep. 9.
Brand, D.G. 1986. A competition index for predicting the vigour of planted Douglas-fir in southwestern British Columbia. Can. J. For. Res. 16:23-29.
Brand, D.G. and Weetman, G.F. 1986. Standards for regeneration establishment in Canada: A case study for Douglas-fir. For. Chron. 62:84-90.
Burton, P.J. 1993. Some limitations inherent to static indices of plant competition. Can. J. For. Res. 23:2141-2152.
Campbell, G.S.,Norman, J.M. 1989. The description and measurement of plant community structure. In Russell., G., Marshall, B. Jarvis, P.G. (Eds.). Plant canopies: their growth, form and Function. Soc. Exp. Biol. Sem. Ser. Vol. 31. pp. 1-19, Cambridge University Press, Cambridge UK.
Canham, D.D. 1988. An index for understory light levels in and around canopy gaps. Ecology 69: 1634-16-38.
Constabel, A. J. and Lieffers, V.J. 1996. Seasonal patterns of light transmission through boreal mixedwood canopies. Can. J. For. Res. 1008-1014.
Comeau, P.G. 2001. Relationship between stand parameters and understory light in boreal aspen stands. B.C. J. Ecosystems and Management In Press.
Comeau, P.G., Braumandl, T.F., and Xie, C.-Y. 1993. Effects of overtopping vegetation on light availability and Engelmann spruce (Picea engelmannii) seedlings. Can. J. For. Res. 23:2044-2048.
DeLong, H.B., Lieffers, V.J., and Blenis, P.V. 1997. Microsite effects on fires-year establishment and overwinter survival of white spruce in aspen-dominated boreal mixedwoods. Can. J. For. Res. 29: 1452-1457.
DeLong, S.C. 1991. The light interception index: a potential tool for assisting in vegetation management decisions. Can. J. For. Res. 21:1037-1042.
DesRochers, A. 2001. Root biomass of regenerating aspen (Populus tremuloides Michx.) stands in Alberta. Can. J. For. Res. In press.
Eis, S. 1981. Effect of vegetative competition on regeneration of white spruce. Can. J. For. Res. 11: 1-8.
Gower, S.T., McMurtrie, R.E., and Murty, D. 1996. Aboveground net primary production decline with stand age: potential causes. TREE 11: 378-382.

18
Jarvis, P.G and Leverenz, J.W. 1983. Productivity of temperate, deciduous and evergreen forests. In O.L. Lang, P.S. Nobel, C.B. Osmond and H. Zielgler, Eds. Physiological plant ecology IV. Ecosystem processes: Mineral cycling, productivity and Man’s influence. Encyclopedia of plant physiology, New Series, Vol. 12D Springer-Verlag, Berlin. Pp 243-280.
Kucharik, C.J., Norman, J.M.,and Gower, S.T. (1998) Measurements of branch area and adjusting leaf area index measurements. Agricultural and Forest Meteorogy 91: 69-88.
Lieffers, V.J., Messier, C., Stadt, K.J., Gendron, F.,and Comeau, P.G. (1999) Predicting and managing light in the understory of boreal forests. Canadian Journal of Forest Research 29: 796-811.
Lieffers, V.J. and Stadt, K.J. 1994. Growth of understory Picea glauca, Calamagrostis canadensis, and Epilobium angustifolium in relation to overstory light transmission. Can. J. For. Res. 24:1193-1198.
Logan, K.T. 1969. Growth of tree seedling as affected by light intensity. IV black spruce, white spruce, balsam fir and eastern white cedar. Can. For. Serv. Publ. 1256.
Long, J.N.and Smith, F.W. (1992) Volume increment in Pinus contorta var. latifolia, the influence of stand development and crown dynamics. For. Ecol. Manage. 53-64.
MacDonald, B. and Weetman, G.F. 1993. Functional growth analysis of conifer seedling responses to competing vegetation. For. Chron. 69:64-70.
Man, R. and Lieffers, V.J. 1999. Are mixtures of aspen and white spruce more productive than single species stands? For. Chron. 75:505-513.
Messier, C., Parent, S., and Bergeron, Y. 1998. Characterization of understory light environment in closed mixed boreal forests: effects of overstory and understory vegetation. J. Veg. Sci. 9: 511-520.
Peterson, E.B. and Peterson N.M. 1996. Ecology and silviculture of trembling aspen. In Ecology and management of British Columbia hardwoods. P.G. Comeau, G.J. Harper, M.E. Blache, J.O. Boateng and K.D. Thomas. B.C. Min. of Forests, Research Branch, Victoria. FRDA Report 255. pp. 31-52.
Pierce, L.L. and Running, S.W. 1988. Rapid estimation of coniferous forest leaf area index using a portable integrating radiometer. Ecology, 69: 1762-1767.
Pinno, B.D. 2000. Crown characteristics and understory light in young trembling aspen stands. M.Sc. Thesis, University of Alberta. 85pp.
Pinno, B.D. 2001. Measuring and modeling the crown and light transmission characteristics of juvenile aspen. Can. J. For. Res. Submitted.
Stadt, K.J. and Lieffers, V.J. 2000. MIXLIGHT: A flexible light transmission model for mixed-species forest stands. Agric. For. Meteor. 102:235-252.
Steven, M.D. and M.H. Unsworth. 1980. The angular distribution and interception of diffuse solar radiation below overcast skies. Quart. J. Royal Meteorol. Soc. 106: 57-61.
Swinehart, D.F. 1962. The Beer-Lambert Law. J. Chem. Edu. 39: 333-335.

19
Tanner, D. DeLong, S.C. and Eastham, A. 1996. Investigations of planting wite spruce under a trembling aspen canopy. In Silviculture of temperate and boreal broadleaf-conifer mixtures. P.G comeau and K.D. Thomas Eds., BC Ministry of Forests Victoria BC. Land Manage. Handbook 36, pp 114-121.
Wright, E.F., Coates, K.D., Canham, C.D. and Bartemucci, P. 1998. Species variability in growth response to light across climatic regions in northwestern British Columbia. Can. J. For. Res. 28: 871-886.