Equity Funds in China A Share Market using Style Research’s Portfolio Analyzer Markets Analyzer CJ...
56
Equity Funds in China A Share Market using Style Research’s Portfolio Analyzer Markets Analyzer CJ Zou [email protected] + 81 90 3818 3361 Nov 2012
-
Upload
randolf-peters -
Category
Documents
-
view
214 -
download
0
Transcript of Equity Funds in China A Share Market using Style Research’s Portfolio Analyzer Markets Analyzer CJ...

Equity Funds in China A Share Marketusing Style Research’s
Portfolio AnalyzerMarkets Analyzer
CJ [email protected] + 81 90 3818 3361
Nov 2012

Data and Approach Data
- 393 China A shares equity funds (equity stocks>70%) end Jun 2012- Performance Attribution is semiannual holdings data from June
2005 to Jun 2012.
Approach- Using Style Research Portfolio Analyzer: portfolios against
Benchmark =CSI 300- Using Style Research Markets Analyzer: market cap weighted,
minimum stock size USD 100 million, sector adjusted, 6-month rebalance
- Add cash in Chinese RMB if the portfolio does not sum to 100%.- Return: 12 months and 2 years excess return

5% of outliers excluded
95th Percentile
50th Percentile (Median)
25th Percentile
5th Percentile
75th Percentile
0.00
2.00
4.00
6.00
8.00
10.00
12.00
14.00
16.00
% P
er A
nnum

What are we going to cover?
Where is the money?
What are the risks? Where are risks from?
What are the returns? Where are the returns from? What do the factor and Sector returns look like?
Case study

Where is the money?

Where is the money?Style Skyline
Book to
Price
Dividend
Yield
Earning
s Yld
C'Flow Yield
Sales t
o Price
EBITDA to Price
Rtn on
Equity
Earning
s Grow
th
Incom
e/Sale
s
Sales G
rowth
IBES 12Mth
Gr
IBES 1Yr R
ev
Market
Cap
Market
Beta
Moment
um ST
Moment
um M
T
Debt/Equi
ty
Foreign
Sales
0.0
2.0
4.0
6.0
8.0
10.0
12.0
Style Skyline
Style Factors
Std
Dev
from
Ben
chm
ark
Mea
n

Where is the money?Sector Adjusted (SA)

Where is the money?Style Skyline: Sector Adjusted
Book to
Price
Dividend
Yield
Earning
s Yld
C'Flow Yield
Sales t
o Price
EBITDA to Price
Rtn on
Equity
Earning
s Grow
th
Incom
e/Sale
s
Sales G
rowth
IBES 12Mth
Gr
IBES 1Yr R
ev
Market
Cap
Market
Beta
Moment
um ST
Moment
um M
T
Debt/Equi
ty
Foreign
Sales
0.0
2.0
4.0
6.0
8.0
10.0
12.0
Style Skyline (Sector Adjusted)
Style Factors
Std
Dev
from
Ben
chm
ark
Mea
n

Where is the money?Sector Skyline
Financi
alsEner
gy
Utilities
Info T
ech
Health
Care
Cons Stap
les
Cons Disc
Telecom
Service
s
Indust
rials
Material
s-40.0
-30.0
-20.0
-10.0
0.0
10.0
20.0
30.0
Sector Skyline
% D
iff fr
om M
arke
t

Where is the money?Sector Skyline Detail
Book to
Price
Dividend
Yield
Earning
s Yld
C'Flow Yield
Sales to
Price
EBITDA to Price
Rtn on E
quity
Earning
s Grow
th
Incom
e/Sale
s
Sales G
rowth
IBES 12Mth G
r
IBES 1Yr R
ev
Market C
ap
Market B
eta
Moment
um ST
Moment
um MT
Debt/Equi
ty
Foreign
Sales
0.0
2.0
4.0
6.0
8.0
10.0
12.0
Health Care Style Skyline
Book to
Price
Dividend
Yield
Earning
s Yld
C'Flow Yield
Sales to
Price
EBITDA to Price
Rtn on E
quity
Earning
s Grow
th
Incom
e/Sale
s
Sales G
rowth
IBES 12Mth G
r
IBES 1Yr R
ev
Market C
ap
Market B
eta
Moment
um ST
Moment
um MT
Debt/Equi
ty
Foreign
Sales
0.0
2.0
4.0
6.0
8.0
10.0
12.0
Consumer Discretionary Style Skyline
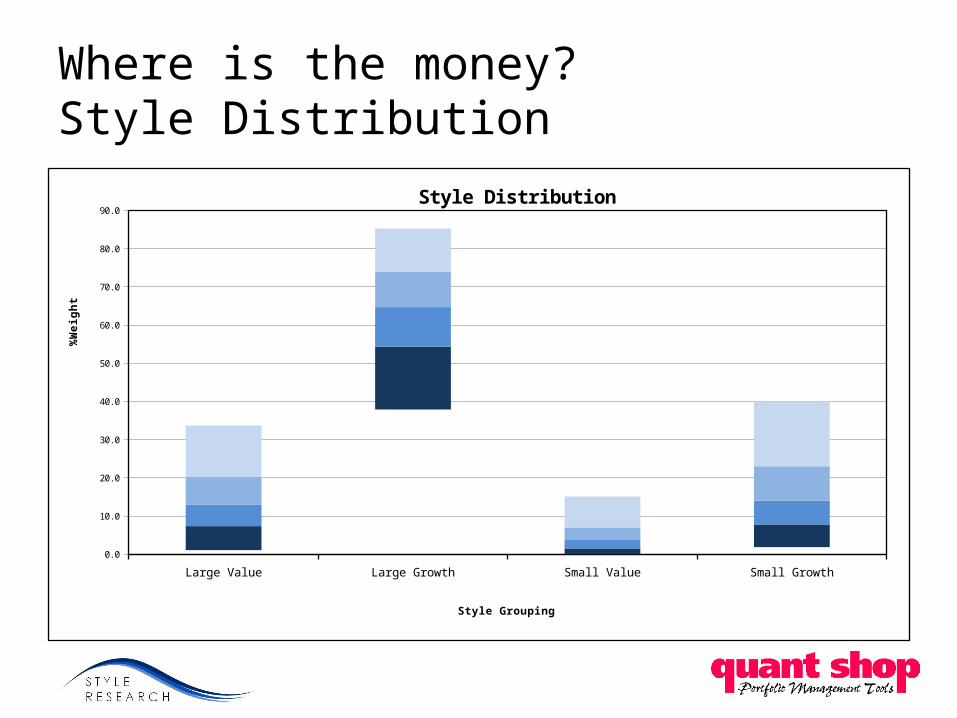
Where is the money?Style Distribution
Large Value Large Growth Small Value Small Growth0.0
10.0
20.0
30.0
40.0
50.0
60.0
70.0
80.0
90.0
Style Distribution
Style Grouping
%W
eigh
t

Where is the money?Style Distribution: SA
Large Value Large Growth Small Value Small Growth0.0
10.0
20.0
30.0
40.0
50.0
60.0
70.0
80.0
90.0
Style Distribution SA
Style Grouping
% W
eigh
t

Where is the money?Size Distribution
100% - 6
0%
60% - 2
0%
20% - 0
%
0.0
10.0
20.0
30.0
40.0
50.0
60.0
70.0
80.0
90.0Size Distribution
Size Grouping
% W
eigh
t

Where is the money? Size Distribution: SA
100% - 6
0%
60% - 2
0%
20% - 0
%
0.0
10.0
20.0
30.0
40.0
50.0
60.0
70.0
80.0Size Distribution SA
Size Grouping
% W
eigh
t

What are the risks? Where are risks from?

Where are the risks?
Trackin
g Erro
r4.00
6.00
8.00
10.00
12.00
14.00
16.00
% P
er A
nnum
95%75%Median25%5%
14.9711.729.727.756.06
50th Percentile (Median)

Where are risks from? Decomposition of Risks
Sector
Risk (P
ure)
Style X'ter
ms
Style Risk
(Pure
)
Equity
X'terms
Equity
Risk (P
ure)
-20.0
-10.0
0.0
10.0
20.0
30.0
40.0
50.0
60.0
70.0
80.0
Risk Skyline
%

What are the returns? Where are the returns from? What do the factor and sector returns look like?

Series1-2%
0%
2%
4%
6%
8%
10%
4th 3rd 2nd 1st
What are the returns? Distribution of Excess Returns last 12 months
50th Percentile (Median)

Decomposition of the sources of return by Style Research
• HIERARCHICAL METHODOLOGY decomposes returns into – Currency Component– Market Component– Sector Component– Style Component – Stock Component

Excess Returns DecompositionLast 12 months
Sector Style Stock Total-8%
-3%
2%
7%
12%
4th 3rd 2nd 1st

Risks vs. Returns : Last 1 year
Last 12 months Risks
Sector Risk(pure) Style Risk(pure) Stock Risk(pure)0%
10%
20%
30%
40%
50%
60%
70%
80%
4th 3rd 2nd 1st
Last 12 months Returns
Sector Return Style Return Stock Return-6%
-4%
-2%
0%
2%
4%
6%
8%
10%
12%
14%
4th 3rd 2nd 1st

Excess Returns Decomposition Last 2 years
Sector Style Stock Total-8%
-6%
-4%
-2%
0%
2%
4%
6%
8%
10%
12%
4th 3rd 2nd 1st

Excess Returns Decomposition Last 1 year vs. Last 2 years return
Last 1 year Return
Sector Style Stock Total-8%
-3%
2%
7%
12%
4th 3rd 2nd 1st
Last 2 years Return
Sector Style Stock Total-8%
-3%
2%
7%
12%
4th 3rd 2nd 1st

Factor Returns – some do well
50-1
00 B
ook
Val
50-1
00 D
iv Yld
50-1
00 E
ngs
Yld
50-1
00 C
fl Yld
50-1
00 S
ales
to P
r
50-1
00 E
BITDA
50-1
00 R
oE
50-1
00 E
rgs
Gr
50-1
00 In
c to
Sls
50-1
00 S
ales
Gr
50-1
00 IB
ES 12M
Gr
50-1
00 IB
ES FY1
3M
0-20
Mar
ket C
ap
50-1
00 B
eta
50-1
00 M
mnt
m 6
M
50-1
00 M
mnt
m 1
2M
0-50
Deb
t to
Eq
50-1
00 F
gn S
ales
-6.0%
-4.0%
-2.0%
0.0%
2.0%
4.0%
6.0%
Style Portfolio Relative Return(SA) Last 12 months

Positions did not match returnswhere the money is
Book to
Price
Dividend
Yield
Earning
s Yld
C'Flow Yield
Sales t
o Price
EBITDA to Price
Rtn on
Equity
Earning
s Grow
th
Incom
e/Sale
s
Sales G
rowth
IBES 12Mth
Gr
IBES 1Yr R
ev
Market
Cap
Market
Beta
Moment
um ST
Moment
um M
T
Debt/Equi
ty
Foreign
Sales
0.0
2.0
4.0
6.0
8.0
10.0
12.0
Style Skyline (Sector Adjusted)
Style Factors
Std
Dev
from
Ben
chm
ark
Mea
n

Sector Returns – some do well
Financ
ials
Energ
y
Utilitie
s
Info
Tec
h
Health
Car
e
Cons
Staple
s
Cons
Disc
Teleco
m S
ervic
es
Indu
stria
ls
Mat
erial
s
-25.0%
-20.0%
-15.0%
-10.0%
-5.0%
0.0%
5.0%
10.0%
15.0%
20.0%
25.0%
Sectors Relative Return(SA) Last 12 months

Financi
alsEner
gy
Utilities
Info T
ech
Health
Care
Cons Stap
les
Cons Disc
Telecom
Service
s
Indust
rials
Material
s-40.0
-30.0
-20.0
-10.0
0.0
10.0
20.0
30.0
Sector Skyline
% D
iff fr
om M
arke
tPositions did not match returns
where the money is

Looking at things differently- information Ratio?

Looking at things differentlyInformation ratio
Sector Style Stock Total(1.00)
(0.80)
(0.60)
(0.40)
(0.20)
0.00
0.20
0.40
0.60
0.80
1.00
4th 3rd 2nd 1st

Looking at things differentlyInformation ratio top quartile(75% - 100%)
Sector Style Stock Total(0.20)
0.00
0.20
0.40
0.60
0.80
1.00
1.20
1.40

Looking at things differentlyInformation ratio bottom quartile(0% - 25%)
Sector Style Stock Total(2.50)
(2.00)
(1.50)
(1.00)
(0.50)
0.00
0.50

Conclusion
Where is the money Style: Overweight growth and underweight value; Overweight momentum both in ST
and MT, slightly large cap Sector: Overweight Health care, Cons Staples, Cons Disc; underweight Energy and
Telecom
Risks: Stock risk> Sector risk> style Risk
Returns outperformed CSI 300 managers made money from stock selection Lost money from Sector – underweighted Telco, Finance, overweight Cons Disc Lost money from Style – underweighted Value, overweight momentum
Info ratios: Stock > Sector and Style

Case Studythe fund has highest info ratio

ABC fund – the Style Skyline
High Beta high momentum
Book
to P
rice
Divide
nd Y
ield
Earnin
gs Y
ld
C'Flow
Yiel
d
Sales
to P
rice
EBITDA to
Pric
e
Rtn o
n Equ
ity
Earnin
gs G
rowth
Inco
me/
Sales
Sales
Gro
wth
IBES 1
2Mth
Gr
IBES 1
Yr Rev
Mar
ket C
ap
Mar
ket B
eta
Mom
entu
m S
T
Mom
entu
m M
T
Debt/E
quity
Foreig
n Sale
s
0.0
2.0
4.0
6.0
8.0
10.0
12.0Portfolio Style Skyline™
Style Factors
Sty
le T
ilt™

ABC fund– Style Distribution
Invest in value and small growth stocks
Larg
e Valu
e
Larg
e Gro
wth
Smal
l Val
ue
Smal
l Gro
wth
0
10
20
30
40
50
60
70
80
90
Style DistributionPortfolio Benchmark
Coverage Market
Style
% W
eig
ht

ABC fund – Market Cap
Invest in Small cap
100%
- 60
%
60%
- 20
%
20%
- 0%
0
10
20
30
40
50
60
70
80
90
Market Cap Distribution Portfolio Benchmark
Coverage Market
Style
% W
eig
ht
-20
-15
-10
-5
0
5
10
15
20
25
30
Sector Active Positions Active Weight
Uncovered
Sector
%
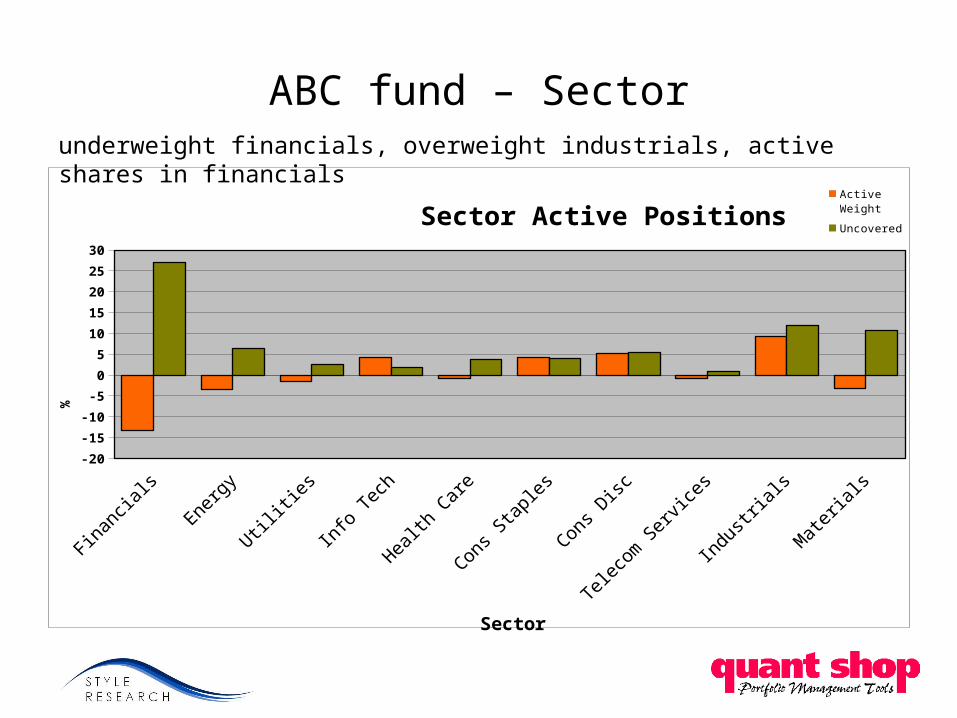
ABC fund – Sectorunderweight financials, overweight industrials, active shares in financials

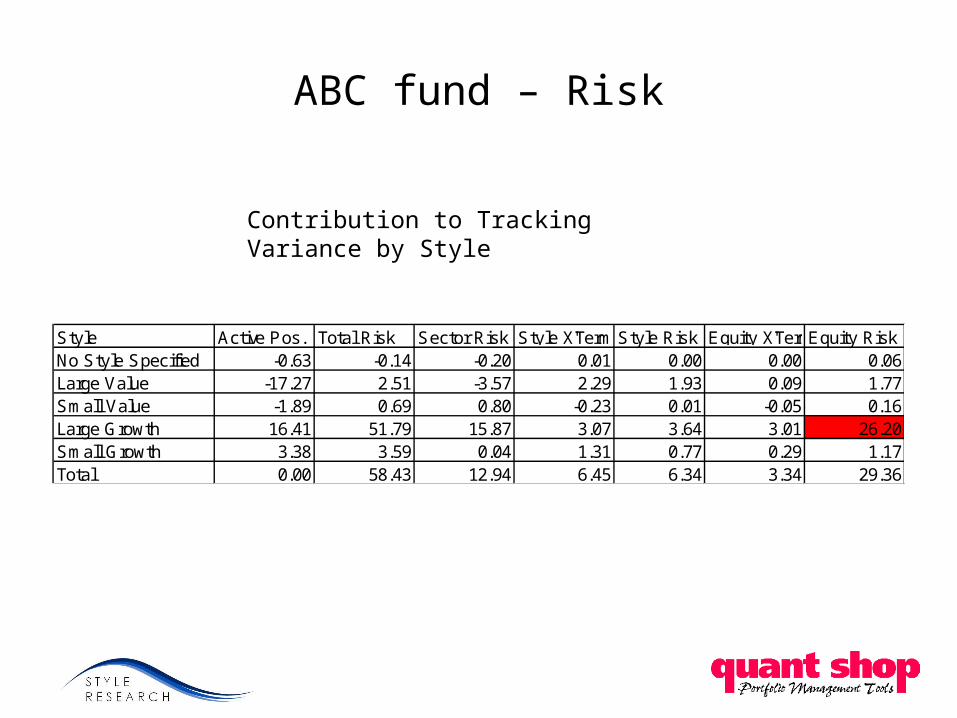
ABC fund – Risk
Risk Attribution
Equity risk!
Components of Tracking Variance 100%
Sector Risk (Pure) 12.94 22.1
Style X'terms 6.45 11.0
Style Risk (Pure) 6.34 10.9
Equity X'terms 3.34 5.7
Equity Risk (Pure) 29.36 50.2 Sector
Risk
Style X
'term
s
Style R
isk
Equity
X'term
s
Equity
Risk
0
10
20
30
40
50
60
%
ABC fund – Risk
Contribution to Tracking Variance by Style
Style Active Pos. Total Risk Sector Risk Style X'TermsStyle Risk Equity X'TermsEquity RiskNo Style Specified -0.63 -0.14 -0.20 0.01 0.00 0.00 0.06Large Value -17.27 2.51 -3.57 2.29 1.93 0.09 1.77Small Value -1.89 0.69 0.80 -0.23 0.01 -0.05 0.16Large Growth 16.41 51.79 15.87 3.07 3.64 3.01 26.20Small Growth 3.38 3.59 0.04 1.31 0.77 0.29 1.17Total 0.00 58.43 12.94 6.45 6.34 3.34 29.36

ABC fund – Risk
Contribution to Tracking Variance by Sector
Sector Active Pos. Total Risk Sector Risk Style X'TermsStyle Risk Equity X'TermsEquity RiskMissing Sector 0.00 0.00 0.00 0.00 0.00 0.00 0.00Financials -13.34 19.37 4.90 3.68 1.16 1.27 8.35Energy -3.52 2.41 0.80 0.92 0.04 -0.03 0.68Utilities -1.46 0.14 -0.29 0.14 0.10 0.00 0.19Information Technology 4.19 2.67 1.83 -0.13 0.05 -0.03 0.95Health Care -0.92 -0.44 -0.57 -0.31 0.05 -0.01 0.41Consumer Staples 4.30 5.75 1.50 0.96 1.42 -0.11 1.99Consumer Discretionary 5.25 7.63 2.68 -0.66 1.10 0.47 4.03Telecommunication Services-0.78 0.13 0.16 -0.07 0.02 0.01 0.01Industrials 9.37 17.42 2.88 1.29 1.93 1.76 9.56Materials -3.08 3.34 -0.96 0.64 0.48 0.01 3.18Total 0.00 58.43 12.94 6.45 6.34 3.34 29.36

ABC fund – Return
-2.0%
0.0%
2.0%
4.0%
6.0%
8.0%
10.0%
12.0%
Performance Summary (31-Dec-07 to 30-Sep-12)
Active Return
Act
ive
Cu
mu
lati
ve R
etu
rn
-40.0%
-30.0%
-20.0%
-10.0%
0.0%
10.0%
20.0%
30.0%Active Return
Portfolio Return
Benchmark Return
Mo
nth
ly A
cti
ve R
etu
rn

ABC fund – Return
-4.0%
-2.0%
0.0%
2.0%
4.0%
6.0%
8.0%
10.0%
12.0%
Hierarchical Performance Attribution (31-Dec-07 to 30-Sep-12)
Active Return
Sector
Style
Stock
Act
ive
Cu
mu
lati
ve R
etu
rn
-10.0%
-8.0%
-6.0%
-4.0%
-2.0%
0.0%
2.0%
4.0%
6.0%
8.0%
Active Return
Sector
Style
Stock
Mo
nth
ly A
cti
ve R
etu
rn

ABC fund – Return
Contributions by Sector last 12 months
- Biggest contributor to last 12 M returns is Industrials
Sector Average Active Weight Relative Return Allocation Stock Interaction Currency TotalFinancials -11.4% 13.0% -1.5% 2.1% -0.8% 0.0% -0.2%Energy -2.8% -9.7% 0.1% 0.1% 0.0% 0.0% 0.1%Utilities -0.9% 9.3% -0.1% 0.5% -0.3% 0.0% 0.1%Info Tech 6.9% -12.7% -0.9% 0.9% 2.1% 0.0% 2.1%Health Care 3.4% 9.9% 0.3% -0.3% -0.2% 0.0% -0.3%Cons Staples 5.3% 7.7% 0.3% 0.1% -0.3% 0.0% 0.1%Cons Disc 5.1% -2.1% -0.3% 1.3% 0.3% 0.0% 1.3%Telecom Services -0.6% -14.2% 0.3% 0.0% 0.0% 0.0% 0.3%Industrials 1.9% -15.2% -0.4% 4.7% 1.0% 0.0% 5.2%Materials -7.0% -7.3% 0.2% 1.3% -0.6% 0.0% 0.9%Totals -2.1% 10.5% 1.2% 0.0% 9.7%

ABC fund – Return
Contributions by Style last 12 months
- Biggest contributor to last 12 m return is Large value
Style Average Active Weight Relative Return Allocation Stock Interaction Currency TotalLarge Value -28.4% 2.6% -0.3% 2.9% -1.7% 0.0% 0.9%Large Growth 14.2% -2.2% 0.0% 6.4% 1.3% 0.0% 7.8%Small Value 2.6% 1.6% 0.1% -0.2% -0.1% 0.0% -0.2%Small Growth 12.3% -29.1% -3.9% 0.0% 5.1% 0.0% 1.2%Totals -4.1% 9.2% 4.5% 0.0% 9.7%

Ranking

Top 10&Bottom 10 Tracking Errors
Funds Name TE%
1 E Fund Health Care 24.1
2 China Universal Health Care 23.6
3 Changxin Domestic Demand Growth 19.1
4 Tianhong Select 18.3
5 Changxin Shuangli 18.1
6 Greatwall Value Added Consumer 18.1
7 Everbright Mid Small Cap 17.9
8 Manulife Teda Growth 17.8
9 Lord Abbett Mid Small Cap 17.5
10 Huashang Dynamic 17.4
Funds Name TE%
1 Everbright Pramerica Quantization 3.9
2 Bosera Franchise Value 4.1
3 Changsheng Quantitative Dividend Strategy
4.5
4 Huaxia Blue-chip Core 4.6
5 Southern Strategy Equity 4.9
6 CCB Principal Dual Benefit Strategy 5.1
7 Orient Strategic Growth 5.1
8 Huatai PineBridge Quantitative First 5.3
9 Harfor Trending Growth 5.6
10 Huaxia Prosperity 5.7
Top 10 Bottom 10Average 9.98

Top 10 & Bottom TEs from sectorTop 10
Funds Name % of TE
1 China Universal Health Care 79%
2 Huaan Tactical Select 78%
3 Harvest Alpha 77%
4 E Fund Health Care 77%
5 Greatwall Jiu FU Core Growth 77%
6 Greatwall Value Added Consumer 76%
7 Invesco GW Domestic Demand Growth II 72%
8 Invesco GW Domestic Demand Growth 72%
9 First-Trust Xianxing 71%
10 Harvest Quality Enterprises 70%
Funds Name % of TE
1 First State Cinda Industry 2.5%
2 China Post Core Selected 2.9%
3 Golden Eagle Strategic Allocation 3.9%
4 KBC-Goldstate Core Power Stock 4.2%
5 SYWG BNP Paribas Advantage 4.6%
6 Dacheng Jinghong 4.9%
7 E Fund Ke Xiang 5.2%
8 E Fund Value Select 5.5%
9 Guangfa Domestic Demand 6.1%
10 Guotai Value Classic Equity 6.1%
Bottom 10Average 35.5%

Top 10 & Bottom TEs from styleTop 10
Funds Name % of TE
1 Guotai Jinlong Sector-Select Equities 53%
2 Lord Abbett Selected 30 43%
3 Morgan Stanley Huaxin Multi-factor Selection Strategy
32%
4 Soochow Sector Rotation 31%
5 Zhonghai Environmental Protection and New Energy Theme
31%
6 China Post Core Selected 30%
7 Huaxia Dividend 29%
8 SYWG BNP Paribas Quantitative 29%
9 Penghua Value Advantage 29%
10 First State Cinda Industry 29%
Funds Name % of TE
1 KBC-Goldstate Core Power Stock 1.7%
2 Huatai Pinebridge Value Growth 2.5%
3 China Universal Health Care 2.6%
4 Bosera Sector Rotation 2.6%
5 Harvest Growth 2.8%
6 E Fund Health Care 2.8%
7 Dacheng Aggressive Growth 2.9%
8 Fortis Haitong Equity 2.9%
9 Fortis Haitong Style Rotation 2.9%
10 HSBC Jintrust Longteng 2.9%
Bottom 10Average 10.7%

Top 10 & Bottom TEs from stockTop 10
Funds Name % of TE
1 KBC-Goldstate Core Power Stock 94%
2 Bank of Communications Schroder Pioneer
89%
3 Franklin Mid Small Cap 88%
4 Changsheng Quantitative Dividend Strategy
88%
5 Bosera Franchise Value 86%
6 Gold Eagle Stable Growth 86%
7 Bank of Communications Schroder Growth
83%
8 Dacheng Sector Rotation 81%
9 Soochow New Economy 81%
10 Bank of Communications Schroder Blue Chip
81%
Funds Name % of TE
1 Morgan Stanley Huaxin Multi-factor Selection Strategy
5.4%
2 China Universal Health Care 6.4%
3 E Fund Health Care 6.8%
4 Changxin Quantitative Pioneer 8.5%
5 ABC-CA Strategy Selected Stock 8.6%
6 SYWG BNP Paribas Quantitative 10.9%
7 Harfor Quantum vitality 11.7%
8 Huaxia Sector Select 13.5%
9 Greatwall Jiu FU Core Growth 13.6%
10 Greatwall Value Added Consumer 14.9%
Bottom 10Average 45%

Top 10 & Bottom 10 ReturnsTop 10 Bottom 10
Funds Name Return
1 Guangfa Ju Rui 11.8%
2 Fortune SGAM Dividend Growth 11.6%
3 Changxin Shuangli 11.2%
4 China Universal Health Care 11.1%
5 Guangfa Core Selected 11.0%
6 UBS SDIC Innovation Power 10.2%
7 Zhonghai Environmental Protection and New Energy Theme
9.9%
8 Xinhua Flexible Theme 9.7%
9 Fortune SGAM Selected Sectors 9.7%
10 Manulife Teda Growth 9.6%
Funds Name Return
1 Dacheng Jinghong -4.0%
2 Baoying Hongyang -3.8%
3 ICBCCS Mid Small Cap -3.6%
4 Invesco GW Emerging Growth -3.5%
5 Changxin Quantitative Pioneer -3.3%
6 Gold Eagle Stable Growth -3.2%
7 Yimin Innovation Advantage -3.1%
8 China Merchants Antai Eqiuty -2.6%
9 China Merchants Blue Chip Equity -2.3%
10 China Post Core Growth -2.2%
xs return last 12 monthsAverage 3.15%

Top 10 & Bottom Returns from sectorTop 10
Funds Name Return
1 China Universal Health Care 3.0%
2 Fullgoal Tianrui 2.0%
3 E Fund Health Care 2.0%
4 Greatwall Jiu FU Core Growth 1.5%
5 Penghua Dynamic Growth 1.2%
6 Minsheng Royal Blue Chip 0.9%
7 ICBCCS High Yield Equity 0.9%
8 Xinhua Enterprise 0.9%
9 Bosera Equity Select 0.8%
10 UBS SDIC Stable 0.8%
Funds Name Return
1 Huashang Dynamic -5.7%
2 Tianhong Yongding Cycle Strategies -5.6%
3 Fortune SGAM Emerging Industries -5.3%
4 E Fund Mid Small Cap -5.2%
5 Baoying Pan-Coastal Regional Growth -5.1%
6 Guotai Growth Equity -5.1%
7 HSBC Jintrust Technology Pioneer -5.1%
8 Chinanature Innovation Pioneer -5.0%
9 LC New Power -5.0%
10 China Post Core Growth -5.0%
Bottom 10xs return last 12 months
Average -2.32%

Top 10 & Bottom Returns from styleTop 10
Funds Name Return
1 Zhonghai Quantization 0.7%
2 Southern Kaiyuan 0.6%
3 Bank of Communications Schroder Theme Selected
0.5%
4 Golden Engle Dividend 0.5%
5 Guangfa Ju Feng 0.4%
6 Southern Long Yuan Industry 0.3%
7 Changxin Dynamic Strategy 0.3%
8 BOCIM Dynamic Strategy 0.2%
9 Changxin Yinli 0.2%
10 Galaxy Blue-chip Selection 0.1%
Funds Name Return
1 Penghua Growth -4.3%
2 Xinhua Flexible Theme -4.2%
3 Penghua Putian Income -3.9%
4 Industrial Co-Run Classification -3.7%
5 Golden Engle Advantage -3.5%
6 AXA-SPDB Life -3.3%
7 Harfor Value -3.3%
8 Bosera Emerging Growth -3.2%
9 Huashang Strategic Selection -3.2%
10 Harvest Taihe -3.1%
Bottom 10xs return last 12 months
Average -1.50%

Top 10 & Bottom Returns from stockTop 10
Funds Name Return
1 Guangfa Ju Rui 18%
2 Xinhua Flexible Theme 17%
3 Fortune SGAM Emerging Industries 15%
4 Fortune SGAM Dividend Growth 15%
5 Guangfa Core Selected 14%
6 Huashang Dynamic 14%
7 Shangtou JPM Emerging Power 13%
8 Manulife Teda Growth 13%
9 LC New Power 13%
10 Fortune SGAM Selected Sectors 13%
Funds Name Return
1 Dacheng Jinghong -0.1%
2 Invesco GW Emerging Growth 0.9%
3 Greatwall Mid Small Cap Growth 1.7%
4 Yimin Innovation Advantage 1.7%
5 Invesco GW Corporate Governance 1.9%
6 SYWG BNP Paribas Consumer 1.9%
7 Galaxy Yinfeng 2.0%
8 Gold Eagle Stable Growth 2.2%
9 ICBCCS Mid Small Cap 2.3%
10 Yinhua Leading Strategy Equity 2.5%
Bottom 10xs return last 12 months
Average 6.97%

Summary Chinese A funds analysis
- Most of China A funds over performed CSI 300 from July 2011 to June 2012- Overweight growth and underweight value; Overweight momentum both in
ST and MT, slightly large cap; Overweight Health care, Cons Staples, Cons Disc; underweight Energy and Telecom
- Style Risk < Sector and Stock risk- Return from Stock> Return from Sector and Style
Case Study- 80% returns are from Large Growth and 55% from Industrial ; 89% of risk
from Large Growth and 33% from industrial.- Buy growth and high momentum stocks
Run detailed analysis of one of your funds- Contact us if you are interested in a sample analysis of your own fund

Thanks
Q&A