Epi Info™ 7 Salmonella Outbreak Tutorial - Centers for … · · 2016-04-08Epi Info™ 7...
198
Epi Info™ 7 Salmonella Outbreak Tutorial Epi Info™ 7 Salmonella Outbreak Tutorial Document Version 2.9 20 April 2015 Author: Erik Knudsen
Transcript of Epi Info™ 7 Salmonella Outbreak Tutorial - Centers for … · · 2016-04-08Epi Info™ 7...

Epi Info™ 7 Salmonella Outbreak Tutorial
Epi Info™ 7 Salmonella Outbreak Tutorial
Document Version 2.9
20 April 2015
Author: Erik Knudsen

i
Acknowledgements
Epi Info™ Development Team:
Instructional design: Erik Knudsen
Epi Info™ technical advisors: José Aponte, Erik Knudsen
Division of Epidemiologic and Analytic Methods for Population Health
Scenario design: Tiffany Winston
Copyright Information
Epi Info™ is a trademark of CDC. Epi Info™ programs are provided in the public domain to promote public
health. Programs might be freely translated, copied, or distributed. No warranty is made or implied for use
of the software for any particular purpose.
Disclaimer
The following scenario and all data associated with the scenario and this training material are fictional. The
scenario is not related to any real-life event and was designed for software training purposes only. The
findings and conclusions in this report are those of the authors and do not necessarily represent the official
position of the Centers for Disease Control and Prevention.

ii
Table of Contents
Acknowledgements ................................................................................................................................................................................... i
Introduction .............................................................................................................................................................................................. 8
How to Use this Tutorial ...................................................................................................................................................................... 8
Step one .......................................................................................................................................................................................... 8
Step two .......................................................................................................................................................................................... 8
Step three........................................................................................................................................................................................ 8
Epi Info™ Resources ............................................................................................................................................................................. 9
Tutorial Files ......................................................................................................................................................................................... 9
Introduction to Scenario .................................................................................................................................................................... 11
Scenario......................................................................................................................................................................................... 11
Creating a Survey in Form Designer ........................................................................................................................................................ 13
Getting Started with Form Designer .................................................................................................................................................. 14
The Form Designer Workspace ..................................................................................................................................................... 14
Key Features .................................................................................................................................................................................. 15
Create a Project ................................................................................................................................................................................. 16
Field Overview ................................................................................................................................................................................... 18
Field Types .................................................................................................................................................................................... 18
Field Properties ............................................................................................................................................................................. 20
Creating Fields, Part 1 ........................................................................................................................................................................ 21
Creating a label/Title field ............................................................................................................................................................. 21
Creating a text field ....................................................................................................................................................................... 21
Creating a date field ...................................................................................................................................................................... 21
Creating a Legal Value field ........................................................................................................................................................... 22
Creating a number field ................................................................................................................................................................ 23
Student Practice ................................................................................................................................................................................. 25
Creating Fields, Part 2 ........................................................................................................................................................................ 27
Creating a group field .................................................................................................................................................................... 27
Creating a second page ................................................................................................................................................................. 29
Renaming a page ........................................................................................................................................................................... 29
Creating a Comment Legal field .................................................................................................................................................... 30
Creating a Codes field ................................................................................................................................................................... 32
Creating a Mirror Field .................................................................................................................................................................. 34
Student Exercise................................................................................................................................................................................. 35
Setting the Tab Order......................................................................................................................................................................... 36
Automatically assigning tabs ......................................................................................................................................................... 37
iii
Manually Assigning Tabs ............................................................................................................................................................... 37
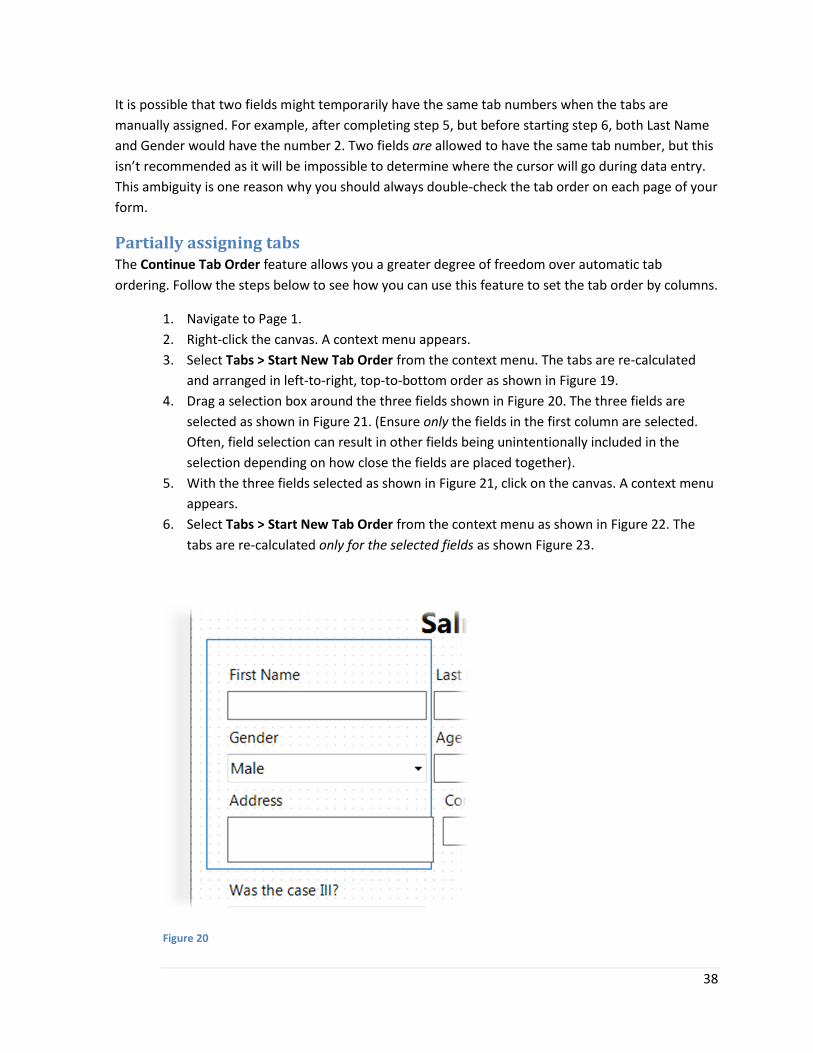
Partially assigning tabs .................................................................................................................................................................. 38
Formatting Options and Other Features ............................................................................................................................................ 42
Field alignment .............................................................................................................................................................................. 42
Font options .................................................................................................................................................................................. 44
Field Input box placement............................................................................................................................................................. 44
Page sizes and orientation ............................................................................................................................................................ 45
Grid settings .................................................................................................................................................................................. 45
Cut, copy, and paste ...................................................................................................................................................................... 46
Data dictionary .............................................................................................................................................................................. 46
Templates .......................................................................................................................................................................................... 48
Working with field-level templates ............................................................................................................................................... 48
Working with project-level templates ........................................................................................................................................... 49
Best Practices in Epi Info™ 7 Form Design ......................................................................................................................................... 53
Use of Yes/No and checkbox fields instead of drop-down list fields ............................................................................................. 53
Yes/No fields versus checkbox fields ............................................................................................................................................. 53
Page size awareness ...................................................................................................................................................................... 53
Group Fields .................................................................................................................................................................................. 53
Limit the use of required fields ..................................................................................................................................................... 54
Limit the use of option fields......................................................................................................................................................... 54
Use the range property for date and number fields ..................................................................................................................... 54
Be mindful of whether the form has a data table ......................................................................................................................... 54
Use multiline fields to capture large amounts of text ................................................................................................................... 55
Use field templates to avoid repeating work ................................................................................................................................ 55
Use project templates to distribute your Epi Info™ 7 projects ..................................................................................................... 55
Summary ............................................................................................................................................................................................ 56
Q&A ................................................................................................................................................................................................... 56
Quiz .................................................................................................................................................................................................... 57
Questions ...................................................................................................................................................................................... 57
Answers ......................................................................................................................................................................................... 59
Data Entry Validation using Check Code ................................................................................................................................................. 60
Getting Started with Check Code ....................................................................................................................................................... 61
The Check Code editor workspace ................................................................................................................................................ 61
Events ............................................................................................................................................................................................ 62
Commands Overview ......................................................................................................................................................................... 64
Define ............................................................................................................................................................................................ 64
Assign ............................................................................................................................................................................................ 64
Hide ............................................................................................................................................................................................... 64
iv
Unhide ........................................................................................................................................................................................... 64
Disable ........................................................................................................................................................................................... 64
Enable ........................................................................................................................................................................................... 64
Highlight ........................................................................................................................................................................................ 64
Unhighlight .................................................................................................................................................................................... 64
GoTo .............................................................................................................................................................................................. 64
Clear .............................................................................................................................................................................................. 64
Autosearch .................................................................................................................................................................................... 64
If .................................................................................................................................................................................................... 64
Execute .......................................................................................................................................................................................... 64
Dialog ............................................................................................................................................................................................ 65
Geocode ........................................................................................................................................................................................ 65
Opening the Form .............................................................................................................................................................................. 66
Calculate Age ..................................................................................................................................................................................... 68
Check for Invalid Dates ...................................................................................................................................................................... 70
Disable a Group Based on Multiple Conditions .................................................................................................................................. 73
Run Commands When the Page is Loaded ........................................................................................................................................ 77
Show a Warning Dialog Based on Multiple Conditions ...................................................................................................................... 78
Optional Exercise - Mutually Exclusive Checkboxes ........................................................................................................................... 81
Student Practice ................................................................................................................................................................................. 87
Best Practices using Epi Info™ 7 Check Code ..................................................................................................................................... 88
Use the DISABLE command to implement skip patterns............................................................................................................... 88
Assign values using proper syntax depending on the field type ................................................................................................... 88
Summary ............................................................................................................................................................................................ 89
Q&A ................................................................................................................................................................................................... 89
Quiz .................................................................................................................................................................................................... 89
Questions ...................................................................................................................................................................................... 89
Answers ......................................................................................................................................................................................... 91
Entering Data .......................................................................................................................................................................................... 93
Getting Started with Enter ................................................................................................................................................................. 94
The Enter workspace ..................................................................................................................................................................... 94
Key features .................................................................................................................................................................................. 95
Opening the form ............................................................................................................................................................................... 96
Entering Data into the Form .............................................................................................................................................................. 96
Merging Data with the Epi Info™ 7 Data Packager ............................................................................................................................ 97
Data packager overview ................................................................................................................................................................ 97
Creating a data package .............................................................................................................................................................. 100
Importing a data package ............................................................................................................................................................ 101

v
Finding Records ................................................................................................................................................................................ 103
Showing a Line List ................................................................................................................................. Error! Bookmark not defined.
Creating an Exposure Relationship .................................................................................................................................................. 105
Summary .......................................................................................................................................................................................... 106
Q&A ................................................................................................................................................................................................. 106
Quiz .................................................................................................................................................................................................. 106
Questions .................................................................................................................................................................................... 106
Answers ....................................................................................................................................................................................... 107
Data Analysis using the Dashboard ....................................................................................................................................................... 108
Getting Started with the Dashboard ................................................................................................................................................ 109
Dashboard workspace ................................................................................................................................................................. 109
Key features ................................................................................................................................................................................ 110
Gadgets Overview ............................................................................................................................................................................ 111
Line list ........................................................................................................................................................................................ 111
Frequency.................................................................................................................................................................................... 111
Means ......................................................................................................................................................................................... 111
2x2 / MxN table ........................................................................................................................................................................... 112
Chart............................................................................................................................................................................................ 112
Combined frequency ................................................................................................................................................................... 112
Matched pair case control .......................................................................................................................................................... 112
Linear regression ......................................................................................................................................................................... 112
Logistic regression ....................................................................................................................................................................... 112
Opening the Salmonella Data .......................................................................................................................................................... 113
Using the Line List Gadget ................................................................................................................................................................ 114
Generating a basic line list .......................................................................................................................................................... 114
Moving and collapsing the line list .............................................................................................................................................. 115
Sending line list output to other programs ................................................................................................................................. 115
Using the Frequency Gadget ............................................................................................................................................................ 116
Additional frequency properties ................................................................................................................................................. 117
Using the Combined Frequency Gadget .......................................................................................................................................... 119
Calculating Age................................................................................................................................................................................. 120
Using the Means Gadget .................................................................................................................................................................. 123
Using Data Filters ............................................................................................................................................................................. 126
Student Practice 1 ............................................................................................................................................................................ 129
Creating MxN Tables ........................................................................................................................................................................ 130
Creating 2x2 Tables .......................................................................................................................................................................... 131
Additional MxN / 2x2 properties ................................................................................................................................................. 132
Counting Checkboxes in a Group ..................................................................................................................................................... 135
vi
Creating Charts Using the Chart Gadget .......................................................................................................................................... 137
Epi curve ...................................................................................................................................................................................... 137
Column chart ............................................................................................................................................................................... 138
Pie chart ...................................................................................................................................................................................... 139
Stacked Column chart ................................................................................................................................................................. 140
Chart titles and axis labels ........................................................................................................................................................... 142
Recoding Data .................................................................................................................................................................................. 144
Creating age groups .................................................................................................................................................................... 144
Creating a dichotomous variable ................................................................................................................................................ 147
Combining Variables ........................................................................................................................................................................ 150
Student Practice 2 ............................................................................................................................................................................ 152
Saving your Work ............................................................................................................................................................................. 153
Saving the output as an HTML document ................................................................................................................................... 153
Saving the output as an Excel spreadsheet ................................................................................................................................. 153
Saving the Dashboard canvas ...................................................................................................................................................... 153
Saving (Exporting) the data ......................................................................................................................................................... 155
Scenario Conclusion .............................................................................................................................................................................. 158
Best Practices Using the Dashboard ................................................................................................................................................ 159
Make good use of space .............................................................................................................................................................. 159
When recoding a variable to two values, use the Yes/No field type ........................................................................................... 159
When saving the canvas, place it in the same folder as the data source .................................................................................... 159
When saving the canvas, place it in a subfolder underneath Epi Info 7/Projects ....................................................................... 159
Summary .......................................................................................................................................................................................... 160
Q&A ................................................................................................................................................................................................. 160
Quiz .................................................................................................................................................................................................. 162
Questions .................................................................................................................................................................................... 162
Answers ....................................................................................................................................................................................... 164
Representing Data with Maps .............................................................................................................................................................. 165
The Epi Map Workspace .................................................................................................................................................................. 166
Navigating Epi Map .......................................................................................................................................................................... 167
Open a map file ........................................................................................................................................................................... 167
Save file as a map ........................................................................................................................................................................ 167
Save file as a graphic ................................................................................................................................................................... 167
Add data layer ............................................................................................................................................................................. 167
Add reference layer ..................................................................................................................................................................... 167
Create time lapse ........................................................................................................................................................................ 167
Maps Types ........................................................................................................................................................................................... 168
Choropleth ....................................................................................................................................................................................... 168

vii
Case Cluster ..................................................................................................................................................................................... 168
Dot Density ...................................................................................................................................................................................... 168
Creating a Choropleth Map .............................................................................................................................................................. 169
Changing Map Properties ................................................................................................................................................................ 172
Viewing Map Information ................................................................................................................................................................ 172
Displaying values ......................................................................................................................................................................... 173
Saving a Map File ............................................................................................................................................................................. 173
Creating a Case Cluster Map ............................................................................................................................................................ 175
Adding More Layers: Hospitals ........................................................................................................................................................ 176
Add the hospital points to the map............................................................................................................................................. 176
Adding text to a map ................................................................................................................................................................... 177
Adding a Reference Shape Layer ...................................................................................................................................................... 178
Saving a Map as a Graphic File ......................................................................................................................................................... 179
Student Exercise............................................................................................................................................................................... 180
Student Practice – Step By Step Instructions ........................................................................................................................................ 184
Student Practice- Lesson 1 ............................................................................................................................................................... 184
Student Practice - Lesson 2 .............................................................................................................................................................. 187
Task 1: Using conditional Statements ......................................................................................................................................... 187
Task 2:Using Enable/Disable with group fields ........................................................................................................................... 188
Task 3: Using Enable/Disable and Clear with Fields .................................................................................................................... 189
Task 4: Using Enable/Disable and Clear with Fields .................................................................................................................... 190
Student Practice-Lesson 4 ................................................................................................................................................................ 192
Student Practice-Lesson 4 ................................................................................................................................................................ 194
Student Practice-Lesson 5 ................................................................................................................................................................ 196
8
Introduction
Introduction
Epi Info™ 7 is a series of programs for Microsoft Windows for use by public health professionals in
conducting outbreak investigations, emergency response action, managing databases for public
health surveillance, system applications, statistics and other tasks. With Epi Info™ 7, you can rapidly
develop a questionnaire or form, customize the data entry process, and enter and analyze data.
The Epi Info™ program is divided into five core modules: Form Designer, Enter, Classic Analysis,
Dashboard, and Maps. Each module has stand-alone capabilities; however, using them for one
project from start to finish adds functionality and efficiency. The Form Designer module is the
questionnaire or survey designer. You will start your project in the Form Designer by creating a
survey. Using Enter, you will populate your database with information specific to your survey. The
data entered, along with additional datasets, will be imported into the Dashboard for detailed study.
This training does not cover every component of Epi Info™ 7 and is meant for the beginning and
intermediate level user.
How to Use this Tutorial You will be introduced to the basic concepts of Epi Info™ 7 throughout this tutorial. Each lesson
builds upon knowledge gained from the previous lesson. Follow the lessons in the order presented
and finish all the listed steps before progressing to the next lesson. Data specific to the course is
provided as part of the training package. At various points in the course, you will be asked to access
this data to complete the lessons. Read the Five Goals listed at the start of each lesson to review the
core functions you should understand by the end of each lesson.
Step one Read the Overview section for each lesson. Each Overview contains a Getting Started breakdown of
the module. The Overview also provides information on the commands, dialog boxes, or other
special features that are unique to each module. The Overview also provides you with screenshots of
the module and introduces you to the basic concepts discussed in each lesson.
Step two Complete the step-by-step instructions to learn the basics. Numbered instructions with screenshots
are provided to help you to learn the core functions of each module. Numbered lessons and
instructions can be followed and applied when using Epi Info™ 7 outside of the classroom.
Step three Complete the Practice Lessons and Skills Review Exercises when provided. Practice lessons build
upon skills learned during basic lessons. Practices and reviews are opportunities to try skills without
9
detailed instruction. Skills Reviews will consist of hands-on activities to further your understanding or
a series of questions meant to reinforce basic knowledge.
Epi Info™ Resources Training documentation, technical information, or other resources are available on the Epi Info™
website (www.cdc.gov/epiinfo).
For questions or problems, contact the Helpline at [email protected] or call (404) 498-6190.
To speak with colleagues around that world about Epi Info™, visit the Epi Info™ phConnect user
group (http://www.phconnect.org/group/epiinfo).
Tutorial Files You must have the latest version of Epi Info™ 7 installed on your computer to complete the lessons in
this tutorial. Check the Epi Info™ website for the latest version of the software
(http://www.cdc.gov/epiinfo/7/index.htm).
The files needed for this tutorial can be found in the Epi Info 7\Resources\Training
Projects\Salmonellosis folder of Epi Info 7. The files that you will need are:
1. Salmonellosis.MDB
2. Salmonellosis.PRJ
3. SalmonellaTrainingCaseData_2013-06-17T20-04-48.edp7
If Epi Info 7 is not already installed on your computer, follow the steps below to install Epi Info™ 7
after it has been downloaded:
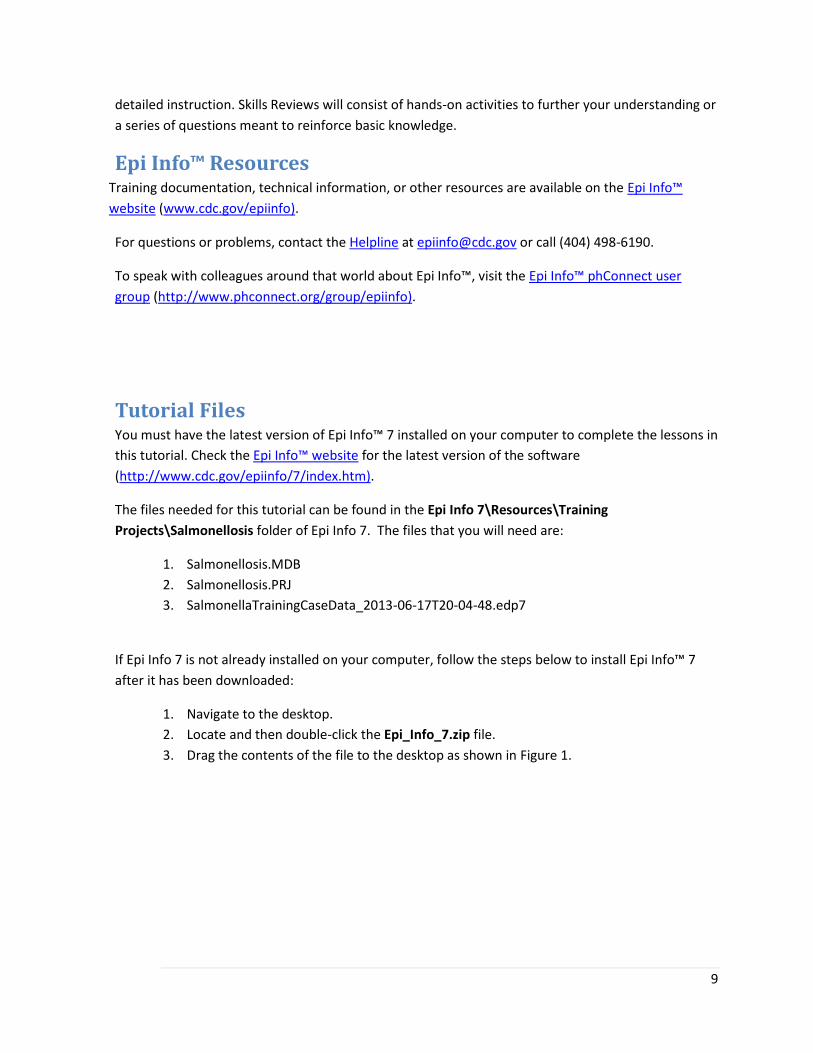
1. Navigate to the desktop.
2. Locate and then double-click the Epi_Info_7.zip file.
3. Drag the contents of the file to the desktop as shown in Figure 1.
10
Figure 1
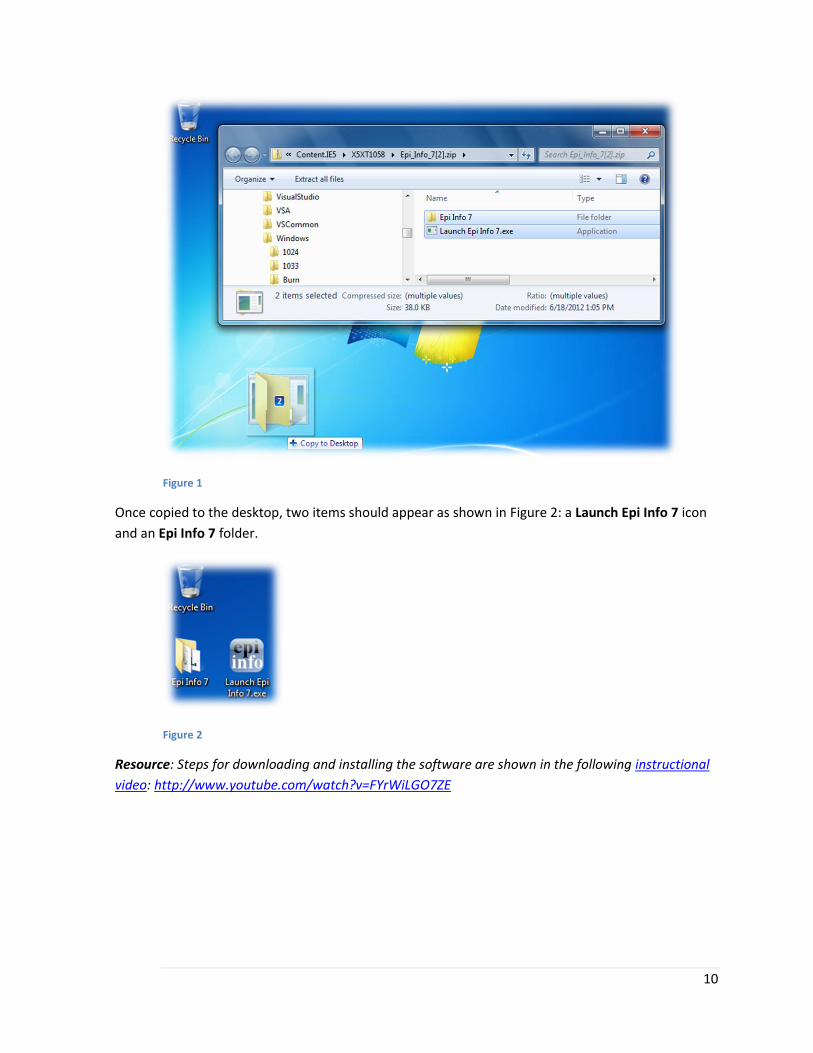
Once copied to the desktop, two items should appear as shown in Figure 2: a Launch Epi Info 7 icon
and an Epi Info 7 folder.
Figure 2
Resource: Steps for downloading and installing the software are shown in the following instructional
video: http://www.youtube.com/watch?v=FYrWiLGO7ZE

11
Introduction to Scenario This tutorial is designed to teach Epi Info™ 7 by following a scenario. A survey and data are
provided and were created specifically for training purposes. The survey and datasets presented here
relate to foodborne outbreak investigations, and specifically Salmonella; however, they can be used
to teach the Epi Info™ 7 software to any user and to illustrate how the program can be used to
gather, analyze, and present data.
Scenario A local manufacturing company in Morgan County, Georgia, hosted its annual company picnic on
May 5th, 2012. Friends and family members of employees were also invited. There were between 150
and 200 people who attended the event.
Catering services were provided by a local sandwich shop. The following sandwiches were listed as
menu items:
Peanut butter and jelly
Reuben
Egg salad sandwich
Ham and cheese
Grilled chicken
Grilled cheese
Salads were offered with each meal:
Caesar salad
Garden salad
Chef salad
Optional snacks or sides:
Potato chips
Freshly-baked chocolate chip cookies
Freshly-baked peanut butter cookies
Choice of drinks:
Water
Iced tea
Because the event had a large number of attendees, food was served at two different times (noon
and 2:00 pm) to give the shop ample opportunity to make all of the dishes.
Over the days following the picnic, the county health department became inundated with calls and
faxed lab reports of several culture-confirmed Salmonella Enteritidis cases. Most cases were
associated with the local company picnic held on May 5th. Because there was a sudden increase in

12
Salmonella cases over the weekend, an investigation into a potential outbreak was conducted. A
roster of attendees at the picnic was obtained and each person was contacted. A case was defined as
any attendee of the ACME company picnic presenting with diarrhea, abdominal cramps, and/or fever
within 72 hours of the picnic. A total of 90 cases met the case definition.

13
Lesson 1
Creating a Survey in Form Designer
This lesson introduces you to the Form Designer module of Epi Info™ 7. To determine the source of
the outbreak, you must first develop the survey that will act as your primary data collection
instrument. Lesson 1 guides you through the process of using Form Designer to create the survey. At
the end of this lesson, you will have experience using the Form Designer to make many of the fields
needed to collect data from the survey population.
Time to complete: 1.5 hours (Beginner)
BEFORE YOU BEGIN
Install the latest version of Epi Info™ 7 on your computer.
Complete the File Set-Up section of the tutorial.
FIVE GOALS
1. Create a project called SalmonellaExample.
2. Create three pages in a form to hold survey questions.
3. Create a set of demographics and symptom fields to describe the survey population.
4. Set the tab order to verify the data entry order the cursor needs to follow.
5. Create a project-level template that can be sent to investigators in the field.

14
Getting Started with Form Designer Epi Info™ 7 forms, and the data collected using those forms, are by default stored in Microsoft Access
2003 databases. A corresponding project file acts as a pointer to the database. Epi Info™ 7 can also
use Microsoft SQL Server databases if one happens to be available. Together, the database and the
project file comprise the Epi Info™ 7 project. Each project contains one or more forms, and each form
might contain one or more pages.
You are not limited in the number of fields you can place on a form, although you can only add up to
255 fields per page. You can have as many as 1,000 pages across all of the forms in a single Epi Info™
7 project.
You can use the Check Code Editor component of Form Designer to add data entry validation to your
form. One example, used in the tutorial, describes how to calculate the difference in years between
two dates. You will create Check Code stating that when a date of birth is entered in one field, the
age of an individual is automatically calculated and placed in another field. This allows you to
customize your questionnaire and makes data entry quicker and more accurate.
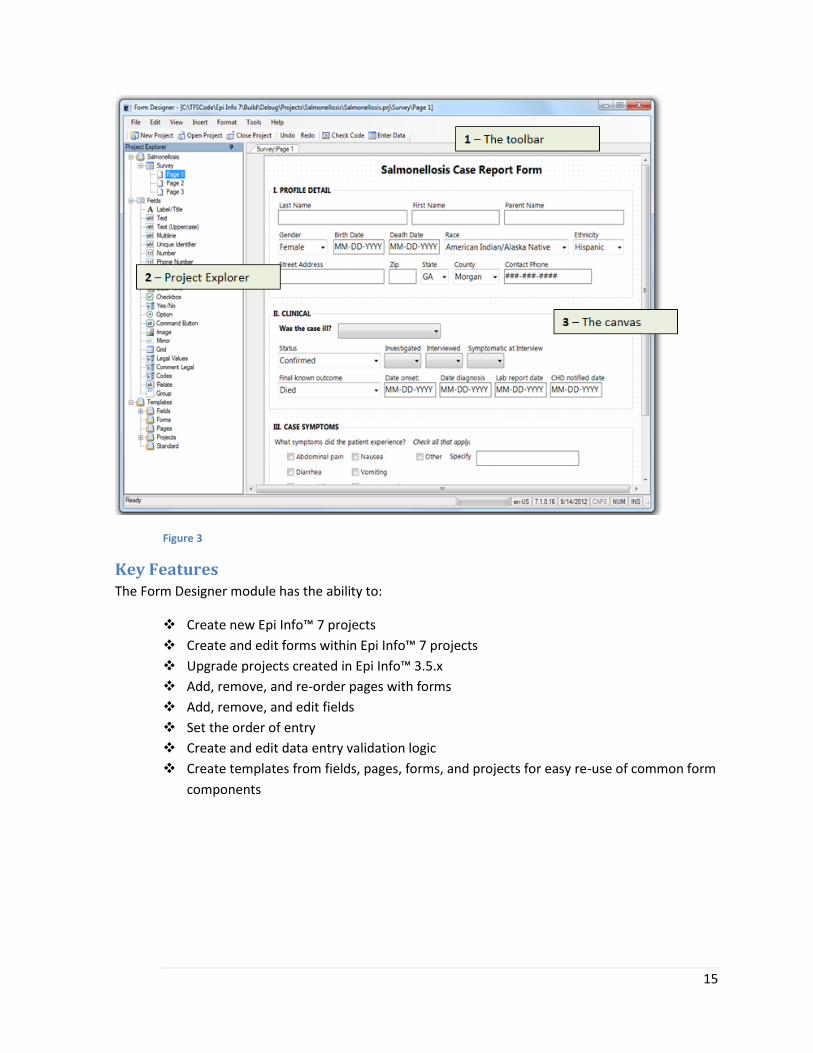
The Form Designer Workspace The Form Designer workspace consists of several main areas:
1. Toolbar. Contains buttons for common features and record navigation.
2. Project Explorer. Shows a list of available pages in the form.
3. Canvas. Holds most of the data entry functions.
15
Figure 3
Key Features The Form Designer module has the ability to:
Create new Epi Info™ 7 projects
Create and edit forms within Epi Info™ 7 projects
Upgrade projects created in Epi Info™ 3.5.x
Add, remove, and re-order pages with forms
Add, remove, and edit fields
Set the order of entry
Create and edit data entry validation logic
Create templates from fields, pages, forms, and projects for easy re-use of common form
components
16
Create a Project Now you will create the Salmonella survey. Creating the survey requires some forethought into the
types of analyses you might want to run on your data. For example, later you might want to calculate
the median age. To do this, you will need to have an age variable in your survey and the variable
must be numeric.
You need to create a new project and a new form. Once inside the project, you can add pages and
create fields to address all the survey questions. You will enter records into the survey in the next
lesson.
Be sure to place all your tutorial files in the Salmonella Training folder you created in File Set-Up.
Follow the steps below to create your project:
1. Navigate to the desktop.
2. Double-click the Launch Epi Info 7 icon to start the Epi Info™ 7 menu.
3. Click the Create Forms button to start the Form Designer module.
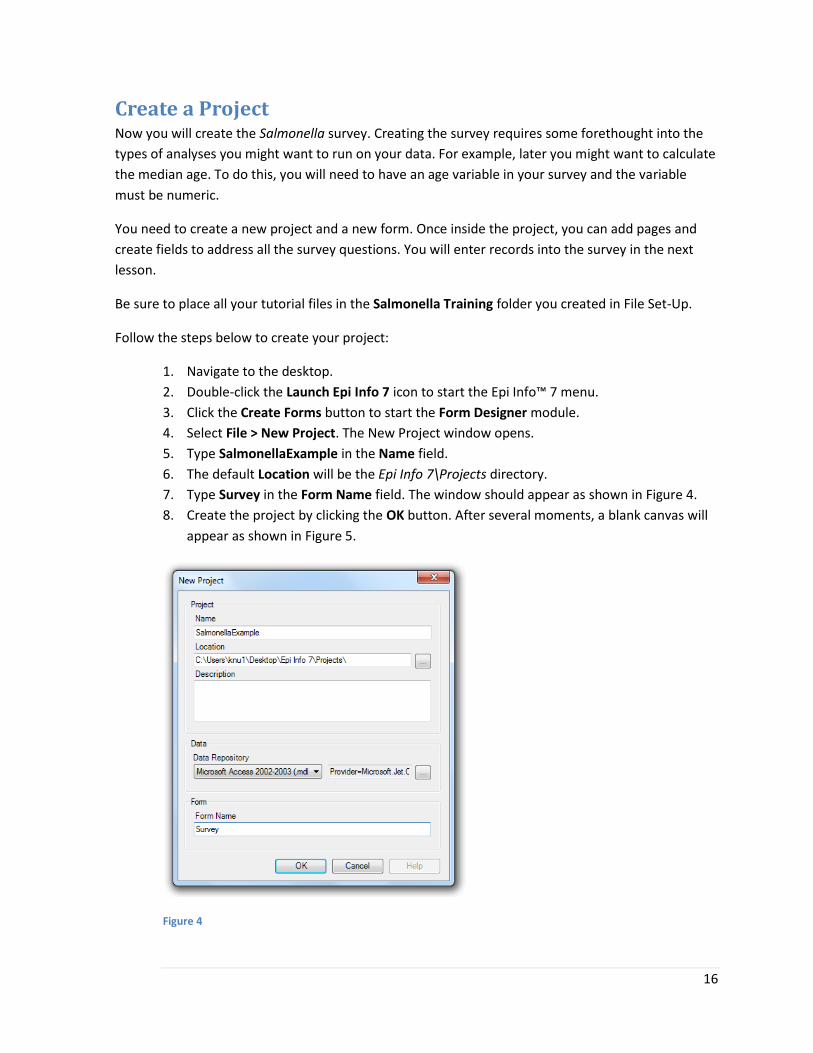
4. Select File > New Project. The New Project window opens.
5. Type SalmonellaExample in the Name field.
6. The default Location will be the Epi Info 7\Projects directory.
7. Type Survey in the Form Name field. The window should appear as shown in Figure 4.
8. Create the project by clicking the OK button. After several moments, a blank canvas will
appear as shown in Figure 5.
Figure 4
17
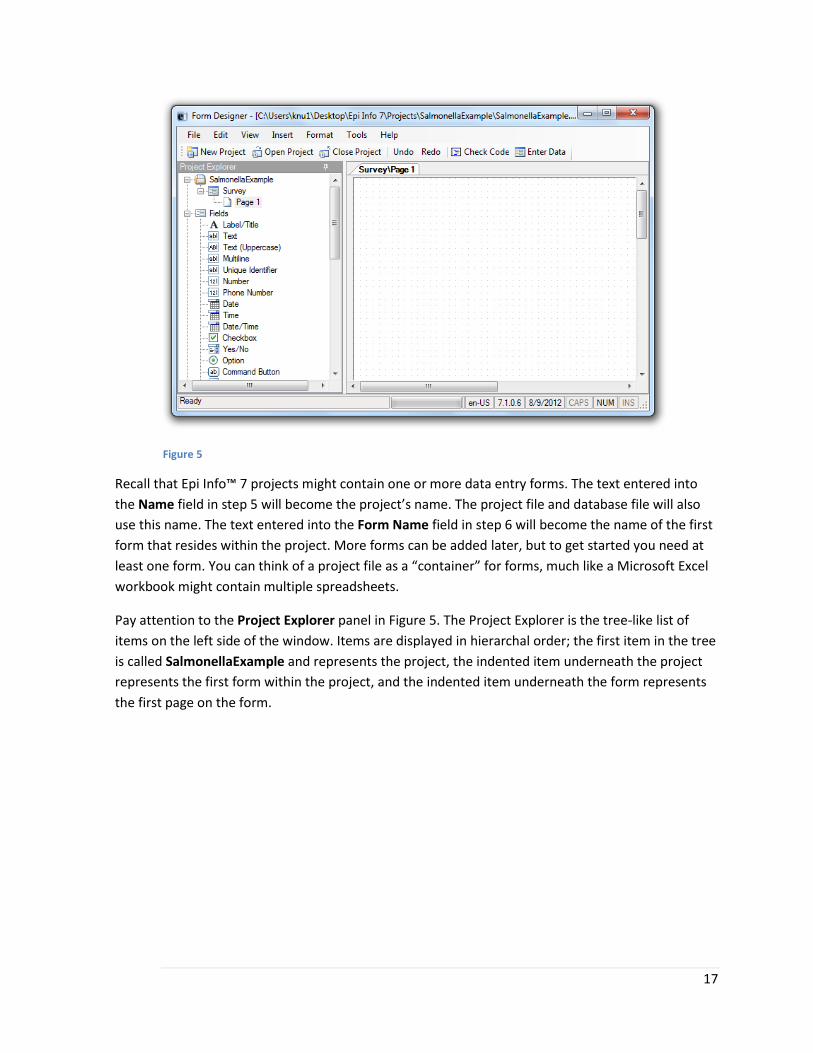
Figure 5
Recall that Epi Info™ 7 projects might contain one or more data entry forms. The text entered into
the Name field in step 5 will become the project’s name. The project file and database file will also
use this name. The text entered into the Form Name field in step 6 will become the name of the first
form that resides within the project. More forms can be added later, but to get started you need at
least one form. You can think of a project file as a “container” for forms, much like a Microsoft Excel
workbook might contain multiple spreadsheets.
Pay attention to the Project Explorer panel in Figure 5. The Project Explorer is the tree-like list of
items on the left side of the window. Items are displayed in hierarchal order; the first item in the tree
is called SalmonellaExample and represents the project, the indented item underneath the project
represents the first form within the project, and the indented item underneath the form represents
the first page on the form.
18
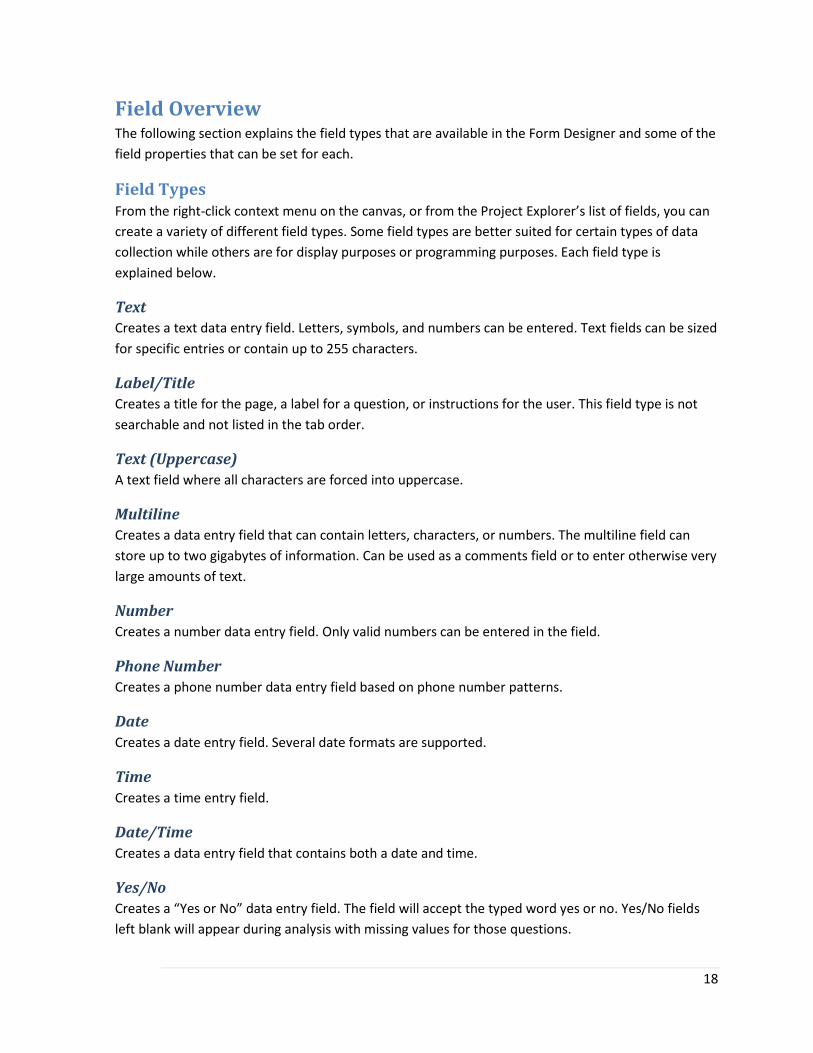
Field Overview The following section explains the field types that are available in the Form Designer and some of the
field properties that can be set for each.
Field Types From the right-click context menu on the canvas, or from the Project Explorer’s list of fields, you can
create a variety of different field types. Some field types are better suited for certain types of data
collection while others are for display purposes or programming purposes. Each field type is
explained below.
Text
Creates a text data entry field. Letters, symbols, and numbers can be entered. Text fields can be sized
for specific entries or contain up to 255 characters.
Label/Title
Creates a title for the page, a label for a question, or instructions for the user. This field type is not
searchable and not listed in the tab order.
Text (Uppercase)
A text field where all characters are forced into uppercase.
Multiline
Creates a data entry field that can contain letters, characters, or numbers. The multiline field can
store up to two gigabytes of information. Can be used as a comments field or to enter otherwise very
large amounts of text.
Number
Creates a number data entry field. Only valid numbers can be entered in the field.
Phone Number
Creates a phone number data entry field based on phone number patterns.
Date
Creates a date entry field. Several date formats are supported.
Time
Creates a time entry field.
Date/Time
Creates a data entry field that contains both a date and time.
Yes/No
Creates a “Yes or No” data entry field. The field will accept the typed word yes or no. Yes/No fields
left blank will appear during analysis with missing values for those questions.
19
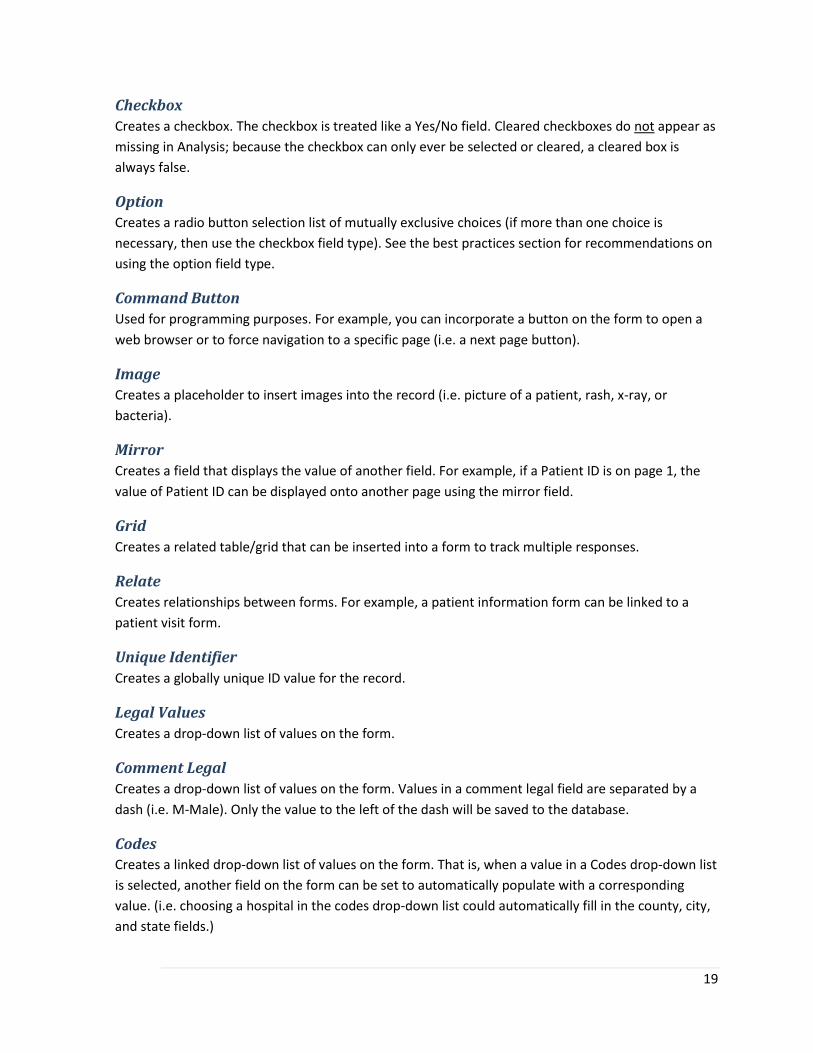
Checkbox
Creates a checkbox. The checkbox is treated like a Yes/No field. Cleared checkboxes do not appear as
missing in Analysis; because the checkbox can only ever be selected or cleared, a cleared box is
always false.
Option
Creates a radio button selection list of mutually exclusive choices (if more than one choice is
necessary, then use the checkbox field type). See the best practices section for recommendations on
using the option field type.
Command Button
Used for programming purposes. For example, you can incorporate a button on the form to open a
web browser or to force navigation to a specific page (i.e. a next page button).
Image
Creates a placeholder to insert images into the record (i.e. picture of a patient, rash, x-ray, or
bacteria).
Mirror
Creates a field that displays the value of another field. For example, if a Patient ID is on page 1, the
value of Patient ID can be displayed onto another page using the mirror field.
Grid
Creates a related table/grid that can be inserted into a form to track multiple responses.
Relate
Creates relationships between forms. For example, a patient information form can be linked to a
patient visit form.
Unique Identifier
Creates a globally unique ID value for the record.
Legal Values
Creates a drop-down list of values on the form.
Comment Legal
Creates a drop-down list of values on the form. Values in a comment legal field are separated by a
dash (i.e. M-Male). Only the value to the left of the dash will be saved to the database.
Codes
Creates a linked drop-down list of values on the form. That is, when a value in a Codes drop-down list
is selected, another field on the form can be set to automatically populate with a corresponding
value. (i.e. choosing a hospital in the codes drop-down list could automatically fill in the county, city,
and state fields.)
20
Field Properties Each field also has a set of properties that can be modified by the designer. The most common
properties are listed below:
Required: Prevents the record from being saved unless data are entered into the field.
Read Only: The field is disabled, preventing the user from modifying its contents.
Range: Allows setting an upper and lower boundary on number- and date-based input.
Repeat Last: When set, automatically populates new records with the same value from
the previous record. Used to speed up data entry when the same values are expected in
the field for every record.
Some properties only apply to certain field types. For example, the range property would have no
context for a checkbox field or a multiline field. The required and read only properties are also
mutually exclusive. When creating or editing a field, only the relevant properties will be enabled for
selection.
21
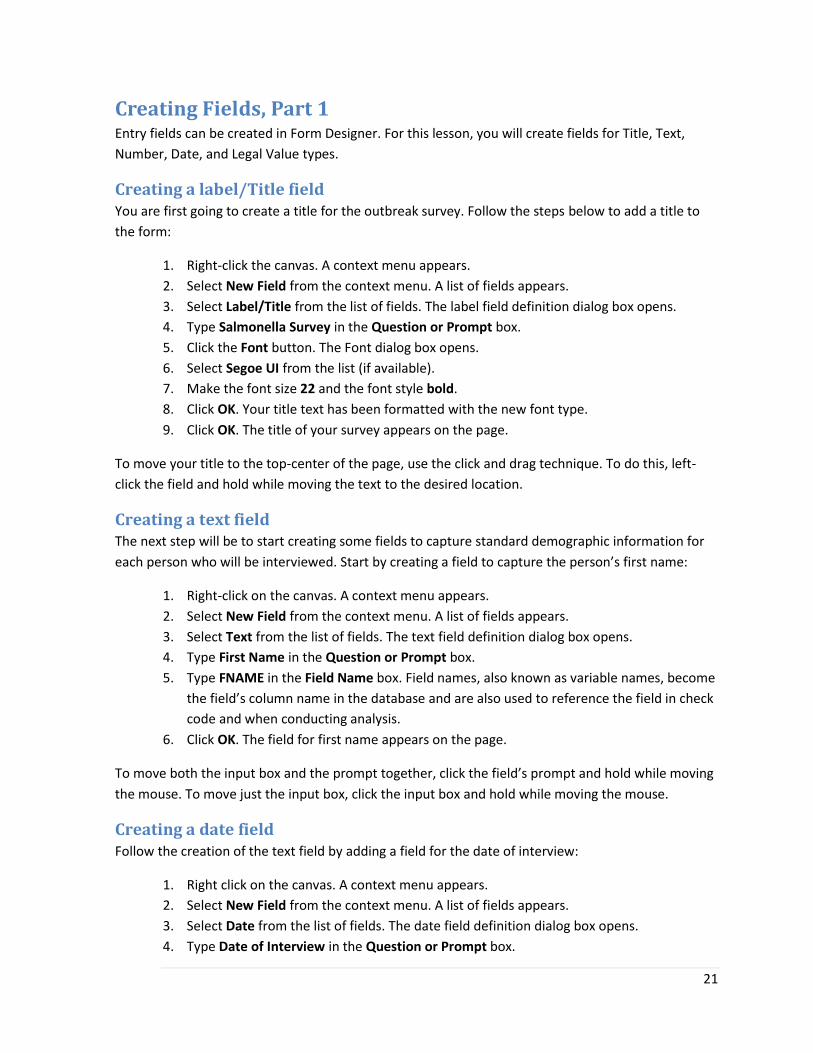
Creating Fields, Part 1 Entry fields can be created in Form Designer. For this lesson, you will create fields for Title, Text,
Number, Date, and Legal Value types.
Creating a label/Title field You are first going to create a title for the outbreak survey. Follow the steps below to add a title to
the form:
1. Right-click the canvas. A context menu appears.
2. Select New Field from the context menu. A list of fields appears.
3. Select Label/Title from the list of fields. The label field definition dialog box opens.
4. Type Salmonella Survey in the Question or Prompt box.
5. Click the Font button. The Font dialog box opens.
6. Select Segoe UI from the list (if available).
7. Make the font size 22 and the font style bold.
8. Click OK. Your title text has been formatted with the new font type.
9. Click OK. The title of your survey appears on the page.
To move your title to the top-center of the page, use the click and drag technique. To do this, left-
click the field and hold while moving the text to the desired location.
Creating a text field The next step will be to start creating some fields to capture standard demographic information for
each person who will be interviewed. Start by creating a field to capture the person’s first name:
1. Right-click on the canvas. A context menu appears.
2. Select New Field from the context menu. A list of fields appears.
3. Select Text from the list of fields. The text field definition dialog box opens.
4. Type First Name in the Question or Prompt box.
5. Type FNAME in the Field Name box. Field names, also known as variable names, become
the field’s column name in the database and are also used to reference the field in check
code and when conducting analysis.
6. Click OK. The field for first name appears on the page.
To move both the input box and the prompt together, click the field’s prompt and hold while moving
the mouse. To move just the input box, click the input box and hold while moving the mouse.
Creating a date field Follow the creation of the text field by adding a field for the date of interview:
1. Right click on the canvas. A context menu appears.
2. Select New Field from the context menu. A list of fields appears.
3. Select Date from the list of fields. The date field definition dialog box opens.
4. Type Date of Interview in the Question or Prompt box.
22
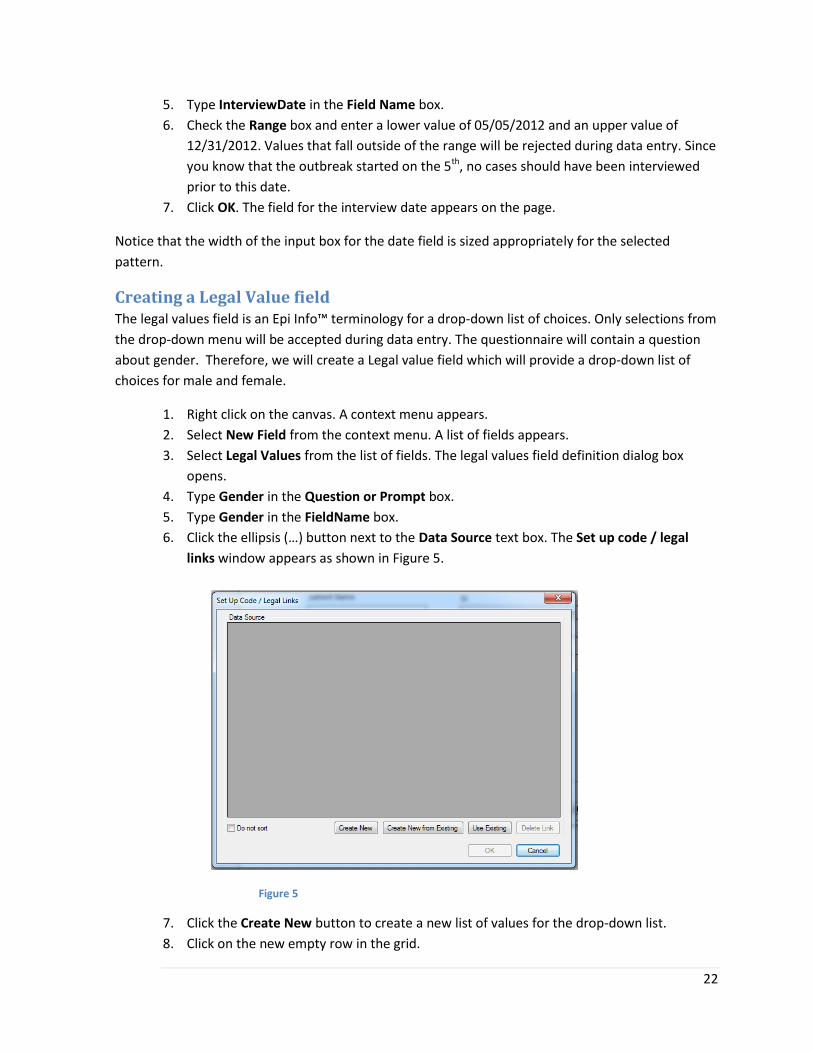
5. Type InterviewDate in the Field Name box.
6. Check the Range box and enter a lower value of 05/05/2012 and an upper value of
12/31/2012. Values that fall outside of the range will be rejected during data entry. Since
you know that the outbreak started on the 5th, no cases should have been interviewed
prior to this date.
7. Click OK. The field for the interview date appears on the page.
Notice that the width of the input box for the date field is sized appropriately for the selected
pattern.
Creating a Legal Value field The legal values field is an Epi Info™ terminology for a drop-down list of choices. Only selections from
the drop-down menu will be accepted during data entry. The questionnaire will contain a question
about gender. Therefore, we will create a Legal value field which will provide a drop-down list of
choices for male and female.
1. Right click on the canvas. A context menu appears.
2. Select New Field from the context menu. A list of fields appears.
3. Select Legal Values from the list of fields. The legal values field definition dialog box
opens.
4. Type Gender in the Question or Prompt box.
5. Type Gender in the FieldName box.
6. Click the ellipsis (…) button next to the Data Source text box. The Set up code / legal
links window appears as shown in Figure 5.
Figure 5
7. Click the Create New button to create a new list of values for the drop-down list.
8. Click on the new empty row in the grid.

23
9. Type Male into the grid view and hit the Enter key.
10. Type Female into the grid view and hit the Enter key.
11. Select the box marked Do not sort.
Note: When selected, Do not sort will arrange the items in the drop-down list exactly as they appear
when you type them. When cleared, the items will be arranged alphabetically.
12. Click OK to accept the values. The Legal Value field definition dialog reappears.
13. Click OK. The field for Gender appears on the page.
Creating a number field The number field will only accept valid numbers. Like the date field, a pattern and a range can be
selected. Continue the form by adding a number field for the interviewee’s age.
1. Right click the canvas. A context menu appears.
2. Select New Field from the context menu. A list of fields appears.
3. Select Number from the list of fields. The number field definition dialog box opens.
4. Type Age in the Question or Prompt box.
5. Type Age in the Field Name box.
6. Select ### from the pattern drop down list. Each # symbol represents a digit.
7. Check the Range box and enter a lower value of 0 and an upper value of 110.
Note: Even with a pattern restricting the age field to 3 digits, invalid values such as 34 or 242 would
still be allowed. The range property in this case adds an additional validation check.
Resource: This video will provide users with information on how to create a drop down list using a
Legal Values field in the Form Designer.
http://www.youtube.com/watch?v=tEDJOmzdQ_8&list=PL9B9157E47AB3FDFA&index=25
8. Click OK. The age field appears on the page.
As with the date field, the width of the number field is based on its pattern. Number fields do not
require a pattern to be specified; however. If no pattern is specified, the field is given a default size
upon its creation similar to a text field.
Your form should look similar to the one displayed in Figure 6 after creating the five fields.
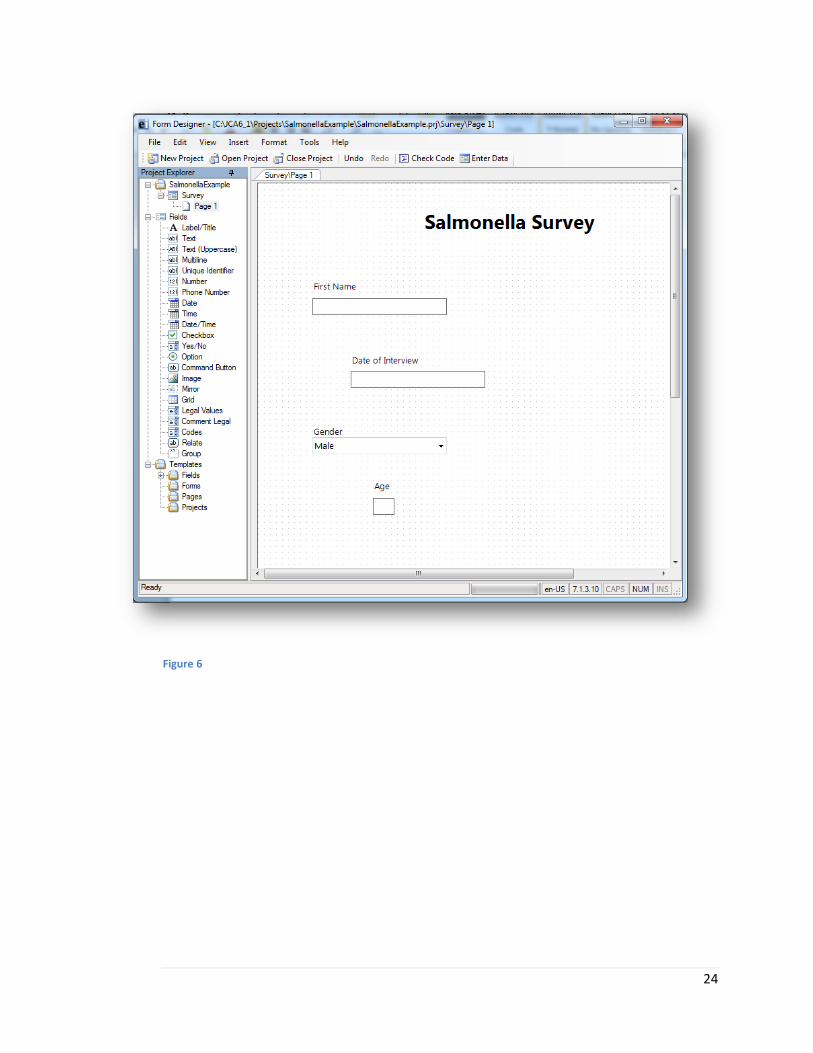
24
Figure 6
25
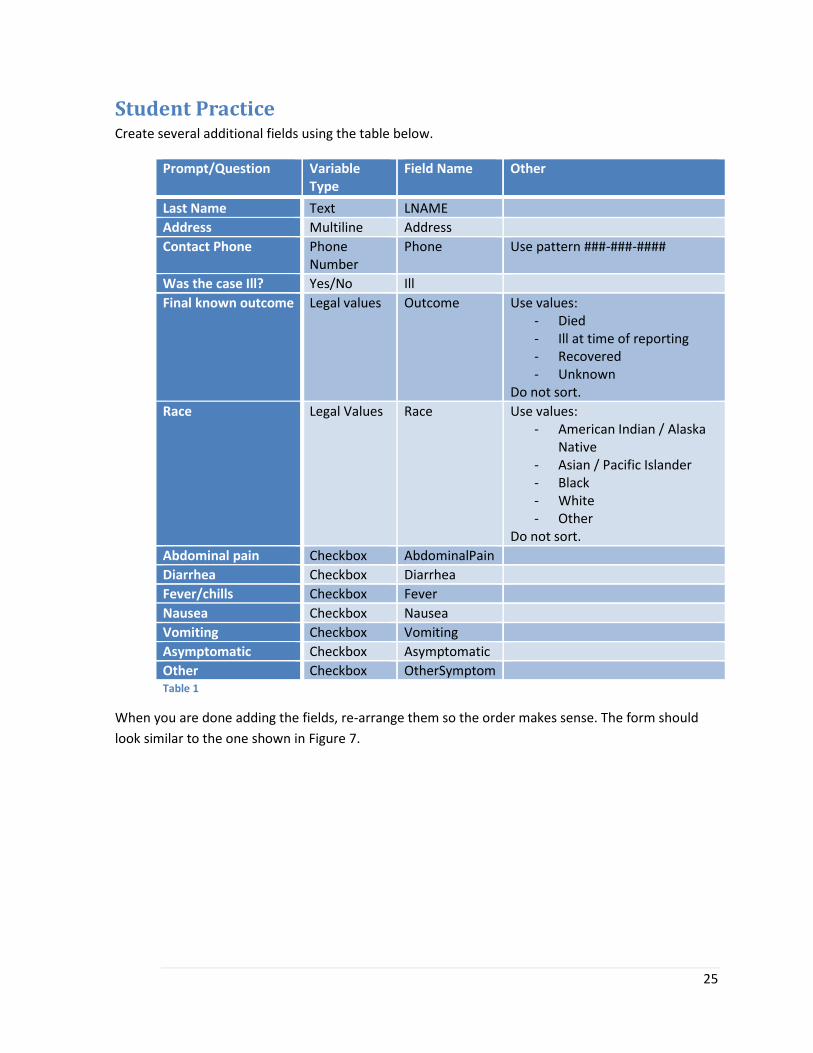
Student Practice Create several additional fields using the table below.
Prompt/Question Variable Type
Field Name Other
Last Name Text LNAME
Address Multiline Address
Contact Phone Phone Number
Phone Use pattern ###-###-####
Was the case Ill? Yes/No Ill
Final known outcome Legal values Outcome Use values: - Died - Ill at time of reporting - Recovered - Unknown
Do not sort.
Race Legal Values Race Use values: - American Indian / Alaska
Native - Asian / Pacific Islander - Black - White - Other
Do not sort.
Abdominal pain Checkbox AbdominalPain
Diarrhea Checkbox Diarrhea
Fever/chills Checkbox Fever
Nausea Checkbox Nausea
Vomiting Checkbox Vomiting
Asymptomatic Checkbox Asymptomatic
Other Checkbox OtherSymptom Table 1
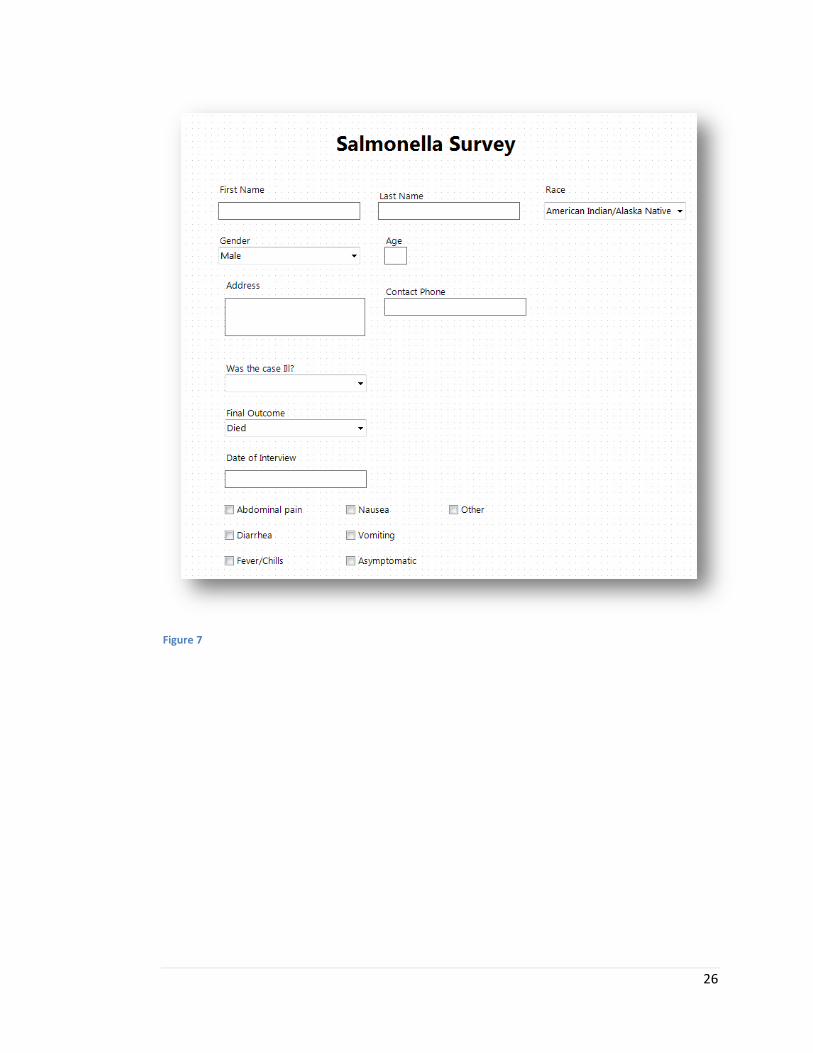
When you are done adding the fields, re-arrange them so the order makes sense. The form should
look similar to the one shown in Figure 7.
26
Figure 7
27
Creating Fields, Part 2 So far you have created a survey that captures basic demographic information, whether the person
was ill, the final known outcome, the date of the interview, and symptom information. In this part of
the tutorial, you will create a field group, an additional page, and some additional fields.
Creating a group field Fields can be grouped together in the Form Designer using the Group Field feature. Groups are both
visual and logical; later on, during analysis, the group itself can be used to automatically run a
statistical routine across all similar fields within the group. For the purposes of this survey, create a
group around the seven symptom fields.
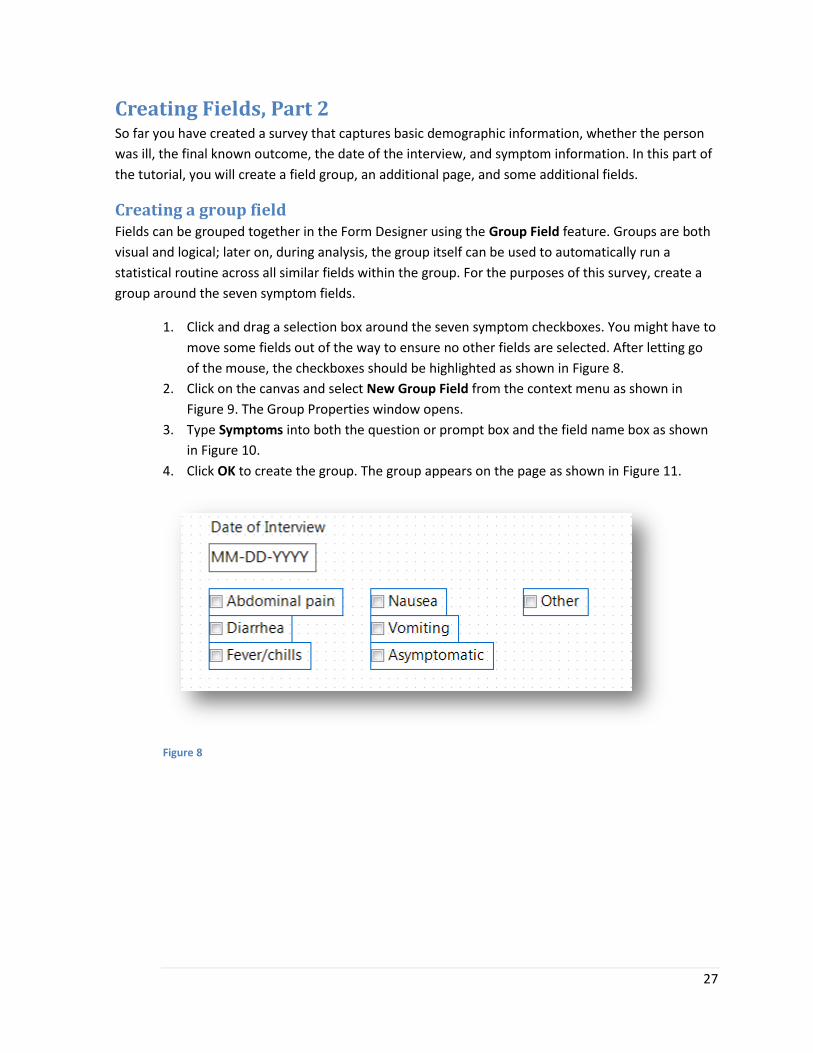
1. Click and drag a selection box around the seven symptom checkboxes. You might have to
move some fields out of the way to ensure no other fields are selected. After letting go
of the mouse, the checkboxes should be highlighted as shown in Figure 8.
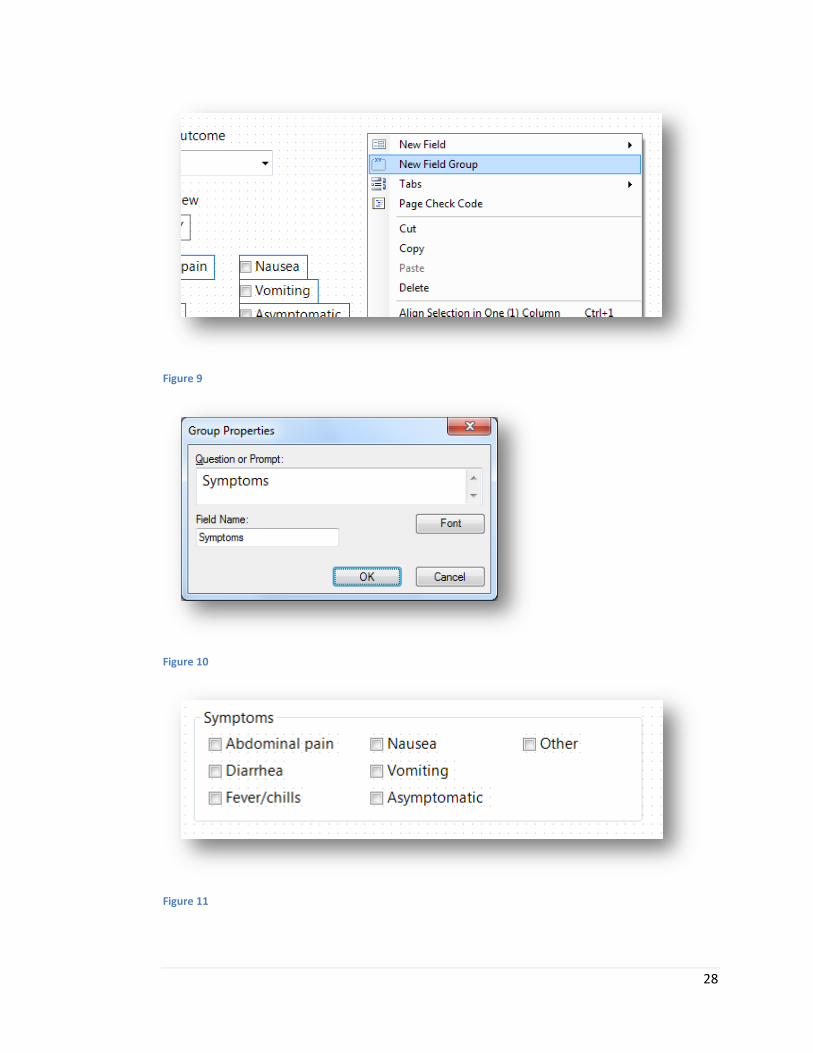
2. Click on the canvas and select New Group Field from the context menu as shown in
Figure 9. The Group Properties window opens.
3. Type Symptoms into both the question or prompt box and the field name box as shown
in Figure 10.
4. Click OK to create the group. The group appears on the page as shown in Figure 11.
Figure 8
28
Figure 9
Figure 10
Figure 11
29
Creating a second page You’re probably starting to run out of room on the form. You will need to add a second page to
collect additional information.
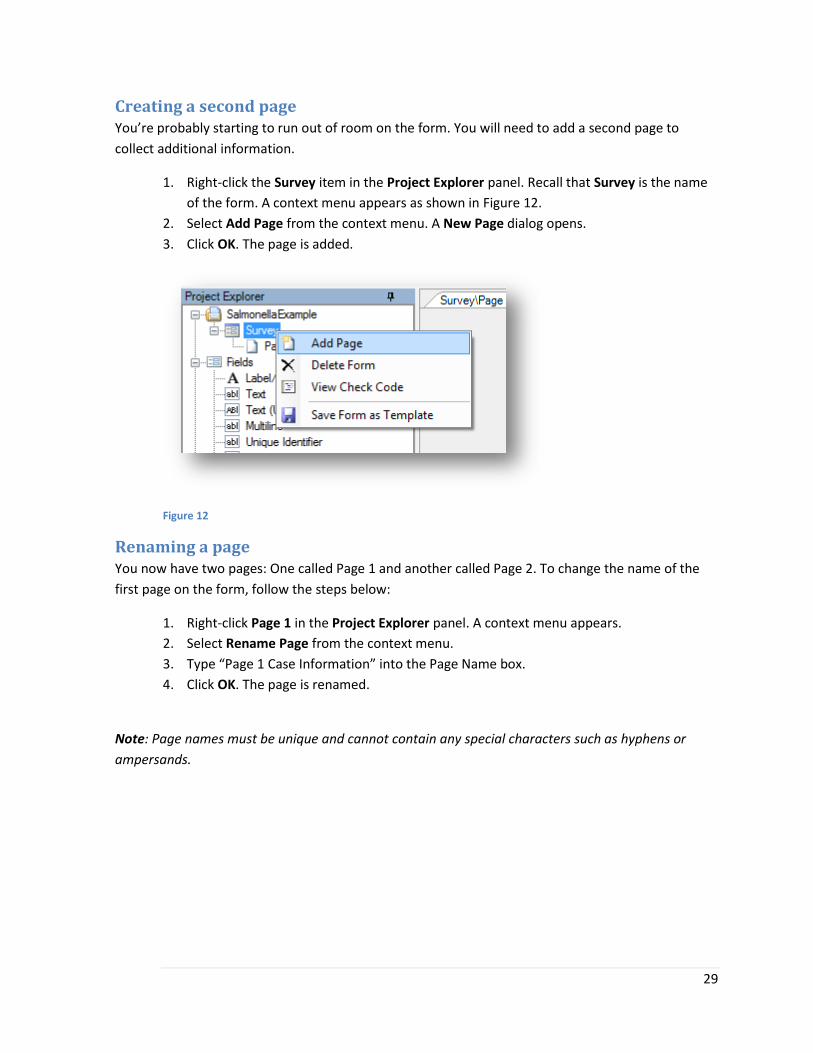
1. Right-click the Survey item in the Project Explorer panel. Recall that Survey is the name
of the form. A context menu appears as shown in Figure 12.
2. Select Add Page from the context menu. A New Page dialog opens.
3. Click OK. The page is added.
Figure 12
Renaming a page You now have two pages: One called Page 1 and another called Page 2. To change the name of the
first page on the form, follow the steps below:
1. Right-click Page 1 in the Project Explorer panel. A context menu appears.
2. Select Rename Page from the context menu.
3. Type “Page 1 Case Information” into the Page Name box.
4. Click OK. The page is renamed.
Note: Page names must be unique and cannot contain any special characters such as hyphens or
ampersands.

30
Creating a Comment Legal field Recall that the Legal Value field creates a drop-down list of values and stores the full text of the
user’s choice in the database. This behavior presents a problem when the choices are either very
long or when a code is required instead of text. For example, if the requirement for a field called
“Race” is to use “1” for Asian, “2” for Black, and “3” for White, using the legal values field might
confuse the person entering data because it is not easy to remember what each code represents.
Resource: This video will provide users with information on how to create drop down lists using a
Comment legal field in the Form Designer.
http://www.youtube.com/watch?v=4yyz1OrOjxc&index=24&list=PL9B9157E47AB3FDFA
The Comment Legal field addresses this problem by attaching a label to each of the choices. The
label is shown during data entry but is discarded when the record is saved; only the value is stored in
the database. A hyphen separates the value from the label. To create a comment legal field:
1. Navigate to Page 2.
2. Right-click the canvas. A context menu appears.
3. Select New Field from the context menu. A list of fields appears.
4. Select Comment Legal from the list of fields. The comment legal field definition dialog
box opens.
5. Type Case Status in the Question or Prompt box.
6. Type CaseStatus in the Field Name box.
7. Click the ellipsis (…) button next to the Data Source text box. The Set up code window
appears.
8. Click the Create New button to create a new list of values for the drop-down list.
9. Type C-Confirmed into the grid view and hit the Enter key.
10. Type P-Probable into the grid view and hit the Enter key.
11. Type S-Suspect into the grid view and hit the Enter key.
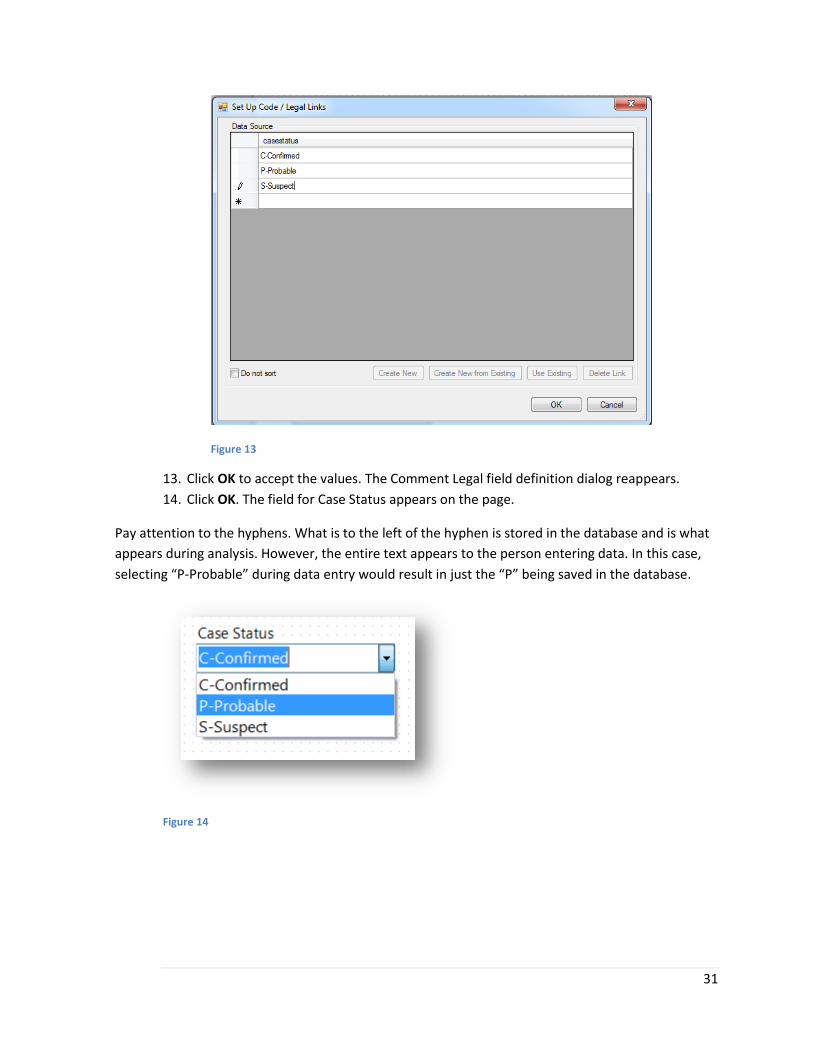
12. Select the box marked Do not sort. (See Figure 13 for an example of how the dialog
should appear after completing this step.)
31
Figure 13
13. Click OK to accept the values. The Comment Legal field definition dialog reappears.
14. Click OK. The field for Case Status appears on the page.
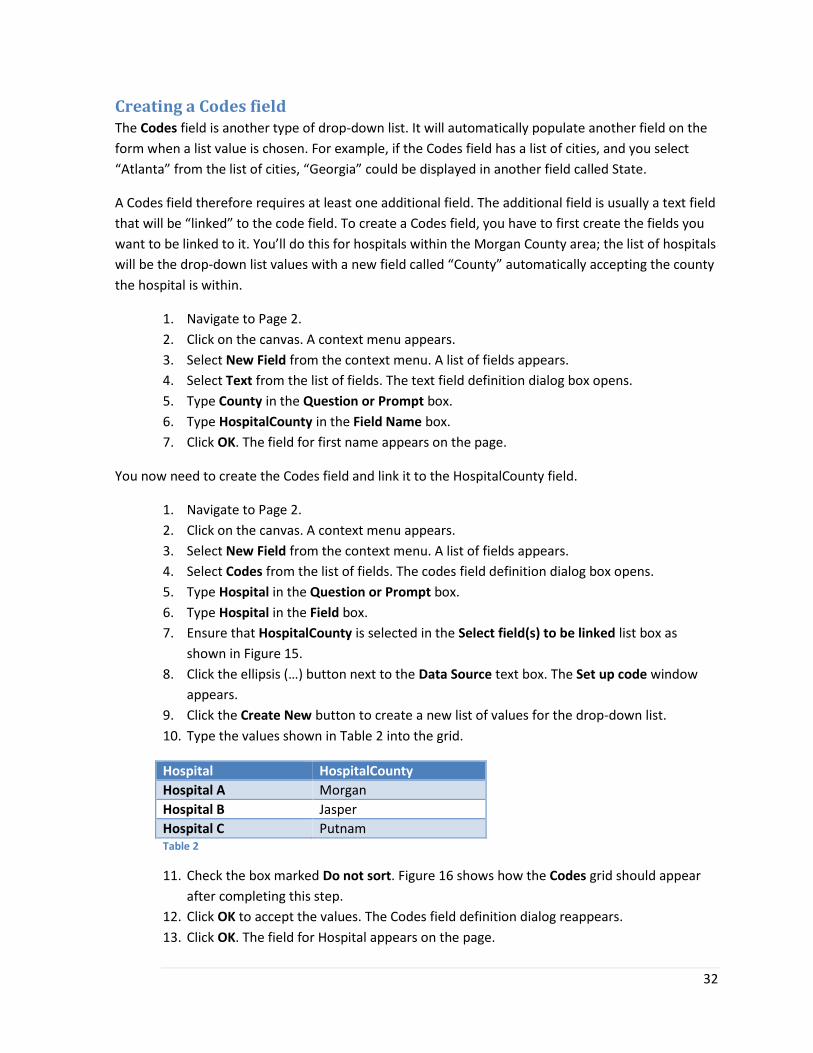
Pay attention to the hyphens. What is to the left of the hyphen is stored in the database and is what
appears during analysis. However, the entire text appears to the person entering data. In this case,
selecting “P-Probable” during data entry would result in just the “P” being saved in the database.
Figure 14
32
Creating a Codes field The Codes field is another type of drop-down list. It will automatically populate another field on the
form when a list value is chosen. For example, if the Codes field has a list of cities, and you select
“Atlanta” from the list of cities, “Georgia” could be displayed in another field called State.
A Codes field therefore requires at least one additional field. The additional field is usually a text field
that will be “linked” to the code field. To create a Codes field, you have to first create the fields you
want to be linked to it. You’ll do this for hospitals within the Morgan County area; the list of hospitals
will be the drop-down list values with a new field called “County” automatically accepting the county
the hospital is within.
1. Navigate to Page 2.
2. Click on the canvas. A context menu appears.
3. Select New Field from the context menu. A list of fields appears.
4. Select Text from the list of fields. The text field definition dialog box opens.
5. Type County in the Question or Prompt box.
6. Type HospitalCounty in the Field Name box.
7. Click OK. The field for first name appears on the page.
You now need to create the Codes field and link it to the HospitalCounty field.
1. Navigate to Page 2.
2. Click on the canvas. A context menu appears.
3. Select New Field from the context menu. A list of fields appears.
4. Select Codes from the list of fields. The codes field definition dialog box opens.
5. Type Hospital in the Question or Prompt box.
6. Type Hospital in the Field box.
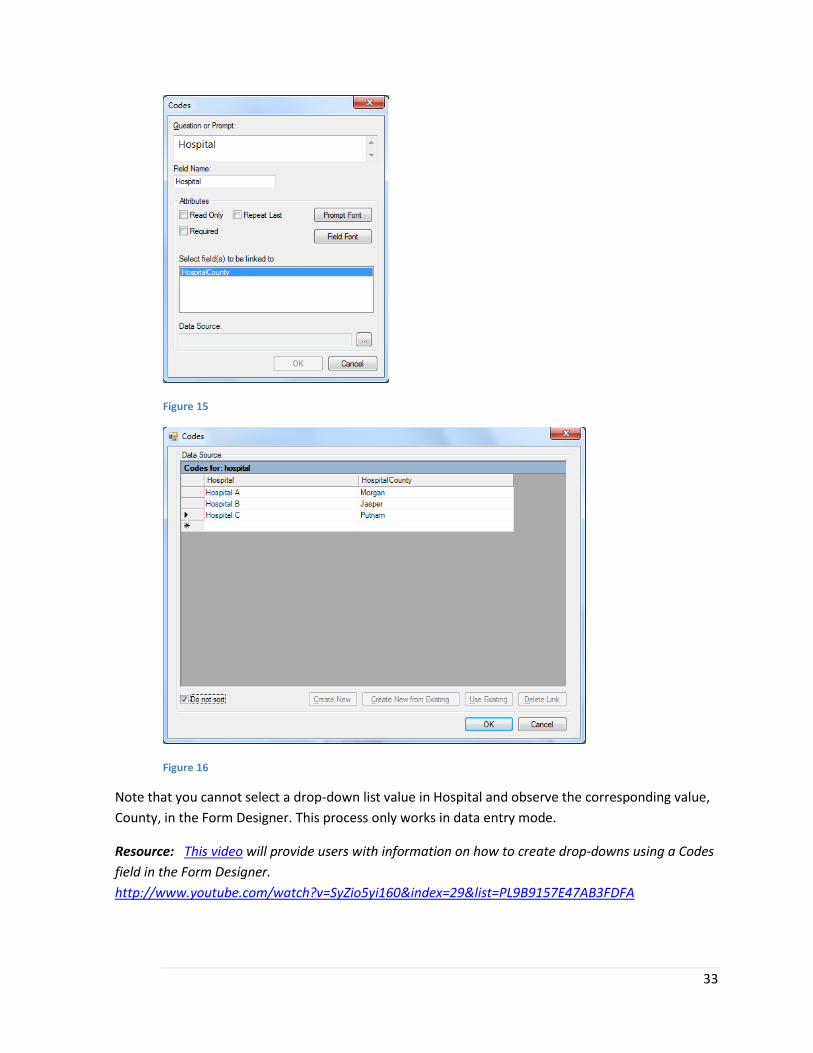
7. Ensure that HospitalCounty is selected in the Select field(s) to be linked list box as
shown in Figure 15.
8. Click the ellipsis (…) button next to the Data Source text box. The Set up code window
appears.
9. Click the Create New button to create a new list of values for the drop-down list.
10. Type the values shown in Table 2 into the grid.
Hospital HospitalCounty
Hospital A Morgan
Hospital B Jasper
Hospital C Putnam Table 2
11. Check the box marked Do not sort. Figure 16 shows how the Codes grid should appear
after completing this step.
12. Click OK to accept the values. The Codes field definition dialog reappears.
13. Click OK. The field for Hospital appears on the page.
33
Figure 15
Figure 16
Note that you cannot select a drop-down list value in Hospital and observe the corresponding value,
County, in the Form Designer. This process only works in data entry mode.
Resource: This video will provide users with information on how to create drop-downs using a Codes
field in the Form Designer.
http://www.youtube.com/watch?v=SyZio5yi160&index=29&list=PL9B9157E47AB3FDFA

34
Creating a Mirror Field A mirror field shows the value of one field on a different page. Since each case has two pages of
information, you want to place their last name on each page.
1. Navigate to Page 2.
2. Right-click the canvas. A context menu appears.
3. Select New Field from the context menu. A list of fields appears.
4. Select Mirror from the list of fields. The mirror field definition dialog box opens.
5. Type Last Name in the Question or Prompt box.
6. Select LNAME in the Assigned Variable drop-down list. The field chosen from this list will
be the field whose value will be displayed in the Mirror Field.
7. Click OK. The field for last name appears on the page.
The mirror field is “read-only” during data entry, meaning the user cannot modify its value. In the
example above, if the user wished to change the contents of the mirror field showing the person’s
last name, they would have to update the LastName field on Page 1.

35
Student Exercise While several fields were added to the questionnaire, it’s not complete. Take 10 to 15 minutes to
think about additional fields that should be included based on the scenario and then add them to the
form. Keep in mind the different types of fields that are available and ask yourself why you might use
one field type over another.
Do not concern yourself with the precise arrangement of the fields. Alignment options, setting the
tab order, and other formatting options are discussed in subsequent sections.
Note: You could also use the table reference provided in the Student Practice- Lesson 1 section of the
Appendix which includes all the fields that were incorporated into the final form.
36
Setting the Tab Order The tab order is the order in which the cursor moves from field to field as data are entered. Each
page on the form has its own tab order. To see the tab order for Page 1, follow the steps below:
1. Navigate to Page 1.
2. Right-click the canvas. A context menu appears.
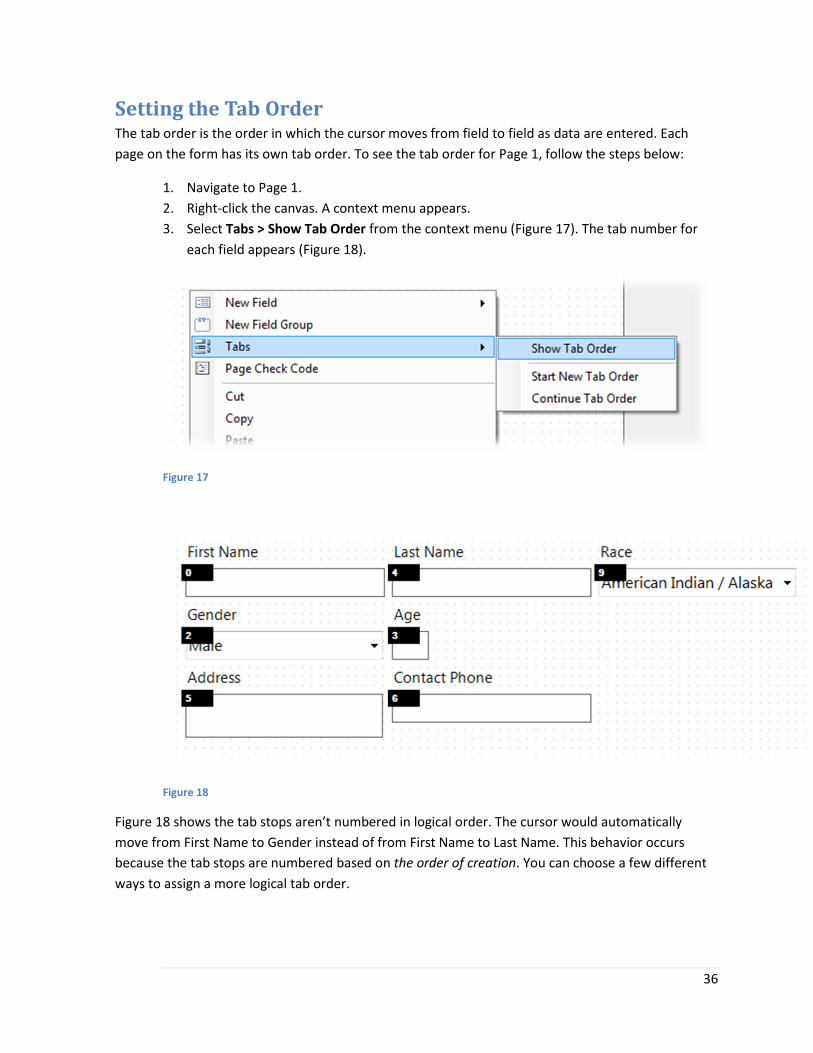
3. Select Tabs > Show Tab Order from the context menu (Figure 17). The tab number for
each field appears (Figure 18).
Figure 17
Figure 18
Figure 18 shows the tab stops aren’t numbered in logical order. The cursor would automatically
move from First Name to Gender instead of from First Name to Last Name. This behavior occurs
because the tab stops are numbered based on the order of creation. You can choose a few different
ways to assign a more logical tab order.
37
Automatically assigning tabs You can automatically re-assign all the tabs on a given page based on a left-to-right, top-to-bottom
sorting algorithm. Follow the steps below to do this:
1. Navigate to Page 1.
2. Right-click the canvas. A context menu appears.
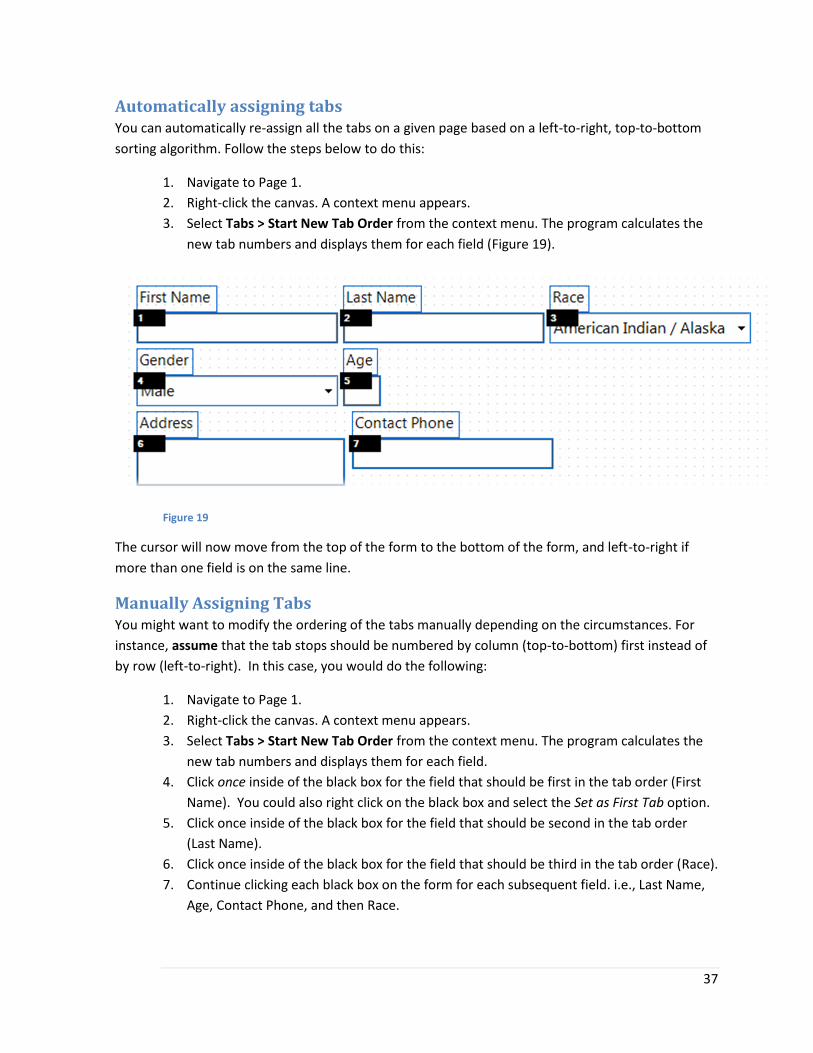
3. Select Tabs > Start New Tab Order from the context menu. The program calculates the
new tab numbers and displays them for each field (Figure 19).
Figure 19
The cursor will now move from the top of the form to the bottom of the form, and left-to-right if
more than one field is on the same line.
Manually Assigning Tabs You might want to modify the ordering of the tabs manually depending on the circumstances. For
instance, assume that the tab stops should be numbered by column (top-to-bottom) first instead of
by row (left-to-right). In this case, you would do the following:
1. Navigate to Page 1.
2. Right-click the canvas. A context menu appears.
3. Select Tabs > Start New Tab Order from the context menu. The program calculates the
new tab numbers and displays them for each field.
4. Click once inside of the black box for the field that should be first in the tab order (First
Name). You could also right click on the black box and select the Set as First Tab option.
5. Click once inside of the black box for the field that should be second in the tab order
(Last Name).
6. Click once inside of the black box for the field that should be third in the tab order (Race).
7. Continue clicking each black box on the form for each subsequent field. i.e., Last Name,
Age, Contact Phone, and then Race.
38
It is possible that two fields might temporarily have the same tab numbers when the tabs are
manually assigned. For example, after completing step 5, but before starting step 6, both Last Name
and Gender would have the number 2. Two fields are allowed to have the same tab number, but this
isn’t recommended as it will be impossible to determine where the cursor will go during data entry.
This ambiguity is one reason why you should always double-check the tab order on each page of your
form.
Partially assigning tabs The Continue Tab Order feature allows you a greater degree of freedom over automatic tab
ordering. Follow the steps below to see how you can use this feature to set the tab order by columns.
1. Navigate to Page 1.
2. Right-click the canvas. A context menu appears.
3. Select Tabs > Start New Tab Order from the context menu. The tabs are re-calculated
and arranged in left-to-right, top-to-bottom order as shown in Figure 19.
4. Drag a selection box around the three fields shown in Figure 20. The three fields are
selected as shown in Figure 21. (Ensure only the fields in the first column are selected.
Often, field selection can result in other fields being unintentionally included in the
selection depending on how close the fields are placed together).
5. With the three fields selected as shown in Figure 21, click on the canvas. A context menu
appears.
6. Select Tabs > Start New Tab Order from the context menu as shown in Figure 22. The
tabs are re-calculated only for the selected fields as shown Figure 23.
Figure 20
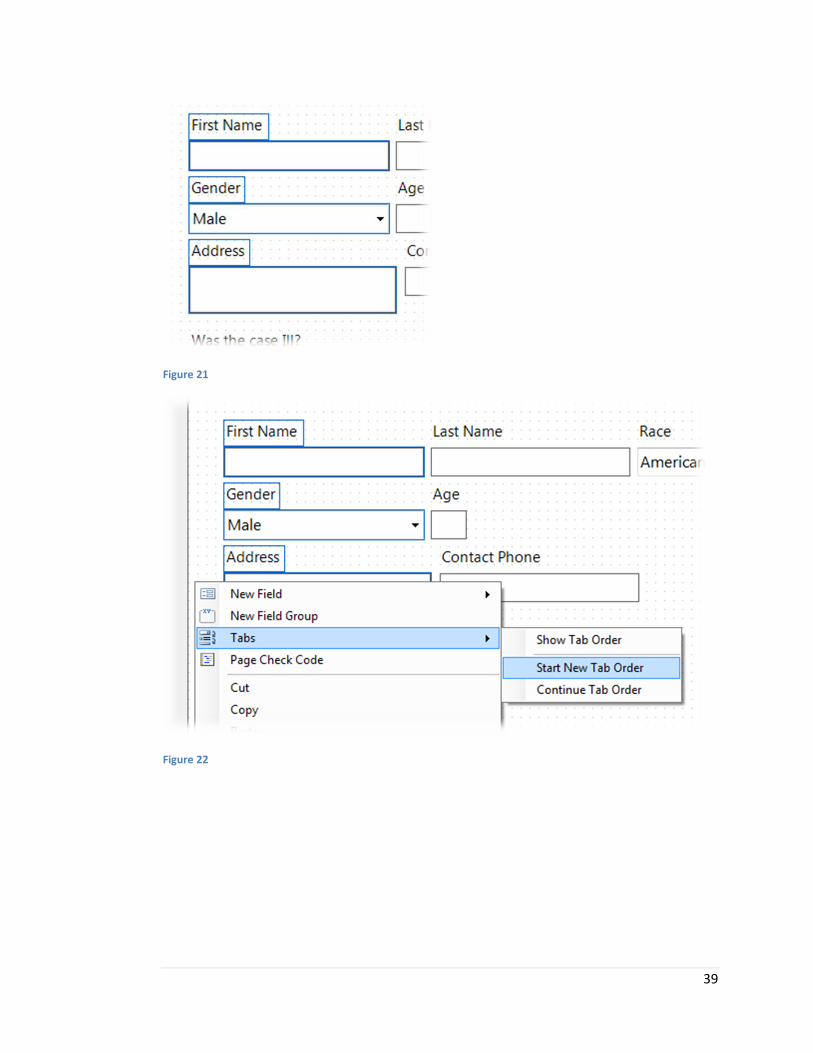
39
Figure 21
Figure 22
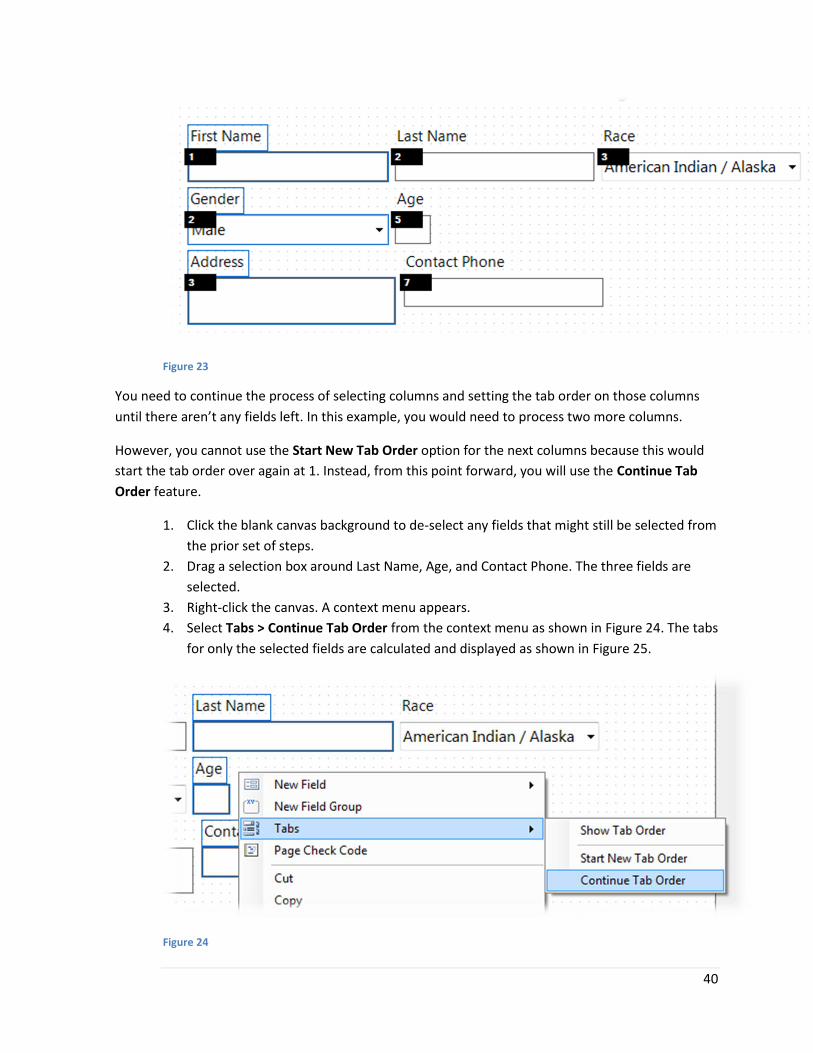
40
Figure 23
You need to continue the process of selecting columns and setting the tab order on those columns
until there aren’t any fields left. In this example, you would need to process two more columns.
However, you cannot use the Start New Tab Order option for the next columns because this would
start the tab order over again at 1. Instead, from this point forward, you will use the Continue Tab
Order feature.
1. Click the blank canvas background to de-select any fields that might still be selected from
the prior set of steps.
2. Drag a selection box around Last Name, Age, and Contact Phone. The three fields are
selected.
3. Right-click the canvas. A context menu appears.
4. Select Tabs > Continue Tab Order from the context menu as shown in Figure 24. The tabs
for only the selected fields are calculated and displayed as shown in Figure 25.
Figure 24
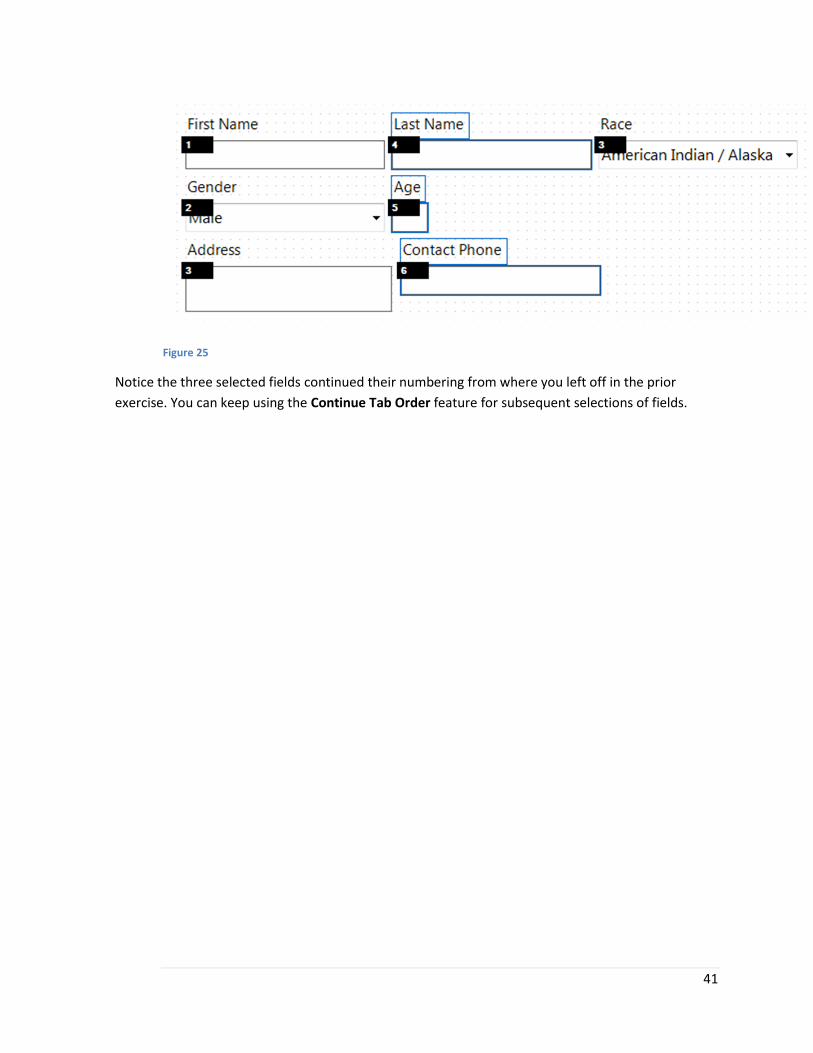
41
Figure 25
Notice the three selected fields continued their numbering from where you left off in the prior
exercise. You can keep using the Continue Tab Order feature for subsequent selections of fields.
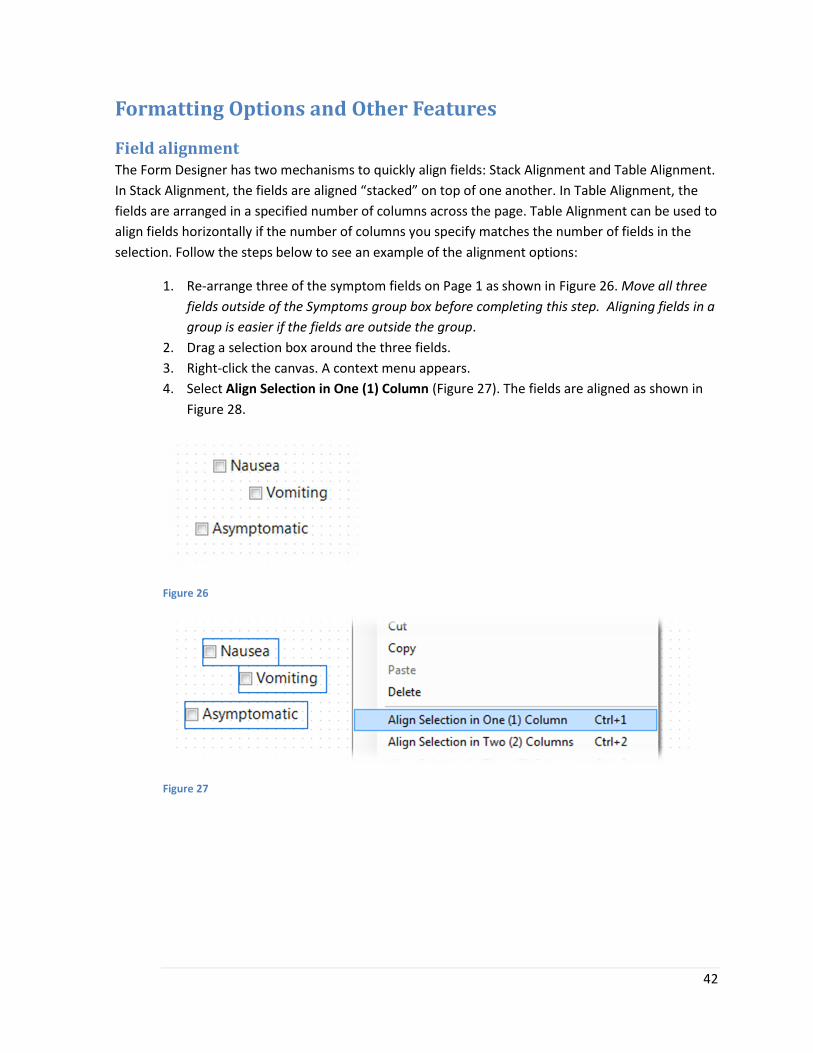
42
Formatting Options and Other Features
Field alignment The Form Designer has two mechanisms to quickly align fields: Stack Alignment and Table Alignment.
In Stack Alignment, the fields are aligned “stacked” on top of one another. In Table Alignment, the
fields are arranged in a specified number of columns across the page. Table Alignment can be used to
align fields horizontally if the number of columns you specify matches the number of fields in the
selection. Follow the steps below to see an example of the alignment options:
1. Re-arrange three of the symptom fields on Page 1 as shown in Figure 26. Move all three
fields outside of the Symptoms group box before completing this step. Aligning fields in a
group is easier if the fields are outside the group.
2. Drag a selection box around the three fields.
3. Right-click the canvas. A context menu appears.
4. Select Align Selection in One (1) Column (Figure 27). The fields are aligned as shown in
Figure 28.
Figure 26
Figure 27
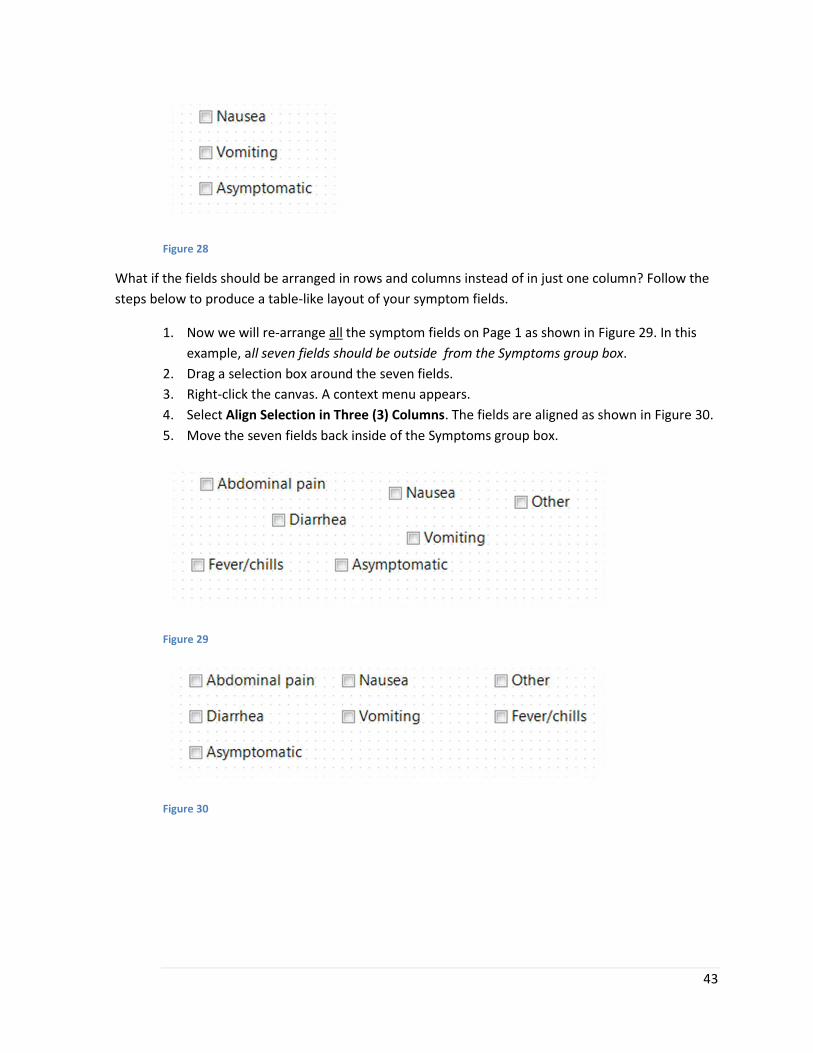
43
Figure 28
What if the fields should be arranged in rows and columns instead of in just one column? Follow the
steps below to produce a table-like layout of your symptom fields.
1. Now we will re-arrange all the symptom fields on Page 1 as shown in Figure 29. In this
example, all seven fields should be outside from the Symptoms group box.
2. Drag a selection box around the seven fields.
3. Right-click the canvas. A context menu appears.
4. Select Align Selection in Three (3) Columns. The fields are aligned as shown in Figure 30.
5. Move the seven fields back inside of the Symptoms group box.
Figure 29
Figure 30
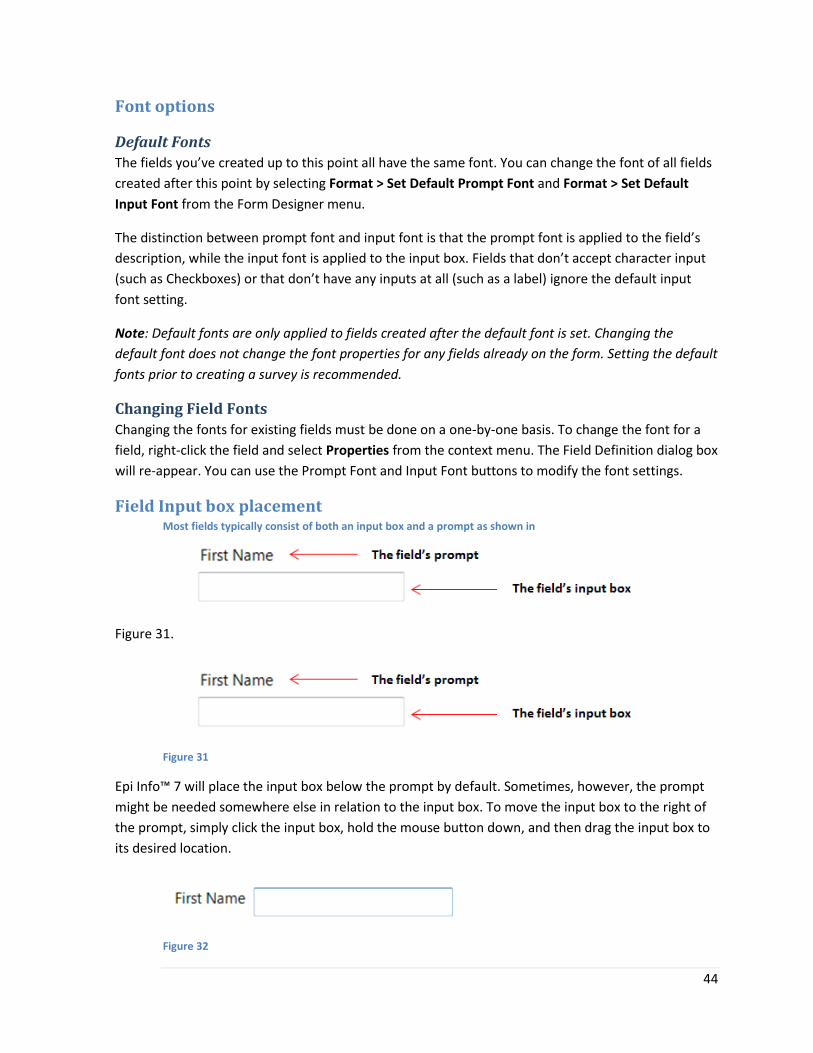
44
Font options
Default Fonts
The fields you’ve created up to this point all have the same font. You can change the font of all fields
created after this point by selecting Format > Set Default Prompt Font and Format > Set Default
Input Font from the Form Designer menu.
The distinction between prompt font and input font is that the prompt font is applied to the field’s
description, while the input font is applied to the input box. Fields that don’t accept character input
(such as Checkboxes) or that don’t have any inputs at all (such as a label) ignore the default input
font setting.
Note: Default fonts are only applied to fields created after the default font is set. Changing the
default font does not change the font properties for any fields already on the form. Setting the default
fonts prior to creating a survey is recommended.
Changing Field Fonts
Changing the fonts for existing fields must be done on a one-by-one basis. To change the font for a
field, right-click the field and select Properties from the context menu. The Field Definition dialog box
will re-appear. You can use the Prompt Font and Input Font buttons to modify the font settings.
Field Input box placement Most fields typically consist of both an input box and a prompt as shown in
Figure 31.
Figure 31
Epi Info™ 7 will place the input box below the prompt by default. Sometimes, however, the prompt
might be needed somewhere else in relation to the input box. To move the input box to the right of
the prompt, simply click the input box, hold the mouse button down, and then drag the input box to
its desired location.
Figure 32
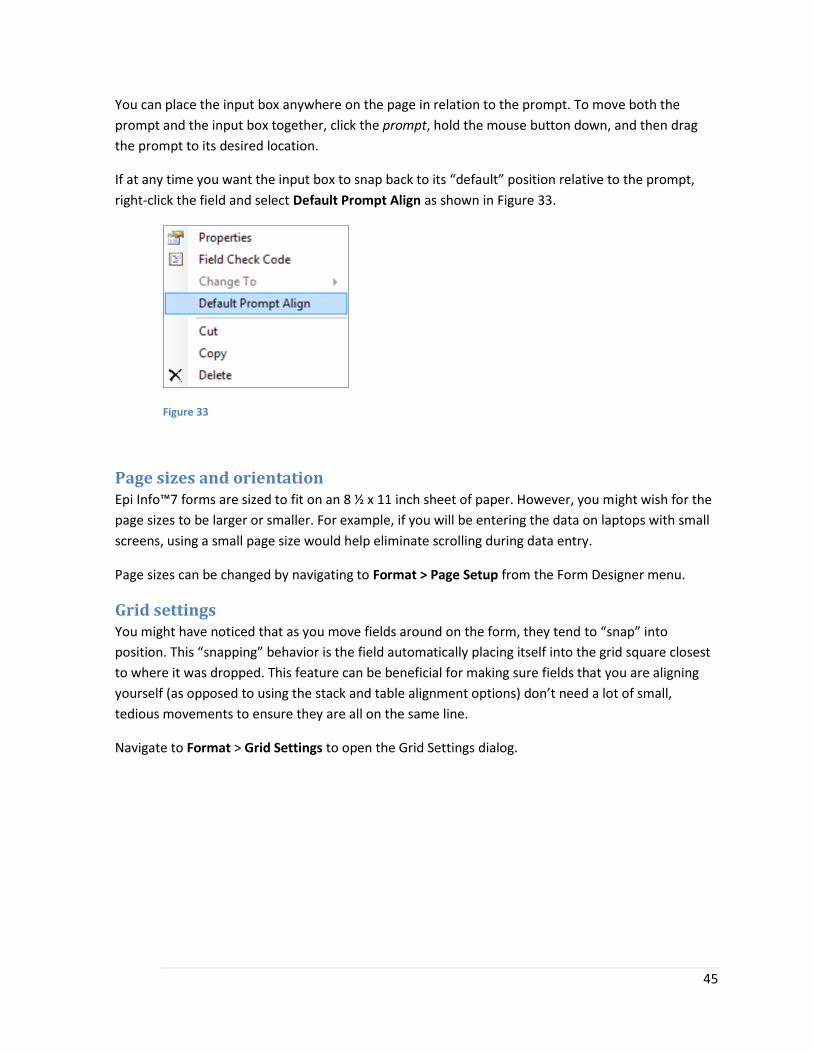
45
You can place the input box anywhere on the page in relation to the prompt. To move both the
prompt and the input box together, click the prompt, hold the mouse button down, and then drag
the prompt to its desired location.
If at any time you want the input box to snap back to its “default” position relative to the prompt,
right-click the field and select Default Prompt Align as shown in Figure 33.
Figure 33
Page sizes and orientation Epi Info™7 forms are sized to fit on an 8 ½ x 11 inch sheet of paper. However, you might wish for the
page sizes to be larger or smaller. For example, if you will be entering the data on laptops with small
screens, using a small page size would help eliminate scrolling during data entry.
Page sizes can be changed by navigating to Format > Page Setup from the Form Designer menu.
Grid settings You might have noticed that as you move fields around on the form, they tend to “snap” into
position. This “snapping” behavior is the field automatically placing itself into the grid square closest
to where it was dropped. This feature can be beneficial for making sure fields that you are aligning
yourself (as opposed to using the stack and table alignment options) don’t need a lot of small,
tedious movements to ensure they are all on the same line.
Navigate to Format > Grid Settings to open the Grid Settings dialog.
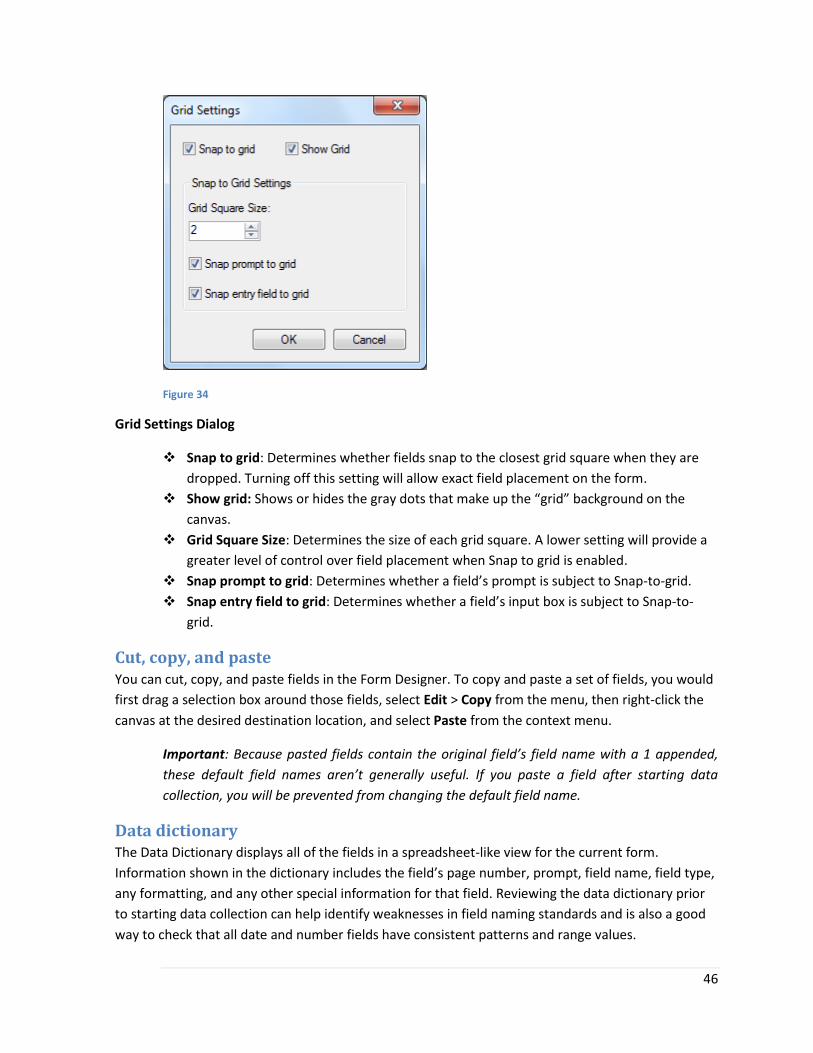
46
Figure 34
Grid Settings Dialog
Snap to grid: Determines whether fields snap to the closest grid square when they are
dropped. Turning off this setting will allow exact field placement on the form.
Show grid: Shows or hides the gray dots that make up the “grid” background on the
canvas.
Grid Square Size: Determines the size of each grid square. A lower setting will provide a
greater level of control over field placement when Snap to grid is enabled.
Snap prompt to grid: Determines whether a field’s prompt is subject to Snap-to-grid.
Snap entry field to grid: Determines whether a field’s input box is subject to Snap-to-
grid.
Cut, copy, and paste You can cut, copy, and paste fields in the Form Designer. To copy and paste a set of fields, you would
first drag a selection box around those fields, select Edit > Copy from the menu, then right-click the
canvas at the desired destination location, and select Paste from the context menu.
Important: Because pasted fields contain the original field’s field name with a 1 appended,
these default field names aren’t generally useful. If you paste a field after starting data
collection, you will be prevented from changing the default field name.
Data dictionary The Data Dictionary displays all of the fields in a spreadsheet-like view for the current form.
Information shown in the dictionary includes the field’s page number, prompt, field name, field type,
any formatting, and any other special information for that field. Reviewing the data dictionary prior
to starting data collection can help identify weaknesses in field naming standards and is also a good
way to check that all date and number fields have consistent patterns and range values.
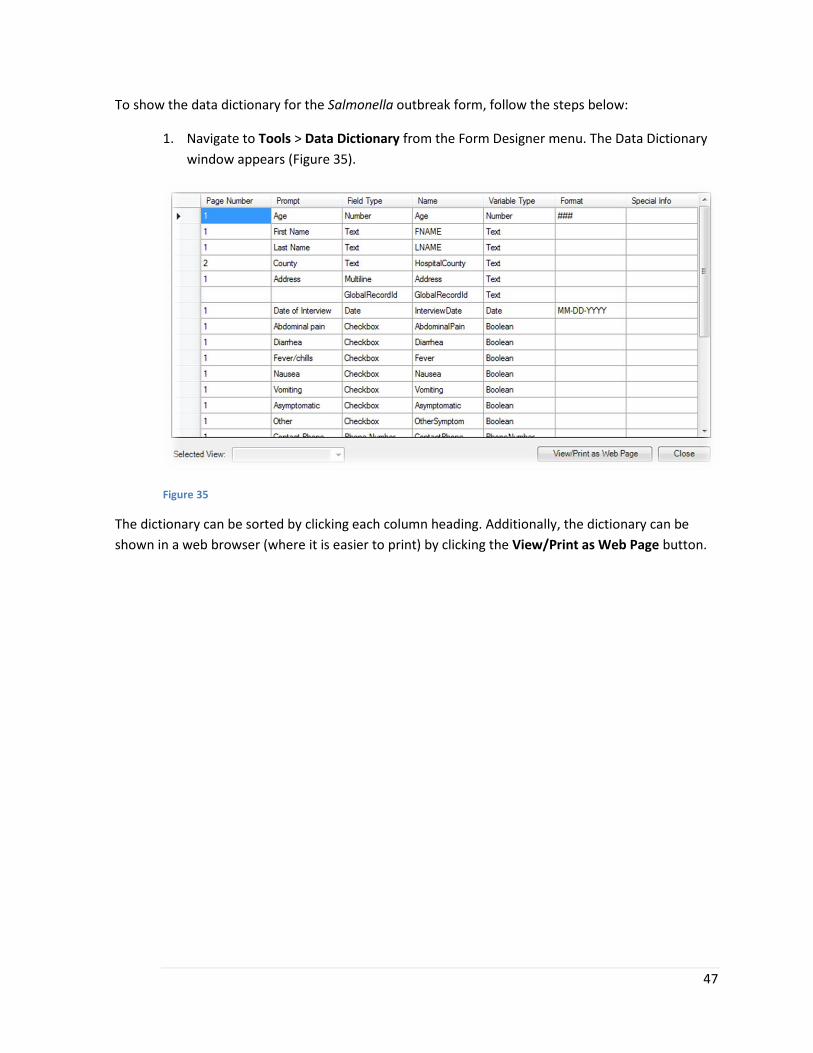
47
To show the data dictionary for the Salmonella outbreak form, follow the steps below:
1. Navigate to Tools > Data Dictionary from the Form Designer menu. The Data Dictionary
window appears (Figure 35).
Figure 35
The dictionary can be sorted by clicking each column heading. Additionally, the dictionary can be
shown in a web browser (where it is easier to print) by clicking the View/Print as Web Page button.
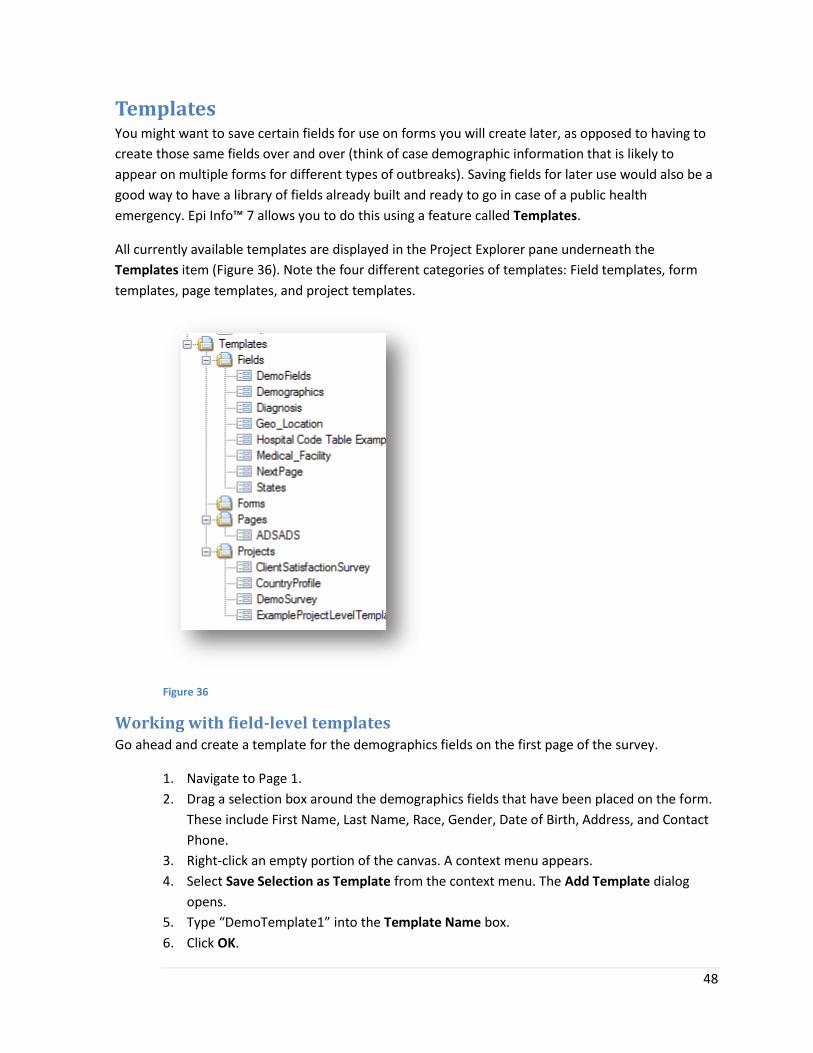
48
Templates You might want to save certain fields for use on forms you will create later, as opposed to having to
create those same fields over and over (think of case demographic information that is likely to
appear on multiple forms for different types of outbreaks). Saving fields for later use would also be a
good way to have a library of fields already built and ready to go in case of a public health
emergency. Epi Info™ 7 allows you to do this using a feature called Templates.
All currently available templates are displayed in the Project Explorer pane underneath the
Templates item (Figure 36). Note the four different categories of templates: Field templates, form
templates, page templates, and project templates.
Figure 36
Working with field-level templates Go ahead and create a template for the demographics fields on the first page of the survey.
1. Navigate to Page 1.
2. Drag a selection box around the demographics fields that have been placed on the form.
These include First Name, Last Name, Race, Gender, Date of Birth, Address, and Contact
Phone.
3. Right-click an empty portion of the canvas. A context menu appears.
4. Select Save Selection as Template from the context menu. The Add Template dialog
opens.
5. Type “DemoTemplate1” into the Template Name box.
6. Click OK.

49
After completing step 6, an item called “DemoTemplate1” should be present underneath the
Templates/Fields item in the Project Explorer (Figure 37).
Figure 37
Now that the template has been saved, it can be added to any other forms or projects created on
that computer. Go ahead and add the template to a new page on the form:
1. Add a new page to the form. (Refer back to the earlier section about adding pages if
you’re unsure how to add a page.)
2. Find the DemoTemplate1 item underneath Templates and then Fields in the Project
Explorer. You might have to scroll down in the Project Explorer pane to find it.
3. Drag the DemoTemplate1 item from the Project Explorer to the top-left section of the
canvas and drop it. The set of demographic fields saved in the prior example are re-
created on the new page.
Note: Field templates, once added to a form, can be modified as if they were regular fields.
Working with project-level templates You’ve created the Salmonella outbreak form. You now need to distribute it to your investigators
who will be interviewing the picnic attendees. How would you distribute the project to them?
You could transfer the Epi Info™ 7 project files from your computer to the other computers that will
be used. A thumb drive or e-mail might be sufficient for this. However, a direct transfer of the project
files might present you with several problems:
If the underlying database type for the project is Microsoft Access, then attaching the
database file to an e-mail might cause the e-mail to be blocked due to the file type. Also,
very large forms might exceed the file size limits on certain e-mail systems.
If the underlying database type for the project is Microsoft SQL Server, then the database
cannot be attached to an e-mail message or copied to a thumb drive at all.
If you have already started to collect data, then attaching the database to the e-mail will
send the recipient both the form and the data that you have already collected.
Both the .prj file and the .mdb database file must be sent. Many users aren’t aware that
both files are required. Any confusion that results from an incomplete transmission (i.e.,
only one of the two files was sent) could result in delays.
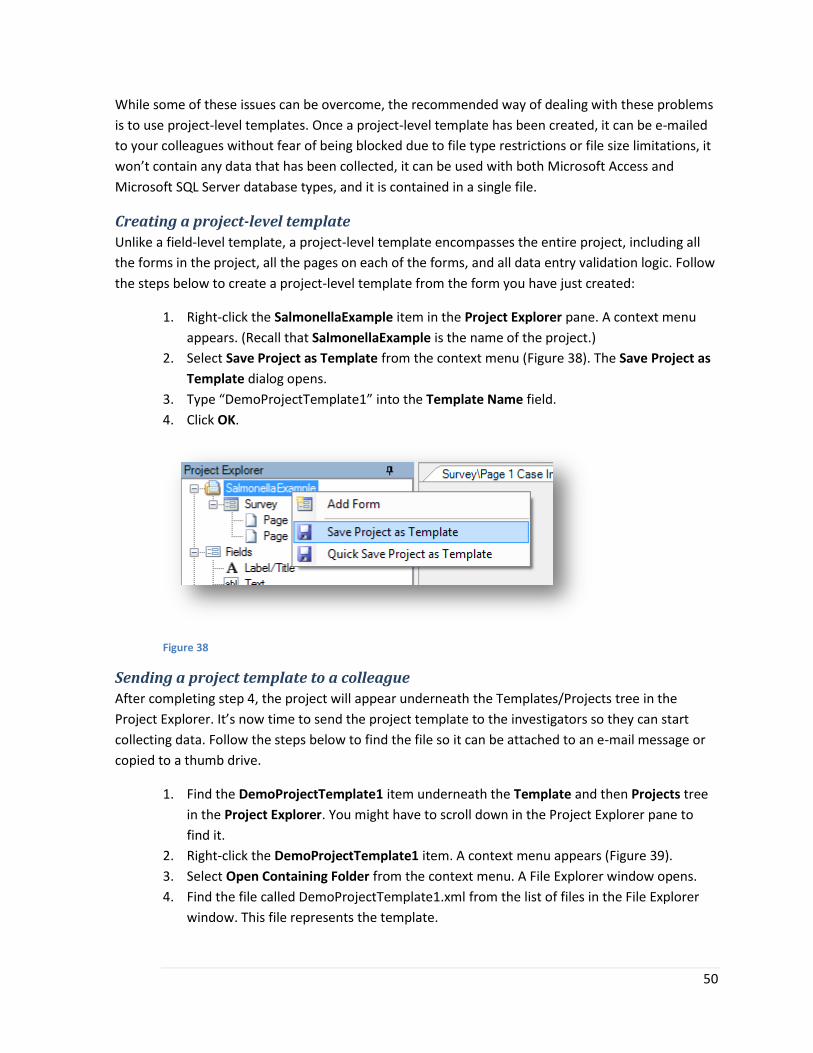
50
While some of these issues can be overcome, the recommended way of dealing with these problems
is to use project-level templates. Once a project-level template has been created, it can be e-mailed
to your colleagues without fear of being blocked due to file type restrictions or file size limitations, it
won’t contain any data that has been collected, it can be used with both Microsoft Access and
Microsoft SQL Server database types, and it is contained in a single file.
Creating a project-level template
Unlike a field-level template, a project-level template encompasses the entire project, including all
the forms in the project, all the pages on each of the forms, and all data entry validation logic. Follow
the steps below to create a project-level template from the form you have just created:
1. Right-click the SalmonellaExample item in the Project Explorer pane. A context menu
appears. (Recall that SalmonellaExample is the name of the project.)
2. Select Save Project as Template from the context menu (Figure 38). The Save Project as
Template dialog opens.
3. Type “DemoProjectTemplate1” into the Template Name field.
4. Click OK.
Figure 38
Sending a project template to a colleague
After completing step 4, the project will appear underneath the Templates/Projects tree in the
Project Explorer. It’s now time to send the project template to the investigators so they can start
collecting data. Follow the steps below to find the file so it can be attached to an e-mail message or
copied to a thumb drive.
1. Find the DemoProjectTemplate1 item underneath the Template and then Projects tree
in the Project Explorer. You might have to scroll down in the Project Explorer pane to
find it.
2. Right-click the DemoProjectTemplate1 item. A context menu appears (Figure 39).
3. Select Open Containing Folder from the context menu. A File Explorer window opens.
4. Find the file called DemoProjectTemplate1.xml from the list of files in the File Explorer
window. This file represents the template.
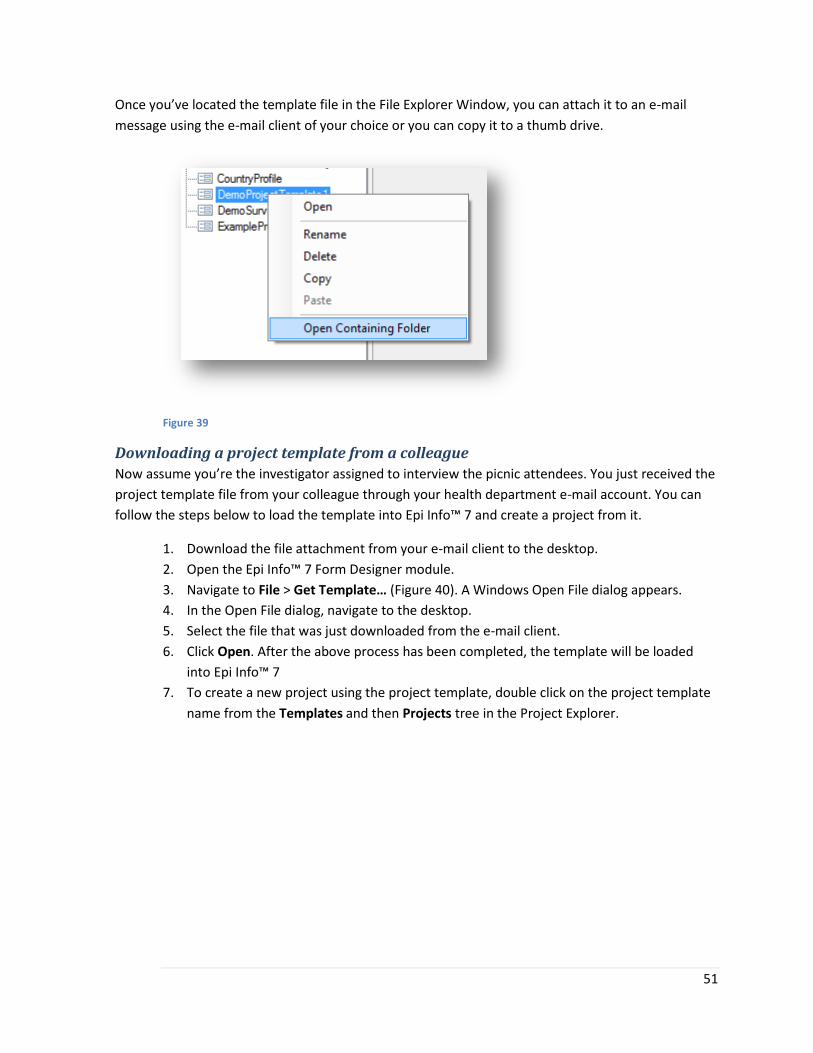
51
Once you’ve located the template file in the File Explorer Window, you can attach it to an e-mail
message using the e-mail client of your choice or you can copy it to a thumb drive.
Figure 39
Downloading a project template from a colleague
Now assume you’re the investigator assigned to interview the picnic attendees. You just received the
project template file from your colleague through your health department e-mail account. You can
follow the steps below to load the template into Epi Info™ 7 and create a project from it.
1. Download the file attachment from your e-mail client to the desktop.
2. Open the Epi Info™ 7 Form Designer module.
3. Navigate to File > Get Template… (Figure 40). A Windows Open File dialog appears.
4. In the Open File dialog, navigate to the desktop.
5. Select the file that was just downloaded from the e-mail client.
6. Click Open. After the above process has been completed, the template will be loaded
into Epi Info™ 7
7. To create a new project using the project template, double click on the project template
name from the Templates and then Projects tree in the Project Explorer.
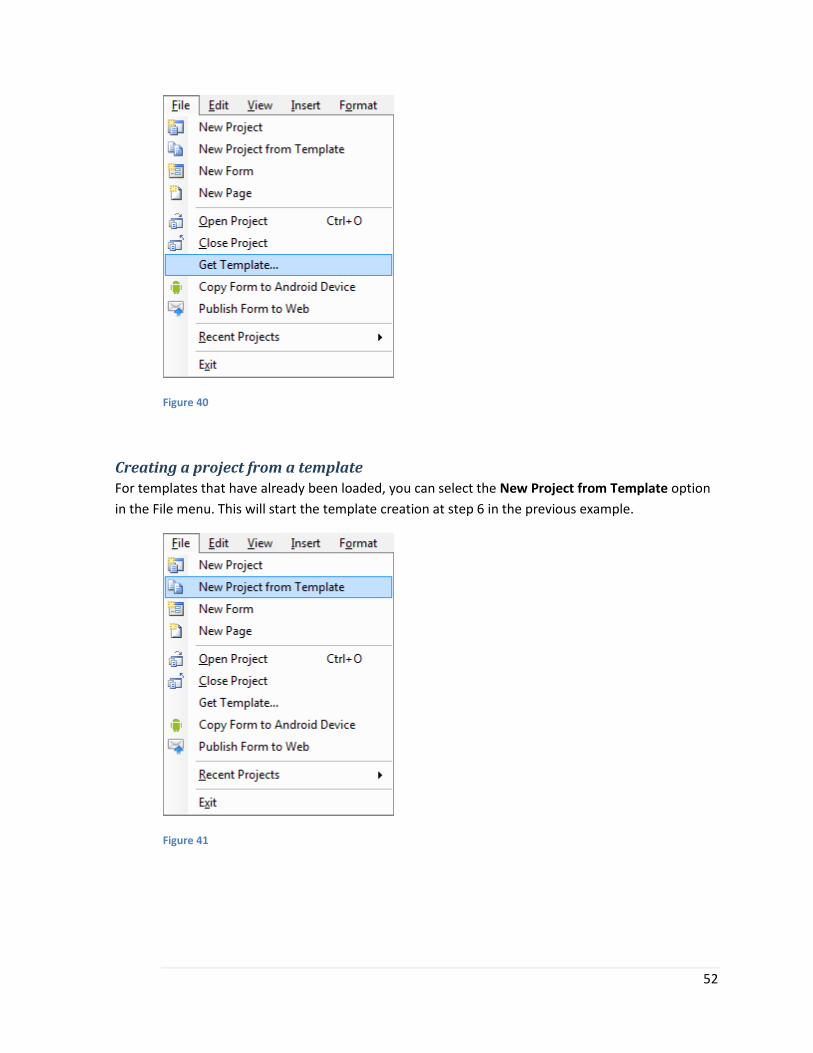
52
Figure 40
Creating a project from a template
For templates that have already been loaded, you can select the New Project from Template option
in the File menu. This will start the template creation at step 6 in the previous example.
Figure 41

53
Best Practices in Epi Info™ 7 Form Design As you can see, creating an Epi Info™ 7 form isn’t difficult. However, it helps to have an idea of how
the data will be analyzed prior to starting the form design process. This typically requires some
forethought and planning about the types of fields that will be used.
Use of Yes/No and checkbox fields instead of drop-down list fields A typical requirement for drop-down lists (Legal values field) is that they contain Yes, No, and Don’t
Know as choices. If the intention is to use that field as part of a 2x2 table, then having more than two
possible values will generate a non-2x2 table and thus, 2x2 statistics won’t be available. The Epi
Info™ 7 analysis tools have ways of recoding categorical data into dichotomous values such as true
and false, but this requires some effort and the process must be done for each field. Imagine if the
Salmonella survey in the example scenario had 100 food items with Yes, No, and Don’t know as
choices; you would need to recode all 100 variables to use the 2x2 statistics.
It’s recommended to use the checkbox fields and Yes/No fields as often as possible for fields where a
2x2 table might be needed.
Yes/No fields versus checkbox fields Recall that Epi Info™ 7 has two similar field types: The Yes/No field and the checkbox field. The
Yes/No field will create a drop-down list with Yes and No as choices. The checkbox can either be
selected or cleared. The key difference between the two field types is that you can leave a Yes/No
field blank, representing an unknown or missing value. If the intention for a given question is to allow
for the possibility that it is unknown or missing, then the Yes/No field should be used as a checkbox
can never be left blank. A cleared checkbox will always be saved to the database as FALSE.
Page size awareness When creating a form, keep in mind that not all computers have large screens. Will the screens used
to display your form be large or will they be small? The default Epi Info™ 7 page size is 8 ½ x 11
inches and works well for desktop computers with large monitors. The default page size may not
work very well when used on tablet PCs or laptops. If you’re going to be conducting a lot of field
work and aren’t sure what equipment you’ll be using, consider two choices:
Reduce the page size. This will limit the number of fields you can put on a given page, but
it will also limit the amount of vertical and horizontal scrolling that will be needed during
data entry.
Change the page orientation to landscape. Many smaller screens have more screen width
than height, so displaying the form in landscape mode might offer a better utilization of
the available screen space.
Group Fields If you’re using Epi Info™ 7 to analyze data, then intelligent use of group fields can greatly speed up
the analysis. For example, you can use groups to combine fields together or you can run a more
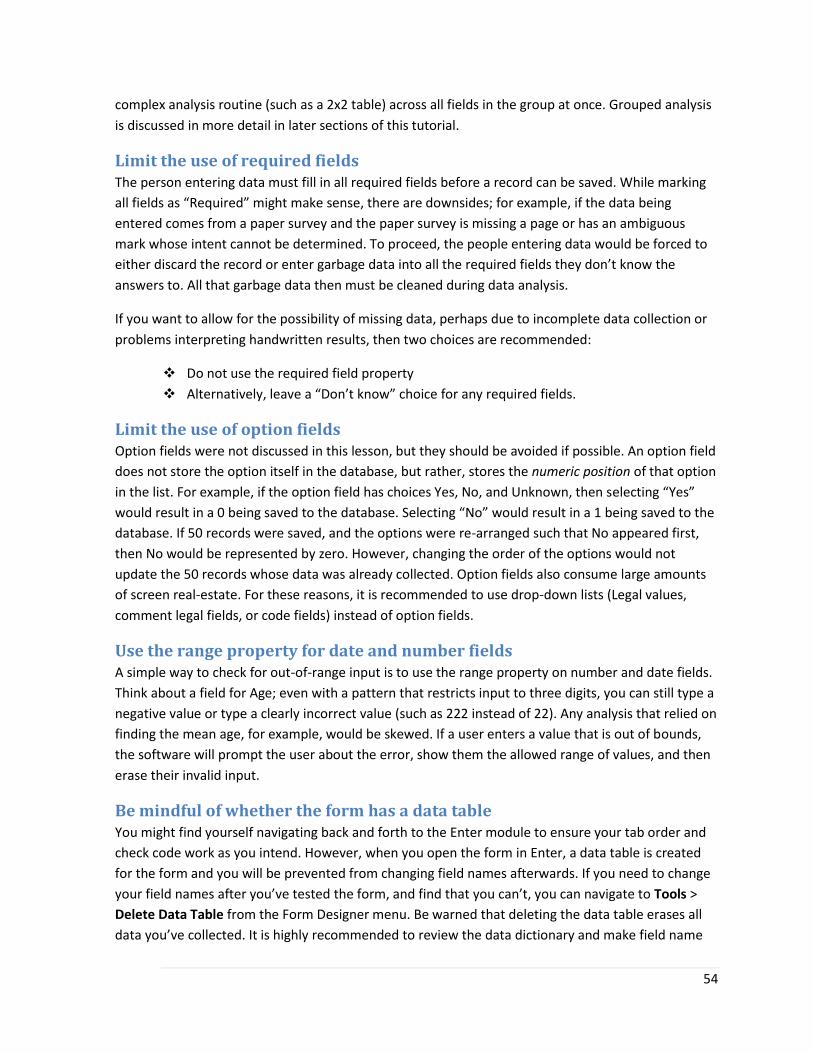
54
complex analysis routine (such as a 2x2 table) across all fields in the group at once. Grouped analysis
is discussed in more detail in later sections of this tutorial.
Limit the use of required fields The person entering data must fill in all required fields before a record can be saved. While marking
all fields as “Required” might make sense, there are downsides; for example, if the data being
entered comes from a paper survey and the paper survey is missing a page or has an ambiguous
mark whose intent cannot be determined. To proceed, the people entering data would be forced to
either discard the record or enter garbage data into all the required fields they don’t know the
answers to. All that garbage data then must be cleaned during data analysis.
If you want to allow for the possibility of missing data, perhaps due to incomplete data collection or
problems interpreting handwritten results, then two choices are recommended:
Do not use the required field property
Alternatively, leave a “Don’t know” choice for any required fields.
Limit the use of option fields Option fields were not discussed in this lesson, but they should be avoided if possible. An option field
does not store the option itself in the database, but rather, stores the numeric position of that option
in the list. For example, if the option field has choices Yes, No, and Unknown, then selecting “Yes”
would result in a 0 being saved to the database. Selecting “No” would result in a 1 being saved to the
database. If 50 records were saved, and the options were re-arranged such that No appeared first,
then No would be represented by zero. However, changing the order of the options would not
update the 50 records whose data was already collected. Option fields also consume large amounts
of screen real-estate. For these reasons, it is recommended to use drop-down lists (Legal values,
comment legal fields, or code fields) instead of option fields.
Use the range property for date and number fields A simple way to check for out-of-range input is to use the range property on number and date fields.
Think about a field for Age; even with a pattern that restricts input to three digits, you can still type a
negative value or type a clearly incorrect value (such as 222 instead of 22). Any analysis that relied on
finding the mean age, for example, would be skewed. If a user enters a value that is out of bounds,
the software will prompt the user about the error, show them the allowed range of values, and then
erase their invalid input.
Be mindful of whether the form has a data table You might find yourself navigating back and forth to the Enter module to ensure your tab order and
check code work as you intend. However, when you open the form in Enter, a data table is created
for the form and you will be prevented from changing field names afterwards. If you need to change
your field names after you’ve tested the form, and find that you can’t, you can navigate to Tools >
Delete Data Table from the Form Designer menu. Be warned that deleting the data table erases all
data you’ve collected. It is highly recommended to review the data dictionary and make field name

55
changes before starting data collection to avoid a scenario where the only solution to changing a
field’s name is to erase live data.
Use multiline fields to capture large amounts of text If you need to capture potentially large amounts of text information, such as a ‘Comments’ section
on a survey, use the Multiline field type. Unlike the Text field, the Multiline field can be re-sized
vertically and it can include both line breaks and tabs. It can also store 2 gigabytes of text, whereas
the Text field can store only 255 characters.
Use field templates to avoid repeating work If you’re using Epi Info™ 7 to create numerous surveys, consider using field-level templates to avoid
re-creating the same set of fields over and over (e.g. Demographics).
Use project templates to distribute your Epi Info™ 7 projects When distributing the project becomes necessary, such as when providing investigators the outbreak
investigation form, consider using project-level templates as the distribution mechanism. Sending
your colleagues the project-level template, instead of the actual Epi Info™ 7 project you’ve been
working on, has several benefits and can avoid unnecessary hassles. See the earlier section of this
manual regarding project-level templates for further details.
Additionally, consider creating certain projects ahead of time and saving them as templates in a
location where your team can access them quickly (such as a network shared drive). Take the
Salmonella outbreak as an example; if a Salmonella outbreak survey had been created before the
outbreak occurred, the investigators would have started with a solid foundation and simply modified
the template to the specifics of the outbreak.
56
Summary During this lesson, you were introduced to the concept of creating electronic data entry forms using
the Form Designer module of Epi Info™ 7. You can now:
Create a new Epi Info™ 7 project
Add pages to a form
Add fields to a form
Set the tab order on the form and change formatting options
Work with templates
Q&A Q: Why can’t I change field names on my form? I’m looking at the Field Definition dialog for every
field on my form, but the field name box is disabled and I can’t edit it.
A: Field names cannot be changed once data entry has started. Even testing your form in data entry
mode is considered data entry, so even a quick check to make sure the tab order works can prevent
you from editing the field names. The way to solve this issue is to open the form in the Form
Designer module and select Tools > Delete Data Table from the menu. This action will erase all
collected data up to that point.
Q: What is the difference between the Text field type and the Multiline field type?
A: The Text field type creates a single-line text box on the form. It can accept up to 255 characters of
input. The multiline field type creates a multiple-line text box on the form. It can be resized vertically,
unlike the Text field, and can store 2 gigabytes of text data. Use the multiline field when large
amounts of text might be required.
Q: How can I reorder the pages on the form?
A: Pages can be re-ordered by left-clicking on them and dragging them to the desired position. Follow
the steps below to move the second page up to the first position, and then back again to the second
position:
1. Click on Page 2 in the Project Explorer panel. The Page 2 item is highlighted.
2. Click and hold the Page 2 item in the Project Explorer panel while dragging the mouse
onto the Page 1 Case Information item.
3. Release the mouse button. Page 2 now appears first.
4. Click and hold the Page 1 Case Information item in the Project Explorer panel while
dragging the mouse onto the Page 2 item.
5. Release the left mouse button. Page 1 now appears first.

57
Quiz The following questions will see how much you have learned about using the Form Designer module.
Questions 1. An Epi Info™ 7 project might contain one or more forms.
a. True
b. False
2. An Epi Info™ 7 form might contain one or more pages.
a. True
b. False
3. The tab order can be set manually or automatically.
a. True
b. False
4. A field’s input box cannot be moved independently of the field prompt.
a. True
b. False
5. Which two field properties are mutually exclusive?
a. Read only and required
b. Range and repeat last
c. Range and required
d. None of the above
6. A certain field type can only be true or false; it can never be left blank or missing. What field
type does this description remind you of?
a. The Yes/No field
b. The checkbox field
c. The legal values field
d. The dichotomous field
e. None of the above
7. What field type shows the user both a value/code and a label describing that value/code, but
only stores the value/code in the database?
a. The legal value field
b. The codes field
c. The comment legal field
d. All of the above
e. None of the above
8. A user wants to add a field on their form to capture comments. What field type would be
best suited for this purpose?
a. A text field
b. A legal values field
c. An option field
d. A multiline field

58
e. None of the above
9. A user is interested in running 2x2 tables on their data after data collection has finished. On
the fields intended for use in the 2x2 tables, what field types might work best to reduce data
recoding during analysis?
a. Yes/No and checkbox fields
b. Text fields
c. Legal values fields
d. Number fields
e. None of the above
10. A user wants to create a drop-down list of clinics. When a clinic is chosen, she wants the
county the clinic is in to be automatically populated into another field. What would be best
suited for this situation?
a. A legal values field
b. A comment legal field
c. Two legal value fields
d. A codes field linked to a text field
e. Two text fields
11. You just finished creating the Salmonella outbreak form and now want to create an E. Coli
food history form. You want to re-use the demographics fields from the first form. How
would you do this?
a. Copy the fields from the Salmonella form, open the E. coli form, and then paste them
b. Save the fields as a template, open the E. coli form, and drag the template onto the
canvas
c. Open the data dictionary, select the fields you want to copy, and then paste them
into the E. coli food history form
d. There is no way to do this; the fields have to be re-created from scratch
12. You have created a number field called “Case ID” on Page 1. You want to show the case ID on
each subsequent page. What field type would be best suited to show the case ID on
subsequent pages of the form?
a. Mirror field
b. Number field
c. Text field
d. All of the above
13. Your supervisor asks to see a list of all the fields on the form, including the field names,
prompts, page numbers and any other special information. What could you use to quickly
send the supervisor this information?
a. A project template
b. The data dictionary
c. A screenshot of the form
d. Your Epi Info™ 7 project file
e. All of the above
f. None of the above

59
Answers 1. A
2. A
3. A
4. B
5. A
6. B. Yes/No fields can be true, false, or left blank. Yes/No fields are blank by default.
7. C
8. D. The text field can store up to 255 characters while the multiline field can store over 2
gigabytes of character data.
9. A. The checkbox and Yes/No fields ensure the data are captured perfectly for 2x2 tables.
(Legal value fields might work if there are only two possible choices, but can sometimes still
require recoding to ensure the ‘positive’ value appears in the first row or first column.)
10. D
11. B
12. A
13. B

60
Lesson 2
Data Entry Validation using Check Code
This lesson introduces you to creating Check Code inside the Form Designer module of Epi Info™ 7.
You will learn how to customize your survey by creating a series of data entry rules. You will also
learn the components of the Form Designer’s Check Code Editor.
In Lesson 1, you created a variety of fields to collect data for your survey. In Lesson 2, you will use the
survey you created and add Check Code to some of the fields. Check Code makes the data entry
process faster and more efficient; therefore, fewer errors occur when you use the data later to
create the statistics and develop your report.
Time to complete: 2 hours (Intermediate)
BEFORE YOU BEGIN
Complete Lesson 1
FIVE GOALS
1. Learn how to navigate the Check Code editor window of the Form Designer.
2. Calculate age using the ASSIGN command.
3. Show a warning dialog box to the user.
4. Disable and enable fields on the form using conditional logic.
5. Use the SYSTEMDATE and YEARS functions.
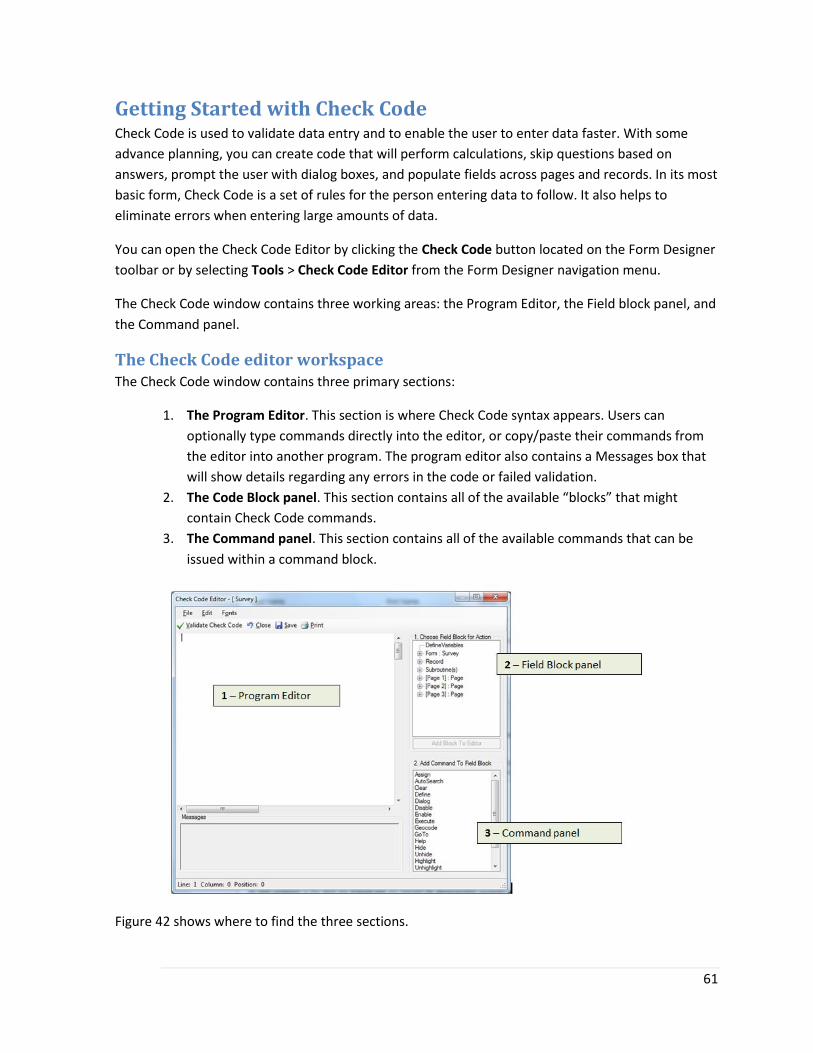
61
Getting Started with Check Code Check Code is used to validate data entry and to enable the user to enter data faster. With some
advance planning, you can create code that will perform calculations, skip questions based on
answers, prompt the user with dialog boxes, and populate fields across pages and records. In its most
basic form, Check Code is a set of rules for the person entering data to follow. It also helps to
eliminate errors when entering large amounts of data.
You can open the Check Code Editor by clicking the Check Code button located on the Form Designer
toolbar or by selecting Tools > Check Code Editor from the Form Designer navigation menu.
The Check Code window contains three working areas: the Program Editor, the Field block panel, and
the Command panel.
The Check Code editor workspace The Check Code window contains three primary sections:
1. The Program Editor. This section is where Check Code syntax appears. Users can
optionally type commands directly into the editor, or copy/paste their commands from
the editor into another program. The program editor also contains a Messages box that
will show details regarding any errors in the code or failed validation.
2. The Code Block panel. This section contains all of the available “blocks” that might
contain Check Code commands.
3. The Command panel. This section contains all of the available commands that can be
issued within a command block.
Figure 42 shows where to find the three sections.
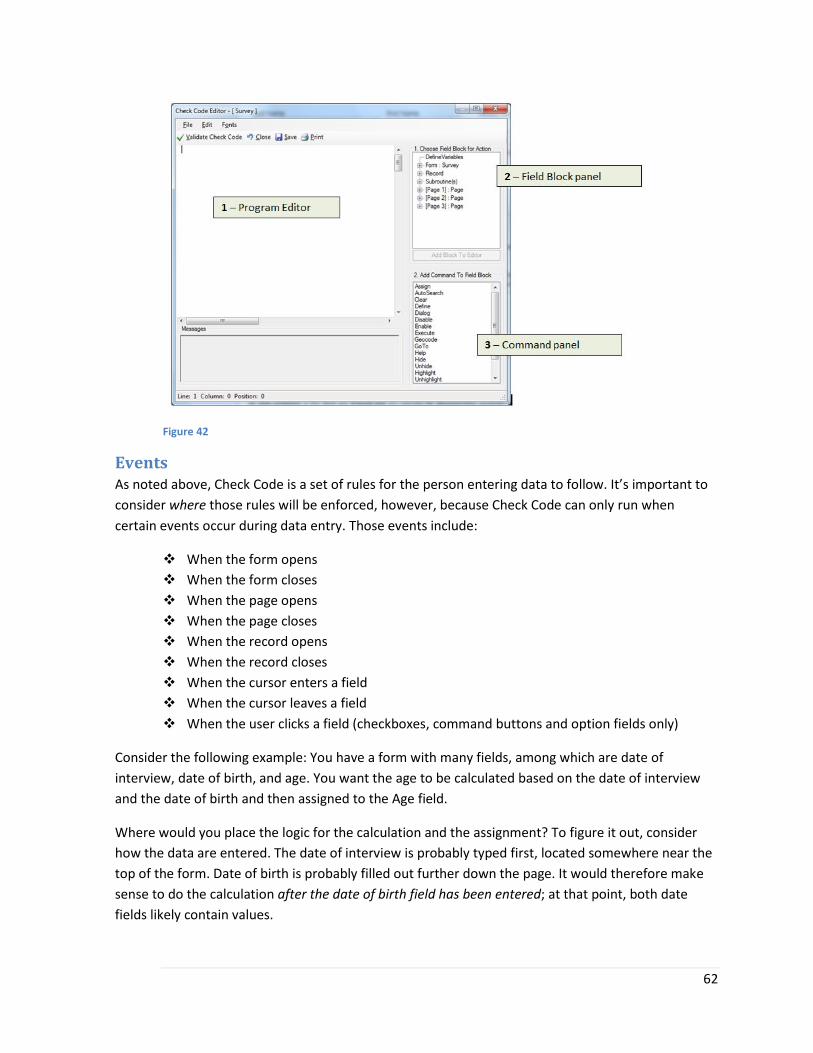
62
Figure 42
Events As noted above, Check Code is a set of rules for the person entering data to follow. It’s important to
consider where those rules will be enforced, however, because Check Code can only run when
certain events occur during data entry. Those events include:
When the form opens
When the form closes
When the page opens
When the page closes
When the record opens
When the record closes
When the cursor enters a field
When the cursor leaves a field
When the user clicks a field (checkboxes, command buttons and option fields only)
Consider the following example: You have a form with many fields, among which are date of
interview, date of birth, and age. You want the age to be calculated based on the date of interview
and the date of birth and then assigned to the Age field.
Where would you place the logic for the calculation and the assignment? To figure it out, consider
how the data are entered. The date of interview is probably typed first, located somewhere near the
top of the form. Date of birth is probably filled out further down the page. It would therefore make
sense to do the calculation after the date of birth field has been entered; at that point, both date
fields likely contain values.

63
What if you placed the logic into the date of interview field instead, such that it ran after the date of
interview had been entered (and not after date of birth had been entered)? Epi Info™ 7 would still
calculate the difference in years between the two dates, but because date of birth is unlikely to have
been typed in at that point, the result will be a null value.
A key distinction should be made between the “before entry” and “after entry” field events. When
the cursor enters a field, the before event for that field is run. This occurs so quickly that it will always
run before the user has a chance to type anything into the field, hence the “before” description.
When the cursor leaves a field; that is, after the user is done entering data into that field – the after
event for that field is run.
The same distinction can be made at the form, page, and record events. When the form opens, the
before event for the form is run; likewise, when a page is opened, the before event for that page is
run. Check code can be set to run at these locations to handle special situations.

64
Commands Overview The rules that you define using the check code editor are implemented through the use of
commands. The available commands are listed below.
Define Use to create new variables.
Assign Use to assign the result of arithmetic or string expression mathematics to a variable.
Hide Use to hide a field from view.
Unhide Use to make a field visible if it had been hidden previously.
Disable Use to disable a field. Disabled fields cannot accept user input and are no longer part of the tab
order.
Enable Use to enable a field that was previously disabled.
Highlight Use to highlight a field in bright yellow, for example, if a data entry error was detected.
Unhighlight Use to remove any field highlighting that might have been applied.
GoTo Use alone or in an IF statement to transfer the cursor to a specifically named field or page.
Clear Use to set the field named to the missing value, as though it had been left blank.
Autosearch Use to search for one or more matching records.
If Use to define conditions and/or consequences that result if the conditions are met. An alternative
consequence can be given after the ELSE statement.
Execute Use to execute a Windows program.

65
Dialog Use to provide interaction with users. Dialogs can display information and ask for and receive input.
Geocode Use to offer geocoding services to the form.
66
Opening the Form You will not be using the form you created earlier. You will be using a form that has already been
created for you to ensure consistent field placement and field naming. To open this form, follow the
steps below:
1. Open the Form Designer module from the Epi Info™ 7 menu. If the Form Designer is
already open, close any projects that might be open by clicking the Close Project button
on the toolbar.
2. Click the Open Project button on the toolbar. A Windows Open File dialog appears.
3. Navigate to the Epi Info 7\Resources\Training Projects\Salmonellosis folder.
4. Select the Salmonella.prj file and click the Open button. The Survey_NoCheckCode
Outbreak Form appears on the canvas.
Ensure that the words “Check Code Form, Use in Lessons 2-3” appears in the upper-right corner. If
they do not, double-click the Salmonella_NoCheckCode item in the Project Explorer pane.
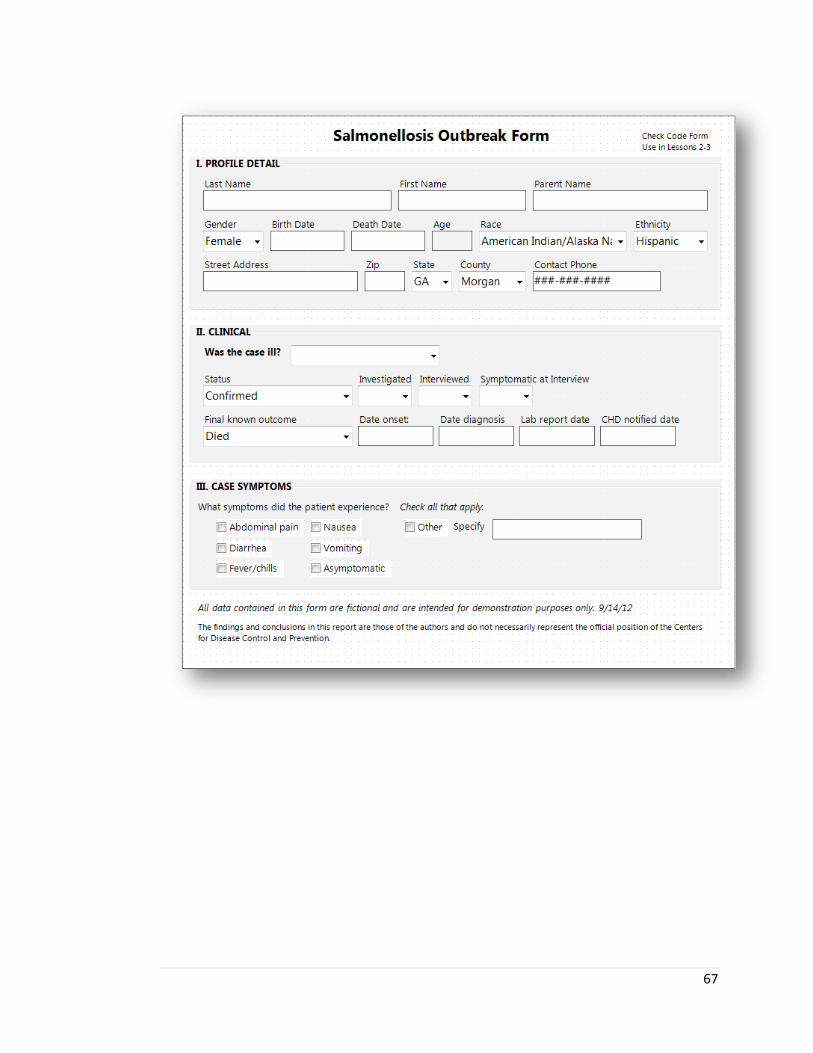
67
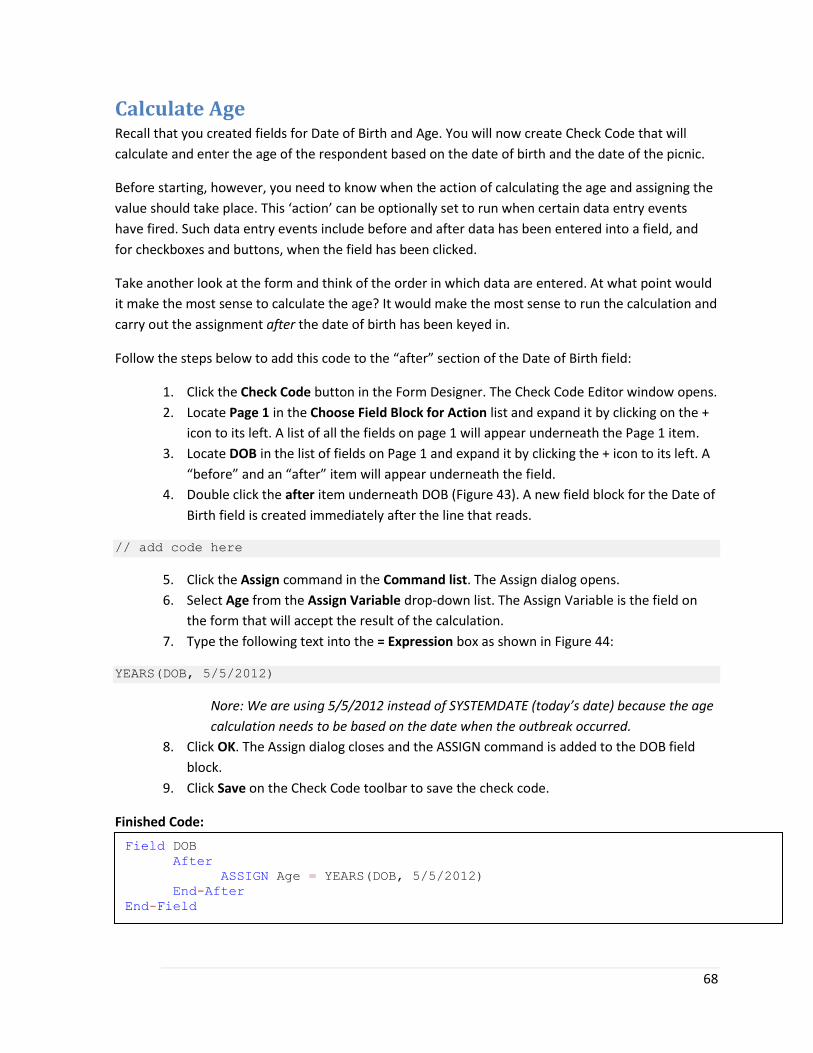
68
Calculate Age Recall that you created fields for Date of Birth and Age. You will now create Check Code that will
calculate and enter the age of the respondent based on the date of birth and the date of the picnic.
Before starting, however, you need to know when the action of calculating the age and assigning the
value should take place. This ‘action’ can be optionally set to run when certain data entry events
have fired. Such data entry events include before and after data has been entered into a field, and
for checkboxes and buttons, when the field has been clicked.
Take another look at the form and think of the order in which data are entered. At what point would
it make the most sense to calculate the age? It would make the most sense to run the calculation and
carry out the assignment after the date of birth has been keyed in.
Follow the steps below to add this code to the “after” section of the Date of Birth field:
1. Click the Check Code button in the Form Designer. The Check Code Editor window opens.
2. Locate Page 1 in the Choose Field Block for Action list and expand it by clicking on the +
icon to its left. A list of all the fields on page 1 will appear underneath the Page 1 item.
3. Locate DOB in the list of fields on Page 1 and expand it by clicking the + icon to its left. A
“before” and an “after” item will appear underneath the field.
4. Double click the after item underneath DOB (Figure 43). A new field block for the Date of
Birth field is created immediately after the line that reads.
// add code here
5. Click the Assign command in the Command list. The Assign dialog opens.
6. Select Age from the Assign Variable drop-down list. The Assign Variable is the field on
the form that will accept the result of the calculation.
7. Type the following text into the = Expression box as shown in Figure 44:
YEARS(DOB, 5/5/2012)
Nore: We are using 5/5/2012 instead of SYSTEMDATE (today’s date) because the age
calculation needs to be based on the date when the outbreak occurred.
8. Click OK. The Assign dialog closes and the ASSIGN command is added to the DOB field
block.
9. Click Save on the Check Code toolbar to save the check code.
Finished Code:
Field DOB
After
ASSIGN Age = YEARS(DOB, 5/5/2012)
End-After
End-Field
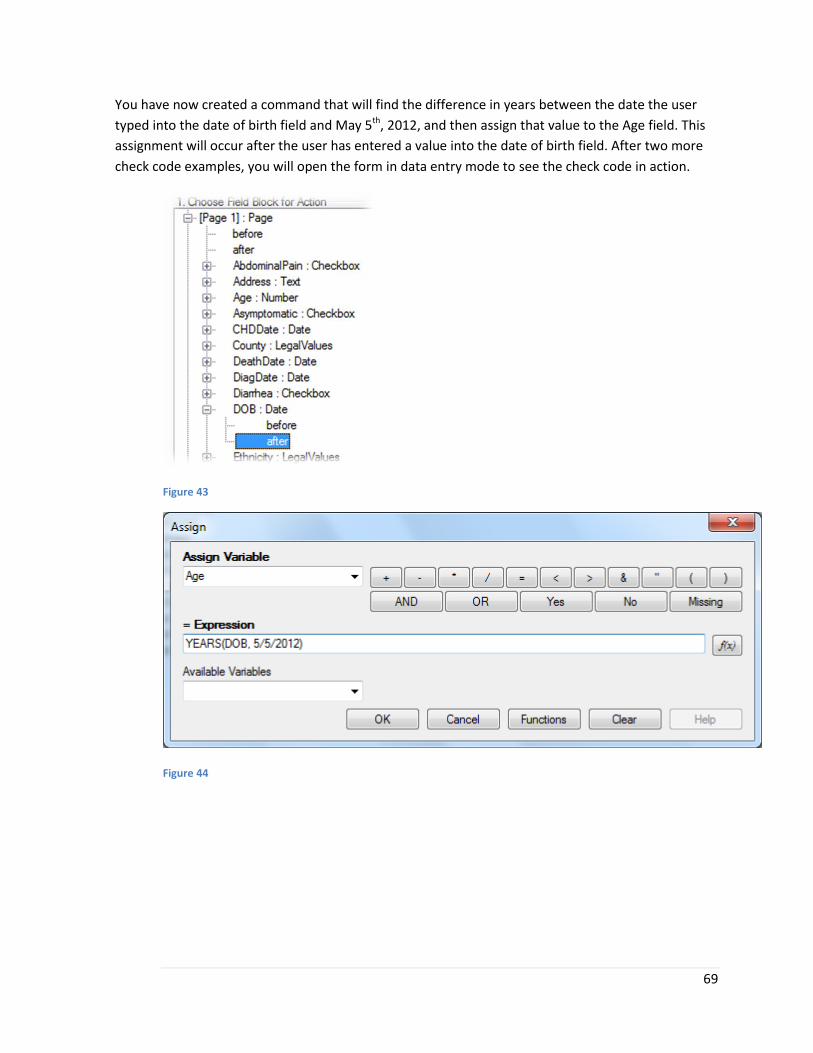
69
You have now created a command that will find the difference in years between the date the user
typed into the date of birth field and May 5th, 2012, and then assign that value to the Age field. This
assignment will occur after the user has entered a value into the date of birth field. After two more
check code examples, you will open the form in data entry mode to see the check code in action.
Figure 43
Figure 44
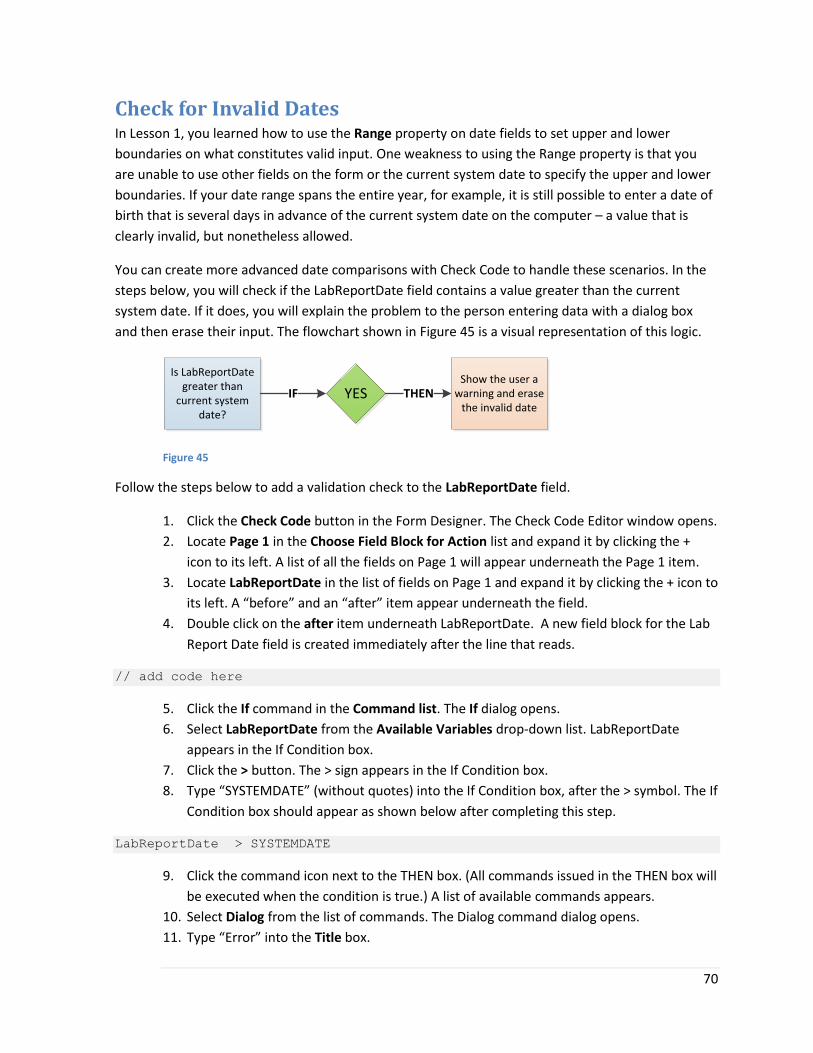
70
Check for Invalid Dates In Lesson 1, you learned how to use the Range property on date fields to set upper and lower
boundaries on what constitutes valid input. One weakness to using the Range property is that you
are unable to use other fields on the form or the current system date to specify the upper and lower
boundaries. If your date range spans the entire year, for example, it is still possible to enter a date of
birth that is several days in advance of the current system date on the computer – a value that is
clearly invalid, but nonetheless allowed.
You can create more advanced date comparisons with Check Code to handle these scenarios. In the
steps below, you will check if the LabReportDate field contains a value greater than the current
system date. If it does, you will explain the problem to the person entering data with a dialog box
and then erase their input. The flowchart shown in Figure 45 is a visual representation of this logic.
Is LabReportDate greater than
current system date?
YESIF THENShow the user a
warning and erase the invalid date
Figure 45
Follow the steps below to add a validation check to the LabReportDate field.
1. Click the Check Code button in the Form Designer. The Check Code Editor window opens.
2. Locate Page 1 in the Choose Field Block for Action list and expand it by clicking the +
icon to its left. A list of all the fields on Page 1 will appear underneath the Page 1 item.
3. Locate LabReportDate in the list of fields on Page 1 and expand it by clicking the + icon to
its left. A “before” and an “after” item appear underneath the field.
4. Double click on the after item underneath LabReportDate. A new field block for the Lab
Report Date field is created immediately after the line that reads.
// add code here
5. Click the If command in the Command list. The If dialog opens.
6. Select LabReportDate from the Available Variables drop-down list. LabReportDate
appears in the If Condition box.
7. Click the > button. The > sign appears in the If Condition box.
8. Type “SYSTEMDATE” (without quotes) into the If Condition box, after the > symbol. The If
Condition box should appear as shown below after completing this step.
LabReportDate > SYSTEMDATE
9. Click the command icon next to the THEN box. (All commands issued in the THEN box will
be executed when the condition is true.) A list of available commands appears.
10. Select Dialog from the list of commands. The Dialog command dialog opens.
11. Type “Error” into the Title box.
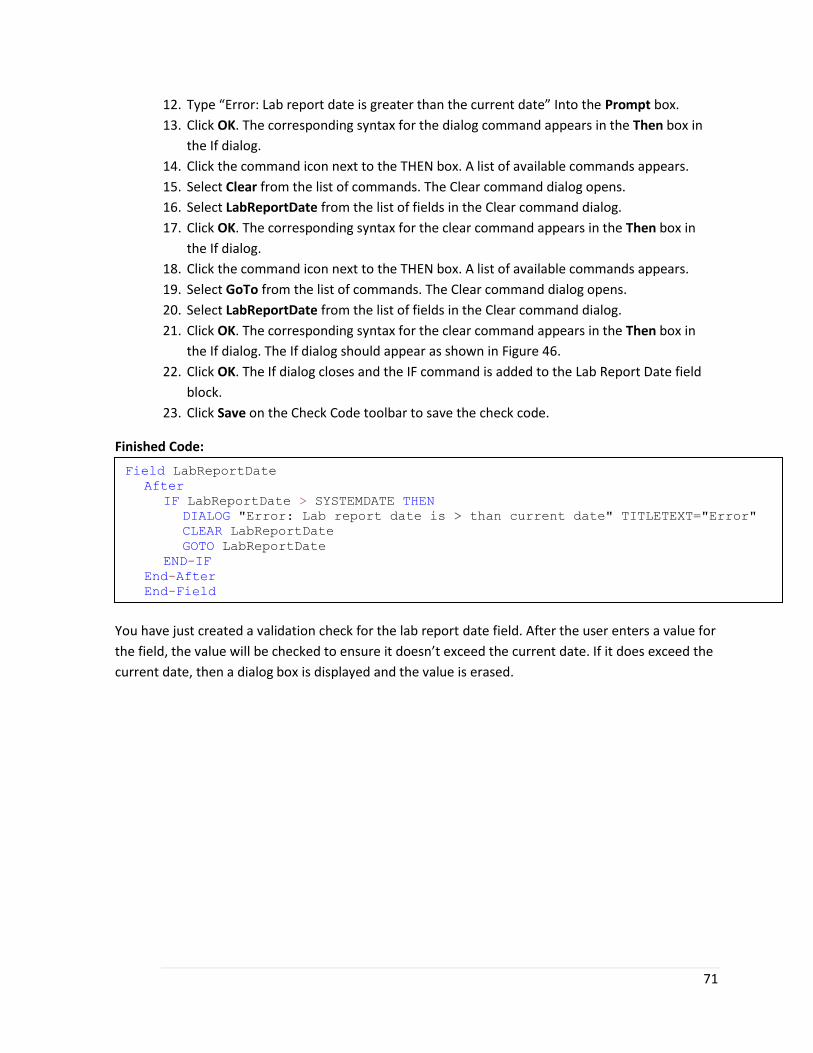
71
12. Type “Error: Lab report date is greater than the current date” Into the Prompt box.
13. Click OK. The corresponding syntax for the dialog command appears in the Then box in
the If dialog.
14. Click the command icon next to the THEN box. A list of available commands appears.
15. Select Clear from the list of commands. The Clear command dialog opens.
16. Select LabReportDate from the list of fields in the Clear command dialog.
17. Click OK. The corresponding syntax for the clear command appears in the Then box in
the If dialog.
18. Click the command icon next to the THEN box. A list of available commands appears.
19. Select GoTo from the list of commands. The Clear command dialog opens.
20. Select LabReportDate from the list of fields in the Clear command dialog.
21. Click OK. The corresponding syntax for the clear command appears in the Then box in
the If dialog. The If dialog should appear as shown in Figure 46.
22. Click OK. The If dialog closes and the IF command is added to the Lab Report Date field
block.
23. Click Save on the Check Code toolbar to save the check code.
Finished Code:
You have just created a validation check for the lab report date field. After the user enters a value for
the field, the value will be checked to ensure it doesn’t exceed the current date. If it does exceed the
current date, then a dialog box is displayed and the value is erased.
Field LabReportDate
After
IF LabReportDate > SYSTEMDATE THEN
DIALOG "Error: Lab report date is > than current date" TITLETEXT="Error"
CLEAR LabReportDate
GOTO LabReportDate
END-IF
End-After
End-Field
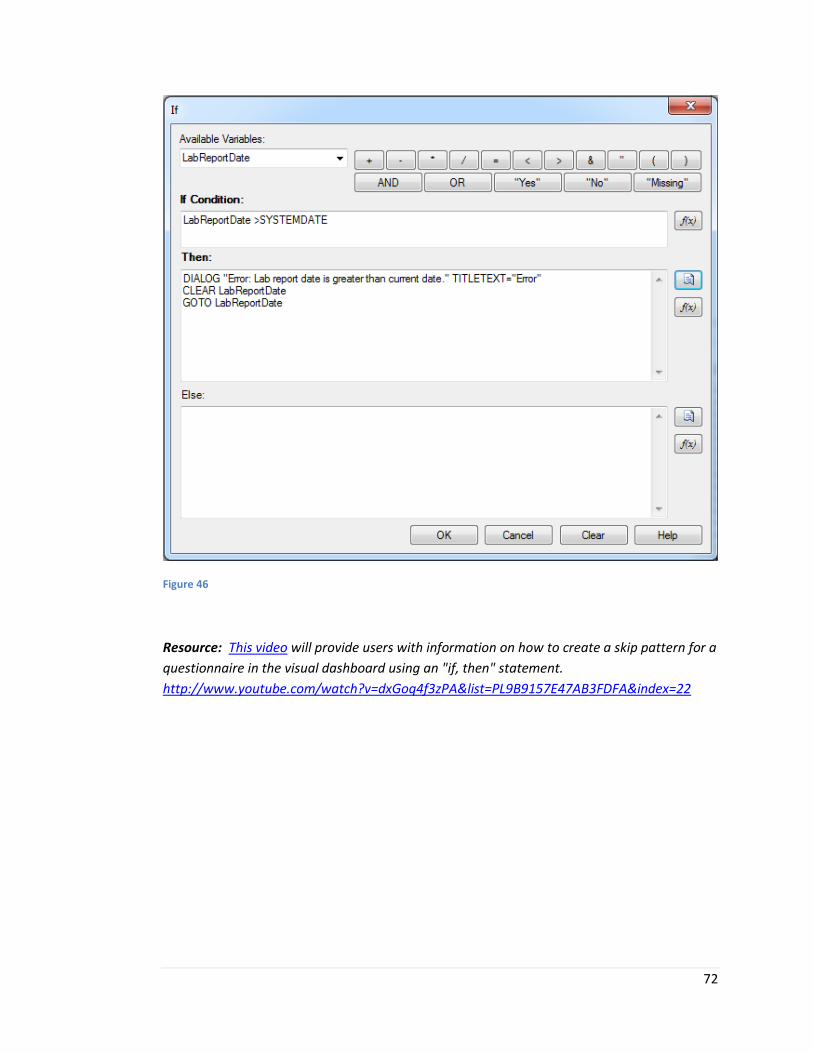
72
Figure 46
Resource: This video will provide users with information on how to create a skip pattern for a
questionnaire in the visual dashboard using an "if, then" statement.
http://www.youtube.com/watch?v=dxGoq4f3zPA&list=PL9B9157E47AB3FDFA&index=22
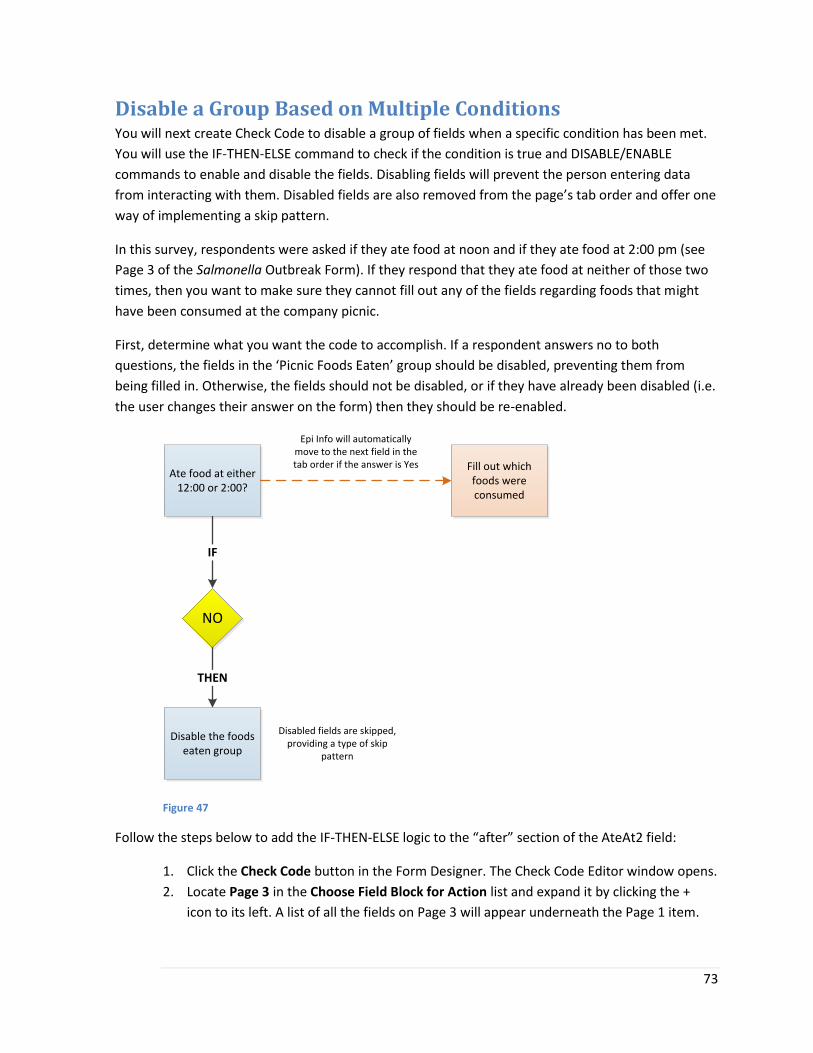
73
Disable a Group Based on Multiple Conditions You will next create Check Code to disable a group of fields when a specific condition has been met.
You will use the IF-THEN-ELSE command to check if the condition is true and DISABLE/ENABLE
commands to enable and disable the fields. Disabling fields will prevent the person entering data
from interacting with them. Disabled fields are also removed from the page’s tab order and offer one
way of implementing a skip pattern.
In this survey, respondents were asked if they ate food at noon and if they ate food at 2:00 pm (see
Page 3 of the Salmonella Outbreak Form). If they respond that they ate food at neither of those two
times, then you want to make sure they cannot fill out any of the fields regarding foods that might
have been consumed at the company picnic.
First, determine what you want the code to accomplish. If a respondent answers no to both
questions, the fields in the ‘Picnic Foods Eaten’ group should be disabled, preventing them from
being filled in. Otherwise, the fields should not be disabled, or if they have already been disabled (i.e.
the user changes their answer on the form) then they should be re-enabled.
Ate food at either 12:00 or 2:00?
Fill out which foods were consumed
Disable the foods eaten group
NO
IF
THEN
Epi Info will automatically move to the next field in the tab order if the answer is Yes
Disabled fields are skipped, providing a type of skip
pattern
Figure 47
Follow the steps below to add the IF-THEN-ELSE logic to the “after” section of the AteAt2 field:
1. Click the Check Code button in the Form Designer. The Check Code Editor window opens.
2. Locate Page 3 in the Choose Field Block for Action list and expand it by clicking the +
icon to its left. A list of all the fields on Page 3 will appear underneath the Page 1 item.

74
3. Locate AteAt2 in the list of fields on Page3 and expand it by clicking the + icon to its left.
A “before” and an “after” item appear underneath the field.
4. Double click the after item underneath AteAt2. A new field block for the AteAt2 field is
created immediately after the line that reads.
// add code here
5. Click the If command in the Command list. The If dialog opens.
6. Select AteAtNoon from the Available Variables drop-down list. AteAtNoon appears in
the If Condition box.
7. Click the = button. The = sign appears in the If Condition box.
8. Click the No button. The (-) symbol appears in the If Condition box.
9. Click the And button. The word “AND” appears in the If Condition box.
10. Select AteAt2 from the Available Variables drop-down list. AteAt2 appears in the If
Condition box.
11. Click the = button. The = sign appears in the If Condition box.
12. Click the No button. The (-) symbol appears in the If Condition box. The contents of the If
Condition box should now appear as such:
AteAtNoon = (-) AND AteAt2 = (-)
Remember that this condition is checking to see if a false or negative value (represented by the (-)
characters) has been entered into both the AteAtNoon and AteAt2 fields. If the condition appears
correct, please proceed.
13. Click the command icon next to the THEN box. (All commands issued in the THEN box will
be executed when the condition is true.) A list of available commands appears.
14. Select Disable from the list of commands. The Disable dialog opens.
15. Select Group_PicnicFoodsEaten from the list of fields.
16. Click OK. The text “DISABLE Group_PicnicFoodsEaten” appears in the THEN box.
17. Click the command icon next to the THEN box. (All commands issued in the THEN box will
be executed when the condition is true.) A list of available commands appears.
18. Select Clear from the list of commands. The Clear dialog opens.
19. Select Group_PicnicFoodsEaten from the list of fields.
20. Click OK. The text “CLEAR Group_PicnicFoodsEaten” appears in the THEN box. The
CLEAR command will set all the values in the group to null in case data was previously
entered into the fields.
You have set all of the fields within the Picnic Foods Eaten group on Page 3 to become disabled when
both AteAtNoon and AteAt2 have been filled in with “No” values. Any data previously entered will be
cleared. However, there is a weakness to this approach. Imagine the following scenario: A user fills in
a “No” value for both AteAt2 and AteAtNoon and the Picnic Foods Eaten group is disabled as
expected. The user then changes the value in AteAt2 to “Yes.” With the check code you have created,
the fields that were disabled would remain disabled even though there is now a “Yes.”
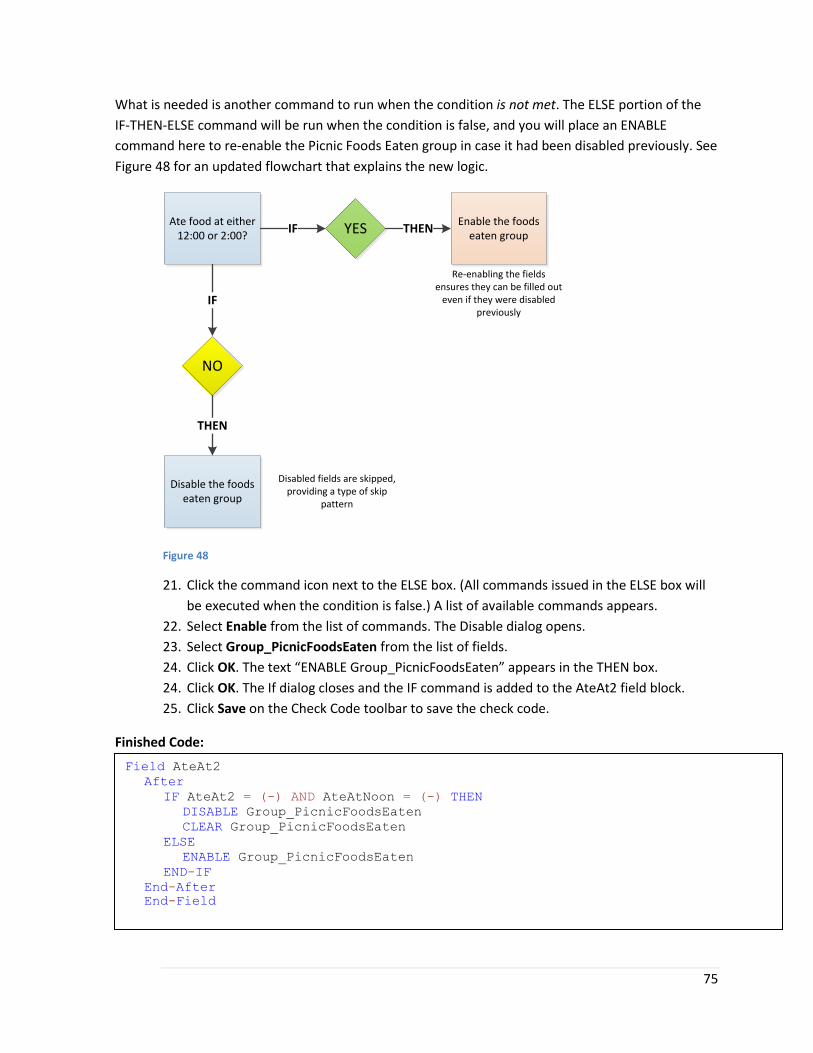
75
What is needed is another command to run when the condition is not met. The ELSE portion of the
IF-THEN-ELSE command will be run when the condition is false, and you will place an ENABLE
command here to re-enable the Picnic Foods Eaten group in case it had been disabled previously. See
Figure 48 for an updated flowchart that explains the new logic.
Ate food at either 12:00 or 2:00?
Enable the foods eaten group
Disable the foods eaten group
NO
IF
THEN
Disabled fields are skipped, providing a type of skip
pattern
IF YES THEN
Re-enabling the fields ensures they can be filled out
even if they were disabled previously
Figure 48
21. Click the command icon next to the ELSE box. (All commands issued in the ELSE box will
be executed when the condition is false.) A list of available commands appears.
22. Select Enable from the list of commands. The Disable dialog opens.
23. Select Group_PicnicFoodsEaten from the list of fields.
24. Click OK. The text “ENABLE Group_PicnicFoodsEaten” appears in the THEN box.
24. Click OK. The If dialog closes and the IF command is added to the AteAt2 field block.
25. Click Save on the Check Code toolbar to save the check code.
Finished Code:
Field AteAt2
After
IF AteAt2 = (-) AND AteAtNoon = (-) THEN
DISABLE Group_PicnicFoodsEaten
CLEAR Group_PicnicFoodsEaten
ELSE
ENABLE Group_PicnicFoodsEaten
END-IF
End-After
End-Field
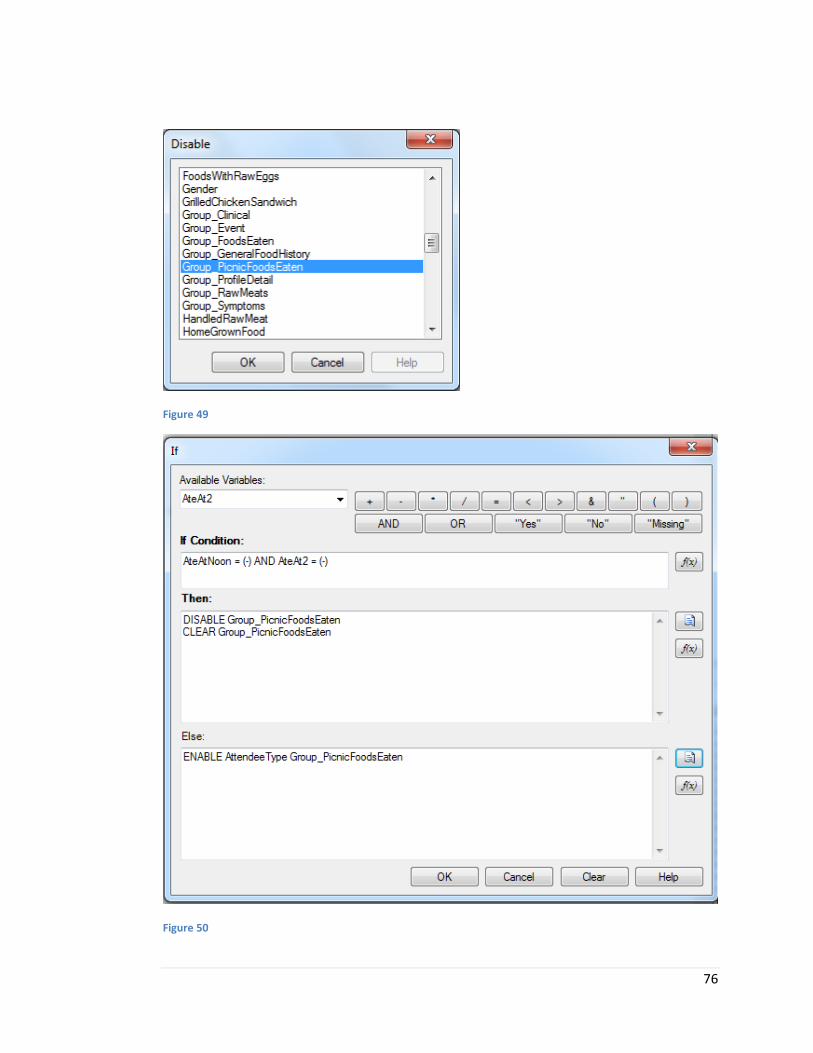
76
Figure 49
Figure 50

77
Run Commands When the Page is Loaded In the previous example, you created check code that disables a group of food items when AteAt2
and AteAtNoon both have “No” values. Recall, however, that the “rules” you create are only
enforced at certain times during data entry. The previous example was set to disable the group of
food items after the AteAt2 field had been filled in.
What happens if, during data entry, you navigate to an existing record where AteAt2 and AteAtNoon
both contain “No”? Because the cursor wouldn’t visit the AteAt2 field by navigating records, the code
you created earlier wouldn’t run. The group box would therefore be enabled even though the
condition for disabling it has been met.
To make sure the enable/disable logic runs when you open the page or change records, an additional
piece of check code must be added. You will add this code to the before event on the page. Recall
that the “before” event is run as soon as the page is loaded, a cursor enters a field, or when
navigating between records. Follow the steps below to add this code to the before page event of
Page 3.
1. Click the Check Code button in the Form Designer. The Check Code Editor window opens.
2. Locate Page 3 in the Choose Field Block for Action list and expand it by clicking the +
icon to its left. A list of all the fields on page 3 will appear underneath the Page 3 item.
3. Double click the before item under Page 3. A field block for Page 3 is created.
4. Now follow the steps in the section “Disable a Group Based on Multiple Conditions”
starting at step #5. The finished check code is shown below.
Finished Code:
Page [Page 3]
Before
//add code here
IF AteAt2 = (-) AND AteAtNoon = (-) THEN
DISABLE Group_PicnicFoodsEaten
CLEAR Group_PicnicFoodsEaten
ELSE
ENABLE Group_PicnicFoodsEaten
END-IF
End-Before
End-Page
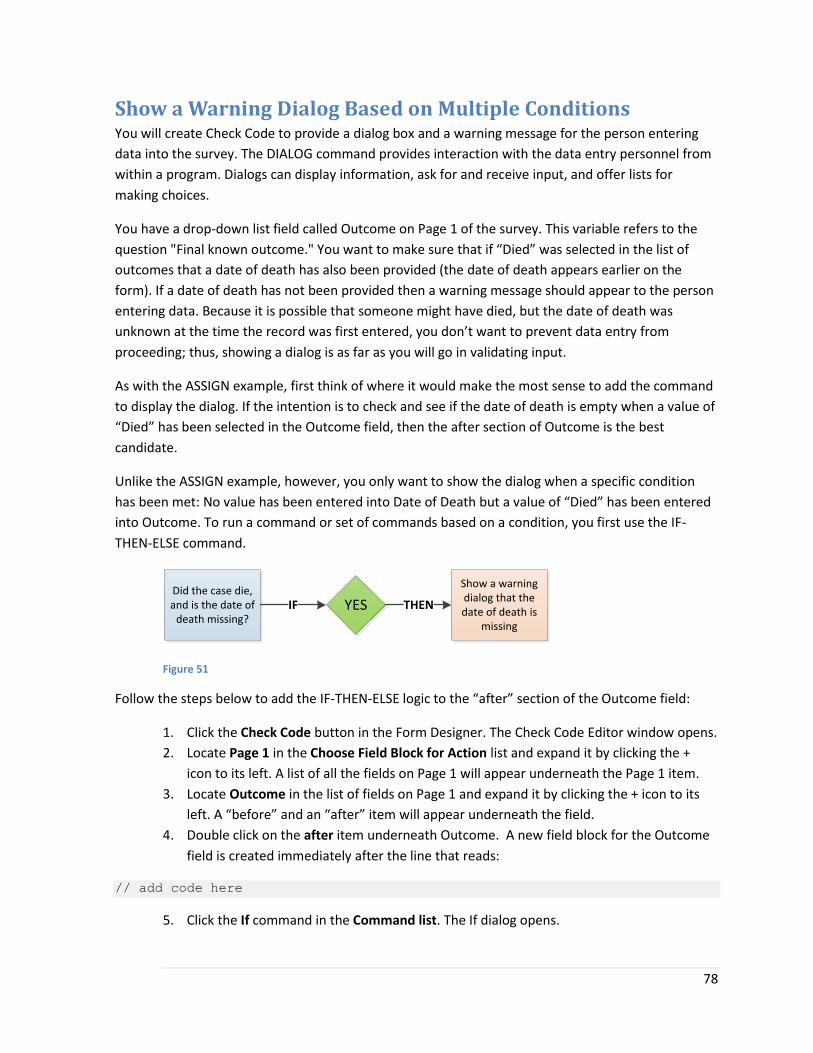
78
Show a Warning Dialog Based on Multiple Conditions You will create Check Code to provide a dialog box and a warning message for the person entering
data into the survey. The DIALOG command provides interaction with the data entry personnel from
within a program. Dialogs can display information, ask for and receive input, and offer lists for
making choices.
You have a drop-down list field called Outcome on Page 1 of the survey. This variable refers to the
question "Final known outcome." You want to make sure that if “Died” was selected in the list of
outcomes that a date of death has also been provided (the date of death appears earlier on the
form). If a date of death has not been provided then a warning message should appear to the person
entering data. Because it is possible that someone might have died, but the date of death was
unknown at the time the record was first entered, you don’t want to prevent data entry from
proceeding; thus, showing a dialog is as far as you will go in validating input.
As with the ASSIGN example, first think of where it would make the most sense to add the command
to display the dialog. If the intention is to check and see if the date of death is empty when a value of
“Died” has been selected in the Outcome field, then the after section of Outcome is the best
candidate.
Unlike the ASSIGN example, however, you only want to show the dialog when a specific condition
has been met: No value has been entered into Date of Death but a value of “Died” has been entered
into Outcome. To run a command or set of commands based on a condition, you first use the IF-
THEN-ELSE command.
Did the case die, and is the date of
death missing?YESIF THEN
Show a warning dialog that the date of death is
missing
Figure 51
Follow the steps below to add the IF-THEN-ELSE logic to the “after” section of the Outcome field:
1. Click the Check Code button in the Form Designer. The Check Code Editor window opens.
2. Locate Page 1 in the Choose Field Block for Action list and expand it by clicking the +
icon to its left. A list of all the fields on Page 1 will appear underneath the Page 1 item.
3. Locate Outcome in the list of fields on Page 1 and expand it by clicking the + icon to its
left. A “before” and an “after” item will appear underneath the field.
4. Double click on the after item underneath Outcome. A new field block for the Outcome
field is created immediately after the line that reads:
// add code here
5. Click the If command in the Command list. The If dialog opens.
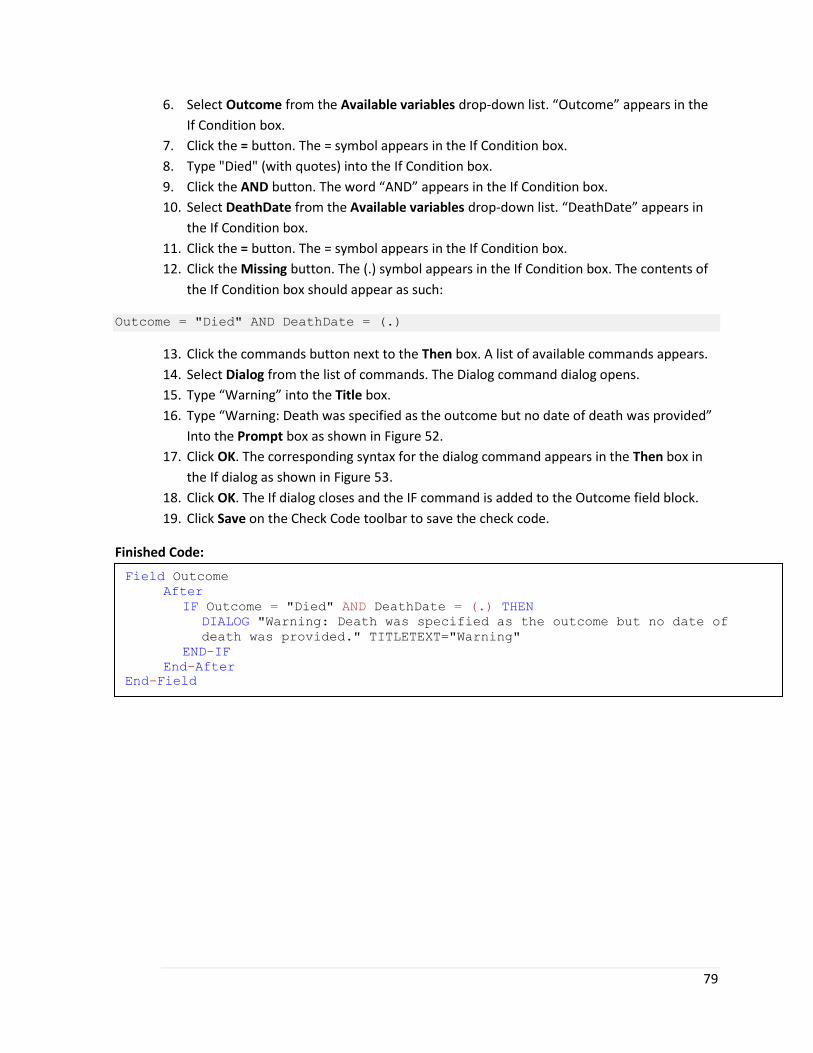
79
6. Select Outcome from the Available variables drop-down list. “Outcome” appears in the
If Condition box.
7. Click the = button. The = symbol appears in the If Condition box.
8. Type "Died" (with quotes) into the If Condition box.
9. Click the AND button. The word “AND” appears in the If Condition box.
10. Select DeathDate from the Available variables drop-down list. “DeathDate” appears in
the If Condition box.
11. Click the = button. The = symbol appears in the If Condition box.
12. Click the Missing button. The (.) symbol appears in the If Condition box. The contents of
the If Condition box should appear as such:
Outcome = "Died" AND DeathDate = (.)
13. Click the commands button next to the Then box. A list of available commands appears.
14. Select Dialog from the list of commands. The Dialog command dialog opens.
15. Type “Warning” into the Title box.
16. Type “Warning: Death was specified as the outcome but no date of death was provided”
Into the Prompt box as shown in Figure 52.
17. Click OK. The corresponding syntax for the dialog command appears in the Then box in
the If dialog as shown in Figure 53.
18. Click OK. The If dialog closes and the IF command is added to the Outcome field block.
19. Click Save on the Check Code toolbar to save the check code.
Finished Code:
Field Outcome
After
IF Outcome = "Died" AND DeathDate = (.) THEN
DIALOG "Warning: Death was specified as the outcome but no date of
death was provided." TITLETEXT="Warning"
END-IF
End-After
End-Field
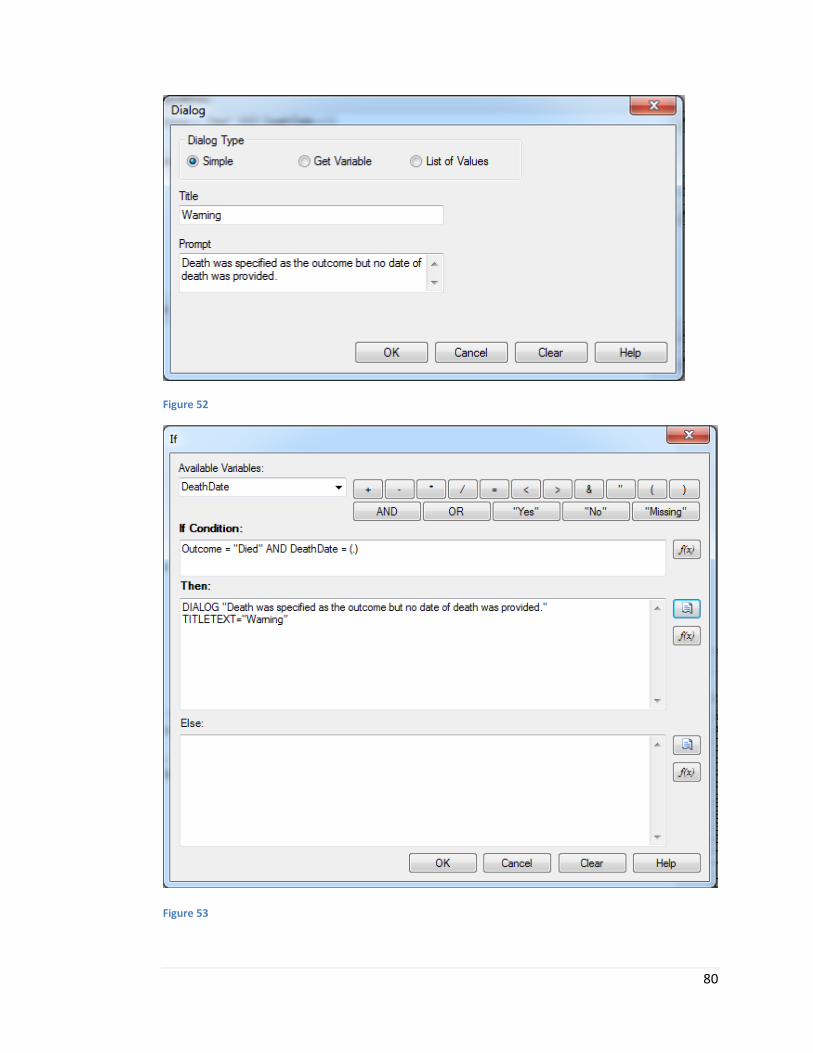
80
Figure 52
Figure 53
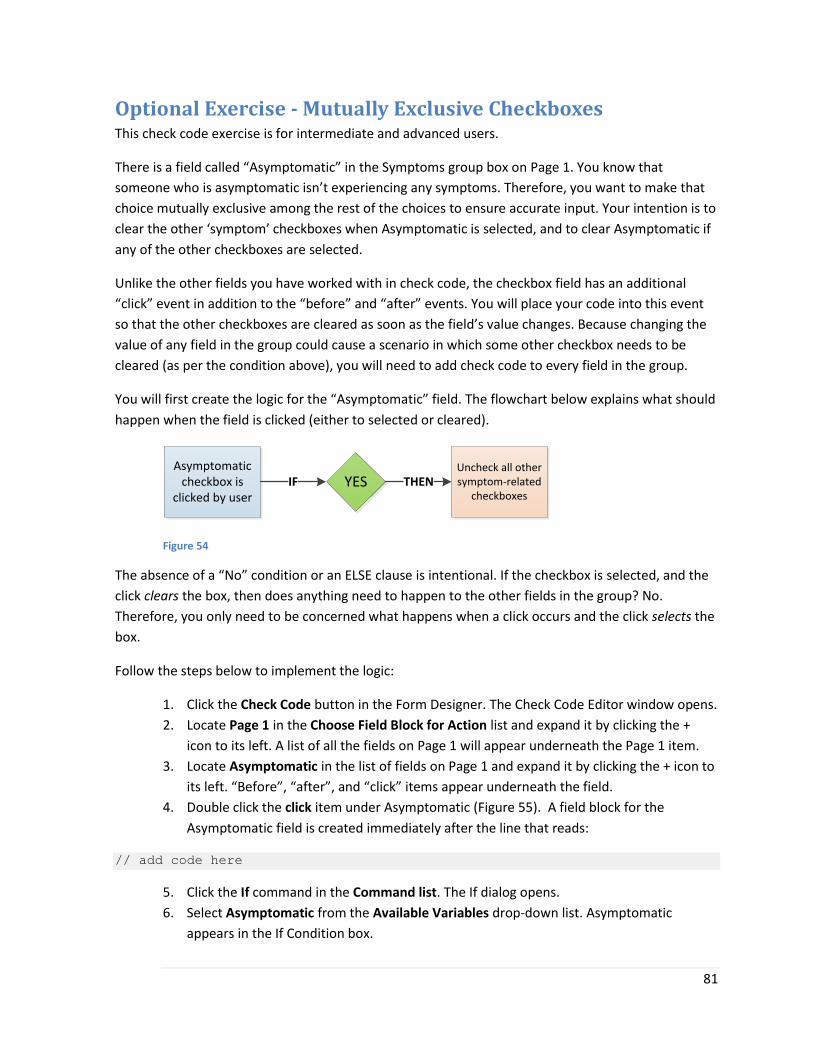
81
Optional Exercise - Mutually Exclusive Checkboxes This check code exercise is for intermediate and advanced users.
There is a field called “Asymptomatic” in the Symptoms group box on Page 1. You know that
someone who is asymptomatic isn’t experiencing any symptoms. Therefore, you want to make that
choice mutually exclusive among the rest of the choices to ensure accurate input. Your intention is to
clear the other ‘symptom’ checkboxes when Asymptomatic is selected, and to clear Asymptomatic if
any of the other checkboxes are selected.
Unlike the other fields you have worked with in check code, the checkbox field has an additional
“click” event in addition to the “before” and “after” events. You will place your code into this event
so that the other checkboxes are cleared as soon as the field’s value changes. Because changing the
value of any field in the group could cause a scenario in which some other checkbox needs to be
cleared (as per the condition above), you will need to add check code to every field in the group.
You will first create the logic for the “Asymptomatic” field. The flowchart below explains what should
happen when the field is clicked (either to selected or cleared).
Asymptomatic checkbox is
clicked by user
Uncheck all other symptom-related
checkboxesIF YES THEN
Figure 54
The absence of a “No” condition or an ELSE clause is intentional. If the checkbox is selected, and the
click clears the box, then does anything need to happen to the other fields in the group? No.
Therefore, you only need to be concerned what happens when a click occurs and the click selects the
box.
Follow the steps below to implement the logic:
1. Click the Check Code button in the Form Designer. The Check Code Editor window opens.
2. Locate Page 1 in the Choose Field Block for Action list and expand it by clicking the +
icon to its left. A list of all the fields on Page 1 will appear underneath the Page 1 item.
3. Locate Asymptomatic in the list of fields on Page 1 and expand it by clicking the + icon to
its left. “Before”, “after”, and “click” items appear underneath the field.
4. Double click the click item under Asymptomatic (Figure 55). A field block for the
Asymptomatic field is created immediately after the line that reads:
// add code here
5. Click the If command in the Command list. The If dialog opens.
6. Select Asymptomatic from the Available Variables drop-down list. Asymptomatic
appears in the If Condition box.

82
7. Click the = button. The = sign appears in the If Condition box.
8. Click the Yes button. The (+) symbol appears in the If Condition box.
9. Click the command icon next to the THEN box. A list of available commands appears.
10. Select Assign from the list of commands. The Assign dialog opens.
11. Select AbdominalPain from the AssignVariable drop-down list.
12. Click the “No” button. The (-) symbol appears in the = Expression box.
13. Click OK. The following syntax appears in the THEN box in the If dialog:
ASSIGN AbdominalPain = (-)
The code you’ve just created will clear the AbdominalPain checkbox when Asymptomatic is selected.
However, there are other checkboxes in the group that also need to be cleared. Follow steps 10
through 13 for each of the following fields, replacing “AbdominalPain” where appropriate:
Diarrhea
Fever
Nausea
Vomiting
OtherSymptom
When you’re done, the IF command dialog window should look like that shown in Figure 56.
14. Click OK. The If dialog closes and the IF command is added to the Asymptomatic field
block.
Now, when Asymptomatic is checked, all of the other checkboxes will be unchecked. However, you
still need to add code to automatically uncheck Asymptomatic when any other symptom is checked.
Follow the steps below to do this:
1. Click the Check Code button in the Form Designer. The Check Code Editor window opens.
2. Locate Page 1 in the Choose Field Block for Action list and expand it by clicking the +
icon to its left. A list of all the fields onPage 1 will appear underneath the Page 1 item.
3. Locate AbdominalPain in the list of fields on Page 1 and expand it by clicking the + icon
to its left. “Before”, “after”, and “click” items appear underneath the field.
4. Double click the click item under AbdominalPain. A field block for the AbdominalPain
field is created immediately after the line that reads:
// add code here
5. Click the If command in the Command list. The If dialog opens.
6. Select AbdominalPain from the Available Variables drop-down list. AbdominalPain
appears in the If Condition box.
7. Click the = button. The = sign appears in the If Condition box.
8. Click the Yes button. The (+) symbol appears in the If Condition box.
9. Click the command icon next to the THEN box. A list of available commands appears.

83
10. Select Assign from the list of commands. The Assign dialog opens.
11. Select Asymptomatic from the AssignVariable drop-down list.
12. Click the “No” button. The (-) symbol appears in the = Expression box.
13. Click OK. The following syntax appears in the THEN box in the If dialog as shown in Figure
57:
ASSIGN Asymptomatic = (-)
14. Click OK. The If dialog closes and the IF command is added to the AbdominalPain field
block.
Now repeat steps 1 through 13 for each of the following fields, replacing “AbdominalPain” as
appropriate:
Diarrhea
Fever
Nausea
Vomiting
OtherSymptom
You now have a group of checkboxes with mutual exclusivity.
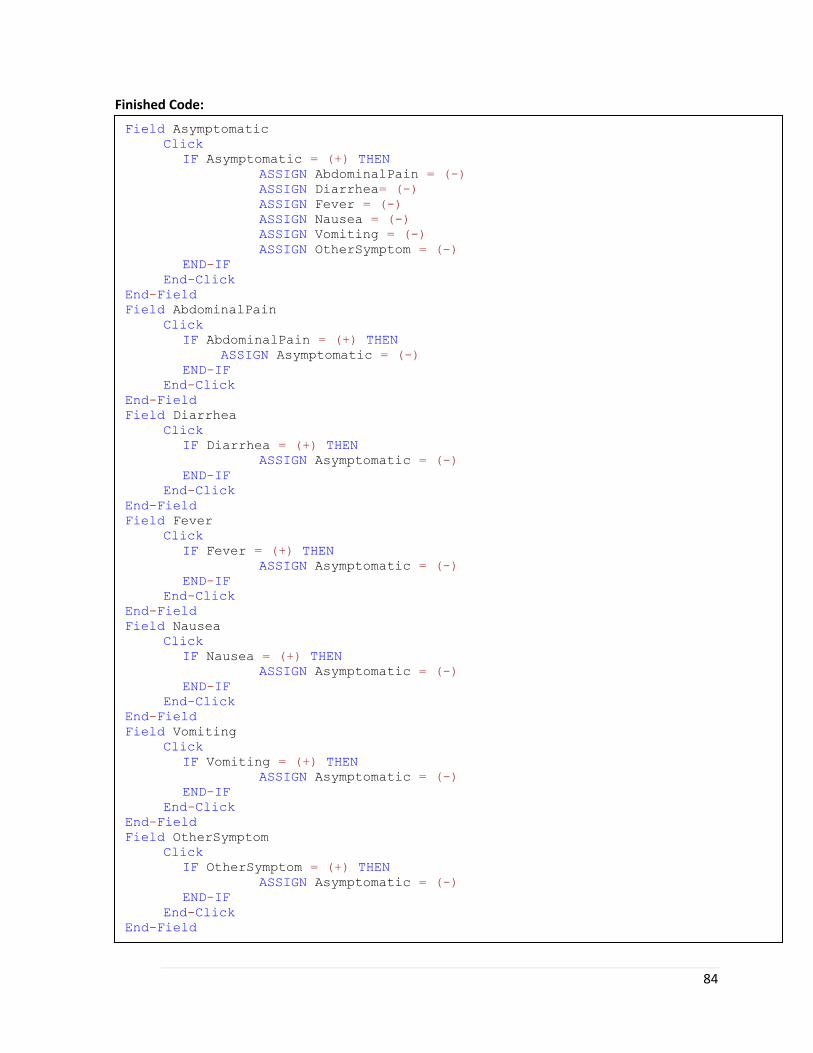
84
Finished Code:
Field Asymptomatic
Click
IF Asymptomatic = (+) THEN
ASSIGN AbdominalPain = (-)
ASSIGN Diarrhea= (-)
ASSIGN Fever = (-)
ASSIGN Nausea = (-)
ASSIGN Vomiting = (-)
ASSIGN OtherSymptom = (-)
END-IF
End-Click
End-Field
Field AbdominalPain
Click
IF AbdominalPain = (+) THEN
ASSIGN Asymptomatic = (-)
END-IF
End-Click
End-Field
Field Diarrhea
Click
IF Diarrhea = (+) THEN
ASSIGN Asymptomatic = (-)
END-IF
End-Click
End-Field
Field Fever
Click
IF Fever = (+) THEN
ASSIGN Asymptomatic = (-)
END-IF
End-Click
End-Field
Field Nausea
Click
IF Nausea = (+) THEN
ASSIGN Asymptomatic = (-)
END-IF
End-Click
End-Field
Field Vomiting
Click
IF Vomiting = (+) THEN
ASSIGN Asymptomatic = (-)
END-IF
End-Click
End-Field
Field OtherSymptom
Click
IF OtherSymptom = (+) THEN
ASSIGN Asymptomatic = (-)
END-IF
End-Click
End-Field
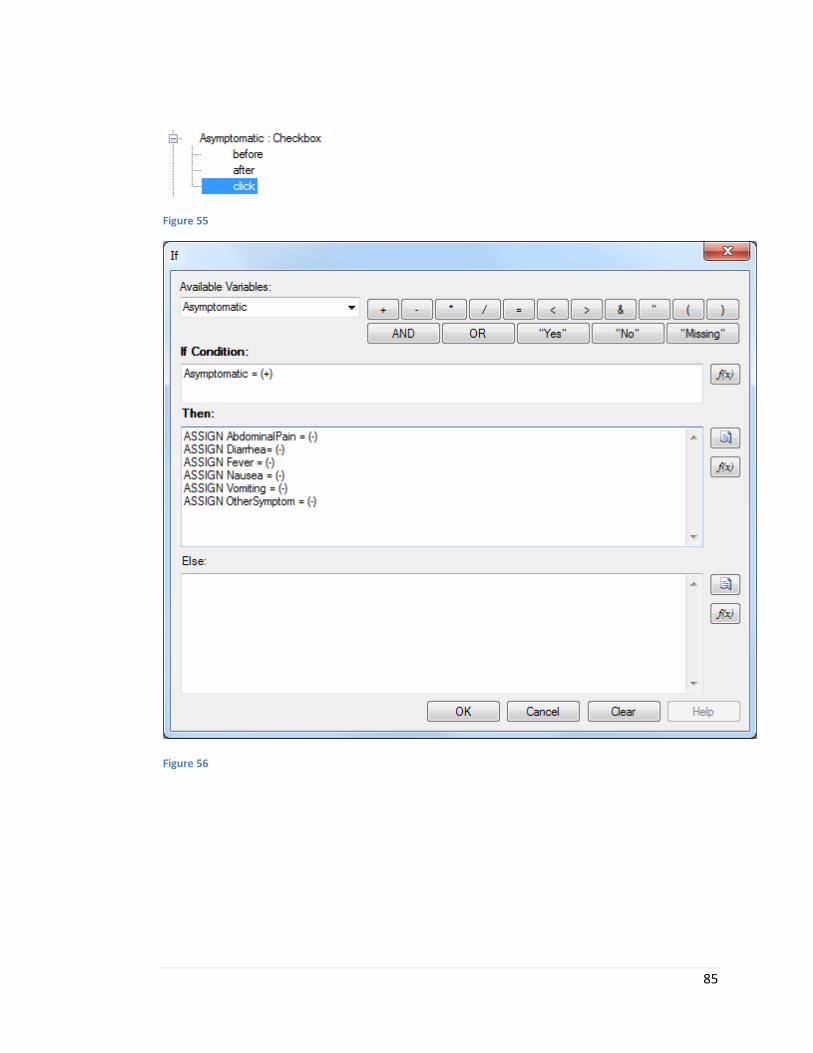
85
Figure 55
Figure 56
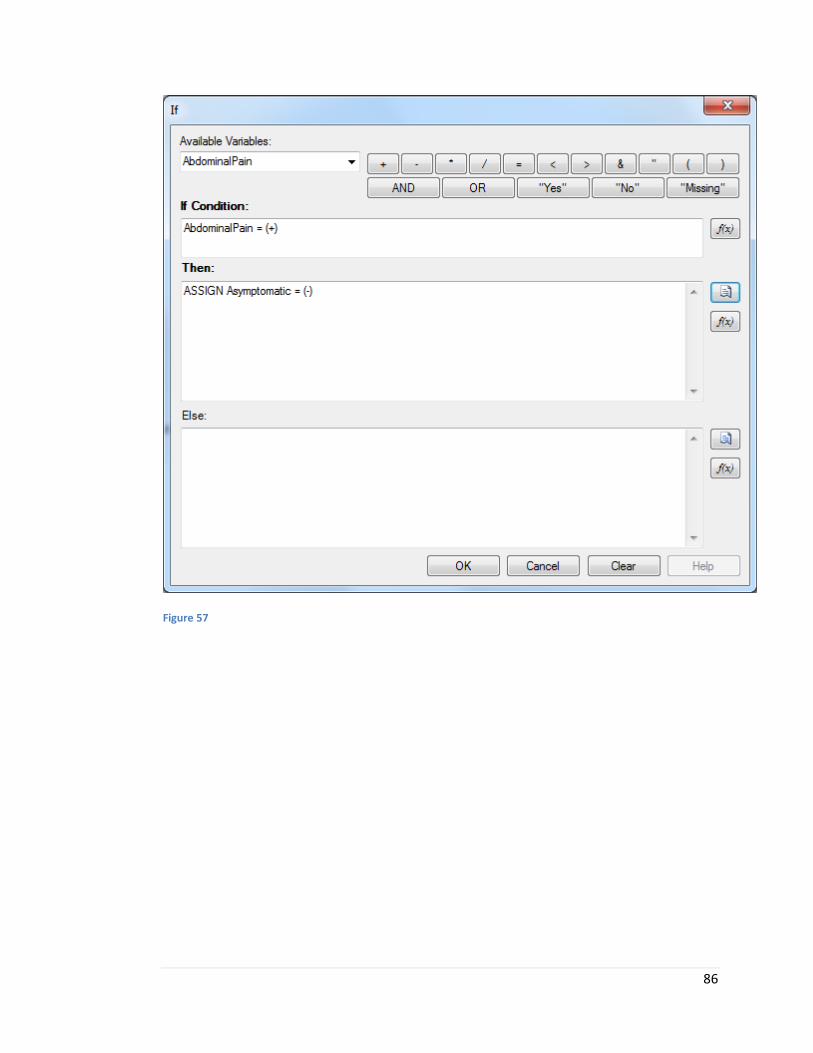
86
Figure 57
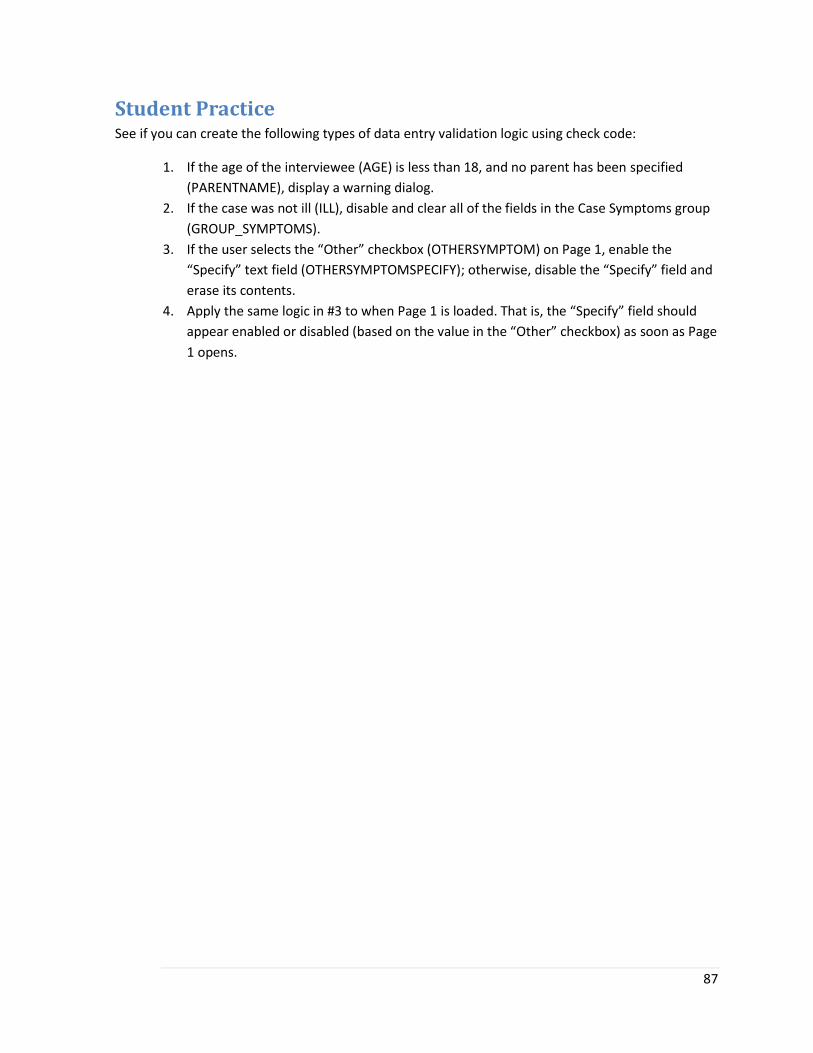
87
Student Practice See if you can create the following types of data entry validation logic using check code:
1. If the age of the interviewee (AGE) is less than 18, and no parent has been specified
(PARENTNAME), display a warning dialog.
2. If the case was not ill (ILL), disable and clear all of the fields in the Case Symptoms group
(GROUP_SYMPTOMS).
3. If the user selects the “Other” checkbox (OTHERSYMPTOM) on Page 1, enable the
“Specify” text field (OTHERSYMPTOMSPECIFY); otherwise, disable the “Specify” field and
erase its contents.
4. Apply the same logic in #3 to when Page 1 is loaded. That is, the “Specify” field should
appear enabled or disabled (based on the value in the “Other” checkbox) as soon as Page
1 opens.

88
Best Practices using Epi Info™ 7 Check Code Check Code is fairly straightforward, but does have a number of caveats that if not kept in mind, can
make Check Code challenging. This section is intended to address some of these common issues.
Use the DISABLE command to implement skip patterns As noted in this lesson, disabling all fields in-between the one that should be skipped from and the
one that should be skipped to is an effective way of implementing a skip pattern. It has the added
benefit that the user cannot click into a field that has been skipped and fill it out. An alternative to
using the DISABLE command is the GOTO command. The GOTO command will direct the cursor to a
specific field. Due to weaknesses in the implementation of the GOTO command, its use is not
recommended except for advanced users. Make sure to include a CLEAR command along with the
DISABLE command in order to set any values to null if the group field is disabled.
Assign values using proper syntax depending on the field type When assigning a value to a field, ensure that the value is formatted correctly. Consider the following
scenarios using the ASSIGN command:
1. Assign the ‘Age’ field (numeric field type) the value 24
2. Assign the ‘Ill’ field (Yes/No field type) the value No
3. Assign the ‘AteChicken’ field (checkbox field type) the value Yes
4. Assign the ‘DateOfInterview’ field (Date field type) the value 5/5/2012
5. Assign the ‘CaseStatus’ field (legal values field type) the value “Confirmed”
6. Assign the ‘Ethnicity’ field (comment legal value field type) the value “H” for Hispanic.
The above scenarios would appear as such in the Check Code editor:
1. ASSIGN Age = 24
2. ASSIGN Ill = (-)
3. ASSIGN AteChicken = (+)
4. ASSIGN DateOfInterview = 5/5/2012
5. ASSIGN CaseStatus = "Confirmed"
6. ASSIGN Ethnicity = "H"
For the number and date field types, no quotes are required around the value being assigned. Text
fields (a legal values field is a text field) require quotes around the value. Yes/No fields and
checkboxes have special values representing their true and false responses, (+) and (-), respectively.

89
Summary During this lesson, you were introduced to the concept of creating data entry validation logic using
the Check Code Editor in the Form Designer module. You can now:
Navigate the Check Code editor.
Use the ASSIGN command.
Use the DIALOG command.
Disable and enable fields based on conditions.
Use the YEARS and SYSTEMDATE functions.
Q&A Q: Can I calculate the age in days instead of years?
A: Yes. There is a function called DAYS that, when passed two date values, returns the difference in
whole days.
Q: Is there a way to calculate the epidemiological week based on a given date?
A: Yes. There is a function called EPIWEEK that, when passed a single date value, returns the
corresponding epidemiological week value.
Quiz The following questions will see how much you have learned about using the Check Code editor.
Questions 1. Check Code can run before or after values are entered in a variable.
a. True
b. False
2. Using the Program Editor, you can create Check Code that will run across pages or records.
a. True
b. False
3. Which function could be used to create an age variable based on two different dates?
a. ROUND
b. YEARS
c. TXTTONUM
4. How does a “true” response for both a checkbox field and Yes/No field appear in check code?
a. (+)
b. (-)
c. Yes
d. True
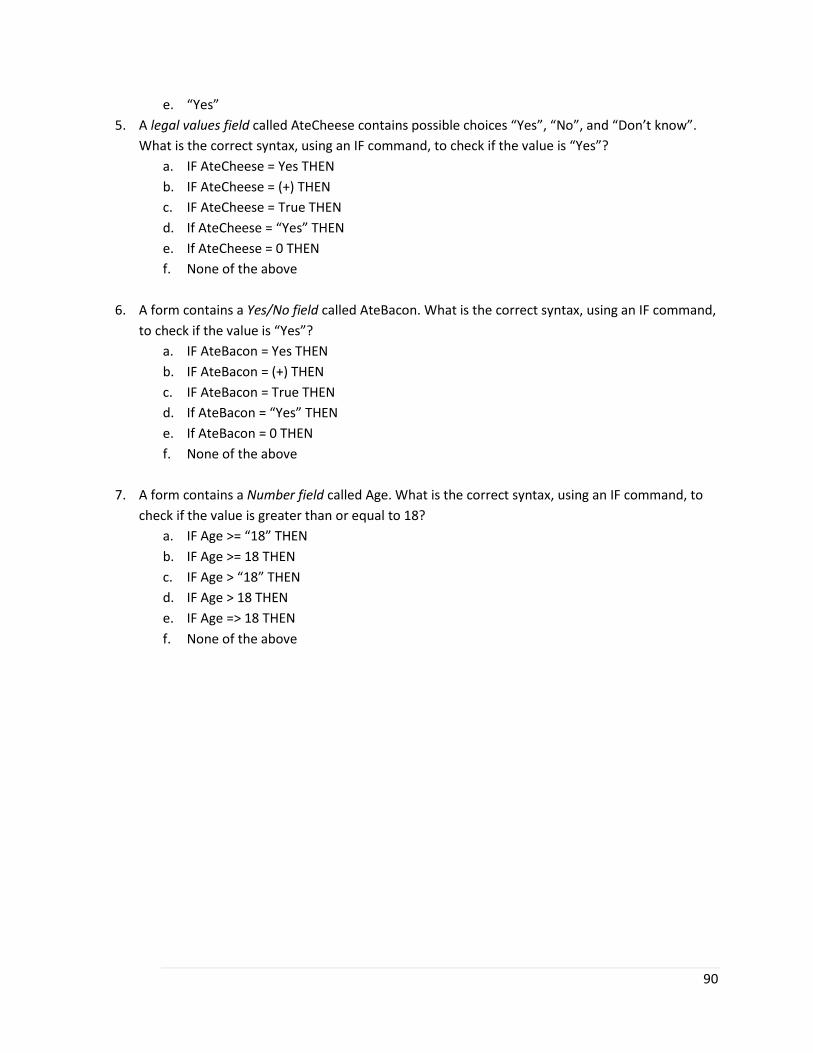
90
e. “Yes”
5. A legal values field called AteCheese contains possible choices “Yes”, “No”, and “Don’t know”.
What is the correct syntax, using an IF command, to check if the value is “Yes”?
a. IF AteCheese = Yes THEN
b. IF AteCheese = (+) THEN
c. IF AteCheese = True THEN
d. If AteCheese = “Yes” THEN
e. If AteCheese = 0 THEN
f. None of the above
6. A form contains a Yes/No field called AteBacon. What is the correct syntax, using an IF command,
to check if the value is “Yes”?
a. IF AteBacon = Yes THEN
b. IF AteBacon = (+) THEN
c. IF AteBacon = True THEN
d. If AteBacon = “Yes” THEN
e. If AteBacon = 0 THEN
f. None of the above
7. A form contains a Number field called Age. What is the correct syntax, using an IF command, to
check if the value is greater than or equal to 18?
a. IF Age >= “18” THEN
b. IF Age >= 18 THEN
c. IF Age > “18” THEN
d. IF Age > 18 THEN
e. IF Age => 18 THEN
f. None of the above

91
Answers 1. A
2. A
3. B
4. A
5. D
6. B
7. B

92
This page intentionally blank.
93
Lesson 3
Entering Data
This lesson introduces you to entering data using the Enter module of Epi Info™ 7. You will learn how
to enter data for the sample survey, navigate the survey you created in Form Designer, merge data
from other investigators, and enter data for the sample survey provided. You will also learn how to
search for records from the Enter module. When you enter records in the survey, you populate the
data table with information to be used for later analyses.
In Lesson 1, you created an electronic version of the survey you will use to collect data to aid in your
Salmonella outbreak investigation. In Lesson 2, Check Code was added to speed the data entry
process and act as a quality control measure. In Lesson 3, you will begin entering data about the
attendees from the company picnic. Data entered in this lesson will be used to create statistics and
develop a picture of the population of those who attended the event.
Time to complete: 1 hour (Beginner)
BEFORE YOU BEGIN
Complete Lesson 1
Complete Lesson 2
FIVE GOALS
1. Learn how to navigate the Enter Data module.
2. Enter four records.
3. Create a line list.
4. Import data from an Epi Info™ 7 data package.
5. Create an exposure relationship.
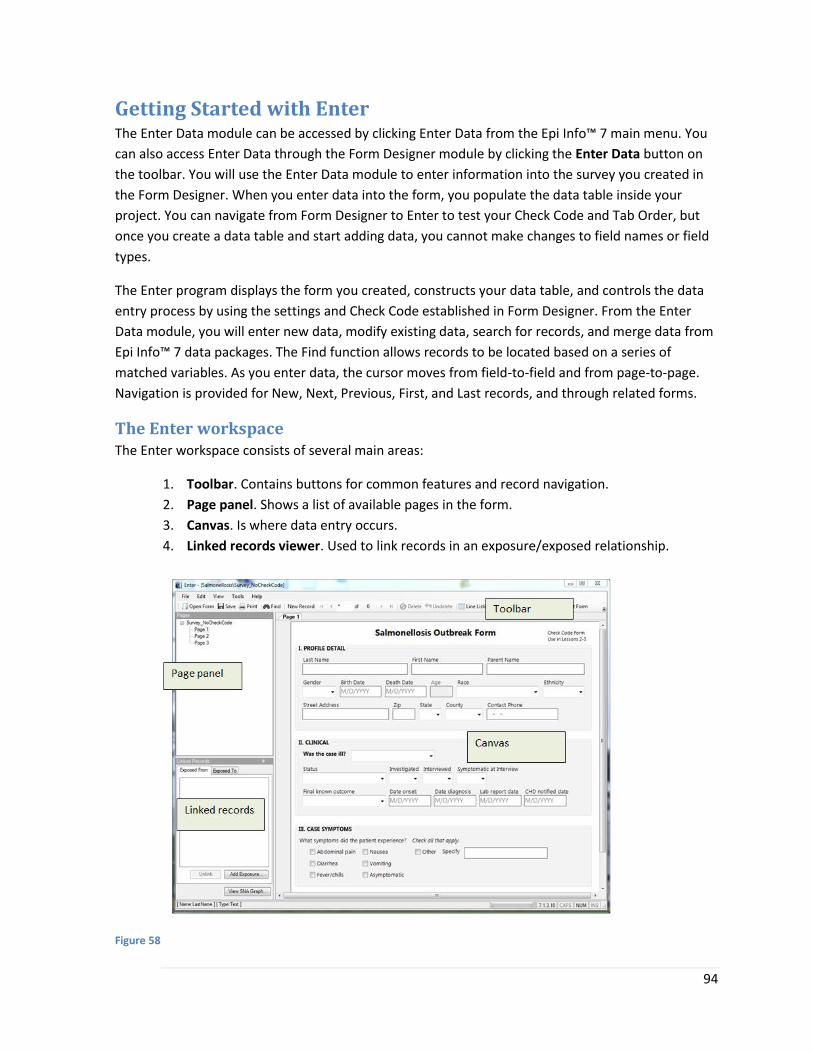
94
Getting Started with Enter The Enter Data module can be accessed by clicking Enter Data from the Epi Info™ 7 main menu. You
can also access Enter Data through the Form Designer module by clicking the Enter Data button on
the toolbar. You will use the Enter Data module to enter information into the survey you created in
the Form Designer. When you enter data into the form, you populate the data table inside your
project. You can navigate from Form Designer to Enter to test your Check Code and Tab Order, but
once you create a data table and start adding data, you cannot make changes to field names or field
types.
The Enter program displays the form you created, constructs your data table, and controls the data
entry process by using the settings and Check Code established in Form Designer. From the Enter
Data module, you will enter new data, modify existing data, search for records, and merge data from
Epi Info™ 7 data packages. The Find function allows records to be located based on a series of
matched variables. As you enter data, the cursor moves from field-to-field and from page-to-page.
Navigation is provided for New, Next, Previous, First, and Last records, and through related forms.
The Enter workspace The Enter workspace consists of several main areas:
1. Toolbar. Contains buttons for common features and record navigation.
2. Page panel. Shows a list of available pages in the form.
3. Canvas. Is where data entry occurs.
4. Linked records viewer. Used to link records in an exposure/exposed relationship.
Figure 58
95
Key features The Enter module has the ability to:
Create new records and edit or soft-delete existing records
Display a data dictionary
Display an interactive line list, an HTML line list, or a Microsoft Excel-based line list of the
entered data
Navigate through records or find a specific record
Print data entry forms, both with and without showing any data
Note: Printing a form with data will work only on Windows Vista, Windows 7, and later versions.
Merge data from other Epi Info™ 7 forms, Epi Info™ 7 data packages, the Epi Info™
mobile application for Android devices, or from the Epi Info™ web survey application
Create Epi Info™ 7 data packages
Create exposure relationships intended for use in contact tracing
Show social network analysis graphs based on exposure relationships
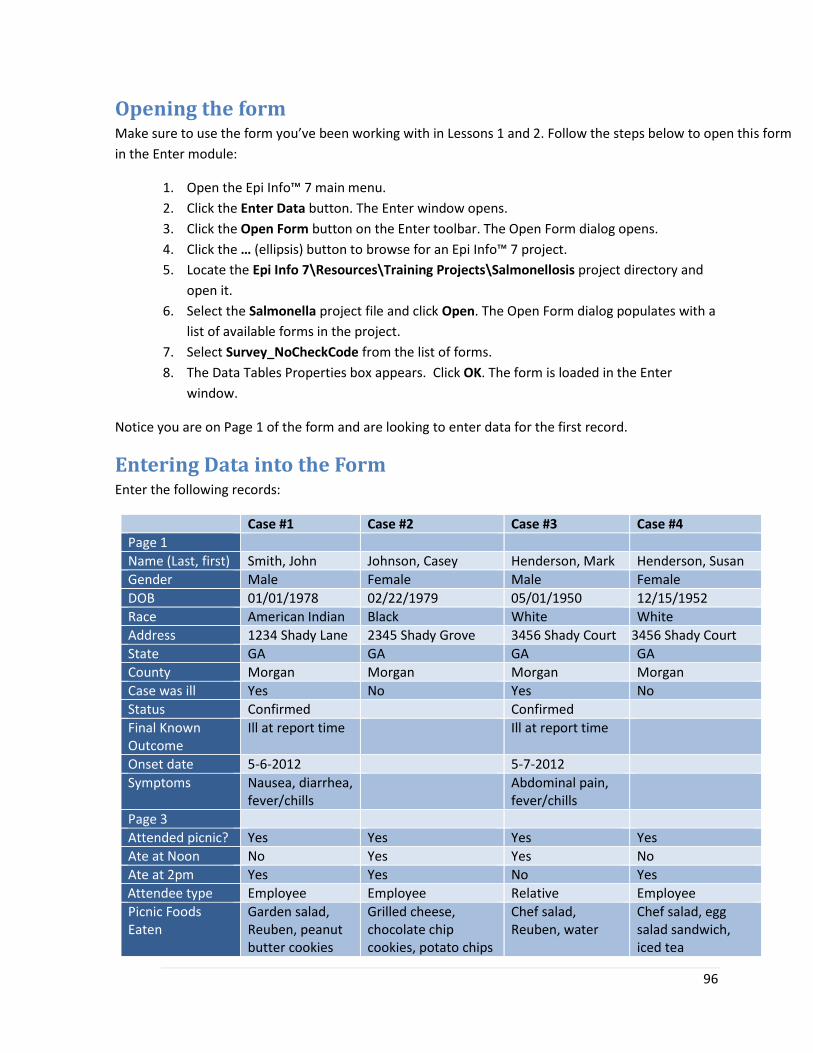
96
Opening the form Make sure to use the form you’ve been working with in Lessons 1 and 2. Follow the steps below to open this form
in the Enter module:
1. Open the Epi Info™ 7 main menu.
2. Click the Enter Data button. The Enter window opens.
3. Click the Open Form button on the Enter toolbar. The Open Form dialog opens.
4. Click the … (ellipsis) button to browse for an Epi Info™ 7 project.
5. Locate the Epi Info 7\Resources\Training Projects\Salmonellosis project directory and
open it.
6. Select the Salmonella project file and click Open. The Open Form dialog populates with a
list of available forms in the project.
7. Select Survey_NoCheckCode from the list of forms.
8. The Data Tables Properties box appears. Click OK. The form is loaded in the Enter
window.
Notice you are on Page 1 of the form and are looking to enter data for the first record.
Entering Data into the Form Enter the following records:
Case #1 Case #2 Case #3 Case #4
Page 1
Name (Last, first) Smith, John Johnson, Casey Henderson, Mark Henderson, Susan
Gender Male Female Male Female
DOB 01/01/1978 02/22/1979 05/01/1950 12/15/1952
Race American Indian Black White White
Address 1234 Shady Lane 2345 Shady Grove 3456 Shady Court 345 3456 Shady Court
State GA GA GA GA
County Morgan Morgan Morgan Morgan
Case was ill Yes No Yes No
Status Confirmed Confirmed
Final Known Outcome
Ill at report time Ill at report time
Onset date 5-6-2012 5-7-2012
Symptoms Nausea, diarrhea, fever/chills
Abdominal pain, fever/chills
Page 3
Attended picnic? Yes Yes Yes Yes
Ate at Noon No Yes Yes No
Ate at 2pm Yes Yes No Yes
Attendee type Attendee type Employee Employee Relative Employee
Picnic Foods Eaten
Garden salad, Reuben, peanut butter cookies
Grilled cheese, chocolate chip cookies, potato chips
Chef salad, Reuben, water
Chef salad, egg salad sandwich, iced tea
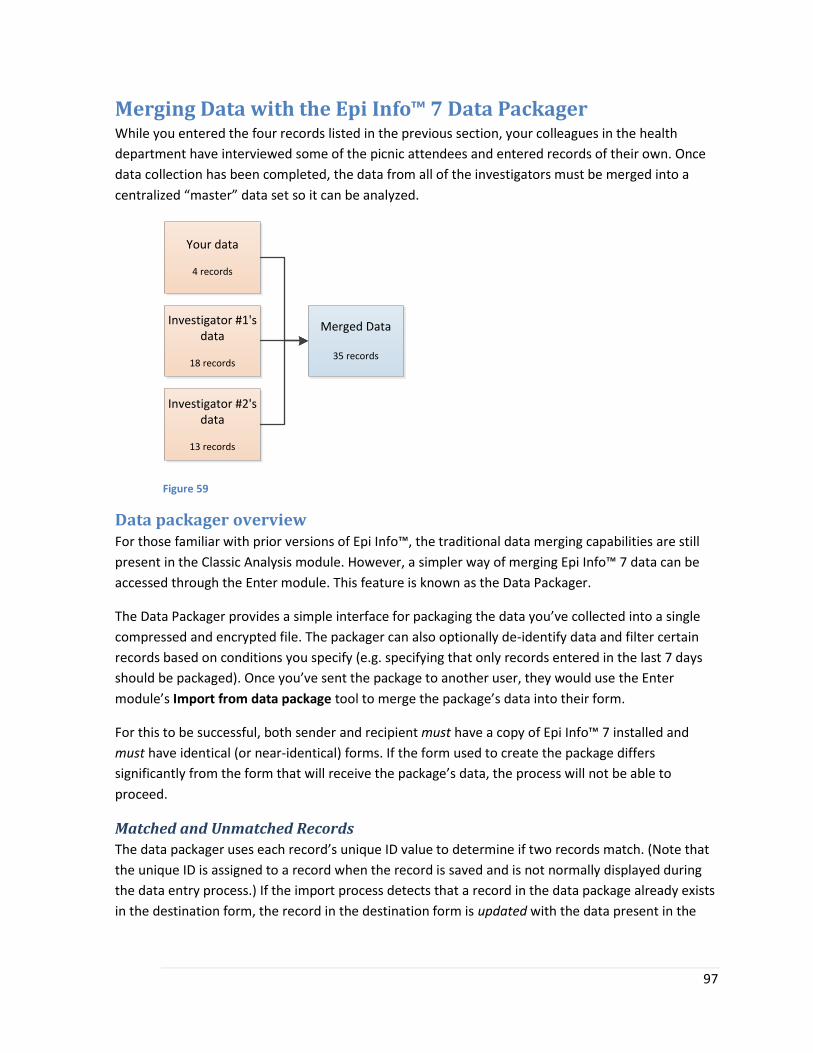
97
Merging Data with the Epi Info™ 7 Data Packager While you entered the four records listed in the previous section, your colleagues in the health
department have interviewed some of the picnic attendees and entered records of their own. Once
data collection has been completed, the data from all of the investigators must be merged into a
centralized “master” data set so it can be analyzed.
Your data
4 records
Investigator #1's data
18 records
Investigator #2's data
13 records
Merged Data
35 records
Figure 59
Data packager overview For those familiar with prior versions of Epi Info™, the traditional data merging capabilities are still
present in the Classic Analysis module. However, a simpler way of merging Epi Info™ 7 data can be
accessed through the Enter module. This feature is known as the Data Packager.
The Data Packager provides a simple interface for packaging the data you’ve collected into a single
compressed and encrypted file. The packager can also optionally de-identify data and filter certain
records based on conditions you specify (e.g. specifying that only records entered in the last 7 days
should be packaged). Once you’ve sent the package to another user, they would use the Enter
module’s Import from data package tool to merge the package’s data into their form.
For this to be successful, both sender and recipient must have a copy of Epi Info™ 7 installed and
must have identical (or near-identical) forms. If the form used to create the package differs
significantly from the form that will receive the package’s data, the process will not be able to
proceed.
Matched and Unmatched Records
The data packager uses each record’s unique ID value to determine if two records match. (Note that
the unique ID is assigned to a record when the record is saved and is not normally displayed during
the data entry process.) If the import process detects that a record in the data package already exists
in the destination form, the record in the destination form is updated with the data present in the
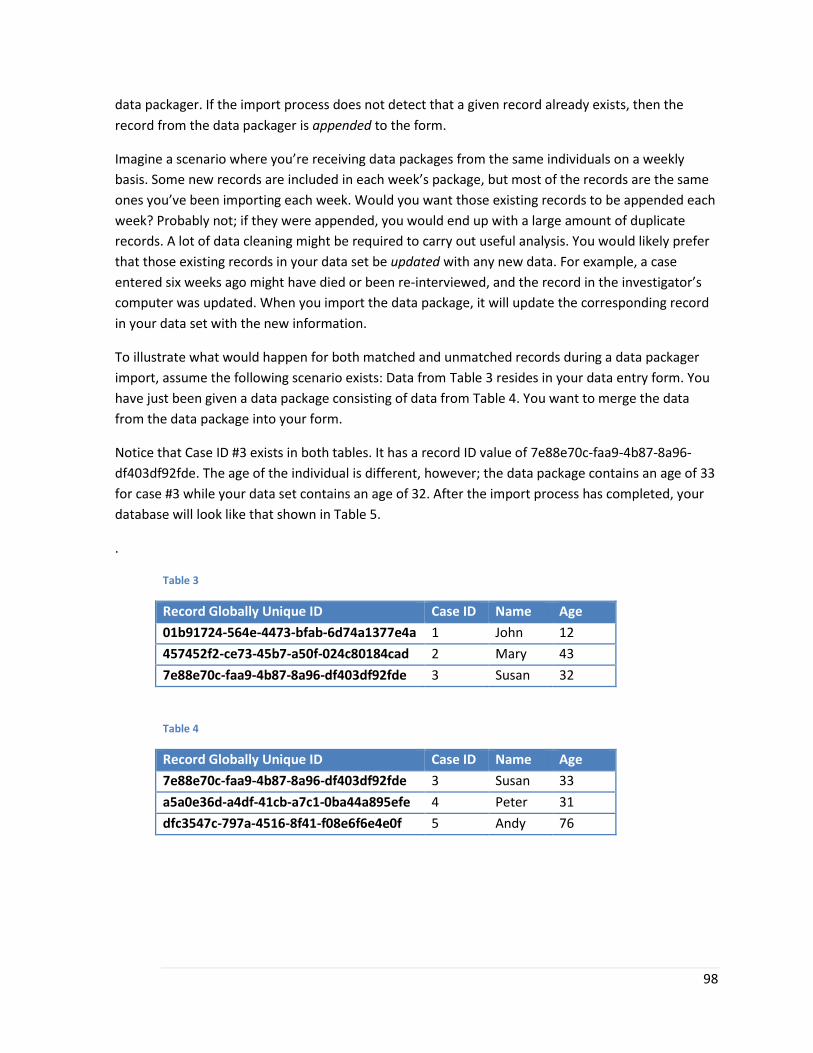
98
data packager. If the import process does not detect that a given record already exists, then the
record from the data packager is appended to the form.
Imagine a scenario where you’re receiving data packages from the same individuals on a weekly
basis. Some new records are included in each week’s package, but most of the records are the same
ones you’ve been importing each week. Would you want those existing records to be appended each
week? Probably not; if they were appended, you would end up with a large amount of duplicate
records. A lot of data cleaning might be required to carry out useful analysis. You would likely prefer
that those existing records in your data set be updated with any new data. For example, a case
entered six weeks ago might have died or been re-interviewed, and the record in the investigator’s
computer was updated. When you import the data package, it will update the corresponding record
in your data set with the new information.
To illustrate what would happen for both matched and unmatched records during a data packager
import, assume the following scenario exists: Data from Table 3 resides in your data entry form. You
have just been given a data package consisting of data from Table 4. You want to merge the data
from the data package into your form.
Notice that Case ID #3 exists in both tables. It has a record ID value of 7e88e70c-faa9-4b87-8a96-
df403df92fde. The age of the individual is different, however; the data package contains an age of 33
for case #3 while your data set contains an age of 32. After the import process has completed, your
database will look like that shown in Table 5.
.
Table 3
Record Globally Unique ID Case ID Name Age
01b91724-564e-4473-bfab-6d74a1377e4a 1 John 12
457452f2-ce73-45b7-a50f-024c80184cad 2 Mary 43
7e88e70c-faa9-4b87-8a96-df403df92fde 3 Susan 32
Table 4
Record Globally Unique ID Case ID Name Age
7e88e70c-faa9-4b87-8a96-df403df92fde 3 Susan 33
a5a0e36d-a4df-41cb-a7c1-0ba44a895efe 4 Peter 31
dfc3547c-797a-4516-8f41-f08e6f6e4e0f 5 Andy 76
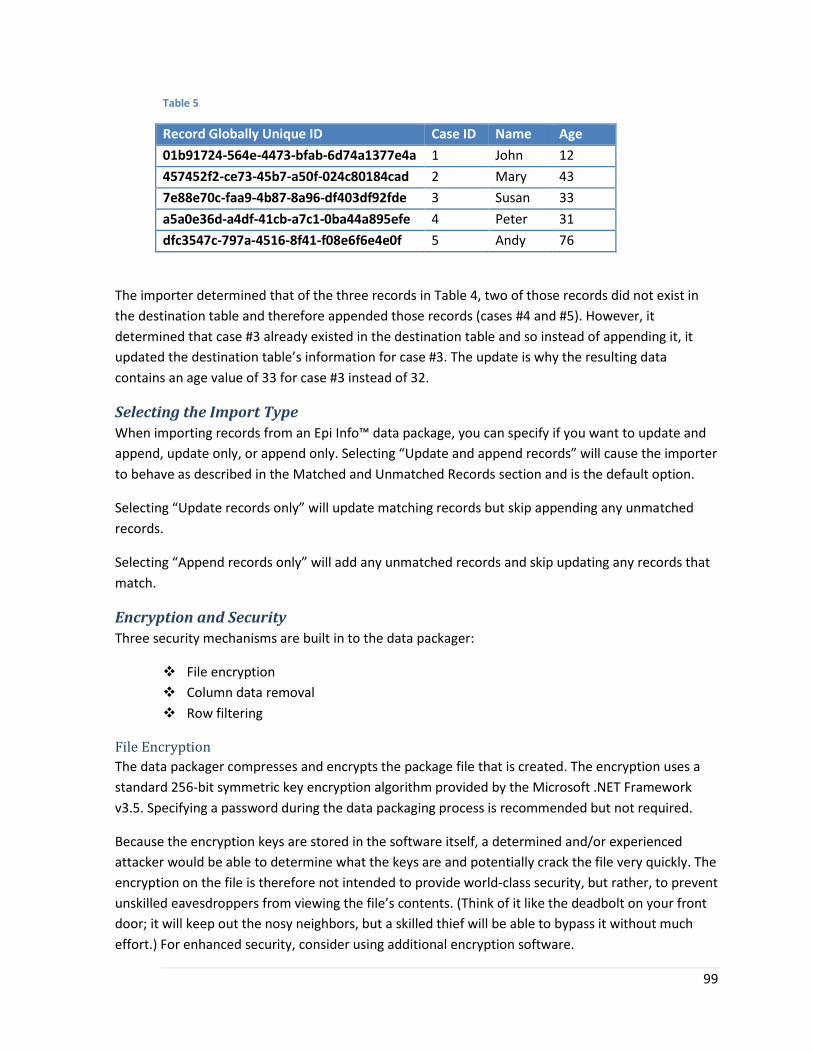
99
Table 5
Record Globally Unique ID Case ID Name Age
01b91724-564e-4473-bfab-6d74a1377e4a 1 John 12
457452f2-ce73-45b7-a50f-024c80184cad 2 Mary 43
7e88e70c-faa9-4b87-8a96-df403df92fde 3 Susan 33
a5a0e36d-a4df-41cb-a7c1-0ba44a895efe 4 Peter 31
dfc3547c-797a-4516-8f41-f08e6f6e4e0f 5 Andy 76
The importer determined that of the three records in Table 4, two of those records did not exist in
the destination table and therefore appended those records (cases #4 and #5). However, it
determined that case #3 already existed in the destination table and so instead of appending it, it
updated the destination table’s information for case #3. The update is why the resulting data
contains an age value of 33 for case #3 instead of 32.
Selecting the Import Type
When importing records from an Epi Info™ data package, you can specify if you want to update and
append, update only, or append only. Selecting “Update and append records” will cause the importer
to behave as described in the Matched and Unmatched Records section and is the default option.
Selecting “Update records only” will update matching records but skip appending any unmatched
records.
Selecting “Append records only” will add any unmatched records and skip updating any records that
match.
Encryption and Security
Three security mechanisms are built in to the data packager:
File encryption
Column data removal
Row filtering
File Encryption
The data packager compresses and encrypts the package file that is created. The encryption uses a
standard 256-bit symmetric key encryption algorithm provided by the Microsoft .NET Framework
v3.5. Specifying a password during the data packaging process is recommended but not required.
Because the encryption keys are stored in the software itself, a determined and/or experienced
attacker would be able to determine what the keys are and potentially crack the file very quickly. The
encryption on the file is therefore not intended to provide world-class security, but rather, to prevent
unskilled eavesdroppers from viewing the file’s contents. (Think of it like the deadbolt on your front
door; it will keep out the nosy neighbors, but a skilled thief will be able to bypass it without much
effort.) For enhanced security, consider using additional encryption software.
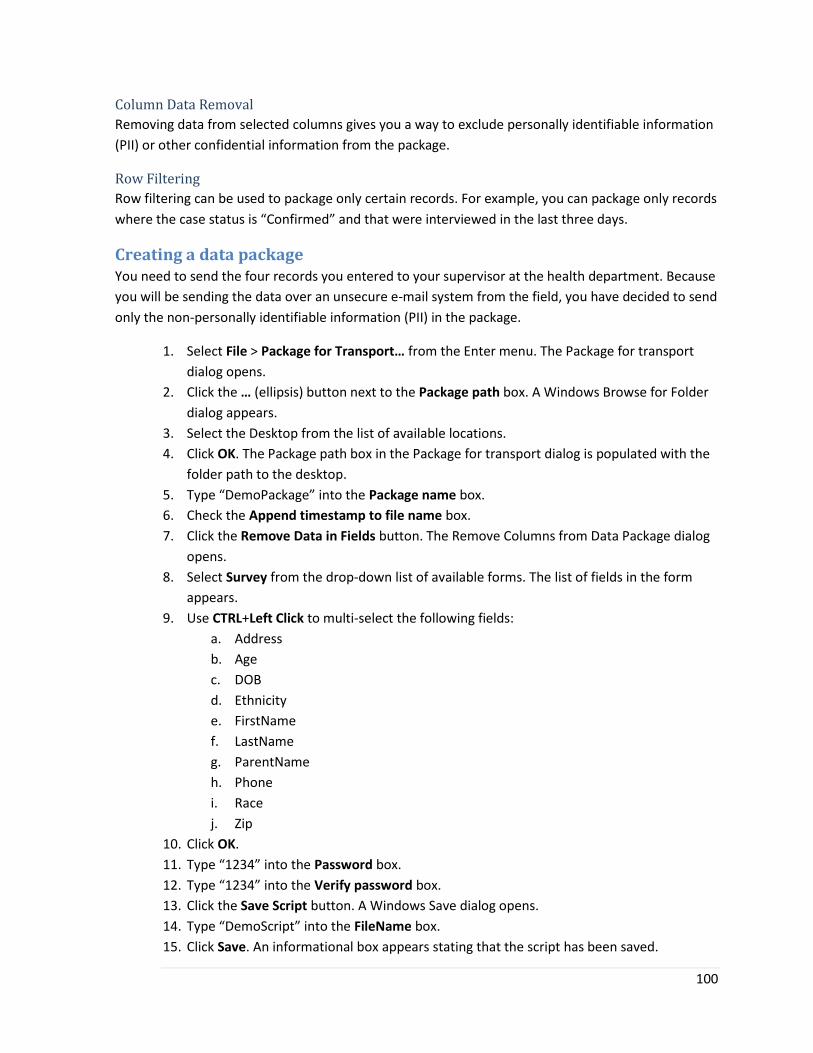
100
Column Data Removal
Removing data from selected columns gives you a way to exclude personally identifiable information
(PII) or other confidential information from the package.
Row Filtering
Row filtering can be used to package only certain records. For example, you can package only records
where the case status is “Confirmed” and that were interviewed in the last three days.
Creating a data package You need to send the four records you entered to your supervisor at the health department. Because
you will be sending the data over an unsecure e-mail system from the field, you have decided to send
only the non-personally identifiable information (PII) in the package.
1. Select File > Package for Transport… from the Enter menu. The Package for transport
dialog opens.
2. Click the … (ellipsis) button next to the Package path box. A Windows Browse for Folder
dialog appears.
3. Select the Desktop from the list of available locations.
4. Click OK. The Package path box in the Package for transport dialog is populated with the
folder path to the desktop.
5. Type “DemoPackage” into the Package name box.
6. Check the Append timestamp to file name box.
7. Click the Remove Data in Fields button. The Remove Columns from Data Package dialog
opens.
8. Select Survey from the drop-down list of available forms. The list of fields in the form
appears.
9. Use CTRL+Left Click to multi-select the following fields:
a. Address
b. Age
c. DOB
d. Ethnicity
e. FirstName
f. LastName
g. ParentName
h. Phone
i. Race
j. Zip
10. Click OK.
11. Type “1234” into the Password box.
12. Type “1234” into the Verify password box.
13. Click the Save Script button. A Windows Save dialog opens.
14. Type “DemoScript” into the FileName box.
15. Click Save. An informational box appears stating that the script has been saved.

101
16. Click the Package button once. The data packaging process starts.
17. When the packaging process has completed, verify that the last item in the status box
contains the words “Package creation complete.”
18. Click Close to exit the data packager.
You have successfully created an Epi Info™ 7 data package file on the desktop. It does not contain
any data for the fields selected in step 9, and saving the packaging script (steps 13-15) means you can
quickly re-package the data later using the same settings without needing to go through all of those
steps again.
To finish the process, you would attach the DemoPackage.edp7 file (now residing on the desktop) to
an e-mail message.
Importing a data package You have just been sent an Epi Info™ 7 data package containing the remainder of the records for the
Salmonella outbreak investigation. To start analysis, you need to merge these records with the four
you have entered.
1. Select File > Import Data > From Data Package from the Enter menu. The Import From
Encrypted Data Package dialog appears.
2. Click the … (ellipsis) button next to the Encrypted data packages to import box. A
Windows Open File dialog appears.
3. Navigate to the \Resources\Training Projects\Salmonellosis folder.
4. Select SalmonellaTrainingCaseData_2013-06-17T20-04-48.edp7.
5. Click Open. The file path appears in the Encrypted data packages to import box.
6. Type “1234” for the password. The dialog should appear as shown in Figure 60.
7. Click Import. The import process begins.
8. When the import process has completed, click the Close button. The Enter window
refreshes and 150 records appear in the record counter.
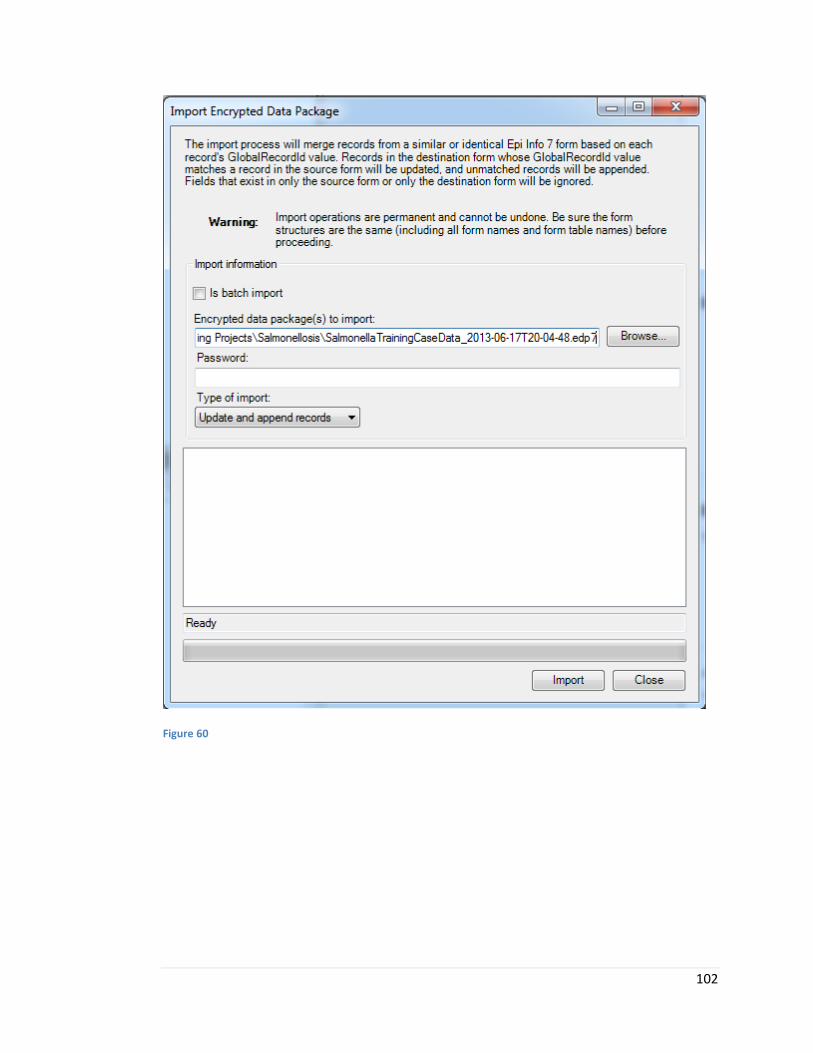
102
Figure 60
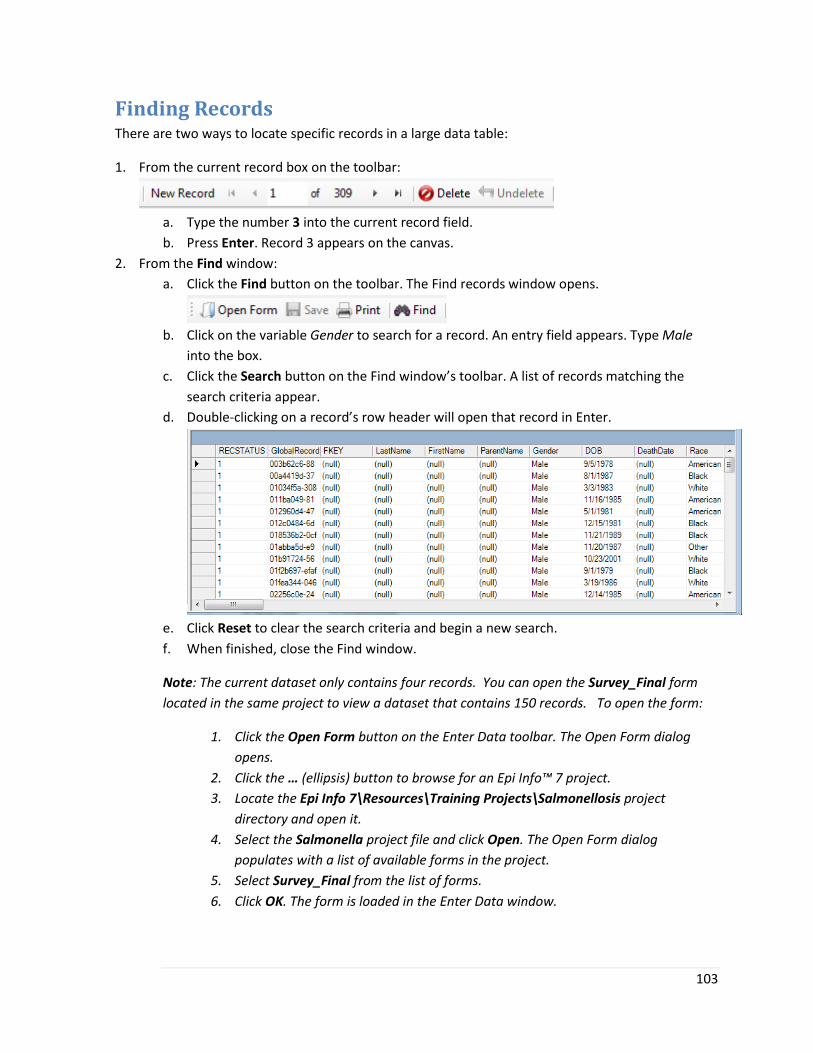
103
Finding Records There are two ways to locate specific records in a large data table:
1. From the current record box on the toolbar:
a. Type the number 3 into the current record field.
b. Press Enter. Record 3 appears on the canvas.
2. From the Find window:
a. Click the Find button on the toolbar. The Find records window opens.
b. Click on the variable Gender to search for a record. An entry field appears. Type Male
into the box.
c. Click the Search button on the Find window’s toolbar. A list of records matching the
search criteria appear.
d. Double-clicking on a record’s row header will open that record in Enter.
e. Click Reset to clear the search criteria and begin a new search.
f. When finished, close the Find window.
Note: The current dataset only contains four records. You can open the Survey_Final form
located in the same project to view a dataset that contains 150 records. To open the form:
1. Click the Open Form button on the Enter Data toolbar. The Open Form dialog
opens.
2. Click the … (ellipsis) button to browse for an Epi Info™ 7 project.
3. Locate the Epi Info 7\Resources\Training Projects\Salmonellosis project
directory and open it.
4. Select the Salmonella project file and click Open. The Open Form dialog
populates with a list of available forms in the project.
5. Select Survey_Final from the list of forms.
6. Click OK. The form is loaded in the Enter Data window.
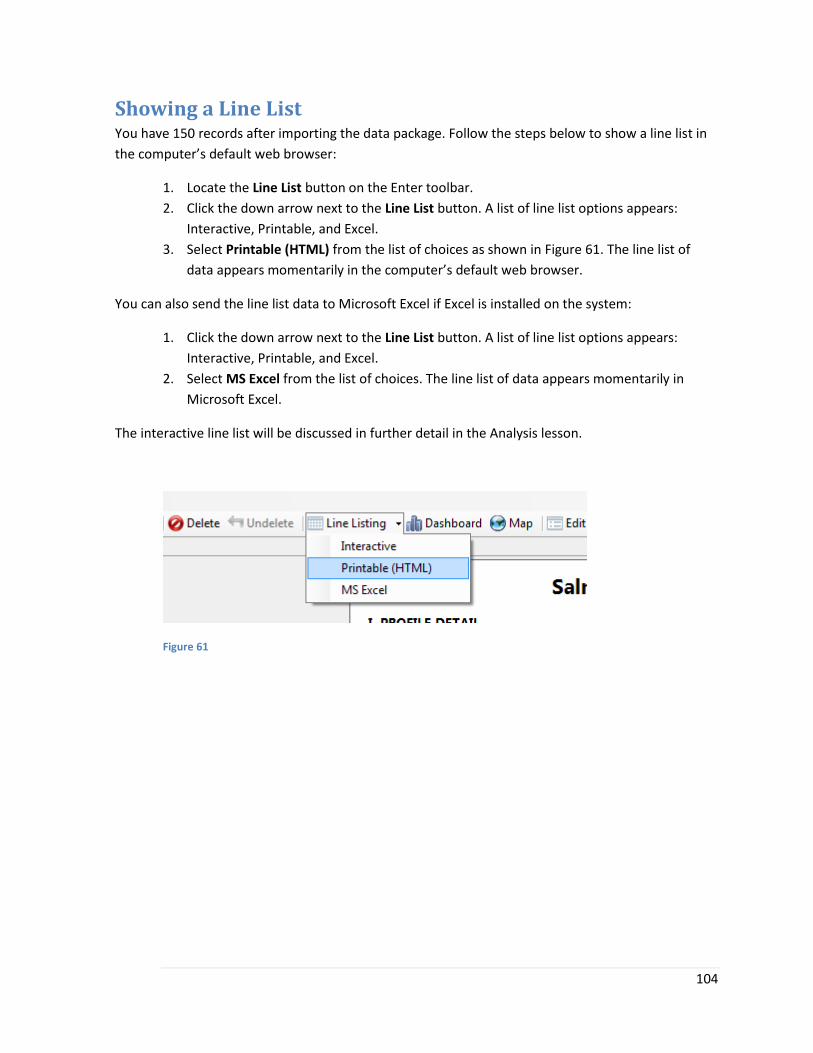
104
Showing a Line List You have 150 records after importing the data package. Follow the steps below to show a line list in
the computer’s default web browser:
1. Locate the Line List button on the Enter toolbar.
2. Click the down arrow next to the Line List button. A list of line list options appears:
Interactive, Printable, and Excel.
3. Select Printable (HTML) from the list of choices as shown in Figure 61. The line list of
data appears momentarily in the computer’s default web browser.
You can also send the line list data to Microsoft Excel if Excel is installed on the system:
1. Click the down arrow next to the Line List button. A list of line list options appears:
Interactive, Printable, and Excel.
2. Select MS Excel from the list of choices. The line list of data appears momentarily in
Microsoft Excel.
The interactive line list will be discussed in further detail in the Analysis lesson.
Figure 61
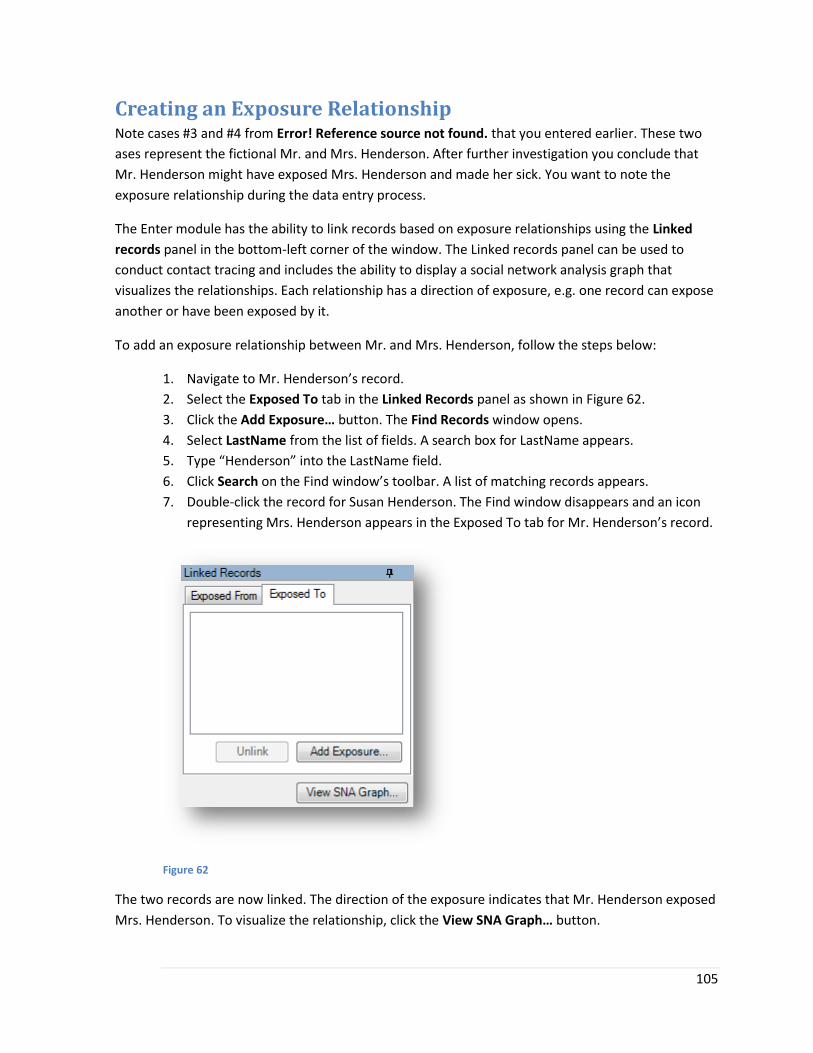
105
Creating an Exposure Relationship Note cases #3 and #4 from Error! Reference source not found. that you entered earlier. These two
ases represent the fictional Mr. and Mrs. Henderson. After further investigation you conclude that
Mr. Henderson might have exposed Mrs. Henderson and made her sick. You want to note the
exposure relationship during the data entry process.
The Enter module has the ability to link records based on exposure relationships using the Linked
records panel in the bottom-left corner of the window. The Linked records panel can be used to
conduct contact tracing and includes the ability to display a social network analysis graph that
visualizes the relationships. Each relationship has a direction of exposure, e.g. one record can expose
another or have been exposed by it.
To add an exposure relationship between Mr. and Mrs. Henderson, follow the steps below:
1. Navigate to Mr. Henderson’s record.
2. Select the Exposed To tab in the Linked Records panel as shown in Figure 62.
3. Click the Add Exposure… button. The Find Records window opens.
4. Select LastName from the list of fields. A search box for LastName appears.
5. Type “Henderson” into the LastName field.
6. Click Search on the Find window’s toolbar. A list of matching records appears.
7. Double-click the record for Susan Henderson. The Find window disappears and an icon
representing Mrs. Henderson appears in the Exposed To tab for Mr. Henderson’s record.
Figure 62
The two records are now linked. The direction of the exposure indicates that Mr. Henderson exposed
Mrs. Henderson. To visualize the relationship, click the View SNA Graph… button.
106
Summary During this lesson, you were introduced to the concept of creating electronic data entry forms using
the Form Designer module of Epi Info™ 7. You can now:
Navigate the Enter workspace.
Enter records.
Create a line list.
Create and import Epi Info™ 7 data packages.
Create exposure relationships.
Q&A Q: Is there a way to show only selected columns in the line list?
A: There is no way to show specific columns from the line lists in Enter, but this capability does exist
in the dedicated analytics modules (discussed in the next lesson).
Q: Can the relationship between two records, created using the Linked Records panel, be
“directionless”; That is, can it be neither exposed to nor exposed from?
A: At this time, there is no way to indicate a missing, unknown, or directionless exposure.
Quiz The following questions will see how much you have learned about using the Enter module.
Questions 1. Records can be added only; existing records can’t be edited once saved.
a. True
b. False
2. A record number can be typed directly into the current record box, and after pressing the Enter
key, that record will appear on the canvas.
a. True
b. False
3. The encryption used in the data packager should not be relied on as the sole source of data
security when handling sensitive or personally identifiable information.
a. True
b. False
4. The Enter module can only import data from other Epi Info™ forms, Epi Info™ data packages,
data that came from the Epi Info™ mobile application for Android devices, or data that came
from the Epi Info™ web survey tool.
a. True
b. False

107
Answers 1. B
2. A
3. A
4. A. Data from other sources, such as Excel files or text files, must be imported into an Epi
Info™ 7 project using the Classic Analysis module.
108
Lesson 4
Data Analysis using the Dashboard
This lesson introduces you to the Epi Info™ 7 Dashboard module.
In Lesson 3, you entered case data in a survey to collect information on the Salmonella outbreak. In
Lesson 4, you will use the Dashboard module to open that data and view it. Once records are loaded
in the Dashboard, you can use “gadgets” to both display the data and run statistics. Lesson 4 covers
these basic skills and shows you how to open data, which are important skills you will use every time
you open the Dashboard module.
Time to complete: 2 hours (Intermediate)
FIVE GOALS
1. Use Dashboard gadgets to show statistical output
2. Create data filters
3. Create new variables with recoded data
4. Create new variables using conditional logic
5. Save the output
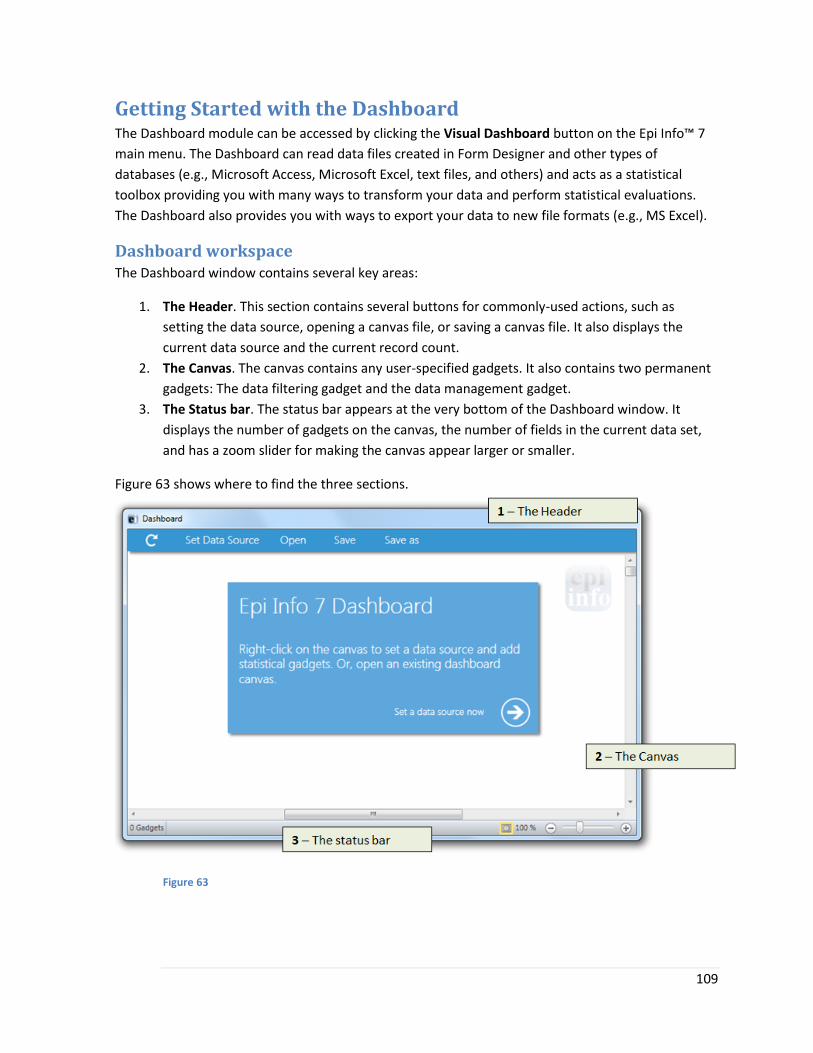
109
Getting Started with the Dashboard The Dashboard module can be accessed by clicking the Visual Dashboard button on the Epi Info™ 7
main menu. The Dashboard can read data files created in Form Designer and other types of
databases (e.g., Microsoft Access, Microsoft Excel, text files, and others) and acts as a statistical
toolbox providing you with many ways to transform your data and perform statistical evaluations.
The Dashboard also provides you with ways to export your data to new file formats (e.g., MS Excel).
Dashboard workspace The Dashboard window contains several key areas:
1. The Header. This section contains several buttons for commonly-used actions, such as
setting the data source, opening a canvas file, or saving a canvas file. It also displays the
current data source and the current record count.
2. The Canvas. The canvas contains any user-specified gadgets. It also contains two permanent
gadgets: The data filtering gadget and the data management gadget.
3. The Status bar. The status bar appears at the very bottom of the Dashboard window. It
displays the number of gadgets on the canvas, the number of fields in the current data set,
and has a zoom slider for making the canvas appear larger or smaller.
Figure 63 shows where to find the three sections.
Figure 63
110
Key features The Dashboard module has the ability to:
Read Epi Info™ 7 project data, Excel spreadsheets, Access databases, and other data formats
Filter records
Define new variables with recoded values, conditional assignments, or special formatting
Display line lists and data dictionaries
Display various types of statistical output, including frequencies, 2x2 tables, and regression
analysis.
Display data visually through the use of charts.
Relate data from other data sources
Export data to other data formats such as Microsoft Excel
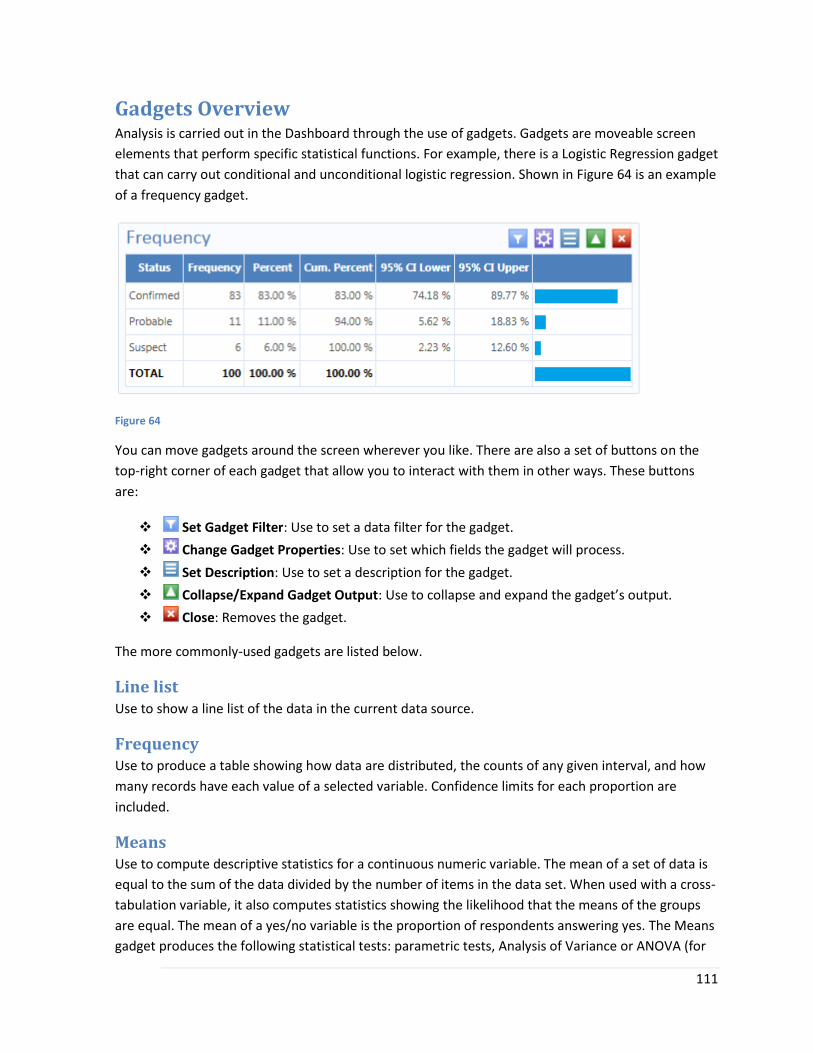
111
Gadgets Overview Analysis is carried out in the Dashboard through the use of gadgets. Gadgets are moveable screen
elements that perform specific statistical functions. For example, there is a Logistic Regression gadget
that can carry out conditional and unconditional logistic regression. Shown in Figure 64 is an example
of a frequency gadget.
Figure 64
You can move gadgets around the screen wherever you like. There are also a set of buttons on the
top-right corner of each gadget that allow you to interact with them in other ways. These buttons
are:
Set Gadget Filter: Use to set a data filter for the gadget.
Change Gadget Properties: Use to set which fields the gadget will process.
Set Description: Use to set a description for the gadget.
Collapse/Expand Gadget Output: Use to collapse and expand the gadget’s output.
Close: Removes the gadget.
The more commonly-used gadgets are listed below.
Line list Use to show a line list of the data in the current data source.
Frequency Use to produce a table showing how data are distributed, the counts of any given interval, and how
many records have each value of a selected variable. Confidence limits for each proportion are
included.
Means Use to compute descriptive statistics for a continuous numeric variable. The mean of a set of data is
equal to the sum of the data divided by the number of items in the data set. When used with a cross-
tabulation variable, it also computes statistics showing the likelihood that the means of the groups
are equal. The mean of a yes/no variable is the proportion of respondents answering yes. The Means
gadget produces the following statistical tests: parametric tests, Analysis of Variance or ANOVA (for

112
two or more samples), non-parametric tests, Bartlett's Test for Inequality of Population Variances,
Kruskal-Wallis one-way analysis of variance (for two or more samples), and Mann-Whitney/Wilcoxon
Two Sample Test.
2x2 / MxN table Use to create cross-tabulations of categorical variables. The 2x2/MxN gadget can help determine the
probability that a risk factor is linked to an outcome. For these values to have their accepted
epidemiological meanings, the value representing presence of the exposure (independent value) and
outcome conditions (dependent variable) must appear in the first row and column of the table. Epi
Info™ Yes/No variables are automatically sorted. Values of the first selected variable will appear
across the top of the table, and those of the second one will be on the left margin of the table.
Normally cells contain counts of records matching the values in the corresponding marginal labels.
For 2x2 tables, the command produces odds ratios and risk ratios. For tables other than 2x2, chi-
squared statistics are computed. Chi square for trend tests for the presence of a trend in dose
response or other case control studies where a series of increasing or decreasing exposures is being
studied. The p-value is the probability that the association between two variables might be because
of chance. A low p-value of <.05 means the risk factor might be closely associated with the illness.
Chart Use to display data visually. Supported chart types include epi curve (histograms), pie, bar, column,
stacked column, scatter, aberration detection, and Pareto.
Combined frequency Use to treat a group of fields as if they were a single field for the purposes of generating frequency
output.
Matched pair case control Use to generate matched pair case control statistics.
Linear regression Use to run linear regression.
Logistic regression Use to run conditional and unconditional logistic regression.

113
Opening the Salmonella Data Follow the steps below to open the Salmonella outbreak data set.
1. Close the Form Designer and Enter modules if they are open.
2. Open the Epi Info™ 7 menu.
3. Click the Visual Dashboard button on the Epi Info™ 7 menu. The Dashboard window opens.
4. Click the Set Data Source button. A Set Data Source dialog opens.
5. Select Epi Info™ 7 Project from the Database Type drop-down list.
Note: Epi Info™ 7 projects are not the only type of data that can be opened in the Dashboard. Note
that Excel documents, MySQL databases, and text files are among the supported data formats.
6. Click the … (ellipsis) button next to the Data Source box. A Windows Open File dialog
appears.
7. Double-click the Epi Info 7\Resources\Training Projects\Salmonellosis folder. The
Salmonellosis folder opens.
8. Select the Salmonellosis.prj file.
9. Click OK. The Set Data Source dialog reappears; a list of forms within the project appears in
the Data Source Explorer list box.
10. Select Survey_Final from the Data Source Explorer list box.
11. Click OK. The data are loaded into the Dashboard.
The Dashboard window’s header shows a record count of 309 after completing step 11.

114
Using the Line List Gadget The Line List gadget displays the variables of the current dataset with their corresponding data. You
can select specific variables from the variables box to narrow the list, or press CTRL+A to select all of
the variables. Selecting a group or a page will show all of the variables contained in the group or
page, respectively.
Generating a basic line list Follow the steps below to create a line list of the current data set:
1. Right-click a blank portion of the Dashboard canvas. A context menu appears.
2. Select Add Analysis Gadget > Line list from the context menu. The line list gadget appears.
3. Use CTRL+Left Click to multi-select the following fields:
a. Age
b. County
c. DOB
d. Gender
e. ILL
f. Group_PicnicFoodsEaten
Note: Group fields and pages are displayed at the end of the selection list.
4. Select Age in the Sort variables drop-down list. Age appears in the Sort order box.
5. Click the Generate Line List button. The line list is displayed, sorted by Age.
Notice the “warning” message displayed at the top of the output (Figure 65). The warning is stating
that the output is limited to 50 rows due to one of the gadget’s settings. The row limit prevents you
from accidentally generating a line list of hundreds of thousands of records (which would greatly
impair performance).
Figure 65
Follow the steps below to modify and re-generate the line list:
1. Click the gear icon on the gadget’s header panel. The Line List Properties panel displays.
2. Type “200” into the Max rows to display box.
3. Click the Generate Line List button. The line list is displayed, sorted by Age.
115
Moving and collapsing the line list The line list gadget can be dragged around the canvas by left-clicking on it, holding the left mouse
button down, and then dragging the mouse. Gadgets can be placed anywhere, including on top of
other gadgets.
Note: Attempting to drag the line list by clicking on the list’s output and moving the mouse may not
work. If this occurs, try clicking the gadget’s header and moving the mouse instead.
Clicking the icon will collapse the contents of the line list output without close the line list. The
benefit to collapsing output is more apparent when many gadgets are on the canvas at once.
Sending line list output to other programs You can send the line list output to other programs or copy it to the clipboard. To send the line list
data to Microsoft Excel, follow the steps below:
1. Right-click on the output for the line list gadget. A gadget-specific context menu appears.
2. Select Send list data to Excel. The line list data appears in Microsoft Excel after several
moments.
If your computer does not have Microsoft Excel installed, you can select Send list data to web
browser. Another option on the context menu, Copy list data to clipboard, allows you to paste the
list’s output into other Windows applications. The options for sending gadget data to the web
browser, to Excel, and to the clipboard exist in most of the other gadget types.
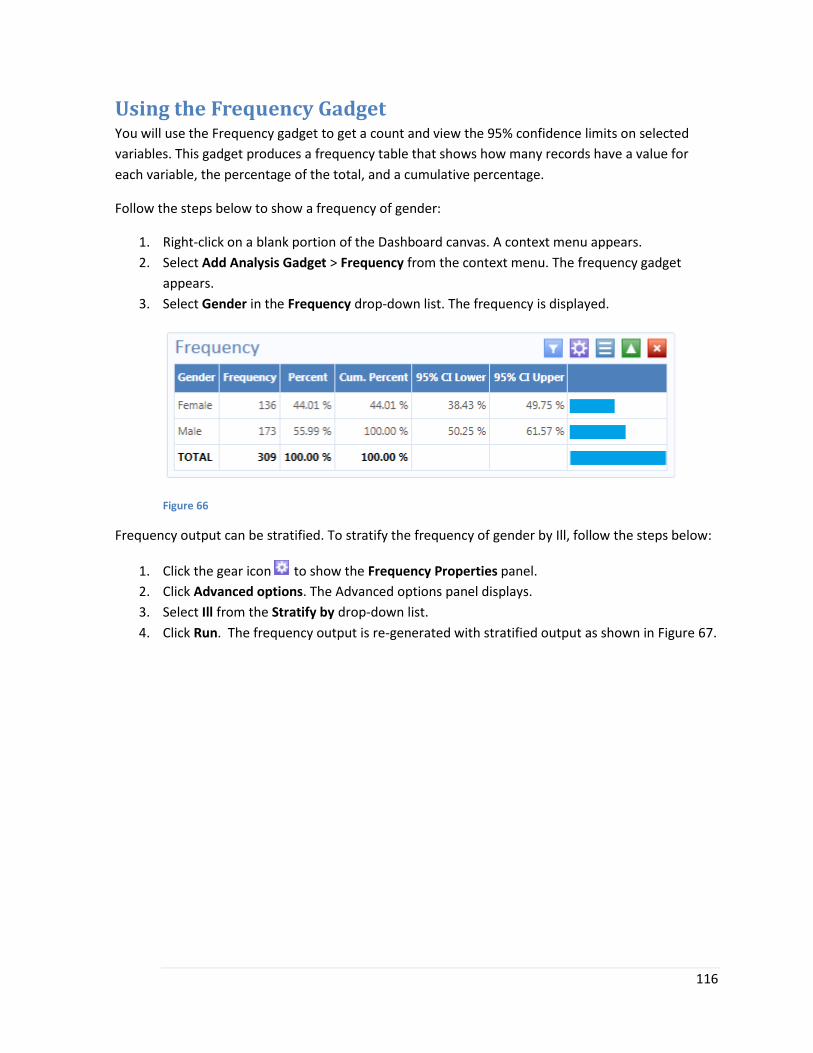
116
Using the Frequency Gadget You will use the Frequency gadget to get a count and view the 95% confidence limits on selected
variables. This gadget produces a frequency table that shows how many records have a value for
each variable, the percentage of the total, and a cumulative percentage.
Follow the steps below to show a frequency of gender:
1. Right-click on a blank portion of the Dashboard canvas. A context menu appears.
2. Select Add Analysis Gadget > Frequency from the context menu. The frequency gadget
appears.
3. Select Gender in the Frequency drop-down list. The frequency is displayed.
Figure 66
Frequency output can be stratified. To stratify the frequency of gender by Ill, follow the steps below:
1. Click the gear icon to show the Frequency Properties panel.
2. Click Advanced options. The Advanced options panel displays.
3. Select Ill from the Stratify by drop-down list.
4. Click Run. The frequency output is re-generated with stratified output as shown in Figure 67.
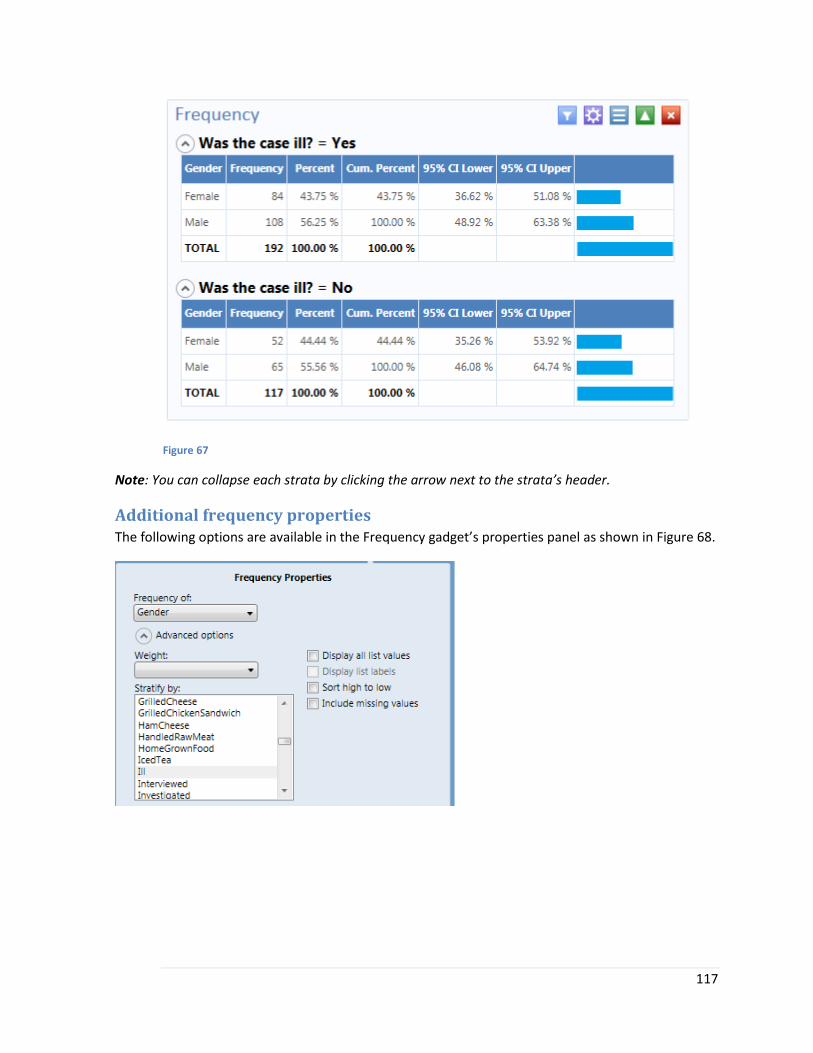
117
Figure 67
Note: You can collapse each strata by clicking the arrow next to the strata’s header.
Additional frequency properties The following options are available in the Frequency gadget’s properties panel as shown in Figure 68.
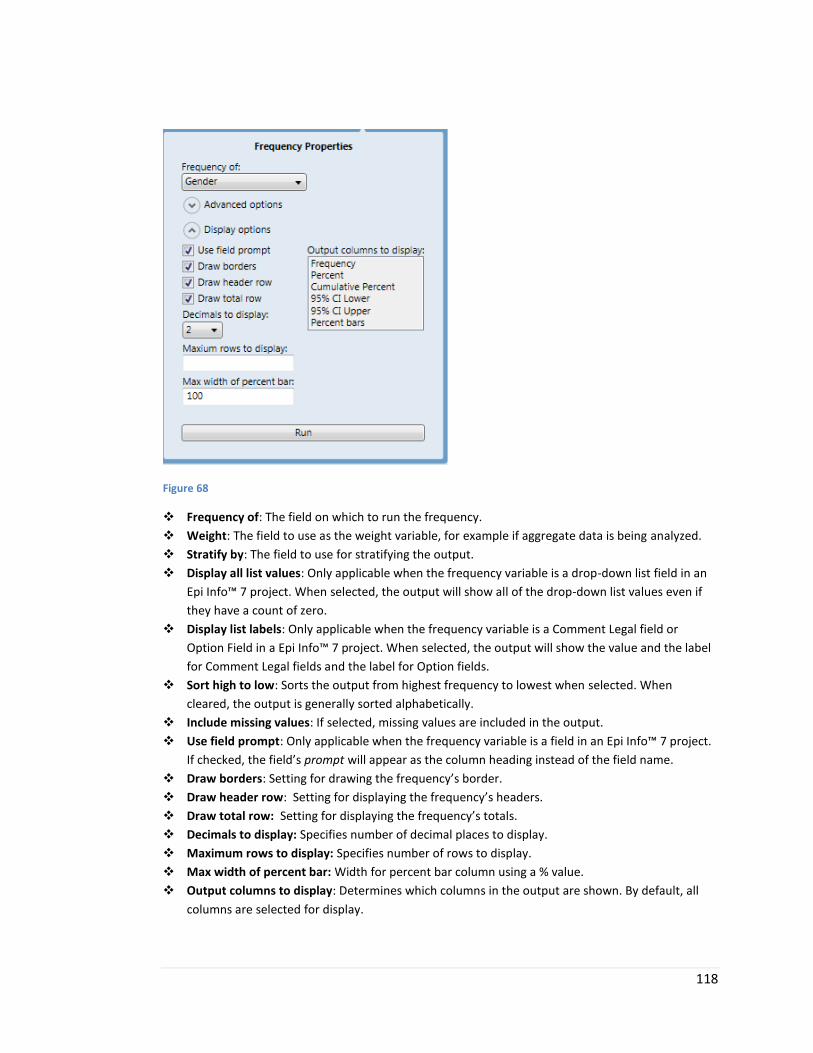
118
Figure 68
Frequency of: The field on which to run the frequency.
Weight: The field to use as the weight variable, for example if aggregate data is being analyzed.
Stratify by: The field to use for stratifying the output.
Display all list values: Only applicable when the frequency variable is a drop-down list field in an
Epi Info™ 7 project. When selected, the output will show all of the drop-down list values even if
they have a count of zero.
Display list labels: Only applicable when the frequency variable is a Comment Legal field or
Option Field in a Epi Info™ 7 project. When selected, the output will show the value and the label
for Comment Legal fields and the label for Option fields.
Sort high to low: Sorts the output from highest frequency to lowest when selected. When
cleared, the output is generally sorted alphabetically.
Include missing values: If selected, missing values are included in the output.
Use field prompt: Only applicable when the frequency variable is a field in an Epi Info™ 7 project.
If checked, the field’s prompt will appear as the column heading instead of the field name.
Draw borders: Setting for drawing the frequency’s border.
Draw header row: Setting for displaying the frequency’s headers.
Draw total row: Setting for displaying the frequency’s totals.
Decimals to display: Specifies number of decimal places to display.
Maximum rows to display: Specifies number of rows to display.
Max width of percent bar: Width for percent bar column using a % value.
Output columns to display: Determines which columns in the output are shown. By default, all
columns are selected for display.
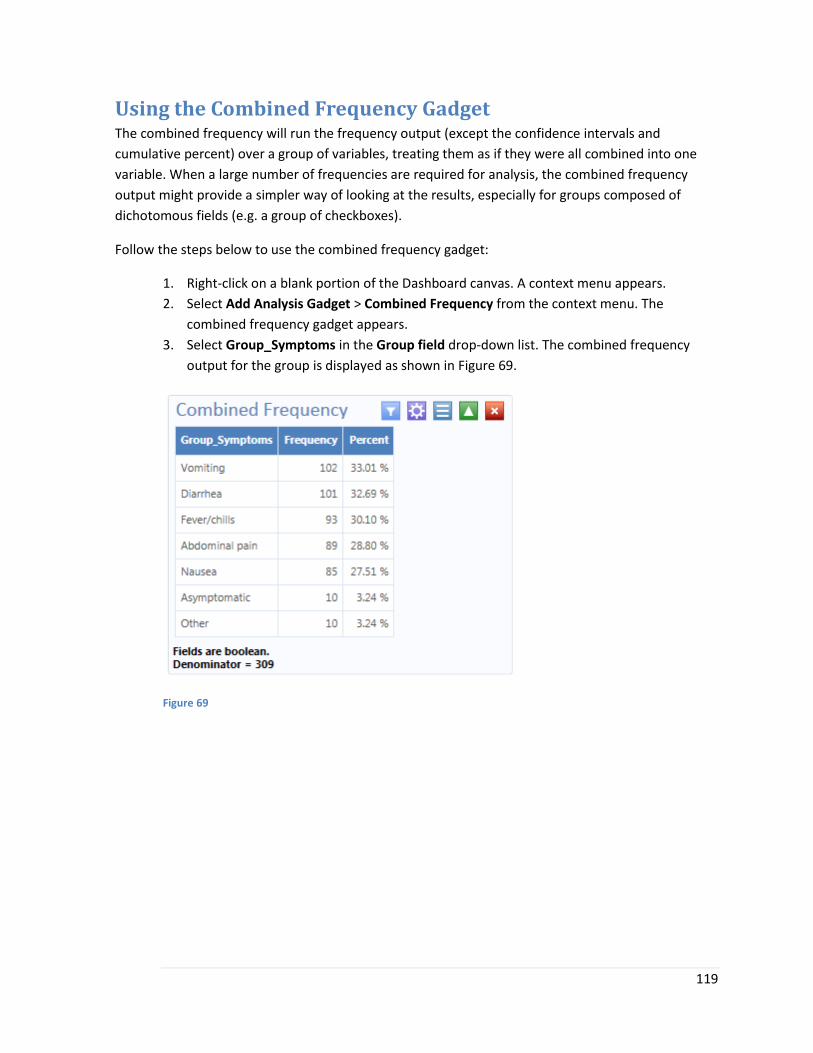
119
Using the Combined Frequency Gadget The combined frequency will run the frequency output (except the confidence intervals and
cumulative percent) over a group of variables, treating them as if they were all combined into one
variable. When a large number of frequencies are required for analysis, the combined frequency
output might provide a simpler way of looking at the results, especially for groups composed of
dichotomous fields (e.g. a group of checkboxes).
Follow the steps below to use the combined frequency gadget:
1. Right-click on a blank portion of the Dashboard canvas. A context menu appears.
2. Select Add Analysis Gadget > Combined Frequency from the context menu. The
combined frequency gadget appears.
3. Select Group_Symptoms in the Group field drop-down list. The combined frequency
output for the group is displayed as shown in Figure 69.
Figure 69

120
Calculating Age Go back and view the line list you created earlier. Observe that the Age column lacks data.
What happened? Recall that this data was mostly collected from investigators in the field. The
investigators might have excluded age from the data packages they sent to you, or perhaps they
were using an older version of the form that didn’t include a field for age. Either way, you would like
to look at the Age for each respondent.
Because both date of birth and date of interview are known for each record, it’s possible to
determine the difference in years between these two dates and assign the result to another field.
This is done using the Defined Variables slide-out gadget on the left side of the screen.
Calculate the age by following the steps below:
1. Move the mouse over the Defined Variables box on the left edge of the canvas. The
Defined Variables slide-out gadget appears as shown in Figure 70.
2. Click New Variable. A list of variable options appears as shown in Figure 71.
3. Select Simple Assignment from the list of variable options. The Add variable with simple
assignment dialog opens.
4. Type “Age2” into the Assign field text box.
5. Select Difference in years from the Assign type drop-down list.
6. Select DOB from the Start date drop-down list.
7. Type 05/05/2012 in the End Date drop down list. The dialog should now appear as
shown in Figure 72.
8. Click OK. The variable is created and appears in the Defined Variables slide-out gadget.
Note: We are using 5/5/2012 instead of SYSTEMDATE (today’s date) because the age
calculation needs to be based on the date when the outbreak occurred.
You might now use the “Age2” variable you specified in step 4. You can verify it’s content by
generating a frequency using the Frequency gadget. The next exercise will explain how to use the
Means gadget to find the descriptive statistics about the newly-created Age2 field.
Important: The “Age2” variable is temporary. When you close the Dashboard or change the
Dashboard’s current data source, it will be destroyed. You will learn later on how to save the
variable so that you don’t have to redo the above steps each time you want to run statistics
on age.
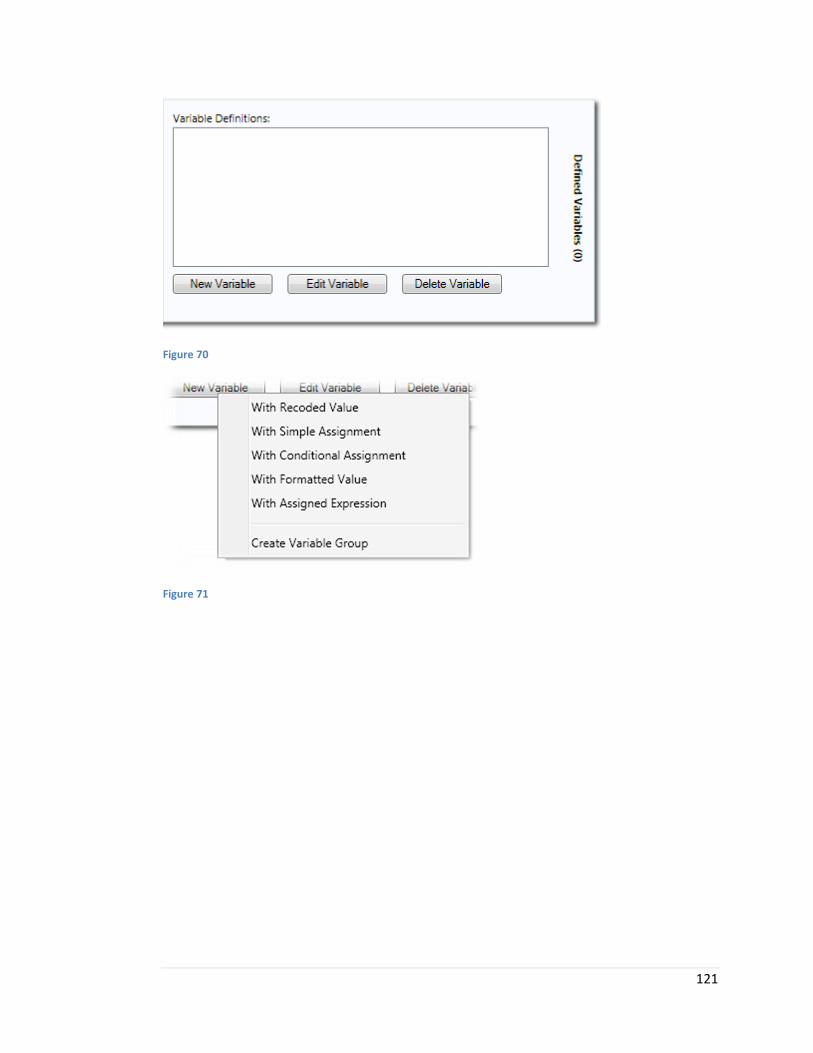
121
Figure 70
Figure 71
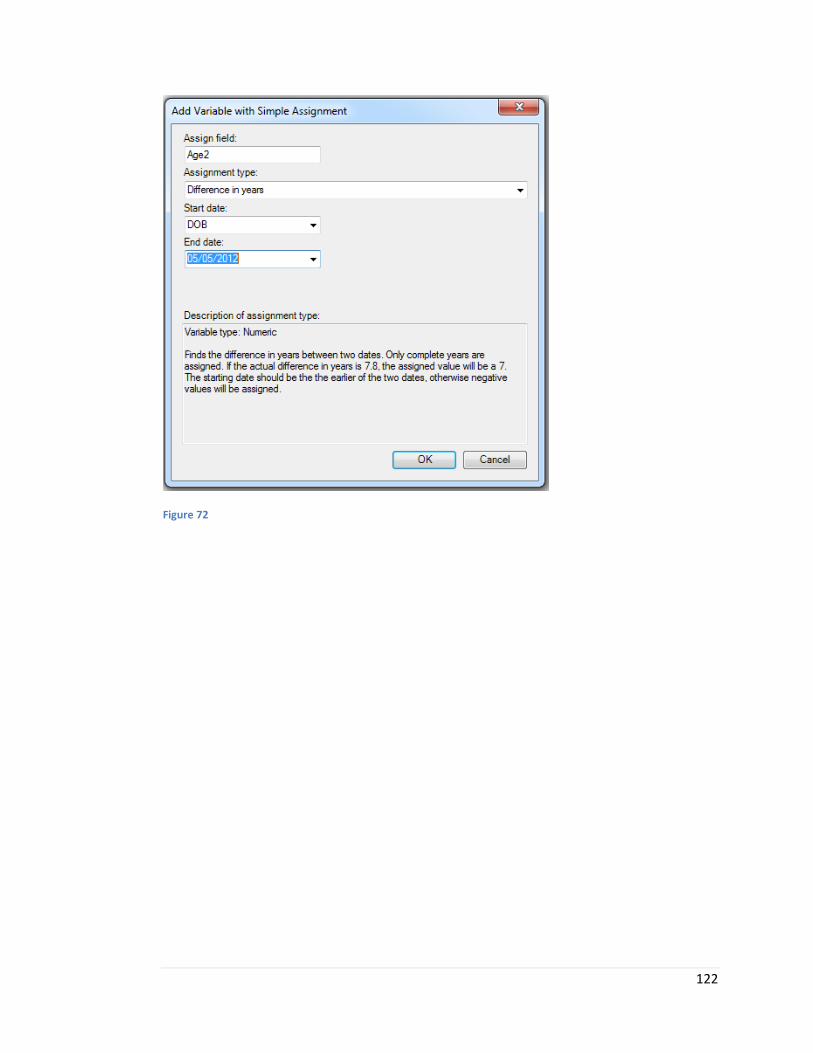
122
Figure 72

123
Using the Means Gadget The Means gadget can be used to obtain an average for a continuous variable. The MEANS command
has two formats:
If only one variable is supplied, the program produces descriptive statistics.
If two variables are supplied, the first variable is numeric and contains the data to be
analyzed. The second variable indicates how groups will be distinguished. The output of
this format contains descriptive statistics of the numeric variable for each value of the
group variable.
Follow the steps below to show descriptive statistics for the Age2 variable you created in the
previous exercise:
1. Right-click on a blank portion of the Dashboard canvas. A context menu appears.
2. Select Add Analysis Gadget > Means from the context menu. The means gadget appears.
3. Select Age2 in the Means drop-down list. The summary statistics for Age are displayed as
shown in Figure 73.
Figure 73
Var: Represents variance; a measure of the dispersion shown by a set of observations.
Std Dev: Represents standard deviation; a statistical summary of how dispersed the
values of a variable are around its mean.
To determine the average age of those who were and weren’t ill, you need to compute the means of
age by ill. You will use a cross tabulation variable to compute statistics showing the likelihood that
the means of the groups are equal.
1. Click the gear icon to show the Means Properties panel.
2. Click Advanced options. The Advanced options panel displays.
3. Select Ill from the Cross tabulate by drop-down list.
4. Click Run. The means output is re-generated with the cross tabulated output. ANOVA
statistics are displayed (Figure 74).
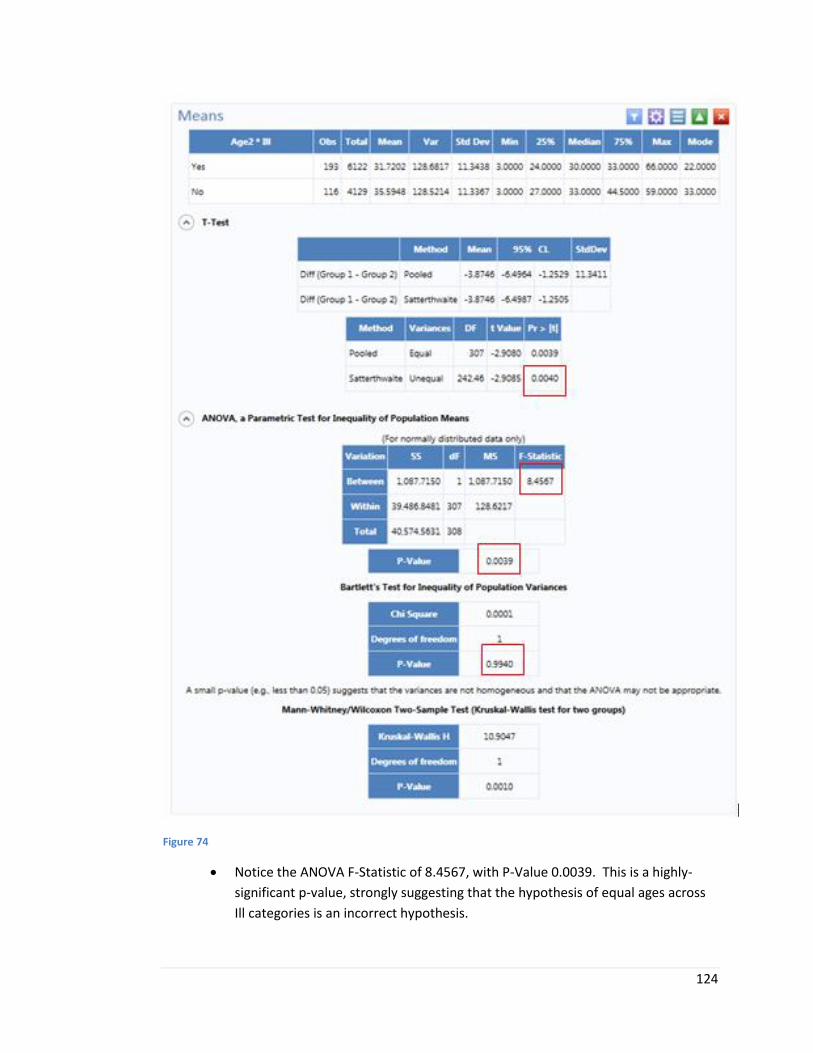
124
Figure 74
Notice the ANOVA F-Statistic of 8.4567, with P-Value 0.0039. This is a highly-
significant p-value, strongly suggesting that the hypothesis of equal ages across
Ill categories is an incorrect hypothesis.

125
• Because Ill has exactly two possible values, T-Test statistics are also produced. The p-
values 0.0039 and 0.0040 suggest rejecting the hypothesis of equal ages, whether or not
the two groups can be assumed to have equal variances.
• Bartlett’s Test tests the assumption of equal variances and with p = 0.9940, accepts
this assumption.
• If the distribution of the Age2 variable cannot be assumed to be normal, the
Wilcoxon Test might be used to compare the two groups. In this example, the Wilcoxon
Test also rejects the hypothesis of equivalent ages.
You will now use the Means gadget with a stratification field to group your data by gender.
1. Click the gear icon to show the Means Properties panel.
2. Click Advanced options (if not already shown). The Advanced options panel displays.
3. Select Gender from the Stratify by drop-down list.
4. Click Run. The means output is re-generated with the stratified and cross tabulated
output. ANOVA statistics are displayed.
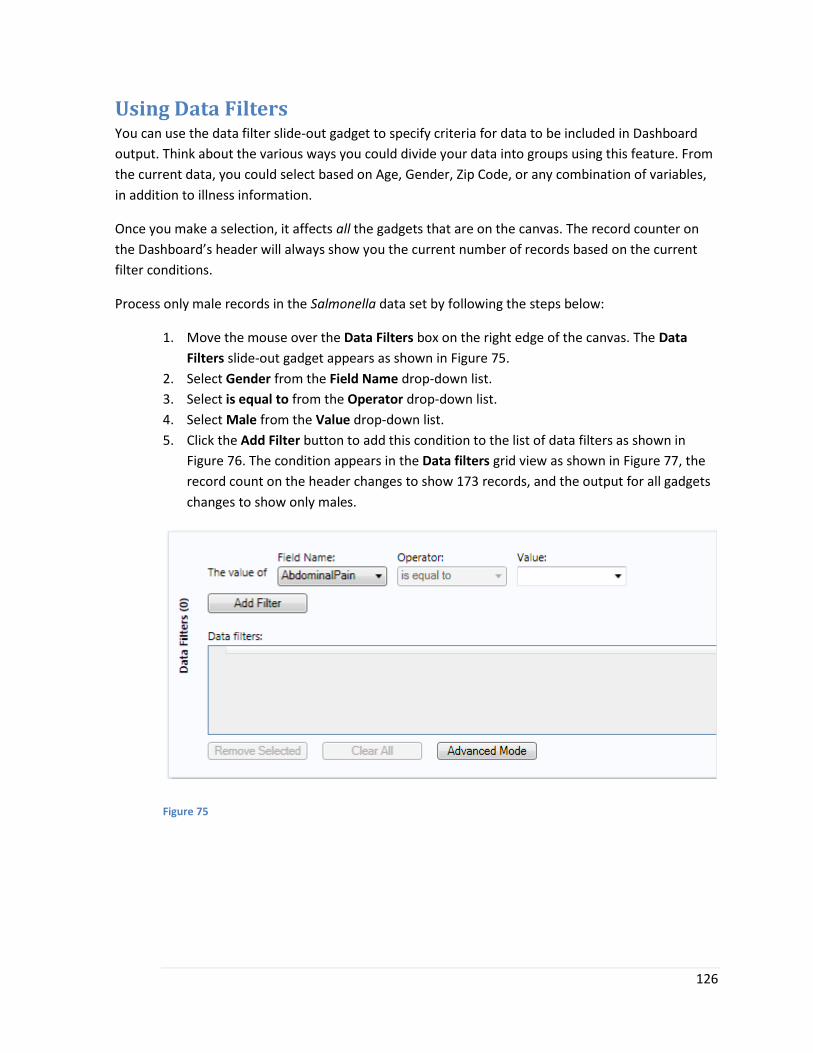
126
Using Data Filters You can use the data filter slide-out gadget to specify criteria for data to be included in Dashboard
output. Think about the various ways you could divide your data into groups using this feature. From
the current data, you could select based on Age, Gender, Zip Code, or any combination of variables,
in addition to illness information.
Once you make a selection, it affects all the gadgets that are on the canvas. The record counter on
the Dashboard’s header will always show you the current number of records based on the current
filter conditions.
Process only male records in the Salmonella data set by following the steps below:
1. Move the mouse over the Data Filters box on the right edge of the canvas. The Data
Filters slide-out gadget appears as shown in Figure 75.
2. Select Gender from the Field Name drop-down list.
3. Select is equal to from the Operator drop-down list.
4. Select Male from the Value drop-down list.
5. Click the Add Filter button to add this condition to the list of data filters as shown in
Figure 76. The condition appears in the Data filters grid view as shown in Figure 77, the
record count on the header changes to show 173 records, and the output for all gadgets
changes to show only males.
Figure 75
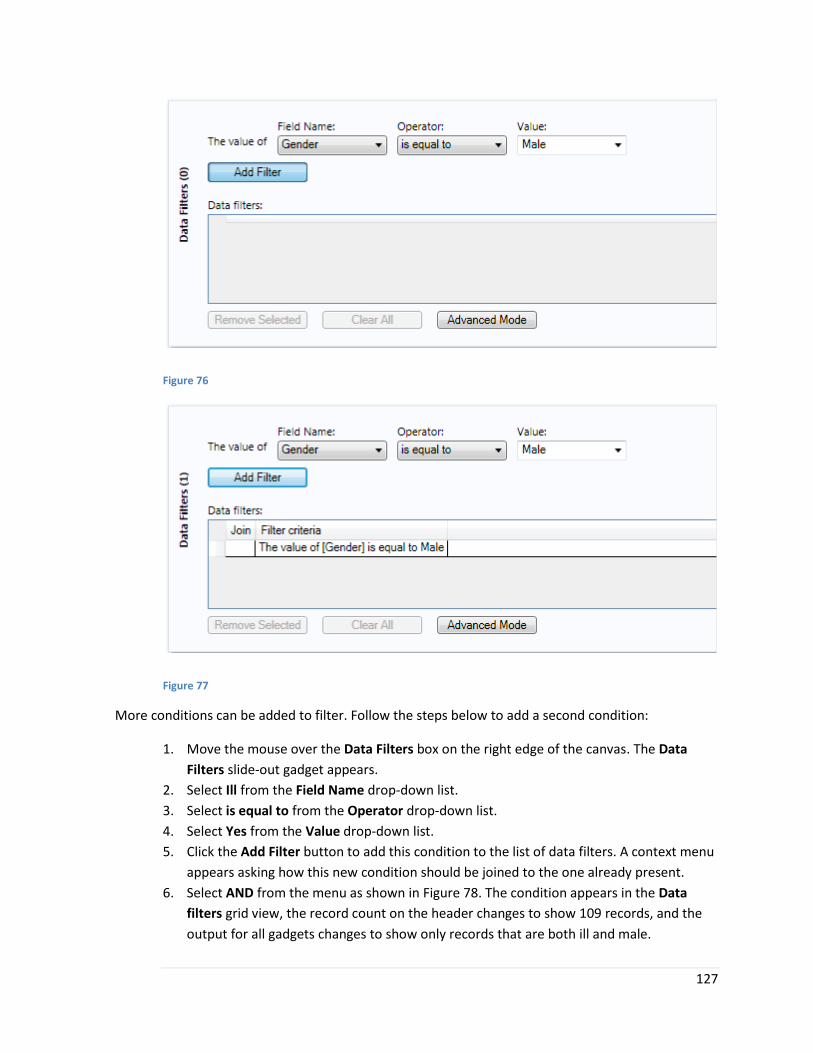
127
Figure 76
Figure 77
More conditions can be added to filter. Follow the steps below to add a second condition:
1. Move the mouse over the Data Filters box on the right edge of the canvas. The Data
Filters slide-out gadget appears.
2. Select Ill from the Field Name drop-down list.
3. Select is equal to from the Operator drop-down list.
4. Select Yes from the Value drop-down list.
5. Click the Add Filter button to add this condition to the list of data filters. A context menu
appears asking how this new condition should be joined to the one already present.
6. Select AND from the menu as shown in Figure 78. The condition appears in the Data
filters grid view, the record count on the header changes to show 109 records, and the
output for all gadgets changes to show only records that are both ill and male.
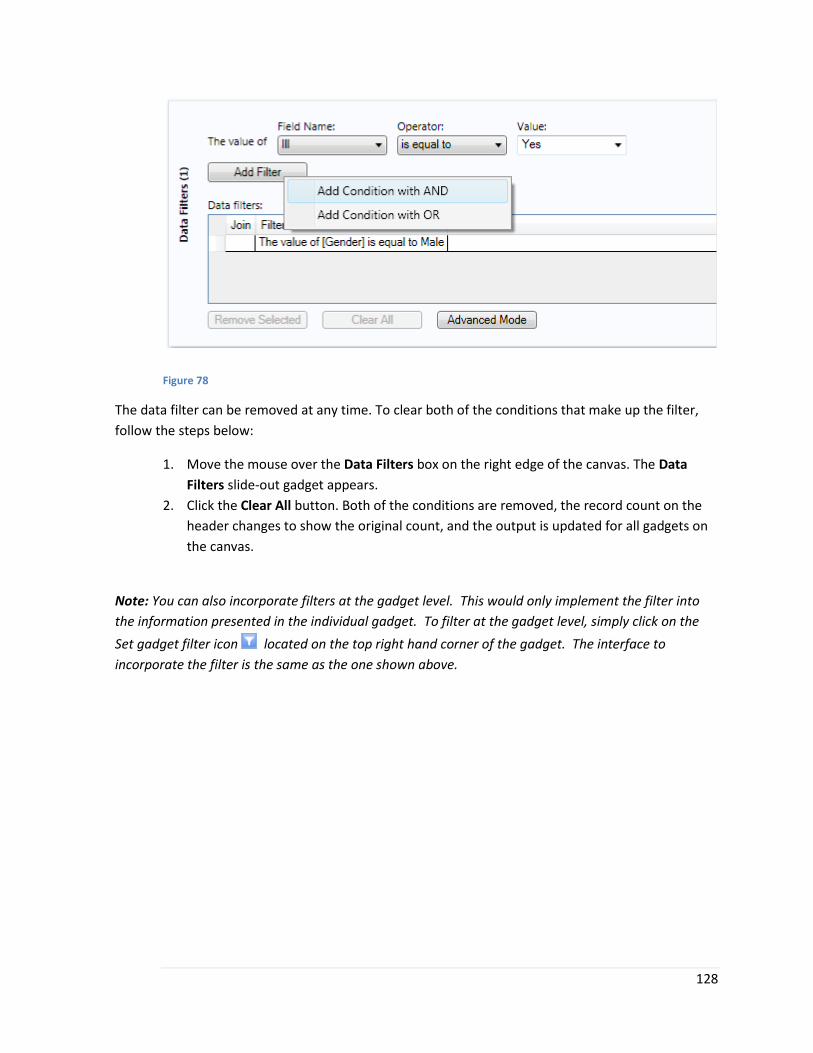
128
Figure 78
The data filter can be removed at any time. To clear both of the conditions that make up the filter,
follow the steps below:
1. Move the mouse over the Data Filters box on the right edge of the canvas. The Data
Filters slide-out gadget appears.
2. Click the Clear All button. Both of the conditions are removed, the record count on the
header changes to show the original count, and the output is updated for all gadgets on
the canvas.
Note: You can also incorporate filters at the gadget level. This would only implement the filter into
the information presented in the individual gadget. To filter at the gadget level, simply click on the
Set gadget filter icon located on the top right hand corner of the gadget. The interface to
incorporate the filter is the same as the one shown above.

129
Student Practice 1 See if you can find the answers to the following questions. Steps by step instructions and answers
are available in the Appendix section of the manual.
1. What racial category (RACE) has the highest frequency in this data set?
2. Does the answer for #1 still hold true when the groups are separated into males and
females?
3. How many people drank water (WATER) and ate their meal at 2:00 pm (ATEAT2)?
4. What is the average age of people in this data set by case outcome (OUTCOME) and
gender (GENDER)?
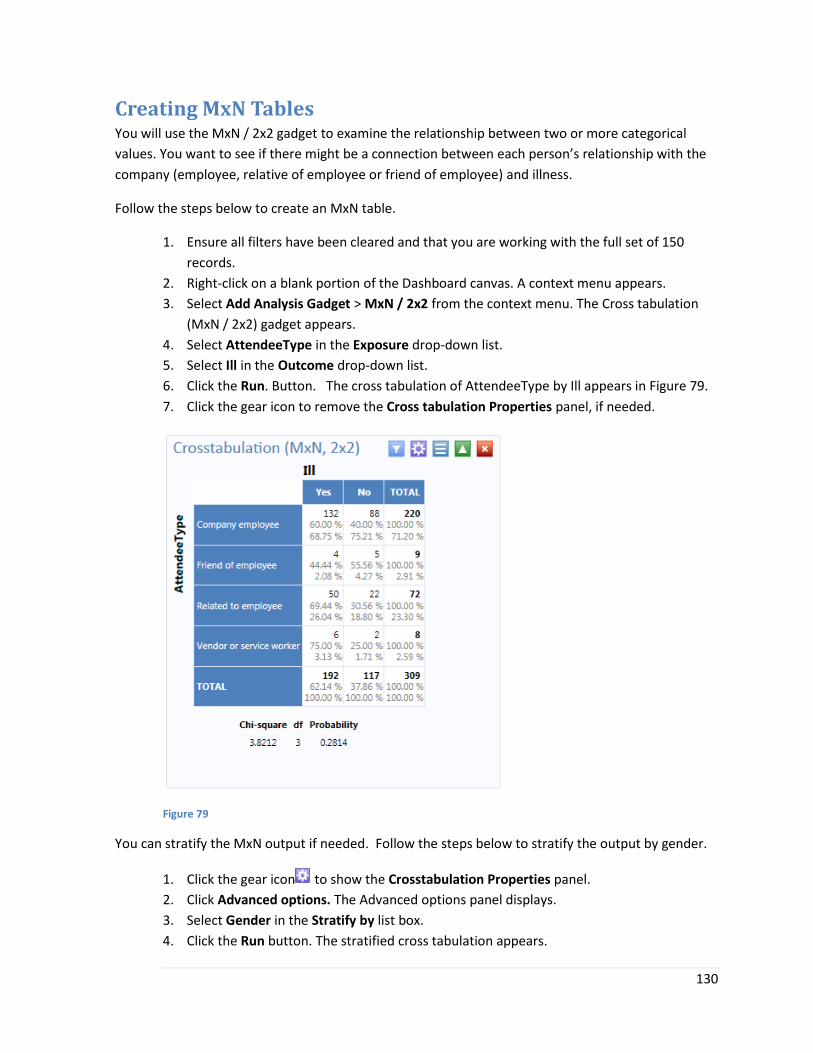
130
Creating MxN Tables You will use the MxN / 2x2 gadget to examine the relationship between two or more categorical
values. You want to see if there might be a connection between each person’s relationship with the
company (employee, relative of employee or friend of employee) and illness.
Follow the steps below to create an MxN table.
1. Ensure all filters have been cleared and that you are working with the full set of 150
records.
2. Right-click on a blank portion of the Dashboard canvas. A context menu appears.
3. Select Add Analysis Gadget > MxN / 2x2 from the context menu. The Cross tabulation
(MxN / 2x2) gadget appears.
4. Select AttendeeType in the Exposure drop-down list.
5. Select Ill in the Outcome drop-down list.
6. Click the Run. Button. The cross tabulation of AttendeeType by Ill appears in Figure 79.
7. Click the gear icon to remove the Cross tabulation Properties panel, if needed.
Figure 79
You can stratify the MxN output if needed. Follow the steps below to stratify the output by gender.
1. Click the gear icon to show the Crosstabulation Properties panel.
2. Click Advanced options. The Advanced options panel displays.
3. Select Gender in the Stratify by list box.
4. Click the Run button. The stratified cross tabulation appears.
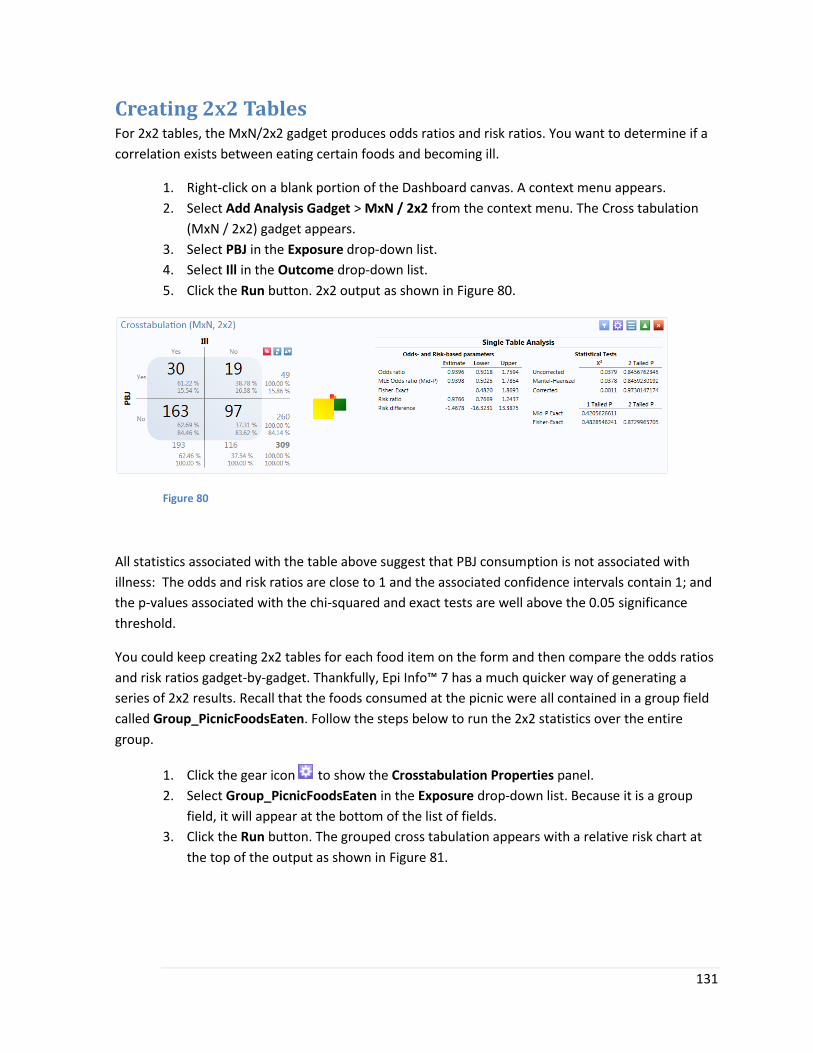
131
Creating 2x2 Tables For 2x2 tables, the MxN/2x2 gadget produces odds ratios and risk ratios. You want to determine if a
correlation exists between eating certain foods and becoming ill.
1. Right-click on a blank portion of the Dashboard canvas. A context menu appears.
2. Select Add Analysis Gadget > MxN / 2x2 from the context menu. The Cross tabulation
(MxN / 2x2) gadget appears.
3. Select PBJ in the Exposure drop-down list.
4. Select Ill in the Outcome drop-down list.
5. Click the Run button. 2x2 output as shown in Figure 80.
Figure 80
All statistics associated with the table above suggest that PBJ consumption is not associated with
illness: The odds and risk ratios are close to 1 and the associated confidence intervals contain 1; and
the p-values associated with the chi-squared and exact tests are well above the 0.05 significance
threshold.
You could keep creating 2x2 tables for each food item on the form and then compare the odds ratios
and risk ratios gadget-by-gadget. Thankfully, Epi Info™ 7 has a much quicker way of generating a
series of 2x2 results. Recall that the foods consumed at the picnic were all contained in a group field
called Group_PicnicFoodsEaten. Follow the steps below to run the 2x2 statistics over the entire
group.
1. Click the gear icon to show the Crosstabulation Properties panel.
2. Select Group_PicnicFoodsEaten in the Exposure drop-down list. Because it is a group
field, it will appear at the bottom of the list of fields.
3. Click the Run button. The grouped cross tabulation appears with a relative risk chart at
the top of the output as shown in Figure 81.

132
Figure 81
The default grouped output will show one 2x2 table for each row in the chart. You can click on an
individual row in the chart to show only the corresponding 2x2 table; all of the other 2x2 tables will
disappear. To do this, follow the steps below:
1. Left-click on the row titled PotatoChips. All of the 2x2 tables except the one for
PotatoChips by Ill disappear.
2. Click on the Expand / show all button to show all of the 2x2 tables.
The chart can also be sorted by clicking on column headers. To sort by the Risk Ratio, follow the steps
below:
1. Left-click on the Risk Ratio column header. The chart is sorted by the risk ratio.
2. Click on the Remove sorting button to stop sorting by risk ratio.
Additional MxN / 2x2 properties The following options are available in the MxN / 2x2 properties panel as shown in Figure 82.
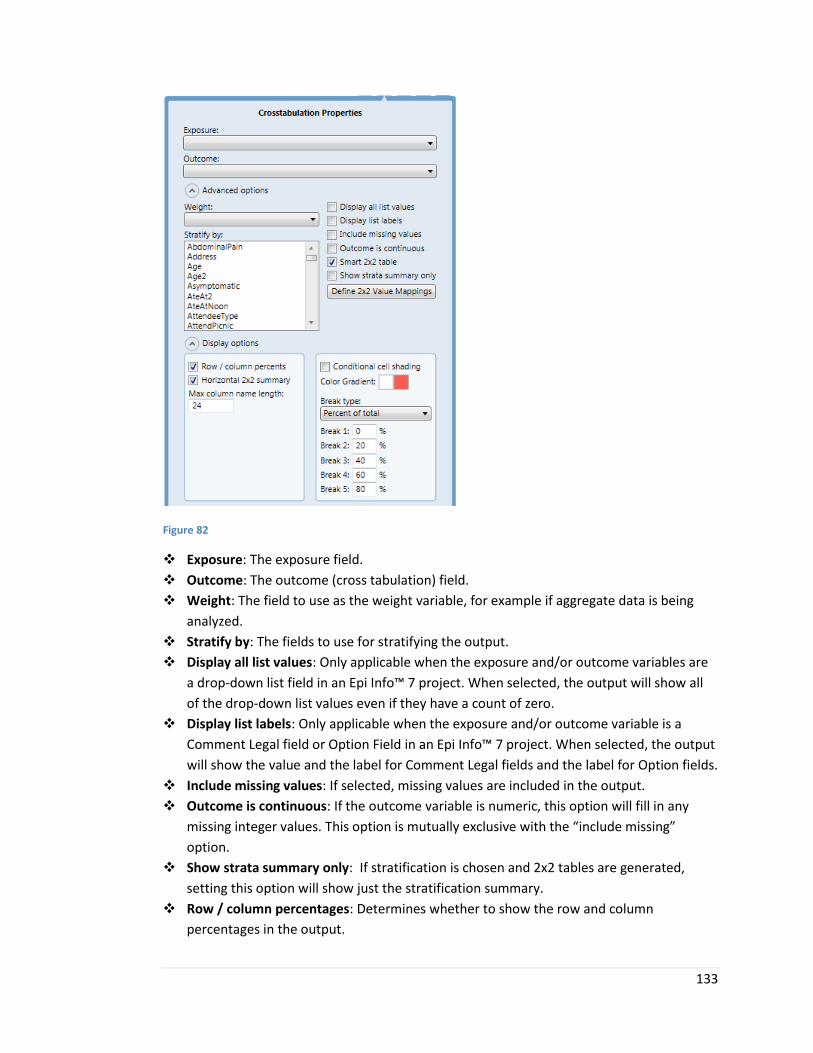
133
Figure 82
Exposure: The exposure field.
Outcome: The outcome (cross tabulation) field.
Weight: The field to use as the weight variable, for example if aggregate data is being
analyzed.
Stratify by: The fields to use for stratifying the output.
Display all list values: Only applicable when the exposure and/or outcome variables are
a drop-down list field in an Epi Info™ 7 project. When selected, the output will show all
of the drop-down list values even if they have a count of zero.
Display list labels: Only applicable when the exposure and/or outcome variable is a
Comment Legal field or Option Field in an Epi Info™ 7 project. When selected, the output
will show the value and the label for Comment Legal fields and the label for Option fields.
Include missing values: If selected, missing values are included in the output.
Outcome is continuous: If the outcome variable is numeric, this option will fill in any
missing integer values. This option is mutually exclusive with the “include missing”
option.
Show strata summary only: If stratification is chosen and 2x2 tables are generated,
setting this option will show just the stratification summary.
Row / column percentages: Determines whether to show the row and column
percentages in the output.

134
Smart 2x2 table: If selected, the 2x2 table attempts to place what it assumes is the
‘positive’ value into the first position. If cleared, it will sort the values alphabetically.
Horizontal 2x2 summary: Displays statistical results either horizontally or vertically.
Show strata summary only: If stratification is chosen and 2x2 tables are generated,
setting this option will show just the stratification summary.
Max column name length: Use to limit the size of very long column headings.
Conditionally cell shading: Incorporates gradient color shading based on cell numbers.
Break type: Percent of total or counts for conditional cell shading feature.
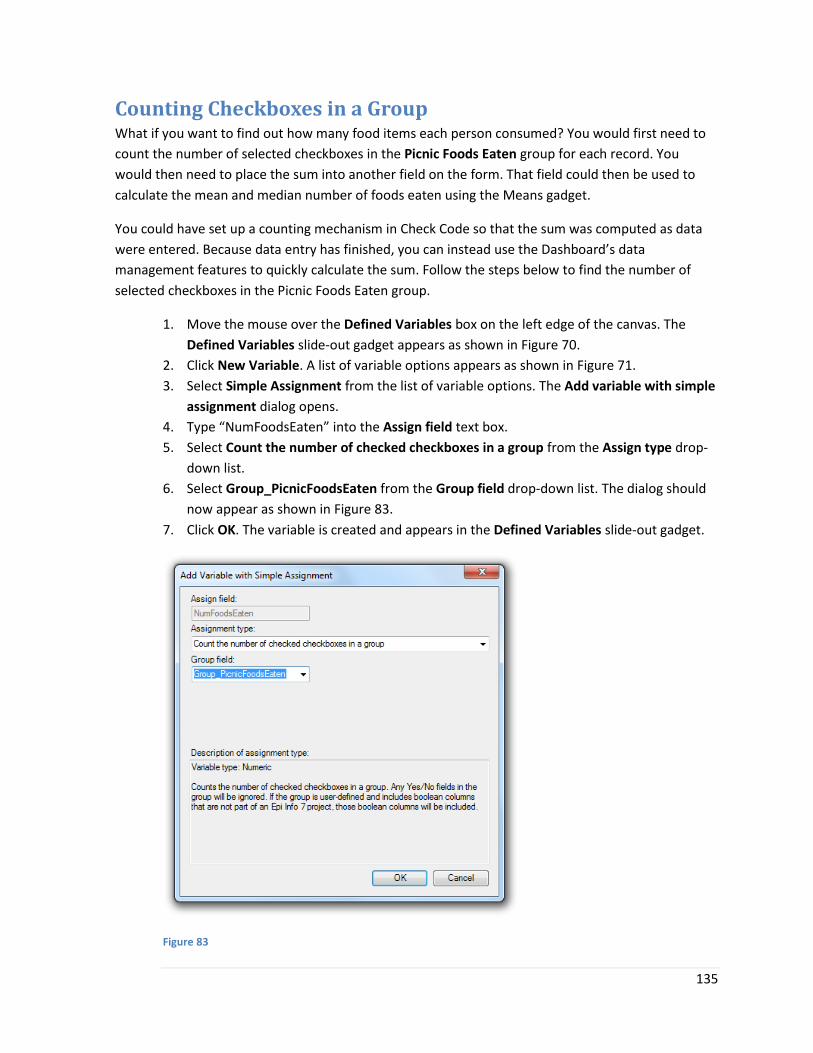
135
Counting Checkboxes in a Group What if you want to find out how many food items each person consumed? You would first need to
count the number of selected checkboxes in the Picnic Foods Eaten group for each record. You
would then need to place the sum into another field on the form. That field could then be used to
calculate the mean and median number of foods eaten using the Means gadget.
You could have set up a counting mechanism in Check Code so that the sum was computed as data
were entered. Because data entry has finished, you can instead use the Dashboard’s data
management features to quickly calculate the sum. Follow the steps below to find the number of
selected checkboxes in the Picnic Foods Eaten group.
1. Move the mouse over the Defined Variables box on the left edge of the canvas. The
Defined Variables slide-out gadget appears as shown in Figure 70.
2. Click New Variable. A list of variable options appears as shown in Figure 71.
3. Select Simple Assignment from the list of variable options. The Add variable with simple
assignment dialog opens.
4. Type “NumFoodsEaten” into the Assign field text box.
5. Select Count the number of checked checkboxes in a group from the Assign type drop-
down list.
6. Select Group_PicnicFoodsEaten from the Group field drop-down list. The dialog should
now appear as shown in Figure 83.
7. Click OK. The variable is created and appears in the Defined Variables slide-out gadget.
Figure 83
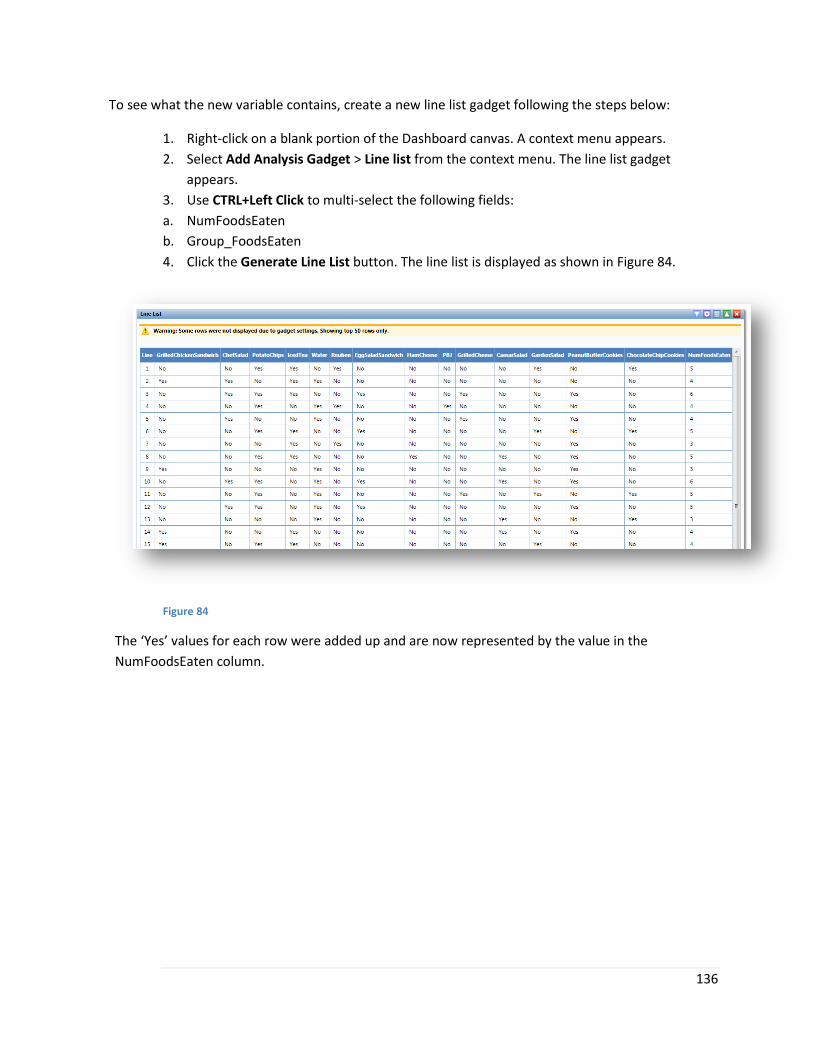
136
To see what the new variable contains, create a new line list gadget following the steps below:
1. Right-click on a blank portion of the Dashboard canvas. A context menu appears.
2. Select Add Analysis Gadget > Line list from the context menu. The line list gadget
appears.
3. Use CTRL+Left Click to multi-select the following fields:
a. NumFoodsEaten
b. Group_FoodsEaten
4. Click the Generate Line List button. The line list is displayed as shown in Figure 84.
Figure 84
The ‘Yes’ values for each row were added up and are now represented by the value in the
NumFoodsEaten column.
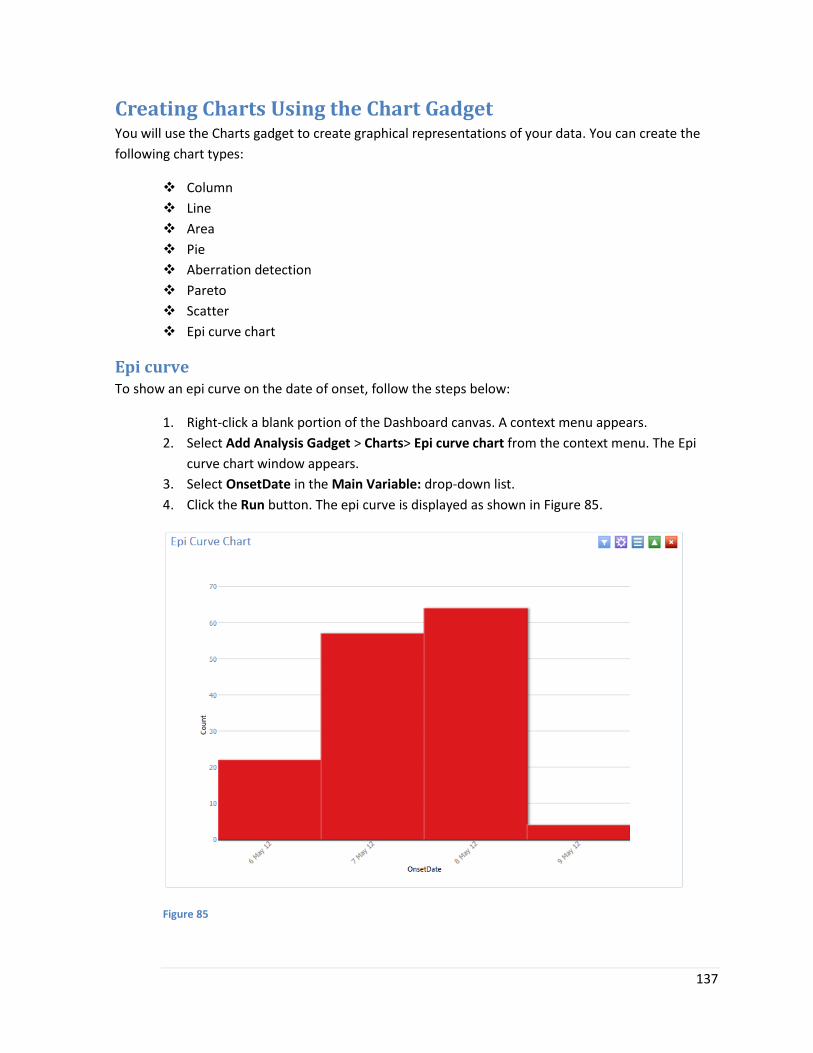
137
Creating Charts Using the Chart Gadget You will use the Charts gadget to create graphical representations of your data. You can create the
following chart types:
Column
Line
Area
Pie
Aberration detection
Pareto
Scatter
Epi curve chart
Epi curve To show an epi curve on the date of onset, follow the steps below:
1. Right-click a blank portion of the Dashboard canvas. A context menu appears.
2. Select Add Analysis Gadget > Charts> Epi curve chart from the context menu. The Epi
curve chart window appears.
3. Select OnsetDate in the Main Variable: drop-down list.
4. Click the Run button. The epi curve is displayed as shown in Figure 85.
Figure 85
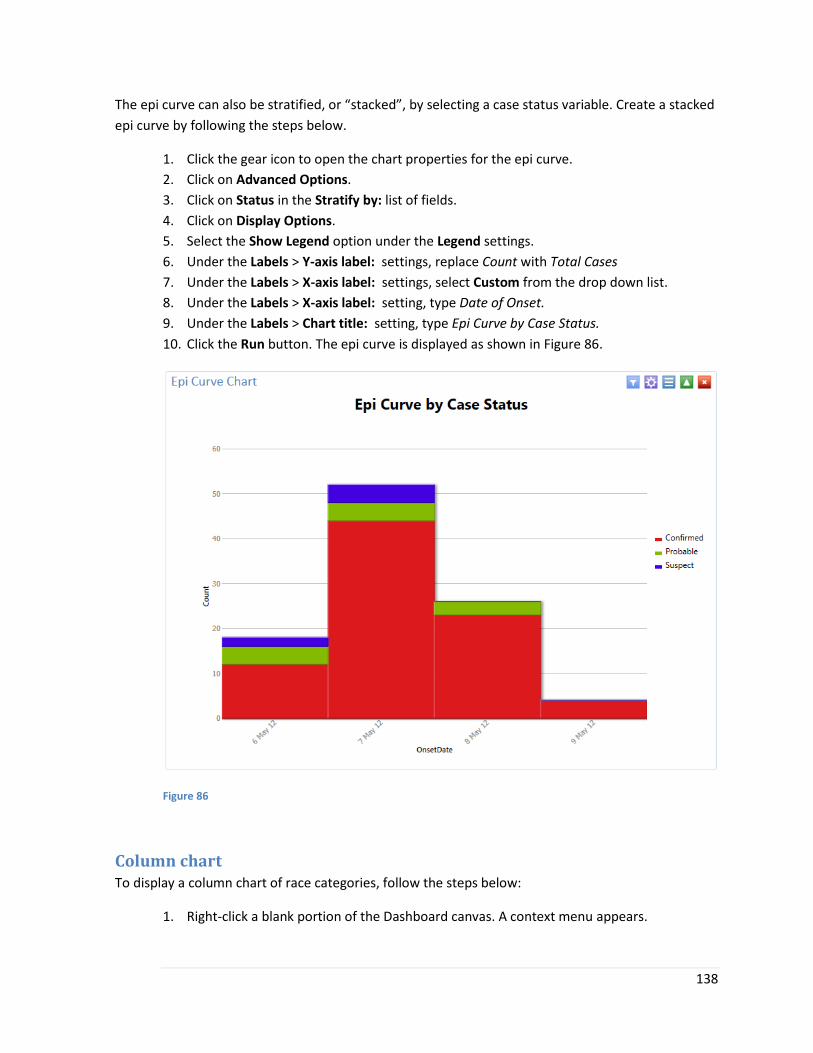
138
The epi curve can also be stratified, or “stacked”, by selecting a case status variable. Create a stacked
epi curve by following the steps below.
1. Click the gear icon to open the chart properties for the epi curve.
2. Click on Advanced Options.
3. Click on Status in the Stratify by: list of fields.
4. Click on Display Options.
5. Select the Show Legend option under the Legend settings.
6. Under the Labels > Y-axis label: settings, replace Count with Total Cases
7. Under the Labels > X-axis label: settings, select Custom from the drop down list.
8. Under the Labels > X-axis label: setting, type Date of Onset.
9. Under the Labels > Chart title: setting, type Epi Curve by Case Status.
10. Click the Run button. The epi curve is displayed as shown in Figure 86.
Figure 86
Column chart To display a column chart of race categories, follow the steps below:
1. Right-click a blank portion of the Dashboard canvas. A context menu appears.
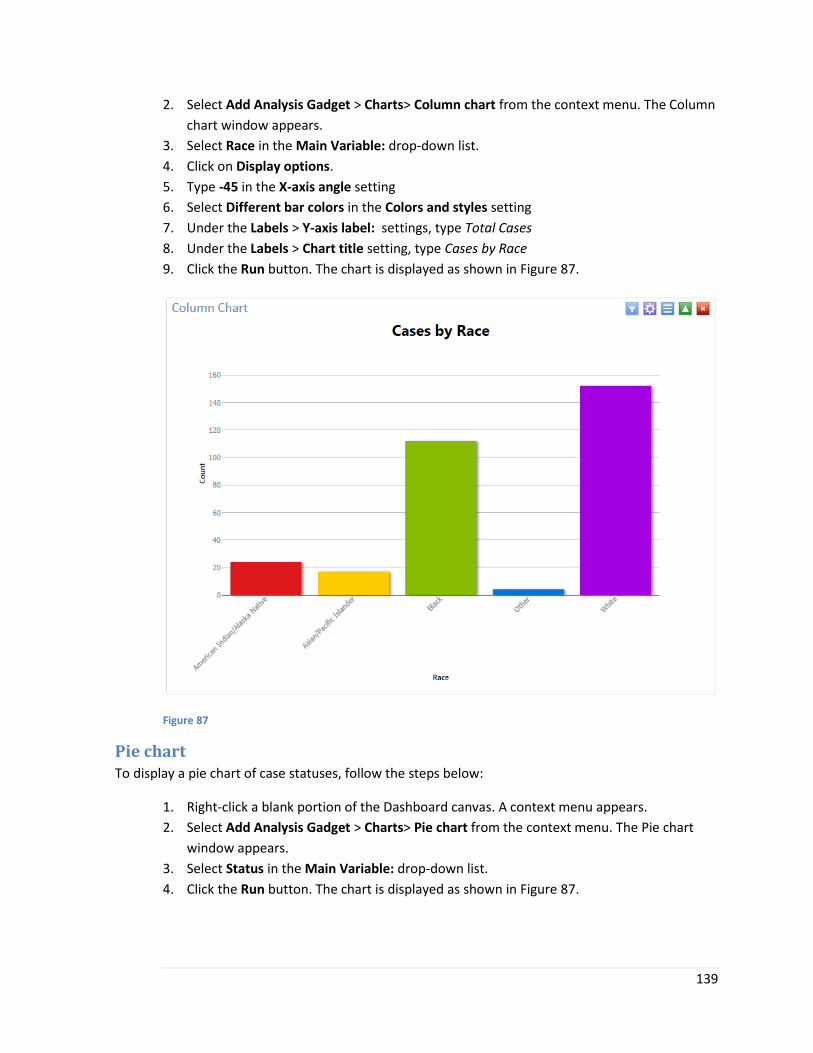
139
2. Select Add Analysis Gadget > Charts> Column chart from the context menu. The Column
chart window appears.
3. Select Race in the Main Variable: drop-down list.
4. Click on Display options.
5. Type -45 in the X-axis angle setting
6. Select Different bar colors in the Colors and styles setting
7. Under the Labels > Y-axis label: settings, type Total Cases
8. Under the Labels > Chart title setting, type Cases by Race
9. Click the Run button. The chart is displayed as shown in Figure 87.
Figure 87
Pie chart To display a pie chart of case statuses, follow the steps below:
1. Right-click a blank portion of the Dashboard canvas. A context menu appears.
2. Select Add Analysis Gadget > Charts> Pie chart from the context menu. The Pie chart
window appears.
3. Select Status in the Main Variable: drop-down list.
4. Click the Run button. The chart is displayed as shown in Figure 87.
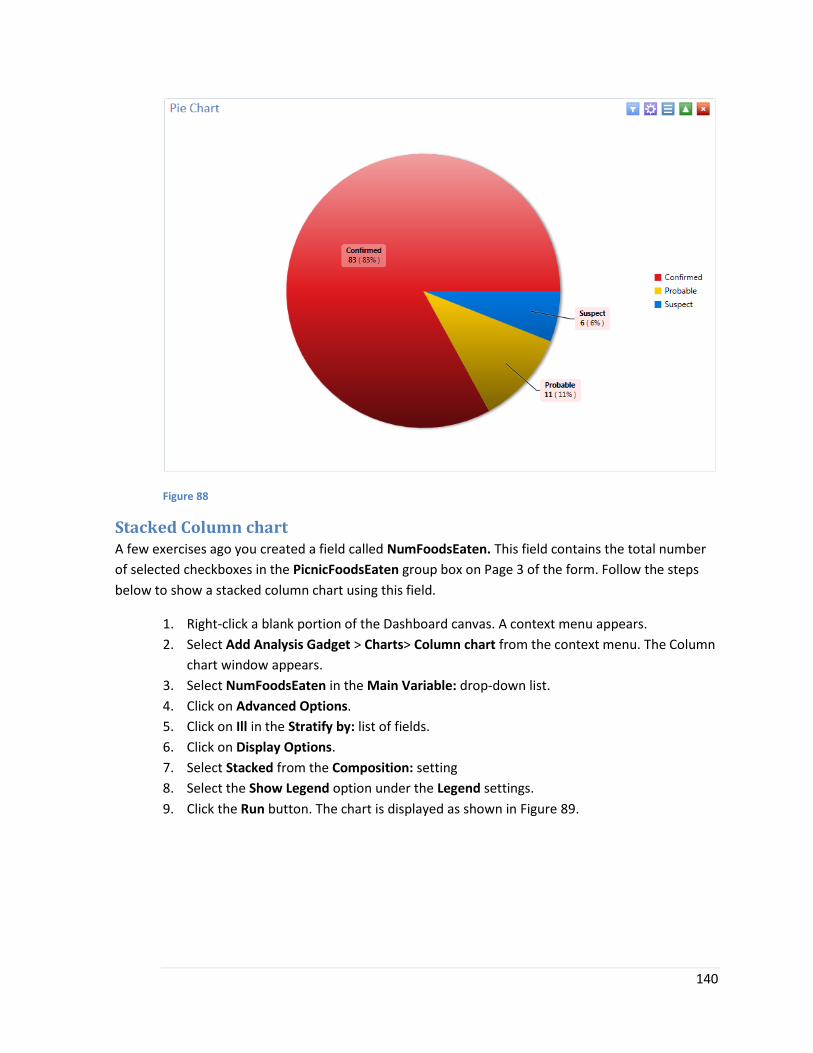
140
Figure 88
Stacked Column chart A few exercises ago you created a field called NumFoodsEaten. This field contains the total number
of selected checkboxes in the PicnicFoodsEaten group box on Page 3 of the form. Follow the steps
below to show a stacked column chart using this field.
1. Right-click a blank portion of the Dashboard canvas. A context menu appears.
2. Select Add Analysis Gadget > Charts> Column chart from the context menu. The Column
chart window appears.
3. Select NumFoodsEaten in the Main Variable: drop-down list.
4. Click on Advanced Options.
5. Click on Ill in the Stratify by: list of fields.
6. Click on Display Options.
7. Select Stacked from the Composition: setting
8. Select the Show Legend option under the Legend settings.
9. Click the Run button. The chart is displayed as shown in Figure 89.
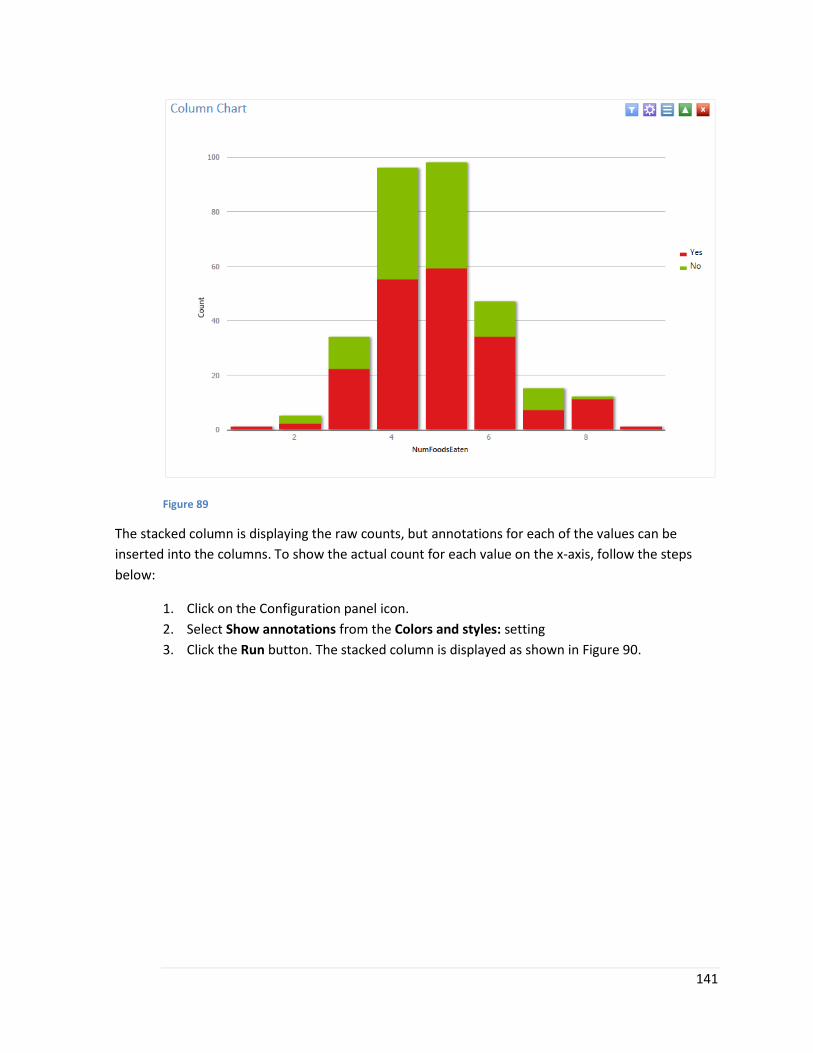
141
Figure 89
The stacked column is displaying the raw counts, but annotations for each of the values can be
inserted into the columns. To show the actual count for each value on the x-axis, follow the steps
below:
1. Click on the Configuration panel icon.
2. Select Show annotations from the Colors and styles: setting
3. Click the Run button. The stacked column is displayed as shown in Figure 90.
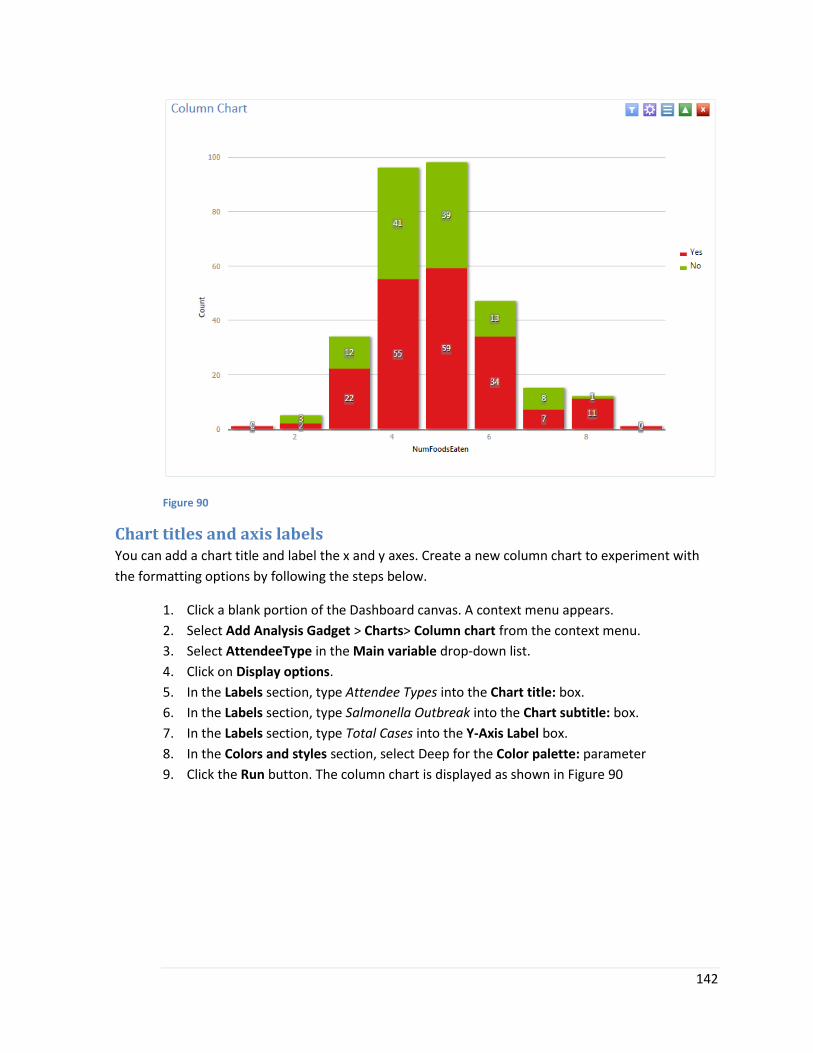
142
Figure 90
Chart titles and axis labels You can add a chart title and label the x and y axes. Create a new column chart to experiment with
the formatting options by following the steps below.
1. Click a blank portion of the Dashboard canvas. A context menu appears.
2. Select Add Analysis Gadget > Charts> Column chart from the context menu.
3. Select AttendeeType in the Main variable drop-down list.
4. Click on Display options.
5. In the Labels section, type Attendee Types into the Chart title: box.
6. In the Labels section, type Salmonella Outbreak into the Chart subtitle: box.
7. In the Labels section, type Total Cases into the Y-Axis Label box.
8. In the Colors and styles section, select Deep for the Color palette: parameter
9. Click the Run button. The column chart is displayed as shown in Figure 90
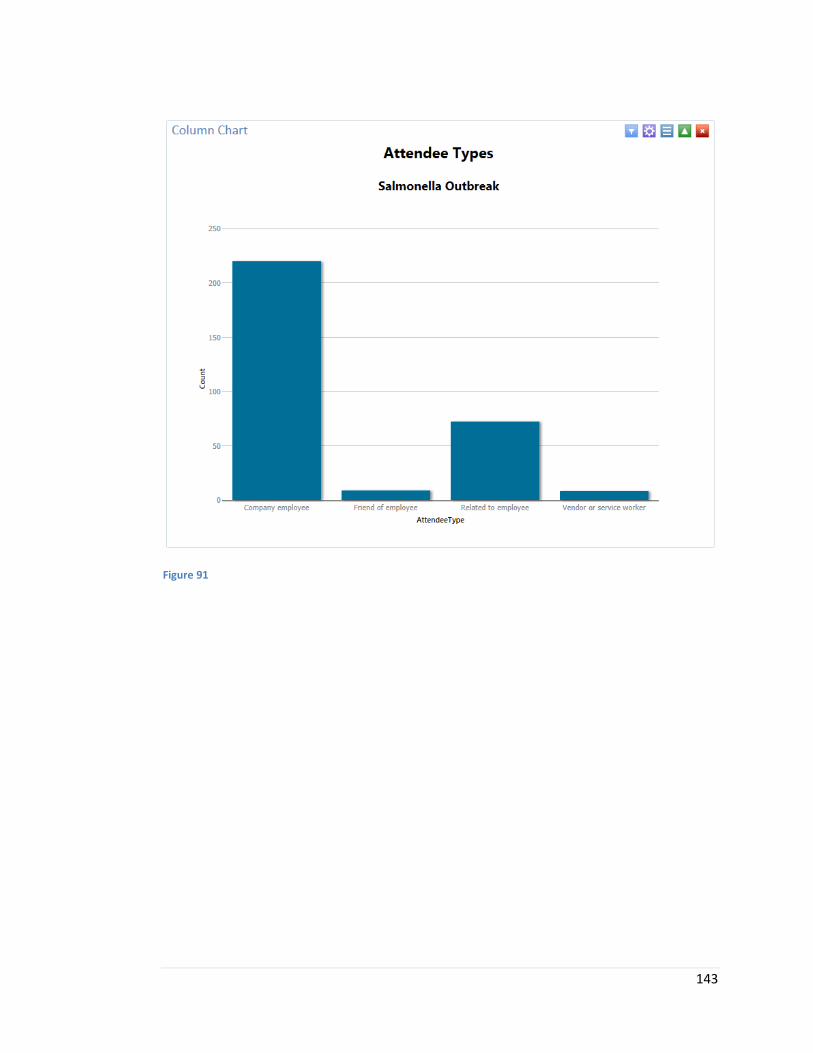
143
Figure 91
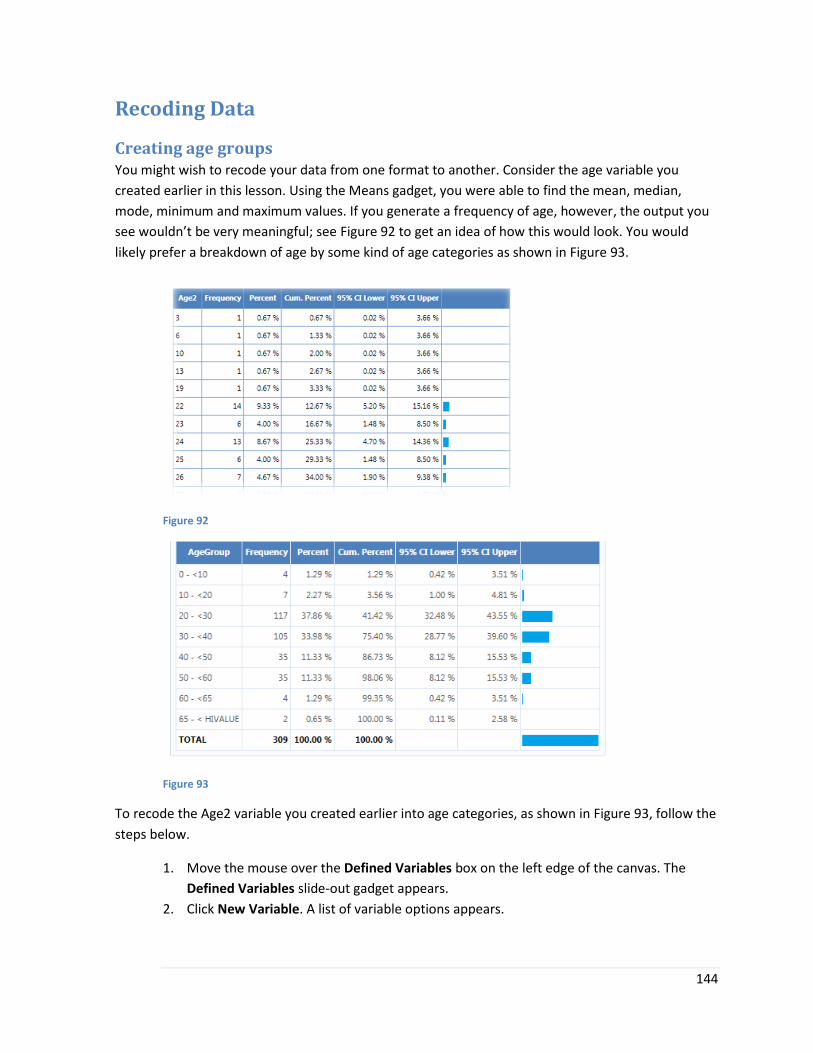
144
Recoding Data
Creating age groups You might wish to recode your data from one format to another. Consider the age variable you
created earlier in this lesson. Using the Means gadget, you were able to find the mean, median,
mode, minimum and maximum values. If you generate a frequency of age, however, the output you
see wouldn’t be very meaningful; see Figure 92 to get an idea of how this would look. You would
likely prefer a breakdown of age by some kind of age categories as shown in Figure 93.
Figure 92
Figure 93
To recode the Age2 variable you created earlier into age categories, as shown in Figure 93, follow the
steps below.
1. Move the mouse over the Defined Variables box on the left edge of the canvas. The
Defined Variables slide-out gadget appears.
2. Click New Variable. A list of variable options appears.
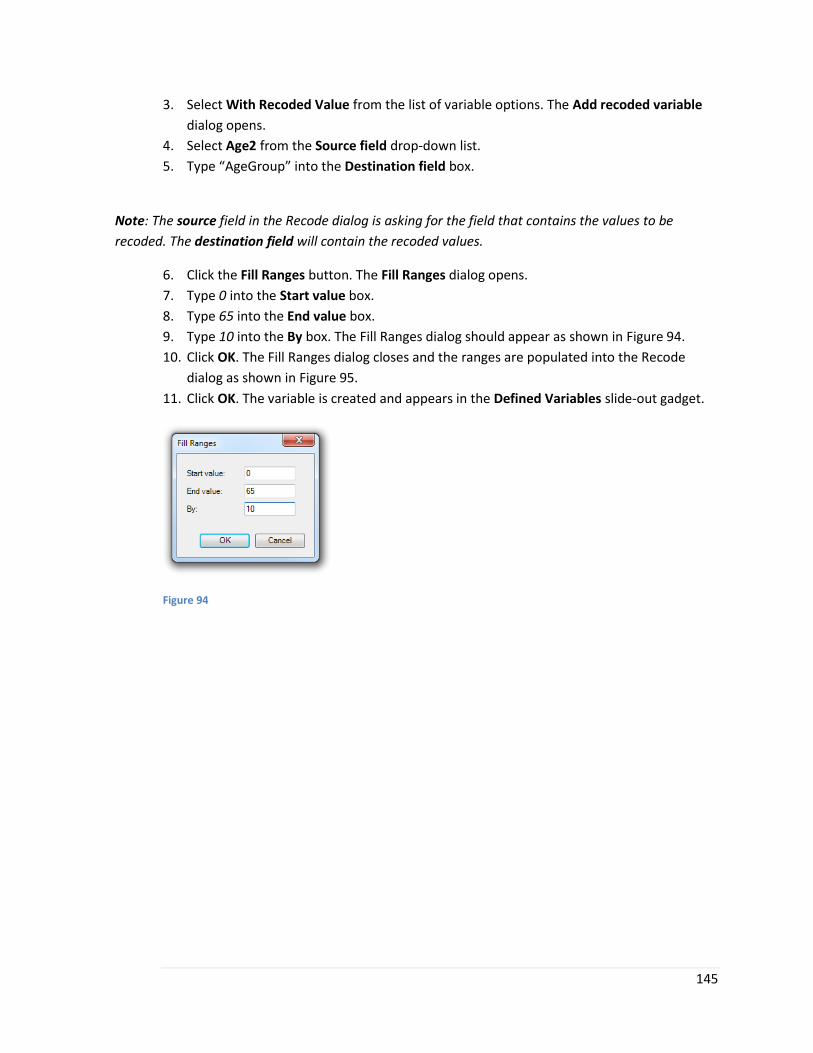
145
3. Select With Recoded Value from the list of variable options. The Add recoded variable
dialog opens.
4. Select Age2 from the Source field drop-down list.
5. Type “AgeGroup” into the Destination field box.
Note: The source field in the Recode dialog is asking for the field that contains the values to be
recoded. The destination field will contain the recoded values.
6. Click the Fill Ranges button. The Fill Ranges dialog opens.
7. Type 0 into the Start value box.
8. Type 65 into the End value box.
9. Type 10 into the By box. The Fill Ranges dialog should appear as shown in Figure 94.
10. Click OK. The Fill Ranges dialog closes and the ranges are populated into the Recode
dialog as shown in Figure 95.
11. Click OK. The variable is created and appears in the Defined Variables slide-out gadget.
Figure 94
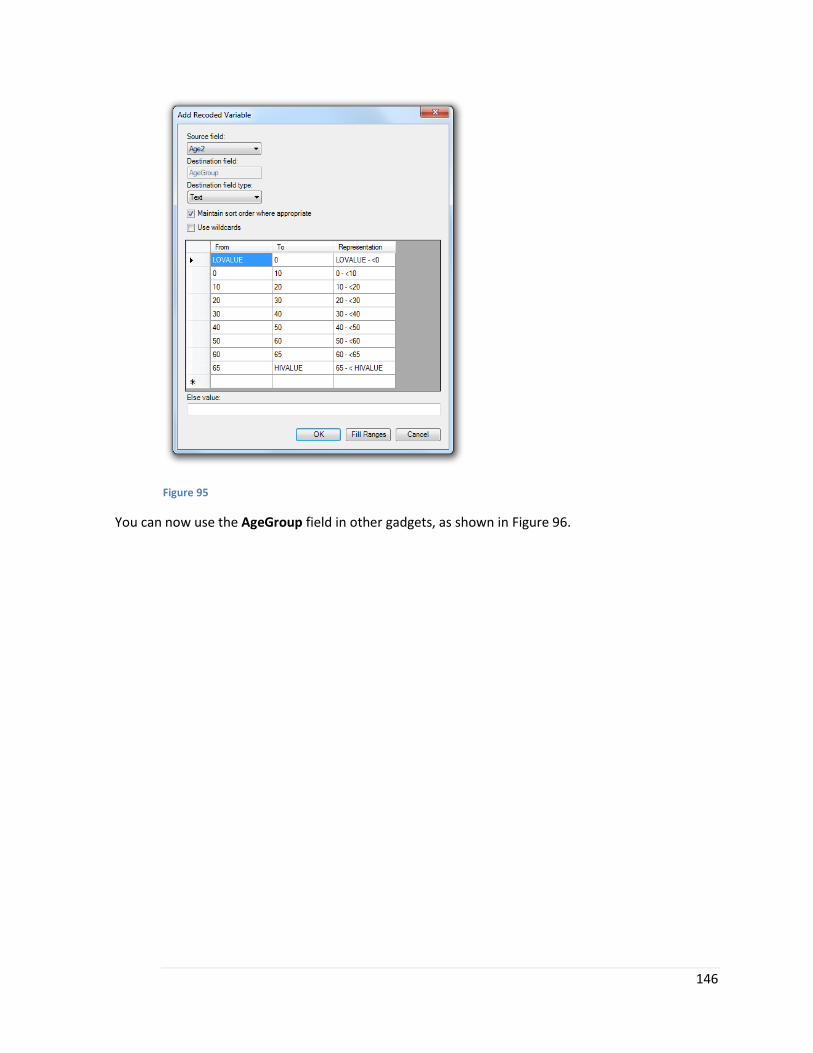
146
Figure 95
You can now use the AgeGroup field in other gadgets, as shown in Figure 96.
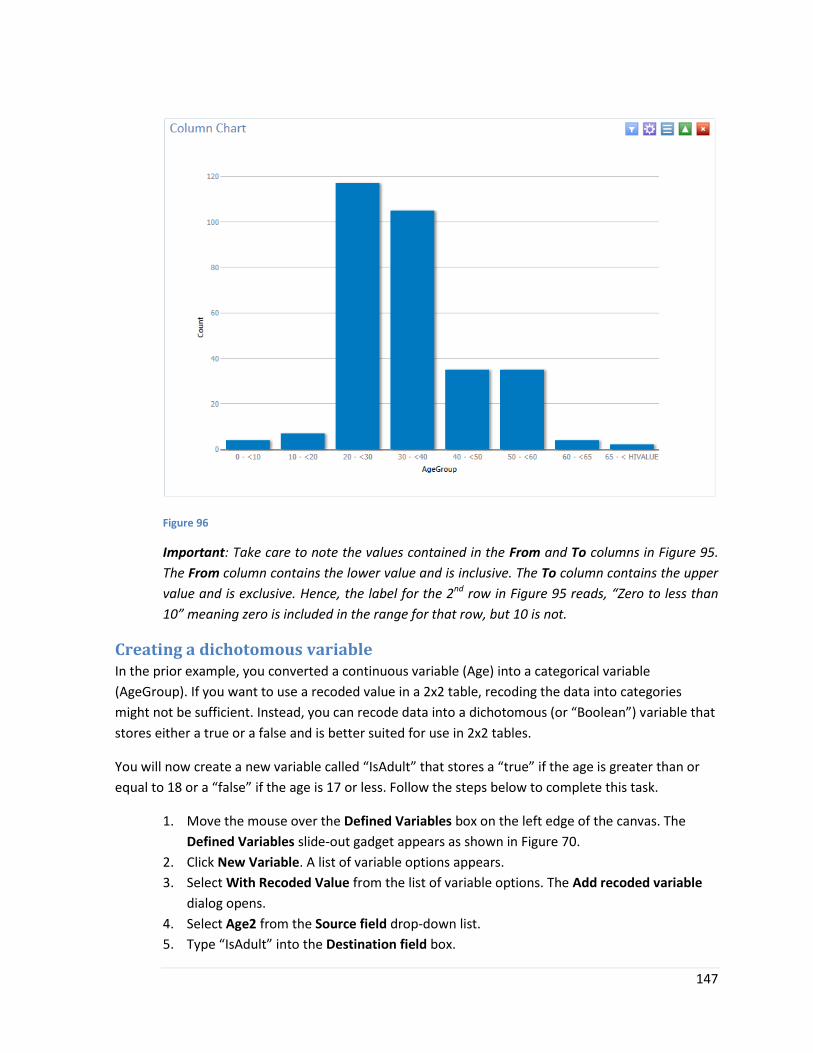
147
Figure 96
Important: Take care to note the values contained in the From and To columns in Figure 95.
The From column contains the lower value and is inclusive. The To column contains the upper
value and is exclusive. Hence, the label for the 2nd row in Figure 95 reads, “Zero to less than
10” meaning zero is included in the range for that row, but 10 is not.
Creating a dichotomous variable In the prior example, you converted a continuous variable (Age) into a categorical variable
(AgeGroup). If you want to use a recoded value in a 2x2 table, recoding the data into categories
might not be sufficient. Instead, you can recode data into a dichotomous (or “Boolean”) variable that
stores either a true or a false and is better suited for use in 2x2 tables.
You will now create a new variable called “IsAdult” that stores a “true” if the age is greater than or
equal to 18 or a “false” if the age is 17 or less. Follow the steps below to complete this task.
1. Move the mouse over the Defined Variables box on the left edge of the canvas. The
Defined Variables slide-out gadget appears as shown in Figure 70.
2. Click New Variable. A list of variable options appears.
3. Select With Recoded Value from the list of variable options. The Add recoded variable
dialog opens.
4. Select Age2 from the Source field drop-down list.
5. Type “IsAdult” into the Destination field box.
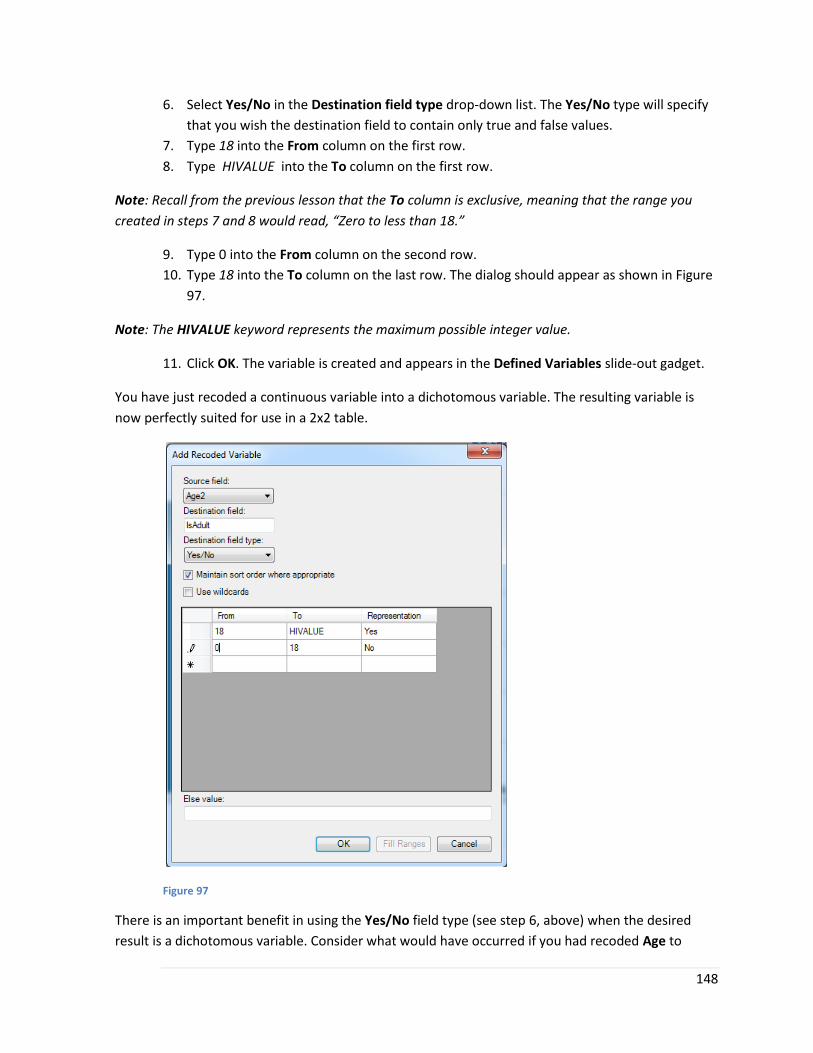
148
6. Select Yes/No in the Destination field type drop-down list. The Yes/No type will specify
that you wish the destination field to contain only true and false values.
7. Type 18 into the From column on the first row.
8. Type HIVALUE into the To column on the first row.
Note: Recall from the previous lesson that the To column is exclusive, meaning that the range you
created in steps 7 and 8 would read, “Zero to less than 18.”
9. Type 0 into the From column on the second row.
10. Type 18 into the To column on the last row. The dialog should appear as shown in Figure
97.
Note: The HIVALUE keyword represents the maximum possible integer value.
11. Click OK. The variable is created and appears in the Defined Variables slide-out gadget.
You have just recoded a continuous variable into a dichotomous variable. The resulting variable is
now perfectly suited for use in a 2x2 table.
Figure 97
There is an important benefit in using the Yes/No field type (see step 6, above) when the desired
result is a dichotomous variable. Consider what would have occurred if you had recoded Age to
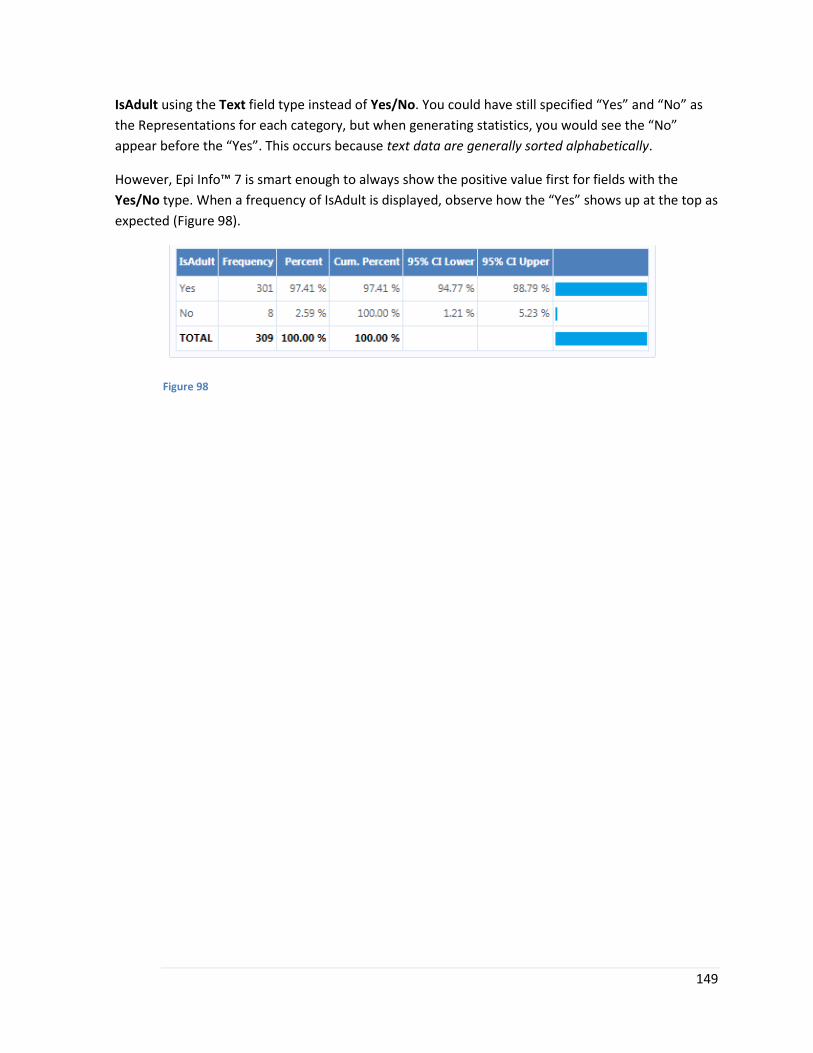
149
IsAdult using the Text field type instead of Yes/No. You could have still specified “Yes” and “No” as
the Representations for each category, but when generating statistics, you would see the “No”
appear before the “Yes”. This occurs because text data are generally sorted alphabetically.
However, Epi Info™ 7 is smart enough to always show the positive value first for fields with the
Yes/No type. When a frequency of IsAdult is displayed, observe how the “Yes” shows up at the top as
expected (Figure 98).
Figure 98

150
Combining Variables Earlier, you learned how to use the Combined Frequency gadget to treat a group of variables as if
they were a single variable. However, you might want to combine variables together in such a way
that you can use them in other gadgets. Assume that you want to create a new variable that stores a
“true” if the record is a male and is over the age of 50, and a “false” otherwise, with the intention of
using it in a 2x2 table.
With the current variables in the data set, you cannot easily carry out this type of analysis.
Furthermore, using the recoding capabilities would only allow you to recode one variable; it can’t
combine two variables together.
The solution is to use the Conditional Assignment option. The Conditional Assignment allows you to
specify that a variable be assigned a value only when a specific condition is met. (It is quite similar to
how the If Command works that was covered in Lesson 2.) To create a conditional assignment, follow
the steps below.
1. Move the mouse over the Defined Variables box on the left edge of the canvas. The
Defined Variables slide-out gadget appears.
2. Click New Variable. A list of variable options appears.
3. Select With Conditional Assignment from the list of variable options. The Add variable
with conditional assignment dialog opens.
4. Type IsMaleOver50 into the Assign field box.
5. Select Yes/No from the Assign field type drop-down list.
6. Click the Create/Edit Condition button. The Specify assign condition dialog appears.
(This dialog operates in the same way as the Data Filter slide-out gadget.)
7. Select Gender in the Field Name drop-down list.
8. Select is equal to in the Operator drop-down list.
9. Select Male in the Value drop-down list.
10. Click Add condition. The condition is added to the Conditions grid view.
11. Select Age in the Field Name drop-down list.
12. Select is greater than in the Operator drop-down list.
13. Type 50 in the Value drop-down list.
14. Click Add condition. A context menu appears asking how you would like to add this new
condition to the one already present.
15. Select Add condition with AND. The condition is added to the Conditions grid view. The
Specify assign condition dialog should now appear as shown in Figure 99.
16. Click OK. The Specify assign condition dialog closes and the Assign condition box in the
Conditional Assign dialog has changed to show the condition you created.
17. Select Yes in the Assign value drop-down list.
18. Check the Use Else checkbox.
19. Select No in the Else value drop-down list. The Conditional Assign dialog should now
appear as shown in Figure 100.
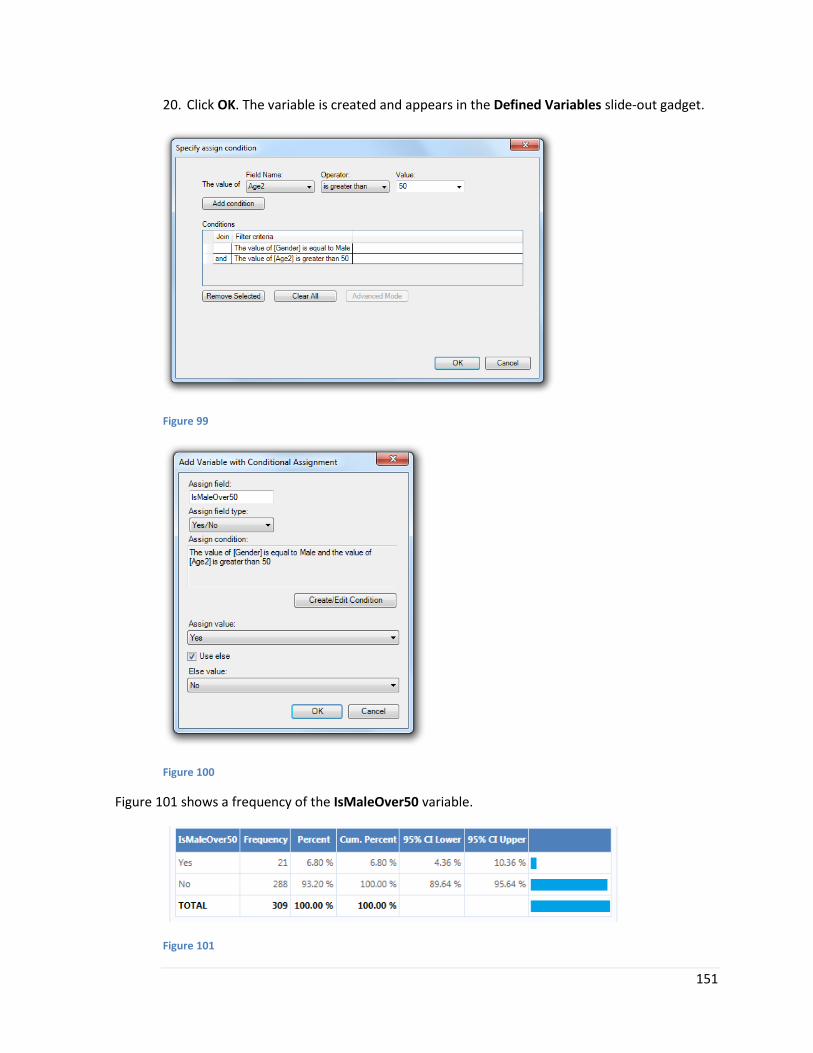
151
20. Click OK. The variable is created and appears in the Defined Variables slide-out gadget.
Figure 99
Figure 100
Figure 101 shows a frequency of the IsMaleOver50 variable.
Figure 101

152
Student Practice 2 You’ve been shown how to display data using gadgets, filter records based on one or more
conditions, and manipulate data by creating new variables. Your main objective is to identify the
source of this outbreak. Previously, when 2x2 tables were performed on the food items, you noticed
that there were multiple food items with OR > 1. Perhaps you need to investigate the ingredients
used to prepare the food items. A common ingredient might have been the cause of the outbreak.
Here is a list of the different ingredients that were used to prepare the different items:
Chef salad- Iceberg lettuce, ham, turkey, egg, cheddar cheese, tomato, carrots,
Italian dressing
Peanut butter and Jelly sandwich- Grape jelly, Jif peanut butter, wheat bread
Reuben sandwich- Rye bread, corned beef, sauerkraut, Thousand Island Dressing,
Swiss cheese
Grilled Cheese- Cheddar cheese, Provolone, wheat bread
Egg Salad Sandwich- egg, mayonnaise, relish, white bread
Ham and Cheese Sandwich- Ham, Provolone, mayonnaise, wheat bread
Chicken Sandwich- Grilled chicken, honey mustard, lettuce, tomato, wheat bun
Peanut butter cookies-peanut butter cookie dough
Chocolate chip cookies- chocolate chip cookie dough
Water
Iced tea-water and tea bags
Potato chips- Kettle chips
In the Visual Dashboard, you can create new variables using Conditional Assignments in order to
group food items consumed during the picnic to a specific ingredient. Perform 2x2 tables with these
new variables to continue your analysis. Try using the Combining Variables example shown above to
create variables for each of the ingredients you consider can be the possible source for the outbreak.
Note: Steps to steps instructions for creating this new variable are shown in Student Practice 2 -
Lesson 4 of the Appendix.
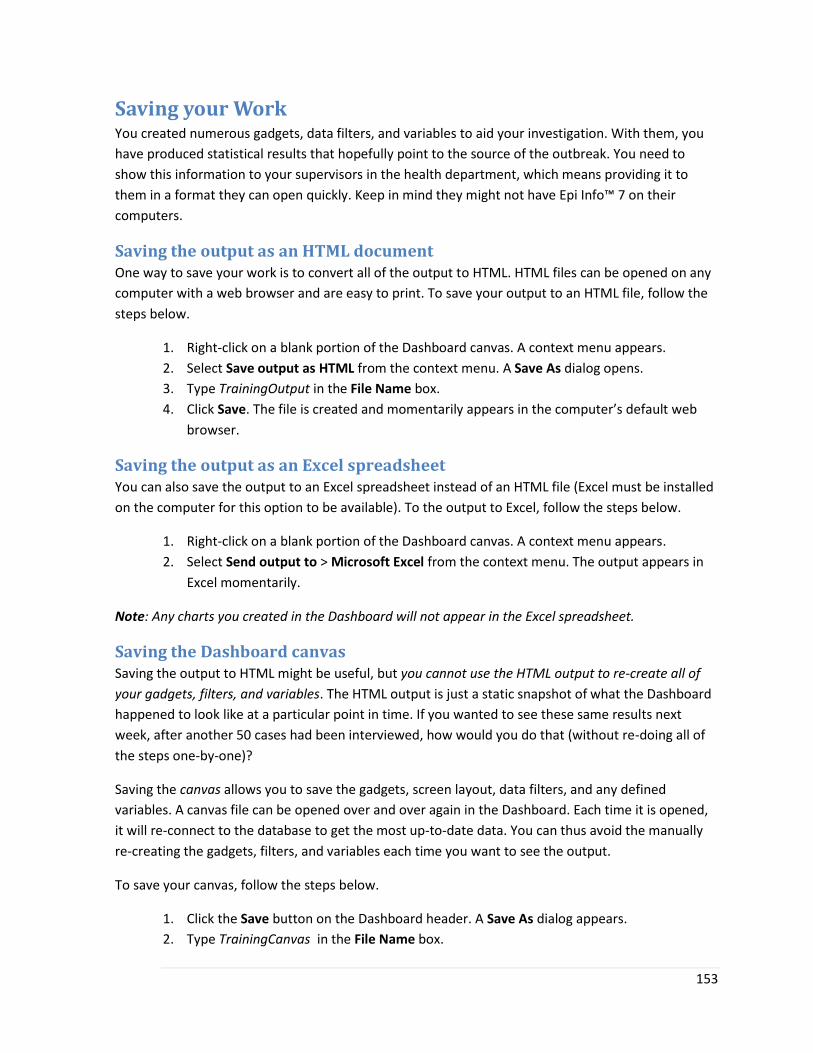
153
Saving your Work You created numerous gadgets, data filters, and variables to aid your investigation. With them, you
have produced statistical results that hopefully point to the source of the outbreak. You need to
show this information to your supervisors in the health department, which means providing it to
them in a format they can open quickly. Keep in mind they might not have Epi Info™ 7 on their
computers.
Saving the output as an HTML document One way to save your work is to convert all of the output to HTML. HTML files can be opened on any
computer with a web browser and are easy to print. To save your output to an HTML file, follow the
steps below.
1. Right-click on a blank portion of the Dashboard canvas. A context menu appears.
2. Select Save output as HTML from the context menu. A Save As dialog opens.
3. Type TrainingOutput in the File Name box.
4. Click Save. The file is created and momentarily appears in the computer’s default web
browser.
Saving the output as an Excel spreadsheet You can also save the output to an Excel spreadsheet instead of an HTML file (Excel must be installed
on the computer for this option to be available). To the output to Excel, follow the steps below.
1. Right-click on a blank portion of the Dashboard canvas. A context menu appears.
2. Select Send output to > Microsoft Excel from the context menu. The output appears in
Excel momentarily.
Note: Any charts you created in the Dashboard will not appear in the Excel spreadsheet.
Saving the Dashboard canvas Saving the output to HTML might be useful, but you cannot use the HTML output to re-create all of
your gadgets, filters, and variables. The HTML output is just a static snapshot of what the Dashboard
happened to look like at a particular point in time. If you wanted to see these same results next
week, after another 50 cases had been interviewed, how would you do that (without re-doing all of
the steps one-by-one)?
Saving the canvas allows you to save the gadgets, screen layout, data filters, and any defined
variables. A canvas file can be opened over and over again in the Dashboard. Each time it is opened,
it will re-connect to the database to get the most up-to-date data. You can thus avoid the manually
re-creating the gadgets, filters, and variables each time you want to see the output.
To save your canvas, follow the steps below.
1. Click the Save button on the Dashboard header. A Save As dialog appears.
2. Type TrainingCanvas in the File Name box.
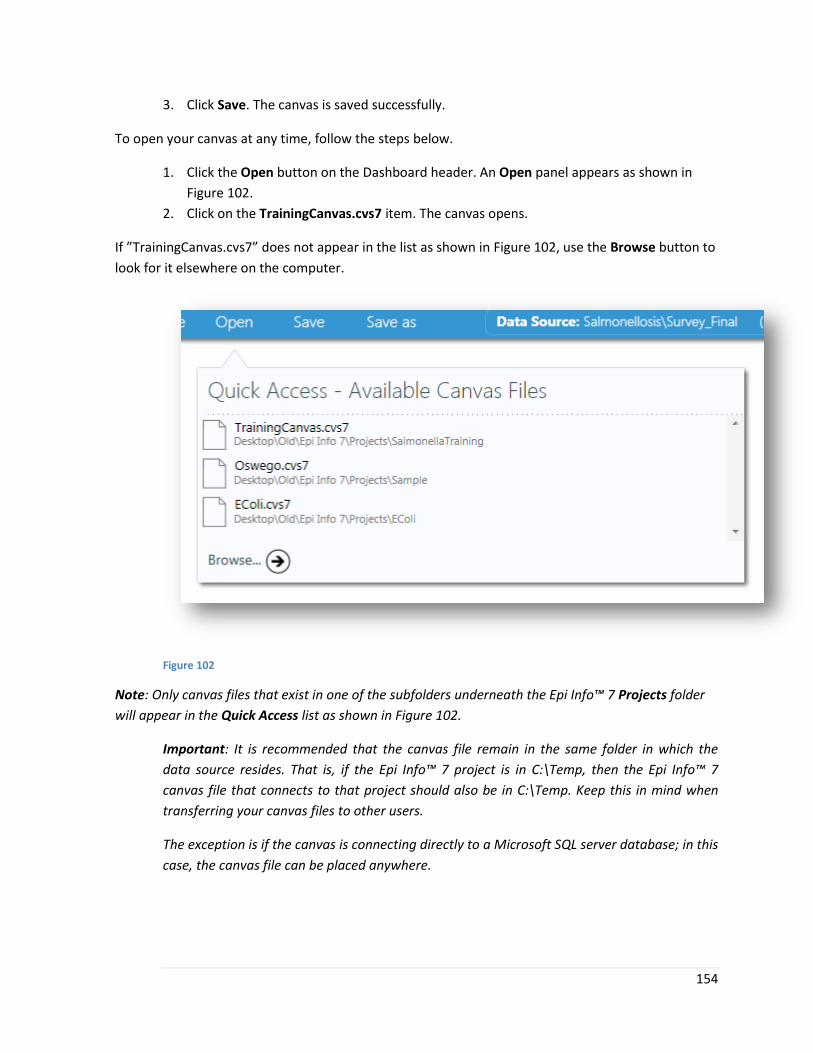
154
3. Click Save. The canvas is saved successfully.
To open your canvas at any time, follow the steps below.
1. Click the Open button on the Dashboard header. An Open panel appears as shown in
Figure 102.
2. Click on the TrainingCanvas.cvs7 item. The canvas opens.
If ”TrainingCanvas.cvs7” does not appear in the list as shown in Figure 102, use the Browse button to
look for it elsewhere on the computer.
Figure 102
Note: Only canvas files that exist in one of the subfolders underneath the Epi Info™ 7 Projects folder
will appear in the Quick Access list as shown in Figure 102.
Important: It is recommended that the canvas file remain in the same folder in which the
data source resides. That is, if the Epi Info™ 7 project is in C:\Temp, then the Epi Info™ 7
canvas file that connects to that project should also be in C:\Temp. Keep this in mind when
transferring your canvas files to other users.
The exception is if the canvas is connecting directly to a Microsoft SQL server database; in this
case, the canvas file can be placed anywhere.
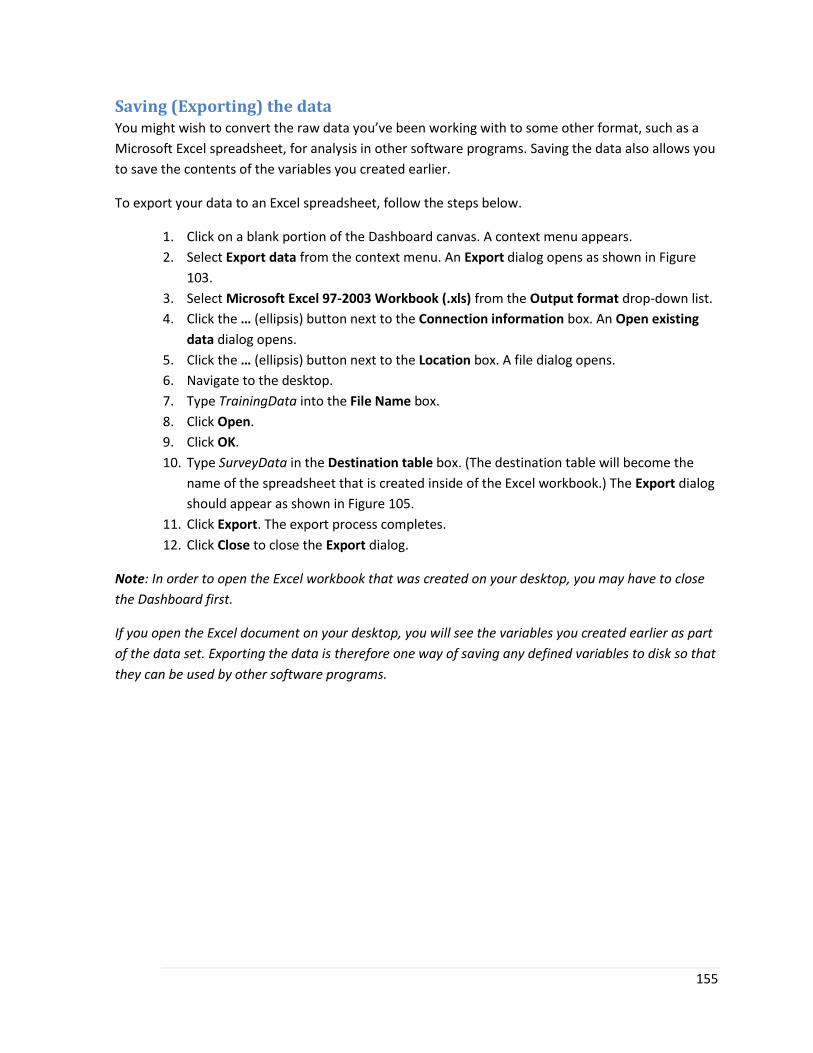
155
Saving (Exporting) the data You might wish to convert the raw data you’ve been working with to some other format, such as a
Microsoft Excel spreadsheet, for analysis in other software programs. Saving the data also allows you
to save the contents of the variables you created earlier.
To export your data to an Excel spreadsheet, follow the steps below.
1. Click on a blank portion of the Dashboard canvas. A context menu appears.
2. Select Export data from the context menu. An Export dialog opens as shown in Figure
103.
3. Select Microsoft Excel 97-2003 Workbook (.xls) from the Output format drop-down list.
4. Click the … (ellipsis) button next to the Connection information box. An Open existing
data dialog opens.
5. Click the … (ellipsis) button next to the Location box. A file dialog opens.
6. Navigate to the desktop.
7. Type TrainingData into the File Name box.
8. Click Open.
9. Click OK.
10. Type SurveyData in the Destination table box. (The destination table will become the
name of the spreadsheet that is created inside of the Excel workbook.) The Export dialog
should appear as shown in Figure 105.
11. Click Export. The export process completes.
12. Click Close to close the Export dialog.
Note: In order to open the Excel workbook that was created on your desktop, you may have to close
the Dashboard first.
If you open the Excel document on your desktop, you will see the variables you created earlier as part
of the data set. Exporting the data is therefore one way of saving any defined variables to disk so that
they can be used by other software programs.
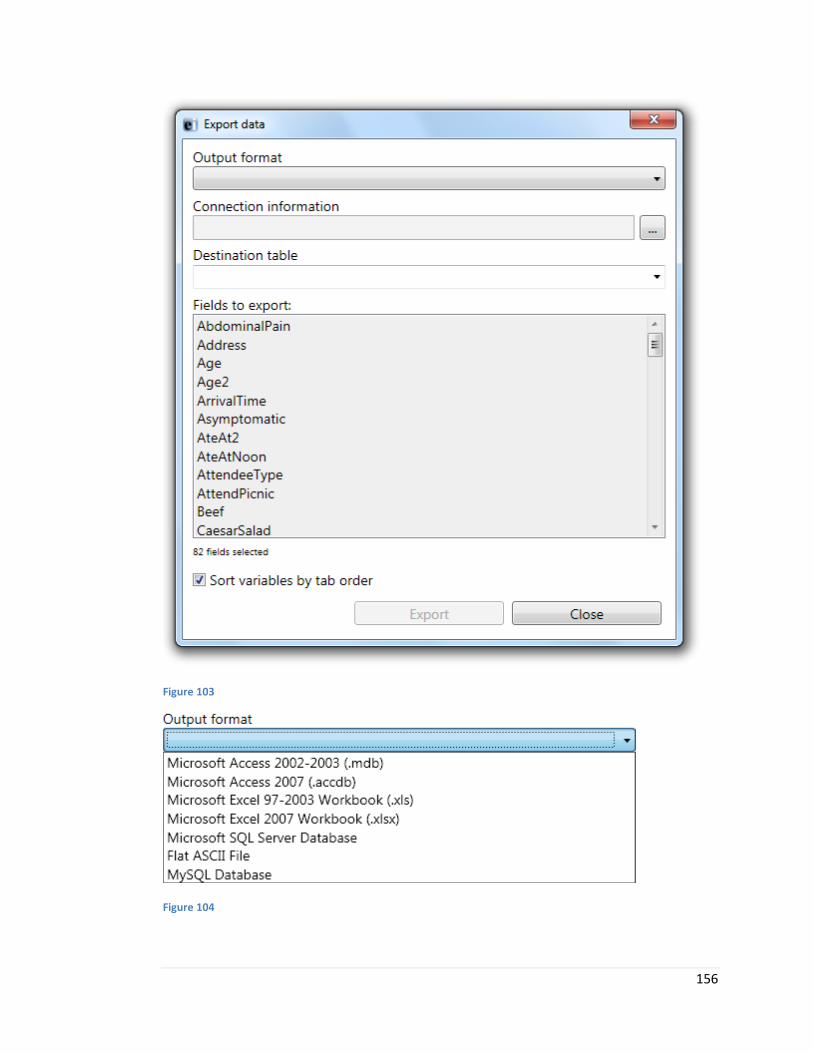
156
Figure 103
Figure 104
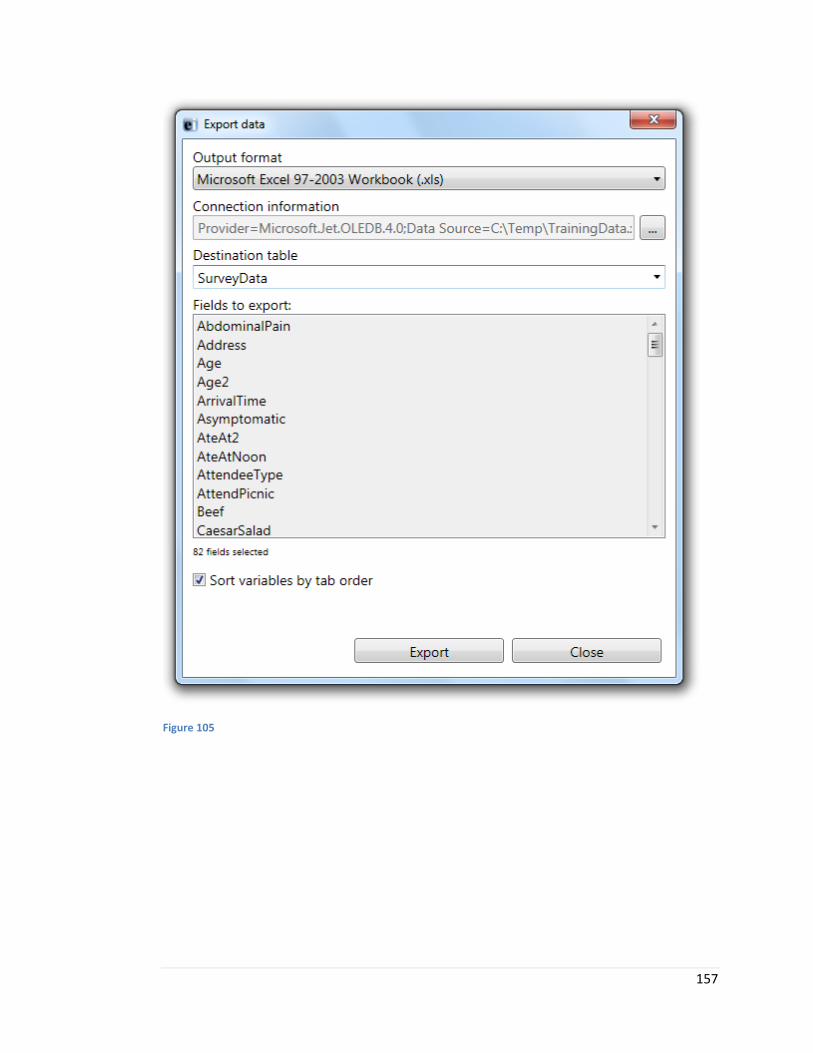
157
Figure 105

158
Scenario Conclusion
After investigating the outbreak, epidemiologists have concluded that eggs were the source
of exposure. When the team did an inspection of the restaurant kitchen, they noted that the
eggs were not stored at the proper temperature and they were not cooked thoroughly.
People who ate the egg salad sandwich and the chef salad were more likely to be infected
with Salmonella enteriditis since they ate the eggs.

159
Best Practices Using the Dashboard
Make good use of space The Dashboard’s canvas can quickly become cluttered with gadgets overlapping each other if you’re
not careful. Make good use of the available vertical space to arrange gadgets logically. Consider using
the zoom in/out feature on the bottom right corner of the Dashboard window to see more output at
once.
When recoding a variable to two values, use the Yes/No field type Consider using the Yes/No field type when recoding data into dichotomous values. Doing so ensures
that the positive value appears first when generating output. Using the Text field type still allows you
to specify “Yes” and “No” as the recoded values, but the “No” might appear first because Text data
typically are sorted alphabetically.
When saving the canvas, place it in the same folder as the data source Placing the canvas in the same folder as the data source ensures that the canvas will be able to
reliably connect to the data source no matter which computer it is transferred to.
When saving the canvas, place it in a subfolder underneath Epi Info
7/Projects Placing the canvas somewhere underneath the Epi Info 7/Projects folder ensures the canvas will
appear in the Dashboard’s Quick Access List of canvas files.
160
Summary During this lesson, you were introduced to the concept of creating electronic data entry forms using
the Form Designer module of Epi Info™ 7. You can now:
Use gadgets to show statistical output
Create data filters
Create new variables with recoded data
Create new variables using conditional logic
Save your output
Q&A Q: Can I use epidemiological weeks in the epi curve chart?
A: Yes. To do this, you need to create a new variable with a Formatted value and select the epi week
option. The variable will then be available when creating the epi curve chart. Note that the epi week
variable type currently assumes Sunday is the first day of the week and might not be suitable for non-
U.S. locales.
Q: Can I stratify the frequency gadget by more than one variable?
A: Not at this time. Only the MxN / 2x2 gadget can accept multiple stratification variables in this
version of the software.
Q: Can I use another field on the form on the right-hand-side of the operator when creating a data
filter?
A: Yes. However, you need to click the Advanced Mode button in the Data Filter slide-out gadget to
do this. The Advanced Mode filter is beyond the scope of this tutorial.
Q: Can I read data sources other than Epi Info™ 7 projects into the Dashboard for analysis?
A: Yes. When setting the data source, notice that the Data Formats drop-down list contains choices
for Microsoft Excel, Microsoft Access, Microsoft SQL Server databases, ASCII text files, and MySQL
databases.
Q: Can I define my own group fields in the Dashboard so I can take advantage of grouped analysis
when analyzing non-Epi Info™ 7 data sources?
A: Yes. When creating a new variable, use the Create Variable Group option.
Q: Can I create a new variable with a math expression? For example, I want to assign a variable the
sum of five or six other variables.
A: Yes. You can compute the sum in two ways:
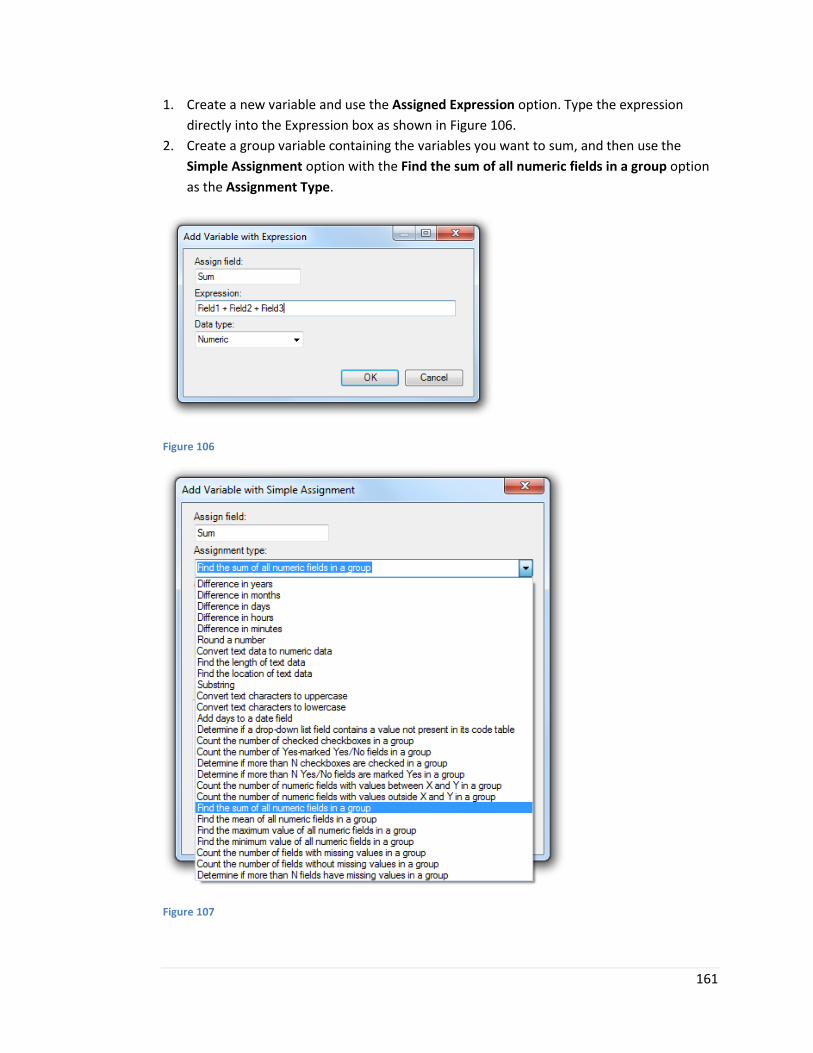
161
1. Create a new variable and use the Assigned Expression option. Type the expression
directly into the Expression box as shown in Figure 106.
2. Create a group variable containing the variables you want to sum, and then use the
Simple Assignment option with the Find the sum of all numeric fields in a group option
as the Assignment Type.
Figure 106
Figure 107

162
Quiz The following questions will see how much you have learned about using the Dashboard.
Questions 1. Some gadgets will show results as soon as you select the necessary variables, while others
will show results only when you click a button.
a. True
b. False
2. The Dashboard can open different types of data sources, including Excel spreadsheets and
Access databases.
a. True
b. False
3. The current record count is always displayed on the bottom of the screen.
a. True
b. False
4. When stratifying output, you can collapse each stratification by clicking on the up arrow next
to the strata’s header.
a. True
b. False
5. Grouped analysis can only be done on Epi Info™ 7 projects, since non-Epi Info™ 7 data
sources (such as Excel spreadsheets) do not have field groups.
a. True
b. False
6. The Frequency gadget will show you the minimum and maximum values for continuous data.
a. True
b. False
7. The output for most gadgets can be collapsed by clicking on the icon for that gadget.
a. True
b. False
8. All variables you create are temporary; they are destroyed as soon as the Dashboard is
closed.
a. True
b. False
9. The output for most gadgets can be sent to Microsoft Excel by right-clicking on the gadget’s
output and selecting the Send data to Excel option.
a. True
b. False
10. What type of defined variable could you use to easily turn continuous data (such as fever
temperatures) into categorical data?
a. The conditionally-assigned variable type
b. The recoded variable type

163
c. The simple assignment type
d. The assigned expression
11. What type of defined variable could you use to easily count the number of selected
checkboxes within a group?
a. The conditionally-assigned variable type
b. The recoded variable type
c. The simple assignment type
d. The assigned expression
12. What type of defined variable could you use to determine the incubation period of a
particular illness?
a. The conditionally-assigned variable type
b. The recoded variable type
c. The simple assignment type
d. The assigned expression
13. What type of defined variable could you use to combine two variables together?
a. The conditionally-assigned variable type
b. The recoded variable type
c. The simple assignment type
d. The assigned expression
14. You created a new variable called “IncubationPeriod” and want to work with the data
contained in this variable in an Excel spreadsheet. What method of saving the data would
you use?
a. Save the canvas file
b. Save the output as HTML
c. Send the output to Excel
d. Export the data to Excel
15. You have placed numerous gadgets on the Dashboard’s canvas and applied several data
filters to generate statistical results. You plan on collecting 50 more records during the
coming week and want to show the output using the updated data. What method would
allow you to do this without having to re-create your gadgets and data filters?
a. Save the canvas file
b. Save the output as HTML
c. Send the output to Excel
d. Export the data to Excel
16. You’ve created several frequencies and charts on the Dashboard and want to send the
output to your supervisor. What is the best method of saving the output so it can be easily
opened by the supervisor?
a. Save the canvas file
b. Save the output as HTML
c. Send the output to Excel
d. Export the data to Excel

164
Answers 1. A
2. A
3. B. The record count is always displayed, but it appears at the top of the screen.
4. A
5. B. You can create your own groups in the Dashboard in order to take advantage of the
grouped analysis features regardless of the data source.
6. B. Use the Means gadget to find the minimum and maximum values for continuous data.
7. A
8. A
9. A
10. B
11. C
12. C. You would use the simple assignment type with “difference in days” or “difference in
hours.”
13. A
14. D. Choice A would save the variable to a canvas file so it could be re-created, but it won’t
save the data, and the canvas file format can’t be opened in Excel. Choices B and C would
save any output from gadgets on the canvas but wouldn’t save the underlying data in the
variable.
15. A
16. B. Choice C would allow you save the output to Excel, but as noted earlier, charts in the
Dashboard are not transferred to Excel. Thus, Choice B is the only option.

165
Lesson 5
Representing Data with Maps
This lesson introduces you to the Epi Info™ 7 Map module.
For this lesson, data adapted from a survey used at a local health department in the state of New
York to support an asthma initiative will be utilized. A paper survey was created and data were
collected around schools in the county to investigate asthma incidence at local schools. Student’s
demographics, symptoms information and school activities information were captured in the survey.
In Lesson 5, you will use Epi Map to create a combination of maps to look for relationships between
income and asthma, incorporating additional layers to the map to identify the locations of regional
hospitals and schools.
This lesson covers the basic information needed to create maps, understand the Epi Map workspace,
and the different options available to edit and customize maps.
Time to complete: 1 hour (Beginner)
FIVE GOALS
1. Create a choropleth map of median income for the surveyed region.
2. Create a case cluster map that shows the correlation between income and asthma cases.
3. Incorporate additional layer to show the location of hospitals in the surveyed region.
4. Incorporate additional layer to show the location of schools in the surveyed region.
5. Create an image of the map to illustrate on a presentation.
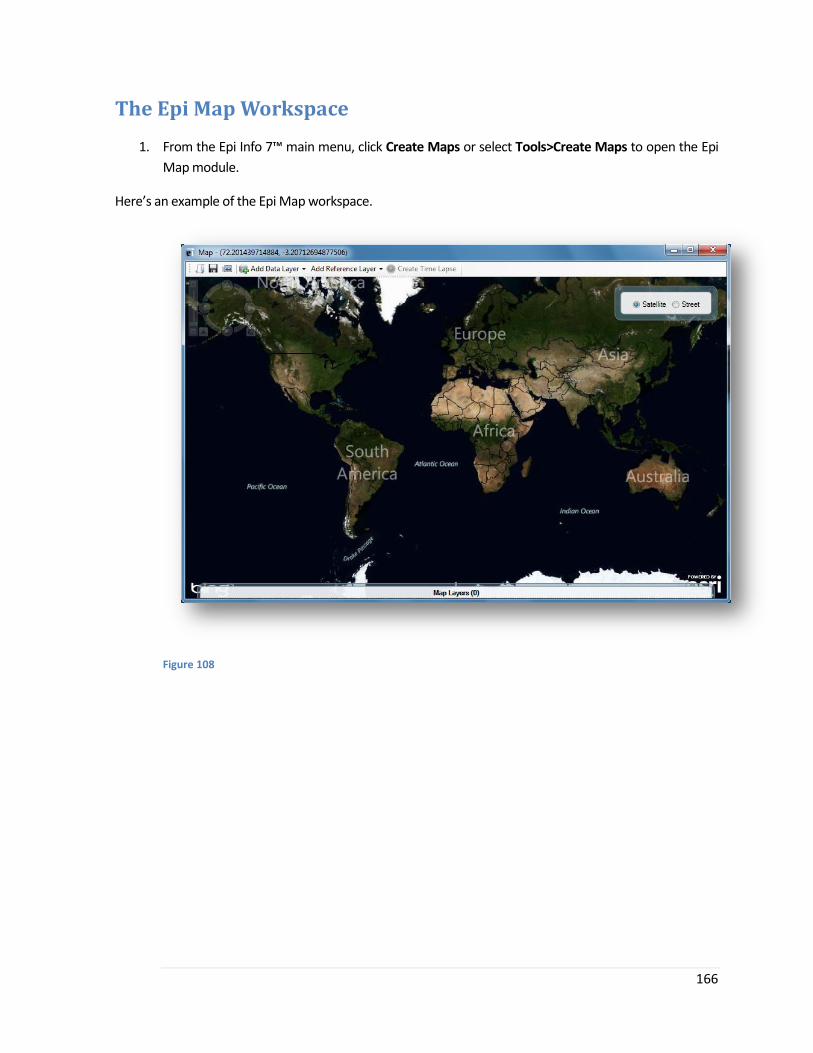
166
The Epi Map Workspace
1. From the Epi Info 7™ main menu, click Create Maps or select Tools>Create Maps to open the Epi
Map module.
Here’s an example of the Epi Map workspace.
Figure 108
167
Navigating Epi Map
Most of the work in Epi Map requires map layers to be constructed with shapefiles and related data
variables or latitude and longitudes coordinates captured in a database. You will use the Add Data Layer
functionality to add, remove, or re-order layers. Once a map is displayed, you will be able to filter certain
criteria, add additional data, add points, zones and labels to a map.
Maps can be saved as .MAP files that are editable and can be opened in Epi Map. Maps can also be saved
as a portable network graphic (.png) file and used in presentations and in other programs.
Other features are also accessible through the Epi Map menu bar. The following options are available in
the Epi Map menu.
Open a map file
Interactive maps created and saved in Epi Map can be opened using this menu option.
Save file as a map
This option allows users to save current map as an interactive map. Users will be able to open this file as
many times as needed without having to select data sources and regenerate data layers. If the data source
is updated, changes will be reflected in the map.
Save file as a graphic
This option allows users to save the map displayed in the current Epi Map session as a portable network
graphic (.png) file.
Add data layer
Allows you to incorporate different types of data into one single map.
Add reference layer
Allows you to add a reference layer without any associated data needed.
Create time lapse
Based on a date field from your dataset, this feature allows you to plot points into your map using a motion
effect to represent the order of occurrence based on the value of a date field.

168
Maps Types
The following maps can be generated using Epi Map.
Choropleth
Use to categorize features into equal ranges or counts (quantiles) that are color-coded to indicate changes
in the data. In this lesson, you will create a choropleth map that illustrates income data for the region.
Case Cluster
Allows users to show different points based on levels of classification (e.g., male, female). In this lesson,
you will create a case cluster map that shows the physical household locations of the children interviewed
based on addresses captured for each household. You will also draw the locations of hospitals and schools
based on latitude and longitude data.
Dot Density
A map type that uses dots or points to show a comparative density of features over a map based on values
stored in polygon layer attribute fields. Dot density is an effective method to visualize concentrations of
quantitative data. In a dot density map, the dots are all the same size and do not represent actual point
locations of data.
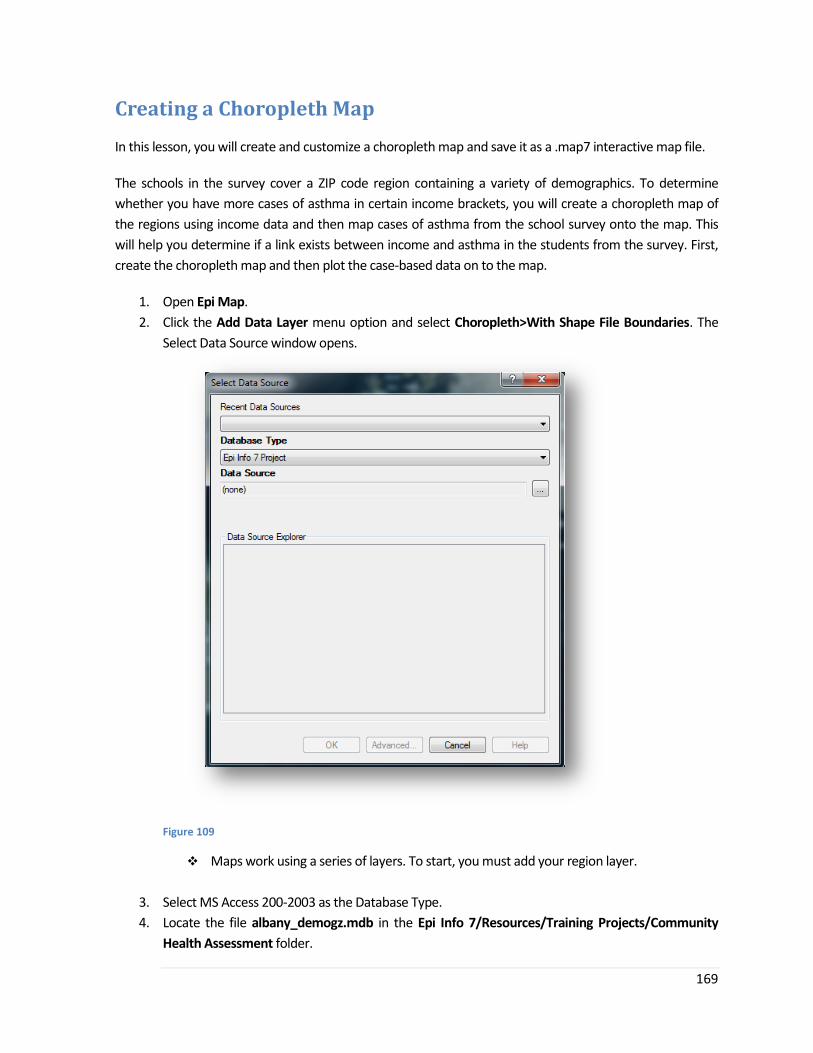
169
Creating a Choropleth Map
In this lesson, you will create and customize a choropleth map and save it as a .map7 interactive map file.
The schools in the survey cover a ZIP code region containing a variety of demographics. To determine
whether you have more cases of asthma in certain income brackets, you will create a choropleth map of
the regions using income data and then map cases of asthma from the school survey onto the map. This
will help you determine if a link exists between income and asthma in the students from the survey. First,
create the choropleth map and then plot the case-based data on to the map.
1. Open Epi Map.
2. Click the Add Data Layer menu option and select Choropleth>With Shape File Boundaries. The
Select Data Source window opens.
Figure 109
Maps work using a series of layers. To start, you must add your region layer.
3. Select MS Access 200-2003 as the Database Type.
4. Locate the file albany_demogz.mdb in the Epi Info 7/Resources/Training Projects/Community
Health Assessment folder.

170
5. Click Open. The Select Data Table From dialog box opens.
The demographic project has two tables. One contains income data and the other race
and ethnicity data. You want to create a choropleth map using the income data. The
income table contains a series of zip codes and the median income and per capita income
for those zip codes. The median income is the value of family income with 50% of families
above the value and 50% of the families below the value. Per capita income is the total
income for that zip code divided by the population.
6. Select INCOME.
7. Click OK.
8. Click on the Browse Shape File button.
9. Locate the file ALBZCTA_region.shp in the Epi Info 7/Resources/Training Projects/Community
Health Assessment folder.
10. Click OK.
The map shape appears in the workspace and the layer appears in the Map Manager.
Note: Epi Info™ 7 can also generate maps using KML files. KML is a file format used to display
geographic data in an Earth browser such as Google Earth, Google Maps, and Google Maps for
mobile. KML uses a tag-based structure with nested elements and attributes and is based on the XML
standard.
Figure 110
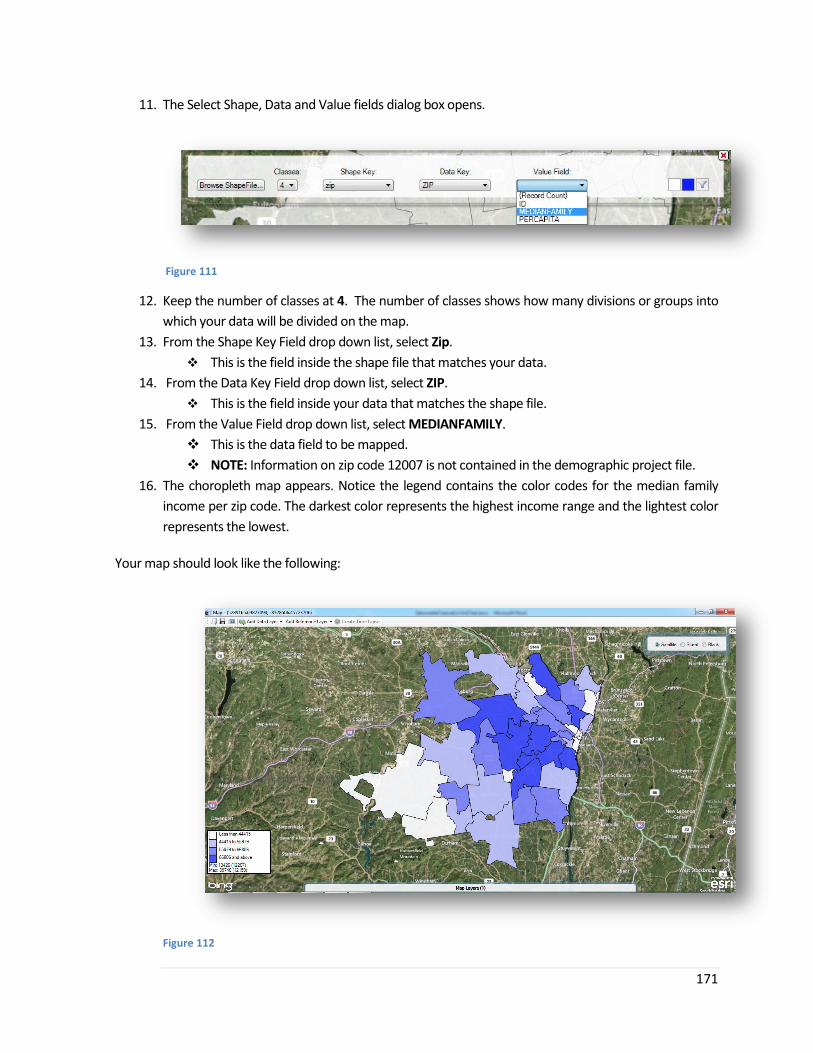
171
11. The Select Shape, Data and Value fields dialog box opens.
Figure 111
12. Keep the number of classes at 4. The number of classes shows how many divisions or groups into
which your data will be divided on the map.
13. From the Shape Key Field drop down list, select Zip.
This is the field inside the shape file that matches your data.
14. From the Data Key Field drop down list, select ZIP.
This is the field inside your data that matches the shape file.
15. From the Value Field drop down list, select MEDIANFAMILY.
This is the data field to be mapped.
NOTE: Information on zip code 12007 is not contained in the demographic project file.
16. The choropleth map appears. Notice the legend contains the color codes for the median family
income per zip code. The darkest color represents the highest income range and the lightest color
represents the lowest.
Your map should look like the following:
Figure 112
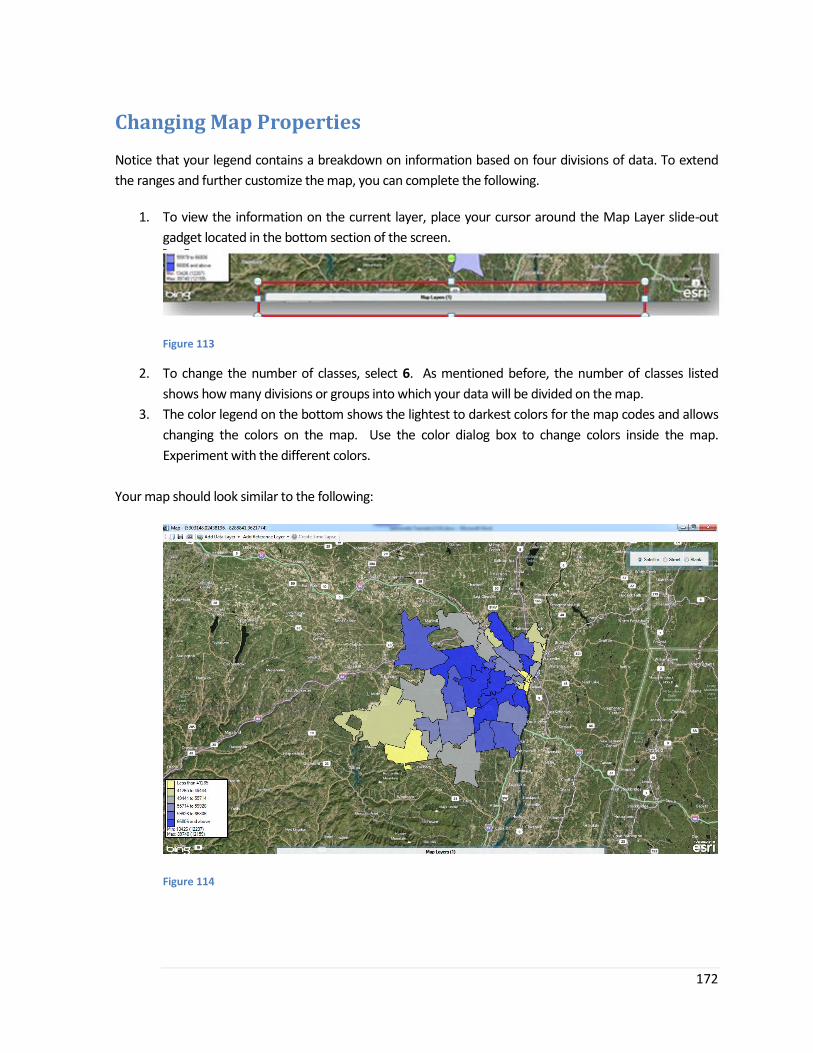
172
Changing Map Properties
Notice that your legend contains a breakdown on information based on four divisions of data. To extend
the ranges and further customize the map, you can complete the following.
1. To view the information on the current layer, place your cursor around the Map Layer slide-out
gadget located in the bottom section of the screen.
Figure 113
2. To change the number of classes, select 6. As mentioned before, the number of classes listed
shows how many divisions or groups into which your data will be divided on the map.
3. The color legend on the bottom shows the lightest to darkest colors for the map codes and allows
changing the colors on the map. Use the color dialog box to change colors inside the map.
Experiment with the different colors.
Your map should look similar to the following:
Figure 114

173
Viewing Map Information
Displaying values
The ALBZCTA_region shape file contains census data as part of the associated .dbf file. Use your mouse
button to hover over different map regions and the value associated with the data file will be displayed (as
shown below):
Figure 115
You can use the Zoom In/Zoom Out control located on the left hand side of the screen to change the
dimensions of the map.
Figure 116
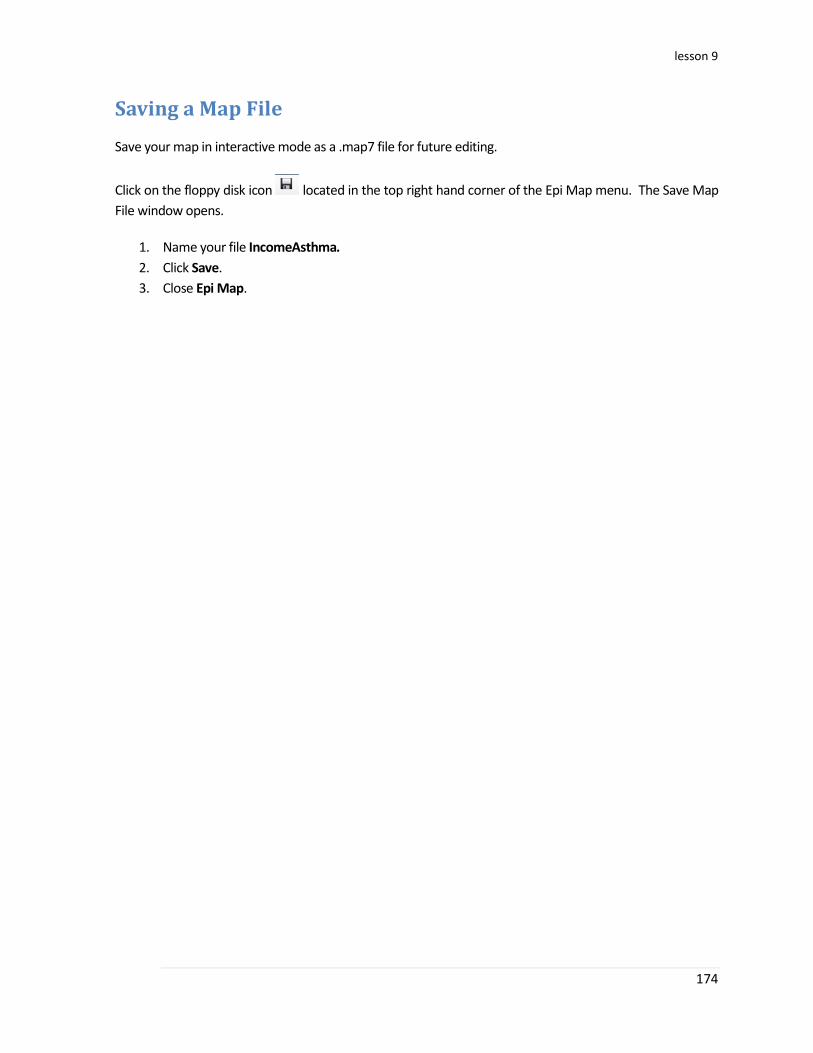
lesson 9
174
Saving a Map File
Save your map in interactive mode as a .map7 file for future editing.
Click on the floppy disk icon located in the top right hand corner of the Epi Map menu. The Save Map
File window opens.
1. Name your file IncomeAsthma.
2. Click Save.
3. Close Epi Map.

175
Creating a Case Cluster Map
Case cluster maps can be made if you have geographic data for the longitude and latitude measurements
of your map corresponding to the region. Latitude and longitude coordinates are developed with GIS
tracking information.
In this lesson, we will first map the location of the households of the children interviewed. We will then
incorporate an additional layer to map the hospital and school locations in the region. We will use
different colors to represent these categories into the map. This will help illustrate which zip codes had
more cases of asthma and the income for those zip codes.
First, we will incorporate the location of the households.
1. From the top menu, select the Add Data Layer> Case Cluster option.
2. Select Epi Info 7™ as the Database Type.
3. Locate the Community Health Assessment.PRJ file in the Epi Info 7/Resources/Training
Projects/Community Health Assessment folder.
4. Select the PreInterventionSurvey form.
5. Click OK.
6. The Latitude and Longitude window opens. Select Latitude from the Latitude drop down list.
7. Select Longitude from the Longitude drop down list.
Epi Map will immediately display the household locations on the map. The locations are represented with
red dots.
Notice that large clusters of cases appear as bigger circles with the total case count contained inside of them.
Notice that an additional layer has been added to the workspace.
You can switch between street and satellite views using the selector located in the top-right corner of the map window.
The case cluster map was placed on top of the income choropleth. Does the map indicate a
correlation between income and asthma in the survey data?
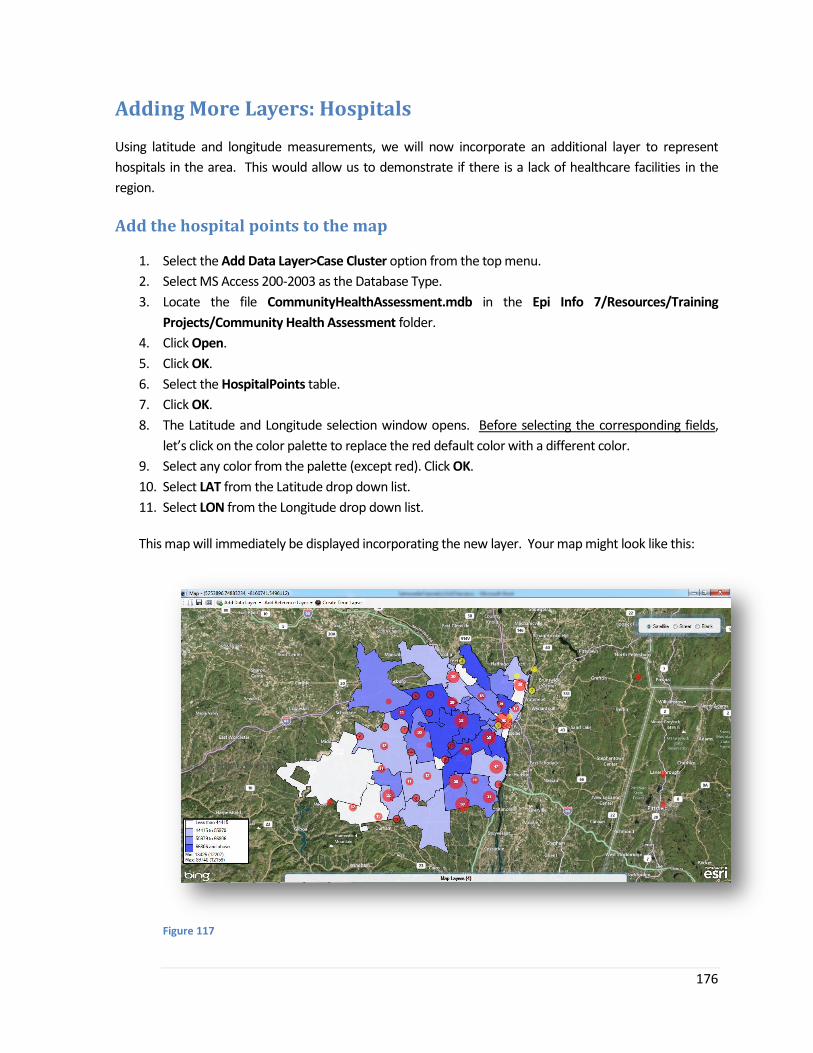
176
Adding More Layers: Hospitals
Using latitude and longitude measurements, we will now incorporate an additional layer to represent
hospitals in the area. This would allow us to demonstrate if there is a lack of healthcare facilities in the
region.
Add the hospital points to the map
1. Select the Add Data Layer>Case Cluster option from the top menu.
2. Select MS Access 200-2003 as the Database Type.
3. Locate the file CommunityHealthAssessment.mdb in the Epi Info 7/Resources/Training
Projects/Community Health Assessment folder.
4. Click Open.
5. Click OK.
6. Select the HospitalPoints table.
7. Click OK.
8. The Latitude and Longitude selection window opens. Before selecting the corresponding fields,
let’s click on the color palette to replace the red default color with a different color.
9. Select any color from the palette (except red). Click OK.
10. Select LAT from the Latitude drop down list.
11. Select LON from the Longitude drop down list.
This map will immediately be displayed incorporating the new layer. Your map might look like this:
Figure 117
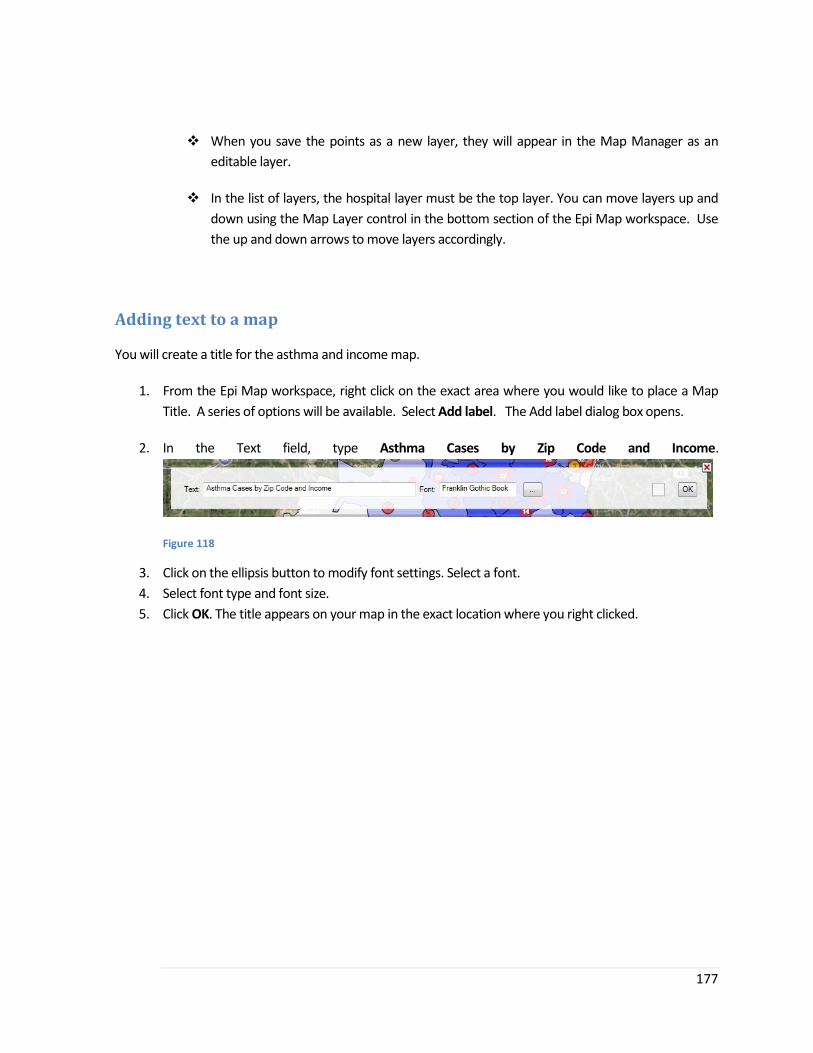
177
When you save the points as a new layer, they will appear in the Map Manager as an
editable layer.
In the list of layers, the hospital layer must be the top layer. You can move layers up and
down using the Map Layer control in the bottom section of the Epi Map workspace. Use
the up and down arrows to move layers accordingly.
Adding text to a map
You will create a title for the asthma and income map.
1. From the Epi Map workspace, right click on the exact area where you would like to place a Map
Title. A series of options will be available. Select Add label. The Add label dialog box opens.
2. In the Text field, type Asthma Cases by Zip Code and Income.
Figure 118
3. Click on the ellipsis button to modify font settings. Select a font.
4. Select font type and font size.
5. Click OK. The title appears on your map in the exact location where you right clicked.
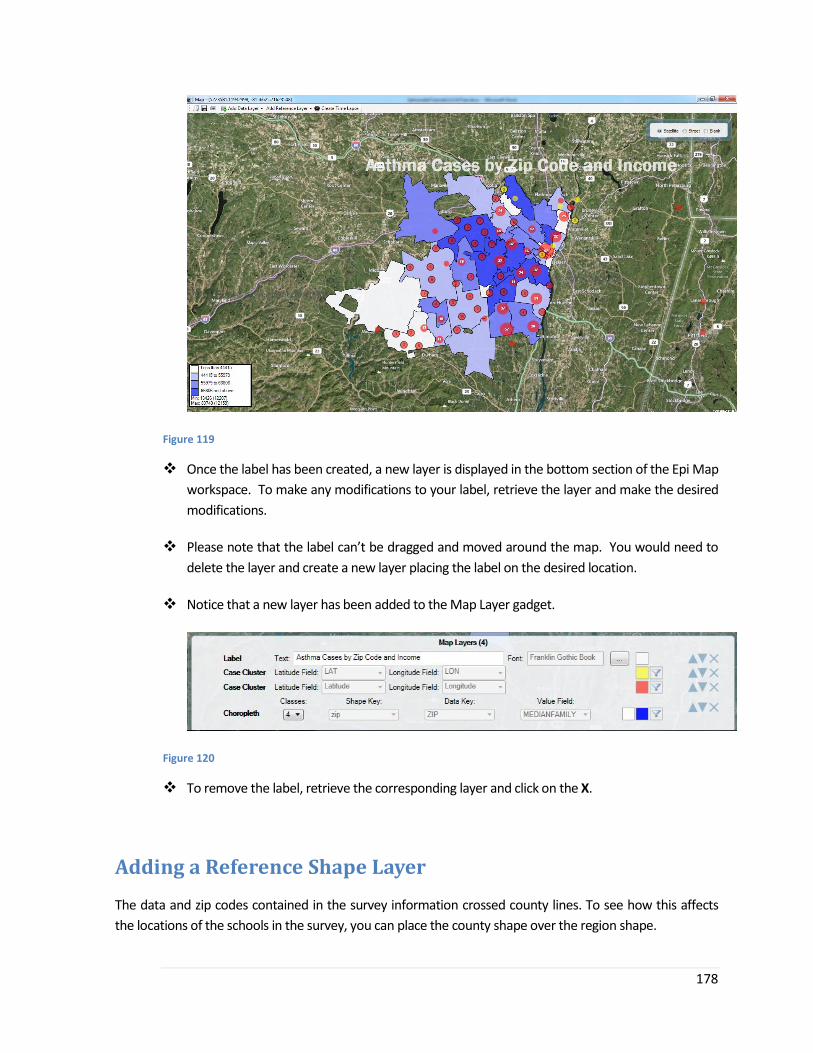
178
Figure 119
Once the label has been created, a new layer is displayed in the bottom section of the Epi Map
workspace. To make any modifications to your label, retrieve the layer and make the desired
modifications.
Please note that the label can’t be dragged and moved around the map. You would need to
delete the layer and create a new layer placing the label on the desired location.
Notice that a new layer has been added to the Map Layer gadget.
Figure 120
To remove the label, retrieve the corresponding layer and click on the X.
Adding a Reference Shape Layer
The data and zip codes contained in the survey information crossed county lines. To see how this affects
the locations of the schools in the survey, you can place the county shape over the region shape.
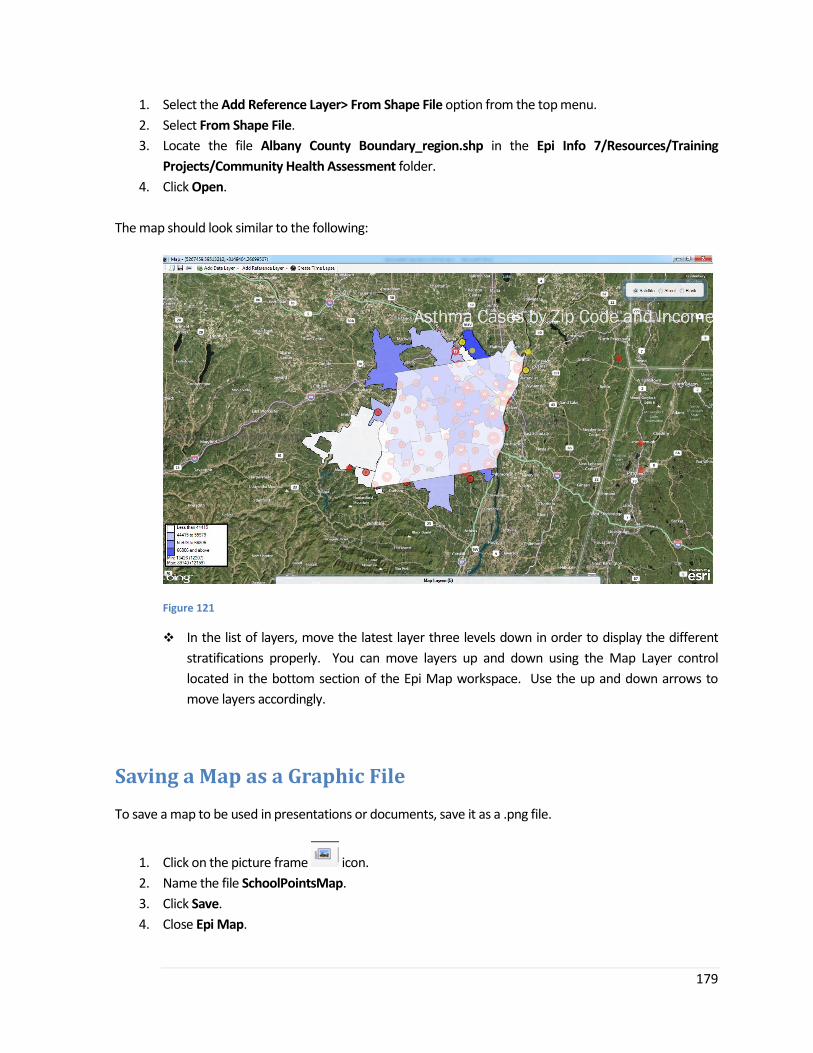
179
1. Select the Add Reference Layer> From Shape File option from the top menu.
2. Select From Shape File.
3. Locate the file Albany County Boundary_region.shp in the Epi Info 7/Resources/Training
Projects/Community Health Assessment folder.
4. Click Open.
The map should look similar to the following:
Figure 121
In the list of layers, move the latest layer three levels down in order to display the different
stratifications properly. You can move layers up and down using the Map Layer control
located in the bottom section of the Epi Map workspace. Use the up and down arrows to
move layers accordingly.
Saving a Map as a Graphic File
To save a map to be used in presentations or documents, save it as a .png file.
1. Click on the picture frame icon.
2. Name the file SchoolPointsMap.
3. Click Save.
4. Close Epi Map.

180
Student Exercise
You have been shown how to incorporate layers into a map. In this exercise, you will add a layer to
represent the locations of the schools that students are attending. Navigate to the Epi Info
7/Resources/Training Projects/Community Health Assessment folder. In the database
CommunityHealthAssessment.mdb, find a table called SchoolPoints. Use these data.

181
Quiz The following questions will see how much you have learned about using the Epi Map module.
Questions 1. Epi Map allows users to generate the following type of maps:
a. Dot density
b. 3D Visualization
c. Choropleth
d. Case cluster
e. Topographic
f. None of the above
g. All of the above
h. A, C and D
2. To map data contained in an MS Excel file, I must import the Excel file as an Epi Info 7 project in
order to map the data.
a. True
b. False
3. Shape files are:
a. Packaged with Epi Info 7 and available for use at no cost
b. Widely available on the Internet for a low fee per shape file
c. Widely available on the Internet at no cost
4. In order to display data accurately in a map data, the user must have:
a. A data key and shape key that doesn’t need to match and a required numeric variable to
display
b. A data key and shape key that doesn’t need to match and a required text variable to
display
c. A data key and shape key that must match and a required numeric variable to display
d. A data key and shape key that must match and a required text variable to display is
required
e. A data key and shape key that must match
5. The Create Time Lapse feature can be used with any data field type in a dataset?
a. True
b. False
6. Can multiple map type layers be overlaid or superimposed in the same map?
a. True
b. False

182
7. When using Case Cluster maps, can users view the information of a specific data point in a map?
a. True
b. False
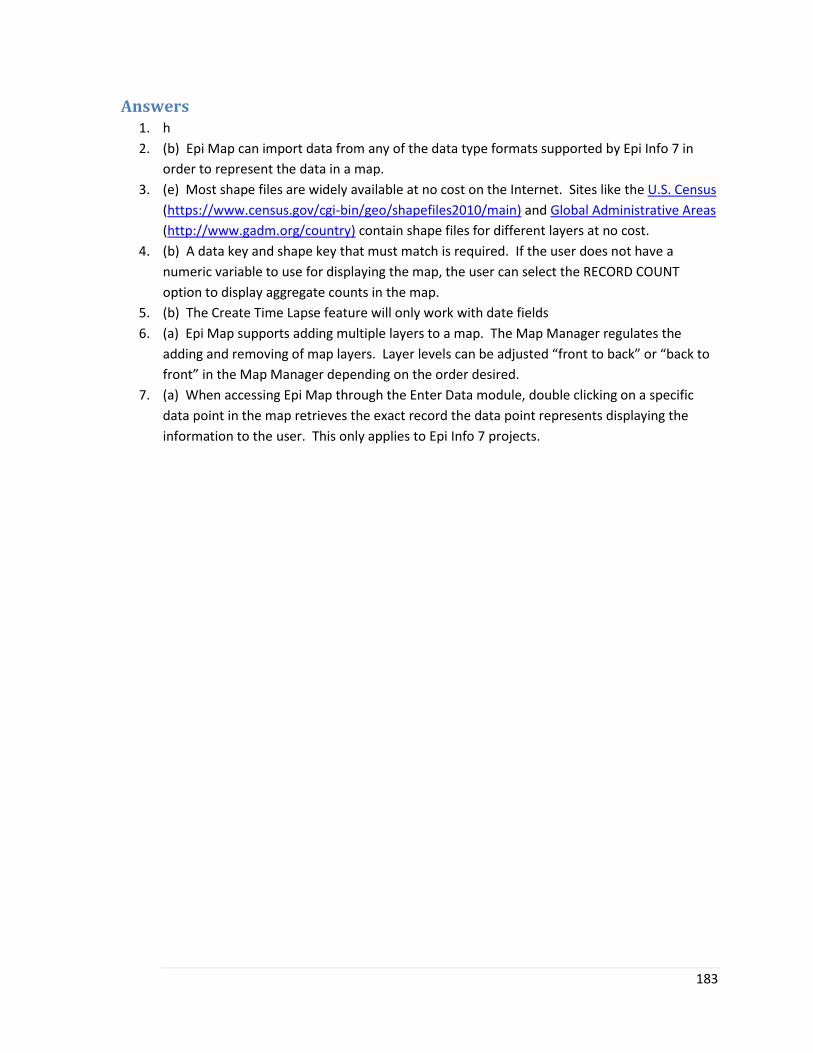
183
Answers 1. h
2. (b) Epi Map can import data from any of the data type formats supported by Epi Info 7 in
order to represent the data in a map.
3. (e) Most shape files are widely available at no cost on the Internet. Sites like the U.S. Census
(https://www.census.gov/cgi-bin/geo/shapefiles2010/main) and Global Administrative Areas
(http://www.gadm.org/country) contain shape files for different layers at no cost.
4. (b) A data key and shape key that must match is required. If the user does not have a
numeric variable to use for displaying the map, the user can select the RECORD COUNT
option to display aggregate counts in the map.
5. (b) The Create Time Lapse feature will only work with date fields
6. (a) Epi Map supports adding multiple layers to a map. The Map Manager regulates the
adding and removing of map layers. Layer levels can be adjusted “front to back” or “back to
front” in the Map Manager depending on the order desired.
7. (a) When accessing Epi Map through the Enter Data module, double clicking on a specific
data point in the map retrieves the exact record the data point represents displaying the
information to the user. This only applies to Epi Info 7 projects.
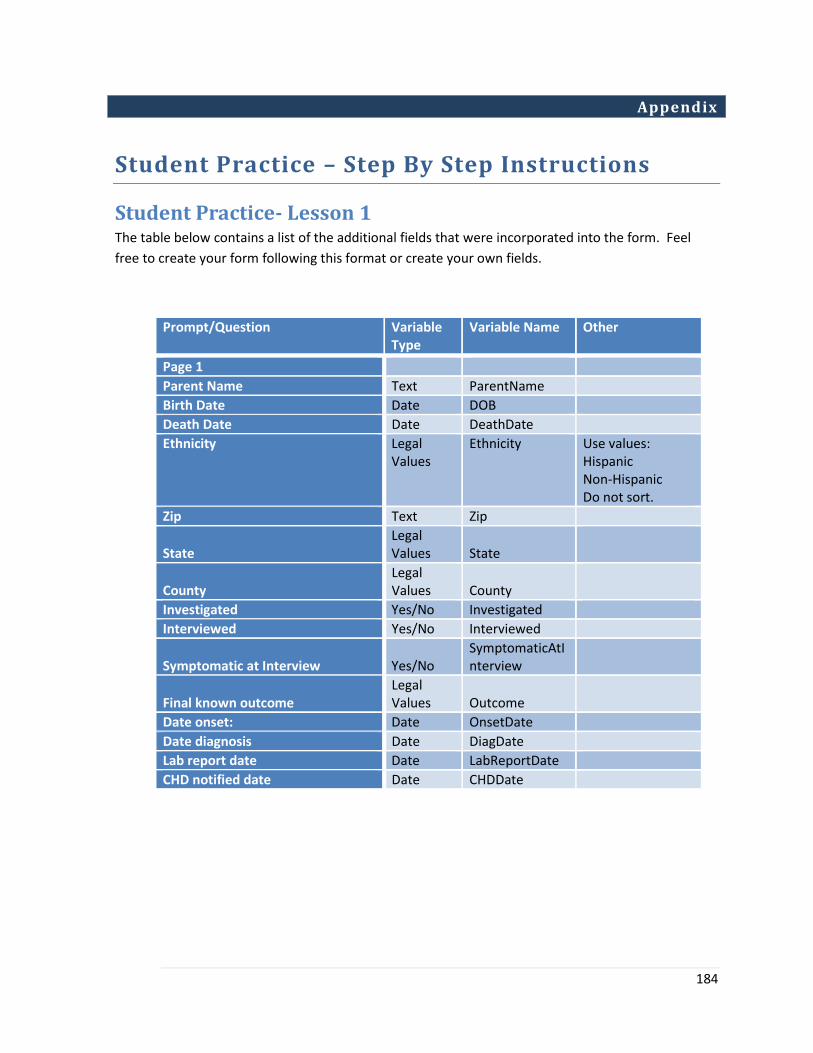
184
Appendix
Student Practice – Step By Step Instructions
Student Practice- Lesson 1 The table below contains a list of the additional fields that were incorporated into the form. Feel
free to create your form following this format or create your own fields.
Prompt/Question Variable Type
Variable Name Other
Page 1
Parent Name Text ParentName
Birth Date Date DOB
Death Date Date DeathDate
Ethnicity Legal Values
Ethnicity Use values: Hispanic Non-Hispanic Do not sort.
Zip Text Zip
State Legal Values State
County Legal Values County
Investigated Yes/No Investigated
Interviewed Yes/No Interviewed
Symptomatic at Interview Yes/No SymptomaticAtInterview
Final known outcome Legal Values Outcome
Date onset: Date OnsetDate
Date diagnosis Date DiagDate
Lab report date Date LabReportDate
CHD notified date Date CHDDate
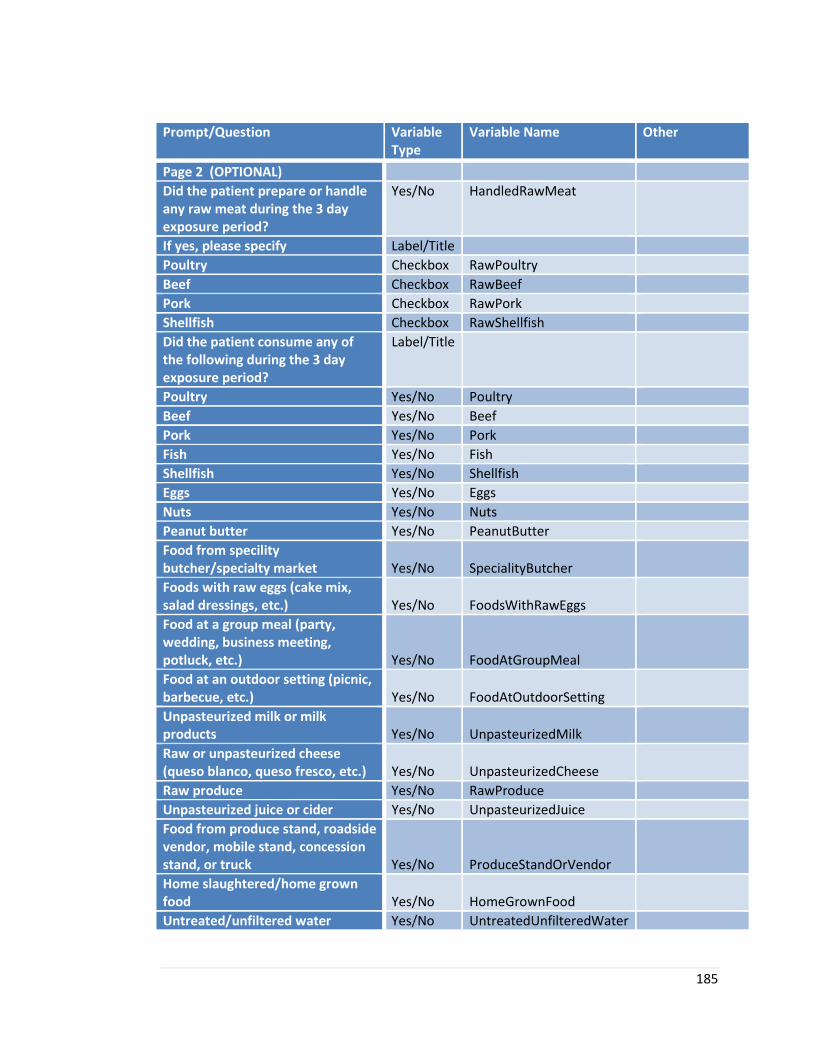
185
Prompt/Question Variable Type
Variable Name Other
Page 2 (OPTIONAL)
Did the patient prepare or handle any raw meat during the 3 day exposure period?
Yes/No HandledRawMeat
If yes, please specify Label/Title
Poultry Checkbox RawPoultry
Beef Checkbox RawBeef
Pork Checkbox RawPork
Shellfish Checkbox RawShellfish
Did the patient consume any of the following during the 3 day exposure period?
Label/Title
Poultry Yes/No Poultry
Beef Yes/No Beef
Pork Yes/No Pork
Fish Yes/No Fish
Shellfish Yes/No Shellfish
Eggs Yes/No Eggs
Nuts Yes/No Nuts
Peanut butter Yes/No PeanutButter
Food from specility butcher/specialty market Yes/No SpecialityButcher
Foods with raw eggs (cake mix, salad dressings, etc.) Yes/No FoodsWithRawEggs
Food at a group meal (party, wedding, business meeting, potluck, etc.) Yes/No FoodAtGroupMeal
Food at an outdoor setting (picnic, barbecue, etc.) Yes/No FoodAtOutdoorSetting
Unpasteurized milk or milk products Yes/No UnpasteurizedMilk
Raw or unpasteurized cheese (queso blanco, queso fresco, etc.) Yes/No UnpasteurizedCheese
Raw produce Yes/No RawProduce
Unpasteurized juice or cider Yes/No UnpasteurizedJuice
Food from produce stand, roadside vendor, mobile stand, concession stand, or truck Yes/No ProduceStandOrVendor
Home slaughtered/home grown food Yes/No HomeGrownFood
Untreated/unfiltered water Yes/No UntreatedUnfilteredWater
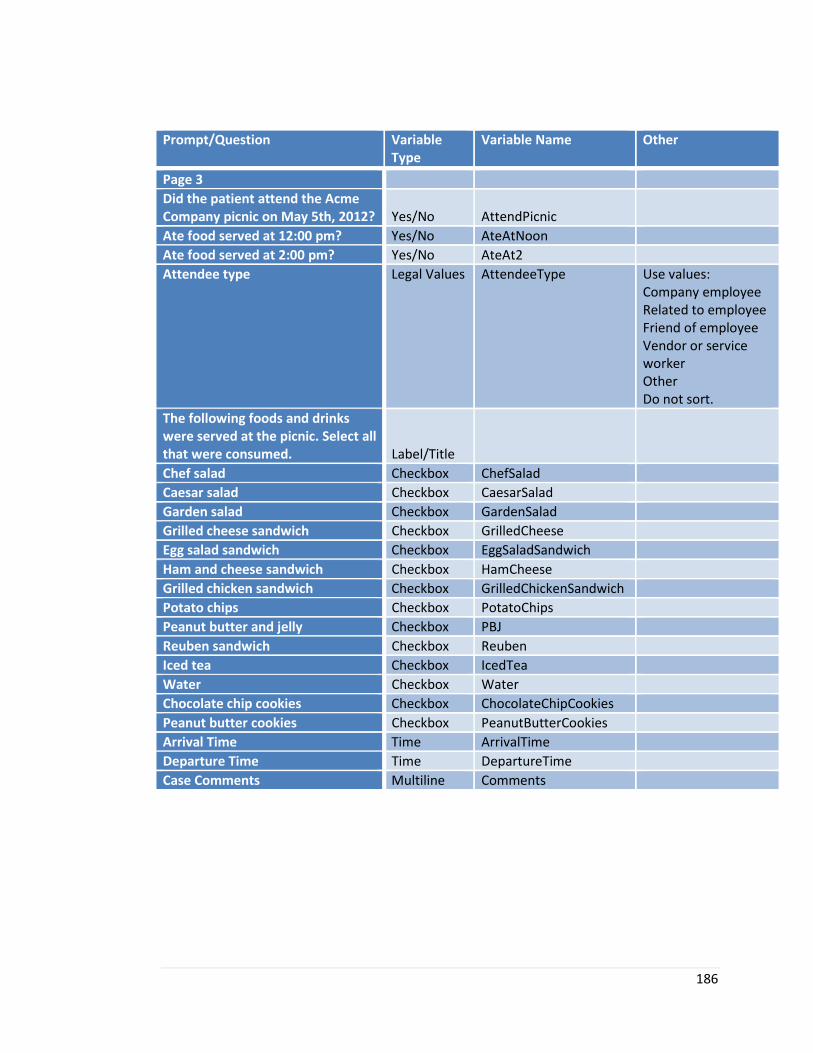
186
Prompt/Question Variable Type
Variable Name Other
Page 3
Did the patient attend the Acme Company picnic on May 5th, 2012? Yes/No AttendPicnic
Ate food served at 12:00 pm? Yes/No AteAtNoon
Ate food served at 2:00 pm? Yes/No AteAt2
Attendee type Legal Values AttendeeType Use values: - Company employee - Related to employee - Friend of employee - Vendor or service
worker - Other
Do not sort.
The following foods and drinks were served at the picnic. Select all that were consumed. Label/Title
Chef salad Checkbox ChefSalad
Caesar salad Checkbox CaesarSalad
Garden salad Checkbox GardenSalad
Grilled cheese sandwich Checkbox GrilledCheese
Egg salad sandwich Checkbox EggSaladSandwich
Ham and cheese sandwich Checkbox HamCheese
Grilled chicken sandwich Checkbox GrilledChickenSandwich
Potato chips Checkbox PotatoChips
Peanut butter and jelly Checkbox PBJ
Reuben sandwich Checkbox Reuben
Iced tea Checkbox IcedTea
Water Checkbox Water
Chocolate chip cookies Checkbox ChocolateChipCookies
Peanut butter cookies Checkbox PeanutButterCookies
Arrival Time Time ArrivalTime
Departure Time Time DepartureTime
Case Comments Multiline Comments

187
Student Practice - Lesson 2 You will be using a form that has already been created for you to ensure consistent variable
placement and variable naming. To open this form, follow the steps below:
1. Open the Form Designer module from the Epi Info™ 7 menu. If the Form Designer is already
open, close any projects that might be open by clicking the Close Project button on the
toolbar.
2. Click the Open Project button on the toolbar. A Windows Open File dialog appears.
3. Navigate to the SalmonellaTraining folder that you copied to the desktop in the File Setup
phase.
4. Select the Salmonella.prj file and click the Open button. The Survey_NoCheckCode form
appears on the canvas.
5. Ensure that the words “Check Code Form, Use in Lessons 2-3” appears in the upper-right
corner. If they do not, double-click on the Salmonella_NoCheckCode item in the Project
Explorer pane.
Task 1: Using conditional Statements If the age of the interviewee is less than 18, and no parent has been specified, display a warning
dialog.
1. Click the Check Code button in the Form Designer. The Check Code Editor window opens.
2. Locate Page 1 in the Choose Field Block for Action list and expand it by clicking on the + icon
to its left. A list of all the fields on page 1 will appear underneath the Page 1 item.
3. Locate DOB in the list of fields on Page 1 and expand it by clicking on the + icon to its left. A
“before” and an “after” item will appear underneath the field.
4. You will notice that the after event is in bold font. This represents that there is check code
currently associated with this field and event.
5. Click on the after item underneath DOB.
6. The cursor will be placed on the first line of the check code block for the AFTER event.
7. Press then END key to place your cursor at the end of the line
8. Press the Enter key. This should place your cursor on the next line.
9. Click the If command in the Command list. The If dialog opens.
10. Select Age from the Available Variables drop-down list.
11. Click on the < button. The < operator appears in the If Condition box.
12. Type 18.
13. Click on the AND button. The AND operator appears in the If Condition box.
14. Select ParentName from the Available Variables drop-down list.
15. Click on the = button. The = sign appears in the If Condition box.
16. Click on the “Missing” button. The (.) symbol appears in the If Condition box.
17. Click on the command icon button next to the THEN box. A list of available commands
appears.
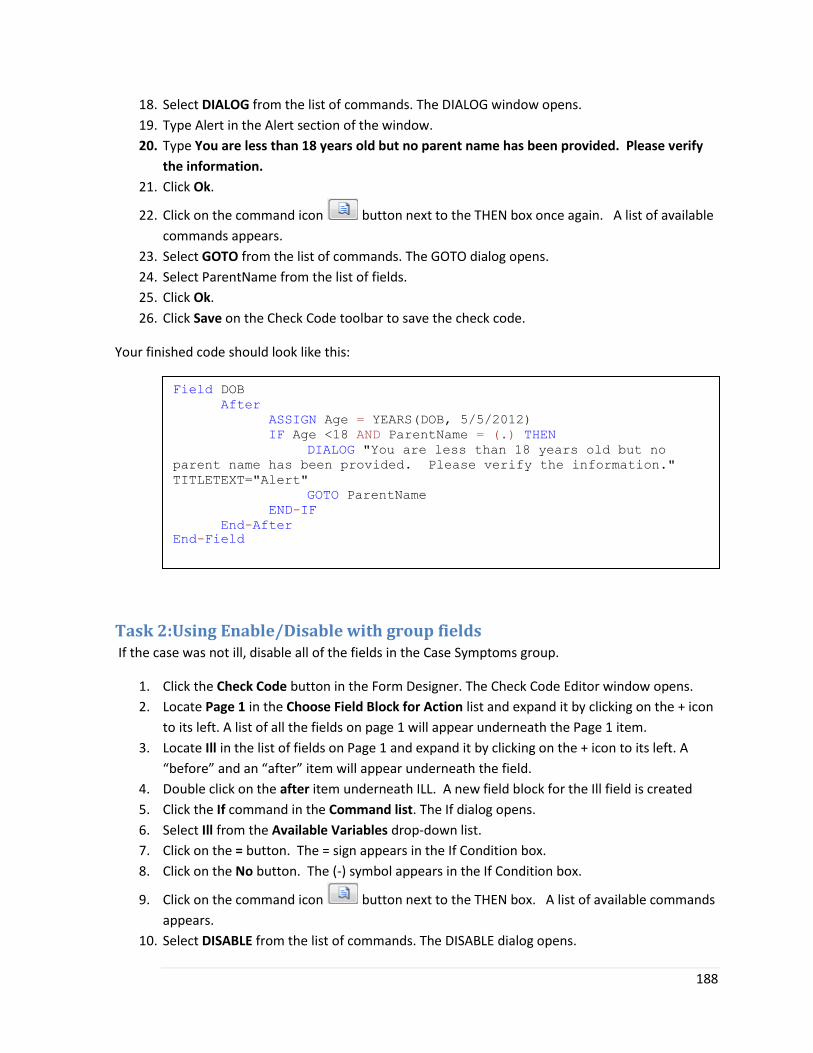
188
18. Select DIALOG from the list of commands. The DIALOG window opens.
19. Type Alert in the Alert section of the window.
20. Type You are less than 18 years old but no parent name has been provided. Please verify
the information.
21. Click Ok.
22. Click on the command icon button next to the THEN box once again. A list of available
commands appears.
23. Select GOTO from the list of commands. The GOTO dialog opens.
24. Select ParentName from the list of fields.
25. Click Ok.
26. Click Save on the Check Code toolbar to save the check code.
Your finished code should look like this:
Task 2:Using Enable/Disable with group fields If the case was not ill, disable all of the fields in the Case Symptoms group.
1. Click the Check Code button in the Form Designer. The Check Code Editor window opens.
2. Locate Page 1 in the Choose Field Block for Action list and expand it by clicking on the + icon
to its left. A list of all the fields on page 1 will appear underneath the Page 1 item.
3. Locate Ill in the list of fields on Page 1 and expand it by clicking on the + icon to its left. A
“before” and an “after” item will appear underneath the field.
4. Double click on the after item underneath ILL. A new field block for the Ill field is created
5. Click the If command in the Command list. The If dialog opens.
6. Select Ill from the Available Variables drop-down list.
7. Click on the = button. The = sign appears in the If Condition box.
8. Click on the No button. The (-) symbol appears in the If Condition box.
9. Click on the command icon button next to the THEN box. A list of available commands
appears.
10. Select DISABLE from the list of commands. The DISABLE dialog opens.
Field DOB
After
ASSIGN Age = YEARS(DOB, 5/5/2012)
IF Age <18 AND ParentName = (.) THEN
DIALOG "You are less than 18 years old but no
parent name has been provided. Please verify the information."
TITLETEXT="Alert"
GOTO ParentName
END-IF
End-After
End-Field
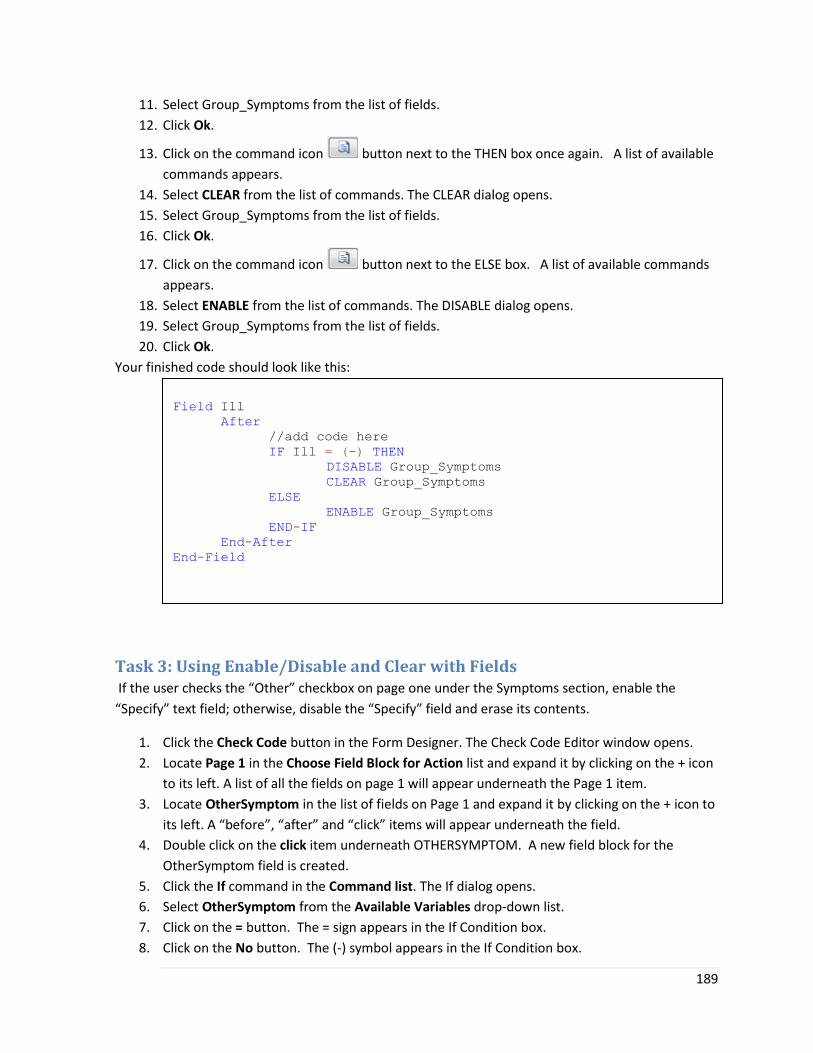
189
11. Select Group_Symptoms from the list of fields.
12. Click Ok.
13. Click on the command icon button next to the THEN box once again. A list of available
commands appears.
14. Select CLEAR from the list of commands. The CLEAR dialog opens.
15. Select Group_Symptoms from the list of fields.
16. Click Ok.
17. Click on the command icon button next to the ELSE box. A list of available commands
appears.
18. Select ENABLE from the list of commands. The DISABLE dialog opens.
19. Select Group_Symptoms from the list of fields.
20. Click Ok.
Your finished code should look like this:
Task 3: Using Enable/Disable and Clear with Fields If the user checks the “Other” checkbox on page one under the Symptoms section, enable the
“Specify” text field; otherwise, disable the “Specify” field and erase its contents.
1. Click the Check Code button in the Form Designer. The Check Code Editor window opens.
2. Locate Page 1 in the Choose Field Block for Action list and expand it by clicking on the + icon
to its left. A list of all the fields on page 1 will appear underneath the Page 1 item.
3. Locate OtherSymptom in the list of fields on Page 1 and expand it by clicking on the + icon to
its left. A “before”, “after” and “click” items will appear underneath the field.
4. Double click on the click item underneath OTHERSYMPTOM. A new field block for the
OtherSymptom field is created.
5. Click the If command in the Command list. The If dialog opens.
6. Select OtherSymptom from the Available Variables drop-down list.
7. Click on the = button. The = sign appears in the If Condition box.
8. Click on the No button. The (-) symbol appears in the If Condition box.
Field Ill
After
//add code here
IF Ill = (-) THEN
DISABLE Group_Symptoms
CLEAR Group_Symptoms
ELSE
ENABLE Group_Symptoms
END-IF
End-After
End-Field

190
9. Click on the command icon button next to the THEN box. A list of available commands
appears.
10. Select DISABLE from the list of commands. The DISABLE dialog opens.
11. Select OtherSymptomSpecify from the list of fields.
12. Click Ok.
13. Click on the command icon button next to the THEN box once again. A list of available
commands appears.
14. Select CLEAR from the list of commands. The CLEAR dialog opens.
15. Select OtherSymptomSpecify from the list of fields.
16. Click Ok.
17. Click on the command icon button next to the ELSE box. A list of available commands
appears.
18. Select ENABLE from the list of commands. The DISABLE dialog opens.
19. Select OtherSymptomSpecify from the list of fields.
20. Click Ok.
Your finished code should look like this:
Task 4: Using Enable/Disable and Clear with Fields Apply the same logic in #3 to when page one is loaded. That is, the “Specify” field should appear
enabled or disabled (based on the value in the “Other” checkbox) as soon as page one opens.
1. Click the Check Code button in the Form Designer. The Check Code Editor window opens.
2. Locate Page 1 in the Choose Field Block for Action list and expand it by clicking on the + icon
to its left. A list of all the fields on page 1 will appear underneath the Page 1 item.
3. This time, locate the “before” and “after” items underneath Page 1.
4. Double click on the before item underneath Page 1. A new field block for the Page is
created.
5. Click the If command in the Command list. The If dialog opens.
6. Select OtherSymptom from the Available Variables drop-down list.
7. Click on the = button. The = sign appears in the If Condition box.
Field OtherSymptom
Click
//add code here
IF OtherSymptom = (-) THEN
DISABLE OtherSymptomSpecify
CLEAR OtherSymptomSpecify
ELSE
ENABLE OtherSymptomSpecify
END-IF
End-Click
End-Field
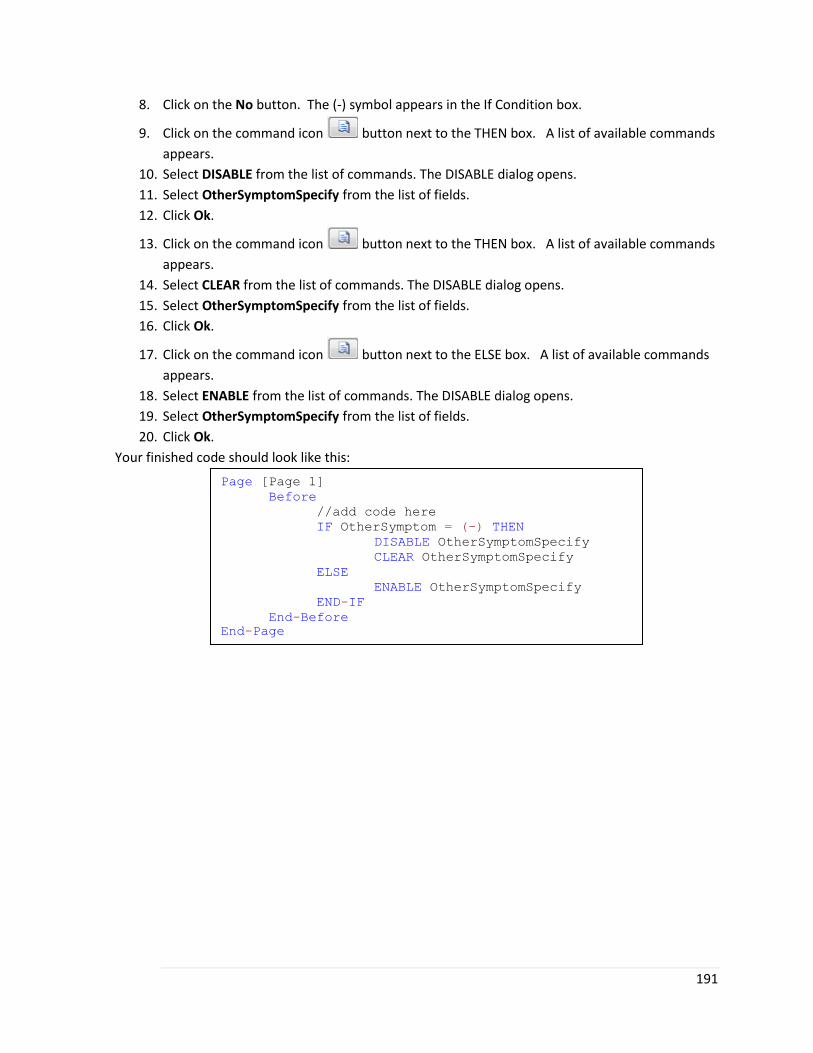
191
8. Click on the No button. The (-) symbol appears in the If Condition box.
9. Click on the command icon button next to the THEN box. A list of available commands
appears.
10. Select DISABLE from the list of commands. The DISABLE dialog opens.
11. Select OtherSymptomSpecify from the list of fields.
12. Click Ok.
13. Click on the command icon button next to the THEN box. A list of available commands
appears.
14. Select CLEAR from the list of commands. The DISABLE dialog opens.
15. Select OtherSymptomSpecify from the list of fields.
16. Click Ok.
17. Click on the command icon button next to the ELSE box. A list of available commands
appears.
18. Select ENABLE from the list of commands. The DISABLE dialog opens.
19. Select OtherSymptomSpecify from the list of fields.
20. Click Ok.
Your finished code should look like this:
Page [Page 1]
Before
//add code here
IF OtherSymptom = (-) THEN
DISABLE OtherSymptomSpecify
CLEAR OtherSymptomSpecify
ELSE
ENABLE OtherSymptomSpecify
END-IF
End-Before
End-Page

192
Student Practice-Lesson 4 Determine the answers to the following questions.
1. What racial category has the highest frequency in this data set?
a. Right-click on a blank portion of the Dashboard canvas. A context menu appears.
b. Select Add Analysis Gadget > Frequency from the context menu. The frequency
gadget appears.
c. Select Race in the Frequency drop-down list. The frequency is displayed.
ANSWER: White with 152 cases or 49.19%
2. Does the answer for #1 still hold true when the groups are separated into males and
females?
a. Right-click on a blank portion of the Dashboard canvas. A context menu appears.
b. Select Add Analysis Gadget > Frequency from the context menu. The frequency
gadget appears.
c. Select Race in the Frequency drop-down list.
a. Click on Advanced options. The Advanced options panel displays.
b. Click on the Gender from the Stratify by drop-down list.
c. Click on Run. The frequency output is re-generated with stratified output.
ANSWER: Yes, the answer for #1 still holds true.
White and Female: 62 or 45.59%
White and Male: 90 or 52.02%
3. How many people drank water and ate their meal at 2:00 pm?
a. Move the mouse over the Data Filters box on the right edge of the canvas. The Data
Filters slide-out gadget appears.
b. Select Water from the Field Name drop-down list.
c. Select Yes from the Value drop-down list.
d. Click the Add Filter button to add this condition.
e. Select AteAt2 from the Field Name drop-down list.
f. Select is equal to from the Operator drop-down list.
g. Select Yes from the Value drop-down list.
h. Click the Add Filter button to add this condition to the list of data filters.
i. Select Add Condition with AND from the two options provided.
j. The condition appears in the Data filters grid view and the records count on the
header changes.
ANSWER: 88
4. What is the average age of people in this data set by case outcome and gender?
a. Right-click on a blank portion of the Dashboard canvas. A context menu appears.
b. Select Add Analysis Gadget > Means from the context menu. The means gadget
appears.
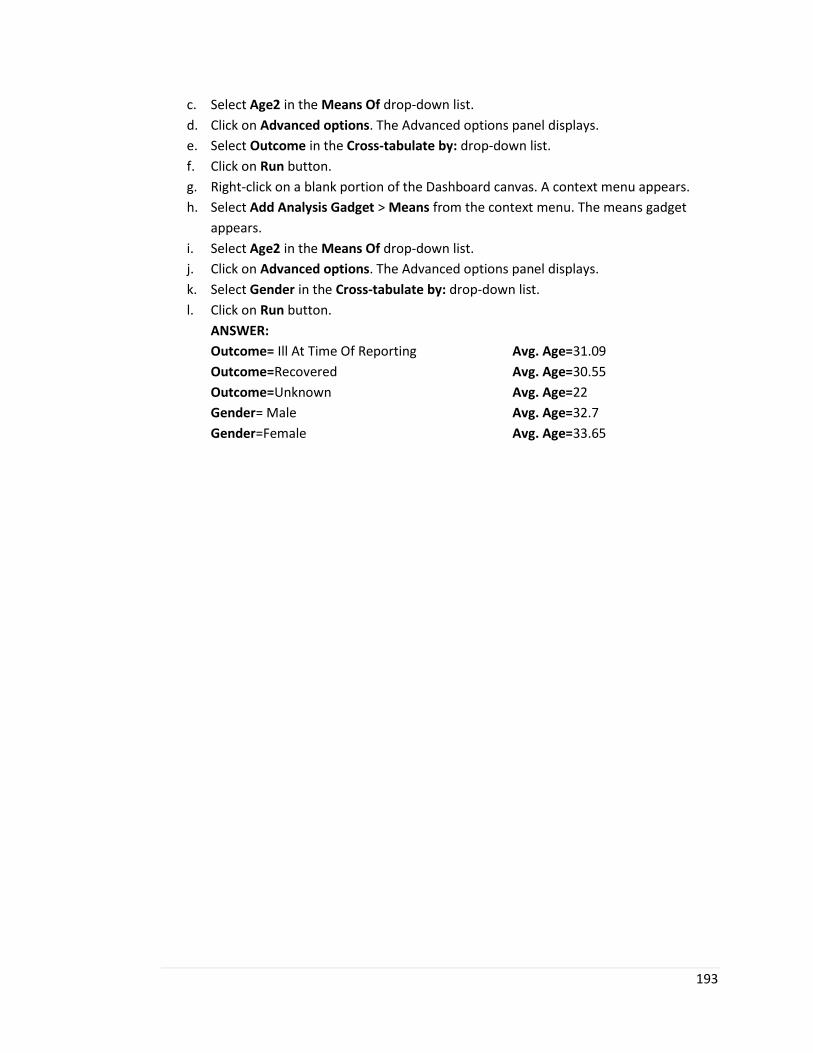
193
c. Select Age2 in the Means Of drop-down list.
d. Click on Advanced options. The Advanced options panel displays.
e. Select Outcome in the Cross-tabulate by: drop-down list.
f. Click on Run button.
g. Right-click on a blank portion of the Dashboard canvas. A context menu appears.
h. Select Add Analysis Gadget > Means from the context menu. The means gadget
appears.
i. Select Age2 in the Means Of drop-down list.
j. Click on Advanced options. The Advanced options panel displays.
k. Select Gender in the Cross-tabulate by: drop-down list.
l. Click on Run button.
ANSWER:
Outcome= Ill At Time Of Reporting
Outcome=Recovered
Outcome=Unknown
Gender= Male
Gender=Female
Avg. Age=31.09
Avg. Age=30.55
Avg. Age=22
Avg. Age=32.7
Avg. Age=33.65

194
Student Practice-Lesson 4 In order to create a new field to group food items to a specific ingredient, you will need to create the
conditional assignment option of the Visual Dashboard. In order to do so, complete the following
steps:
1. Move the mouse over the Defined Variables box on the left edge of the canvas. The
Defined Variables slide-out gadget appears.
2. Click New Variable. A list of variable options appears.
3. Select With Conditional Assignment from the list of variable options. The Add variable
with conditional assignment dialog opens.
4. Type EggFoods into the Assign field box.
5. Select Yes/No from the Assign field type drop-down list.
6. Click the Create/Edit Condition button. The Specify assign condition dialog appears.
(This dialog operates in the same way as the Data Filter slide-out gadget.)
7. Select ChefSalad in the Field Name drop-down list.
8. Select is equal to in the Operator drop-down list.
9. Select Yes in the Value drop-down list.
10. Click Add condition. The condition is added to the Conditions grid view.
11. Select EggSaladSanwich in the Field Name drop-down list.
12. Select is equal to in the Operator drop-down list.
13. Select Yes in the Value drop-down list.
14. Click Add condition. A context menu appears asking how you would like to add this new
condition to the one already present.
15. Select Add condition with OR. The condition is added to the Conditions grid view. Click
OK. The Specify assign condition dialog closes and the Assign condition box in the
Conditional Assign dialog has changed to show the condition you created.
16. Select Yes in the Assign value drop-down list.
17. Check the Use Else checkbox.
18. Select No in the Else value drop-down list.
19. Click OK. The variable is created and appears in the Defined Variables slide-out gadget.
Now you can use this variable as your Exposure field using 2x2 tables to evaluate the
association of consuming eggs (EggFoods) and getting ill. Notice the results. Several of these
statistics suggest that consumption of Egg Foods is associated with illness:
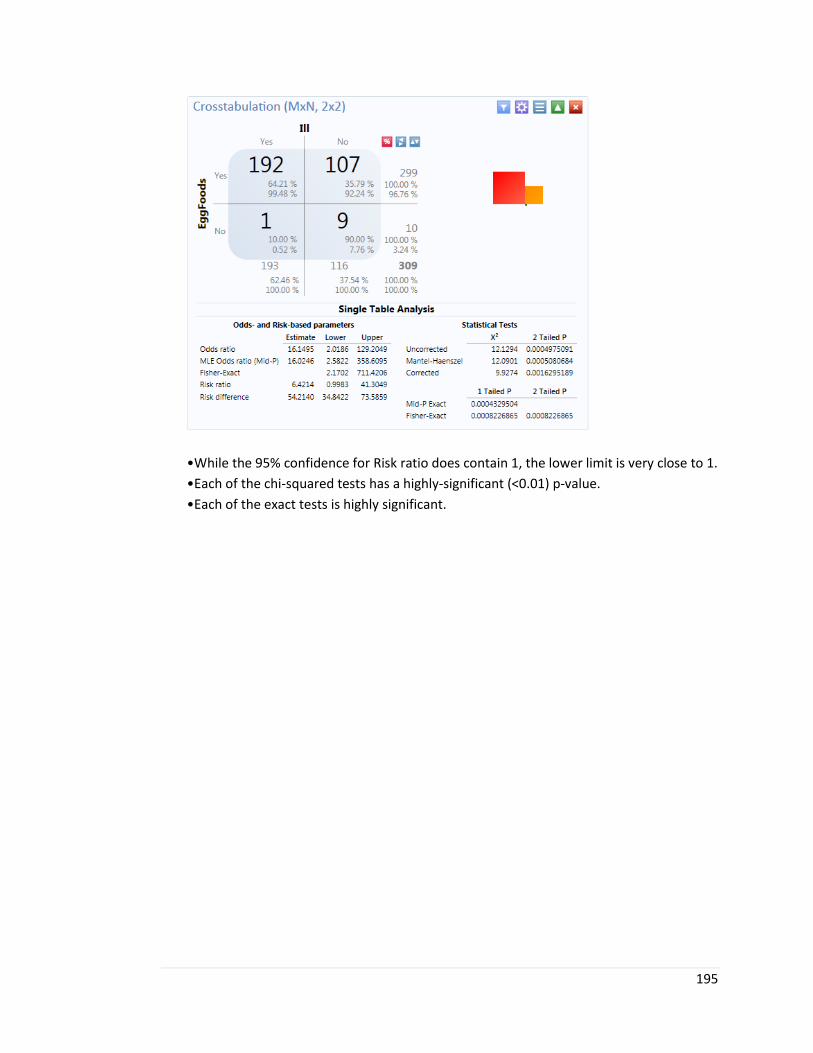
195
•While the 95% confidence for Risk ratio does contain 1, the lower limit is very close to 1.
•Each of the chi-squared tests has a highly-significant (<0.01) p-value.
•Each of the exact tests is highly significant.
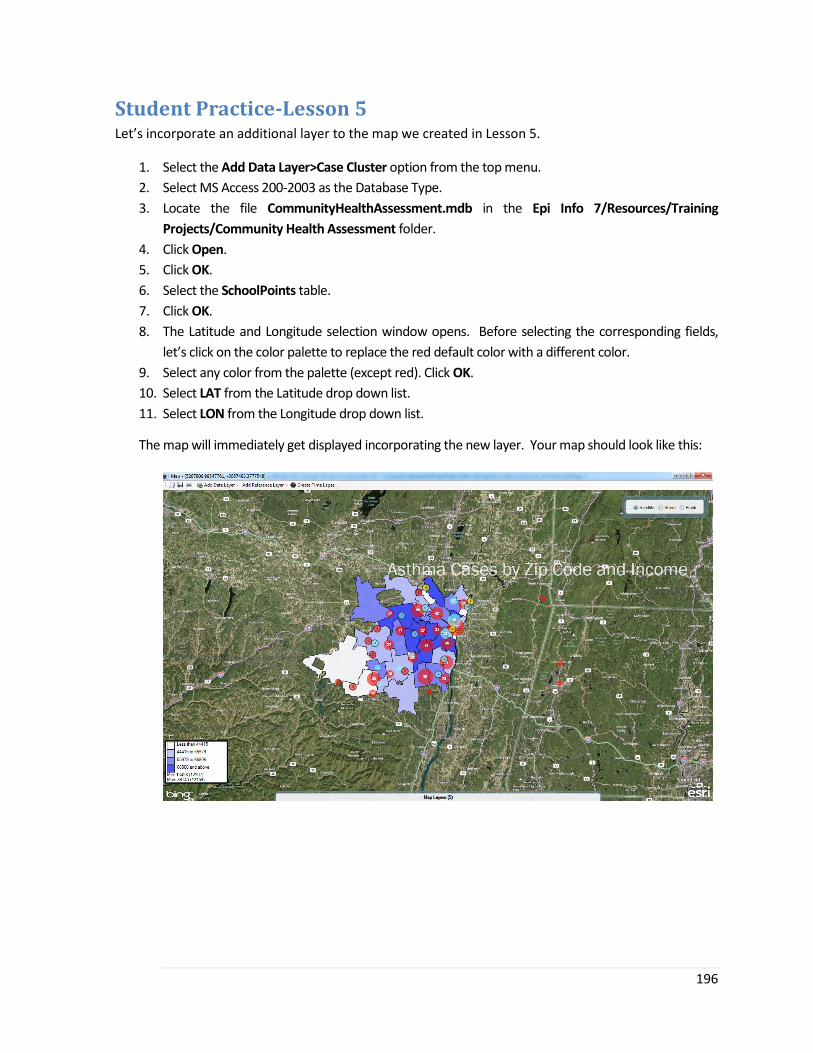
196
Student Practice-Lesson 5 Let’s incorporate an additional layer to the map we created in Lesson 5.
1. Select the Add Data Layer>Case Cluster option from the top menu.
2. Select MS Access 200-2003 as the Database Type.
3. Locate the file CommunityHealthAssessment.mdb in the Epi Info 7/Resources/Training
Projects/Community Health Assessment folder.
4. Click Open.
5. Click OK.
6. Select the SchoolPoints table.
7. Click OK.
8. The Latitude and Longitude selection window opens. Before selecting the corresponding fields,
let’s click on the color palette to replace the red default color with a different color.
9. Select any color from the palette (except red). Click OK.
10. Select LAT from the Latitude drop down list.
11. Select LON from the Longitude drop down list.
The map will immediately get displayed incorporating the new layer. Your map should look like this:

188