Bridgeman's Fruit Cultivators Manual; by Thomas Bridgeman (1847)

1
EPCOR Utilities Inc.Investor Presentation June 2016
Guy BridgemanSenior Vice President & Chief Financial Officer
Bryan KornfeldSenior Manager, Corporate Finance
Guy BridgemanSenior Vice President & Chief Financial Officer
John ElfordSenior Vice President, Water Canada
Duane SommerfeldTreasurer
Pam ZrobekCorporate Controller
Regina Wastewater Treatment Plant

2
Forward-Looking InformationCertain information in this presentation and in oral answers to questions may contain forward-lookinginformation statements or forward-looking information together, “forward-looking information together”.Forward-looking information is based on current expectations, estimates and projections that involve anumber of risks which could cause actual results to vary and in some instances to differ materially fromthose anticipated by EPCOR. Forward-looking information is based on the estimates and opinions ofmanagement at the time the information is presented. Actual results could differ materially from conclusions,forecasts or projections in the forward-looking information, and certain material factors or assumptions wereapplied in drawing conclusions or making forecasts or projections as reflected in the forward-lookinginformation. Additional information about the material factors and risks that could cause actual results todiffer materially from the conclusions, forecasts or projections in the forward-looking information and thematerial factors or assumptions that were applied in drawing a conclusion or making a forecast or projectionas reflected in the forward-looking information is contained in the most recent interim and annualManagement Discussion and Analysis filed on SEDAR (www.sedar.com) and EPCOR’s website(www.epcor.com).
Readers are cautioned not to place undue reliance on forward-looking statements as actual results coulddiffer materially from the plans, expectations, estimates or intentions expressed in the forward-lookingstatements. Except as required by law, EPCOR assumes no obligation to update any forward-lookinginformation, should circumstances or management’s estimates or opinions change, or any other reason.

3
EPCOR Overview

4
EPCOR – Corporate Snapshot
Stand-alone corporation, owned solely by City of Edmonton – no reliance on shareholder to fund investments.
Governed by independent Board of Directors.
Long-life, high quality, infrastructure asset in North America.
Predominantly rate regulated business with limited commercial exposure, carried under long-term contract with investment grade counterparties.
Regulatory and geographic diversity.
Strong, stand-alone investment grade credit ratings.
Issuer of public and private debt.

5
EPCOR OperationsBuilder, owner, operator of electrical transmission and distribution networks, water and wastewater treatment facilities and infrastructure and provider of retail energy products.

6
Excellent risk profileExposure to power generation significantly reduced since spin-off in 2009.Mostly rate regulated.Good sector and geographic diversity.
Excellent credit profileStrong balance sheet.Strong operating cash flow and related solvency metrics.Cash from operations is sufficient to fund organic growth and dividend.
Excellent growth profile2/3 of capital investment is in regulated businesses – funded from operations.1/3 related to business development – funded by debt issuance.
Focus on development projects (P3, selenium, greenfield natural gas).Disciplined development process within Risk Appetite Framework.
EPCOR Financial Profile

7
Strategic Positioning:Annual in-depth planning process.Delivered on stated strategy to sell down interest in Capital Power and invest in regulated and long-term contracted assets.
Risk Management:Comprehensive financial management policies and enterprise risk management system geared to identifying, understanding and mitigating risk.Disciplined approach to operations, business development and capital placement.Fully staffed Regulatory and Government Relations teams.
Organizational Effectiveness:Experienced management team with considerable expertise.
Governance:Independent and experienced Board of Directors. New perspectives and skills added with three new directors in two years.
CONFIDENTIAL
Management and Governance

8
Financial Overview

9
Sold majority of the power generation business, re-investing in lower risk wires and water utility infrastructure.
$0
$50
$100
$150
$200
$250
$300
$350
$400
2009 2010 2011 2012 2013 2014 2015
Generation
Corporate
Energy Services
Distribution & Transmission
Water Services
Pre-split Level
$ M
illio
n
$330
$203$188
$252
$290
$365
Risk Re-orientation
CONFIDENTIAL
$285
Operating Income
10
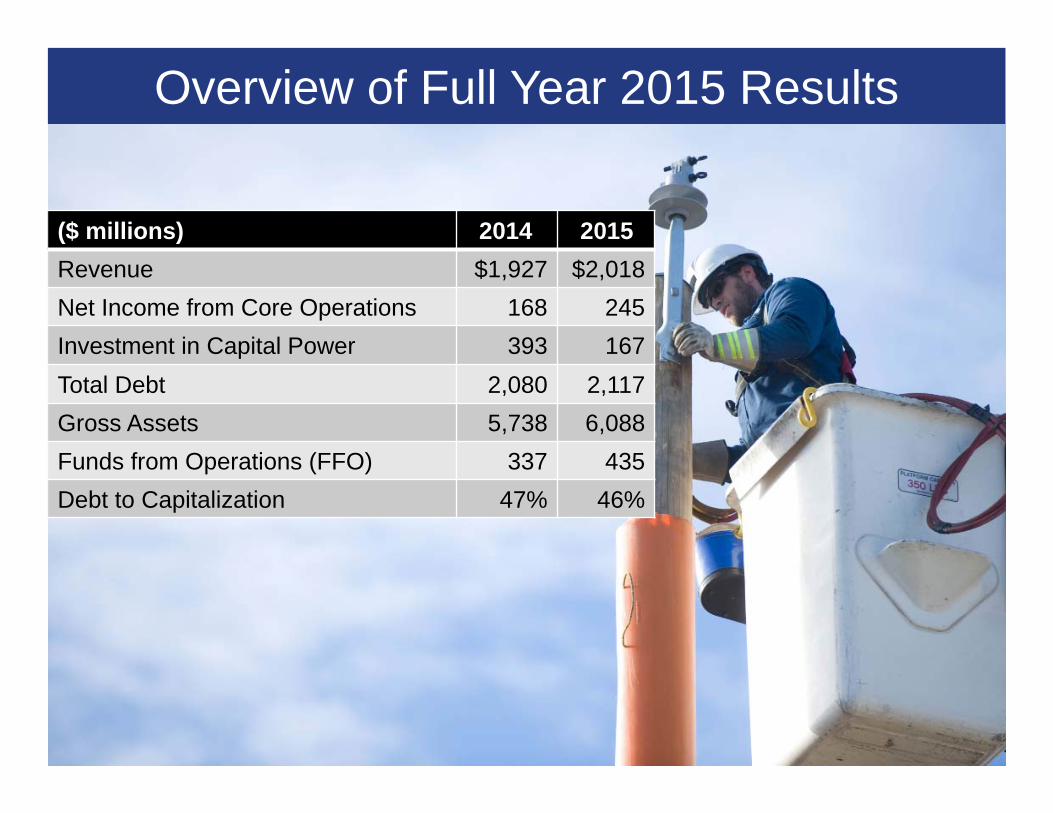
Overview of Full Year 2015 Results
($ millions) 2014 2015Revenue $1,927 $2,018Net Income from Core Operations 168 245Investment in Capital Power 393 167Total Debt 2,080 2,117Gross Assets 5,738 6,088Funds from Operations (FFO) 337 435Debt to Capitalization 47% 46%

111 All amounts in millions of CDN dollars, as of December 31, 2015
2015 – Financial Overview
12
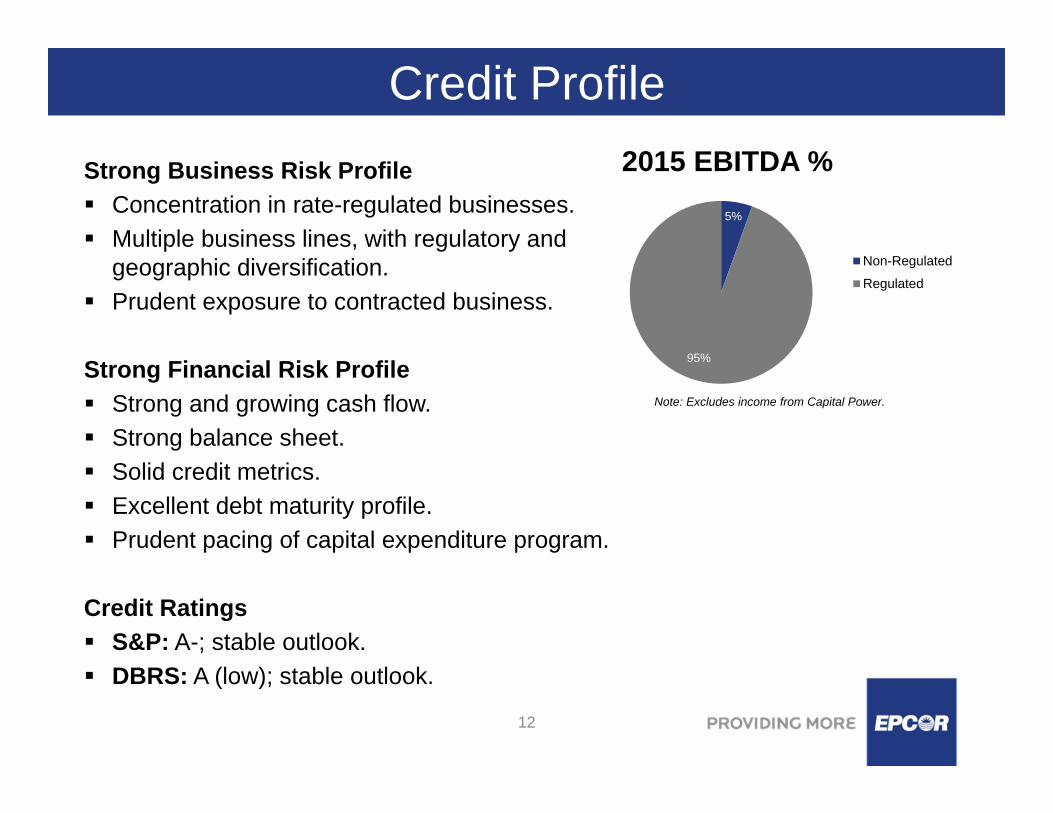
Strong Business Risk ProfileConcentration in rate-regulated businesses.Multiple business lines, with regulatory and geographic diversification.Prudent exposure to contracted business.
Strong Financial Risk ProfileStrong and growing cash flow.Strong balance sheet.Solid credit metrics.Excellent debt maturity profile.Prudent pacing of capital expenditure program.
Credit RatingsS&P: A-; stable outlook.DBRS: A (low); stable outlook.
Credit Profile
Note: Excludes income from Capital Power.
5%
95%
2015 EBITDA %
Non-Regulated
Regulated

13
Cash Flow and Leverage
FFO compound average annual rate of 23% since 2010.
FFO largely funding sustainable capital program and dividends.
Prudent leverage provides capacity to add debt.

14
Improving Solvency
Interest Coverage net of impacts from Capital Power
Financial capacity and flexibility evident with improving coverage ratios.
Strengthening cash flow and earnings, driven by BU performance.
Reinvestment of Capital Power divestiture into core businesses.
Diminishing impact from Back-to-Back debt with Capital Power; end in sight.

15
Debt Maturities
Debt maturities are well spaced without any notable pressure points.2016 maturity was paid March 22, 2016.2018 debt maturity is $236 million, not inclusive of Capital Power’s backing obligation.

16
Good access to capital and short-term liquidity.
Committed credit facilities of $550 million – supporting $350 million commercial paper program.
Unutilized $1 billion Short Term Base Shelf.
Dividend obligation of $141 million until a change is recommended by the Board and approved by the Shareholder.
Debt maturities generally align with asset lives financed with debt profile laddered appropriately.
Debt is denominated in currency to match cash flow and sourced at lowest economic cost.
Expecting to issue debt to fund development growth.
As circumstances dictate, preferred shares / hybrid financing will be considered as well as further sell down of Capital Power equity stake.
Financing Summary

17
Regulatory Update

18
Water
Water Canada – Regulatory UpdateApproved ROE for Edmonton Water and Wastewater remains at 10.875%.Approved capital structure remains 60% debt to 40% equity.Submitted 2017-2021 PBR application in the second quarter of 2016.
Water USA – Regulatory UpdateRegulatory tone remains positive. Improved regulatory mechanism brings assets into rate base with minimal lag.

19
Regulatory Update
Utility Asset Disposition ruling upheld original decision regarding stranded assets – no rating downgrades occurred because of it or are expected.
Distribution received very favorable decision on its 2016-2017 capital tracker application, including Advanced Meter Infrastructure.
Distribution filed its second generation PBR proposal on March 23, 2016.
Generic Cost of Capital proceedings will conclude this year, deciding the 2016 and 2017 return-on-equity rates. The rates for 2013, 2014 and 2015 were:
Distribution & Transmission
Entity Equity Capital ROE Rate
Transmission 36% 8.3%
Distribution 40% 8.3%

20
Energy Services
Regulatory Update - Energy Price Setting Plan Amendment
February 2014 - AUC approved the corporate reorganization resulting in significant cash tax savings through utilization of tax loss carry forwards.
2014 – 2018 Energy Price Setting Plan Compliance filing approved by the regulator with implementation in August 2016.
Approval provides reduced exposure to energy risk and compensation for commodity losses.
Next Energy Price Setting Plan Application anticipated in Q3 of 2016 –covering period after April 30, 2018.
21
Strategy & Growth
22
Strategic DirectionBalanced growth profile
Investments more weighted towards regulated utility infrastructure.Scale of commercial and industrial investment will not jeopardize current credit ratings.
Development2/3 of capital development in organic growth.Develop a new operating hub - greenfield natural gas in Ontario.Partner with municipalities for new water / wastewater needs.
Public–private partnership (P3) / concession projects.
Market reputationContinue to build reputation as a trusted developer and operator of utility assets.Zero injury culture.Service reliability.Environmental responsibility.

23
P3 DevelopmentContinue to build on success in P3 space.Regina Wastewater Treatment Plant expansion upgrade costing $158 million with EPCOR providing long-term financing of $79 million at completion in 2016.Evan-Thomas Water and Wastewater Facility contract with Alberta Infrastructure on $37.6 million expansion and upgrade completed in 2014.
Water – Municipal
Water and Wastewater – Municipal Significant opportunity to invest in municipal infrastructure which the federal government has identified as a top priority.

24
Water – Commercial Water treatment opportunity in mining sector
Mining is a battered industry; low point in commodity cycle.
Environmental pressure to manage the release of Selenium caused by mining into waterways is another heavy burden.
Selenium is a harmful element to fish.
The U.S. EPA is expressing urgency.
EPCOR succeeded in removal of heavy metals from the Britannia mine site.
Possibilities exist for EPCOR to place capital in water treatment facilities focused on selenium removal.

25
Texas Water Pipeline
Opportunity to purchase existing contracted water pipeline operations in Texas.Low Risk - Service to municipal customers under long-term contracts.
Water supply also under long-term contract.
Attractive Returns - Potential to increase returns by signing up additional customers.
Growth Potential - New business platform without development risks.
Huge water infrastructure need in Texas to meet long-term demands.
Project to be funded by a U.S. private debt issue of $40 million.

26
New Hub – Ontario Natural Gas Expansion into natural gas distribution
EPCOR successful in bid for rights to develop and operate a rate regulated natural gas distribution utility. Initially to three municipalities in the South Bruce region of Ontario.
KincardineArran-ElderslieHuron-Kinloss
Franchise agreements in place with all three municipalities.Rate regulated by Ontario Energy Board (OEB).Subject to OEB approval.

27
Drainage Services
Opportunity for City of Edmonton to transfer drainage services, which conveys sewage and storm water runoff from approximately 250,000 customers.
*Net of contributed assets
Would bolster resume to bid on future collection system projects.
City of Edmonton Council voted to study pros and cons.
Decision expected Q4 2016.
($ Millions)
WaterWaste Water Total
Net Income 47 52 12 64 Funds from Operations 70 90 26 116 Capital Spend 132 102 46 148
Fixed Assets* 862 1,048 316 1,364 Debt 447 627 211 838 Staffing 769 477 174 651
EPCOR - 2015ACity Drainage
2014A

28
Final Thoughts
CONFIDENTIAL
EPCOR firing on all cylinders!
Strong financial performance across all business units.
Healthy balance sheet is strengthening; credit metrics are improving.
Regulatory wins:Arizona regulatory environment continues to improve.Favorable PBR capital tracker decision.Energy Price Setting Plan performing well.
Non-deferrable, regulated capital placement is increasing.
Improved business development deal flow and outlook.
Adding Drainage would enhance EPCOR’s regulated business activities.

29
Thank you for your time

30
Appendix
31
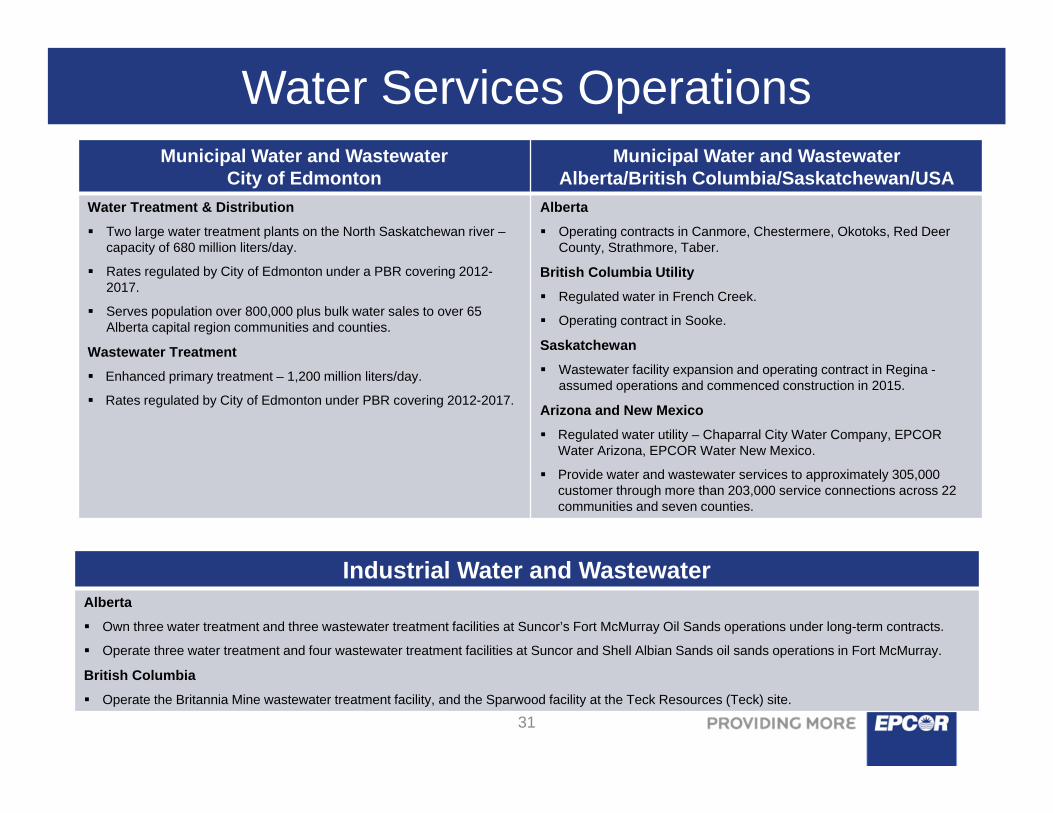
Water Services OperationsMunicipal Water and Wastewater
City of EdmontonMunicipal Water and Wastewater
Alberta/British Columbia/Saskatchewan/USAWater Treatment & Distribution
Two large water treatment plants on the North Saskatchewan river –capacity of 680 million liters/day.
Rates regulated by City of Edmonton under a PBR covering 2012-2017.
Serves population over 800,000 plus bulk water sales to over 65 Alberta capital region communities and counties.
Wastewater TreatmentEnhanced primary treatment – 1,200 million liters/day.
Rates regulated by City of Edmonton under PBR covering 2012-2017.
AlbertaOperating contracts in Canmore, Chestermere, Okotoks, Red Deer County, Strathmore, Taber.
British Columbia UtilityRegulated water in French Creek.
Operating contract in Sooke.
SaskatchewanWastewater facility expansion and operating contract in Regina -assumed operations and commenced construction in 2015.
Arizona and New MexicoRegulated water utility – Chaparral City Water Company, EPCOR Water Arizona, EPCOR Water New Mexico.
Provide water and wastewater services to approximately 305,000 customer through more than 203,000 service connections across 22 communities and seven counties.
Industrial Water and WastewaterAlberta
Own three water treatment and three wastewater treatment facilities at Suncor’s Fort McMurray Oil Sands operations under long-term contracts.
Operate three water treatment and four wastewater treatment facilities at Suncor and Shell Albian Sands oil sands operations in Fort McMurray.
British ColumbiaOperate the Britannia Mine wastewater treatment facility, and the Sparwood facility at the Teck Resources (Teck) site.

32
Electricity OperationsElectricity Distribution and Transmission Technologies
Distribute to approximately 370,000 sites within Edmonton with high reliability.Approximately 5,500 km of distribution and 260 km of transmission lines, both aerial and underground.
51,000 poles with 11,500 aerial transformers and more than 19,400 underground transformer.
Own and operate 35 transmission and five distribution substations.
Regulated by the Alberta Utilities Commission (AUC) – Distribution (PBR) /Transmission (cost of service).
Provide design, construction and maintenance services for street lighting, traffic signals and Light Rail Transit systems in Edmonton, Calgary and other municipalities.

33
Energy ServicesRegulated Operations Encor by EPCOR
Provide RRO (procurement, billing and customer care) for approximately 600,000 Edmonton and Fortis Alberta energycustomers.
Regulated by AUC on a cost-of-service based framework.
Provide billing and customer care for approximately 265,000 EPCOR water customers in Edmonton and City of Edmonton drainage and waste collection services.
Owing to market conditions and low RRO rates, EPCOR has returned to net site growth not experienced since the 2009-2011 period, and gained 7,500 RRO customers in 2015.
Competitive Retail energy provider under Encor by EPCOR. Provide procurement, billing and customer care services to Alberta retail electricity and gas customers under competitive contract.
Currently offers fixed and floating electricity and gas contracts with all commodity risk transferred to the third party.
Introduced new green competitive product offerings for gas and electricity contracts. Encor green energy is sourced from 100% Canadian renewable energy projects.
34
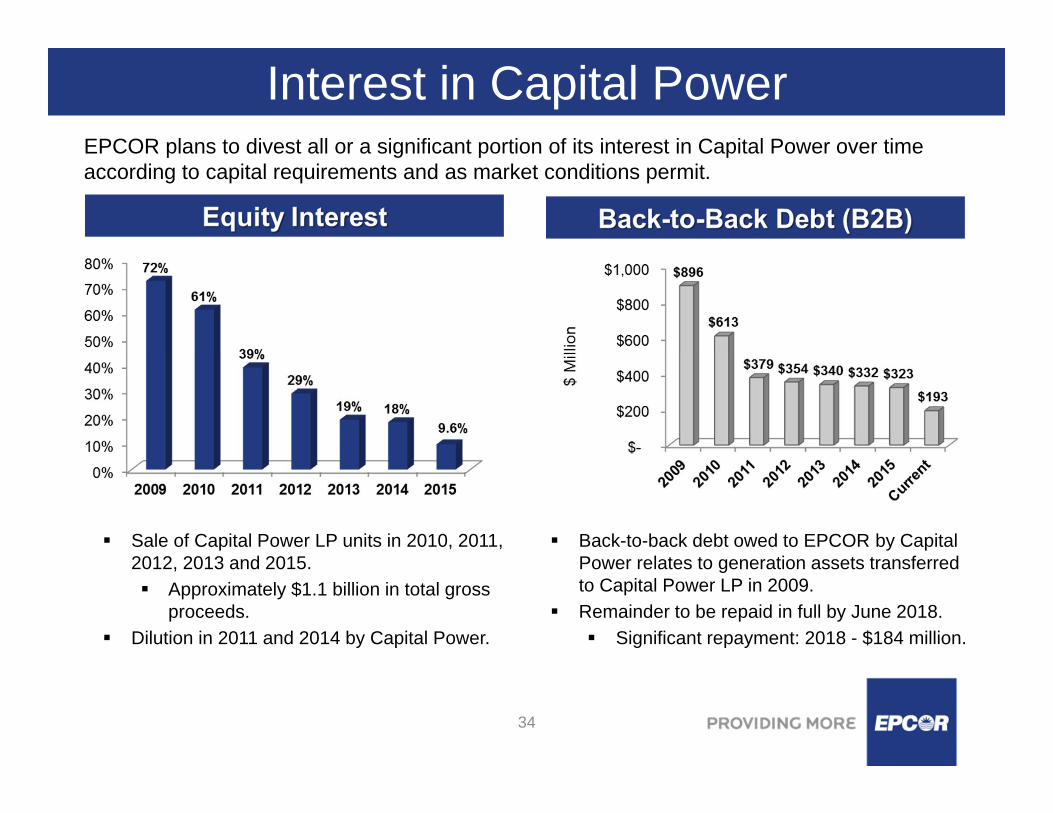
Sale of Capital Power LP units in 2010, 2011, 2012, 2013 and 2015.
Approximately $1.1 billion in total gross proceeds.
Dilution in 2011 and 2014 by Capital Power.
Back-to-back debt owed to EPCOR by Capital Power relates to generation assets transferred to Capital Power LP in 2009.Remainder to be repaid in full by June 2018.
Significant repayment: 2018 - $184 million.
EPCOR plans to divest all or a significant portion of its interest in Capital Power over time according to capital requirements and as market conditions permit.
Interest in Capital Power