EPA Strategy - iowadnr.gov Workshops... · EPA’s SMM Strategic Plan 2017-2022. 23. Strategic...
29
EPA Strategy Mary Goetz, EPA Region 7 24 Apr 2018
Transcript of EPA Strategy - iowadnr.gov Workshops... · EPA’s SMM Strategic Plan 2017-2022. 23. Strategic...

EPA Strategy
Mary Goetz, EPA Region 724 Apr 2018

Outline• FY18-22 Transformation Strategy• EPA Lean Management Systems Principles• RCRA Haz. Waste Generators, Treatment, Storage,
Disposal• Sustainable Materials Management Strategies• Questions


EPA Lean Management Systems


RCRA
March 2018
10
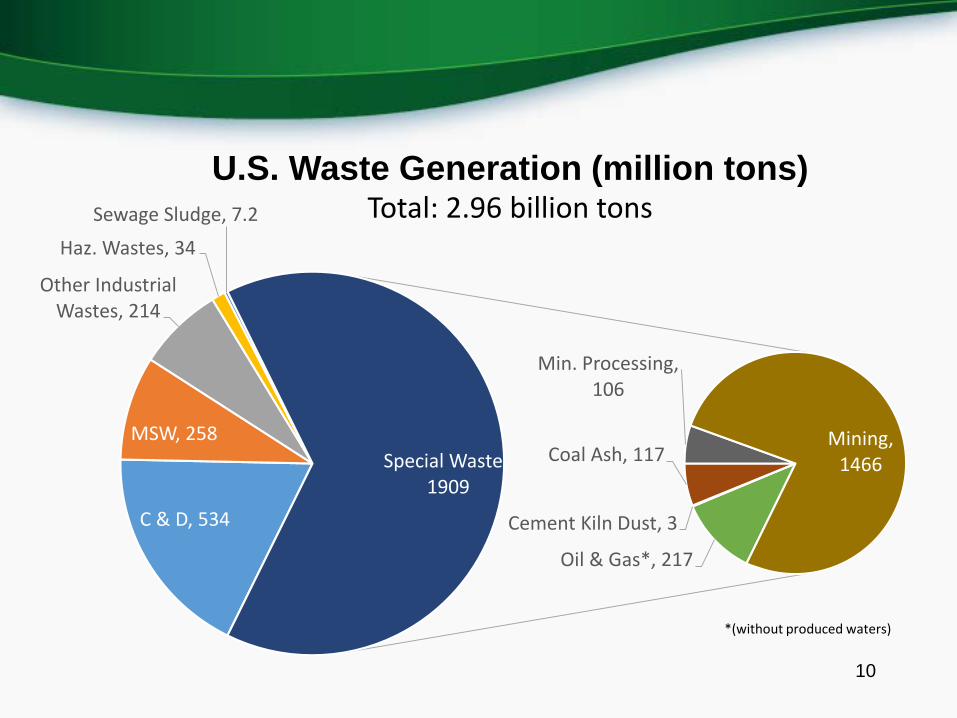
C & D, 534
MSW, 258
Other Industrial Wastes, 214
Haz. Wastes, 34
Sewage Sludge, 7.2
Oil & Gas*, 217
Cement Kiln Dust, 3
Coal Ash, 117
Min. Processing, 106
Mining, 1466Special Waste,
1909
U.S. Waste Generation (million tons)Total: 2.96 billion tons
*(without produced waters)

Hazardous Waste Generators - Iowa
Benefits of the RCRA Program• Every year in the United States, we generate nine tons of waste
per person.• RCRA provides a framework for an efficient, $100 billion dollar
waste management industry directly employing 379,000 people.• We work in partnership with the states to ensure that the more
than 400,000 facilities that manage solid and hazardous wastes have the necessary controls to safeguard communities and the environment and prevent the creation of new Superfund sites.
• The overall RCRA program produces economic benefits of $50B - $58B, while costs are estimated at $13.2B.
12
Collaboration
13
Collaboration with States and Tribes• EPA HQ, EPA Regions, States,
and Tribes work together to implement the RCRA program.
• In FY17, EPA provided $99 million through RCRA’s State and Tribal Assistance Grants (STAG) to help states and tribes implement Subtitle C of RCRA.
• EPA is responsible for direct implementation of the RCRA HW program in 2 states, Corrective Action in 6 states, and the HW programs in Indian Country for all 573 federally recognized tribes.
14
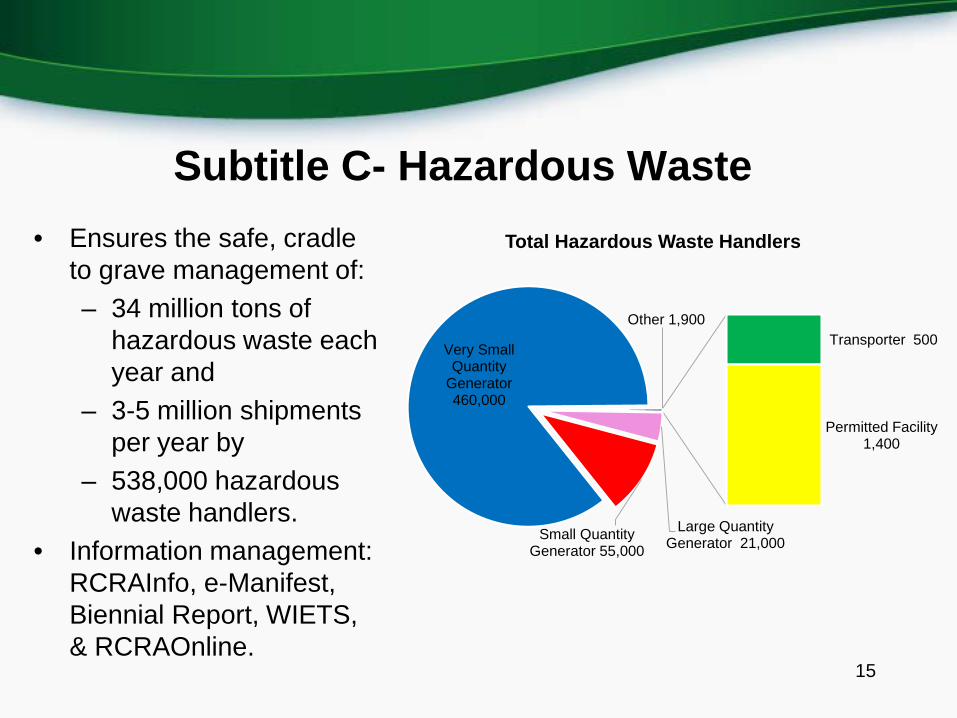
Subtitle C- Hazardous Waste• Ensures the safe, cradle
to grave management of:– 34 million tons of
hazardous waste each year and
– 3-5 million shipments per year by
– 538,000 hazardous waste handlers.
• Information management: RCRAInfo, e-Manifest, Biennial Report, WIETS, & RCRAOnline.
Large Quantity Generator 21,000Small Quantity
Generator 55,000
Very Small Quantity
Generator 460,000
Transporter 500
Permitted Facility1,400
Other 1,900
Total Hazardous Waste Handlers
15
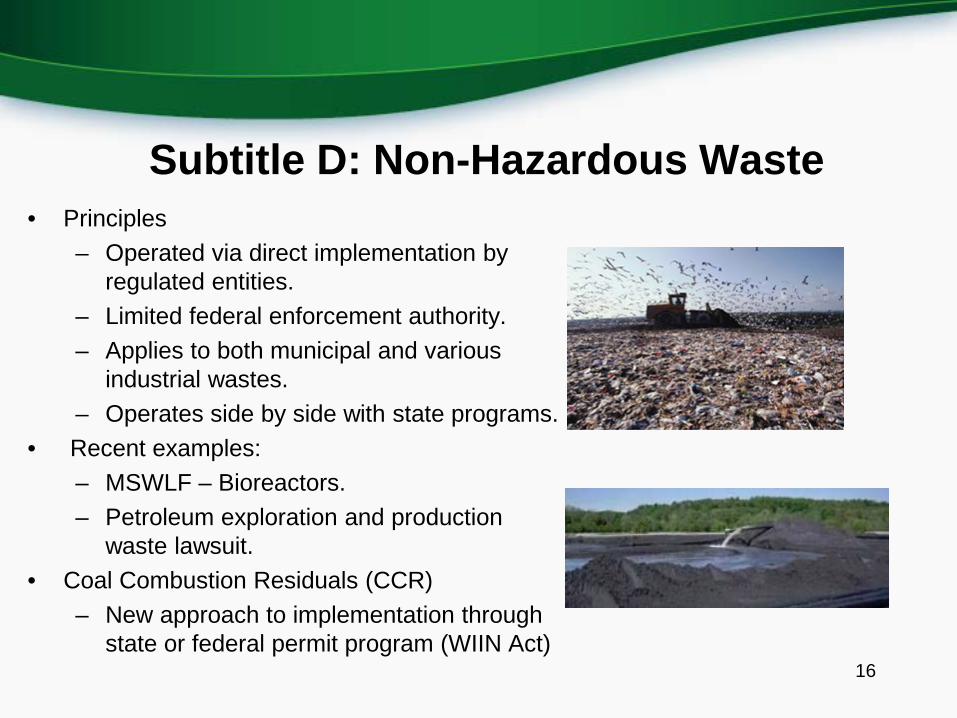
Subtitle D: Non-Hazardous Waste• Principles
– Operated via direct implementation by regulated entities.
– Limited federal enforcement authority.– Applies to both municipal and various
industrial wastes.– Operates side by side with state programs.
• Recent examples:– MSWLF – Bioreactors.– Petroleum exploration and production
waste lawsuit.• Coal Combustion Residuals (CCR)
– New approach to implementation through state or federal permit program (WIIN Act)
16
Critical Issues• 2017 Biennial Reporting• RCRA HW Air Emissions National Enforcement Initiative• CCR: rulemaking, state program approval, etc. • e-Manifest program rollout• Energetics: airbags, lithium batteries• Financial assurance: CERCLA and RCRA• Retail: aerosol cans, pharmaceuticals• State authorization
17
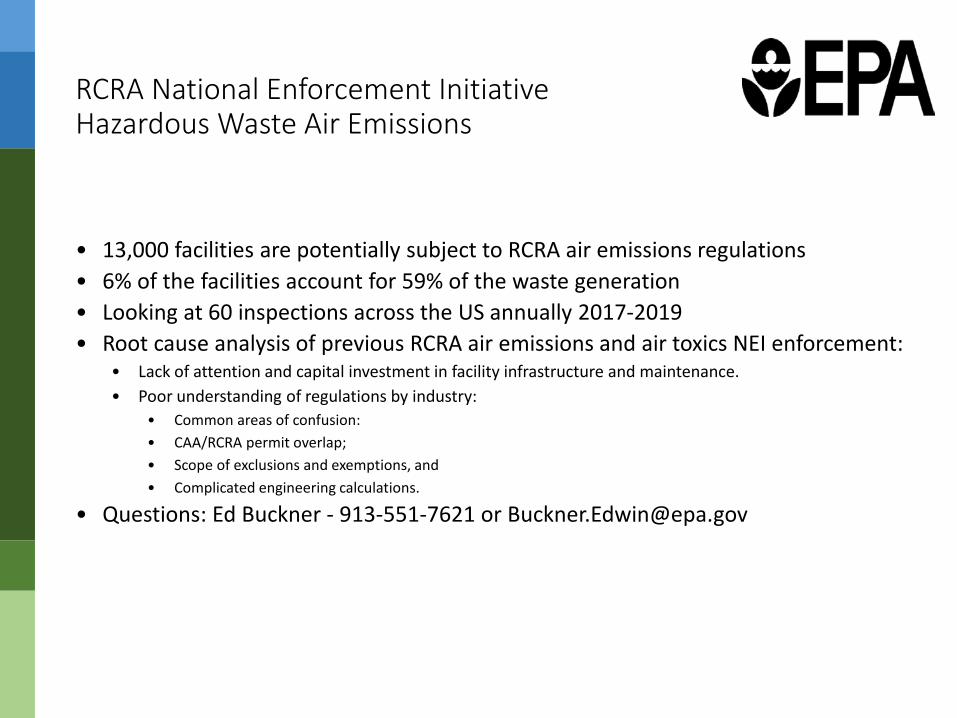
RCRA National Enforcement Initiative Hazardous Waste Air Emissions
• 13,000 facilities are potentially subject to RCRA air emissions regulations• 6% of the facilities account for 59% of the waste generation• Looking at 60 inspections across the US annually 2017-2019• Root cause analysis of previous RCRA air emissions and air toxics NEI enforcement:
• Lack of attention and capital investment in facility infrastructure and maintenance. • Poor understanding of regulations by industry:
• Common areas of confusion:• CAA/RCRA permit overlap; • Scope of exclusions and exemptions, and • Complicated engineering calculations.
• Questions: Ed Buckner - 913-551-7621 or [email protected]

Coal Combustion Residuals Timeline
• By October 17, 2017:• Install groundwater monitoring wells• Determine background levels• Complete sampling for App III constituents• Begin to analyze the samples
• By January 31, 2018:• Post data and, • If triggered, begin Assessment monitoring for all
Appendix III and Appendix IV constituents• By April 17, 2018:
• Completed sampling for all Appendix III and Appendix IV constituents
• By July 2018:• Determine whether there is a statistically significant
increase over the MCL/background• Could also simultaneously use this three month
timeframe to demonstrate that the statistically significant increase was due to another source or sampling and analysis error.
• By January 2019:• Earliest date a leaking SI would have to cease receiving
waste in the unit.

e-Manifest Overview
• The Electronic Hazardous Waste Manifest System (e-Manifest) is a new system with June 2018 implementation that will allow:▫ Industry Hazardous Waste Handlers to submit Uniform Hazardous Waste Manifest
Forms, either electronically or on paper, to EPA▫ States/Regions to retrieve the collected manifest data electronically
• E-Enterprise and e-Manifest▫ Will use other systems under e-Enterprise including: Resource Conservation and
Recovery Act Information System (RCRAInfo),Central Data Exchange (CDX) and electronic signatures
▫ Align with Administrator’s “Cooperative Federalism” Vision for effective partnerships with states and tribes.
▫ Support Agency-wide initiative to reduce reporting burden, and provide the agency, states and the public with easier access to environmental data.
Anticipated ResultEPA estimates the national e-Manifest system will ultimately reduce the burden associated with preparing shipping manifests by 300,000 to 700,000 hours and result in cost savings of more than $90 million per year for states and industry.

SMM
March 2018
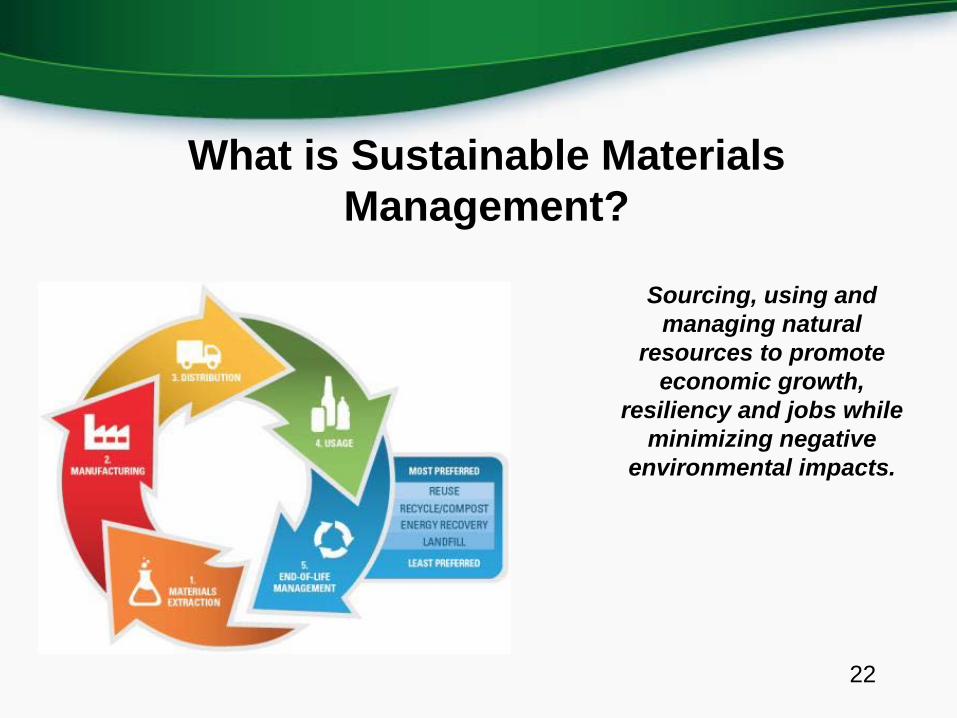
What is Sustainable Materials Management?
22
Sourcing, using and managing natural
resources to promote economic growth,
resiliency and jobs while minimizing negative
environmental impacts.
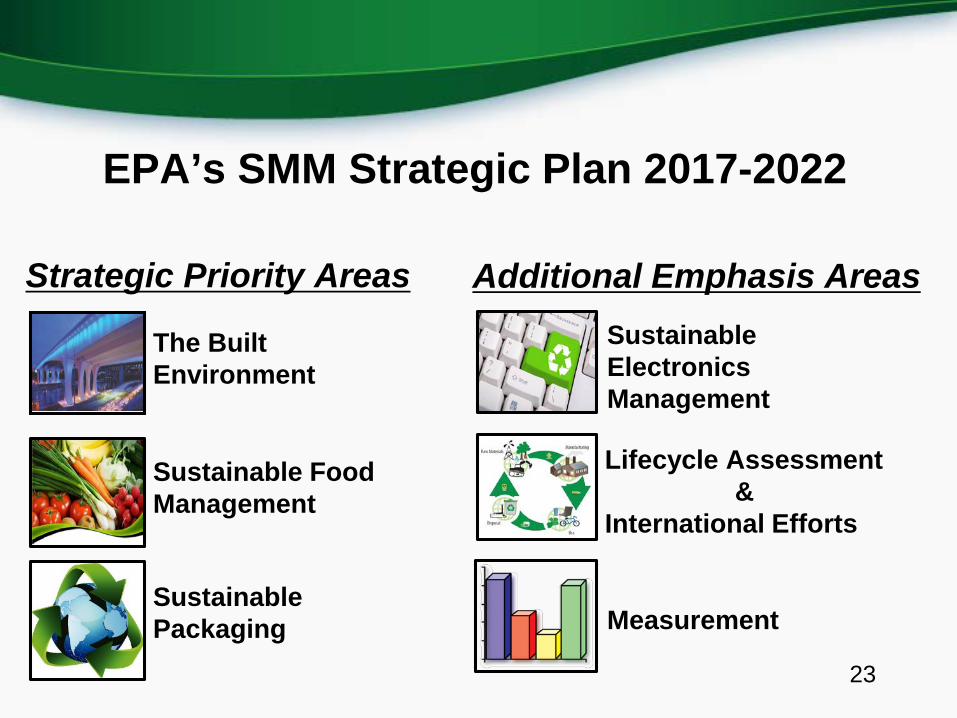
EPA’s SMM Strategic Plan 2017-2022
23
Strategic Priority Areas Additional Emphasis Areas
The Built Environment
Sustainable Food Management
Sustainable Packaging
Sustainable Electronics Management
Lifecycle Assessment&
International Efforts
Measurement
Recent FY18 House Budget Language:
• “…the Committees continue to support the Waste Minimization and Recycling program, and the Agency is encouraged to use funds from within the program to help public entities demonstrate community anaerobic digester applications to municipal solid waste streams and farm needs such as capturing excess phosphorus.”
24
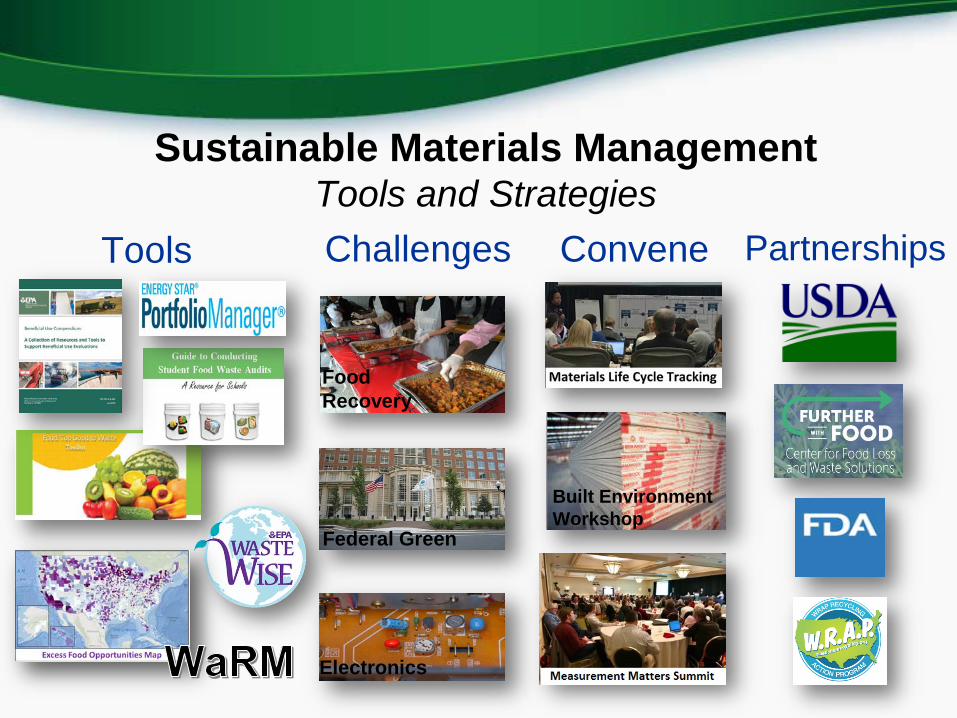
Sustainable Materials ManagementTools and Strategies
Tools PartnershipsChallenges Convene
Built Environment Workshop
Electronics
Federal Green
Food Recovery

26

27
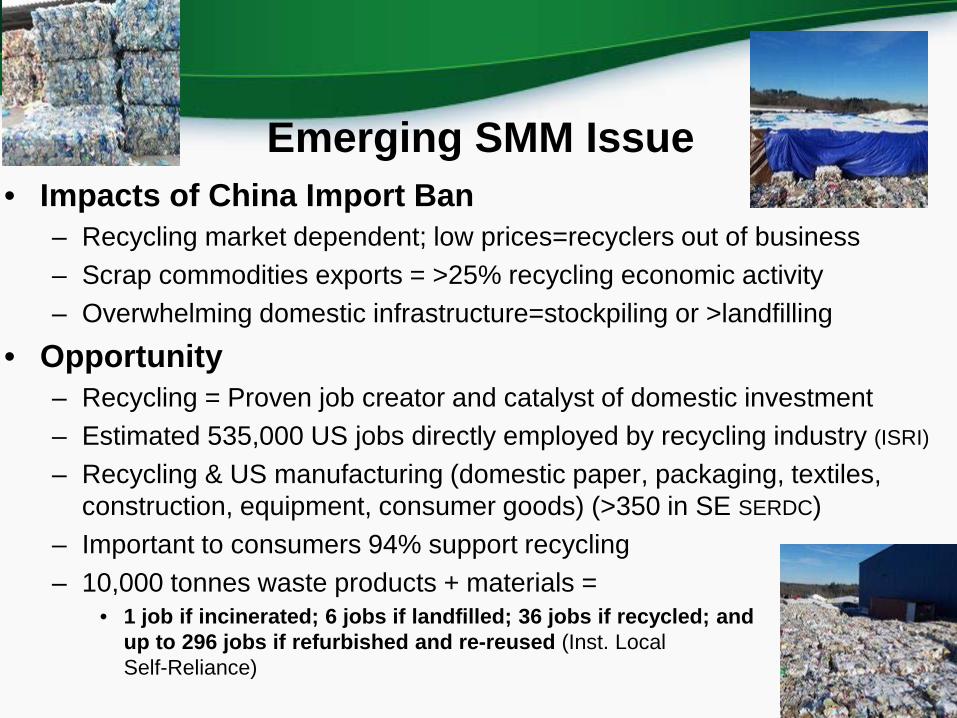
Emerging SMM Issue• Impacts of China Import Ban
– Recycling market dependent; low prices=recyclers out of business– Scrap commodities exports = >25% recycling economic activity– Overwhelming domestic infrastructure=stockpiling or >landfilling
• Opportunity– Recycling = Proven job creator and catalyst of domestic investment– Estimated 535,000 US jobs directly employed by recycling industry (ISRI)
– Recycling & US manufacturing (domestic paper, packaging, textiles, construction, equipment, consumer goods) (>350 in SE SERDC)
– Important to consumers 94% support recycling– 10,000 tonnes waste products + materials =
• 1 job if incinerated; 6 jobs if landfilled; 36 jobs if recycled; and up to 296 jobs if refurbished and re-reused (Inst. Local Self-Reliance) 28

Wrap Up and Questions