EPA s Newest Draft Nonroad Emission Inventory Model (NONROAD · * June 2000: 2007 HD Diesel Highway...
52
EPA’s Newest Draft Nonroad Emission Inventory Model (NONROAD) 12th International Emission Inventory Conference San Diego, California April 28 - May 1, 2003 Craig A. Harvey US Environmental Protection Agency
Transcript of EPA s Newest Draft Nonroad Emission Inventory Model (NONROAD · * June 2000: 2007 HD Diesel Highway...
EPA’s Newest Draft NonroadEmission Inventory Model
(NONROAD)
12th International Emission Inventory Conference
San Diego, California
April 28 - May 1, 2003
Craig A. Harvey
US Environmental Protection Agency
Outline• Introduction / Model Overview
• Model Modifications
– Model Inputs
– Code Modifications
– Geographic Allocations
• Inventory Impacts
• Questions and Answers

NONROAD Team
• Office of Transportation and Air Quality (Assessment and Standards Division)
• Penny Carey
• Craig Harvey
• Greg Janssen
• Jim Warila
• Rich Wilcox
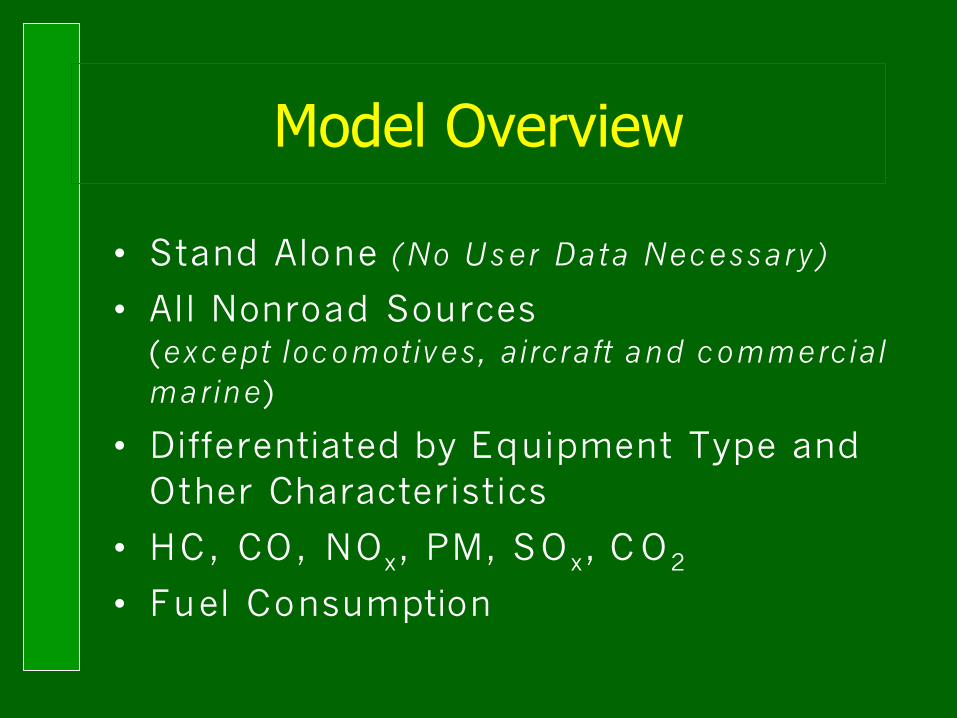
Model Overview
• Stand Alone (No U s er Data Necessary)
• All Nonroad Sources (except locomotives, aircraft and commercial marine)
• Differentiated by Equipment Type and Other Characteristics
• HC, CO, NOx, PM, SO x, C O2
• Fuel Consumption

NONR O A D Model Versions
* June 1998: Original Draft Release
April 1999: highway tier-2/gasoline sulfur rule
* June 2000: 2007 HD Diesel Highway Rule & 1999 NEI/Trends v1.0. 1996 Diesel PM used in NATA.
Nov 2000: final finding & rec vehicle/large SI ANPRM & 2000 NEI & 1999 NTI. 1999 NEI v1.5 & draft v2.
July 2001: rec vehicle & large SI NPRM
May 2002: Draft NONR O A D 2002, NEI 1970-2001 various years (1999 final v2). NTI for 1990, 96, 99. (and basis for RV/LgSI FRM & nonroad diesel NPRM)
* = publicly released model
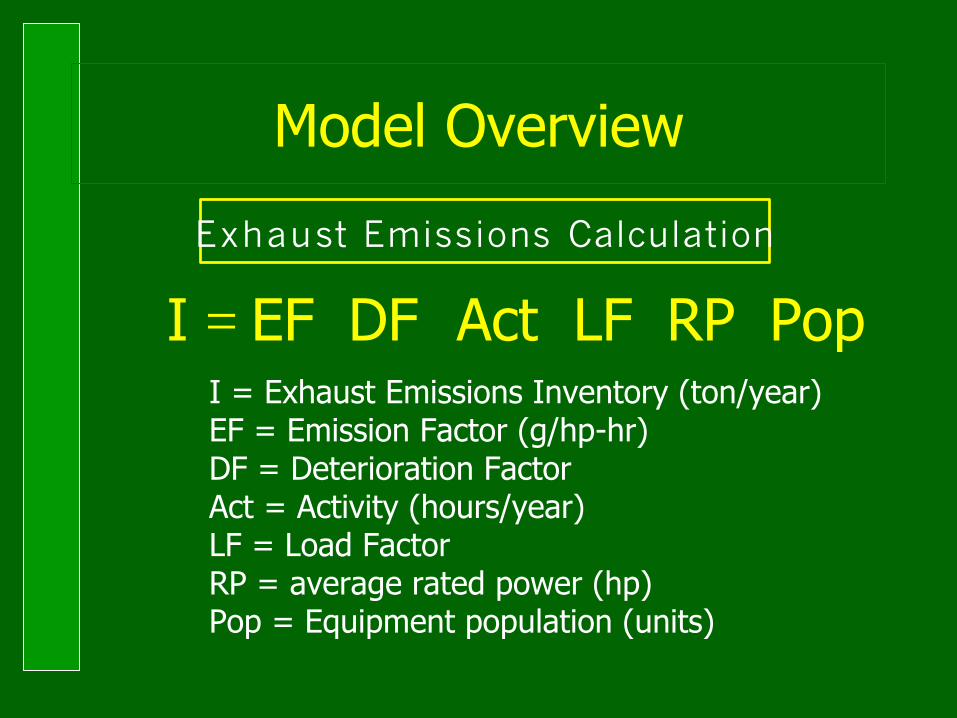
Model Overview
Exhaust Emissions Calculation
PopRPLFActDFEFI ⋅⋅⋅⋅⋅=I = Exhaust Emissions Inventory (ton/year)EF = Emission Factor (g/hp-hr)DF = Deterioration Factor Act = Activity (hours/year)LF = Load FactorRP = average rated power (hp)Pop = Equipment population (units)
Default Inputsfor Diesel Engines
in the NONROAD model

Diesel Engines:Variables modified for N O N R O A D2002
• Load Factors (LF)
• Zero-hour Steady-state Emission Factors (EF)
• Transient Adjustment Factors (TAFs)
• Deterioration Factors (DFs)
• Median Life
• Base-Year Populations
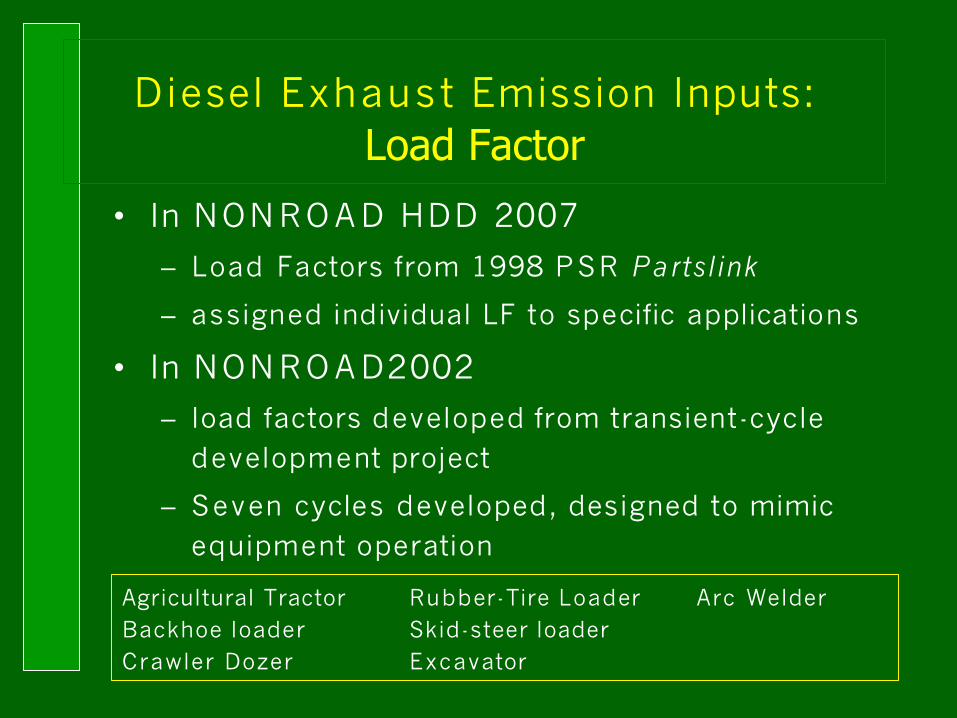
Diesel Exhaust Emission Inputs:Load Factor
• In NONRO A D HDD 2007
– Load Factors from 1998 PSR Partslink
– assigned individual LF to specific applications
• In NONRO A D2002
– load factors developed from transient-cycle development project
– Seven cycles developed, designed to mimic equipment operation
Agricultural Tractor Rubber-Tire Loader Arc WelderBackhoe loader Skid-steer loaderCrawler Dozer Excavator
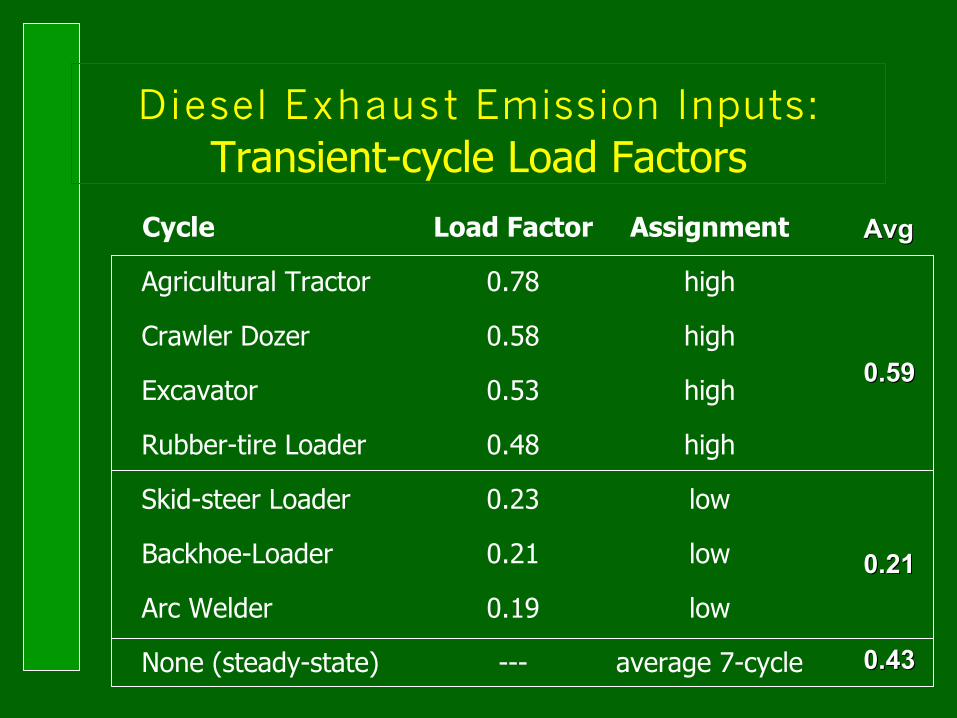
Diesel Exhaust Emission Inputs:Transient-cycle Load Factors
Cycle Load Factor Assignment
Agricultural Tractor 0.78 high
Crawler Dozer 0.58 high
Excavator 0.53 high
Rubber-tire Loader 0.48 high
Skid-steer Loader 0.23 low
Backhoe-Loader 0.21 low
Arc Welder 0.19 low
None (steady-state) --- average 7-cycle
AvgAvg
0.590.59
0.210.21
0.430.43

Diesel Exhaust Emission Inputs: Emission Factors
Three key components:
EF = ZHL x TAF x DF
ZHL = “zero hour” levels -- from new engine test data
TAF = transient adjustment factor -- adjusts the ZHLs that are derived from steady-state lab testing, to account for how engine speed and load variations in the field affect emissions.
DF = deterioration factor -- adjusts for age-related deterioration and malmaintenance
The model also adjusts the PM EF for differences between test fuel sulfur level and in-use sulfur level

Diesel Exhaust Emission Inputs: C o mparison of PM Z H L s
•• No changes to BSF C s
Max HP Tier 1 HD07 T1 ratio:HD07 Tier 2 HD07 T2 ratio:HD07 Tier 3 HD07 T3 ratio:HD07
11 0.4474 0.52 0.9 0.50 0.44 1.1 na na na
16 0.2665 0.52 0.5 0.2665 0.36 0.7 na na na
25 0.2665 0.36 0.7 0.2665 0.36 0.7 na na na
50 0.3389 0.38 0.9 0.3389 0.32 1.1 na na na
100 0.4730 0.37 1.3 0.24 0.24 1.0 0.30 0.24 1.3
175 0.2799 0.22 1.3 0.18 0.18 1.0 0.22 0.18 1.2
300 0.2521 0.19 1.3 0.1316 0.12 1.1 0.15 0.12 1.3
600 0.2008 0.12 1.7 0.1316 0.12 1.1 0.15 0.12 1.3
750 0.2201 0.14 1.6 0.1316 0.12 1.1 0.15 0.12 1.3
>750 0.1934 0.13 1.5 0.1316 0.12 1.1 na na na
PM ZMLs, g/hp-hrTier 1 Tier 2 Tier 3

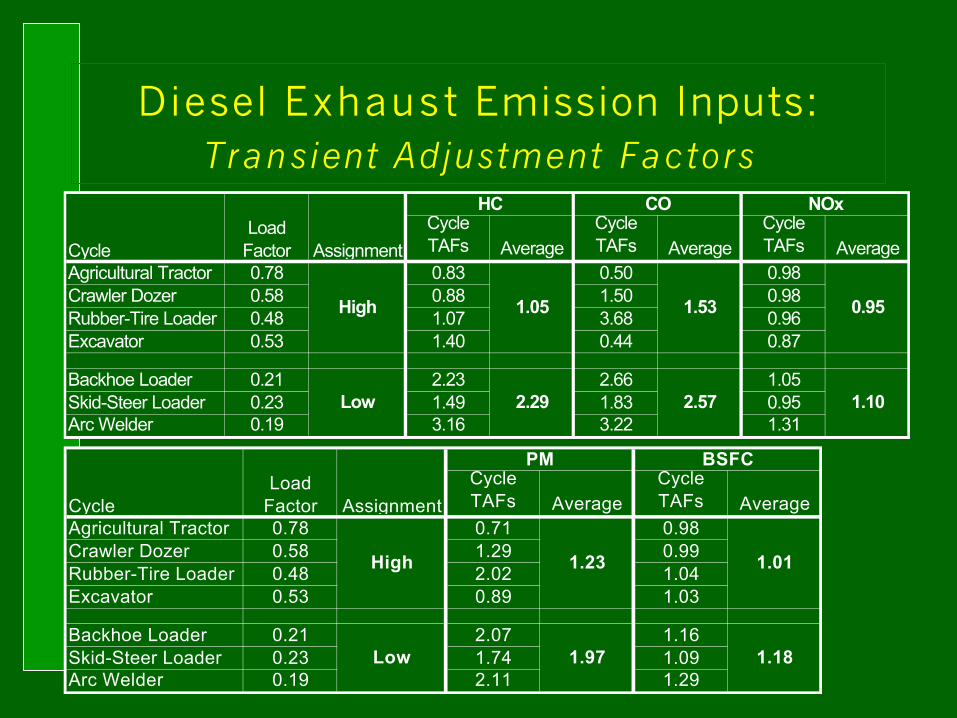
Diesel Exhaust Emission Inputs: Transient Adjustment Factors
• Still based on cycle test data, BUT
– Added data for excavator cycle (7 cycles in all)
– Combined Tier 0 and Tier 1 data (not statistically different based on Student’s t-test)
– Average of ratios used vs ratio of averages
– Binned cycle data by load factor category
• TAF assignments to equipment type no longer vary by tier
Diesel Exhaust Emission Inputs: Transient Adjustment Factors
Cycle TAFs Average
Cycle TAFs Average
Cycle TAFs Average
Agricultural Tractor 0.78 0.83 0.50 0.98Crawler Dozer 0.58 0.88 1.50 0.98Rubber-Tire Loader 0.48 1.07 3.68 0.96Excavator 0.53 1.40 0.44 0.87
Backhoe Loader 0.21 2.23 2.66 1.05Skid-Steer Loader 0.23 1.49 1.83 0.95Arc Welder 0.19 3.16 3.22 1.31
CycleLoad
Factor Assignment
1.05 1.53 0.95
2.29 2.57 1.10
NOx
High
Low
HC CO
Cycle TAFs Average
Cycle TAFs Average
Agricultural Tractor 0.78 0.71 0.98Crawler Dozer 0.58 1.29 0.99Rubber-Tire Loader 0.48 2.02 1.04Excavator 0.53 0.89 1.03
Backhoe Loader 0.21 2.07 1.16Skid-Steer Loader 0.23 1.74 1.09Arc Welder 0.19 2.11 1.29
1.18
CycleLoad
Factor Assignment
Low
1.23 1.01
1.97
PM BSFC
High

Transient Adjustment Factors:K e y Issue for Tier 3 Engines
PM for Tier 3 Engines: TAF increase: 20%
• assume EGR increases transient PM
due to the time lag for clearance of the intake system
NOx for Tier 3 Engines: TAF increase: 10%
• assume EGR increases transient NOxdue to EGR being turned off during transients
Lacking a transient certification test, Tier 3 engine designs with EGR are likely to have higher transient emissions
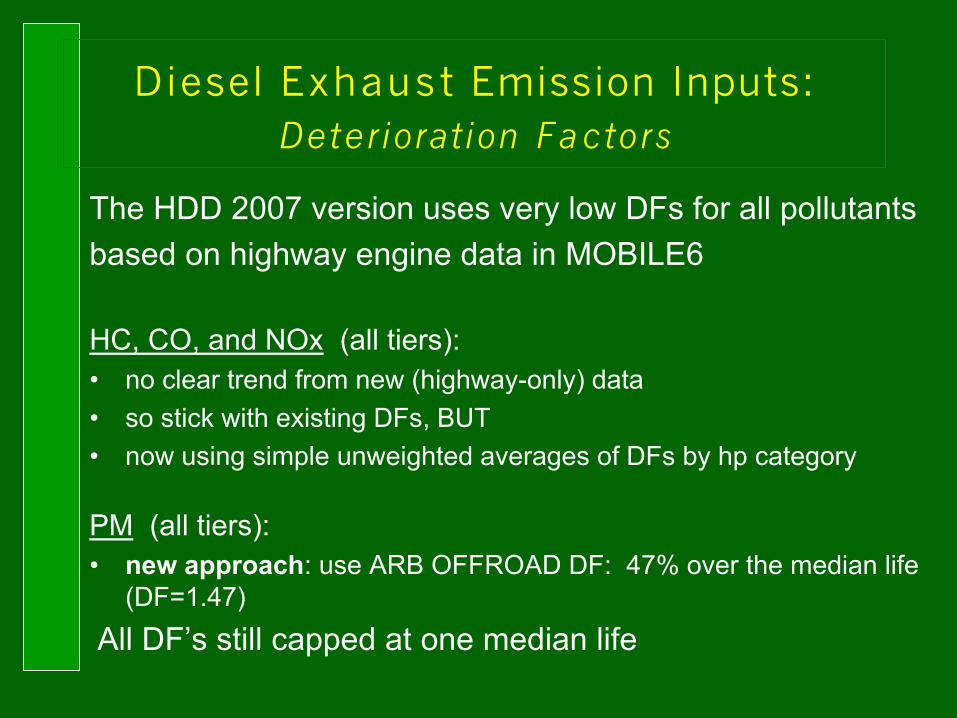
Diesel Exhaust Emission Inputs: Deterioration F a ctors
The HDD 2007 version uses very low DFs for all pollutants
based on highway engine data in MOBILE6
HC, CO, and NOx (all tiers):• no clear trend from new (highway-only) data
• so stick with existing DFs, BUT
• now using simple unweighted averages of DFs by hp category
PM (all tiers):• new approach: use ARB OFFROAD DF: 47% over the median life
(DF=1.47)
All DF’s still capped at one median life
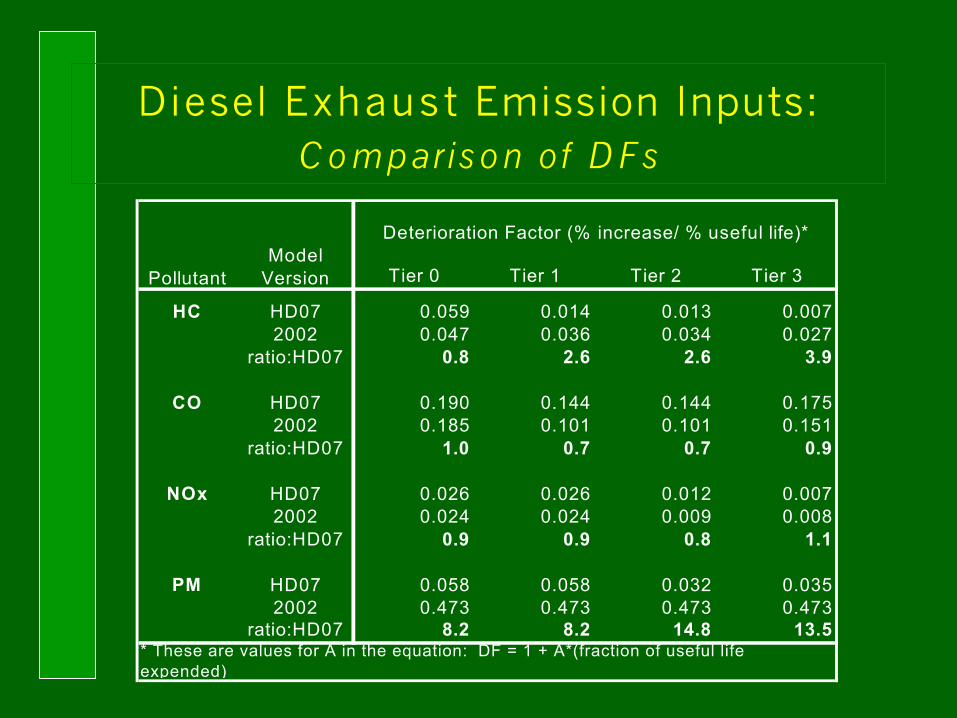
Diesel Exhaust Emission Inputs: C o mparison of D F s
Tier 0 Tier 1 Tier 2 Tier 3
HC HD07 0.059 0.014 0.013 0.0072002 0.047 0.036 0.034 0.027
ratio:HD07 0.8 2.6 2.6 3.9
CO HD07 0.190 0.144 0.144 0.1752002 0.185 0.101 0.101 0.151
ratio:HD07 1.0 0.7 0.7 0.9
NOx HD07 0.026 0.026 0.012 0.0072002 0.024 0.024 0.009 0.008
ratio:HD07 0.9 0.9 0.8 1.1
PM HD07 0.058 0.058 0.032 0.0352002 0.473 0.473 0.473 0.473
ratio:HD07 8.2 8.2 14.8 13.5
Deterioration Factor (% increase/ % useful life)*
PollutantModel
Version
* These are values for A in the equation: DF = 1 + A*(fraction of useful life expended)

Power Category Source: PSR Source: EEA Modified EEA
<16 hp 13,000 hrs 1,250 hrs 2,500 hrs
16-50 hp 10,000 hrs 2,500 hrs 2,500 hrs
50-300 hp 11,500 hrs 4,000 hrs 4,667 hrs
300-1000 hp 9,000 hrs 6,000 hrs 7,000 hrs
>1000 hp 7,500 hrs 6,000 hrs 7,000 hrs
We removed EEA’s “rugged life” adjustment:EEA shortened the highway-derived median lives by 15% to account for the more severe operating conditions of nonroad engines. However, nonroad engine designs typically already account for this (mainly by use of de-rated bigger engines); so we removed the 15% adjustment.
We adjusted the median life for <16 hp engines to match that for 16-50 hp engines, to avoid median lives shorter than the regulatory useful lives; 2500 hrs at full load equates to 5000 hrs at a 50% typical average load factor (the regulatory useful life for these engines is 3000 hr).
Diesel Engine Scrappage:Median Life
Inputs: Equipment Population
• Population = f(sales, activity, load factor, median life)
• For diesel equipment, we now use PSR sales data to calculate populations, rather than using PSR populations directly. – Allows consistent median life and LFs
– Decreased diesel Pops by ~25%
Default Inputsin the NONROAD model:
Recreational Equipment andLarge Spark-Ignition Engines
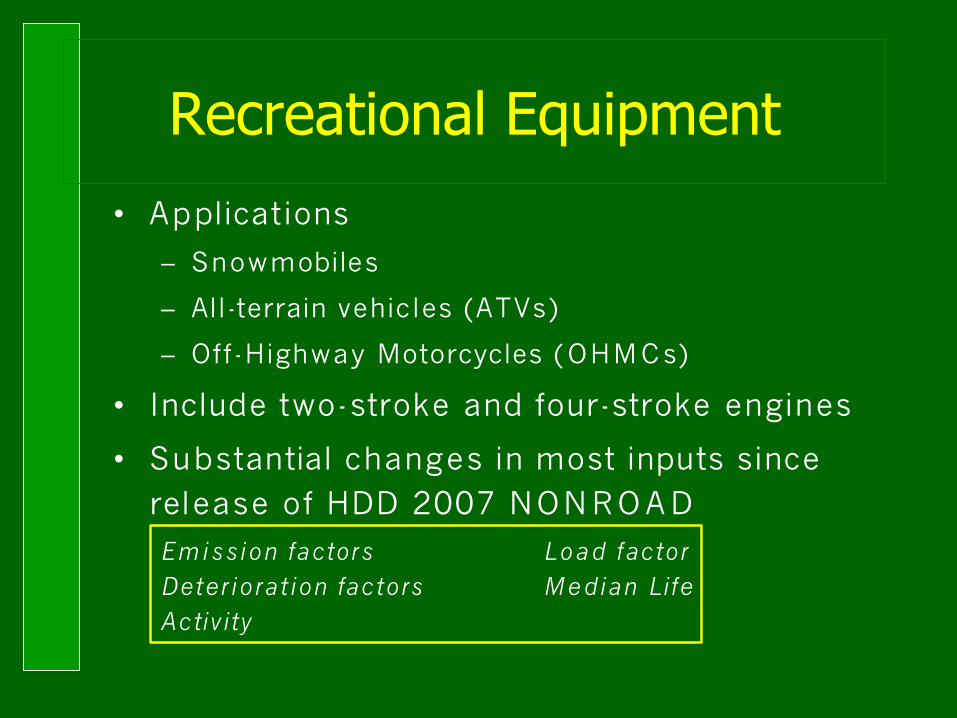
Recreational Equipment
• Applications
– Snowmobiles
– All-terrain vehicles (ATVs)
– Off-Highway Motorcycles (OHMCs)
• Include two-stroke and four-stroke engines
• Substantial changes in most inputs since release of HDD 2007 NONRO A DEmission factors Load factorDeterioration factors M e dian LifeActivity

Large Spark-Ignition Equipment(SI Engines Rated @ 19 kW)
• Commercial/Industrial– Forklifts
– Generators
– Commercial Turf
– Aerial Lifts
– Pumps
• Marine Engines– Stern drive
– Inboard
• Include 2-stroke and 4-stroke engines
• Multiple fuels
– Gasoline
– LPG
– C N G
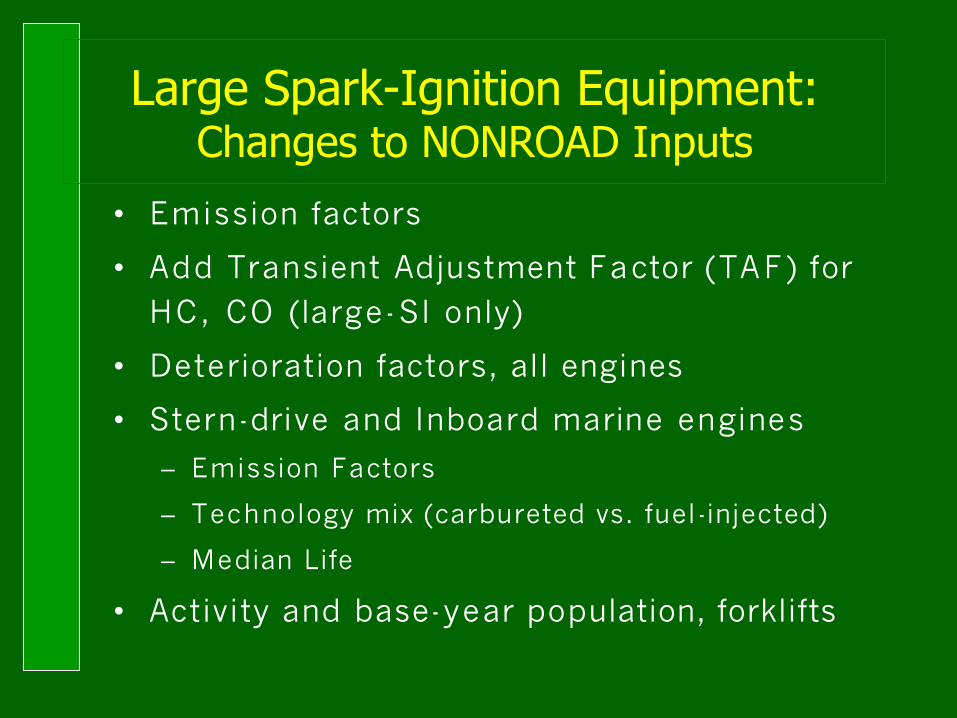
Large Spark-Ignition Equipment:Changes to NONROAD Inputs
• Emission factors
• Add Transient Adjustment Factor (TAF) for HC, CO (large-SI only)
• Deterioration factors, all engines
• Stern-drive and Inboard marine engines
– Emission Factors
– Technology mix (carbureted vs. fuel-injected)
– Median Life
• Activity and base-year population, forklifts
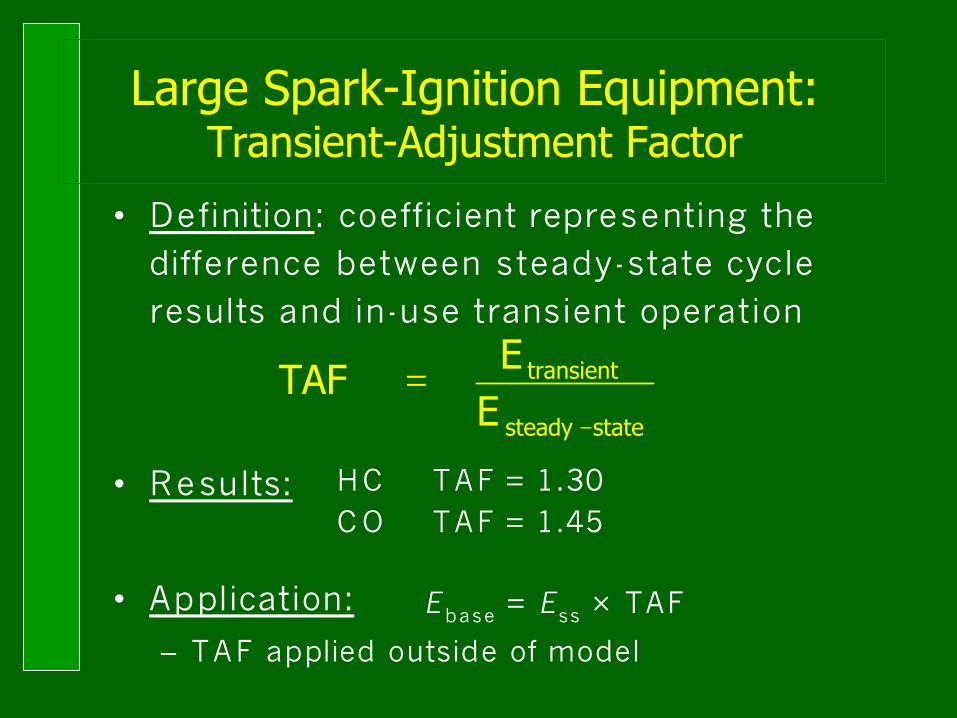
Large Spark-Ignition Equipment:Transient-Adjustment Factor
• Definition: coefficient representing the difference between steady-state cycle results and in-use transient operation
• Results:
• Application:
– TAF applied outside of model
statesteady
transient
EE
TAF−
=
HC TAF = 1.30C O TAF = 1.45
E base = Ess × TAF
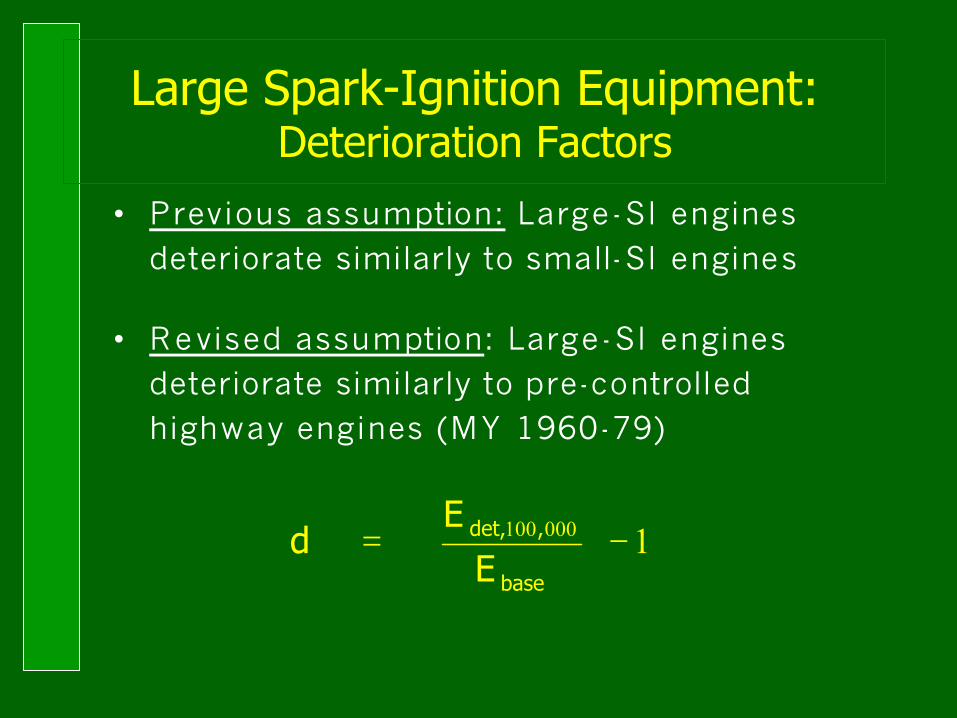
Large Spark-Ignition Equipment:Deterioration Factors
• Previous assumption: Large-SI engines deteriorate similarly to small-SI engines
• Revised assumption: Large-SI engines deteriorate similarly to pre-controlled highway engines (MY 1960-79)
1000100 −
=
base
,det,
E
Ed
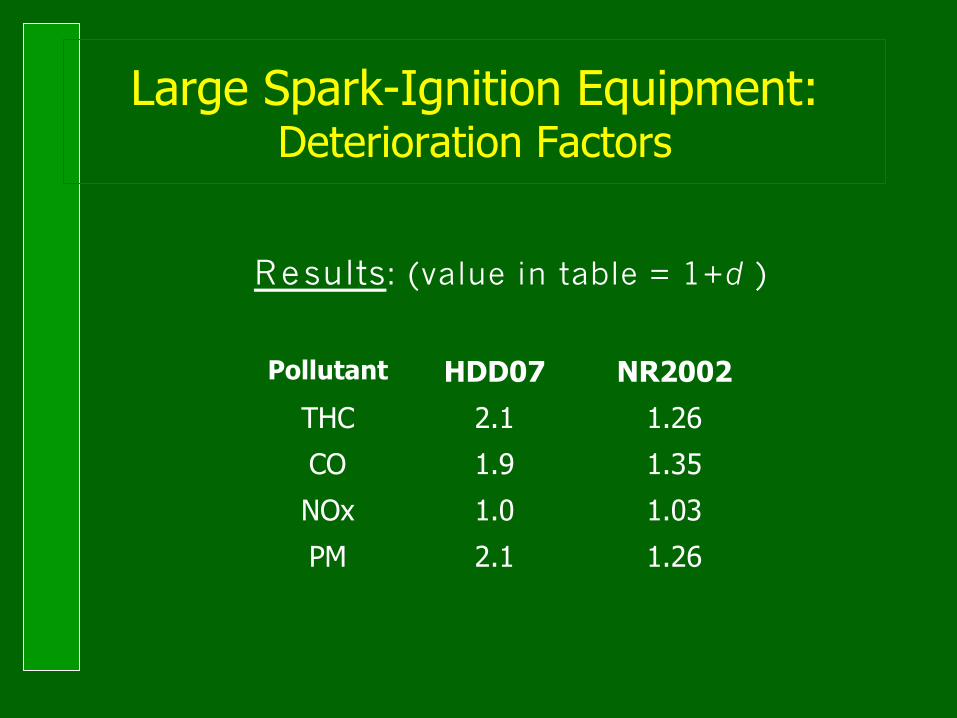
Large Spark-Ignition Equipment:Deterioration Factors
Results: (value in table = 1+d )
Pollutant HDD07 NR2002
THC 2.1 1.26
CO 1.9 1.35
NOx 1.0 1.03
PM 2.1 1.26
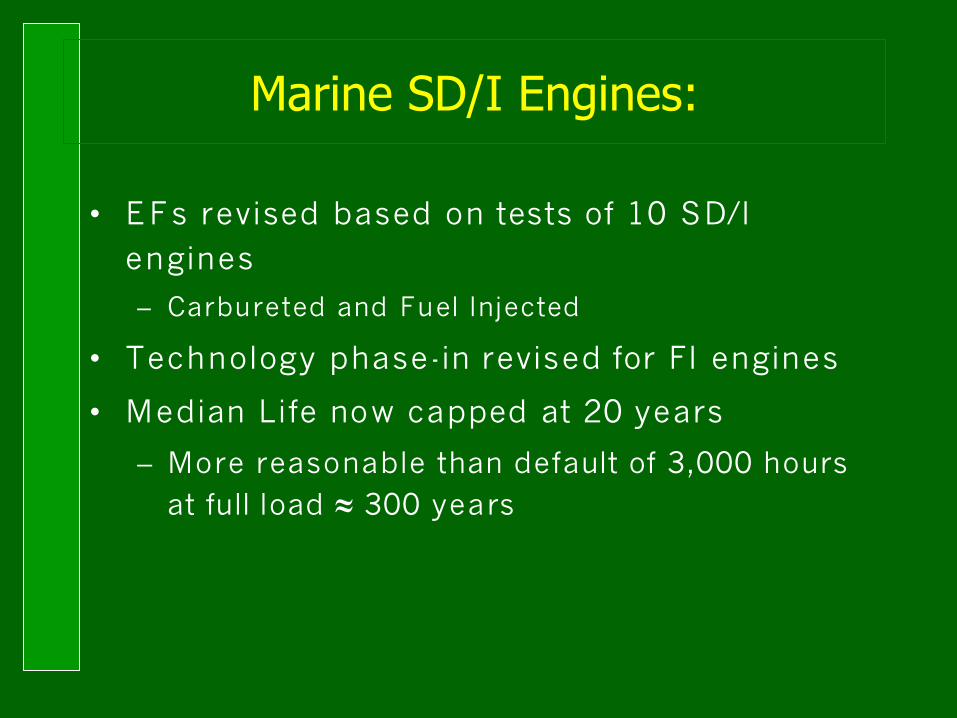
Marine SD/I Engines:
• EFs revised based on tests of 10 SD/I engines
– Carbureted and Fuel Injected
• Technology phase-in revised for FI engines
• Median Life now capped at 20 years
– More reasonable than default of 3,000 hours at full load ¡ 300 years

Technical Developments in the NONROAD Model:
Code Modifications

Code Modifications/CorrectionsP M C alculation E q u ation
( )[ ]fuelS−××××−= 0033.001.0157.06.453BSFCPMPM base
( )[ ]fuelSLP −××××××−= 33.001.0157.06.453BSFCPMPM base
The equation was:
Now corrected to:
Add rated powerand load facto r
Cor rect basefuel s u l f u r (3300 ppm)
g/lb
F ract ion of fuel s u l f u r converted to P M fo rengines w i thou t t rap s
g/hr
Conver t s S percent toweight f ract ion
In-u s e S level (%)
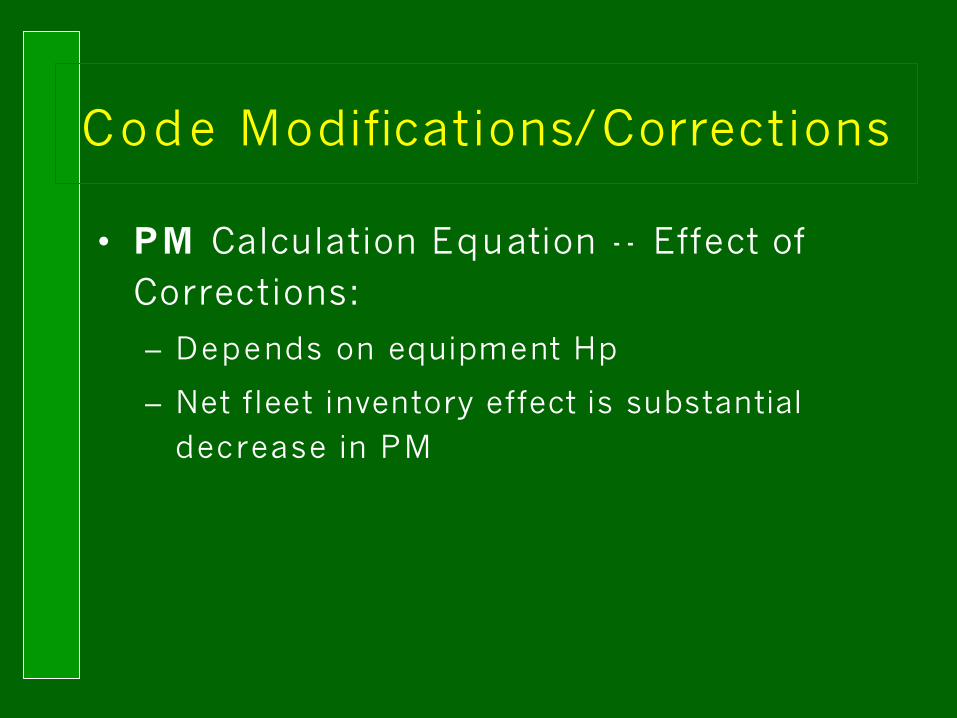
Code Modifications/Corrections
• PM Calculation Equation -- Effect of Corrections:
– Depends on equipment Hp
– Net fleet inventory effect is substantial decrease in PM

Code Modifications/Corrections
• S O2 Calculation Equation
– Was missing Load Factor
– Net effect of correction is to decrease SO2
by roughly 40%
Code Modifications/Corrections
• Scrappage & Age Distribution
– New simplified method:
1. Use growth to determine target calendar year population
2. Apply default age distribution based on scrappage curve shape and no growth
3. Adjust for assumed growth rate

Scrappage / Age Distribution
Year 2000 NONROAD Popula tion by Age
Ag Tractors 50-100 hp
0 5 10 15 20 25 30
Age (Years)
Pop
ula
tion
June 2000
Version
Modified Age
Distribution

Geographic Allocation in Draft NONROAD2002
Geographic Allocation: Overview
• Geographic allocation of engine populations accounts for how many and what types of equipment are being used in a certain location
– Default data allocates to the county level
• National populations allocated outside NONR O AD to county level using county-specific surrogate indicators
• County populations are then aggregated to produce default state population input files
Geographic Allocation: Overview
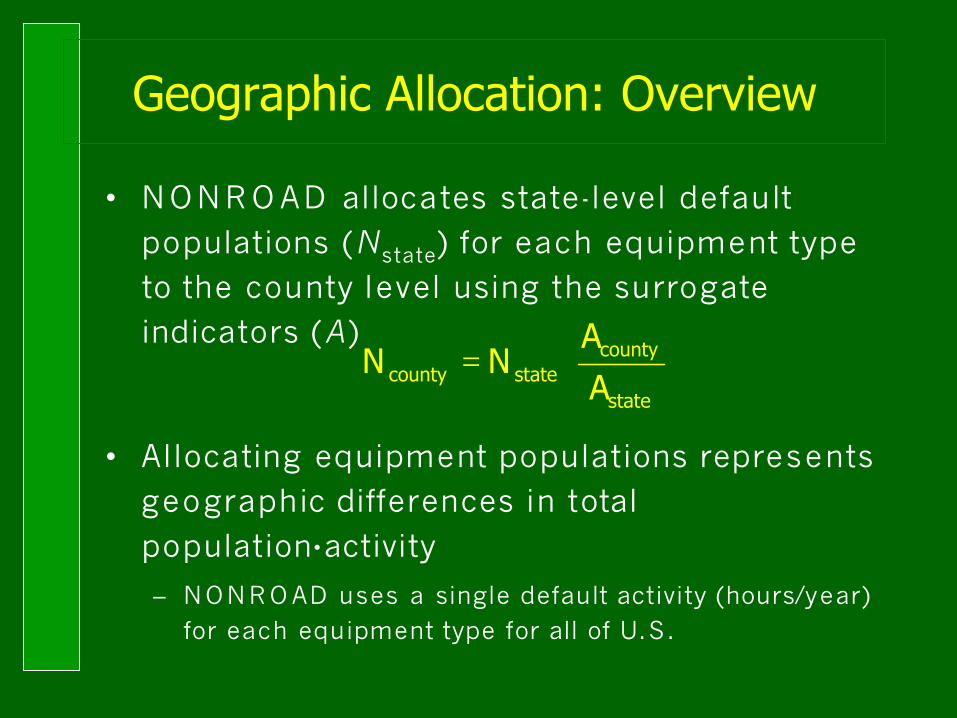
• NONR O AD allocates state-level default populations (Nstate) for each equipment type to the county level using the surrogate indicators (A)
• Allocating equipment populations represents geographic differences in total population$activity
– NONR O AD uses a single default activity (hours/year) for each equipment type for all of U.S.
=
state
countystatecounty A
ANN

Geographic Allocation: Overview
• Users may specify local state/county surrogates or substitute local population data– For broad equipment categories or for individual
equipment types
– Local activity data needs to be used with local population data in order to avoid strange results
• Allocation surrogates based on publicly available data as much as possible– U.S. Census population/housing, business, and
geographic data.
– Exception for construction which was based on proprietary data from F.W. Dodge, Inc.
Geographic Allocation:Construction Equipment
• Allocated on basis of weighted-average dollar value of different types of construction activity– Road and infrastructure construction account for
much larger share of actual equipment activity per dollar valuation than residential and commercial construction
– Based on 1998 survey of construction in Houston (for purposes of SIP)
– Compares well to 1993 study of construction• Equipment activity based on fuel cost per project
• Dollar valuation derived from 1987 Census data
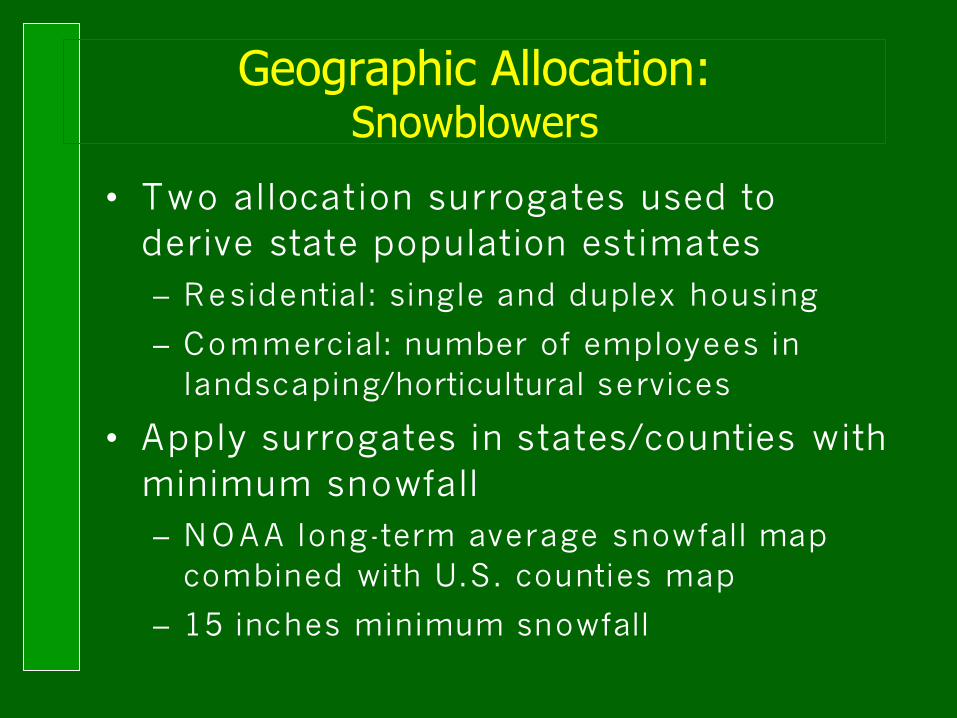
Geographic Allocation:Snowblowers
• Two allocation surrogates used to derive state population estimates – Residential: single and duplex housing
– Commercial: number of employees in landscaping/horticultural services
• Apply surrogates in states/counties with minimum snowfall– NOAA long-term average snowfall map
combined with U.S. counties map
– 15 inches minimum snowfall
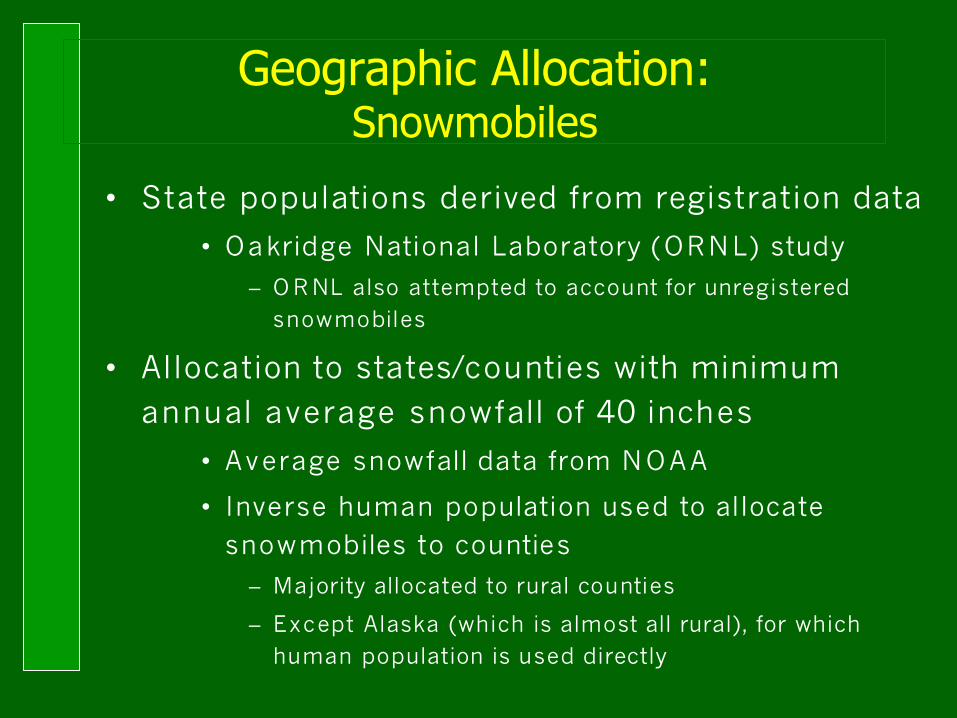
Geographic Allocation: Snowmobiles
• State populations derived from registration data
• Oakridge National Laboratory (ORNL) study – O R NL also attempted to account for unregistered
snowmobiles
• Allocation to states/counties with minimum annual average snowfall of 40 inches
• Average snowfall data from NOAA
• Inverse human population used to allocate snowmobiles to counties
– Majority allocated to rural counties
– Except Alaska (which is almost all rural), for which human population is used directly
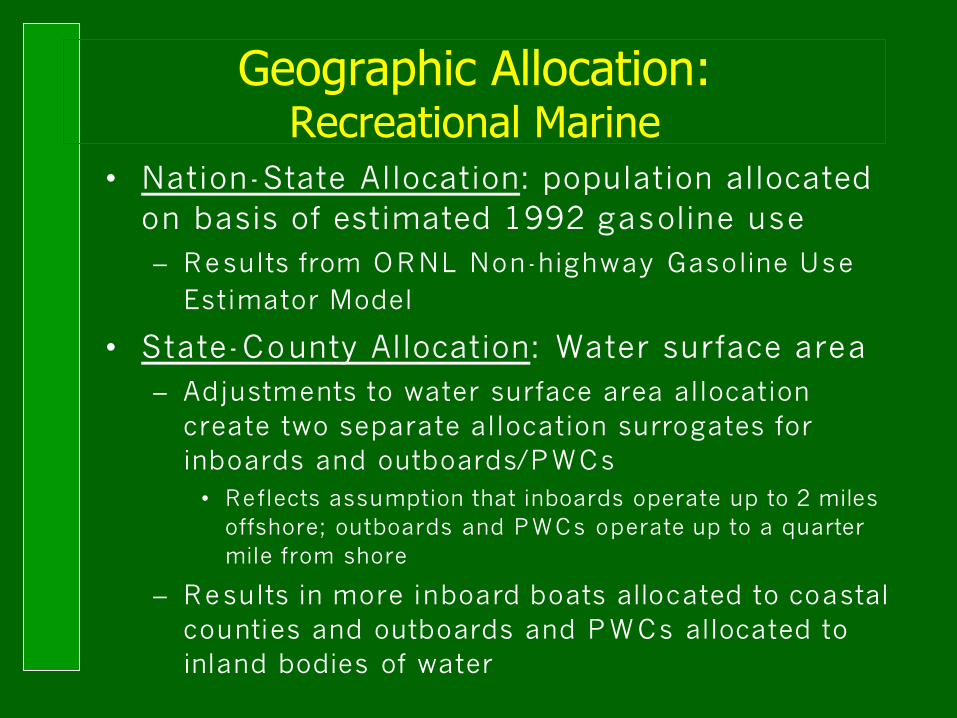
Geographic Allocation: Recreational Marine
• Nation-State Allocation: population allocated on basis of estimated 1992 gasoline use– Results from ORNL Non-highway Gasoline Use
Estimator Model
• State-County Allocation: Water surface area– Adjustments to water surface area allocation
create two separate allocation surrogates for inboards and outboards/PWCs
• Reflects assumption that inboards operate up to 2 miles offshore; outboards and PWCs operate up to a quarter mile from shore
– Results in more inboard boats allocated to coastal counties and outboards and P W Cs allocated to inland bodies of water

Basis for Comparison
• Time Period: Calendar Year 1999
• HDD 2007: national estimates using June-2000 version with national defaults– current publicly available version
• NR 2002: national estimates from 1999 NEI, final version 2– sums of county inventories
– recently released to states
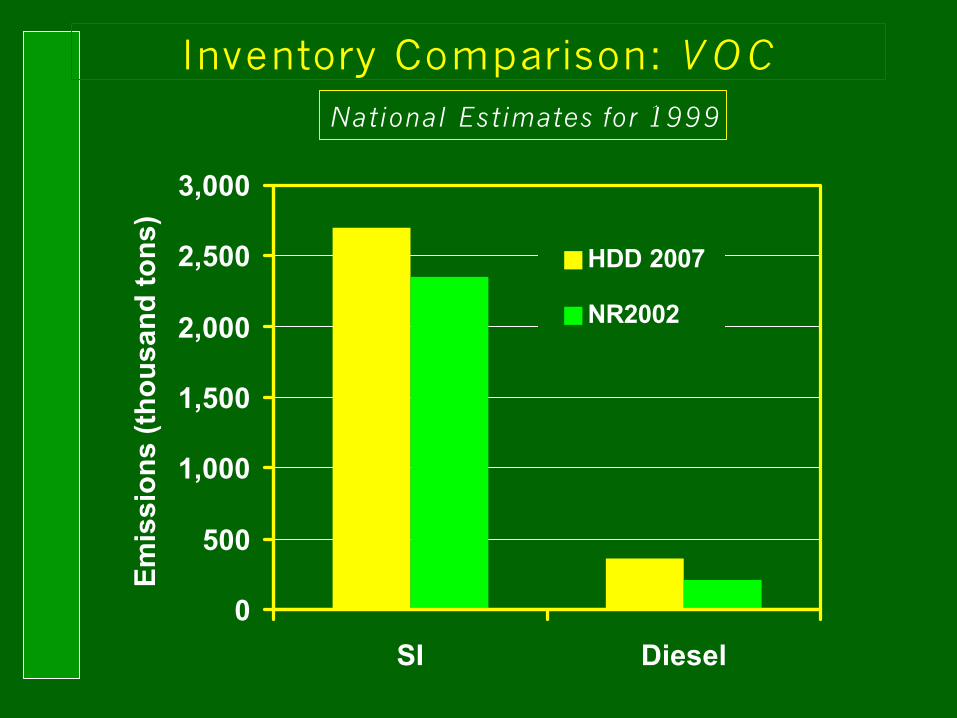
Inventory Comparison: V O CNational Estimates for 1999
0
500
1,000
1,500
2,000
2,500
3,000
SI Diesel
Em
issi
on
s (t
ho
usa
nd
to
ns)
HDD 2007
NR2002
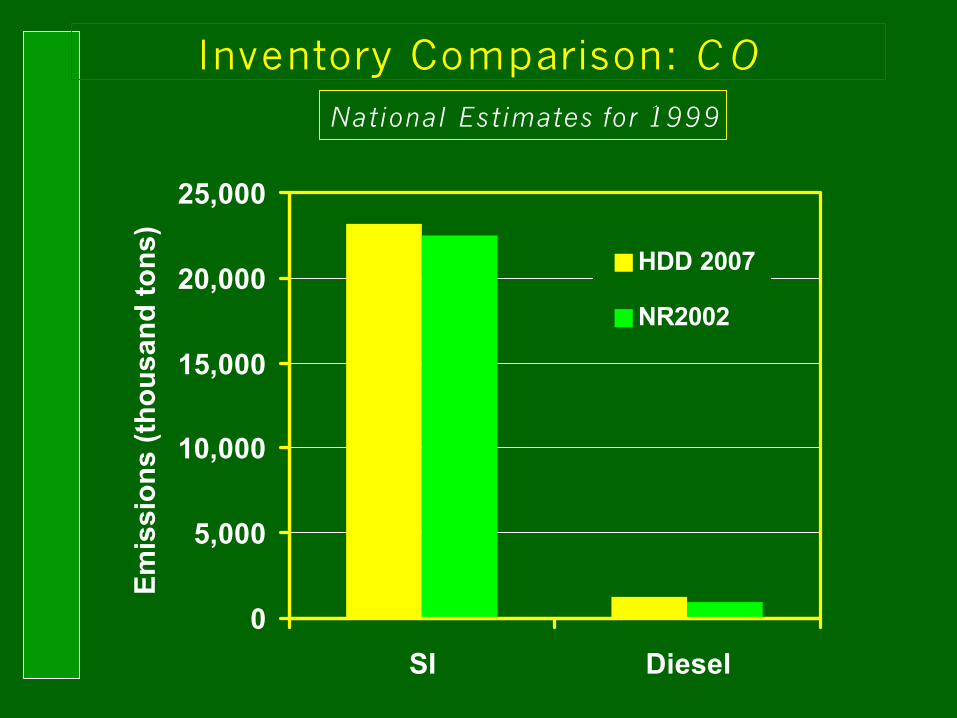
Inventory Comparison: C ONational Estimates for 1999
0
5,000
10,000
15,000
20,000
25,000
SI Diesel
Em
issi
on
s (t
ho
usa
nd
to
ns)
HDD 2007
NR2002
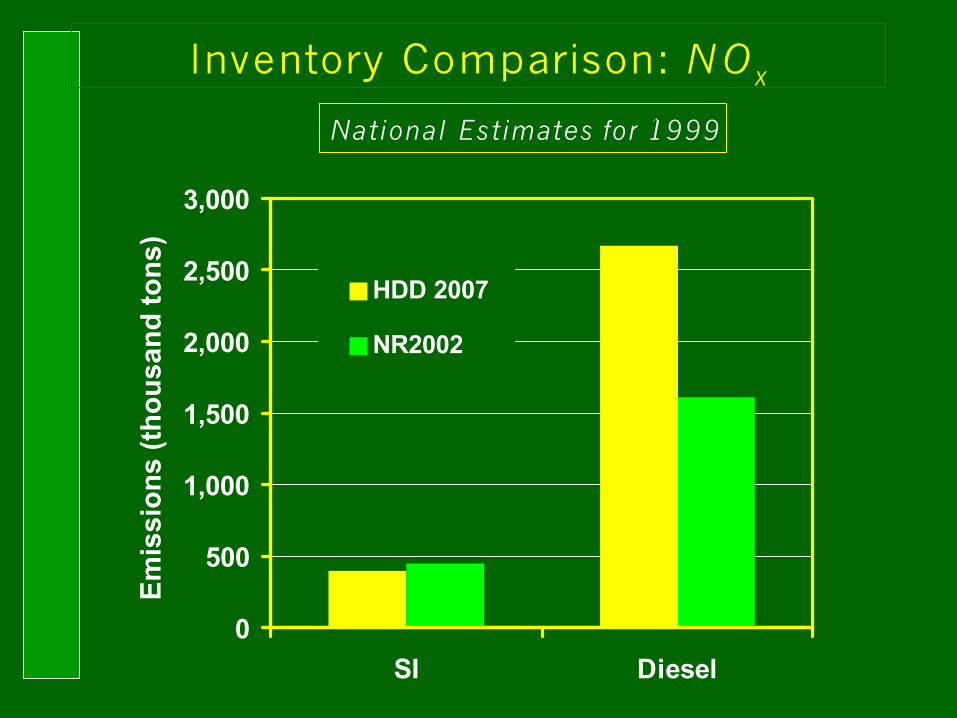
Inventory Comparison: N O x
National Estimates for 1999
0
500
1,000
1,500
2,000
2,500
3,000
SI Diesel
Em
issi
on
s (t
ho
usa
nd
to
ns)
HDD 2007
NR2002
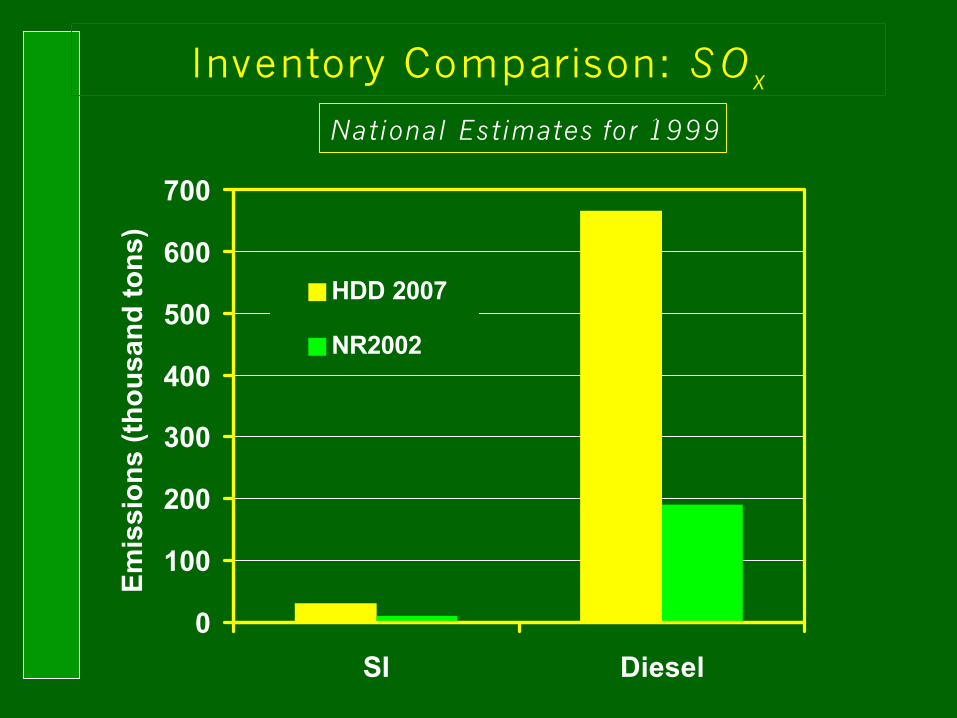
Inventory Comparison: S O x
National Estimates for 1999
0
100
200
300
400
500
600
700
SI Diesel
Em
issi
on
s (t
ho
usa
nd
to
ns)
HDD 2007
NR2002
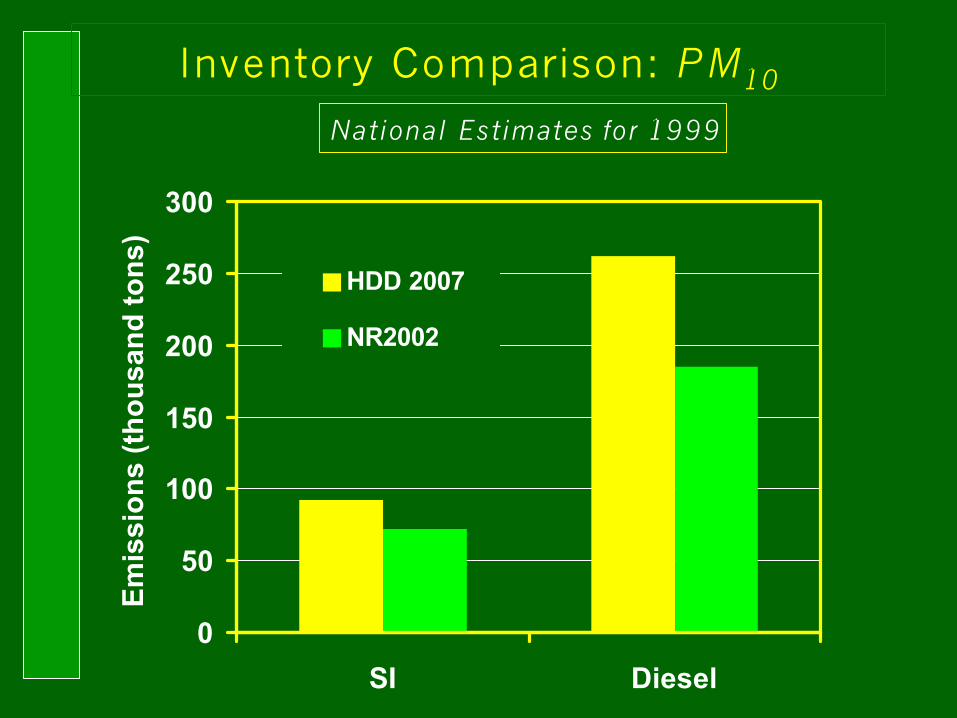
Inventory Comparison: PM10
National Estimates for 1999
0
50
100
150
200
250
300
SI Diesel
Em
issi
on
s (t
ho
usa
nd
to
ns)
HDD 2007
NR2002
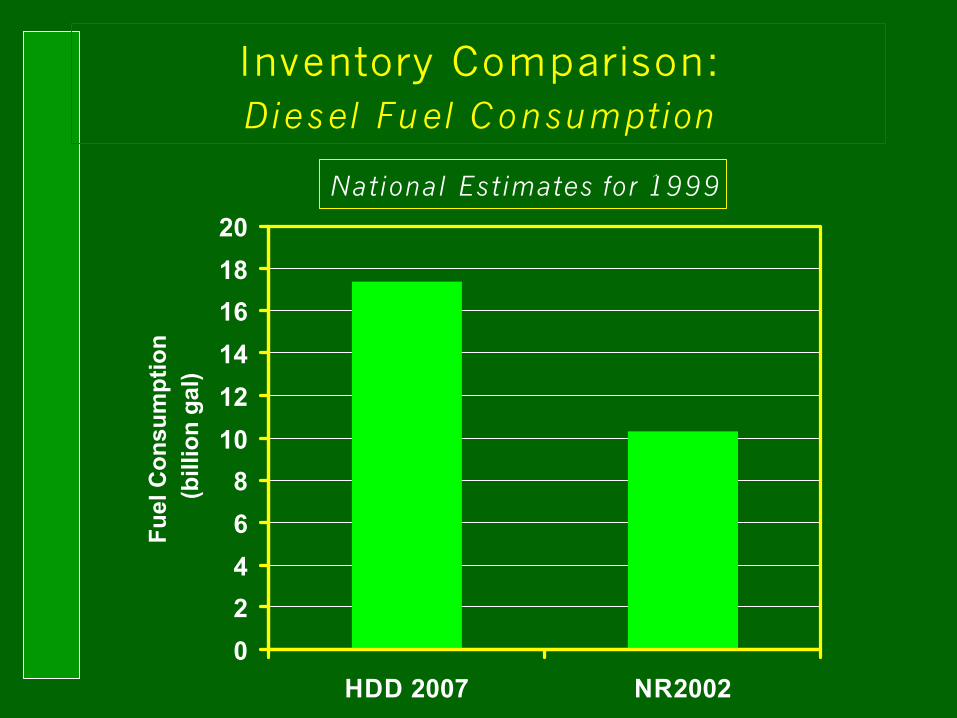
Inventory Comparison:Diesel Fuel Consumption
0
2
4
6
8
10
12
14
16
18
20
HDD 2007 NR2002
Fu
el C
on
sum
pti
on
(b
illio
n g
al)
National Estimates for 1999

Inventory Comparison: SI + Diesel
National Estimates for 1999
0
5,000
10,000
15,000
20,000
25,000
30,000
VOC CO NOx
Em
issi
on
s (t
ho
usa
nd
to
ns)
HDD 2007
NR2002
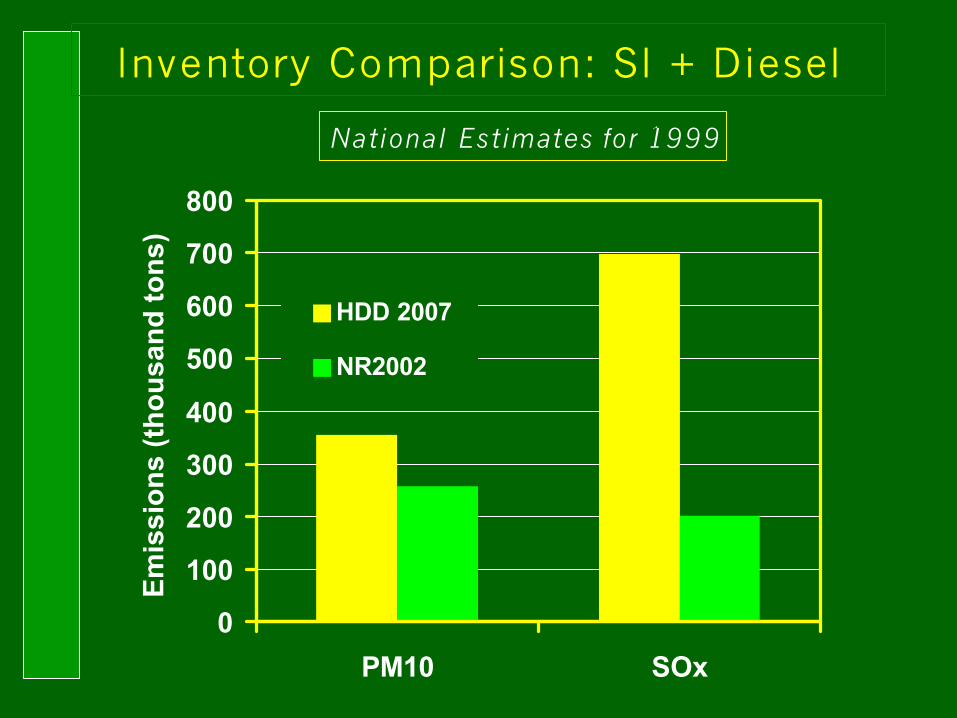
Inventory Comparison: SI + Diesel
National Estimates for 1999
0
100
200
300
400
500
600
700
800
PM10 SOx
Em
issi
on
s (t
ho
usa
nd
to
ns)
HDD 2007
NR2002
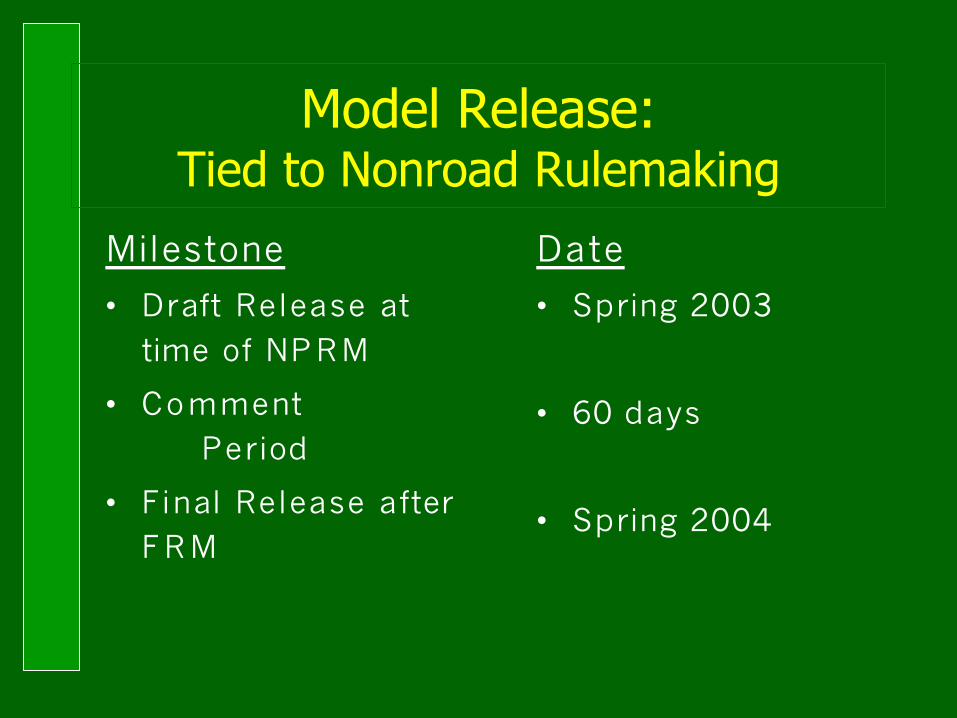
Model Release:Tied to Nonroad Rulemaking
Milestone
• Draft Release at time of NPRM
• Comment Period
• Final Release after FRM
Date
• Spring 2003
• 60 days
• Spring 2004

Guidance:NONROAD in SIPs
• Draft NONR O A D is currently the best tool available for estimating regional nonroad inventories.
• With the release of the Nonroad NPRM, Draft NONR O AD2002 is now publicly available.
• Draft NONR O A D can be used in official SIP submissions to EPA.
• States need to be aware that Draft NONR O AD is likely to undergo further revisions before it is finalized next year.