
ISBN 978-952-15-0279-7 (printed) ISBN 978-952-15-4216-9 (PDF)
Upload
joshua-priceCategory
view
218download
1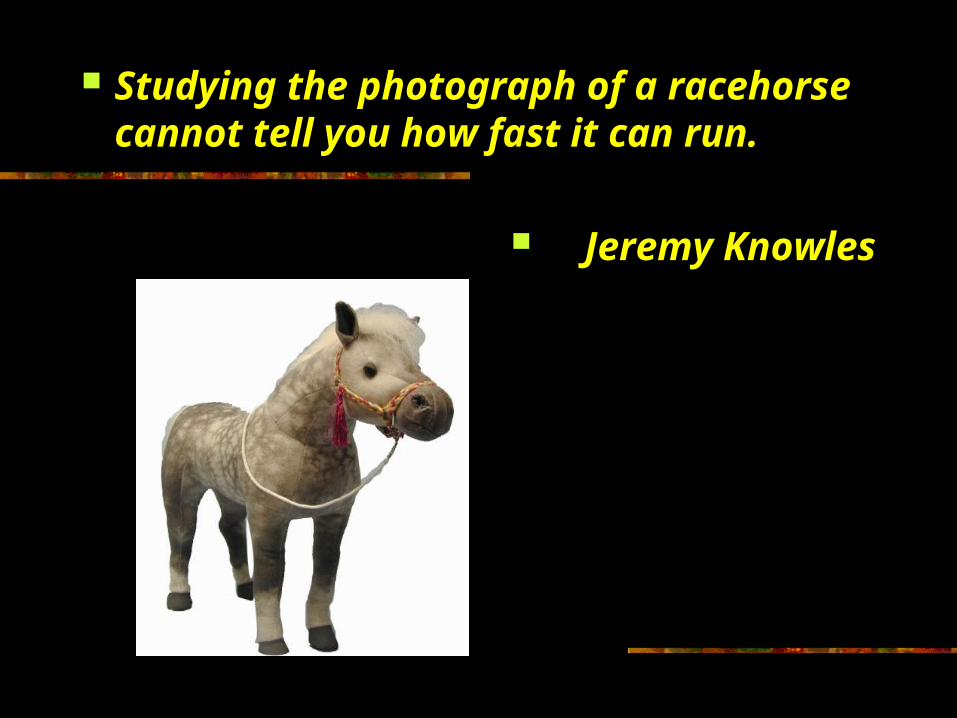
Studying the photograph of a racehorse cannot tell you how fast it can run.
Jeremy Knowles
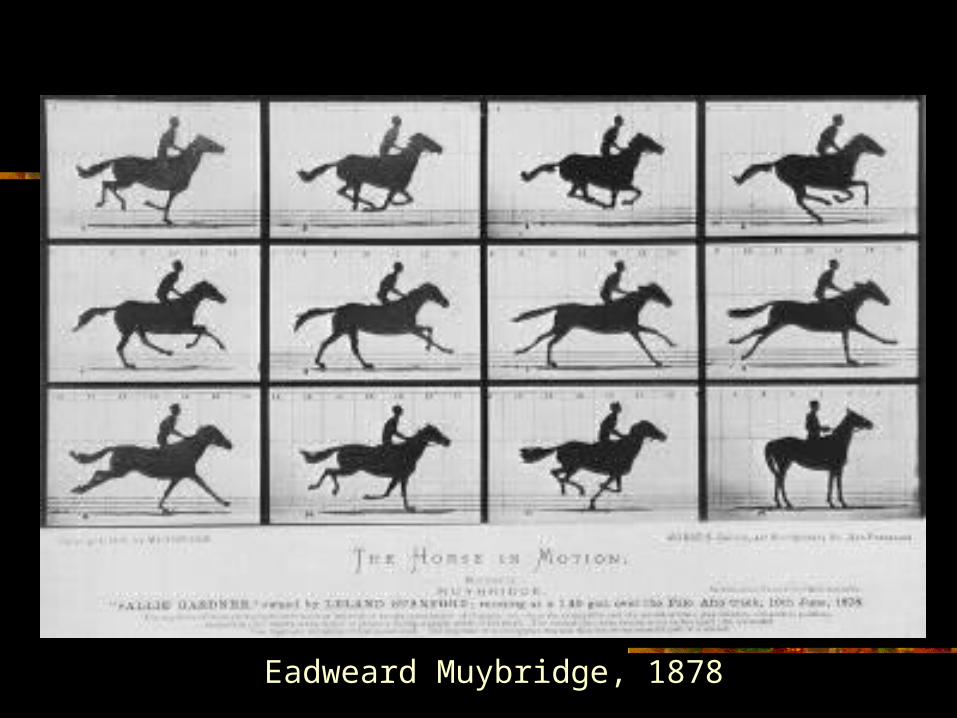
Eadweard Muybridge, 1878
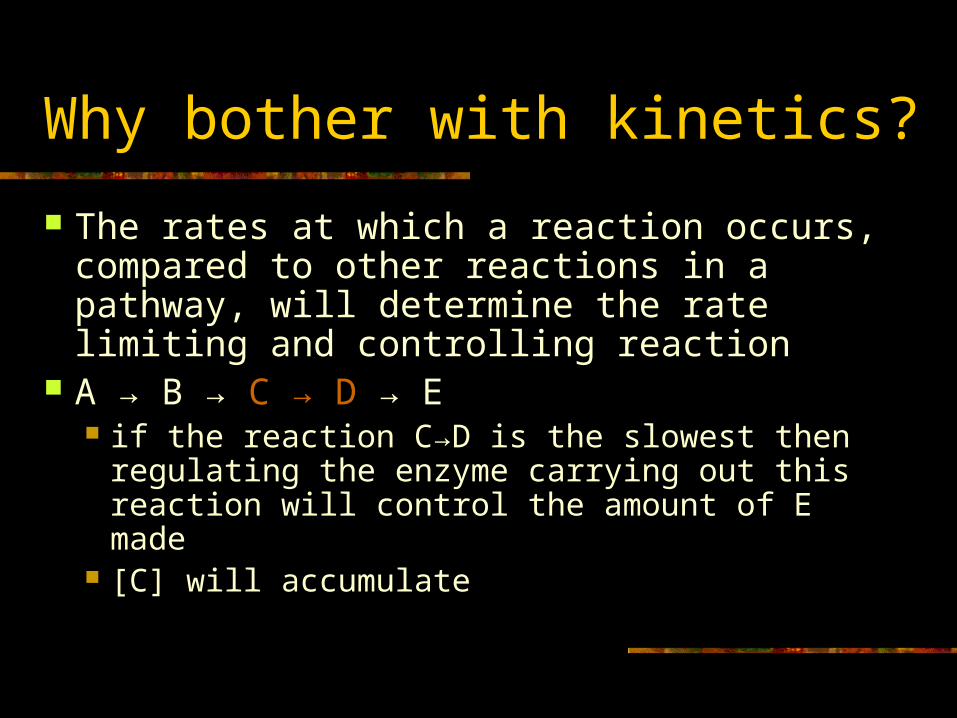
Why bother with kinetics?
The rates at which a reaction occurs, compared to other reactions in a pathway, will determine the rate limiting and controlling reaction
A → B → C → D → E if the reaction C→D is the slowest then
regulating the enzyme carrying out this reaction will control the amount of E made
[C] will accumulate
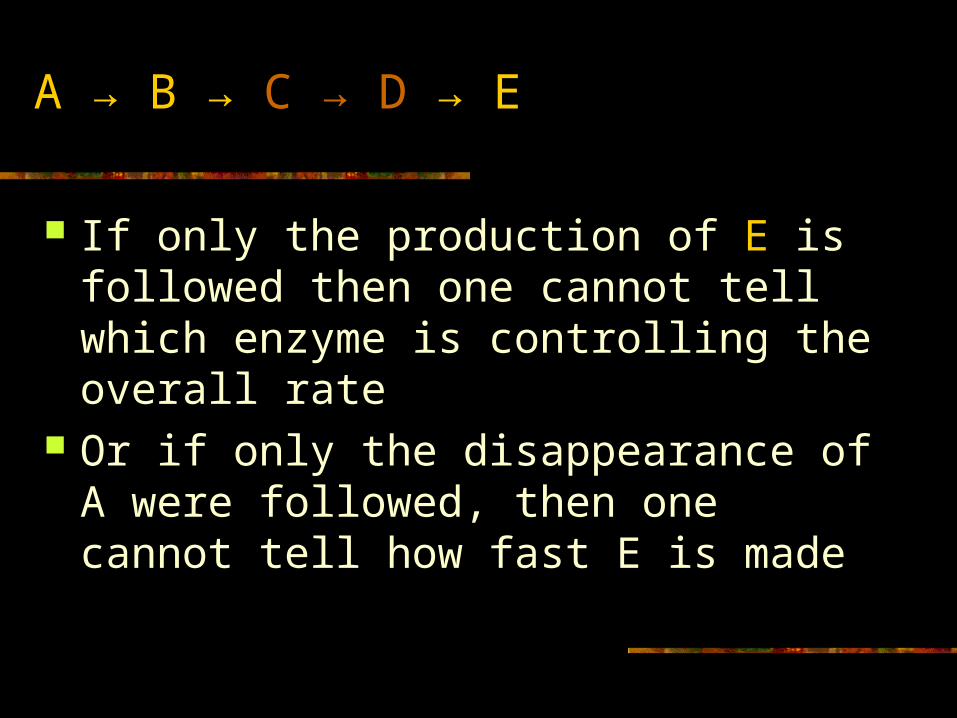
A → B → C → D → E
If only the production of E is followed then one cannot tell which enzyme is controlling the overall rate
Or if only the disappearance of A were followed, then one cannot tell how fast E is made

Lots of information in a reaction time course
If only one time point is taken, then many important aspects may be missed. A non-linear rate A lag before the steady state Running out of substrate A competing activity or build up of product inhibition
time
[product]
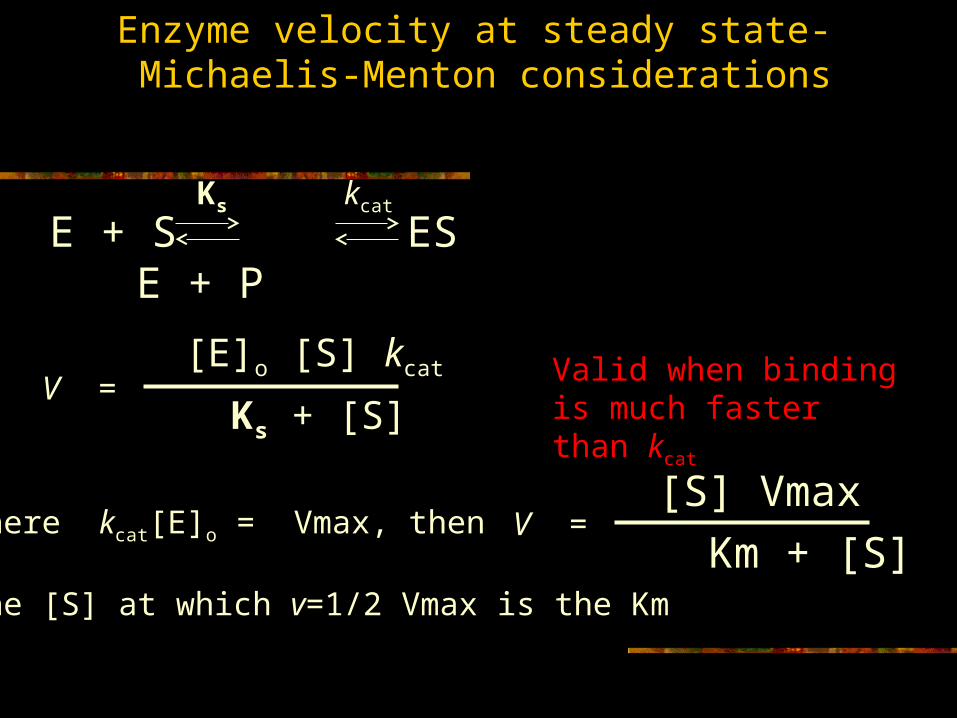
Enzyme velocity at steady state- Michaelis-Menton considerations
[E]o [S] kcat
Ks + [S]V =
Where kcat[E]o = Vmax, then
The [S] at which v=1/2 Vmax is the Km
[S] Vmax
Km + [S]V =
E + S ES E + PkcatKs
Valid when binding is much faster than kcat
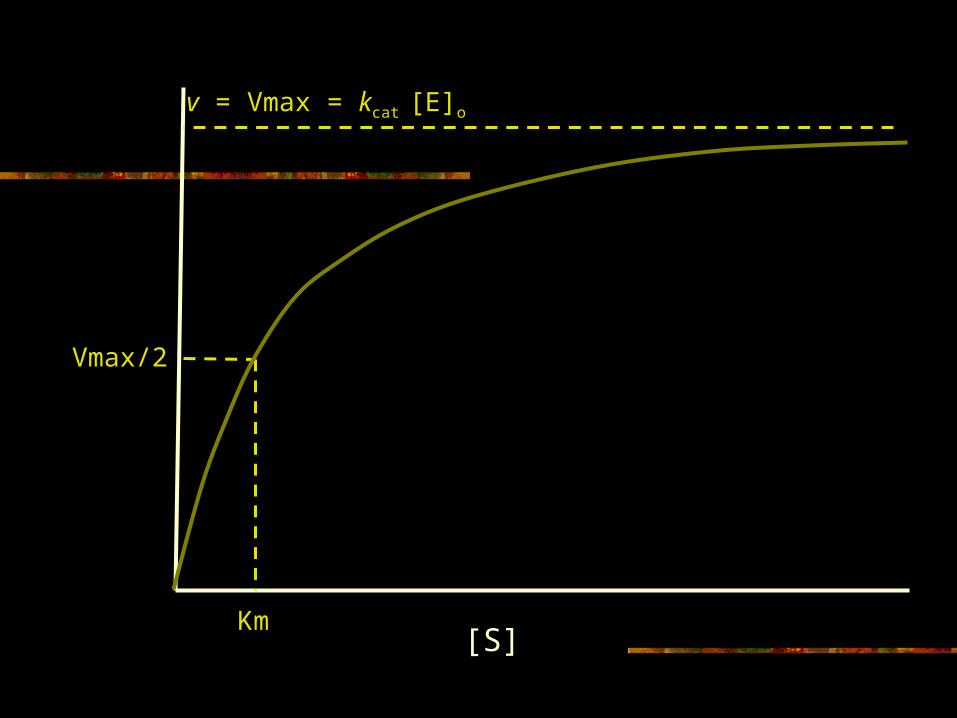
[S]
Vmax/2
Km
v = Vmax = kcat [E]o
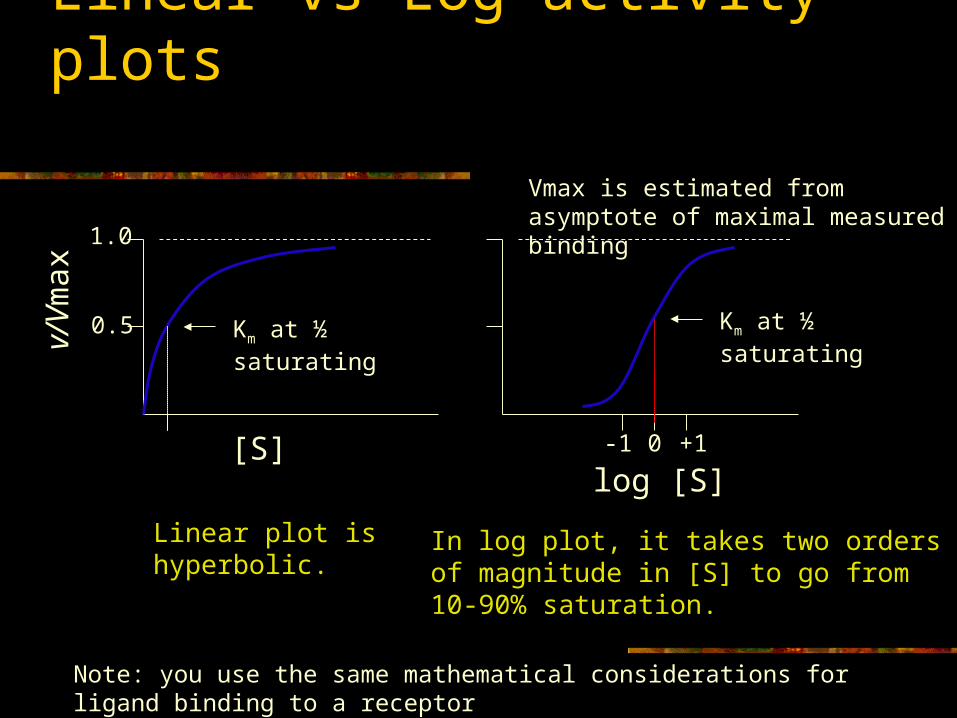
Linear vs Log activity plots
log [S]
Km at ½ saturatingKm at ½ saturating
[S]
v/V
max
0.5
1.0
Linear plot is hyperbolic. In log plot, it takes two orders of magnitude in [S] to go from 10-90% saturation.
0-1 +1
Vmax is estimated from asymptote of maximal measured binding
Note: you use the same mathematical considerations for ligand binding to a receptor
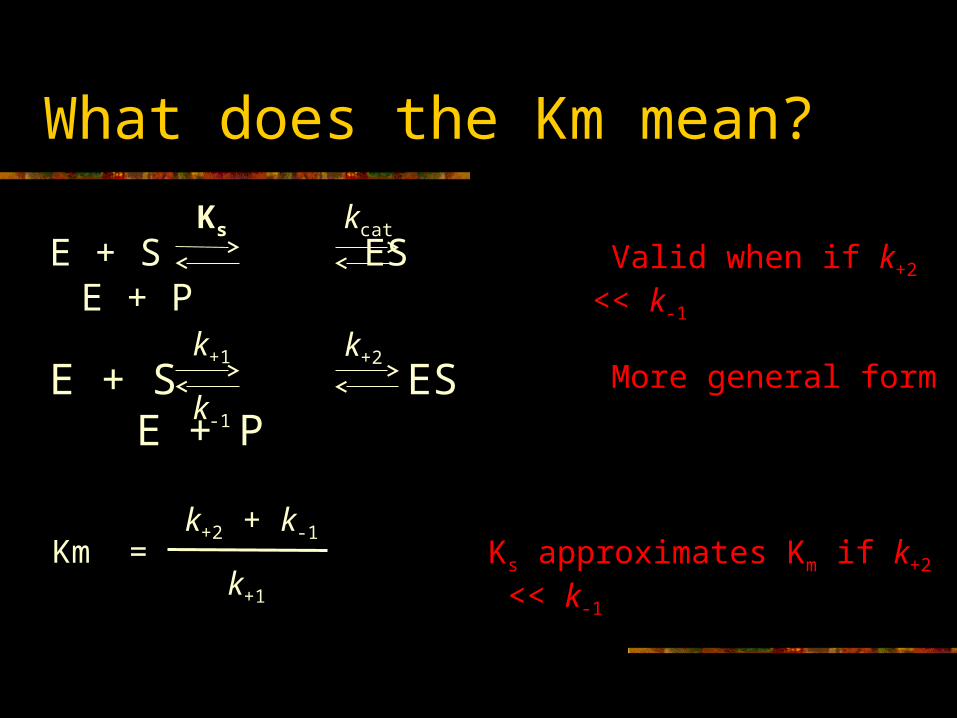
What does the Km mean?
E + S ES E + PkcatKs
Km =k+2 + k-1
k+1
Ks approximates Km if k+2 << k-1
Valid when if k+2 << k-1
E + S ES E + Pk+2k+1
k-1
More general form
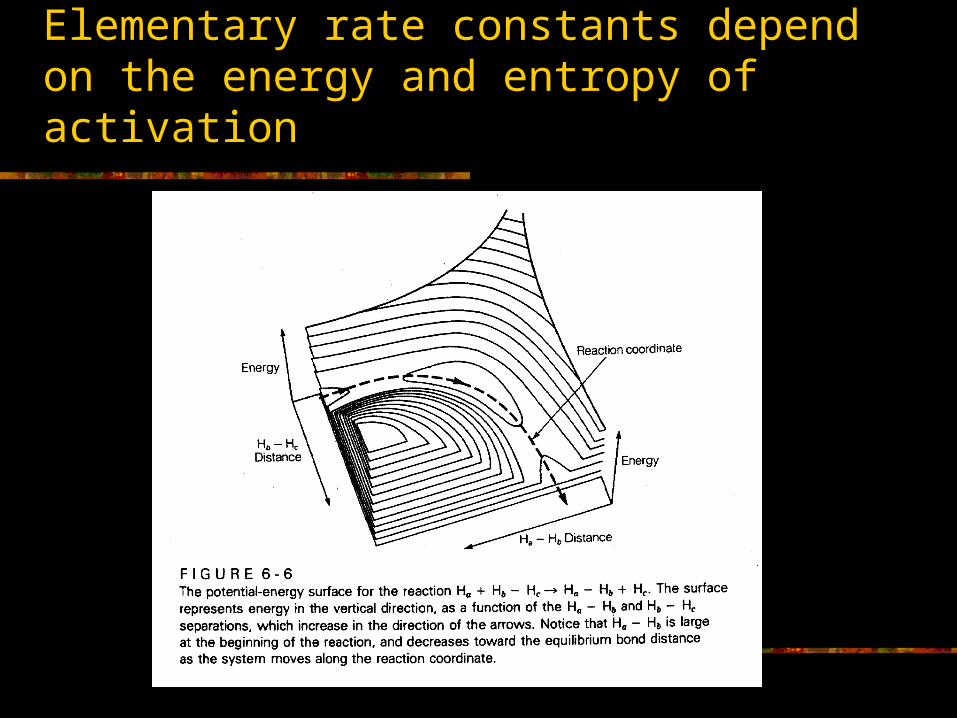
Elementary rate constants depend on the energy and entropy of activation
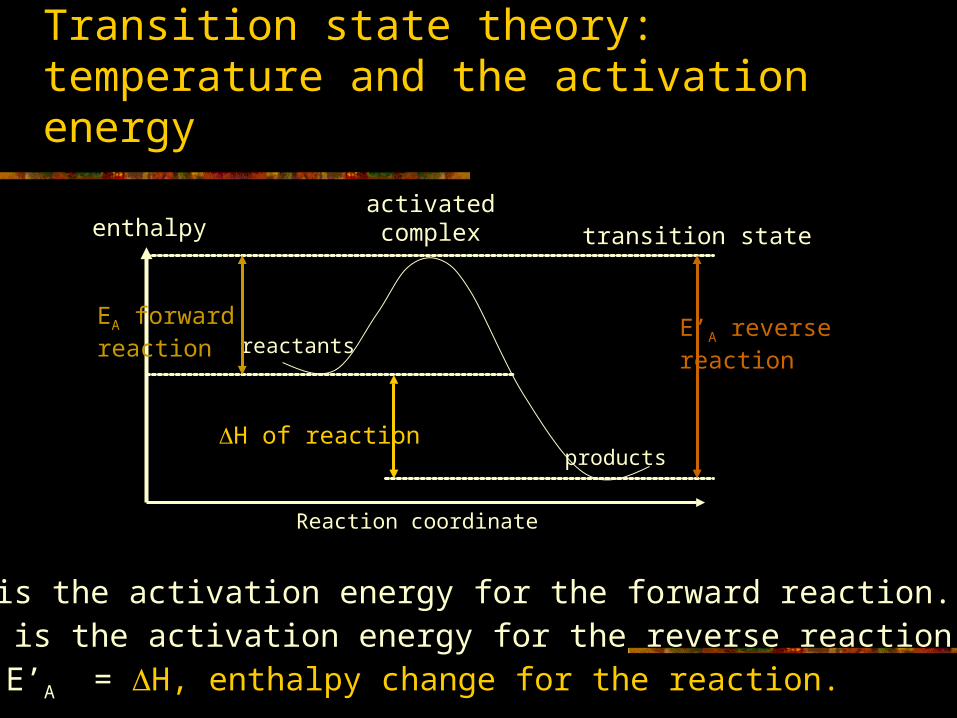
Transition state theory: temperature and the activation energy
enthalpyactivatedcomplex transition state
E’A reverse reaction
products
reactantsEA forward reaction
H of reaction
Reaction coordinate
EA is the activation energy for the forward reaction.E’A is the activation energy for the reverse reaction.EA- E’A = H, enthalpy change for the reaction.
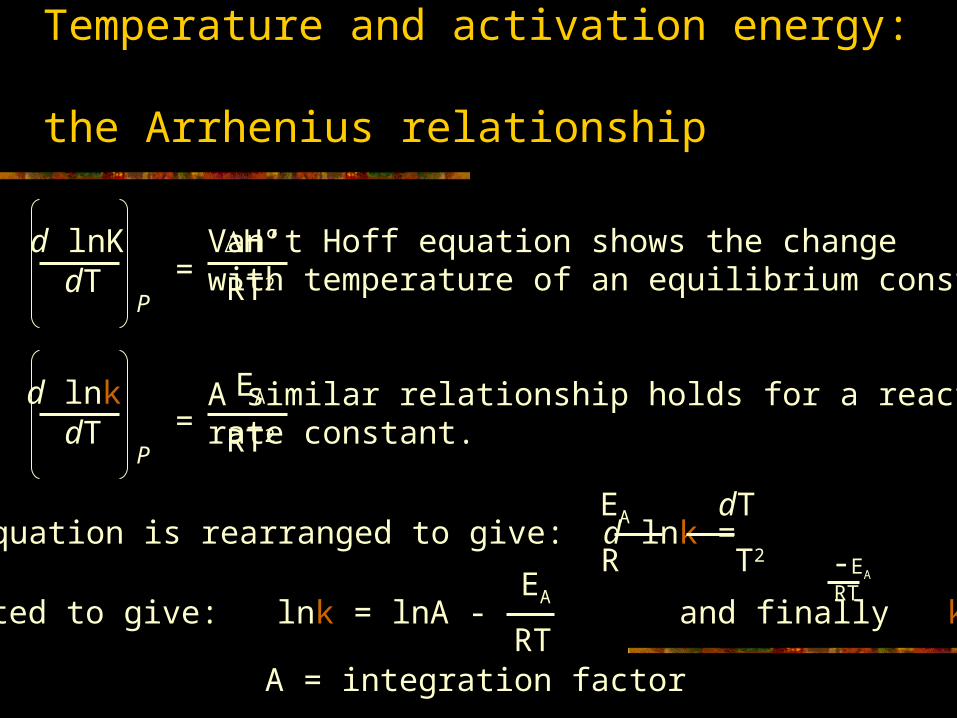
Temperature and activation energy: the Arrhenius relationship
d lnKdT
P=
H°
RT2
Van’t Hoff equation shows the changewith temperature of an equilibrium constant.
A similar relationship holds for a reaction rate constant.
d lnkdT
P=
EA
RT2
This equation is rearranged to give: d lnk = EA dT
R T2
And integrated to give: lnk = lnA - and finally k = A eEA
RT
-EA
RT
A = integration factor
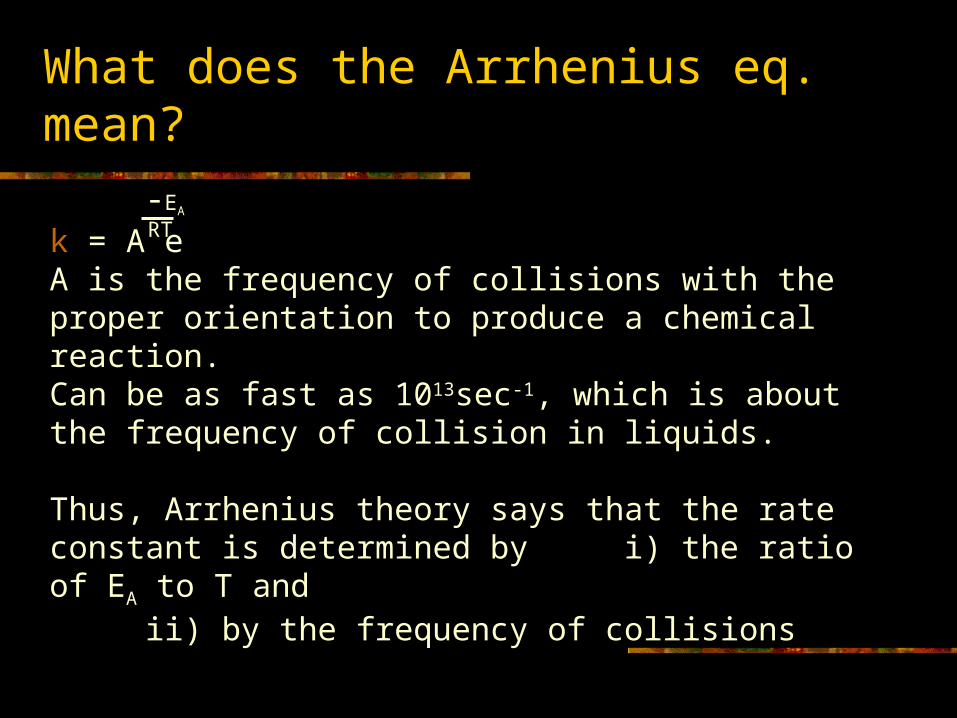
What does the Arrhenius eq. mean?
k = A eA is the frequency of collisions with the proper orientation to produce a chemical reaction. Can be as fast as 1013sec-1, which is about the frequency of collision in liquids.
Thus, Arrhenius theory says that the rate constant is determined by i) the ratio of EA to T and ii) by the frequency of collisions
-EA
RT
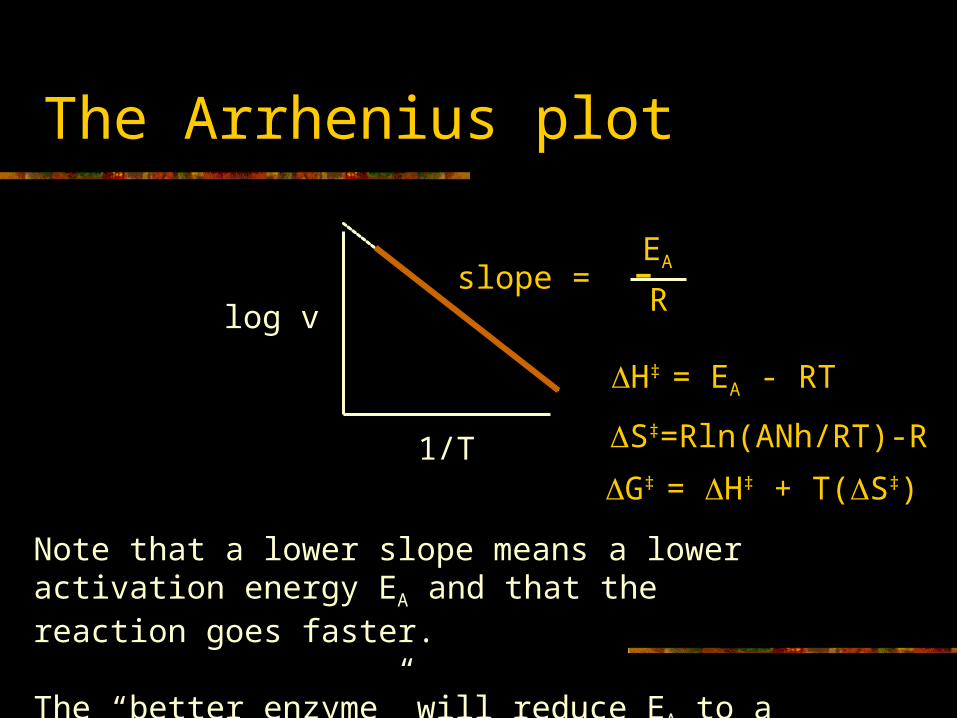
The Arrhenius plot
log v
1/T
slope = -EA
R
Note that a lower slope means a lower activation energy EA and that the reaction goes faster.
The “better enzyme” will reduce EA to a greater extent.
H‡ = EA - RT
S‡=Rln(ANh/RT)-R
G‡ = H‡ + T(S‡)

Example: amino acid substitutions can affect
EA, better or worse catalyst.

The Assay
If you want to understand the kinetics of a reaction,
like the binding of a ligand to a receptor, or
an enzymatic reaction, like a phosphorylation or
dephosphorylation of a signaling protein, or
transport of an ion across a membrane, or
transcriptional activation of a gene,
You need an assay with the proper “time constant”
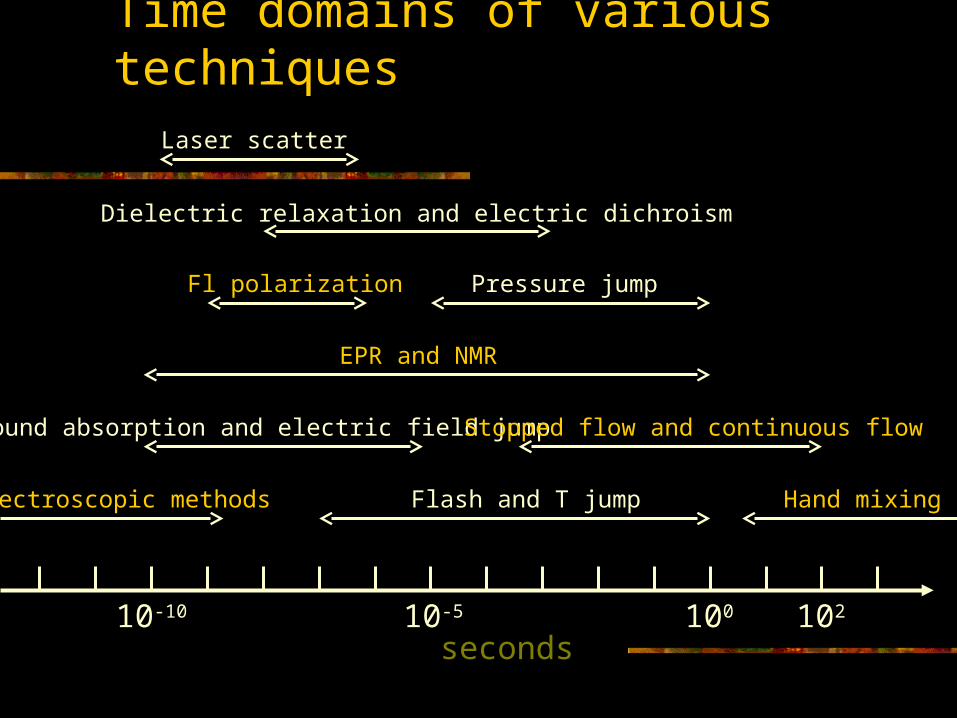
Time domains of various techniques
10210-10 10010-5
seconds
Spectroscopic methods Hand mixingFlash and T jump
EPR and NMR
Pressure jump
Dielectric relaxation and electric dichroism
Laser scatter
Fl polarization
Ultrasound absorption and electric field jump Stopped flow and continuous flow

Specificity of the reaction
Is the reaction you are measuring carried out by only one enzyme?
Temperature? Co-factors? Competing activities?
Are there “non-enzymatic” pathways to the products?
Controls, controls, controls.
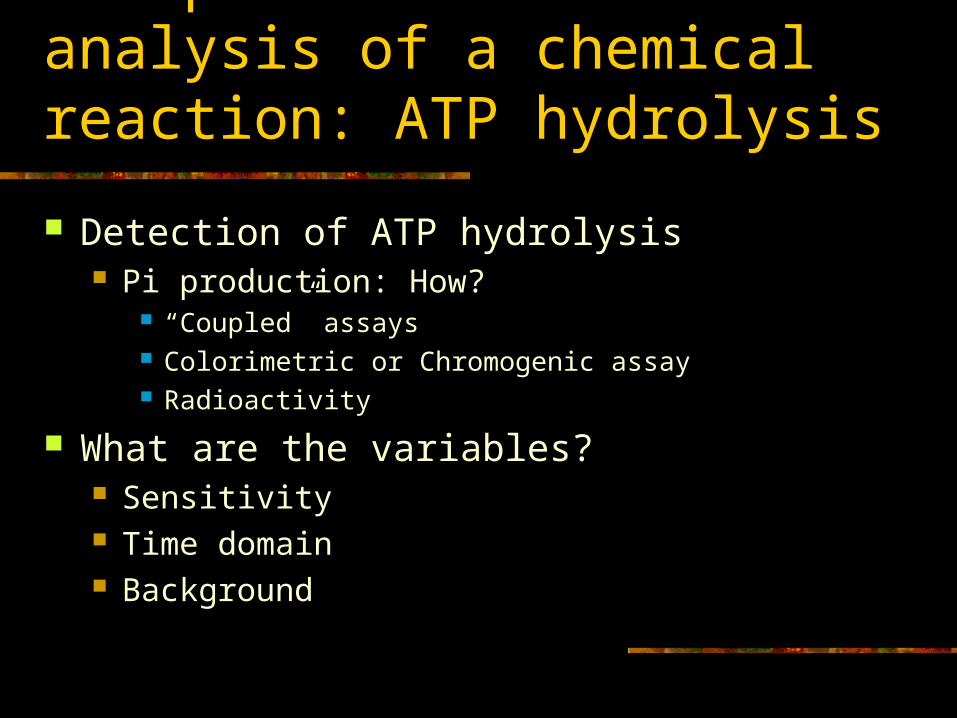
Example of kinetic analysis of a chemical reaction: ATP hydrolysis
Detection of ATP hydrolysis Pi production: How?
“Coupled” assays Colorimetric or Chromogenic assay Radioactivity
What are the variables? Sensitivity Time domain Background
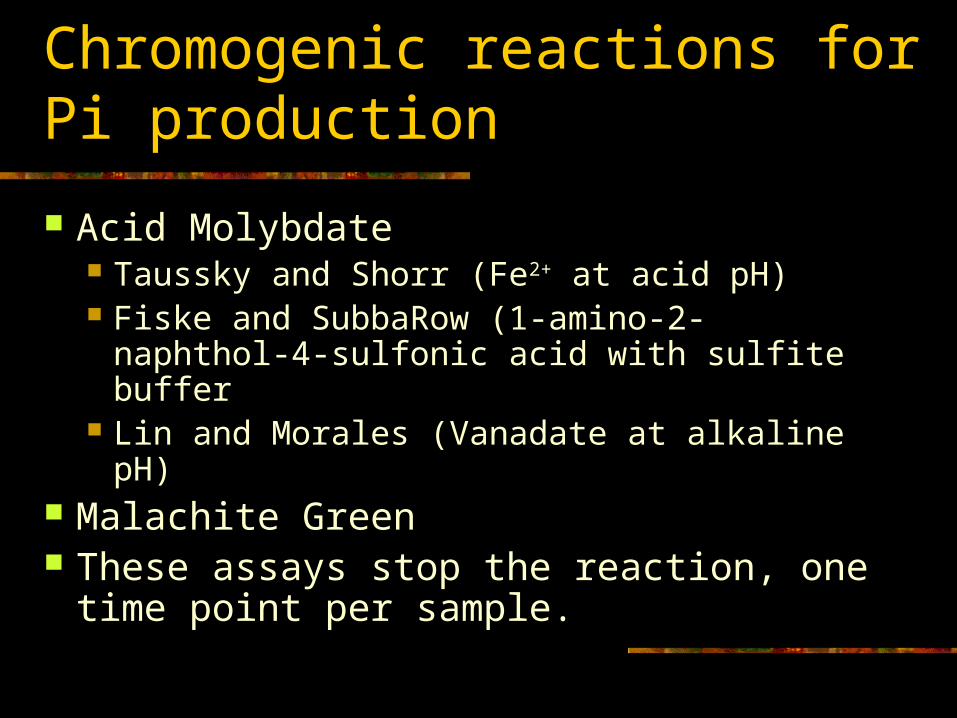
Chromogenic reactions for Pi production
Acid Molybdate Taussky and Shorr (Fe2+ at acid pH) Fiske and SubbaRow (1-amino-2-naphthol-4-
sulfonic acid with sulfite buffer Lin and Morales (Vanadate at alkaline pH)
Malachite Green These assays stop the reaction, one time
point per sample.
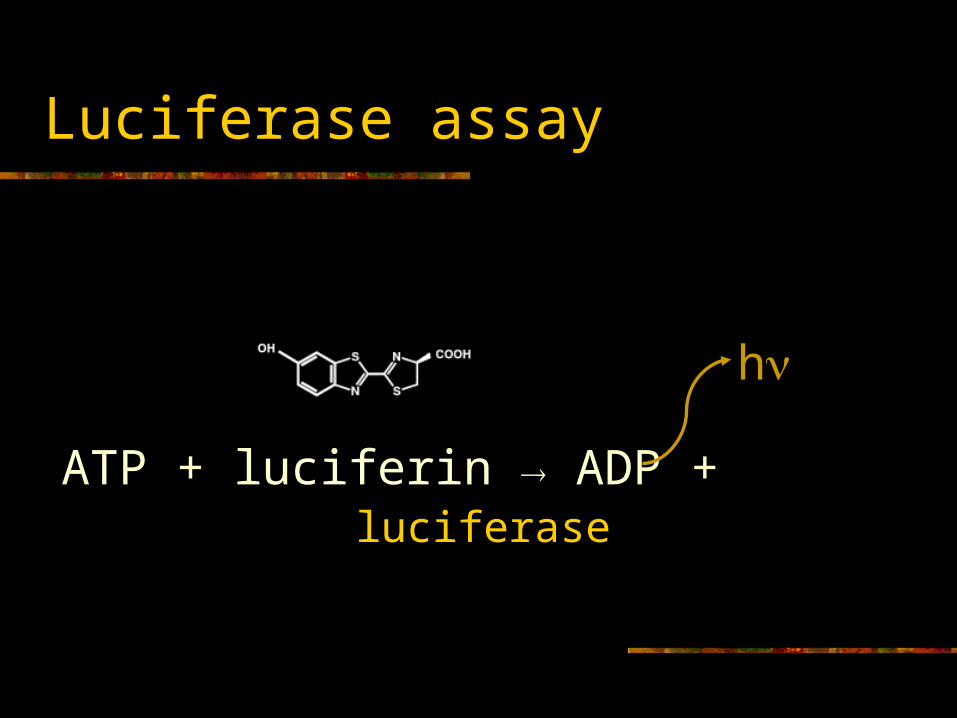
Luciferase assay
ATP + luciferin ADP +
h
luciferase
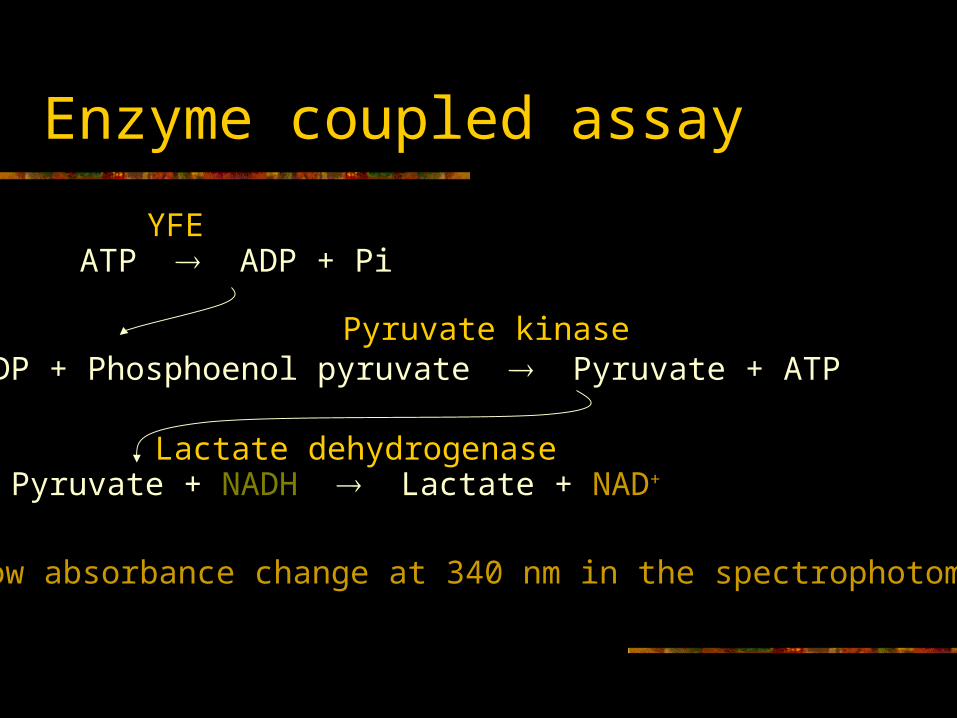
Enzyme coupled assay
ATP ADP + Pi
ADP + Phosphoenol pyruvate Pyruvate + ATP
Pyruvate + NADH Lactate + NAD+
YFE
Pyruvate kinase
Lactate dehydrogenase
Follow absorbance change at 340 nm in the spectrophotometer.
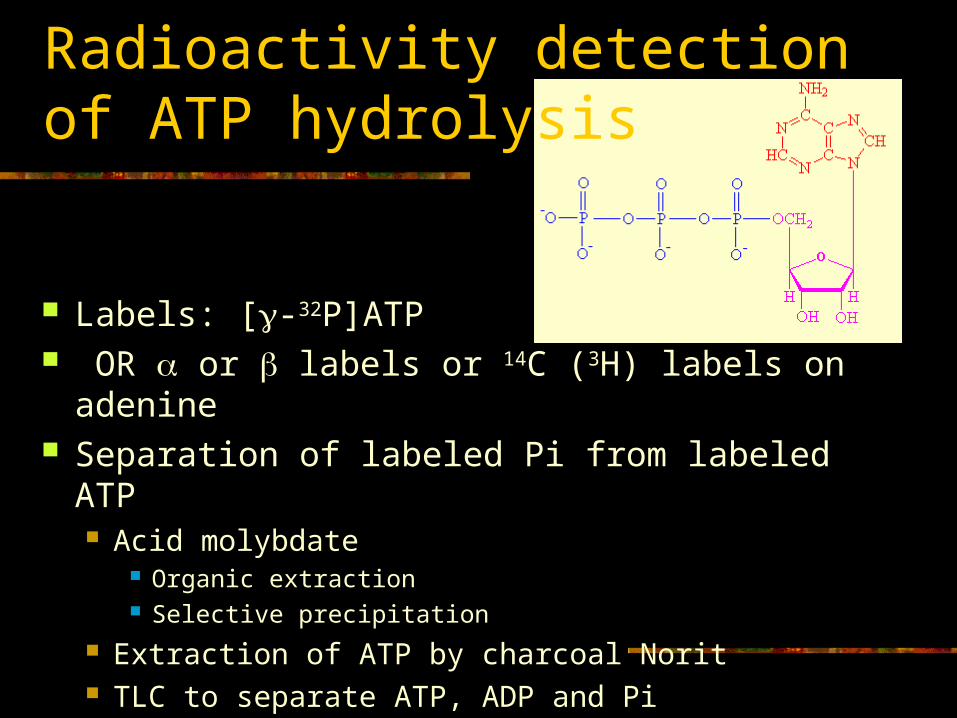
Radioactivity detection of ATP hydrolysis
Labels: [-32P]ATP OR or labels or 14C (3H) labels on adenine Separation of labeled Pi from labeled ATP
Acid molybdate Organic extraction Selective precipitation
Extraction of ATP by charcoal Norit TLC to separate ATP, ADP and Pi
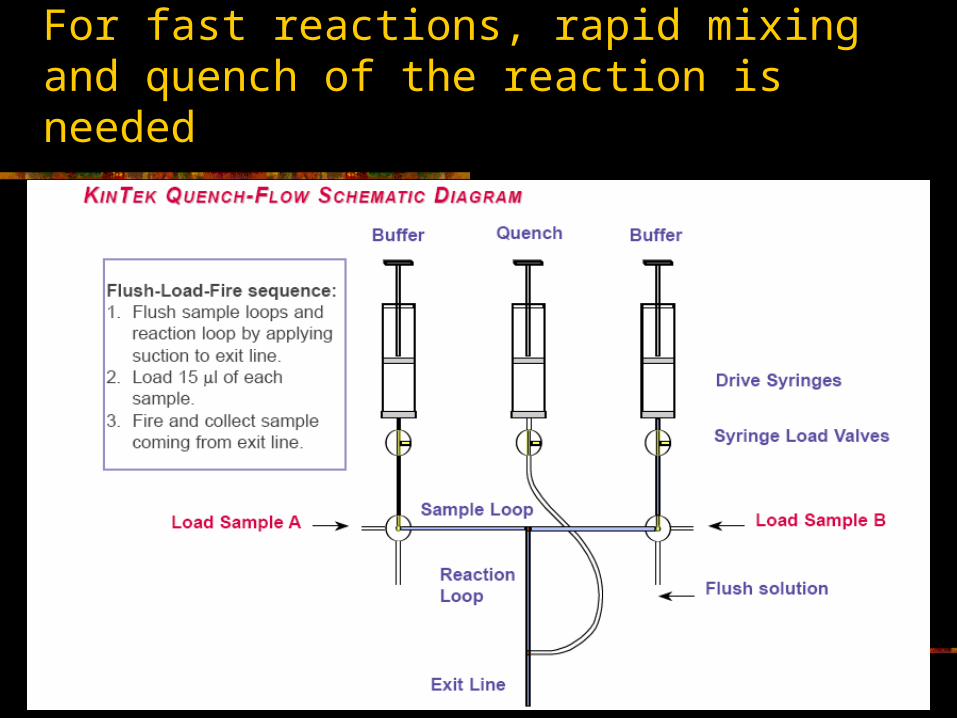
For fast reactions, rapid mixing and quench of the reaction is needed
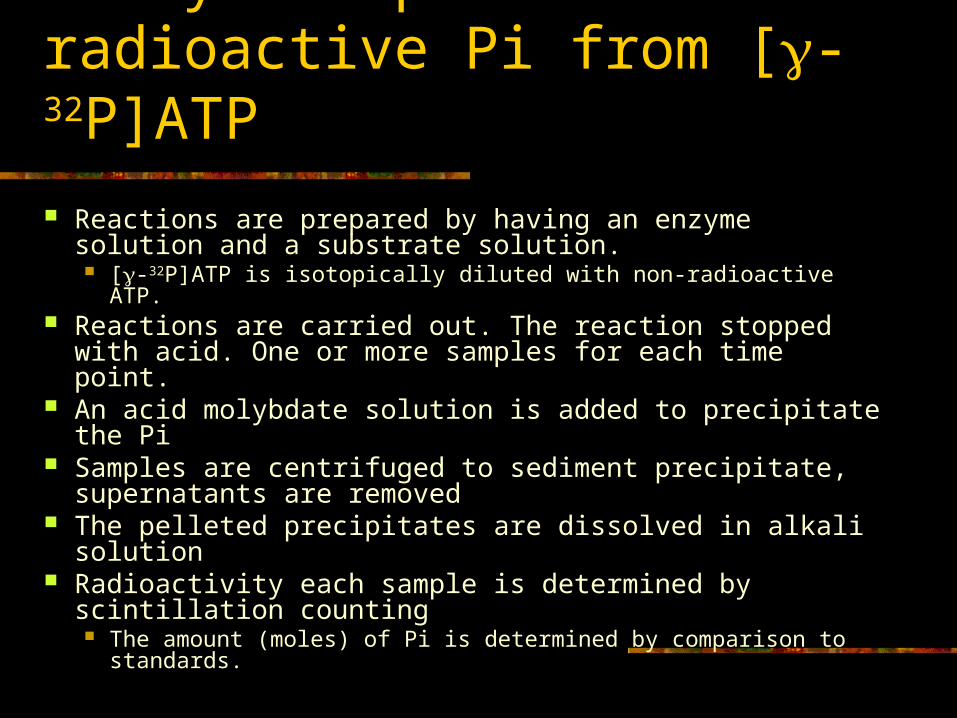
Assay for production of radioactive Pi from [-32P]ATP
Reactions are prepared by having an enzyme solution and a substrate solution. [-32P]ATP is isotopically diluted with non-radioactive ATP.
Reactions are carried out. The reaction stopped with acid. One or more samples for each time point.
An acid molybdate solution is added to precipitate the Pi Samples are centrifuged to sediment precipitate,
supernatants are removed The pelleted precipitates are dissolved in alkali solution Radioactivity each sample is determined by scintillation
counting The amount (moles) of Pi is determined by comparison to
standards.

Fluorescence assay for Pi production
Phosphate binding protein modified with coumarin Fluorescence increase upon binding of Pi
Detects release of Pi from enzyme Fluorescence change can be followed
continuously in stopped flow
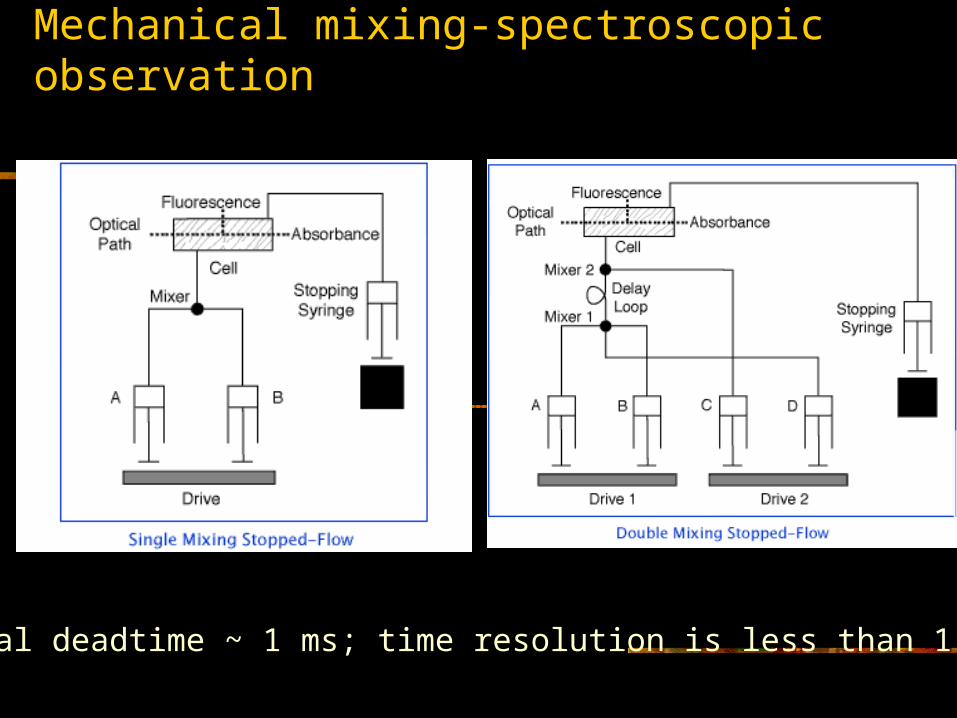
Mechanical mixing-spectroscopic observation
Usual deadtime ~ 1 ms; time resolution is less than 1 ms
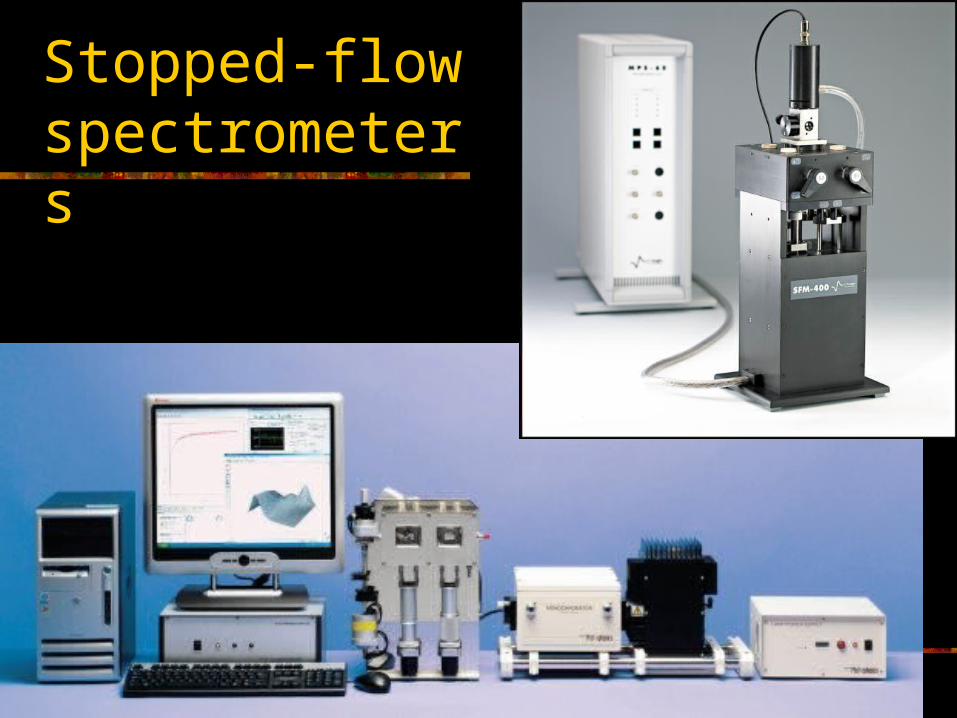
Stopped-flow spectrometers
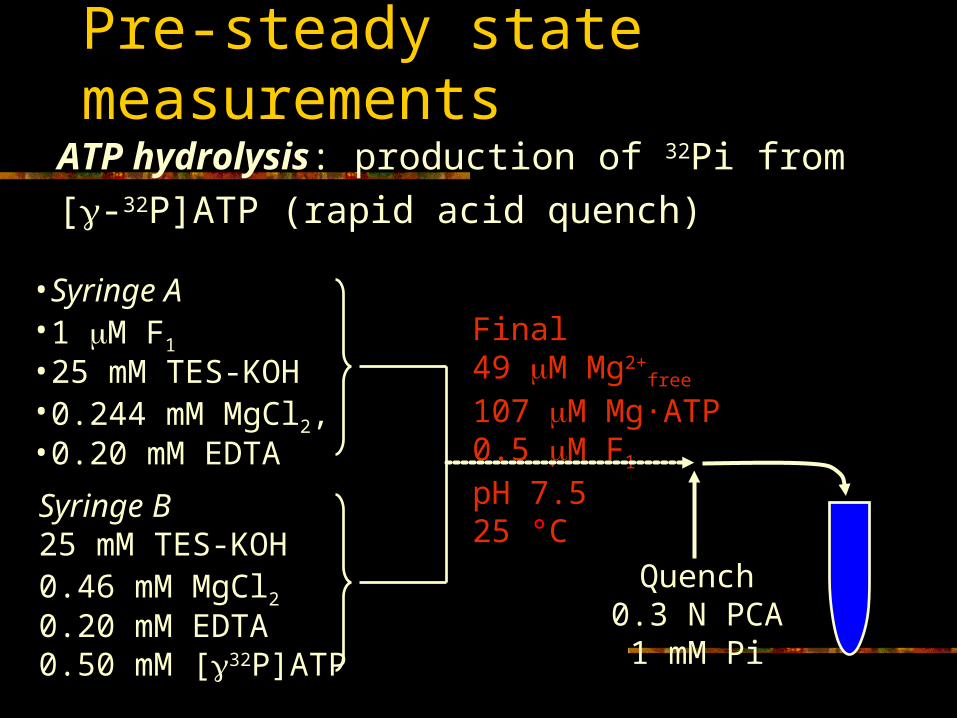
Pre-steady state measurements
ATP hydrolysis: production of 32Pi from
[-32P]ATP (rapid acid quench)
•Syringe A•1 M F1
•25 mM TES-KOH•0.244 mM MgCl2, •0.20 mM EDTA
Syringe B25 mM TES-KOH0.46 mM MgCl20.20 mM EDTA0.50 mM [32P]ATP
Final49 M Mg2+
free
107 M Mg·ATP0.5 M F1
pH 7.525 °C
Quench0.3 N PCA1 mM Pi
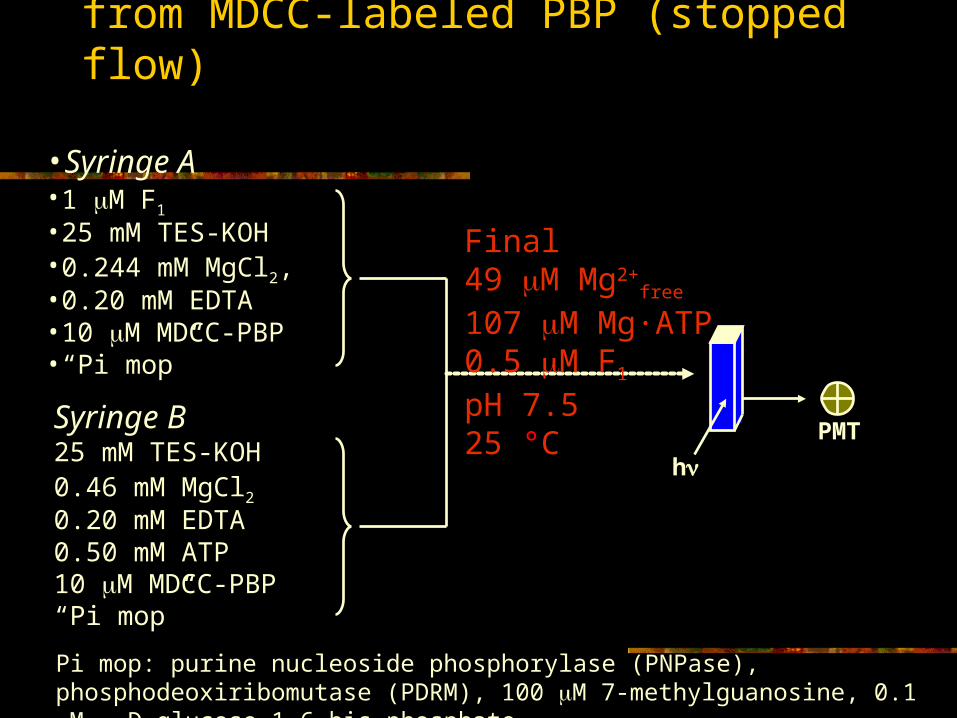
Pi release: fluorescence signal from MDCC-labeled PBP (stopped flow)
•Syringe A•1 M F1
•25 mM TES-KOH•0.244 mM MgCl2, •0.20 mM EDTA•10 M MDCC-PBP •“Pi mop”
Syringe B25 mM TES-KOH0.46 mM MgCl20.20 mM EDTA0.50 mM ATP10 M MDCC-PBP “Pi mop”
Final49 M Mg2+
free
107 M Mg·ATP0.5 M F1
pH 7.525 °C
hPMT
Pi mop: purine nucleoside phosphorylase (PNPase), phosphodeoxiribomutase (PDRM), 100 M 7-methylguanosine, 0.1 M -D-glucose 1,6-bis-phosphate
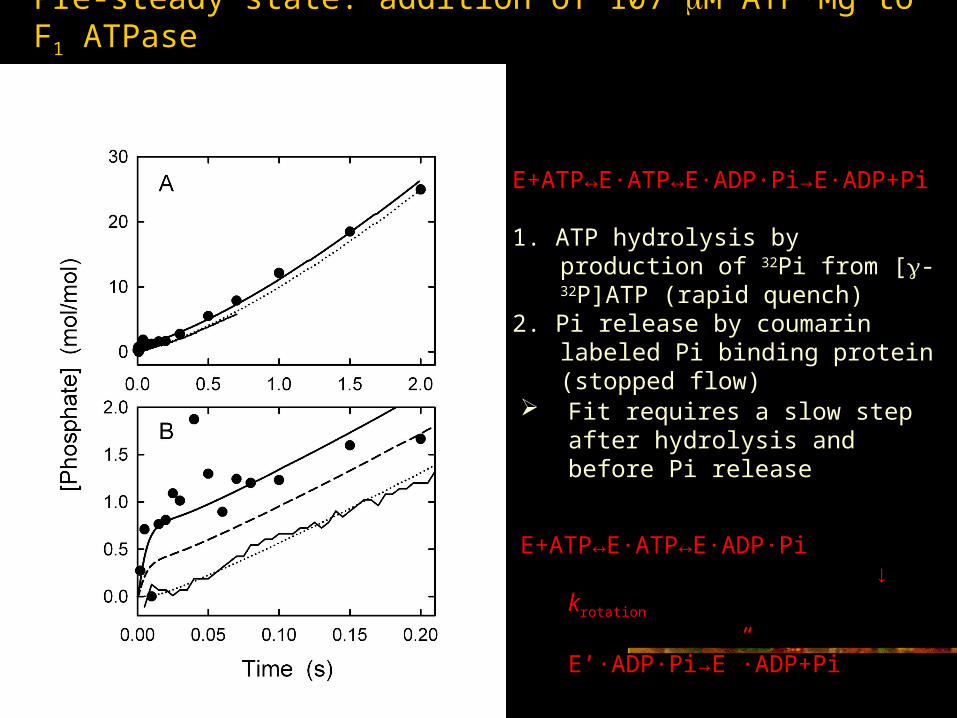
Pre-steady state: addition of 107 M ATP·Mg to F1 ATPase
E+ATP↔E·ATP↔E·ADP·Pi→E·ADP+Pi 1. ATP hydrolysis by production of 32Pi
from [-32P]ATP (rapid quench)2. Pi release by coumarin labeled Pi
binding protein (stopped flow)
Fit requires a slow step after hydrolysis and before Pi release
E+ATP↔E·ATP↔E·ADP·Pi ↓ krotation
E’·ADP·Pi→E”·ADP+Pi