ENVIRONMENTAL TECHNOLOGY BEST PRACTICE PROGRAMME …
29
ENVIRONMENTAL TECHNOLOGY BEST PRACTICE PROGRAMME GG82 GUIDE INVESTING TO INCREASE PROFITS AND REDUCE WASTES GOOD PRACTICE: Proven technology and techniques for profitable environmental improvement
Transcript of ENVIRONMENTAL TECHNOLOGY BEST PRACTICE PROGRAMME …
ENVIRONMENTAL
TECHNOLOGY
BEST PRACTICE
PROGRAMME
GG82GUIDE
INVESTINGTO INCREASE PROFITSAND REDUCE WASTES
GOOD PRACTICE: Proven technology and techniques for profitable environmental improvement

© Crown copyright. First printed June 1997. This material may be freely reproduced except for sale or advertising purposes.
Printed on paper containing 75% post-consumer waste.
INVESTINGTO INCREASE PROFITSAND REDUCE WASTES
This Good Practice Guide was produced by the
Environmental Technology Best Practice Programme
Prepared with assistance from:
ECOTEC Research and Consulting Ltd
The Co-operative Bank’s Ecology Unit

This Guide describes the cost savings and other benefits associated with investment in technologythat produces less waste.
The Guide will help you to:
■ consider a range of potential solutions to a production or environmental problem - not simplyopt for end-of-pipe pollution control technology;
■ identify all the potential costs and savings of a cleaner technology and include them in theinvestment appraisal;
■ present your case to banks and lenders.
Adopting a cleaner technology generally leads to more efficient use of raw materials, utilities andenergy, with a consequent reduction in waste. Investment in cleaner technology therefore allowscompanies to achieve cost savings and environmental objectives simultaneously. Expenditure bycompanies on end-of-pipe solutions does not usually provide such opportunities for cost savings.
The key to identifying the most cost-effective and environmentally-friendly solution is an appraisalof the true cost implications of alternatives.
The four main investment appraisal techniques outlined in this Guide are: payback period; return oncapital employed; net present value (NPV); and internal rate of return. Examples demonstrate theimportance of taking the time value of money into account through the use of discountingtechniques such as NPV. Sources of finance for cleaner technology projects and the informationneeded to make a successful loan application are also discussed.
The coloured pages at the centre of this Guide contain a simple worked example showing the useof investment appraisal techniques to select the cleaner technology option that generates the mostfinancial benefit.
A booklet containing Industry Examples can be found in the pocket at the back of this Guide. Thebooklet, Cleaner Technology Pays, describes how four companies achieved savings and otherbenefits after using investment appraisal techniques to select a cleaner technology option.
S U M M A R Y

Section Page
1 Why invest in cleaner technology? 1
2 Assessing the financial benefits of cleaner technology 3
2.1 Allocating costs 3
2.2 Does cleaner technology always win? 6
3 Financing capital investments 7
3.1 Sources of finance 7
3.2 Obtaining external finance 7
3.3 Bank lending practices 9
3.4 Good practice for financing cleaner technology 12
Appendices
Appendix 1 Investment appraisal techniques 13
Appendix 2 Sources of further help and information 20
Appendix 3 Definitions of asset finance methods 22
C O N T E N T S

In addition to these benefits, cleaner technology often has less obvious - or hidden - benefits suchas lower insurance premiums or a reduced need for monitoring to demonstrate compliance withenvironmental legislation.
Look at Cleaner Technology Pays, a separate booklet which is in the pocket at the back of this Guide.It contains Industry Examples which detail how companies have achieved cost savings by investingin cleaner technology.
Cleaner technology is simply equipment or materials that produce less waste or emissions thanconventional technology. Cleaner technology can be incorporated in existing production lines ordesigned into new manufacturing processes.
Traditional end-of-pipe technology is generally associated with treatments that collect or containenvironmental emissions. Cleaner technology prevents or minimises undesirable emissions throughchanges to the production process. The term is also associated with technology that allows the re-use or recycling of resources, eg the re-use of effluent as process water following treatment witha membrane separation system.
Cleaner technology covers:
■ changes to raw materials used in the process, ie utilities, feedstocks and auxiliary agents;
■ changes to the process itself, eg in-process recycling or process modifications;
■ changes to process output(s), ie the design, composition or specification of the endproduct(s).
Any change to the raw materials used, production process or products normally requires majorcapital investment. However, this can result in significant economic and environmental benefits -some of which may not be immediately apparent.
1
W H Y I N V E S T I N C L E A N E RT E C H N O L O G Y ?
1
section
1
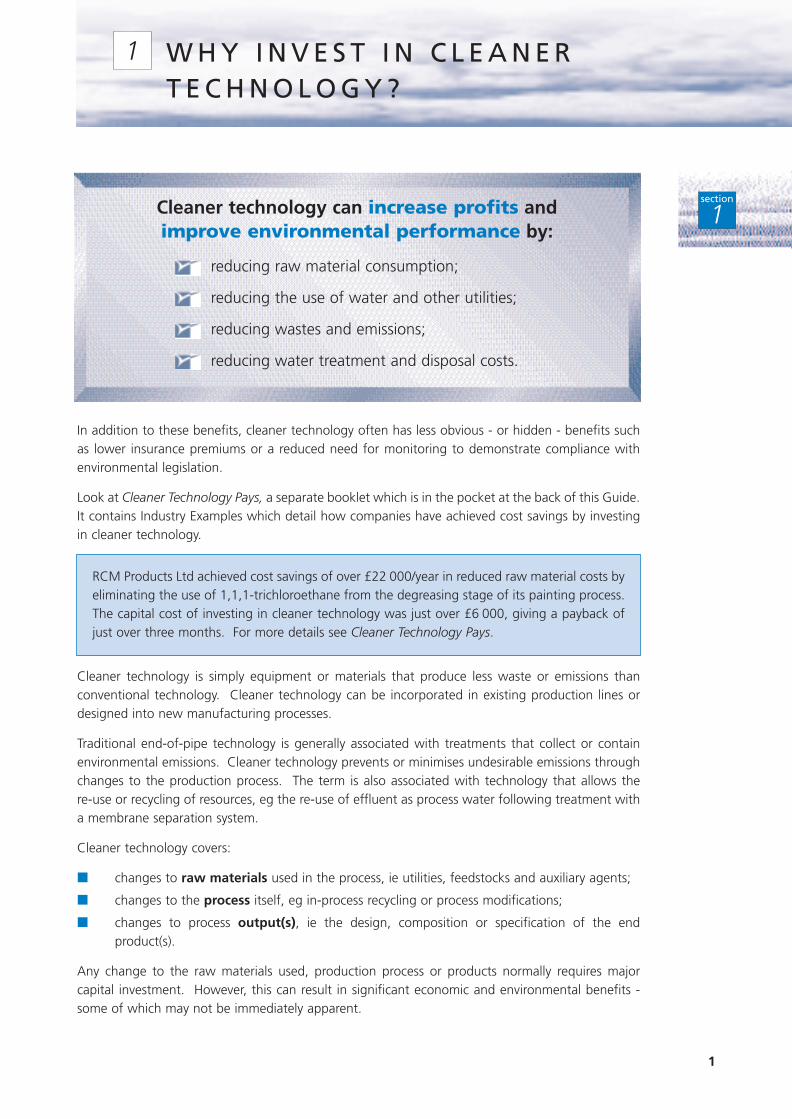
RCM Products Ltd achieved cost savings of over £22 000/year in reduced raw material costs byeliminating the use of 1,1,1-trichloroethane from the degreasing stage of its painting process.The capital cost of investing in cleaner technology was just over £6 000, giving a payback ofjust over three months. For more details see Cleaner Technology Pays.
Cleaner technology can increase profits andimprove environmental performance by:
reducing raw material consumption;
reducing the use of water and other utilities;
reducing wastes and emissions;
reducing water treatment and disposal costs.
Capital investment in cleaner technology is driven by:
■ the potential economic benefits, ie lower costs and/or higher revenues;
■ pressure from regulators, ie implementing legislation;
■ pressure to improve environmental performance from the company’s stakeholders -customers, suppliers, shareholders, employees, banks, managers, etc.
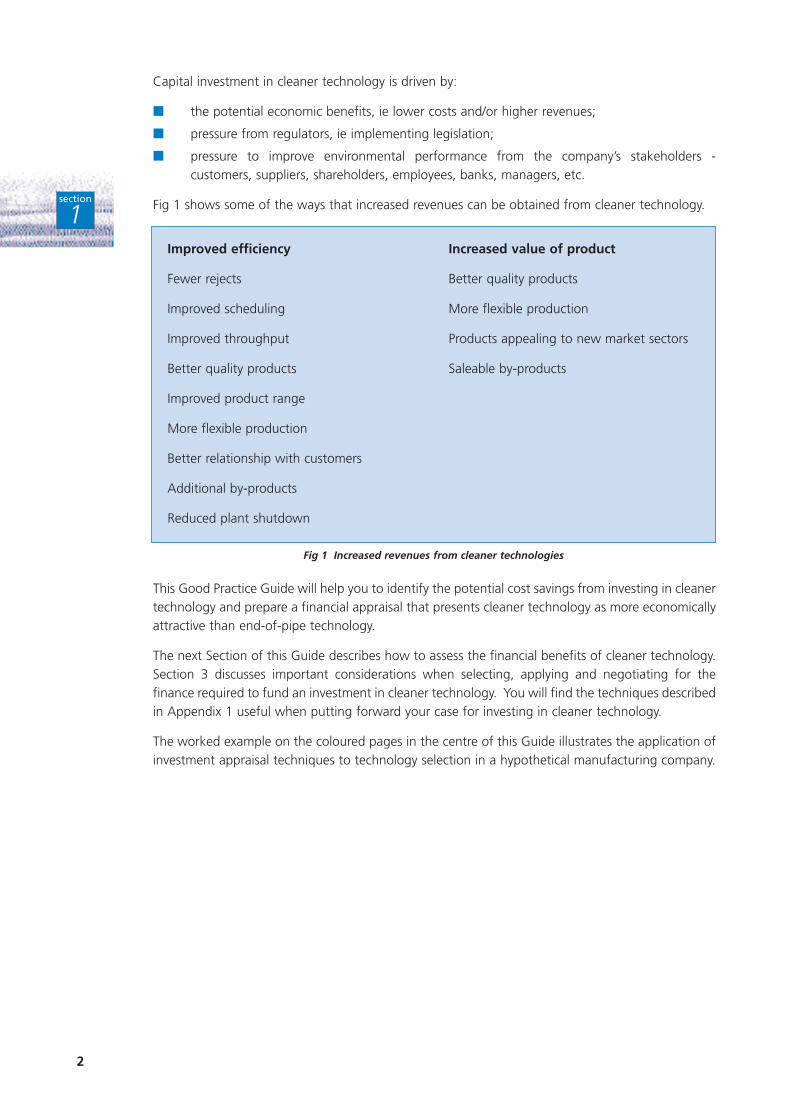
Fig 1 shows some of the ways that increased revenues can be obtained from cleaner technology.
This Good Practice Guide will help you to identify the potential cost savings from investing in cleanertechnology and prepare a financial appraisal that presents cleaner technology as more economicallyattractive than end-of-pipe technology.
The next Section of this Guide describes how to assess the financial benefits of cleaner technology.Section 3 discusses important considerations when selecting, applying and negotiating for thefinance required to fund an investment in cleaner technology. You will find the techniques describedin Appendix 1 useful when putting forward your case for investing in cleaner technology.
The worked example on the coloured pages in the centre of this Guide illustrates the application ofinvestment appraisal techniques to technology selection in a hypothetical manufacturing company.
2
section
1
Fig 1 Increased revenues from cleaner technologies
Improved efficiency Increased value of product
Fewer rejects Better quality products
Improved scheduling More flexible production
Improved throughput Products appealing to new market sectors
Better quality products Saleable by-products
Improved product range
More flexible production
Better relationship with customers
Additional by-products
Reduced plant shutdown
Within your company, cleaner technology projects will be competing for limited capital resourceswith other proposed projects. However, investment in cleaner technology usually produces anumber of financial and commercial benefits not seen with end-of-pipe investments. To incorporatethese benefits in the investment appraisal procedure, it is necessary to:
■ include a wider range of project costs and benefits, such as increased sales and fewer rejects,as legitimate cash flows in the investment appraisal process;
■ allocate costs and benefits to existing and proposed processes and products, instead of tooverheads;
■ account for uncertain cash flows which may occur over a longer time period. This process isknown as discounted cash flow (see Appendix 1).
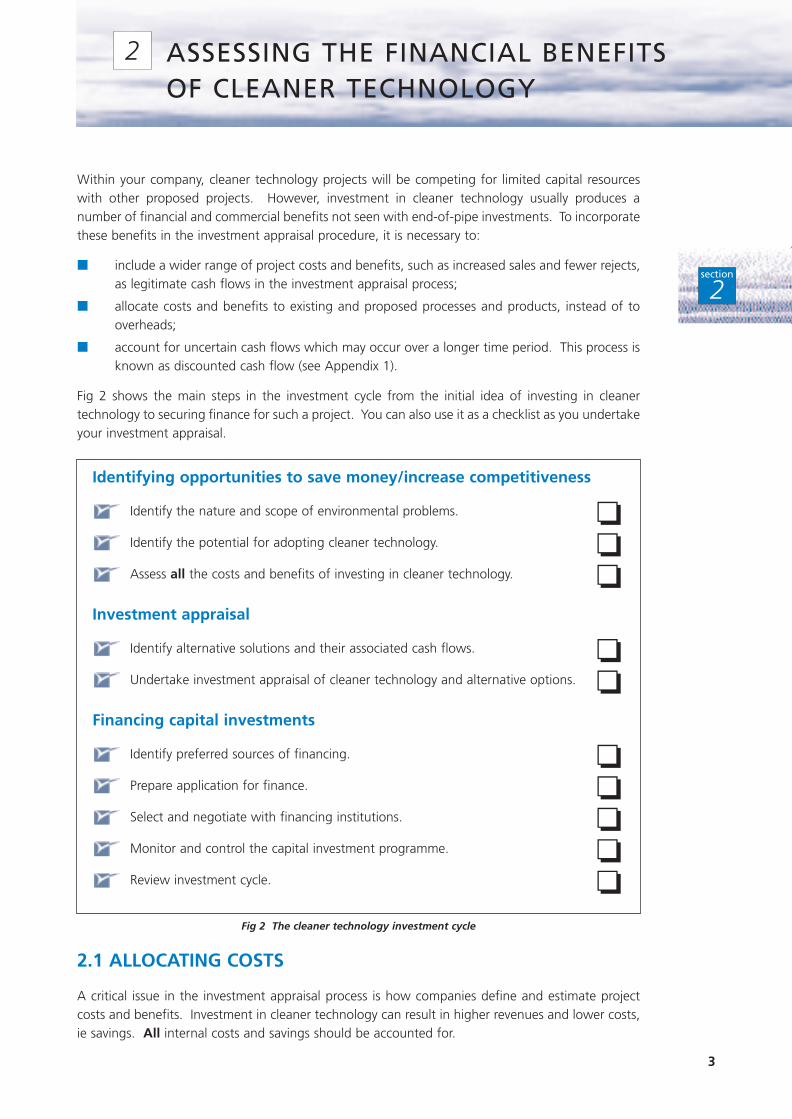
Fig 2 shows the main steps in the investment cycle from the initial idea of investing in cleanertechnology to securing finance for such a project. You can also use it as a checklist as you undertakeyour investment appraisal.
2.1 ALLOCATING COSTS
A critical issue in the investment appraisal process is how companies define and estimate projectcosts and benefits. Investment in cleaner technology can result in higher revenues and lower costs,ie savings. All internal costs and savings should be accounted for.
3
section
2
ASSESSING THE FINANCIAL BENEFITSOF CLEANER TECHNOLOGY
2
Fig 2 The cleaner technology investment cycle
Identifying opportunities to save money/increase competitiveness
Identify the nature and scope of environmental problems. ❏Identify the potential for adopting cleaner technology. ❏Assess all the costs and benefits of investing in cleaner technology. ❏
Investment appraisal
Identify alternative solutions and their associated cash flows. ❏Undertake investment appraisal of cleaner technology and alternative options. ❏
Financing capital investments
Identify preferred sources of financing. ❏Prepare application for finance. ❏Select and negotiate with financing institutions. ❏Monitor and control the capital investment programme. ❏Review investment cycle. ❏
Fig 3 provides a checklist of potential cost savings, divided into:
■ easily identified savings - those items that can be quantified easily;
■ hidden costs - those items that are more difficult to quantify, but which often providesignificant financial benefits;
■ uncertain costs - those items from which savings may be less obvious and which may taketime to accrue.
This checklist is not exhaustive; benefits will vary between companies and may change with time. Itis intended to highlight the range of savings which should be considered and, where appropriate,included as benefits in the investment appraisal process. You may wish to photocopy this checklistfor use in your company.
The approach suggested by the checklist in Fig 3 will enable you to identify and, where appropriate,calculate the potential savings from choosing a cleaner technology rather than an end-of-pipesolution.
2.1.1 Hidden costs
Understanding where hidden costs occur and allocating them accordingly is important. If youunderstand these costs, you can obtain a clear picture of the true costs of production and products.By allocating environmental costs to products or the processes that generate them, companies cantarget activities that reduce their costs and which also improve their environmental performance, forexample, investment in cleaner technology.
Not all processes and products are equally responsible for generating environmental costs. Someprocesses may:
■ produce more waste;
■ use more hazardous materials;
■ generate more emissions per unit of output;
■ require more intensive inspection and monitoring;
■ require disproportionately more training;
■ be more highly regulated;
■ give rise to risks that could result in higher insurance premiums or potential liability for futurepersonal or property damages.
Most environmental costs are usually assigned as overheads. Overheads may then be allocated toproducts and processes, eg energy costs distributed between departments. However, the factorsused to allocate overheads often bear no relationship to the origin of these environmental costs.
Identifying hidden costs
Environmental cost information can be obtained from a range of company departments andexternal organisations, including purchasing/procurement departments, production/operations,accounts/finance, consultants and technology suppliers. Solicitors, accountants and sales staff arelikely to play an increasing role as more intangible costs are included, eg the cost of insuring againstfuture liabilities, protecting company image, etc.
The most significant environmental costs involve:
■ wasted materials, ie reduced yield;
■ waste disposal.
4
section
2

5
section
2
Fig 3 Cost savings checklist for investment in cleaner technology
EASILY IDENTIFIED SAVINGS
Lower capital costs:
Site permitting ❏ Engineering and supervision ❏Reduced footprint ❏ Equipment ❏Buildings ❏ Services ❏
Reduced operating costs:
Inputs (feedstock, solvents, ❏ Utilities costs (water, electricity, ❏auxiliary agents, etc) gas, steam, etc)
Packaging ❏ Labour ❏Rental ❏ Insurance ❏Procurement ❏
HIDDEN COSTSReduced pollution control costs (handling, treatment, monitoring):
Capital costs ❏ Operating costs ❏Waste disposal costs ❏ Off-site treatment costs ❏
Reduced regulatory compliance costs (staff time):
Environmental training ❏ Level of monitoring/testing ❏Level of medical surveillance ❏ Number of inspections ❏Number of notifications ❏ Reporting and record-keeping ❏
UNCERTAIN COSTS Reduced contingency (future) costs:
Compliance costs ❏ Penalties and fines ❏Response to pollutant releases ❏ Legal expenses ❏Remediation costs ❏ Damage to property/persons ❏Damage to natural resources/economy ❏ Utility and feedstock costs ❏Cost of capital (equity, loans) ❏
Stakeholder (intangible) costs:
Customers/suppliers ❏ Investors/shareholders ❏Lenders ❏ Insurers ❏Employees ❏ Managers ❏Regulators ❏ Local community ❏Local authority ❏

Identifying these costs necessitates the collection of data on all stages of the production process thatgenerate waste and/or pollution. Waste disposal records will help you determine total wastequantities and the costs associated with their treatment and/or disposal. Good Practice Guide(GG25) Saving Money Through Waste Minimisation: Raw Material Use and Good Practice Guide(GG26) Saving Money Through Waste Minimisation: Reducing Water Use explain how to pinpointsources of waste/pollution through a mass balance. Both Guides are available free of chargethrough the Environmental Helpline on 0800 585794.
Cleaner technology generally allows you to make more efficient use of energy and raw materials.You should also consider possible revenues from saleable by-products, eg solvents recovered bydistillation or metals recovered from wastewater sludges. Increased product yield also producesincreased revenues.
Other costs are associated with regulation and risk:
■ obtaining licences to operate;
■ monitoring emissions to air and water;
■ reporting to the Environment Agency and other regulatory bodies.
Risk-related costs include those associated with insuring against environmental liabilities.
2.1.2 Uncertain costs
These costs are less tangible and thus more difficult to quantify. Commitment to cleaner technologyand improved environmental performance can have a positive impact on a range of factorsincluding:
■ product quality;
■ productivity;
■ customer acceptance of the company and its product(s);
■ corporate image;
■ employee attitudes and health.
2.2 DOES CLEANER TECHNOLOGY ALWAYS WIN?
Using the checklist in Fig 3 will ensure that all the benefits of investing in cleaner technology aretaken into account in an investment appraisal. This may improve the financial attractiveness ofcleaner technology projects, thus increasing the chances of obtaining funding for them from limitedcapital resources.
The cost of ‘writing off’ existing equipment should not be forgotten. Cleaner technology may beeconomic only if its financial benefits are sufficient to cover both the depreciation of existingequipment and the investment in the new equipment. End-of-pipe technology is often preferred ifexisting plant has not fully depreciated and an improvement in environmental performance isdemanded immediately.
6
section
2
In its investment appraisal, Revill Industrial Finishes Ltd included the savings from reducedsolvent consumption (easily identified savings), the potential savings from a reduction ininsurance premiums (hidden savings) and improved employee health and reduced regulatorypressures (uncertain savings). For more details, see Cleaner Technology Pays which is in thepocket at the back of this Good Practice Guide.

3.1 SOURCES OF FINANCE
There are three main methods of financing cleaner technology projects:
■ equity;
■ borrowing;
■ asset finance.
Sources of finance, which may be internal and external to the company, include:
■ Internal funds (equity) such as retained cash deposits from past trading or personal capital,eg from senior management.
■ External bank loans (known as balance sheet finance) such as term loans or an agreedoverdraft available from banks and other lending institutions. Such loans are based on thecredit worthiness of the company and its demonstrable ability to generate the cash to repaythe loan.
■ External asset finance such as finance leasing or hire purchase supplied by asset financeand leasing companies (possibly subsidiaries of banks, etc) or operating lease/contract hire(with/without maintenance). The latter may be available from the suppliers of cleanertechnology.
■ External equity or development capital available from venture capitalists, business angels,etc. Extended trade credit can be negotiated to provide additional equity.
Some useful definitions relating to asset finance methods are given in Appendix 3.
Table 1 (overleaf) summarises the strengths and weaknesses of these different sources of finance.
Many companies prefer to use internal funds and bank loans to finance cleaner technology projects,mainly because of their simplicity and flexible financing structure. If you are cautious about bankloans, you may consider lease hire as an alternative to full purchase.
3.2 OBTAINING EXTERNAL FINANCE
When negotiating finance, the following general rules apply:
■ Consider all possible options - debt finance, leasing arrangements and equity.
■ Consult your accountant.
■ Identify the optimum funding package.
■ Discuss the proposed package with your existing financiers.
If you prefer to take out a bank loan:
■ Research current financing rates.
■ Find out about the services provided by the bank for their business customers.
■ Choose a bank management team with which you believe you could establish a goodworking relationship.
■ Approach a maximum of four lenders.
7
section
3
F I N A N C I N G C A P I TA LI N V E S T M E N T S
3

■ Compare the terms and conditions of the written offers, paying particular attention to:
- the level of funding;
- the repayment period;
- the interest rate;
- arrangement and management fees;
- security and equity requirements;
- the lending conditions and covenants.
■ Identify the lead organisation for deals involving different types of finance.
■ Maintain a close relationship with your lenders, but test the market periodically to ensure thatthe rates remain competitive.
8
section
3
Source of finance Strengths Weaknesses
Internal funds Self-justified.
Fast, with total management control.
No external costs.
Term loans Fixed term and fixed/variable interest rates.
Longer term.
Limited impact on working capital.
Allows for accurate budgeting.
Asset finance 100% funding may be available.
Fixed term/variable rentals.
Allows for accurate budgeting.
Flexible and easy to arrange.
Medium-term facility. Facilities do not normally conflict with bank security arrangements.
Certainty of credit - not repayable on demand.
Acquisition of the asset/equipment from future cash flow leaves working capital intact.
External equity Access to market/management expertise.
Reduces gearing.
Reduces working capital.
Arrangement fees payable.
Funds generally restricted to size of asset base.
Linked to useful life of the asset.
Additional security required, especially if 100% funding.*
Contract breaches may require on-demand repayment.
Own capital contribution is oftenrequired.
Funds restricted to specific asset.
Asset is secured.
Asset is repossessed if rentals are missed.
Shorter-term repayment requirementsmay reduce working capital.
Can be slow.
Can result in loss of management control.
Exit route required by equity provider may contradict management strategy.
Costs can be very high (depending ondividend policy).
* The Small Firms Loan Guarantee Scheme is an option when additional security is not available.
Table 1 Strengths and weaknesses of different sources of finance

Money and Machines (ref URN 95/555) from the Department of Trade and Industry (DTI) providesdetailed guidance on how to identify and negotiate with financial institutions. This publication isavailable free to UK businesses from DTI M90s Publications, ADMAIL 528, London SW1W 8YT. Tel: 0171 510 0144. Fax: 0171 510 0197.
3.3 BANK LENDING PRACTICES
Banks provide loans to make money and thus remain in business. This objective is reflected in thebusiness targets assigned to individual branches or bank lending officers (BLOs). Banks are thereforelooking for reasons to proceed with loan applications rather than turn them down.
Although the actual lending sequence varies from bank to bank, there are a number of commonfeatures.
The BLO contacted initially by the loan applicant normally has the power to:
■ agree the loan provided the assessment is favourable and the loan is within the BLO’sdiscretionary limit;
■ turn down an application, even if it is outside the BLO’s discretionary limit (senior staff areusually consulted);
■ pass the application to another department (if appropriate).
If the loan breaches the BLO’s discretionary limit, it may be referred to the regional office/businesscentre. This referral procedure is also carried out between the regional and central office if theproposed loan exceeds the discretionary limit of the senior member of the regional team.Management of the loan, once approved, may return to the originating BLO or remain with theauthorising branch. Local business advisors can, however, act as a contact point.
3.3.1 How are loan applications assessed?
The bank’s aim when considering a loan evaluation is to approve loans with an acceptable balancebetween risk and return. Acceptability is also viewed within the context of the bank’s existing loanportfolio. The lender will apply - either formally or informally - what are known as ‘the canons ofgood lending’.
Bank loans fall into two categories - an existing client or a new-to-bank business. For existingclients, the performance of existing accounts and overdrafts are an important consideration. Abusiness approaching a new bank does not have this advantage/disadvantage. However, the newbank will want to know why the loan application is not being made to the bank that normallyhandles the company’s affairs.
BLOs often use mnemonics as checklists during loan assessments. The two most commonmnemonics used by BLOs are:
■ CAMPARI, which stands for:
- Character (of the loan applicant);
- Ability (to run the business);
- Margin (is the balance between risk and reward correct?);
- Purpose (do we understand the business?);
- Amount (is the loan amount adequate or excessive?);
- Repayment (how do we get our money back?);
- Insurance (what is the security?).
9
section
3
■ PARSERS, which stands for:
- Person (who is the loan applicant?);
- Amount (is the loan amount adequate or excessive?);
- Repayment (is the balance between risk and reward correct?);
- Security (what is the security?);
- Expediency (why should we provide loan finance?);
- Remuneration (what we will make on the deal?);
- Services (will we be able to sell other services?).
BLOs are particularly interested in quantifying ability to pay and security. Bankers therefore placeparticular emphasis on:
■ measures of cash flow - taken from profit and loss statements, balance sheets and flow offunds statements;
■ the value of current assets, especially the net realisable value from the balance sheet.
Cash flow generation is the paramount factor as this is how the company will service its loan.Profitability and track record are other important factors.
Use of financial ratios
It is often difficult to derive a full picture of financial performance from a profit and loss account ora balance sheet. Ratios are therefore often used to interpret accounts.
A series of financial ratios are used as performance indicators, eg cash flow cover, gearing, liquidityand interest cover. In addition to indicating how a business is performing, these ratios also providetrends and patterns. For example, the ratios can be compared to those from previous years’ and theaccounts of companies in the same industrial sector.
Other measures
Bankers also tend to use gearing and interest cover as measures of a company’s solvency.
Gearing is the ratio of debt (ie loans from all sources) to total company funds (shareholders, capital,reserves, etc). The higher the proportion of loan finance, the higher the gearing. Provided cash flowis steady and profits are fairly stable, then a higher gearing can generally be afforded. Ideallygearing should not be higher than 50%, although some lenders accept higher levels.
Interest cover measures the ability of a company to pay the interest on its loans. Banks thereforepay particular attention to how many times retained profits (before tax and interest deductions)exceed interest. If this figure is more than four, this is very good. If it is less than two, it may indicatepotential serviceability problems if interest rates rise or trading levels drop.
3.3.2 What information does the lender need?
Loan applicants are generally interviewed at the bank and at their business premises. An on-site visitgives the BLO the opportunity to confirm the impressions gained from the accounts.
Bankers collect the following information:
■ historical financial information about the company;
■ the project for which the loan is required, including forward financial projections;
■ the company’s management team.
Fig 4 lists the contents of a typical data pack accompanying any loan application. The ability toprovide this information and to offer sensible comments will indicate management competence.
10
section
3
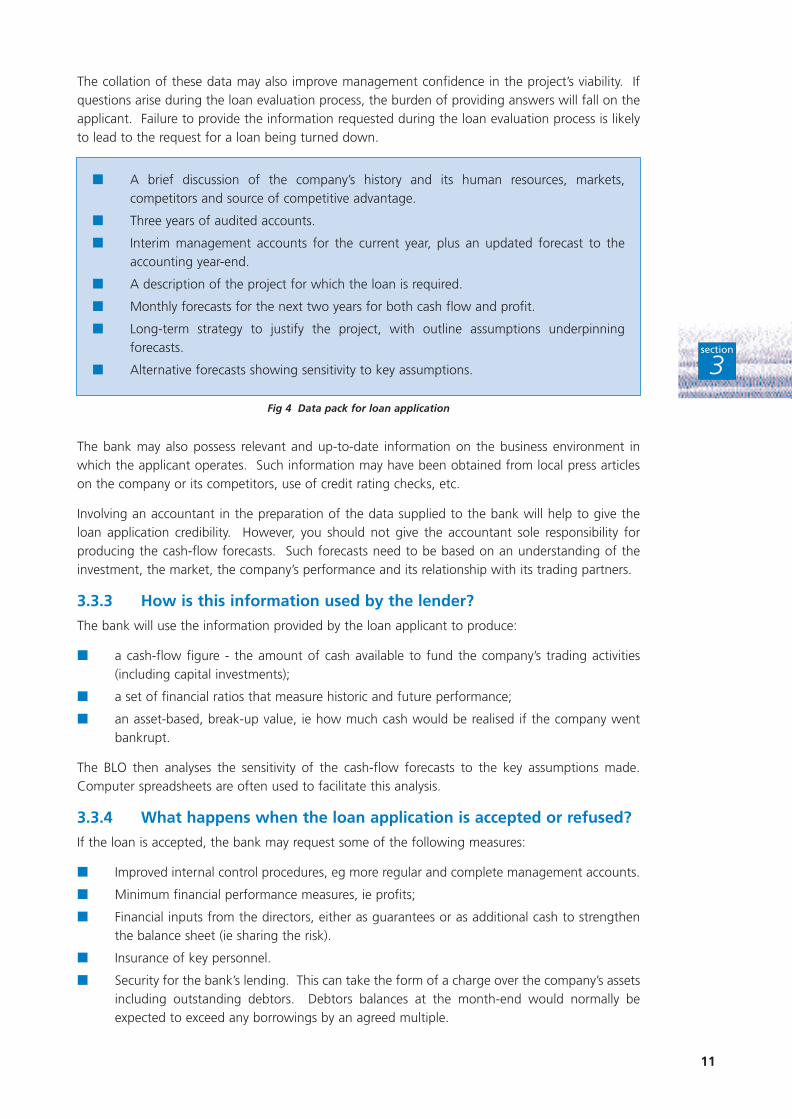
The collation of these data may also improve management confidence in the project’s viability. Ifquestions arise during the loan evaluation process, the burden of providing answers will fall on theapplicant. Failure to provide the information requested during the loan evaluation process is likelyto lead to the request for a loan being turned down.
The bank may also possess relevant and up-to-date information on the business environment inwhich the applicant operates. Such information may have been obtained from local press articleson the company or its competitors, use of credit rating checks, etc.
Involving an accountant in the preparation of the data supplied to the bank will help to give theloan application credibility. However, you should not give the accountant sole responsibility forproducing the cash-flow forecasts. Such forecasts need to be based on an understanding of theinvestment, the market, the company’s performance and its relationship with its trading partners.
3.3.3 How is this information used by the lender?
The bank will use the information provided by the loan applicant to produce:
■ a cash-flow figure - the amount of cash available to fund the company’s trading activities(including capital investments);
■ a set of financial ratios that measure historic and future performance;
■ an asset-based, break-up value, ie how much cash would be realised if the company wentbankrupt.
The BLO then analyses the sensitivity of the cash-flow forecasts to the key assumptions made.Computer spreadsheets are often used to facilitate this analysis.
3.3.4 What happens when the loan application is accepted or refused?
If the loan is accepted, the bank may request some of the following measures:
■ Improved internal control procedures, eg more regular and complete management accounts.
■ Minimum financial performance measures, ie profits;
■ Financial inputs from the directors, either as guarantees or as additional cash to strengthenthe balance sheet (ie sharing the risk).
■ Insurance of key personnel.
■ Security for the bank’s lending. This can take the form of a charge over the company’s assetsincluding outstanding debtors. Debtors balances at the month-end would normally beexpected to exceed any borrowings by an agreed multiple.
11
section
3Fig 4 Data pack for loan application
■ A brief discussion of the company’s history and its human resources, markets,competitors and source of competitive advantage.
■ Three years of audited accounts.
■ Interim management accounts for the current year, plus an updated forecast to theaccounting year-end.
■ A description of the project for which the loan is required.
■ Monthly forecasts for the next two years for both cash flow and profit.
■ Long-term strategy to justify the project, with outline assumptions underpinningforecasts.
■ Alternative forecasts showing sensitivity to key assumptions.

The measures requested will depend on individual circumstances.
A bank normally expects its funding to be secured on the assets of the company. If the value of thecompany’s assets is considered insufficient, a degree of personal commitment from the directors isrequired, ie via guarantees.
Loan monitoring will also be carried out using information from the company’s bank account; suchinformation is readily available and continually updated.
If the loan application is refused, it is important to ask why. If necessary, you can thenstrengthen and resubmit your case. BLOs are usually very helpful in providing advice and assistance.
3.4 GOOD PRACTICE FOR FINANCING CLEANER TECHNOLOGY
Banks do not generally apply special terms and conditions or vary their internal procedures whenassessing loan applications for investment in cleaner technology. The information required merelydepends on whether or not the company is an existing client. However, some banks are consideringoffering more favourable terms for cleaner technology investments.
There is a strong correlation between the size of a company and the scope of the accountinginformation it is able to produce. In general, small companies produce less frequent and lessdetailed information. This is not good practice. As a minimum, a company should produce:
■ a monthly cash-flow forecast covering the next six months in detail and a further six monthsin summary;
■ audited accounts (preferably within six months of year-end);
■ quarterly management accounts;
■ monthly debtors and creditors list - banks normally only take into account debtors with debtsof not more than three months old.
These datasets are used by the lender to assess both security (ie assets) and ability to pay (ie cash flow).
12
section
3
WHAT IS INVESTMENT APPRAISAL?
Investment appraisal attempts to provide some measure of project profitability. The aim is toensure that the right project is undertaken at the right time. For a project to proceed, the futurebenefits should compare favourably with the expenditure needed to achieve them.
All investment appraisal techniques rely on an analysis of projected cash flows:
■ inflows, ie revenues;
■ outflows, ie costs.
These cash flows need to be identified and forecast for the life of a project - the checklist in Fig 3will help you identify the cash flows for cleaner technology investment.
At any given time, a project’s profitability can be expressed simply as revenues minus costs.Increased profitability can be achieved by either higher revenues from increased sales/prices or lowercosts due to reduced raw material or utility consumption.
Investment appraisal can be applied when selecting:
■ a single, independent project, eg whether to introduce in-process recycling;
■ one project from a set of mutually alternative projects, eg end-of-pipe versus cleanertechnology;
■ a portfolio of projects within a limited budget, eg different cleaner technology opportunities.
What does investment appraisal involve?
Investment appraisal of any project generally consists of four stages, ie:
■ identification and forecasting of future cash flows;
■ adjustment of the cash flow to take account of any associated risks;
■ discounting these cash flows to allow for the time value of money;
■ assessing project profitability via proven investment appraisal techniques.
These stages are described in the following Sections.
THE ROLE OF RISK ANALYSIS
Cash flow forecasts can never be made with complete certainty as all projects are subject to risk oruncertainty. Examples associated with technology-based projects include:
■ What if capital costs double?
■ What if operating costs increase?
■ What if the supplier ceases trading?
■ What if the project completion date is delayed?
■ What if throughput is reduced?
■ What if raw materials have to be changed?
13
appx
A1
I N V E S T M E N T A P P R A I S A LT E C H N I Q U E S
Appendix 1

In these and similar situations, the financial viability of the project will be lower than anticipated.Risk analysis attempts to quantify this uncertainty in future cash flows.
Uncertainty can be dealt with by either adjusting the forecast cash flows through probabilityassessment or accounting for it while assessing project profitability. The best way is to quantify riskand adjust the cash flows accordingly. Use of spreadsheets for investment appraisal simplifies thetask of sensitivity analysis.
Sensitivity analysis can also be used to explore the effects on a project’s economic viability ofuncertainty in different areas, eg predicted operating costs.
WHY DISCOUNT FUTURE CASH FLOWS?
The value of money is time dependent, ie the value of money in five years’ time will not be the sameas it is today. Cash flows at different points in time are therefore not directly comparable. To makethem comparable and therefore usable in investment appraisal, cash flows have to be converted toequivalent values - all at the same point in time. This is achieved by discounting all future cash flowsto the present by multiplying by the discount factor. The ‘present’ is either the time of theevaluation or the start of the project.
The discount factor, which depends on the time (t) when the cash flow occurs and the investmentcost (i), can be calculated using the formula:
1
(1+i)t
The cost of capital depends on how the project is to be financed (see Section 3). For example,assuming a project is to be financed by a loan at an interest rate of 5%, the cash flow in year 5 of£100 000 will have a present value of 100 000 x 1/(1+0.1)5, ie £78 353.
THE MAIN INVESTMENT APPRAISAL TECHNIQUES
Investment appraisal techniques can be divided into two groups, depending on whether or not theforecast cash flows are discounted. The two groups are:
■ Traditional non-discounting techniques:
- payback period;
- return on capital employed.
■ Modern discounting techniques:
- net present value;
- internal rate of return.
Non-discounting techniques
Traditional non-discounting investment techniques such as payback period and the return on capitalemployed ignore the time value of money. This can present a misleading and more favourableoutcome.
14
appx
A1
Hillsyde Foundry used sensitivity analysis to assess the impact of lower sand throughput on theeconomic viability of installing a thermal reclamation unit. Even with a worst-case scenario ofa reduction in throughput of over 60%, the payback on the project was 1.5 years - still withinthe Company’s maximum allowable payback period. For more details see Cleaner TechnologyPays which is in the pocket at the back of this Good Practice Guide.
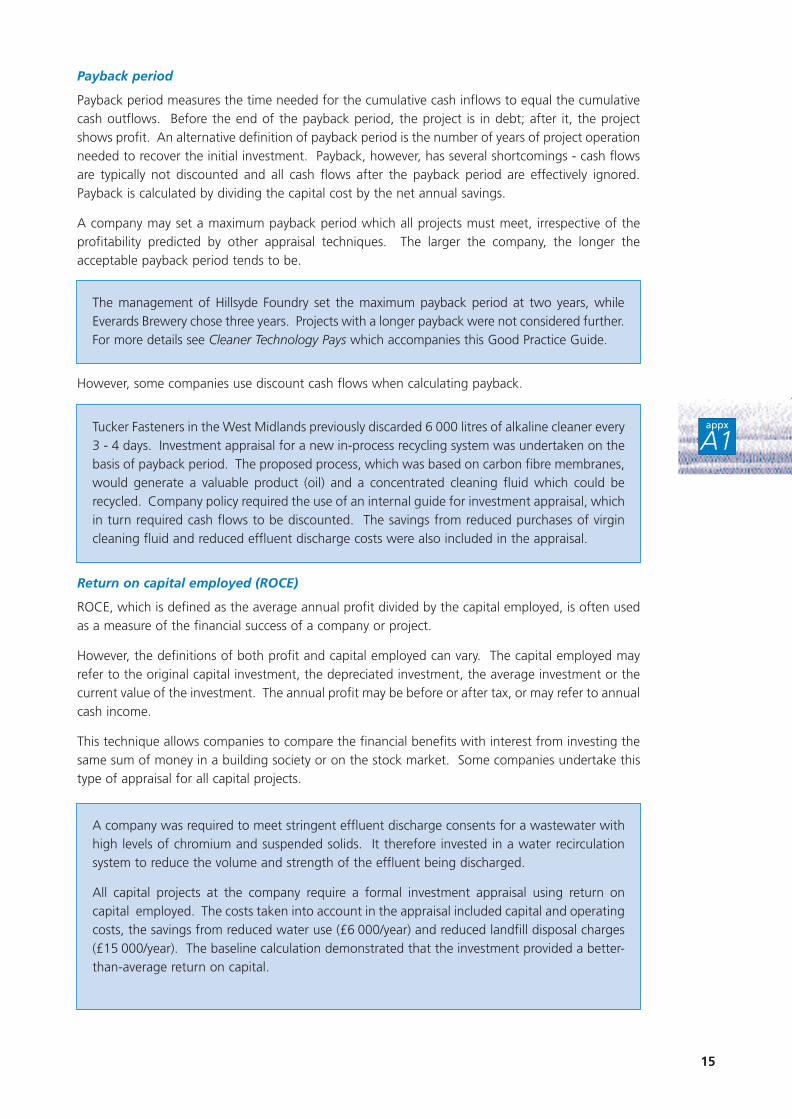
Payback period
Payback period measures the time needed for the cumulative cash inflows to equal the cumulativecash outflows. Before the end of the payback period, the project is in debt; after it, the projectshows profit. An alternative definition of payback period is the number of years of project operationneeded to recover the initial investment. Payback, however, has several shortcomings - cash flowsare typically not discounted and all cash flows after the payback period are effectively ignored.Payback is calculated by dividing the capital cost by the net annual savings.
A company may set a maximum payback period which all projects must meet, irrespective of theprofitability predicted by other appraisal techniques. The larger the company, the longer theacceptable payback period tends to be.
However, some companies use discount cash flows when calculating payback.
Return on capital employed (ROCE)
ROCE, which is defined as the average annual profit divided by the capital employed, is often usedas a measure of the financial success of a company or project.
However, the definitions of both profit and capital employed can vary. The capital employed mayrefer to the original capital investment, the depreciated investment, the average investment or thecurrent value of the investment. The annual profit may be before or after tax, or may refer to annualcash income.
This technique allows companies to compare the financial benefits with interest from investing thesame sum of money in a building society or on the stock market. Some companies undertake thistype of appraisal for all capital projects.
15
appx
A1
The management of Hillsyde Foundry set the maximum payback period at two years, whileEverards Brewery chose three years. Projects with a longer payback were not considered further.For more details see Cleaner Technology Pays which accompanies this Good Practice Guide.
Tucker Fasteners in the West Midlands previously discarded 6 000 litres of alkaline cleaner every3 - 4 days. Investment appraisal for a new in-process recycling system was undertaken on thebasis of payback period. The proposed process, which was based on carbon fibre membranes,would generate a valuable product (oil) and a concentrated cleaning fluid which could berecycled. Company policy required the use of an internal guide for investment appraisal, whichin turn required cash flows to be discounted. The savings from reduced purchases of virgincleaning fluid and reduced effluent discharge costs were also included in the appraisal.
A company was required to meet stringent effluent discharge consents for a wastewater withhigh levels of chromium and suspended solids. It therefore invested in a water recirculationsystem to reduce the volume and strength of the effluent being discharged.
All capital projects at the company require a formal investment appraisal using return oncapital employed. The costs taken into account in the appraisal included capital and operatingcosts, the savings from reduced water use (£6 000/year) and reduced landfill disposal charges(£15 000/year). The baseline calculation demonstrated that the investment provided a better-than-average return on capital.
Discounting techniques
Net present value (NPV)
Capital invested in a project cannot be invested elsewhere to earn profits in, say, an interest-bearingbank account. For example, £1 received now can be re-invested immediately to earn more profits;thus it is worth more than £1 received in five years’ time. This principle of the ‘time value of money’represents the ‘opportunity cost’ of investing money in a project when it could be generating moreprofit if invested elsewhere.
NPV is an important investment appraisal technique because it accounts for the time value ofmoney. NPV combines - in a single number - all the future annual cash flows occurring over the lifeof the project.
NPV has the following advantages:
■ incorporating the time value of money;
■ providing a direct measure of project profitability;
■ the ability to cope with unorthodox, changing and uncertain cash flows;
■ including cash flows over an extended time period.
A project which is economically viable in terms of generating a profit will have an NPV greater thanzero. Projects are generally selected according to the size of this value.
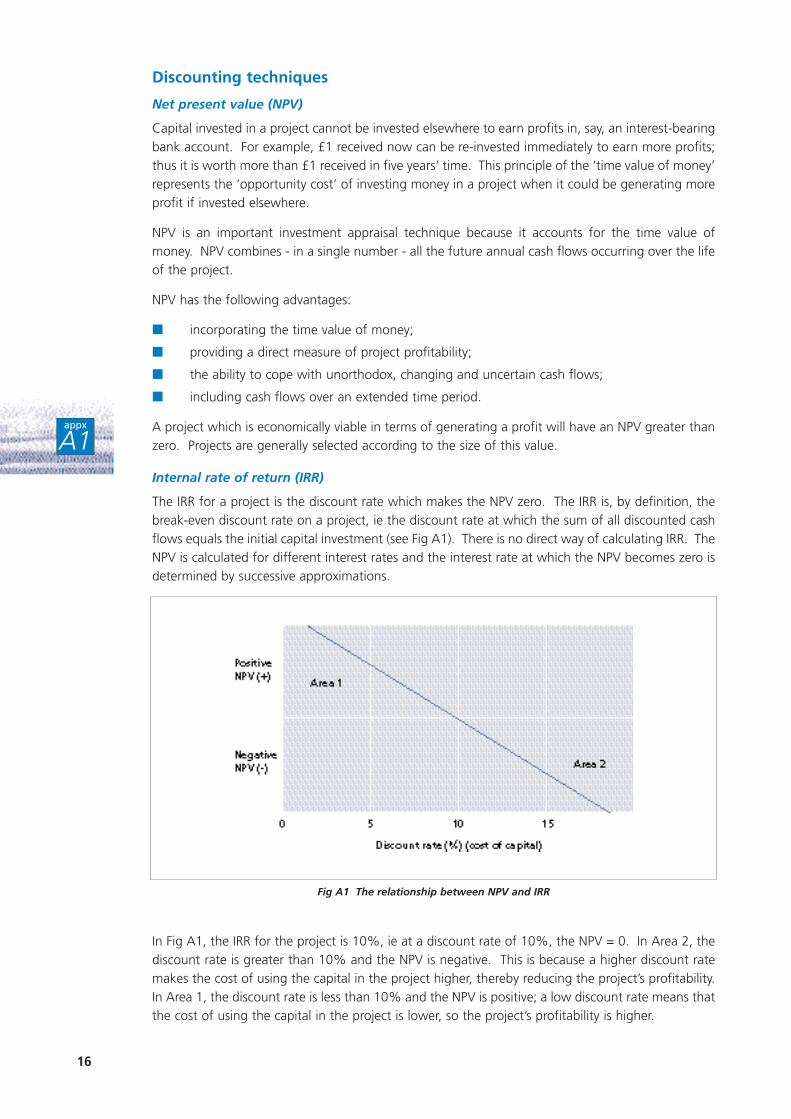
Internal rate of return (IRR)
The IRR for a project is the discount rate which makes the NPV zero. The IRR is, by definition, thebreak-even discount rate on a project, ie the discount rate at which the sum of all discounted cashflows equals the initial capital investment (see Fig A1). There is no direct way of calculating IRR. TheNPV is calculated for different interest rates and the interest rate at which the NPV becomes zero isdetermined by successive approximations.
In Fig A1, the IRR for the project is 10%, ie at a discount rate of 10%, the NPV = 0. In Area 2, thediscount rate is greater than 10% and the NPV is negative. This is because a higher discount ratemakes the cost of using the capital in the project higher, thereby reducing the project’s profitability.In Area 1, the discount rate is less than 10% and the NPV is positive; a low discount rate means thatthe cost of using the capital in the project is lower, so the project’s profitability is higher.
16
appx
A1
Fig A1 The relationship between NPV and IRR

Current practice in investment appraisal
Table A1 illustrates the relative importance given by large and medium-sized companies to the maininvestment appraisal techniques. The techniques are ranked from 1 (most important) to 5 (leastimportant). Table A1 shows that large companies tend to favour IRR; payback is often used as aninitial screening technique.
Medium companies Large companies All companies
(£10 - £30 million (over £30 million
turnover) turnover)
Payback period 1.5 2.5 1.9
Internal rate of return 2.8 1.8 2.3
Net present value 3.6 2.8 3.1
Intuitive judgement by management 2.5 3.6 3.2
Return on capital employed 2.8 3.3 3.2
Source: A Survey of Management Accounting Practices in UK Manufacturing Companies, ACCA (1993)1 = Most important; 5 = Least important
Table A1 Ranking of investment appraisal techniques
Smaller companies tend to favour payback period as their main investment appraisal technique,combined with intuitive judgement by management of project profitability. Insistence of shortpayback periods - typically less than two years - is due to the importance of cash flow for smallerbusinesses. Measures relating to cash flow are therefore often more important to these companiesthan financial indicators of absolute or relative profitability. Smaller companies commonlyincorporate risk into their investment appraisal by adjusting the acceptable payback period andforecasting conservative cash flows.
As the size of the capital investment increases, so does the likelihood that more complex investmentappraisal techniques will be applied.
THE ADVANTAGES/DISADVANTAGES OF THE MAIN INVESTMENTAPPRAISAL TECHNIQUES
The four main investment appraisal techniques can be summarised as follows:
■ payback period measures the time taken in months or years to break even and thus for theproject to be in ‘profit’, ie when revenues exceed costs;
■ ROCE provides a measure of relative ‘profitability’ in %;
■ NPV provides an absolute measure of ‘profit’ in £;
■ IRR represents the rate of interest that the capital used for the project would have to earn tobe a better investment.
The relative strengths of the four techniques are summarised in Table A2 (overleaf).
17
appx
A1
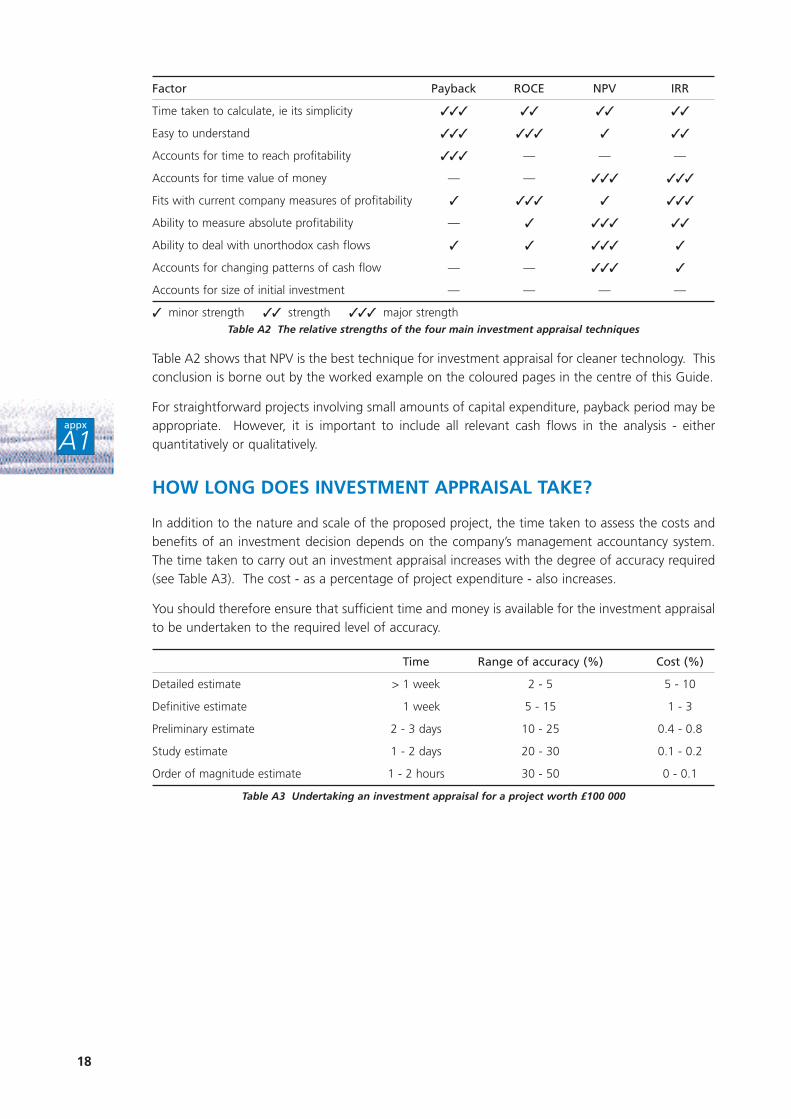
Factor Payback ROCE NPV IRR
Time taken to calculate, ie its simplicity ✓✓✓ ✓✓ ✓✓ ✓✓
Easy to understand ✓✓✓ ✓✓✓ ✓ ✓✓
Accounts for time to reach profitability ✓✓✓ — — —
Accounts for time value of money — — ✓✓✓ ✓✓✓
Fits with current company measures of profitability ✓ ✓✓✓ ✓ ✓✓✓
Ability to measure absolute profitability — ✓ ✓✓✓ ✓✓
Ability to deal with unorthodox cash flows ✓ ✓ ✓✓✓ ✓
Accounts for changing patterns of cash flow — — ✓✓✓ ✓
Accounts for size of initial investment — — — —
✓ minor strength ✓✓ strength ✓✓✓ major strengthTable A2 The relative strengths of the four main investment appraisal techniques
Table A2 shows that NPV is the best technique for investment appraisal for cleaner technology. Thisconclusion is borne out by the worked example on the coloured pages in the centre of this Guide.
For straightforward projects involving small amounts of capital expenditure, payback period may beappropriate. However, it is important to include all relevant cash flows in the analysis - eitherquantitatively or qualitatively.
HOW LONG DOES INVESTMENT APPRAISAL TAKE?
In addition to the nature and scale of the proposed project, the time taken to assess the costs andbenefits of an investment decision depends on the company’s management accountancy system.The time taken to carry out an investment appraisal increases with the degree of accuracy required(see Table A3). The cost - as a percentage of project expenditure - also increases.
You should therefore ensure that sufficient time and money is available for the investment appraisalto be undertaken to the required level of accuracy.
Time Range of accuracy (%) Cost (%)
Detailed estimate > 1 week 2 - 5 5 - 10
Definitive estimate 1 week 5 - 15 1 - 3
Preliminary estimate 2 - 3 days 10 - 25 0.4 - 0.8
Study estimate 1 - 2 days 20 - 30 0.1 - 0.2
Order of magnitude estimate 1 - 2 hours 30 - 50 0 - 0.1
Table A3 Undertaking an investment appraisal for a project worth £100 000
18
appx
A1

Some companies may wish to use payback period to provide an indication of the timing of futurecash flows.
19
appx
A1
REMEMBER TO:
Ensure all internal costs and benefits are taken into account in the appraisalprocess.
Allocate environmental costs to the processes/products/departments where theyoriginate rather than to overheads.
Use NPV to provide a direct measure of a project’s profitability. NPV takes accountof the ‘time value’ of money.
A number of other sources of help and information on cleaner technology and financial appraisalare available. The following list, which is not exhaustive, is intended to help you make the bestchoices for your company.
CLEANER TECHNOLOGY
■ Environmental Technology Best Practice Programme publications, available free ofcharge through the Environmental Helpline on 0800 585794. Fax: 01235 463804. e-mail: [email protected]. These include:
- Good Practice Guide (GG37) Cost-effective Separation Technologies for MinimisingWastes and Effluents;
- Good Practice Guide (GG54) Cost-effective Membrane Technologies for MinimisingWastes and Effluents.
■ United Nations Environment Programme (UNEP) Industry and Environment CleanerProduction (CP) Programme sector guides to cleaner production:
- Trainer Workbook on Cleaner Production in Leather Tanning;
- Trainer Workbook on Cleaner Production in the Brewing Sector;
- Trainer Workbook on Cleaner Production in Textile Wet Processing;
- Cleaner Production Industry Sector Guide on Leather Tanning;
- Cleaner Production Industry Sector Guide on Textiles;
- Cleaner Production Industry Sector Guide on Metal Finishing/Manufacturing;
- Cleaner Production Industry Sector Guide on Beverages and Dairy Products;
- Cleaner Production Industry Sector Guide on Meat, Fish, Fruit, and Vegetable Processing.
The first three guides in this series were published at the end of 1996. UNEP IE publications can beordered from SMI (Distribution Services) Ltd, PO Box 119, Stevenage, Hertfordshire SG1 4TP. Tel: 01438 748111. Fax: 01438 748844. e-mail: [email protected]
INVESTMENT APPRAISAL AND BANK LENDING
■ Energy Efficiency Best Practice Programme publications include:
- Good Practice Guide 69 Investment Appraisal for Industrial Energy Efficiency. This Guideis available from the Energy Efficiency Enquiries Bureau, ETSU. Tel: 01235 436747. Fax: 01235 433066. e-mail: [email protected]
- Good Practice Guide 165 Financial Aspects of Energy Management in Buildings. ThisGuide is available from the Enquiries Bureau, BRECSU. Tel: 01923 664258. Fax: 01923664787. e-mail: [email protected]
Information on investment appraisal and bank lending is available from many other sources,including:
■ The Chartered Institute of Bankers (Tel: 01227 762600);
■ The Association of Chartered Certified Accountants (Tel: 0171 242 6855);
■ The Chartered Institute of Management Accountants (Tel: 0171 637 2311);
■ The Institution of Chemical Engineers (Tel: 01788 578214).20
appx
A2
S O U R C E S O F F U R T H E R H E L PA N D I N F O R M AT I O N
Appendix 2

GUIDANCE ON BUSINESS MANAGEMENT
■ High Street Banks provide general advice on business planning and how to apply forfinance.
■ The Department of Trade and Industry (DTI) has produced a number of useful guides andtexts on environmental protection, finance and production for UK companies. For acatalogue of DTI Publications in Print, contact the DTI Publications Unit, 1 Victoria Street,London SW1H 0ET. Tel: 0171 215 1770.
■ The DTI Managing in the 90s Publications provide extensive help to companies onmanagement and production in the 1990s. They include:
- Money and Machines, URN 95/555. Feb 1995.
- Information Means Money, URN 95/549. Mar 1995.
These publications are available free to UK businesses from DTI M90s Publications, ADMAIL 528,London SW1W 8YT. Tel: 0171 510 0144. Fax: 0171 510 0197.
■ The DTI Small Firms Publications list includes several useful publications on finance,including:
- A Guide for Help to Small Firms, URN 96/750. May 1996.
- A Guide to Factoring and Discounting, URN 95/685. Jun 1995.
- A Guide to Hire Purchase and Leasing, URN 95/684. Jun 1995.
- Finance Without Debt: A Guide to Sources of Venture Capital under £250 000,URN 96/553. Feb 1996.
These publications are available free to UK businesses from DTI Small Firms Publications, ADMAIL528, London SW1W 8YT. Tel: 0171 510 0169. Fax: 0171 510 0197.
For further advice and details of other sources of information on cleaner technology and investment appraisal, contact the
Environmental Helpline on 0800 585794.
Fax: 01235 463804. e-mail: [email protected]
World wide web: http://www.etsu.com/ETBPP/
21
appx
A2

FINANCE LEASE AGREEMENT
A finance lease agreement is merely a rental agreement for a fixed period - usually called the primaryperiod. The agreement transfers most of the risks and rewards of ownership of the asset to thecustomer without making the customer the legal owner.
The agreement is between the finance company (lessor/owner) and the customer (lessee/user).
At the end of the primary period, there is usually an option for the customer to continue to rent theequipment for the payment of an annual nominal/peppercorn rent.
In the event of the equipment being sold, the finance company allows the customer to retain themajority of the sale proceeds (usually 95%).
Title of the equipment can never pass to the customer, ie the equipment must always be sold to anindependent third party on termination of the lease.
Capital allowances are claimed by the finance company.
OPERATING LEASE/CONTRACT HIRE AGREEMENT
An operating lease agreement is a rental agreement for a fixed period of time, sometimes inclusiveof maintenance, eg vehicle contract hire or equipment rental. The risks and rewards of ownershipremain with the finance company.
The agreement is between the finance company and the customer.
Rental payments made under an operating lease agreement are usually lower than under a financelease or hire purchase agreement. This is because the finance company is taking account of theanticipated proceeds from the sale of the equipment.
At the end of the lease period, the equipment is returned to the finance company - usually at nofurther risk or cost to the customer.
The finance company usually, but not always, sells the equipment and benefits from any profit orabsorbs any loss.
Title of the equipment never passes to the customer.
HIRE-PURCHASE/LEASE PURCHASE AGREEMENT
A hire-purchase (HP)/lease purchase agreement is ‘an agreement to hire with an option to purchase’.The risks and rewards of ownership remain with the borrower.
An HP agreement is between the finance company (owner) and the borrower (hirer).
Title of the asset covered by the HP agreement remains with the finance company until such timeas all payments due under the agreement have been made and the option to purchase fee includedwith the last payment has been paid.
Once title has passed there is no further liability by the borrower under the HP agreement.
Capital allowances are claimed by the borrower.22
appx
A3
D E F I N I T I O N S O F A S S E TF I N A N C E M E T H O D S
Appendix 3


The Environmental Technology Best Practice Programme is a joint Department of Trade and
Industry and Department of the Environment initiative. It is managed by AEA Technology plc
through ETSU and the National Environmental Technology Centre.
The Programme offers free advice and information for UK businesses and promotes
environmental practices that:
■ increase profits for UK industry and commerce;
■ reduce waste and pollution at source.
To find out more about the Programme please call the Environmental Helpline on freephone
0800 585794. As well as giving information about the Programme, the Helpline has access to
a wide range of environmental information. It offers free advice to UK businesses on technical
matters, environmental legislation, conferences and promotional seminars. For smaller
companies, a free counselling service may be offered at the discretion of the Helpline Manager.
FOR FURTHER INFORMATION, PLEASE CONTACT THE ENVIRONMENTAL HELPLINE
0800 585794e-mail address: [email protected]
World wide web: http://www.etsu.com/ETBPP/