Environmental statement 2012 - European Economic and ... · Environmental statement 2012 Figures...
40
Environmental statement 2012 Figures for 2011 European Economic and Social Committee Committee of the Regions 1 ocial Committe ee Regions d S So the R n n n Co ro o o o o o p pe e ea a a a a a a a a a an n n n n n n n n n n C C Eu n n n E E E E E Ec c c c c c c c co o o o o ono om m mi ic c omm m m m m m m m mi itt t tee c c c a and e of t d S n n n n r rop p p p p pe e e e e e e e ea a a a a a a a a an n n n n n n n Eu n n n E E E E Ec c c c c co o o o o o onom mi ic c c c a a a and REG.NO.BE-BXL-27
Transcript of Environmental statement 2012 - European Economic and ... · Environmental statement 2012 Figures...
Environmentalstatement
2012Figures for 2011
European Economic and Social Committee
Committee of the Regions
1
ocial Committeee
Regions
d SSo
the R
nnn
Co
rooooooppppeeeaaaaaaaaaaannnnnnnnnnn
CC
Eu nnn EEEEEEcccccccccoooooonoommmiicc
ommmmmmmmmmiittttee
ccc aand
e of t
d SnnnnrroppppppeeeeeeeeeaaaaaaaaaannnnnnnnEu nnn EEEEEccccccooooooonommiicccc aaaand
REG.NO.BE-BXL-27

Acronyms
CoR: Committee of the Regions
EESC: European Economic and Social Committee
EMAS: Eco-Management and Audit Scheme
PMC: Plastic, metal and drink cartons
EMS: Environmental management system
Buildings:
JDE: Jacques Delors, rue Belliard 99-101, Brussels
BvS: Bertha von Suttner, rue Montoyer 92-102, Brussels
B68: Belliard 68, rue Belliard 68, Brussels
TRE: Trèves, rue de Trèves 74, Brussels
REM: Remorqueur, rue Remorqueur 93, Brussels
NACE Code (statistical classification of economic
activities in the European Community)
The Committees’ NACE code is NACE 99 (activities
of extraterritorial organizations and bodies)
EMAS contact address within the EESC and the CoR
Silvia Staffa (Project manager EMAS)
Rue Belliard 99-101, 1040 Bruxelles – Tél.: +32 (0)2 546 83 78 – E-mail: [email protected]
3 | Environmental statement 2012
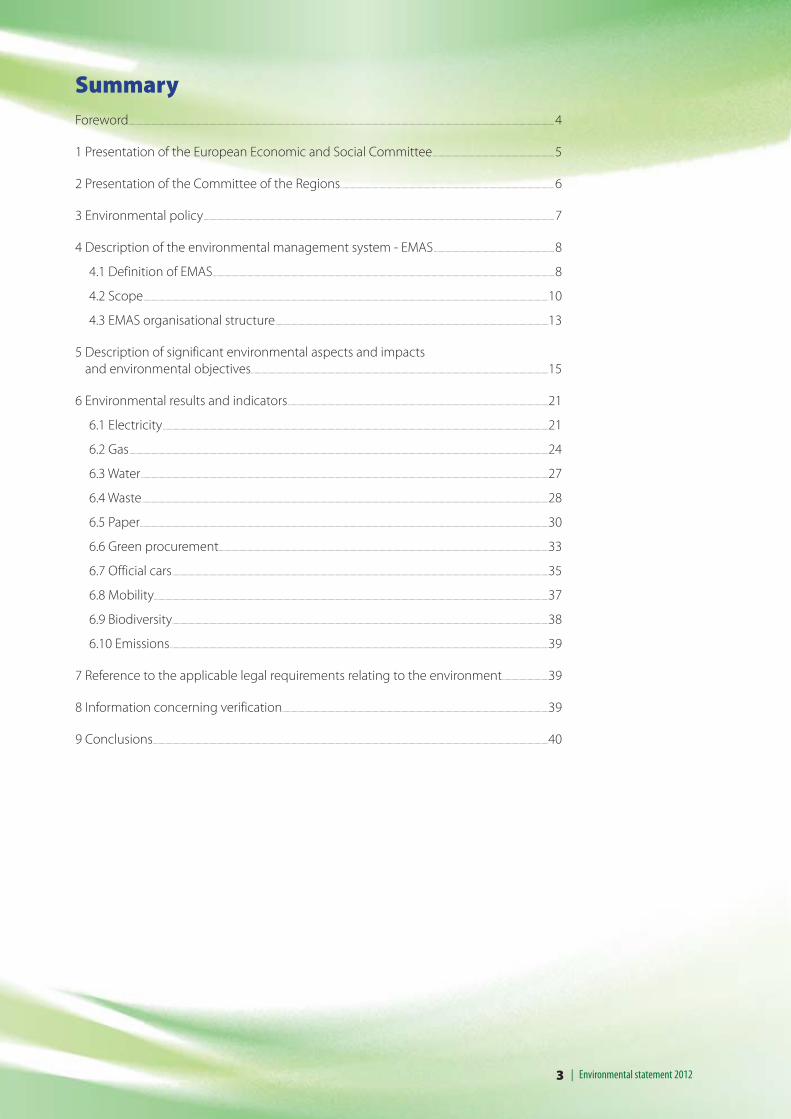
SummaryForeword ................................................................................................................................................................................................................................................................................................................................................................................4
1 Presentation of the European Economic and Social Committee .........................................................................................................5
2 Presentation of the Committee of the Regions .........................................................................................................................................................................................6
3 Environmental policy ...............................................................................................................................................................................................................................................................................................................7
4 Description of the environmental management system - EMAS ........................................................................................................8
4.1 Definition of EMAS .......................................................................................................................................................................................................................................................................................................8
4.2 Scope ..............................................................................................................................................................................................................................................................................................................................................................10
4.3 EMAS organisational structure ............................................................................................................................................................................................................................................13
5 Description of significant environmental aspects and impacts
and environmental objectives .................................................................................................................................................................................................................................................................15
6 Environmental results and indicators .................................................................................................................................................................................................................................21
6.1 Electricity .............................................................................................................................................................................................................................................................................................................................................21
6.2 Gas ..........................................................................................................................................................................................................................................................................................................................................................................24
6.3 Water ................................................................................................................................................................................................................................................................................................................................................................27
6.4 Waste ...............................................................................................................................................................................................................................................................................................................................................................28
6.5 Paper .................................................................................................................................................................................................................................................................................................................................................................30
6.6 Green procurement .............................................................................................................................................................................................................................................................................................33
6.7 Official cars .....................................................................................................................................................................................................................................................................................................................................35
6.8 Mobility .....................................................................................................................................................................................................................................................................................................................................................37
6.9 Biodiversity .....................................................................................................................................................................................................................................................................................................................................38
6.10 Emissions .......................................................................................................................................................................................................................................................................................................................................39
7 Reference to the applicable legal requirements relating to the environment ........................................39
8 Information concerning verification ......................................................................................................................................................................................................................................39
9 Conclusions ......................................................................................................................................................................................................................................................................................................................................................40

4Environmental statement 2012 |
ForewordThe general public are well aware of the EU’s commitment to sustainable development
and combating climate change. Two EU consultative bodies, the European Economic and
Social Committee and the Committee of the Regions, are also involved in these efforts.
Less well-known, perhaps, is the determination of the European institutions to reduce the
environmental impact of their own administrative activities and buildings[1] .
This determination is reflected within the Committees by numerous environmental
measures enabling them to significantly reduce the environmental impact of their 1400
employees and some 100 000 m² of buildings.
And, results have actually been achieved! This is shown by the environmental indicators
we have been monitoring since 2008 - of these, the most impressive are a 16% drop in
electricity consumption, 28% in gas consumption and 20% in paper consumption. The
following pages explain these results in greater detail.
Thanks to the efforts of all Committee staff and strong support from the presidents and
secretaries-general, in December 2010 the Committees obtained EMAS registration and
ISO 14001 certification. This confirms that the Committees have set up an effective and
reliable environmental management system, and that they have chosen to operate as
sustainably as possible.
The Committees and their staff will of course continue working hard to maintain and
improve these results. The improvement process is continuing, and is well and truly
established!
Cornelis Bentvelsen
Chairman of the EMAS steering committee and logistics director
Highlights of 2011
Gas -28% compared to 2008
Electricity -16% compared to 2008
Water -11% compared to 2009
Paper -20% compared to 2009
Waste -22% compared to 2010
Environmental cleaning products 68% of the total quantity used
Plant-care products (green spaces) 100% environmental since 2010
Environmental certification EMAS, ISO 14001, Eco-dynamic Enterprise and Sustainable Canteen (since beginning of 2012)
[1] It should be pointed out here that the two Committees are jointly involved in the EMAS project
because they occupy and manage several buildings together in Brussels besides sharing joint translation
and logistics services (infrastructure, security, IT, catering and printing). It therefore makes sense for them
to establish a joint system of environmental management.

5 | Environmental statement 2012
1. Presentation of the European Economic and Social Committee
The European Economic and Social Committee (EESC) is a consultative body set up
by the Rome Treaties in 1957. It ensures representation of European citizens belonging
to business organisations, trade unions, professional associations and civic groups, which
together make up organised civil society. The Committee is therefore well placed to act
as an intermediary between organised civil society and the European institutions, in
particular the Council of the European Union, the European Parliament and the European
Commission.
The 344 EESC members, who are appointed by national governments represented in
the Council, come from very different backgrounds. They are split into three groups:
"Employers", "Employees", and "Various Interests". As well as belonging to a group,
members also belong to two subject-based "sections" (economy, agriculture, social affairs,
etc.). They bring the Committee a wide range of experience. Living in their respective
countries and working in various economic, social or civic sectors, they are in day-to-day
contact with their fellow European citizens. They are therefore in a position to understand
their wishes and concerns. A general secretariat with around 800 staff helps the members
carry out their duties.
The EESC draws up opinions for the European institutions with the general interest in
mind, by trying to reach consensus on the basis of an amalgamation of initial positions
which are often different, and at times contradictory. It is mandatory for the EESC to be
consulted on those issues stipulated in the Treaties and in all cases where the institutions
deem it appropriate. It can also be consulted on an exploratory basis by one of the other
institutions, or can itself take the initiative to issue opinions. The EESC thus enables
representatives of organised civil society to participate in EU policy and decision-making.
This process, and the continual quest for compromise, bring together representatives
of public and private-sector employers' organisations (Group I), employees (Group II),
but also - and this is the distinguishing feature of the EESC - other sections of organised
civil society (farmers, the professions, consumers, environmentalists, associations
combating exclusion and poverty, young people, families, the elderly, women, people
with disabilities, etc).

6Environmental statement 2012 |
2.2 Presentation of the Committee of the Regions
Established in 1994, the Committee of the Regions (CoR) is the EU’s political assembly of
regional and local representatives. Its mission is to involve regional and local authorities
and the communities they represent in the EU’s decision-making process and to inform
them about EU policies.
The Committee of the Regions comprises 344 members from the 27 Member States and
an equal number of alternates. All of them are nominated by the Member States and
appointed for five years by the Council of the EU.
The CoR was established for two main reasons. Firstly, over 70% of EU legislation is
implemented by local and regional authorities, and it therefore makes sense to involve
their representatives in the process of drawing up new EU laws. Secondly, involvement
of local levels in EU decision-making is a way of giving such decisions greater legitimacy
and bringing Europe closer to its citizens.
Under the European Treaties, the European Commission, the Council and the European
Parliament are required to consult the CoR on any proposal of relevance to regions and
towns or cities. The CoR can also publish opinions on its own initiative, which enables it
to put issues on the EU agenda.
It can appeal to the EU Court of Justice if its rights are infringed, or it believes that an EU
law violates the subsidiarity principle or fails to respect regional or local powers.

3. Environmental policy
8Environmental statement 2012 |
4. Description of the environmental management system - EMAS
4.1 Definition of EMAS
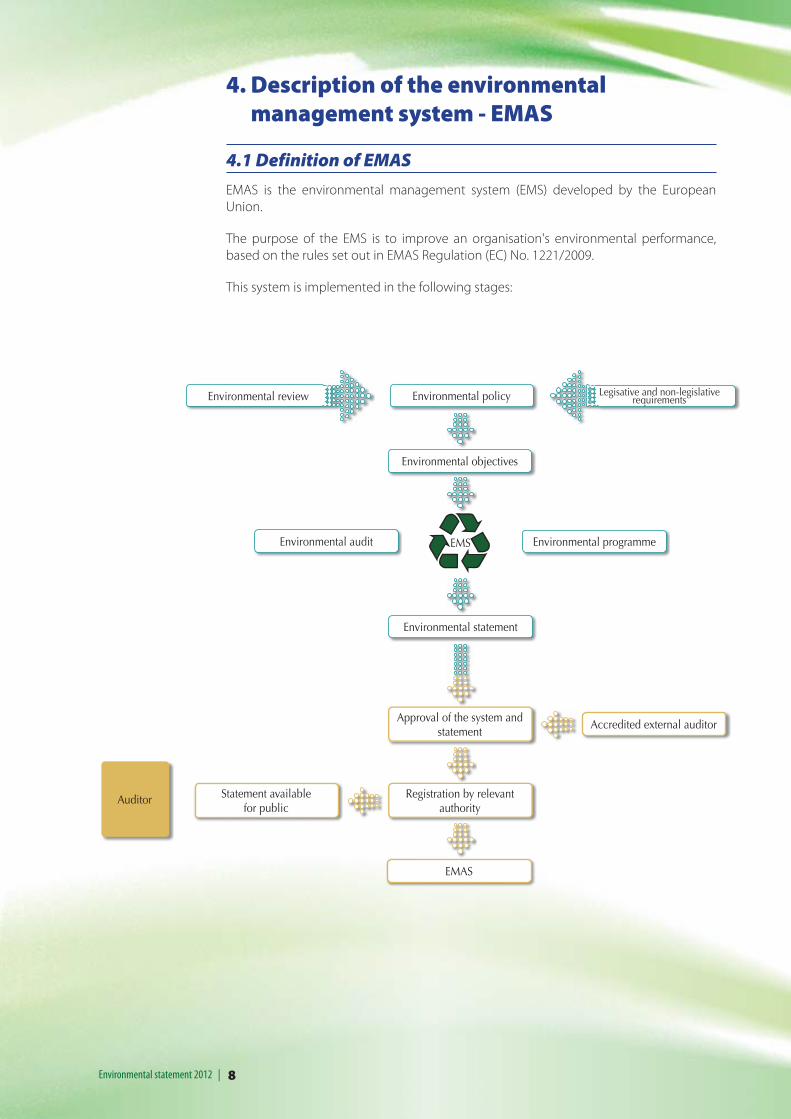
EMAS is the environmental management system (EMS) developed by the European
Union.
The purpose of the EMS is to improve an organisation's environmental performance,
based on the rules set out in EMAS Regulation (EC) No. 1221/2009.
This system is implemented in the following stages:
Environmental review
EMS
Environmental policy
Environmental objectives
Environmental programmeEnvironmental audit
Environmental statement
Accredited external auditor
Registration by relevantauthority
EMAS
Auditor
Approval of the system and statement
Statement availablefor public
Legisative and non-legislativerequirements
9 | Environmental statement 2012
The environmental review involves a detailed analysis of the Committees’ activities in
order to identify those which have a significant environmental impact. The most significant
impacts are identified using a points-based system, and improvement objectives are set
for them.
This points-based system uses the following criteria: how serious is the impact, how
frequently does it occur, and is it under control? In addition, all aspects covered by
environmental legislation are considered as significant.
The review distinguishes between direct[2] and indirect[3] environmental aspects. For
example, purchases and activities by subcontractors are described as indirect aspects.
They can be identified as significant or non-significant using the method described above.
To ensure that everyone in the Committees follows a similar approach, the Committees
have drawn up an “environmental policy” putting their commitment to the project on
an official basis.
Based on environmental policy and the results of the environmental review,
“environmental objectives” (expressed in the form of actions) are defined. These
objectives take into account legal and other requirements applicable to the Committees. In
order to be credible, these objectives must be translated into a performance requirement
which, wherever possible, should be quantified. The objectives are consolidated in an
“environmental programme” defining deadlines, those responsible, and resources for
achieving them. This programme is approved by the EMAS Steering Committee.
The environmental programme is then implemented by means of the actions specified.
At this stage, all members of the organisation need to work together so that the objectives
can be met. This stage also includes information and awareness-raising activities at all
levels. At the same time, official environmental practices are established (for example
waste sorting procedures) and disseminated among those concerned. The procedures
and environmental handbook [4] are available on the Committees’ intranet site.
Any organisational system must continuously develop, with regular checks enabling
shortcomings to be identified and overcome. In the case of the EMS, internal or external
audits are carried out. Cases of non-compliance (irregularities) with environmental
requirements are recorded in audit reports used as a basis for improvement measures.
The environmental statement (this document) is intended to inform the public of the
existence of an EMAS-compliant environmental management system while enabling
it to follow changes in our environmental performance. A new updated version of the
environmental statement is published every year after checking and approval by an
accredited organisation.
The final stage involves checking that the system is working properly. To ensure that the
audit on the Committees is credible, it is carried out by an independent auditor. Finally,
if all requirements of the EMAS Regulation have been met, the relevant authority in the
Brussels Capital Region, i.e. Bruxelles Environnement, registers the Committees.
With regard to the Committees, environmental auditor AIB-Vinçotte International audited
them and declared on 27/12/2011 that the Committees are in full compliance with the
[2] An environmental aspect associated with activities, products and services of the organisation itself
over which it has direct management control.
[3] An environmental aspect which can result from the interaction of an organisation with third parties
and which can to a reasonable degree be influenced by an organisation.
[4] A document summarising how the environmental management system works, with particular
reference to documentation and other components of the system.

10Environmental statement 2012 |
provisions of the EMAS III Regulation. As a result, we now have registration number BE-
BXL-000027 from the Brussels Environment Agency.
4.2 Scope
The scope of the environmental management system at the EESC and CoR is as follows:
• all staff working at the EESC and CoR - around 1 400 people;
• contractors occupying our premises: they are informed of our environmental
approach;
• EESC and CoR members: they are informed of EMAS activities, but are not obliged
to take part.
The Committees occupy and manage six buildings together in Brussels besides sharing
joint translation and logistics services (infrastructure, security, IT, catering and printing).
The buildings are situated in the Brussels European quarter in Brussels, an area mainly
devoted to administrative activity and office buildings.
The following five buildings are an integral part of the scope of EMAS:
Building
Gross
above
ground area
- m² -
Gross
underground
area
- m² -
Net car
parking area
- m² -
Number of
car parking
spaces
Occupants
2011Address
Jacques Delors (JDE) 36 379 15 284 10 167 292 525 Rue Belliard 99 – 101
Bertha von Suttner (BvS) 20 566 9 925 5 358 199 497 Rue Montoyer 92 – 102
Belliard 68 (B68) 7 305 1 322 687 28 226 Rue Belliard 68
Trèves (TRE) 6 091 2 108 1 143 43 130 Rue de Trèves 74
Remorqueur (REM) 2 325 371 - - 67 Rue Belliard 93
TOTAL 72 666 29 010 17 355 562 1 445 April 2011 data
The total number of occupants (April 2011 data) in the above table also includes
contractors as well as members with offices in the EESC and CoR buildings.
The Committees’ buildings also include a sixth building, the “Van Maerlant” (VMA, Rue Van
Maerlant/Van Maerlantstraat 2, Brussels), shared by the EESC and CoR with the European
Commission, which owns the building. This building is not included in the scope of
the environmental management system. However, CoR and EESC staff working in the
building (208 staff together with some members) must apply our procedures unless
there are other procedures required by the European Commission.
History of the buildings
Until June 2004, the Committees’ headquarters, administrative offices and meeting
rooms were located at No 2 rue Ravenstein, in the very heart of Brussels. Following several
enlargements of the European Union, the Ravenstein buildings had become too small
for the Committees, and it was decided to move in 2004 to new buildings at 99-101 rue
Belliard, in the European quarter.
11 | Environmental statement 2012
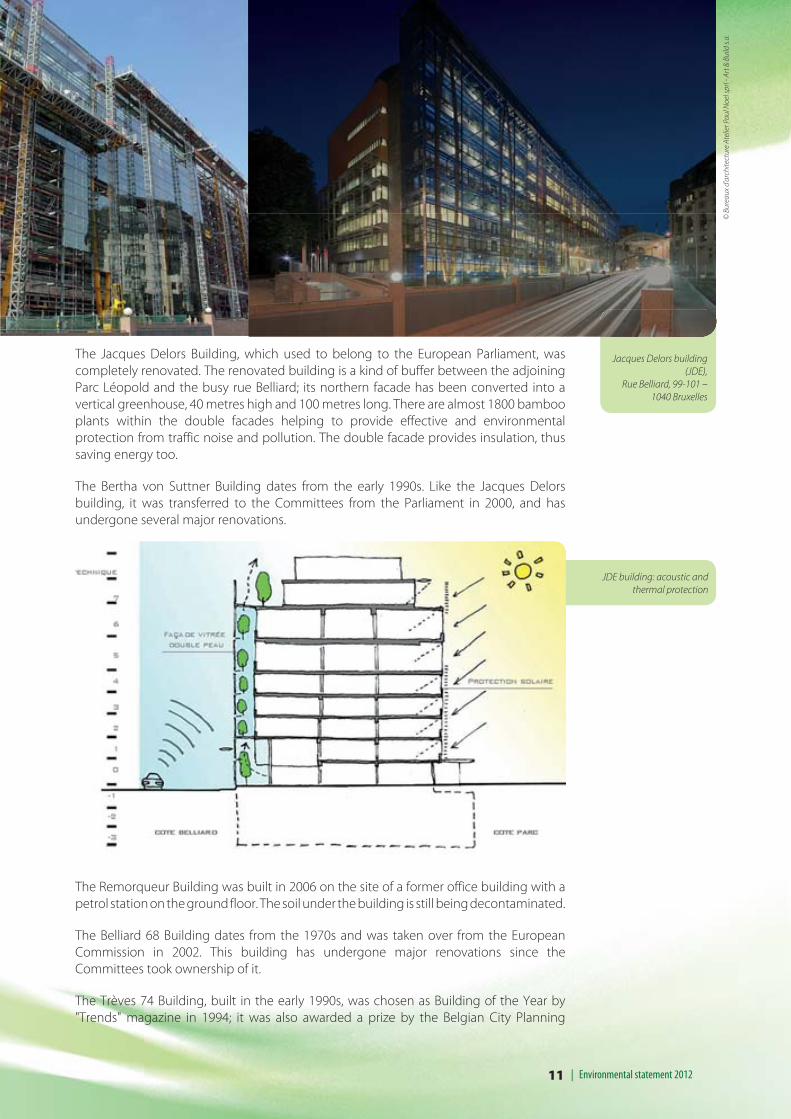
JDE building: acoustic and
thermal protection
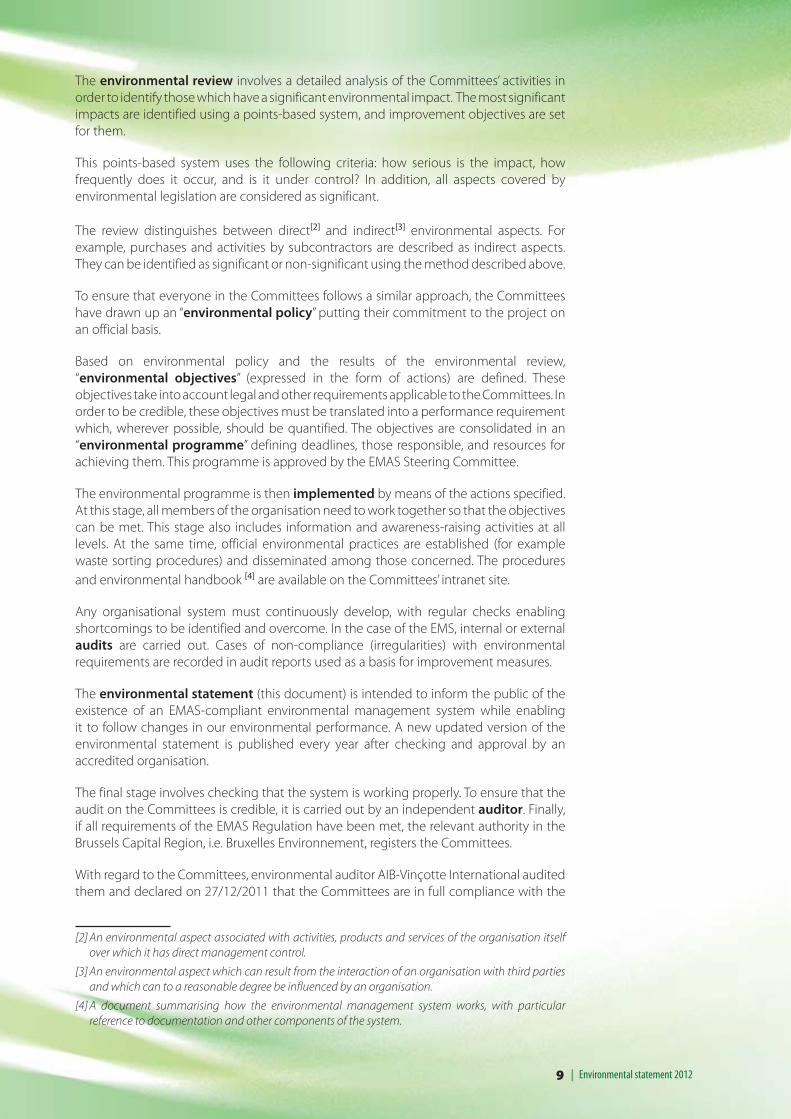
Jacques Delors building
(JDE),
Rue Belliard, 99-101 –
1040 Bruxelles
The Jacques Delors Building, which used to belong to the European Parliament, was
completely renovated. The renovated building is a kind of buffer between the adjoining
Parc Léopold and the busy rue Belliard; its northern facade has been converted into a
vertical greenhouse, 40 metres high and 100 metres long. There are almost 1800 bamboo
plants within the double facades helping to provide effective and environmental
protection from traffic noise and pollution. The double facade provides insulation, thus
saving energy too.
The Bertha von Suttner Building dates from the early 1990s. Like the Jacques Delors
building, it was transferred to the Committees from the Parliament in 2000, and has
undergone several major renovations.
The Remorqueur Building was built in 2006 on the site of a former office building with a
petrol station on the ground floor. The soil under the building is still being decontaminated.
The Belliard 68 Building dates from the 1970s and was taken over from the European
Commission in 2002. This building has undergone major renovations since the
Committees took ownership of it.
The Trèves 74 Building, built in the early 1990s, was chosen as Building of the Year by
"Trends" magazine in 1994; it was also awarded a prize by the Belgian City Planning
© B
ure
au
x d
’arc
hit
ectu
re A
telie
r Pa
ul N
oel
sp
rl -
Art
& B
uild
s.a
.
12Environmental statement 2012 |
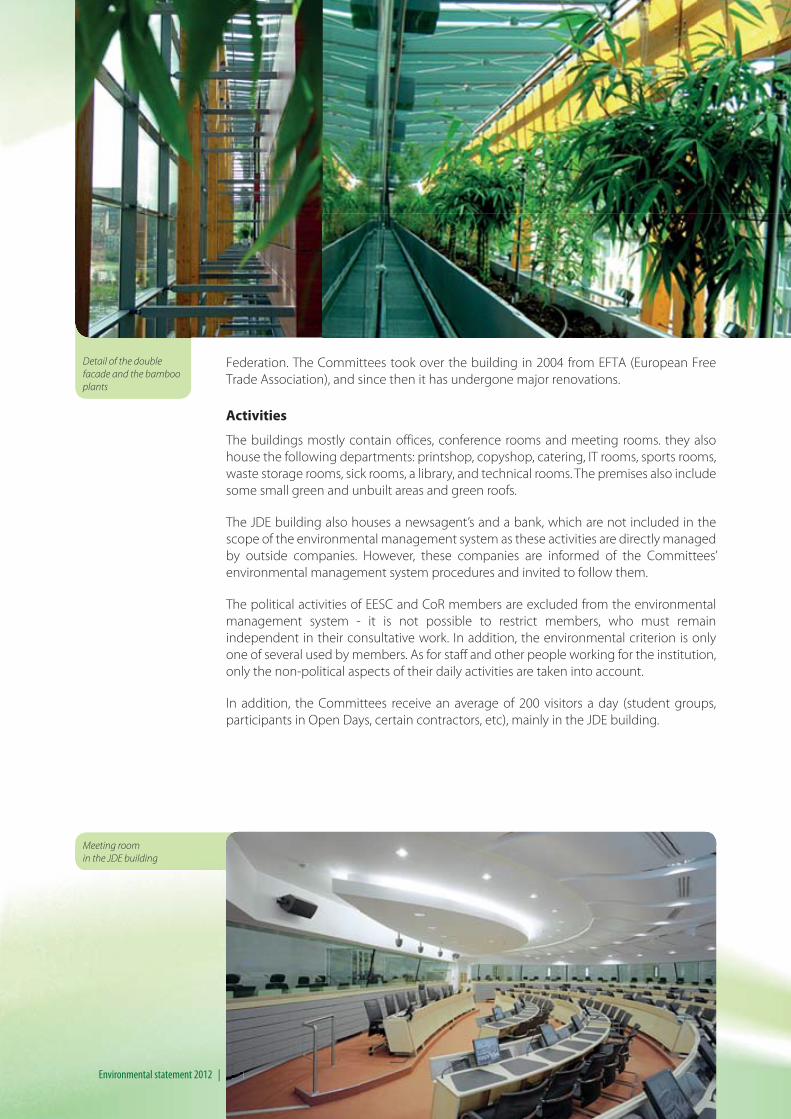
Meeting room
in the JDE building
Detail of the double
facade and the bamboo
plants
Federation. The Committees took over the building in 2004 from EFTA (European Free
Trade Association), and since then it has undergone major renovations.
Activities
The buildings mostly contain offices, conference rooms and meeting rooms. they also
house the following departments: printshop, copyshop, catering, IT rooms, sports rooms,
waste storage rooms, sick rooms, a library, and technical rooms. The premises also include
some small green and unbuilt areas and green roofs.
The JDE building also houses a newsagent’s and a bank, which are not included in the
scope of the environmental management system as these activities are directly managed
by outside companies. However, these companies are informed of the Committees’
environmental management system procedures and invited to follow them.
The political activities of EESC and CoR members are excluded from the environmental
management system - it is not possible to restrict members, who must remain
independent in their consultative work. In addition, the environmental criterion is only
one of several used by members. As for staff and other people working for the institution,
only the non-political aspects of their daily activities are taken into account.
In addition, the Committees receive an average of 200 visitors a day (student groups,
participants in Open Days, certain contractors, etc), mainly in the JDE building.
12121211121212121212121221211222222222121221221221212222222121212121222122222121221212221212121221212121212121222222221212112212121212121211221212121112222221122121112121211221221211112122111211111121222
13 | Environmental statement 2012
Source: EU treaties
Source: EESC and CoR administrations. These figures
show the number of (active) staff working at the Committees
on 1 October of each year.
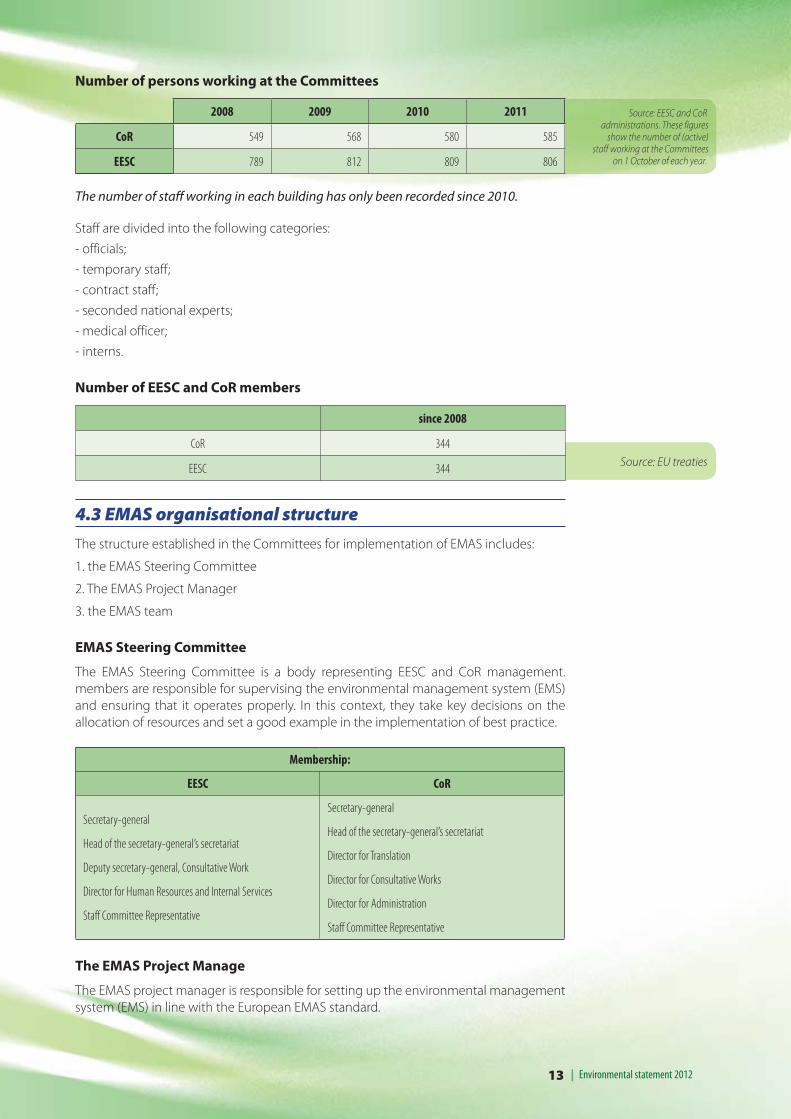
Number of persons working at the Committees
2008 2009 2010 2011
CoR 549 568 580 585
EESC 789 812 809 806
The number of staff working in each building has only been recorded since 2010.
Staff are divided into the following categories:
- officials;
- temporary staff;
- contract staff;
- seconded national experts;
- medical officer;
- interns.
Number of EESC and CoR members
since 2008
CoR 344
EESC 344
4.3 EMAS organisational structure
The structure established in the Committees for implementation of EMAS includes:
1. the EMAS Steering Committee
2. The EMAS Project Manager
3. the EMAS team
EMAS Steering Committee
The EMAS Steering Committee is a body representing EESC and CoR management.
members are responsible for supervising the environmental management system (EMS)
and ensuring that it operates properly. In this context, they take key decisions on the
allocation of resources and set a good example in the implementation of best practice.
Membership:
EESC CoR
Secretary-general
Head of the secretary-general’s secretariat
Deputy secretary-general, Consultative Work
Director for Human Resources and Internal Services
Staff Committee Representative
Secretary-general
Head of the secretary-general’s secretariat
Director for Translation
Director for Consultative Works
Director for Administration
Staff Committee Representative
The EMAS Project Manage
The EMAS project manager is responsible for setting up the environmental management
system (EMS) in line with the European EMAS standard.
14Environmental statement 2012 |
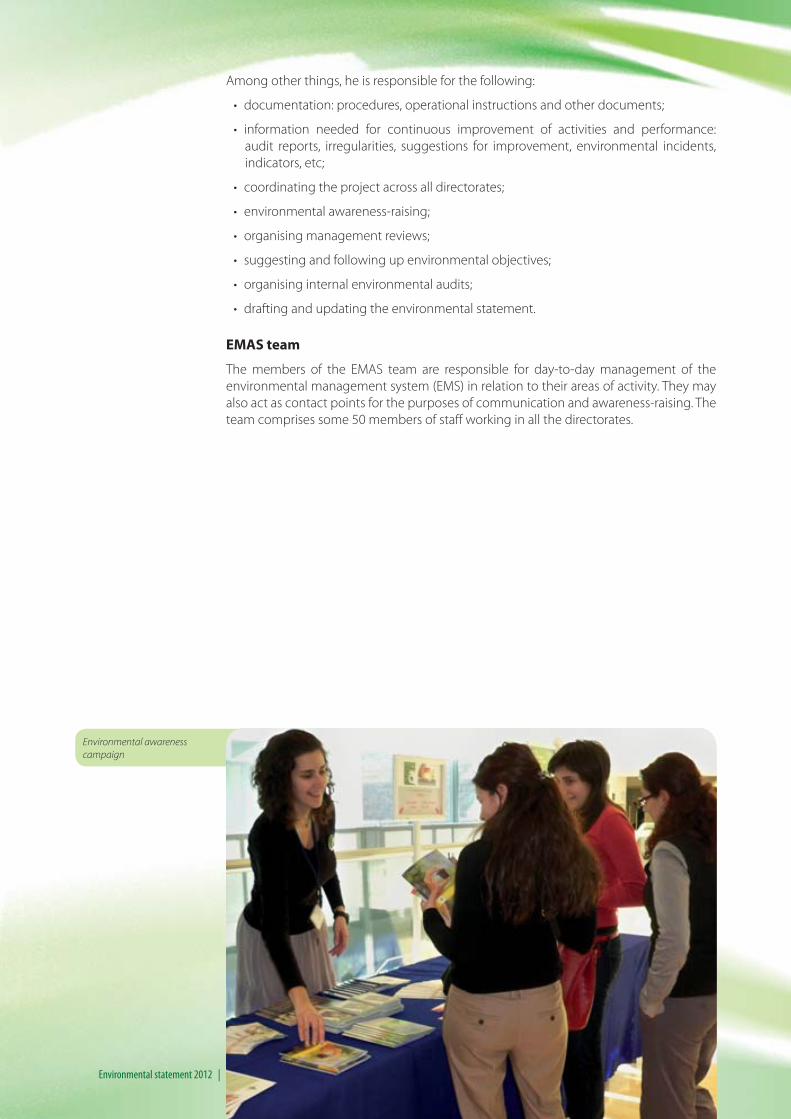
Environmental awareness
campaign
Among other things, he is responsible for the following:
• documentation: procedures, operational instructions and other documents;
• information needed for continuous improvement of activities and performance:
audit reports, irregularities, suggestions for improvement, environmental incidents,
indicators, etc;
• coordinating the project across all directorates;
• environmental awareness-raising;
• organising management reviews;
• suggesting and following up environmental objectives;
• organising internal environmental audits;
• drafting and updating the environmental statement.
EMAS team
The members of the EMAS team are responsible for day-to-day management of the
environmental management system (EMS) in relation to their areas of activity. They may
also act as contact points for the purposes of communication and awareness-raising. The
team comprises some 50 members of staff working in all the directorates.
15 | Environmental statement 2012
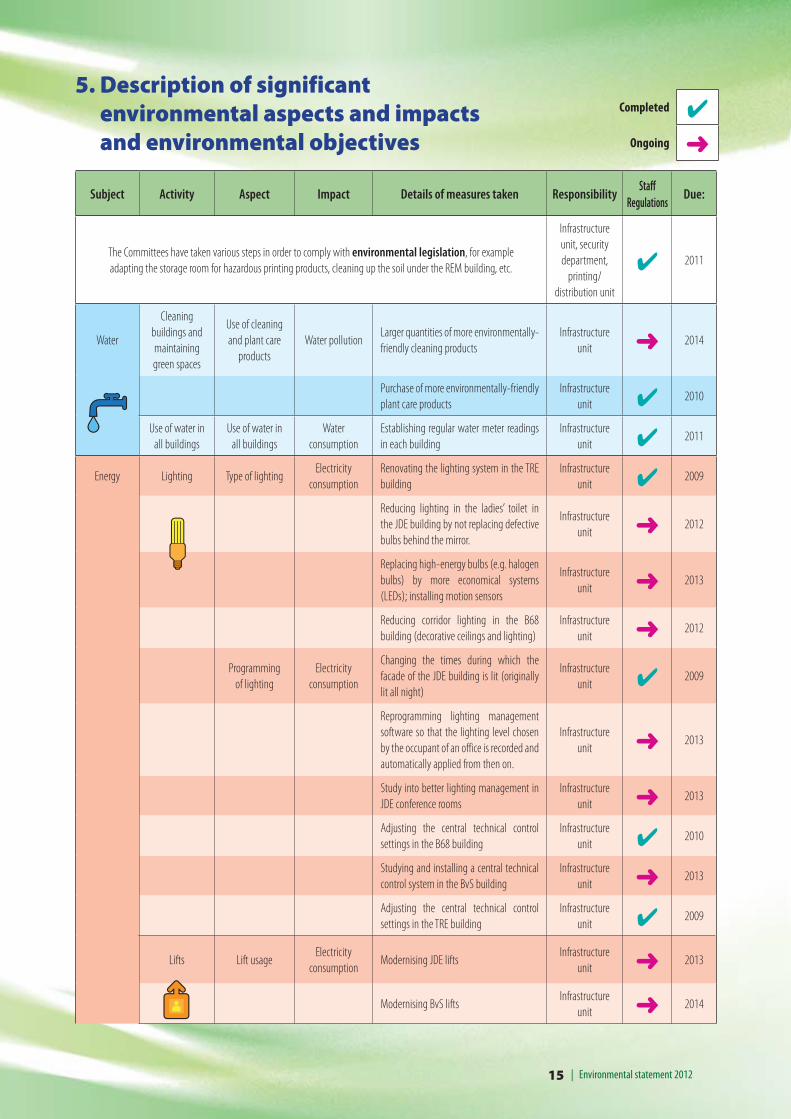
5. Description of significant environmental aspects and impacts and environmental objectives
Subject Activity Aspect Impact Details of measures taken ResponsibilityStaff
RegulationsDue:
The Committees have taken various steps in order to comply with environmental legislation, for example
adapting the storage room for hazardous printing products, cleaning up the soil under the REM building, etc.
Infrastructure
unit, security
department,
printing/
distribution unit
✔ 2011
Water
Cleaning
buildings and
maintaining
green spaces
Use of cleaning
and plant care
products
Water pollutionLarger quantities of more environmentally-
friendly cleaning products
Infrastructure
unit ➜ 2014
Purchase of more environmentally-friendly
plant care products
Infrastructure
unit ✔ 2010
Use of water in
all buildings
Use of water in
all buildings
Water
consumption
Establishing regular water meter readings
in each building
Infrastructure
unit ✔ 2011
Energy Lighting Type of lightingElectricity
consumption
Renovating the lighting system in the TRE
building
Infrastructure
unit ✔ 2009
Reducing lighting in the ladies’ toilet in
the JDE building by not replacing defective
bulbs behind the mirror.
Infrastructure
unit ➜ 2012
Replacing high-energy bulbs (e.g. halogen
bulbs) by more economical systems
(LEDs); installing motion sensors
Infrastructure
unit ➜ 2013
Reducing corridor lighting in the B68
building (decorative ceilings and lighting)
Infrastructure
unit ➜ 2012
Programming
of lighting
Electricity
consumption
Changing the times during which the
facade of the JDE building is lit (originally
lit all night)
Infrastructure
unit ✔ 2009
Reprogramming lighting management
software so that the lighting level chosen
by the occupant of an office is recorded and
automatically applied from then on.
Infrastructure
unit ➜ 2013
Study into better lighting management in
JDE conference rooms
Infrastructure
unit ➜ 2013
Adjusting the central technical control
settings in the B68 building
Infrastructure
unit ✔ 2010
Studying and installing a central technical
control system in the BvS building
Infrastructure
unit ➜ 2013
Adjusting the central technical control
settings in the TRE building
Infrastructure
unit ✔ 2009
Lifts Lift usageElectricity
consumptionModernising JDE lifts
Infrastructure
unit ➜ 2013
Modernising BvS liftsInfrastructure
unit ➜ 2014
Completed ✔Ongoing ➜
16Environmental statement 2012 |
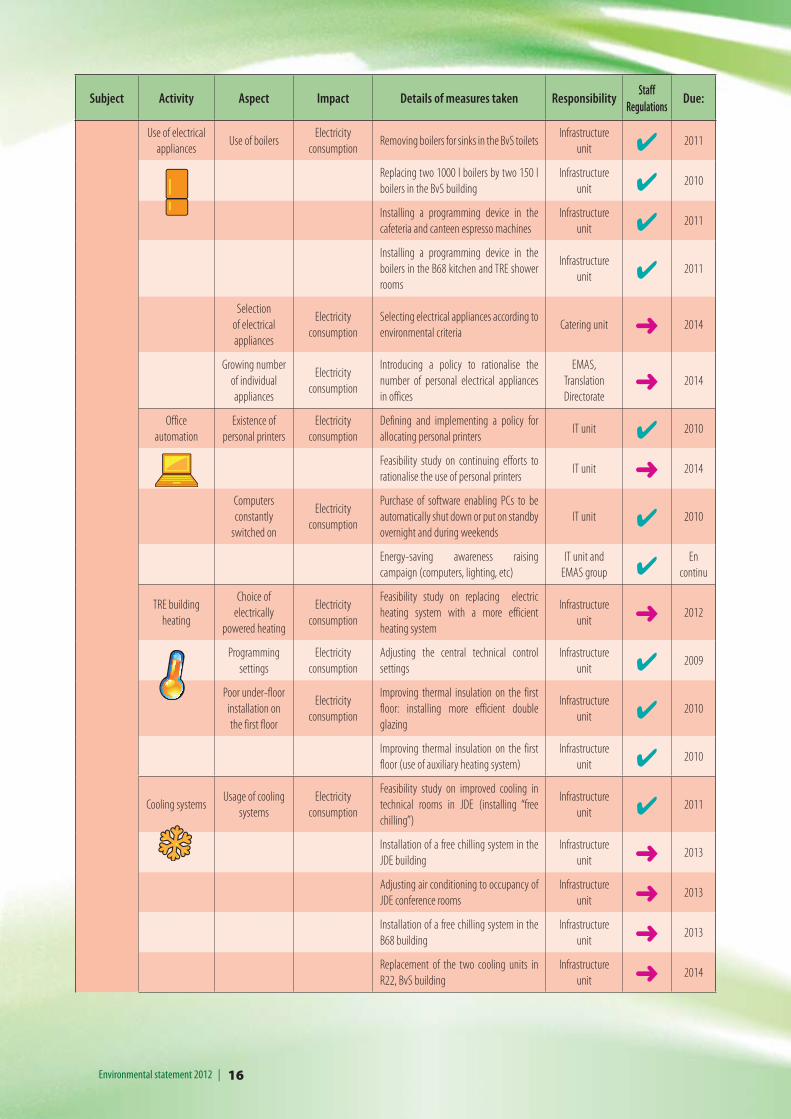
Subject Activity Aspect Impact Details of measures taken ResponsibilityStaff
RegulationsDue:
Use of electrical
appliancesUse of boilers
Electricity
consumptionRemoving boilers for sinks in the BvS toilets
Infrastructure
unit ✔ 2011
Replacing two 1000 l boilers by two 150 l
boilers in the BvS building
Infrastructure
unit ✔ 2010
Installing a programming device in the
cafeteria and canteen espresso machines
Infrastructure
unit ✔ 2011
Installing a programming device in the
boilers in the B68 kitchen and TRE shower
rooms
Infrastructure
unit ✔ 2011
Selection
of electrical
appliances
Electricity
consumption
Selecting electrical appliances according to
environmental criteriaCatering unit ➜ 2014
Growing number
of individual
appliances
Electricity
consumption
Introducing a policy to rationalise the
number of personal electrical appliances
in offices
EMAS,
Translation
Directorate➜ 2014
Office
automation
Existence of
personal printers
Electricity
consumption
Defining and implementing a policy for
allocating personal printersIT unit ✔ 2010
Feasibility study on continuing efforts to
rationalise the use of personal printers IT unit ➜ 2014
Computers
constantly
switched on
Electricity
consumption
Purchase of software enabling PCs to be
automatically shut down or put on standby
overnight and during weekends
IT unit ✔ 2010
Energy-saving awareness raising
campaign (computers, lighting, etc)
IT unit and
EMAS group ✔En
continu
TRE building
heating
Choice of
electrically
powered heating
Electricity
consumption
Feasibility study on replacing electric
heating system with a more efficient
heating system
Infrastructure
unit ➜ 2012
Programming
settings
Electricity
consumption
Adjusting the central technical control
settings
Infrastructure
unit ✔ 2009
Poor under-floor
installation on
the first floor
Electricity
consumption
Improving thermal insulation on the first
floor: installing more efficient double
glazing
Infrastructure
unit ✔ 2010
Improving thermal insulation on the first
floor (use of auxiliary heating system)
Infrastructure
unit ✔ 2010
Cooling systemsUsage of cooling
systems
Electricity
consumption
Feasibility study on improved cooling in
technical rooms in JDE (installing “free
chilling”)
Infrastructure
unit ✔ 2011
Installation of a free chilling system in the
JDE building
Infrastructure
unit ➜ 2013
Adjusting air conditioning to occupancy of
JDE conference rooms
Infrastructure
unit ➜ 2013
Installation of a free chilling system in the
B68 building
Infrastructure
unit ➜ 2013
Replacement of the two cooling units in
R22, BvS building
Infrastructure
unit ➜ 2014

17 | Environmental statement 2012
Subject Activity Aspect Impact Details of measures taken ResponsibilityStaff
RegulationsDue:
Use of
electricity in
all buildings
Electrical
appliances,
lighting, etc
Electricity
consumption
Installation of solar panels on the JDE and
B68 buildings
Infrastructure
unit ✔ 2010
Installation of electricity meters for air
supply units with a capacity in excess of 10
000 m³ in all buildings
Infrastructure
unit ➜ 2014
Heating
buildings
(except TRE)
Insufficient
insulation
of facades
and pipes
Gas
consumption
Feasibility study on thermal break
windows in the BvS building
Infrastructure
unit ✔ 2010
Installation of thermal break windows in
the BvS building
Infrastructure
unit ➜ 2017
Installation of central thermostat controls
in the B68 building
Infrastructure
unit ➜ 2013
Study into recovering energy from the
extractor units in the B68, JDE and REM
buildings
Infrastructure
unit ➜ 2012
Office temperature range set from 20- 23°C
instead of 18-24°C
Infrastructure
unit ➜ 2012
Installation of energy meters for hot water
in the JDE and B68 buildings
Infrastructure
unit ➜ 2014
Installation of energy meters for chilled
water in the JDE, B68, BvS, REM and TRE
buildings
Infrastructure
unit ➜ 2014
Roof insulation on the first floor of the BvS
building
Infrastructure
unit ➜ 2012
Feasibility study on installing double skin
facades in the REM building
Infrastructure
unit ➜ 2013
Lagging of heating systems in B68, BvS,
JDE and REM buildings
Infrastructure
unit ✔ 2010
Energy performance studies (thermal
envelope) of BVS and REM buildings
Infrastructure
unit ✔ 2010
Renovation of the upper level of the BvS-
JDE footbridge: replacing plexiglass by
energy-efficient double glazing
Infrastructure
unit ✔ 2011
Use of gas
in the REM
building
HeatingGas
consumption
Establishing regular meter readings by the
gas supplier
Infrastructure
unit ✔ 2011
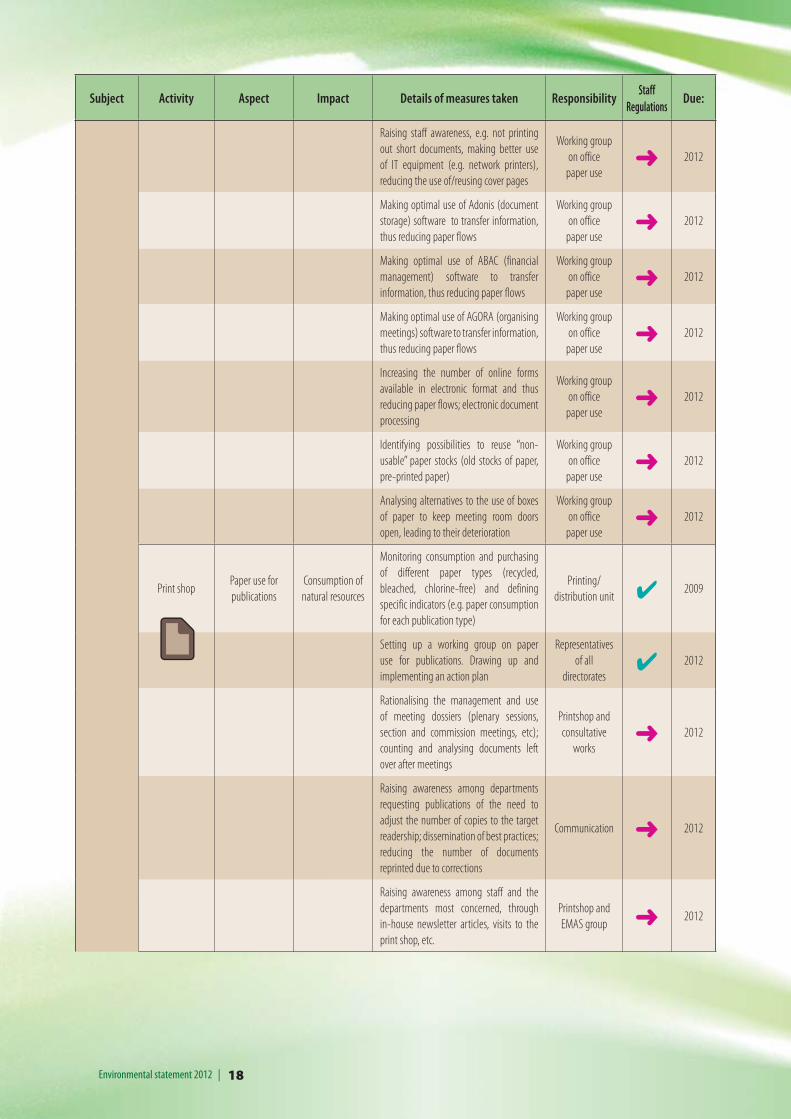
MaterialsPrinting and
photocopyingPaper use by staff
Consumption of
natural resources
Monitoring consumption and purchasing
of different paper types (recycled,
bleached, chlorine-free) and defining
specific indicators (e.g. paper consumption
for each building)
Printing/
distribution unit ✔ 2009
Setting up a working group on paper use
Drawing up and implementing an action
plan
Representatives
of all
directorates✔ 2012
18Environmental statement 2012 |
Subject Activity Aspect Impact Details of measures taken ResponsibilityStaff
RegulationsDue:
Raising staff awareness, e.g. not printing
out short documents, making better use
of IT equipment (e.g. network printers),
reducing the use of/reusing cover pages
Working group
on office
paper use➜ 2012
Making optimal use of Adonis (document
storage) software to transfer information,
thus reducing paper flows
Working group
on office
paper use➜ 2012
Making optimal use of ABAC (financial
management) software to transfer
information, thus reducing paper flows
Working group
on office
paper use➜ 2012
Making optimal use of AGORA (organising
meetings) software to transfer information,
thus reducing paper flows
Working group
on office
paper use➜ 2012
Increasing the number of online forms
available in electronic format and thus
reducing paper flows; electronic document
processing
Working group
on office
paper use➜ 2012
Identifying possibilities to reuse “non-
usable” paper stocks (old stocks of paper,
pre-printed paper)
Working group
on office
paper use➜ 2012
Analysing alternatives to the use of boxes
of paper to keep meeting room doors
open, leading to their deterioration
Working group
on office
paper use➜ 2012
Print shopPaper use for
publications
Consumption of
natural resources
Monitoring consumption and purchasing
of different paper types (recycled,
bleached, chlorine-free) and defining
specific indicators (e.g. paper consumption
for each publication type)
Printing/
distribution unit ✔ 2009
Setting up a working group on paper
use for publications. Drawing up and
implementing an action plan
Representatives
of all
directorates✔ 2012
Rationalising the management and use
of meeting dossiers (plenary sessions,
section and commission meetings, etc);
counting and analysing documents left
over after meetings
Printshop and
consultative
works➜ 2012
Raising awareness among departments
requesting publications of the need to
adjust the number of copies to the target
readership; dissemination of best practices;
reducing the number of documents
reprinted due to corrections
Communication ➜ 2012
Raising awareness among staff and the
departments most concerned, through
in-house newsletter articles, visits to the
print shop, etc.
Printshop and
EMAS group ➜ 2012
19 | Environmental statement 2012
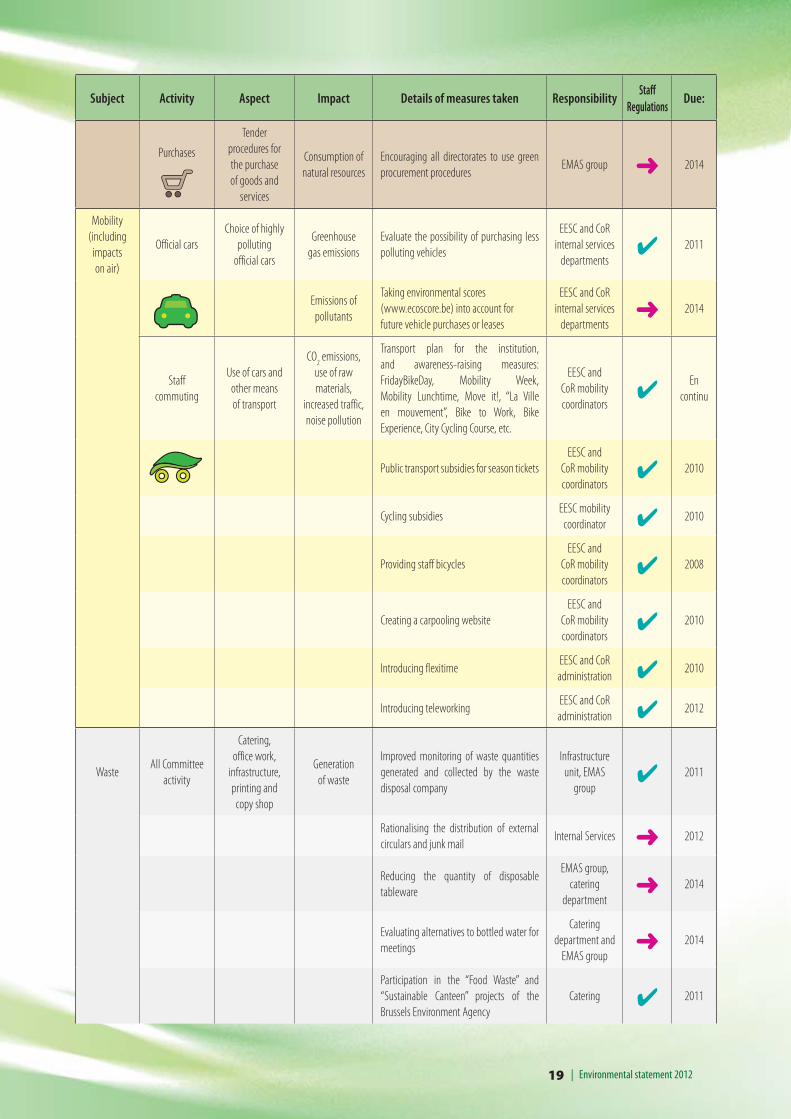
Subject Activity Aspect Impact Details of measures taken ResponsibilityStaff
RegulationsDue:
Purchases
Tender
procedures for
the purchase
of goods and
services
Consumption of
natural resources
Encouraging all directorates to use green
procurement procedures EMAS group ➜ 2014
Mobility
(including
impacts
on air)
Official cars
Choice of highly
polluting
official cars
Greenhouse
gas emissions
Evaluate the possibility of purchasing less
polluting vehicles
EESC and CoR
internal services
departments✔ 2011
Emissions of
pollutants
Taking environmental scores
(www.ecoscore.be) into account for
future vehicle purchases or leases
EESC and CoR
internal services
departments➜ 2014
Staff
commuting
Use of cars and
other means
of transport
CO2 emissions,
use of raw
materials,
increased traffic,
noise pollution
Transport plan for the institution,
and awareness-raising measures:
FridayBikeDay, Mobility Week,
Mobility Lunchtime, Move it!, “La Ville
en mouvement”, Bike to Work, Bike
Experience, City Cycling Course, etc.
EESC and
CoR mobility
coordinators✔
En
continu
Public transport subsidies for season tickets
EESC and
CoR mobility
coordinators✔ 2010
Cycling subsidiesEESC mobility
coordinator ✔ 2010
Providing staff bicycles
EESC and
CoR mobility
coordinators✔ 2008
Creating a carpooling website
EESC and
CoR mobility
coordinators✔ 2010
Introducing flexitimeEESC and CoR
administration ✔ 2010
Introducing teleworkingEESC and CoR
administration ✔ 2012
WasteAll Committee
activity
Catering,
office work,
infrastructure,
printing and
copy shop
Generation
of waste
Improved monitoring of waste quantities
generated and collected by the waste
disposal company
Infrastructure
unit, EMAS
group✔ 2011
Rationalising the distribution of external
circulars and junk mail Internal Services ➜ 2012
Reducing the quantity of disposable
tableware
EMAS group,
catering
department➜ 2014
Evaluating alternatives to bottled water for
meetings
Catering
department and
EMAS group➜ 2014
Participation in the “Food Waste” and
“Sustainable Canteen” projects of the
Brussels Environment Agency
Catering ✔ 2011

20Environmental statement 2012 |
Subject Activity Aspect Impact Details of measures taken ResponsibilityStaff
RegulationsDue:
Raising staff awareness EMAS group ➜ 2014
Improved waste sorting: blue bins (PMC)
on every floor, green bins for glass in every
building.
Infrastructure
unit, EMAS
group✔ 2010
Evaluating alternatives for food waste
Infrastructure
unit, EMAS
group✔ 2010
Awareness-raising campaign for
recovering bottles with a deposit EMAS group ✔ 2010
Donating IT equipment and furniture to
charities when they are replaced at the
Committees
IT unit and
infrastructure
unit✔ 2009
Awareness-
raising
Raising staff awareness at all management
levelsEMAS group ➜ 2012
Providing more regular information to
members, newly recruited staff and internsEMAS group ✔ 2010
More intensive training of EMAS team
members EMAS group ✔ 2010
The indirect aspects considered as significant are as follows: the purchase of cleaning
and plant care products, and staff commuting. Indirect impacts can be identified as
significant or non-significant using the same method as for direct impacts (see page 7).
Environmental criteria are often included in the criteria used to select the Committees’
contractors. In some cases, one of these criteria is for the contractors to have their own
environmental management system.

21 | Environmental statement 2012
Indicator:
kWh/person for the
five buildings
6. Environmental results and indicators
6.1 Electricity
Objective: Reducing electricity consumption by 5% per m² (above ground) for all
buildings from 2009 to 2011 (reference year: 2008).
For the 2012-2014 period, a new objective has been set of reducing consumption by 5%
compared to 2011 levels.
Electricity use
Most electricity is used by lighting, lifts, air conditioning, computers, printers and other
electrical appliances, and heating in the TRE building.
Explanation of data
- Data has been provided by the Infrastructure unit, based on invoices from the electricity
supplier
- The blue horizontal line shows the above-mentioned objective.
- Per-capita electricity consumption is based on the numbers of occupants recorded in
March 2010[5] (1421 occupants) and April 2011 (1445 occupants).
Analysis of results
The objective has been met and exceeded: - 16%
In 2011, total per-capita electricity consumption decreased by 16% compared to 2008
levels.
[5] 2010 data are used for the years 2008, 2009 and 2010 because accurate data was not available before
March 2010.
Annual electricity consumptionTotal for 5 buildings - per person
6 8546 8987 665
6 474
-10%
-11%
-16%
1 000
2 000
3 000
4 000
5 000
6 000
7 000
8 000
9 000
2008 2009 2010 2011
kWh/
pers
Total 5 bat
2008 - 5%
22Environmental statement 2012 |
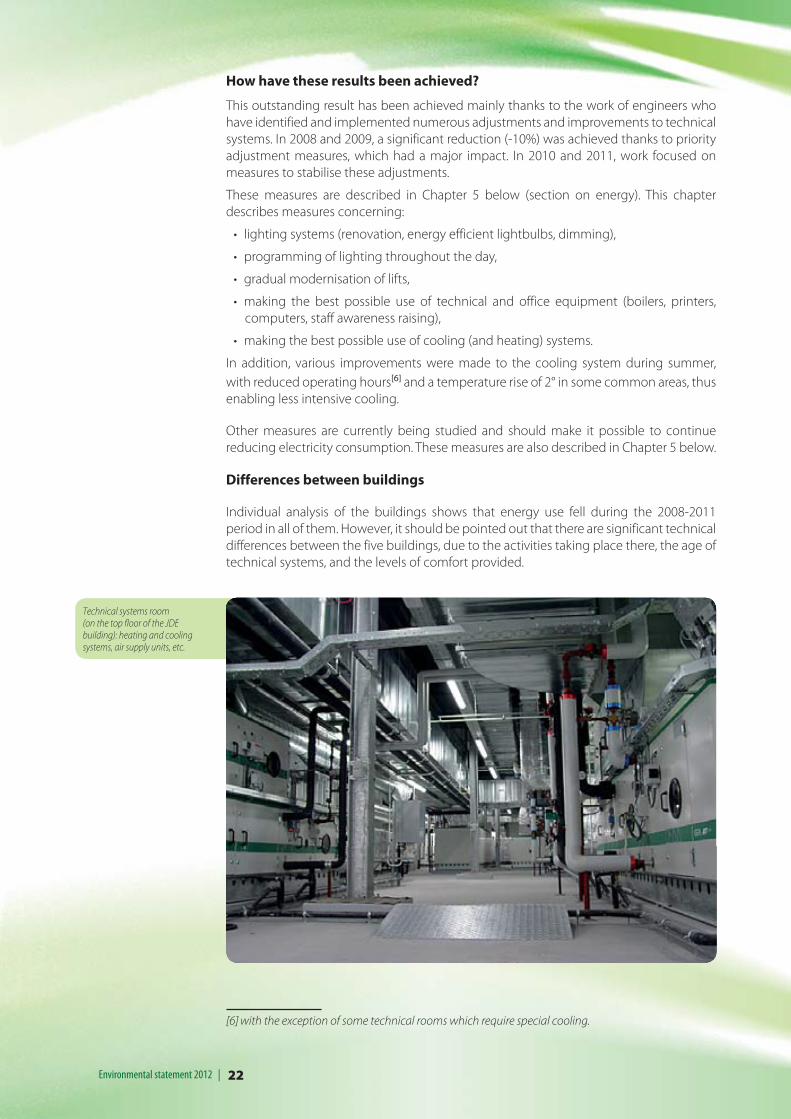
Technical systems room(on the top floor of the JDE building): heating and cooling systems, air supply units, etc.
How have these results been achieved?
This outstanding result has been achieved mainly thanks to the work of engineers who
have identified and implemented numerous adjustments and improvements to technical
systems. In 2008 and 2009, a significant reduction (-10%) was achieved thanks to priority
adjustment measures, which had a major impact. In 2010 and 2011, work focused on
measures to stabilise these adjustments.
These measures are described in Chapter 5 below (section on energy). This chapter
describes measures concerning:
• lighting systems (renovation, energy efficient lightbulbs, dimming),
• programming of lighting throughout the day,
• gradual modernisation of lifts,
• making the best possible use of technical and office equipment (boilers, printers,
computers, staff awareness raising),
• making the best possible use of cooling (and heating) systems.
In addition, various improvements were made to the cooling system during summer,
with reduced operating hours[6] and a temperature rise of 2° in some common areas, thus
enabling less intensive cooling.
Other measures are currently being studied and should make it possible to continue
reducing electricity consumption. These measures are also described in Chapter 5 below.
Differences between buildings
Individual analysis of the buildings shows that energy use fell during the 2008-2011
period in all of them. However, it should be pointed out that there are significant technical
differences between the five buildings, due to the activities taking place there, the age of
technical systems, and the levels of comfort provided.
[6] with the exception of some technical rooms which require special cooling.

23 | Environmental statement 2012
In the BvS building, office lighting levels can be adjusted individually
through software which is accessible on each computer.
New lighting system with energy-saving bulbs (28W or 39W): a
photoelectric sensor automatically adjusts lighting to the levels of
natural light (TRE building)
For example, the largest building (JDE) houses many meeting and conference rooms as
well as the canteen and print shop, and these obviously use more energy than offices.
The second largest building (BvS) has no air-conditioning system, and therefore
consumption per m² and per person is much lower than in the other buildings.
The TRE building is heated by electricity and is very sensitive to weather conditions.
Thermal installation work was carried out on the building in 2010 and new lighting
systems were installed in 2009.
Production of renewable energy:
Solar panels (150 m²) were installed on the roofs of two buildings (B68 and JDE) in summer
2010. When the panels were installed, it was expected that they would produce around
20MW per year, some 0.2% of the Committees’ total electricity consumption.
From January 2011 to December 2011, the first full year of operation, only 13.5 MWh of
electricity was produced. Production during the potentially very sunny months of July
and August was particularly disappointing due to cloudy weather.
Solar panel on B68 andJDE buildings
24Environmental statement 2012 |
6.2 Gas
Objective: Reducing gas consumption by 5% per m² for all buildings from 2009 to 2011
(reference year: 2008).
For the 2012-2014 period, a new objective has been set of reducing consumption by 5%
compared to 2011 levels.
Use: Gas is only used to heat four buildings.
Explanation of data
• Data has been provided by the infrastructure unit based on invoices from the gas
supplier
• The blue horizontal line shows the above-mentioned objective
• Only three buildings are taken into account when calculating the Committees’
consumption. The following buildings are not taken into account:
• The TRE building, which has an electrical heating system;
• The REM building, data for which is unusable. Due to its relatively small size (2325
m²), this is not one of the buildings for which our provider systematically and
regularly monitors energy use. This building accounts for around 3% of the total
floor area of the five buildings covered by this environmental statement. Since
early 2011 we have been asking for quarterly readings from the gas supplier.
• The “degree day 15:15” concept enables us to take into account temperatures
observed throughout the relevant year, thus showing energy consumption in relation
to changing weather. For example, a particularly cold winter will mean greater energy
consumption, even if new insulation measures have been taken. Using the degree
day concept, the impact of insulation can be measured.
• Per-capita gas consumption is based on the numbers of occupants recorded in March
2010[7] (1421 occupants) and April 2011 (1445 occupants).
Analysis of results
The objective has been met and exceeded: - 28%
In 2011, total per capita gas consumption decreased by 28% compared to 2008 levels.
The very modest increase in consumption between 2010 and 2011 can be explained
due to a certain level of distortion caused by the use of the “degree day 15:15” method
in 2011. The purpose of this method is to smooth out varying weather conditions in
order to more accurately reflect the buildings’ energy performance. However, in 2011 the
winter was particularly mild, therefore decreasing the effect of such weighting on relative
consumption. At the same time, there was a continued decline in absolute consumption.
How have these results been achieved?
• As in the case of electricity consumption, this impact was mainly due to the engineers
who identified and implemented measures to use heating systems more efficiently,
particularly in terms of time settings.
• All of these measures are described in Chapter 5 below (section on energy - heating
buildings). Such measures include:
• thermal insulation of heating systems and several buildings
[7] 2010 data are used for the years 2008, 2009 and 2010 because accurate data was not available before
March 2010

25 | Environmental statement 2012
Indicator: kWh/ degree
day 15:15 /per person
per year for the three
buildings (JDE, BvS, B68)
• renovation of the upper floor of a footbridge between two buildings, with high-
quality double glazing
• energy performance studies (thermal envelope)
Other measures are currently being implemented or studied, and should make it possible
to continue reducing electricity consumption. These measures are also described in
Chapter 5 below.
Differences between buildings
There are huge differences between heating systems in different buildings. Despite the
issue mentioned above, consumption has gone down since 2008 in the three buildings
studied.
A “static” (radiator) heating system (e.g. in the BvS building) offers less scope for technical
adjustments than a “dynamic” (HVAC with fan convector units) system as used in the JDE
and B68 buildings. Energy therefore has to be saved through other measures, for example
by replacing windows.
At the same time, the BvS heating system is significantly more economical “per m²” than
the other two buildings, because the ventilation system used in the JDE and B68 buildings
requires a much higher volume of blown air, which has to be completely renewed and
therefore also heated.
Annual gas consumption
2,742,663,00
3,81
-28%
-30%-21
%
0,00
0,50
1,00
1,50
2,00
2,50
3,00
3,50
4,00
4,50
2008 2009 2010 2011
kWh/
DJ/p
ers
Total 3 bat2008 - 5%
Weighted by
degree day
15:15
Total for three
buildings - per
person

26Environmental statement 2012 |
6.3 Water
Objective : No objective has been set for water consumption as we do not have
(sufficiently reliable) data from before 2011; in addition, this aspect was not considered as
significant in the environmental review (see page 7 for a description of the environmental
review stage).
Use: Water is mainly used for kitchens, toilets, cleaning, humidifying air and watering
indoor plants. The Committees only use mains water.
Explanation of data
- Data has been provided by the infrastructure unit based on invoices from the water
supplier
- These data are based on invoices received by the Committees for periods which are
sometimes unequal. They therefore represent an extrapolation for a period of one year
of data covering periods which may be longer or shorter than one year. Regular readings
of water meters were started in late 2011 by the infrastructure unit.
- In addition, the data for 2009 and 2010 presented here are slightly different from the
figures in the 2011 Environmental Statement because one of the two water meters in
the JDE building was not taken into account there.
JDE-BvS footbridge
Insulation of cooling circuitsHeating system in JDE buildingThermal insulation
27 | Environmental statement 2012
Indicator: m³ water
consumed per year
per person for the
five buildings
New taps (BvS building)
Analysis of results
Declining consumption
Consumption fell by 11% in 2011 compared to 2009 levels. However, given the above
reservations about the reliability of data, it would be more useful to analyse trends once
we have high-quality data from several years.
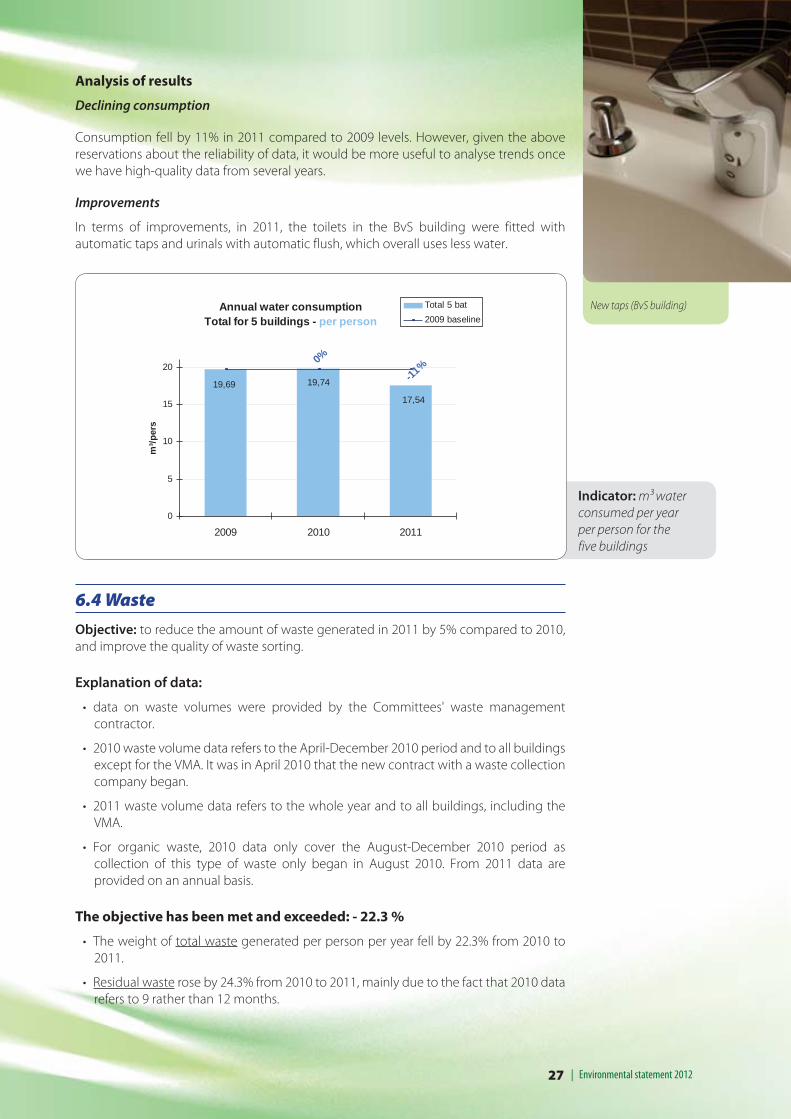
Improvements
In terms of improvements, in 2011, the toilets in the BvS building were fitted with
automatic taps and urinals with automatic flush, which overall uses less water.
6.4 Waste
Objective: to reduce the amount of waste generated in 2011 by 5% compared to 2010,
and improve the quality of waste sorting.
Explanation of data:
• data on waste volumes were provided by the Committees' waste management
contractor.
• 2010 waste volume data refers to the April-December 2010 period and to all buildings
except for the VMA. It was in April 2010 that the new contract with a waste collection
company began.
• 2011 waste volume data refers to the whole year and to all buildings, including the
VMA.
• For organic waste, 2010 data only cover the August-December 2010 period as
collection of this type of waste only began in August 2010. From 2011 data are
provided on an annual basis.
The objective has been met and exceeded: - 22.3 %
• The weight of total waste generated per person per year fell by 22.3% from 2010 to
2011.
• Residual waste rose by 24.3% from 2010 to 2011, mainly due to the fact that 2010 data
refers to 9 rather than 12 months.
Annual water consumptionTotal for 5 buildings - per person
19,69 19,74
17,54
0%
-11%
0
5
10
15
20
2009 2010 2011
m³/p
ers
Total 5 bat2009 baseline

28Environmental statement 2012 |
Indicator: weight per
year per waste type and
per person
• Paper waste fell by 85%, due to the partial clearing out of the archives in 2010.
• Organic waste rose by 53.3%, mainly because the 2010 figures only refer to five months.
• For 2011, hazardous waste amounted to 1% of total waste.
Refuse collection
• Most waste is collected by truck, by an approved waste collection company.
• Each of the departments concerned organises separate collection of one or several
hazardous waste types. The following types of hazardous waste have been identified
at the Committees: old electrical and electronic equipment (the bulk of our hazardous
waste), needles used by the medical departments, printer toners and cartridges,
energy-saving and other lightbulbs, used oils from the buildings maintenance
department, and dirty cloths/ink/waste water from the print shop.
• Food leftovers (“organic waste”) have been collected separately since August 2010 for
use in biogas production.
Waste reduction measures
In order to reduce waste quantities, the Committees have taken various steps such as:
• awareness-raising activities, e.g. participation in European Waste Production Week in
2009, 2010 and 2011. In 2011, the main theme of the Week was food waste;
• in cooperation with the catering company, disposable tableware (plates, cutlery) was
cut by 43% from 2008 to 2011.
In terms of food waste, several steps have been taken with the catering company,
particularly in terms of managing purchases and stocks, preserving food, meals,
awareness-raising among kitchen staff, and using sales statistics.
In addition, the Committees have successfully participated in two programmes organised
by the Brussels Capital Region:
1. the “Sustainable Canteen” programme, the objectives of which are to prevent food
waste and other kinds of waste, and to save water and energy;
2. the “Food Waste” pilot project, which involves developing long-term strategies to
reduce food waste in canteens.
2010-2011 waste: kg/year/person
2010
2010
2010 2010 2010
20112011
2011 2011 2011
0
50
100
150
200
250
Residual waste Paper-cardboard PMC Glass Organic waste
Bin Type
kg
29 | Environmental statement 2012
In March 2012, the Committees’ canteen was certified as a Sustainable Canteen.
Waste sorting
Waste sorting is organised at different levels. Each office is equipped with a paper bin and
a bin for residual waste. On each floor of every building there are blue bins for PMC (paper,
metal, cans). There are also paper bins in all photocopier/printer rooms on each floor.
Each building has a glass bin and several collection points for used batteries. Meeting
rooms have smarter bins with three compartments (PMC, paper and residual waste).
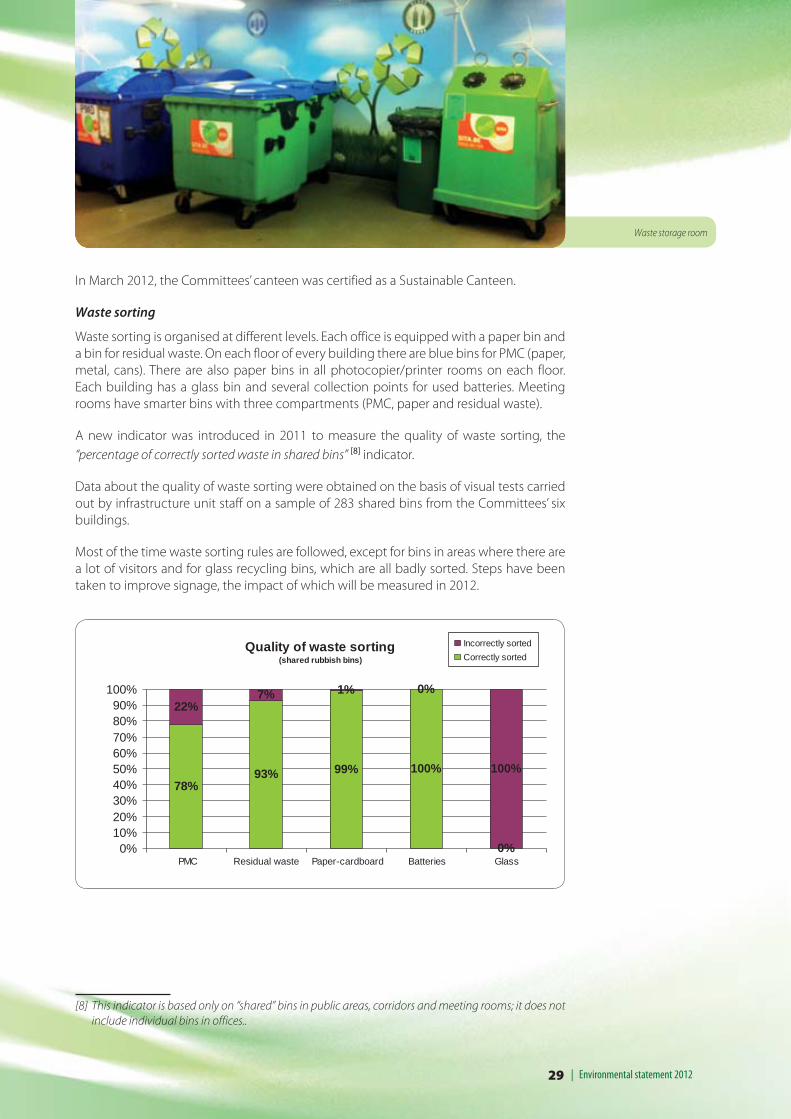
A new indicator was introduced in 2011 to measure the quality of waste sorting, the
“percentage of correctly sorted waste in shared bins” [8] indicator.
Data about the quality of waste sorting were obtained on the basis of visual tests carried
out by infrastructure unit staff on a sample of 283 shared bins from the Committees’ six
buildings.
Most of the time waste sorting rules are followed, except for bins in areas where there are
a lot of visitors and for glass recycling bins, which are all badly sorted. Steps have been
taken to improve signage, the impact of which will be measured in 2012.
[8] This indicator is based only on “shared” bins in public areas, corridors and meeting rooms; it does not
include individual bins in offices..
Waste storage room
78%93% 99% 100%
0%
22%7% 1% 0%
100%
0%10%20%30%40%50%60%70%80%90%
100%
Quality of waste sorting(shared rubbish bins)
PMC Residual waste Paper-cardboard Batteries Glass
Incorrectly sortedCorrectly sorted

30Environmental statement 2012 |
6.5 Paper
The Committees aim to use paper rationally and responsibility in their activities.
Two working groups ("office paper" and "paper for publications") were set up in 2010,
each one comprising about 20 members of staff representing all the directorates of the
two Committees. Two indicators have been established: "office paper" and "paper for
publication".
Office paper
Objective: At the beginning of 2011, an objective was set to reduce office paper
consumption by 5% compared to 2010.
Use: "office paper" refers to A4 size, recycled, 80g paper used by staff in their personal
printers or network printers.
Analysis of results
A downwards trend in 2010 which was not continued in 2011
The objective was met and exceeded for the 2009-2010 period, with a reduction of nearly
20%. However, consumption rose by 3% from 2010 to 2011.
On average, paper use fell from 27 sheets per day per employee in 2009 to 21 sheets in
2010. The small rise between 2010 and 2011 could be due to the fact that the Committees’
consultative activity increased significantly in 2011.
Steps taken
Communication and awareness-raising activity since 2009 encourage staff to only print
when strictly necessary and to use double-sided printing or multiple pages on each
sheet. In addition, the double-sided printing option has been set as the default option on
all network printers.
The paper working group will have to step up its efforts to raise staff awareness in 2012 at
the same time as implementing other measures which have already been identified, for
Source: paper ordered by the printing unit
Indicator :
Number of printed
pages per working
day per employee
Office paper use
41
24
1417
2422
2729
20
13 14
21
16
21
30
21
1013
26
17
21
0
5
10
15
20
25
30
35
40
45
JDE BvS B68 TRE REM VMA Average
Pag
es/ d
ay/
empl
oyee
200920102011

31 | Environmental statement 2012
Printshop (JDE building)
example by optimising electronic working procedures through the elimination
of parallel paper-based procedures. At the same time, it will need to find ways of
re-using “unusable” printed paper (for example, paper with out-of-date headers
or cover pages generated by network printers).
Paper for publications
Objective: to rationalise the use of paper for publications and members’
meeting documents.
A quantitative target for reducing this kind of paper use would be of little
relevance for two reasons: firstly, the quantity of “paper for publication”
consumed is closely dependent on the communication plans implemented
by each of the Committees; secondly, lower consumption could reflect
outsourcing of some publications (e.g. to the Office for Official Publications
of the European Communities) rather than being a consequence of measures
taken by the working group on “paper for publications”.
Use
Various types of “paper for publications” are used only by the printing unit, both for
members’ meeting documents [9] and for communication products (brochures, books,
posters, greetings cards, visiting cards, etc), many of which are printed in colour and on
special paper.
Analysis of results
In 2010 the quantity of paper (in terms of weight) ordered by the printing unit for
publications increased by 20%, due to stockpiling; however, there was a reduction of 15%
from 2010 to 2011. Monitoring this indicator over several years could enable us to identify
clearer paper use trends.
Steps taken
Several steps have been taken to rationalise the use of paper for publications since 2010.
These include monitoring paper use for each paper type (recycled, bleached, chlorine-
free), more efficient management of the quantities of paper documents distributed at
members’ meetings (plenary sessions, section and commission meetings, etc.), raising
awareness among in-house clients of the need to adjust their publication orders to actual
needs, and avoiding reprints due to last-minute corrections. Discussions are also taking
place about how to reduce the amount of external advertising sent en masse to staff and
members and generating additional paper waste.
[9] On A4 paper, 80g recycled, in black and white and double sided.
Printshop (JDE building)
32Environmental statement 2012 |
Source: Unité Imprimerie
Source: Factures de l'OP aux départements de la Communication
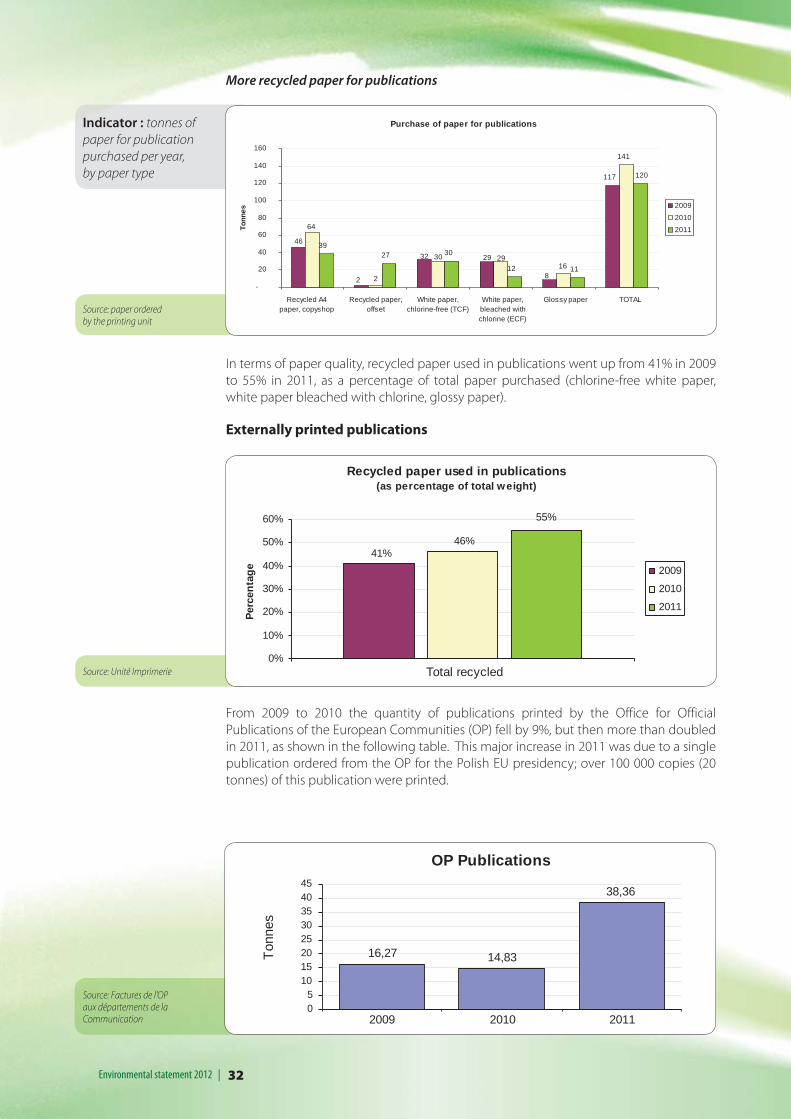
Indicator : tonnes of
paper for publication
purchased per year,
by paper type
Source: paper ordered by the printing unit
More recycled paper for publications
In terms of paper quality, recycled paper used in publications went up from 41% in 2009
to 55% in 2011, as a percentage of total paper purchased (chlorine-free white paper,
white paper bleached with chlorine, glossy paper).
Externally printed publications
From 2009 to 2010 the quantity of publications printed by the Office for Official
Publications of the European Communities (OP) fell by 9%, but then more than doubled
in 2011, as shown in the following table. This major increase in 2011 was due to a single
publication ordered from the OP for the Polish EU presidency; over 100 000 copies (20
tonnes) of this publication were printed.
Purchase of paper for publications
117
141
39 27 30
12 11 29 32
8
46
2
29 30
64
16
2
120
-
20
40
60
80
100
120
140
160
Tonn
es
2009
2010
2011
Recycled A4paper, copyshop
Recycled paper,offset
White paper,chlorine-free (TCF)
White paper,bleached withchlorine (ECF)
Glossy paper TOTAL
OP Publications
16,27 14,83
38,36
05
1015202530354045
2009 2010 2011
Tonn
es
Recycled paper used in publications (as percentage of total weight)
55%
41%46%
0%
10%
20%
30%
40%
50%
60%
Perc
enta
ge 2009
2010
2011
Total recycled
33 | Environmental statement 2012
6.6 Green procurement
Objective: All calls for tender by the Logistics Directorate are checked by the EMAS group
to ensure that they include environmental criteria.
Results
In 2011 the EMAS group was consulted on 10 different tender procedures, all from the
Logistics Directorate.
Environmental criteria were suggested for waste management, the choice of products
and materials, and compliance with environmental legislation. For example, in building
renovation and maintenance projects, a requirement has been introduced to use only
wood sourced from sustainably managed forests, as well as environmentally-friendly
paint, glue, solvents and plasterboard. Energy performance criteria have been set for
purchases of an industrial dishwasher and windows.
In all these tender procedures, tender documents state very clearly to applicants that
the Committees have established an environmental management system in line with
the European EMAS benchmark; at the same time, a copy of the environmental policy is
systematically included among tender documents.
Although EMAS group recommendations are not binding on staff managing tender
procedures, they are usually followed.
Two ongoing contracts are currently being monitored:
Cleaning products
Objective: to purchase more environmentally-friendly cleaning products and
consumables
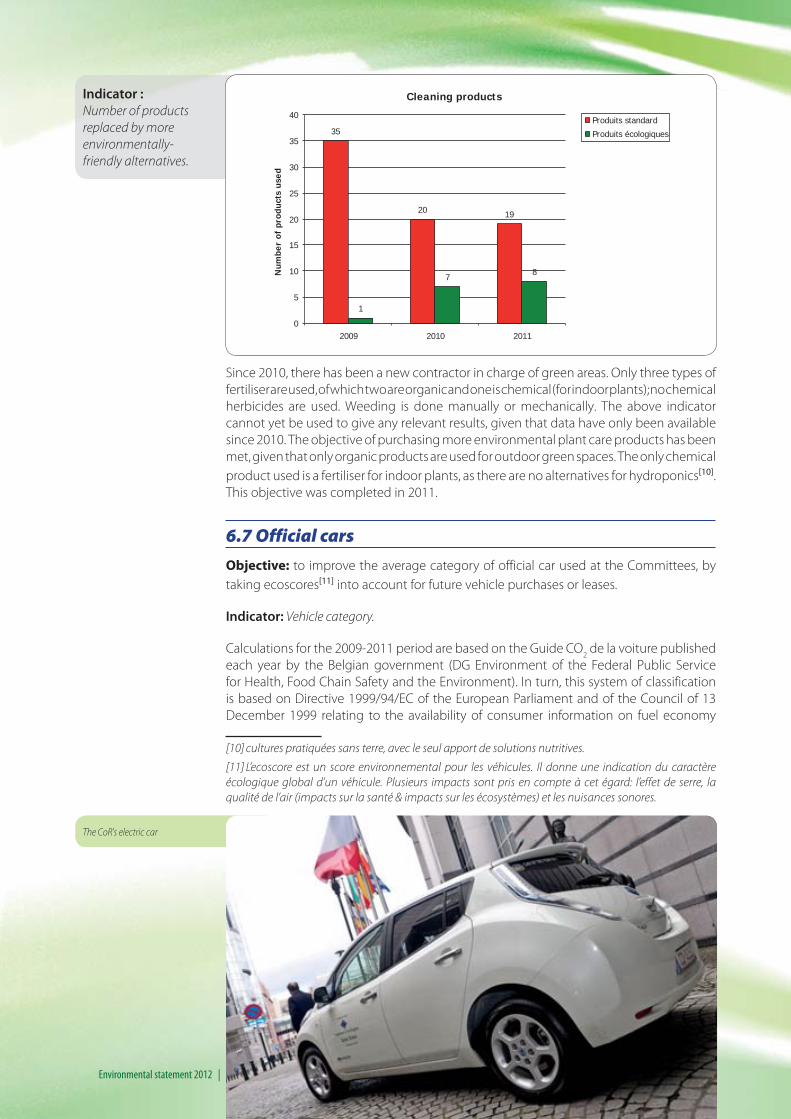
Indicator: Number of products replaced by more environmentally-friendly alternatives.
Until 2009, the cleaning company used conventional products available on the market.
Since the cleaning contract with the Committees was renewed in 2010, it has replaced
some of these products with environmental alternatives. The cleaning company still uses
some conventional products, as internal tests found that the corresponding environmental
products were not sufficiently effective.
The total number of products (both conventional and environmental) has decreased from
35 to 27 as some products introduced in 2010 are multipurpose.
The percentage of environmental products has increased very significantly from 3% to 30%.
Since 2010, monitoring of the quantity of environmental products has continued, with an
increase from 31% in 2010 to 68% in 2011. This improvement is due to the fact that the
products which have been replaced are the most often used ones.
Environmental cleaning products are fully and rapidly biodegradable, free from bio-
accumulative raw materials and nitro musks (scents), and are based on surfactants of
plant or mineral origin. In addition, cartridges for these products are recyclable and pump
dispensers are reusable.
Plant care products
Objective: to purchase more environmentally-friendly plant care products and
consumables
34Environmental statement 2012 |
The CoR's electric car
Indicator :
Number of products
replaced by more
environmentally-
friendly alternatives.
Since 2010, there has been a new contractor in charge of green areas. Only three types of
fertiliser are used, of which two are organic and one is chemical (for indoor plants); no chemical
herbicides are used. Weeding is done manually or mechanically. The above indicator
cannot yet be used to give any relevant results, given that data have only been available
since 2010. The objective of purchasing more environmental plant care products has been
met, given that only organic products are used for outdoor green spaces. The only chemical
product used is a fertiliser for indoor plants, as there are no alternatives for hydroponics[10].
This objective was completed in 2011.
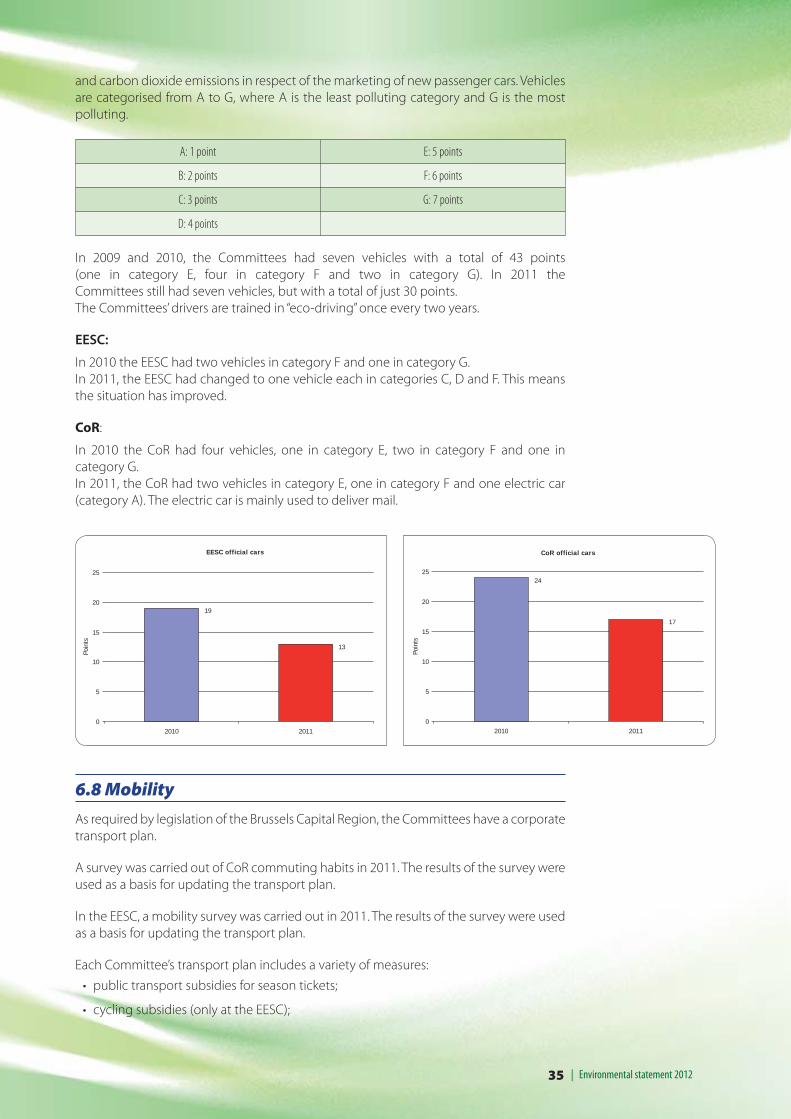
6.7 Official cars
Objective: to improve the average category of official car used at the Committees, by
taking ecoscores[11] into account for future vehicle purchases or leases.
Indicator: Vehicle category.
Calculations for the 2009-2011 period are based on the Guide CO2 de la voiture published
each year by the Belgian government (DG Environment of the Federal Public Service
for Health, Food Chain Safety and the Environment). In turn, this system of classification
is based on Directive 1999/94/EC of the European Parliament and of the Council of 13
December 1999 relating to the availability of consumer information on fuel economy
[10] cultures pratiquées sans terre, avec le seul apport de solutions nutritives.
[11] L’ecoscore est un score environnemental pour les véhicules. Il donne une indication du caractère
écologique global d’un véhicule. Plusieurs impacts sont pris en compte à cet égard: l’effet de serre, la
qualité de l’air (impacts sur la santé & impacts sur les écosystèmes) et les nuisances sonores.
35
20 19
1
7 8
0
5
10
15
20
25
30
35
40
2009 2010 2011
Produits standard
Produits écologiques
Cleaning products
Num
ber
of p
rodu
cts
used
35 | Environmental statement 2012
and carbon dioxide emissions in respect of the marketing of new passenger cars. Vehicles
are categorised from A to G, where A is the least polluting category and G is the most
polluting.
A: 1 point E: 5 points
B: 2 points F: 6 points
C: 3 points G: 7 points
D: 4 points
In 2009 and 2010, the Committees had seven vehicles with a total of 43 points
(one in category E, four in category F and two in category G). In 2011 the
Committees still had seven vehicles, but with a total of just 30 points.
The Committees’ drivers are trained in “eco-driving” once every two years.
EESC:
In 2010 the EESC had two vehicles in category F and one in category G.
In 2011, the EESC had changed to one vehicle each in categories C, D and F. This means
the situation has improved.
CoR:
In 2010 the CoR had four vehicles, one in category E, two in category F and one in
category G.
In 2011, the CoR had two vehicles in category E, one in category F and one electric car
(category A). The electric car is mainly used to deliver mail.
6.8 Mobility
As required by legislation of the Brussels Capital Region, the Committees have a corporate
transport plan.
A survey was carried out of CoR commuting habits in 2011. The results of the survey were
used as a basis for updating the transport plan.
In the EESC, a mobility survey was carried out in 2011. The results of the survey were used
as a basis for updating the transport plan.
Each Committee’s transport plan includes a variety of measures:
• public transport subsidies for season tickets;
• cycling subsidies (only at the EESC);
EESC official cars
19
13
0
5
10
15
20
25
2010 2011
Poin
ts
CoR official cars
17
24
0
5
10
15
20
25
2010 2011
Poin
ts

36Environmental statement 2012 |
• since 2008, providing 10 staff bicycles for Committee staff and members;
• providing lockers and showers near the bike racks;
• providing charging points for electrical bicycles;
• creating a car-pooling website in 2010;
• awareness-raising measures targeted at all staff in order to promote sustainable
mobility: FridayBike/Foot Day (breakfasts for cyclists and pedestrians), participation
in Mobility Week organised by the Brussels Region, Mobility Lunchtime (to inform
colleagues of alternatives to driving), the Bike Experience, Bike to Work, City Cycling
course, Move it!, “La Ville en mouvement” exhibition. Eco-driving courses were held in
2011.
• access plans are displayed at the entrance to the EESC and CoR buildings, showing
nearby public transport.
• introduction of flexitime: provided they work core hours, staff can adjust their working
hours to avoid rush-hour traffic.
• introduction of teleworking: based on the results of the pilot project carried out in
2011, the Committees have decided to roll it out to other staff.
6.9 Biodiversity
PThe EMAS III Regulation includes a biodiversity impact indicator as one of the indicators
which it is obligatory to monitor. For us, this is relevant to the way in which we use land,
especially in terms of land which is built on. Built-on land is sealed, and therefore plants
cannot grow there, which is not conducive to biodiversity.
Indicators : The Committees’ premises cover an area of 13 508 m² of which:
• 9786 m² are built on (72%) and
• 3723 m² (28%) is unbuilt.
It should be pointed out that 2602 m² of the unbuilt area is given over to green spaces,
while the rest is sealed (pavements, courtyards, etc.).
In addition, the built on area includes 778 m² of green roofs (on the JDE building).
In 2012 two beehives were installed on the roof of the JDE building. The aim of this initiative
was to support biodiversity in an urban environment and to raise public awareness of the
importance of bees and their dramatic decline. The beehives are a symbol of the Committees’
commitment to a sustainable urban environment. The many parks and gardens in the
surrounding areas will enable the bees to find food. In addition, the Committee buildings
Means of transport modes used by EESC staff for commuting
Car 23.9%
Carpooling 1.4%
Train 22.5%Bus/tram/metro 30.1%
Bike 12.2%
Motorbike 1.1%
On foot 8.9%
Means of transport used by CoR staff for commuting
Car 19.8%
Carpooling 0.7%
Train 20.9%
Bus/tram/metro 34.9%
Bike 11.7%
Motorbike 0.4%
On foot 11.7%

37 | Environmental statement 2012
In May, 2012 two beehives were installed on the roof
of the JDE building.
house many public events which will serve as excellent communication opportunities. The
honey collected will be presented to Committee guests and partners, and the hives will be
at the heart of promotional activities.
6.10 Emissions
The EMAS III Regulation also includes total greenhouse gas emissions and annual emissions
of other gases as indicators which it is obligatory to monitor. At the Committees, the
only gas emissions come from the heating system. This was not identified as a significant
aspect in the environmental review, and therefore no study has been carried out on this
subject.
7. Reference to the applicable legal requirements relating to the environment
The Committees are subject to European, Belgian, regional and Brussels municipal
environmental legislation and rules. Legislative monitoring is ensured by a register of
applicable legislation and by regular audits of legislative compliance.
In the event of an accident or incident entailing environmental or staff health and safety
risks, the Committees will immediately inform the Brussels Environment Agency and the
relevant municipality.

38Environmental statement 2012 |
8. Information concerning verificationDéclaration du vérificateur environnemental relative aux activités de vérification
et de validation
AIB-Vinçotte International S.A., EMAS environmental auditor, authorised for activities 10,
11, 13, 16, 18, 19, 20 (excl. 20.51), 21, 22, 23, 24, 25, 26, 27, 28, 29, 30.2, 30.9, 31, 32, 33, 35,
36, 37, 38, 39, 41, 42, 43, 45, 46, 47, 49, 52, 53, 58, 59, 60, 70, 71, 74, 79, 80, 81, 82, 84, 85, 86,
87, 88, 90, 94, 95, 96, 99 (NACE code) declares that it has checked compliance by all the
organisations included in the environmental statement of the European Economic and
Social Committee and the Committee of the Regions with all provisions of Regulation
(EC) No 1221/2009 of the European Parliament and of the Council of 25 November 2009
on the voluntary participation by organisations in a Community eco-management and
audit scheme (EMAS).
By signing this declaration, I declare that:
• the verification and validation has been carried out in full compliance with the
requirements of Regulation (EC) No 1221/2009,
• the outcome of the verification and validation confirms that there is no evidence of
non-compliance with applicable legal requirements relating to the environment,
• the data and information of the environmental statement of the organisations reflect
a reliable, credible and correct image of all the organisations’ activities, within the
scope mentioned in the environmental statement.
This document is not equivalent to EMAS registration. EMAS registration can only be
granted by a Competent Body under Regulation (EC) No 1221/2009. This document shall
not be used as a stand-alone piece of public communication.
Done at Brussels, 16/07/2012
Signature
Bart Janssens,
Président de la Commission de Certification.
9. ConclusionsThe environmental indicators described in the preceding pages show a clear trend: over the last few years
we have seen a significant reduction in our environmental impact, specifically in terms of lower energy and
raw materials consumption, lower waste production, together with improvements in numerous other key
indicators.
In 2012, the challenge will be to maintain these positive results, or even to improve them, as EMAS is designed
as an ongoing improvement process and not as a snap-shot!
To this end, the EMAS group, Committee staff and building management technicians will have to step up
efforts even further, with the strong and sustained support of senior management. Communication will
therefore be a key part of this process in order to keep up motivation among all concerned. .
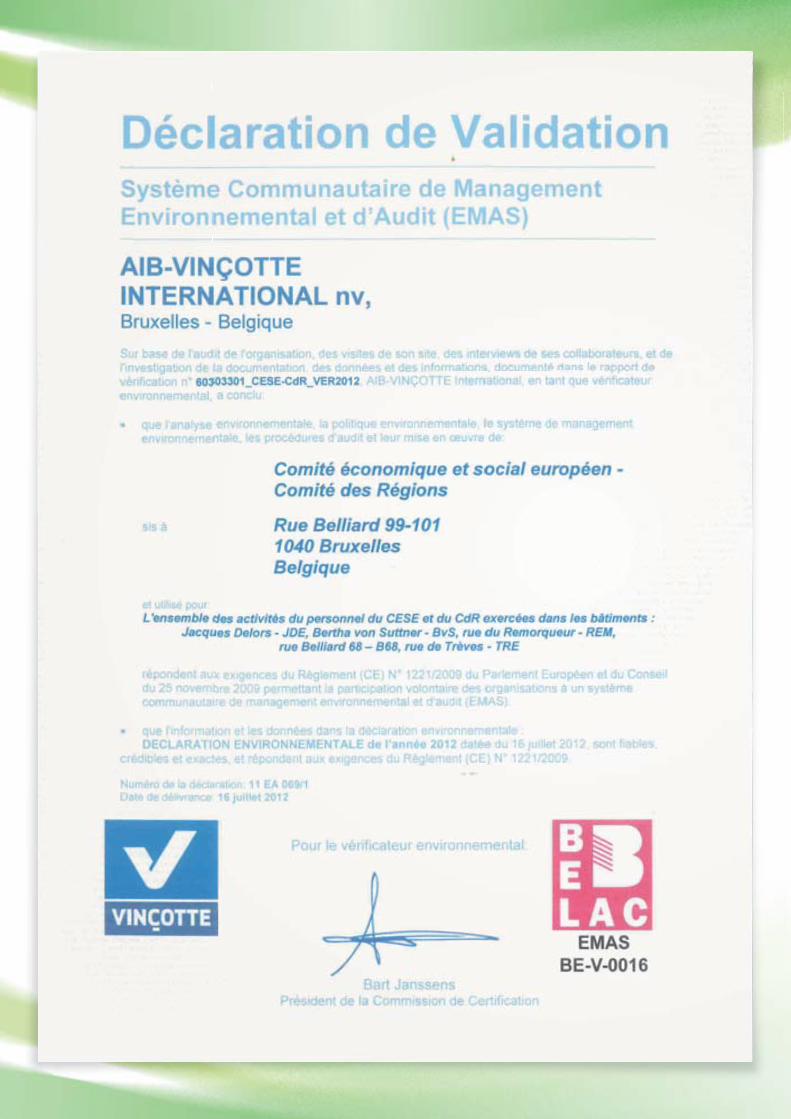

The next complete edition of the environmental statement (republication)
will be in July 2014. Data will be updated in July 2013.
© European Union, 2012
Reproduction is authorised provided the source is acknowledged..
This brochure is printed on 100% recycled paper