Environmental pollution is associated with increased risk ...
28
SHORT REPORTS Environmental pollution is associated with increased risk of psychiatric disorders in the US and Denmark Atif Khan 1 , Oleguer Plana-Ripoll ID 2,3,4 , Sussie Antonsen 2,3,4 ,Jørgen Brandt ID 5 , Camilla Geels ID 5 , Hannah Landecker ID 6 , Patrick F. Sullivan 7,8 , Carsten Bøcker Pedersen 2,3,4,9 , Andrey RzhetskyID 1,10 * 1 Department of Medicine, Institute of Genomics and Systems Biology, University of Chicago, Chicago, Illinois, United States of America, 2 National Centre for Register-Based Research, Aarhus BSS, Department of Economics and Business Economics, Aarhus University, Aarhus, Denmark, 3 Centre for Integrated Register-based Research, CIRRAU, Aarhus University, Aarhus, Denmark, 4 The Lundbeck Foundation Initiative for Integrative Psychiatric Research, iPSYCH, Aarhus, Denmark, 5 Department of Environmental Science, Aarhus University, Roskilde, Denmark, 6 Department of Sociology and the Institute for Society and Genetics, University of California Los Angeles, Los Angeles, California, United States of America, 7 Department of Medical Epidemiology and Biostatistics, Karolinska Institutet, Stockholm, Sweden, 8 Departments of Genetics and Psychiatry, University of North Carolina, Chapel Hill, North Carolina, United States of America, 9 Big Data Centre for Environment and Health, Aarhus University, Aarhus, Denmark, 10 Department of Human Genetics, Center for Data and Computing, University of Chicago, Chicago, Illinois, United States of America * [email protected] Abstract The search for the genetic factors underlying complex neuropsychiatric disorders has pro- ceeded apace in the past decade. Despite some advances in identifying genetic variants associated with psychiatric disorders, most variants have small individual contributions to risk. By contrast, disease risk increase appears to be less subtle for disease-predisposing environ- mental insults. In this study, we sought to identify associations between environmental pollu- tion and risk of neuropsychiatric disorders. We present exploratory analyses of 2 independent, very large datasets: 151 million unique individuals, represented in a United States insurance claims dataset, and 1.4 million unique individuals documented in Danish national treatment registers. Environmental Protection Agency (EPA) county-level environmental quality indices (EQIs) in the US and individual-level exposure to air pollution in Denmark were used to assess the association between pollution exposure and the risk of neuropsychiatric disorders. These results show that air pollution is significantly associated with increased risk of psychiatric disor- ders. We hypothesize that pollutants affect the human brain via neuroinflammatory pathways that have also been shown to cause depression-like phenotypes in animal studies. Editor’s Note This Short Report received both positive and negative reviews by experts. The Academic Editor has written an accompanying Primer that is published alongside this article (https:// doi.org/10.1371/journal.pbio.3000370). The linked Primer presents a complementary PLOS Biology | https://doi.org/10.1371/journal.pbio.3000353 August 20, 2019 1 / 28 a1111111111 a1111111111 a1111111111 a1111111111 a1111111111 OPEN ACCESS Citation: Khan A, Plana-Ripoll O, Antonsen S, Brandt J, Geels C, Landecker H, et al. (2019) Environmental pollution is associated with increased risk of psychiatric disorders in the US and Denmark. PLoS Biol 17(8): e3000353. https:// doi.org/10.1371/journal.pbio.3000353 Academic Editor: John P. A. Ioannidis, Stanford University School of Medicine, UNITED STATES Received: January 12, 2019 Accepted: July 17, 2019 Published: August 20, 2019 Copyright: © 2019 Khan et al. This is an open access article distributed under the terms of the Creative Commons Attribution License, which permits unrestricted use, distribution, and reproduction in any medium, provided the original author and source are credited. Data Availability Statement: The raw epidemiological data are available from IBM Health, subject to ethics review and a license agreement. Funding: This work was funded by the NordForsk project 75007: Understanding the Link Between Air Pollution and Distribution of Related Health Impacts and Welfare in the Nordic countries (NordicWelfAir); the DARPA Big Mechanism program under ARO contract W911NF1410333; by National Institutes of Health grants R01HL122712, 1P50MH094267, and U01HL108634-01; and by a
Transcript of Environmental pollution is associated with increased risk ...
SHORT REPORTS
Environmental pollution is associated with
increased risk of psychiatric disorders in the
US and Denmark
Atif Khan1, Oleguer Plana-RipollID2,3,4, Sussie Antonsen2,3,4, Jørgen BrandtID
5,
Camilla GeelsID5, Hannah LandeckerID
6, Patrick F. Sullivan7,8, Carsten
Bøcker Pedersen2,3,4,9, Andrey RzhetskyID1,10*
1 Department of Medicine, Institute of Genomics and Systems Biology, University of Chicago, Chicago,
Illinois, United States of America, 2 National Centre for Register-Based Research, Aarhus BSS, Department
of Economics and Business Economics, Aarhus University, Aarhus, Denmark, 3 Centre for Integrated
Register-based Research, CIRRAU, Aarhus University, Aarhus, Denmark, 4 The Lundbeck Foundation
Initiative for Integrative Psychiatric Research, iPSYCH, Aarhus, Denmark, 5 Department of Environmental
Science, Aarhus University, Roskilde, Denmark, 6 Department of Sociology and the Institute for Society and
Genetics, University of California Los Angeles, Los Angeles, California, United States of America,
7 Department of Medical Epidemiology and Biostatistics, Karolinska Institutet, Stockholm, Sweden,
8 Departments of Genetics and Psychiatry, University of North Carolina, Chapel Hill, North Carolina, United
States of America, 9 Big Data Centre for Environment and Health, Aarhus University, Aarhus, Denmark,
10 Department of Human Genetics, Center for Data and Computing, University of Chicago, Chicago, Illinois,
United States of America
Abstract
The search for the genetic factors underlying complex neuropsychiatric disorders has pro-
ceeded apace in the past decade. Despite some advances in identifying genetic variants
associated with psychiatric disorders, most variants have small individual contributions to risk.
By contrast, disease risk increase appears to be less subtle for disease-predisposing environ-
mental insults. In this study, we sought to identify associations between environmental pollu-
tion and risk of neuropsychiatric disorders. We present exploratory analyses of 2 independent,
very large datasets: 151 million unique individuals, represented in a United States insurance
claims dataset, and 1.4 million unique individuals documented in Danish national treatment
registers. Environmental Protection Agency (EPA) county-level environmental quality indices
(EQIs) in the US and individual-level exposure to air pollution in Denmark were used to assess
the association between pollution exposure and the risk of neuropsychiatric disorders. These
results show that air pollution is significantly associated with increased risk of psychiatric disor-
ders. We hypothesize that pollutants affect the human brain via neuroinflammatory pathways
that have also been shown to cause depression-like phenotypes in animal studies.
Editor’s Note
This Short Report received both positive and negative reviews by experts. The Academic
Editor has written an accompanying Primer that is published alongside this article (https://
doi.org/10.1371/journal.pbio.3000370). The linked Primer presents a complementary
PLOS Biology | https://doi.org/10.1371/journal.pbio.3000353 August 20, 2019 1 / 28
a1111111111
a1111111111
a1111111111
a1111111111
a1111111111
OPEN ACCESS
Citation: Khan A, Plana-Ripoll O, Antonsen S,
Brandt J, Geels C, Landecker H, et al. (2019)
Environmental pollution is associated with
increased risk of psychiatric disorders in the US
and Denmark. PLoS Biol 17(8): e3000353. https://
doi.org/10.1371/journal.pbio.3000353
Academic Editor: John P. A. Ioannidis, Stanford
University School of Medicine, UNITED STATES
Received: January 12, 2019
Accepted: July 17, 2019
Published: August 20, 2019
Copyright: © 2019 Khan et al. This is an open
access article distributed under the terms of the
Creative Commons Attribution License, which
permits unrestricted use, distribution, and
reproduction in any medium, provided the original
author and source are credited.
Data Availability Statement: The raw
epidemiological data are available from IBM Health,
subject to ethics review and a license agreement.
Funding: This work was funded by the NordForsk
project 75007: Understanding the Link Between Air
Pollution and Distribution of Related Health
Impacts and Welfare in the Nordic countries
(NordicWelfAir); the DARPA Big Mechanism
program under ARO contract W911NF1410333; by
National Institutes of Health grants R01HL122712,
1P50MH094267, and U01HL108634-01; and by a
expert perspective; it discusses how the current study should be interpreted, given the mod-
est effect size, potential biases, and other limitations.
Introduction
The increasing prevalence of mental disorders is a major global problem that affects millions
of people every year. In addition to personal suffering, psychiatric disorders are associated
with significant societal costs [1]. A number of putative contributors to the etiology of these ill-
nesses have been identified, but the majority of risk factors remain unknown. Mental illnesses
such as bipolar disorder and schizophrenia develop due to a complex interplay of genetic pre-
dispositions and life experiences or exposures [2–5]. In the last decade, the genetic underpin-
nings of mental disorders have been extensively studied. For instance, recent work has
identified 145 genome-wide significant associations for schizophrenia [6, 7]. However, genet-
ics alone cannot account for full phenotypic variation in mental health and disease, and it has
long been believed that genetic, neurochemical, and environmental factors interact at many
different levels to play a role in the onset, severity, and progression of these illnesses. The
major neuropsychiatric disorders cover a broad range of heritability values, leaving ample
room for environmental influences to play a role. From a comprehensive twin meta-analysis
[8], environmental effects contribute to a 55% to 66% risk for major depression, 32% risk for
bipolar disorder, and 23% risk for schizophrenia. Increased knowledge of environmental risk
factors is therefore vital for a more comprehensive understanding of disease causation.
What aspects of human environments are driving psychiatric and neurological disease preva-
lence? Recent umbrella reviews of epidemiological studies analyzing putative risk factors associ-
ated with common psychiatric and neurological disorders suggest several contributing factors to
mental health and well-being, such as individual attributes and behavior (medical illness, stress-
ful life events, substance abuse, cognitive and/or emotional immaturity), social circumstances
(poor access to basic services, unemployment, poverty, neglect, social injustice, relationship con-
flicts, work stress, exposure to violence, and abuse), and environmental factors (occupational
exposure, and exposure to pollution) [9–11]. These reviews stressed that well-designed and ade-
quately powered studies are necessary to map the environmental risk factors for psychiatric dis-
order. Studies of gene-environment interactions in the context of psychiatric disorders likewise
point to a wide range of factors interacting with genotype in mental disorder prevalence [2, 12–
15]. Historically, most of the attention to the environment as a causal factor in these studies has
focused on home or family environments, with an empirically-justified emphasis on childhood
adversity and trauma, [16] and, more recently, on prenatal influences [17].
Far fewer studies have explored the links between physical environments and mental ill-
nesses (see [18–22]), with a small subset of these specifically focused on environmental pollution
or its constituent toxicants [23]. Yet concern has been growing about the diverse negative health
effects of air pollution, raising the possibility that air quality may play an important role in men-
tal health and cognitive function. While the study of air pollution and health was originally
driven by dramatic events and drastic outcomes such as mortality during 1930 Meuse Valley
fog [24] due to the combination of industrial air pollution and climatic conditions, and the 1952
Great London Fog event [25–27], in which a multiple day temperature inversion concentrated
coal-based air pollutants and resulted in thousands of deaths, attention has been turning to the
question of chronic exposures and chronic diseases, including neurodevelopmental and neuro-
degenerative conditions [28, 29]. More recent events, such as the Eastern China smog in 2013
[30] and the New Delhi smog in 2017 [31] saw air pollution measurements reach record levels,
conditions that led to significant increases in morbidity and mortality rates. Such events have
Pollution and mental health
PLOS Biology | https://doi.org/10.1371/journal.pbio.3000353 August 20, 2019 2 / 28
gift from Liz and Kent Dauten. The funders had no
role in study design, data collection and analysis,
decision to publish, or preparation of the
manuscript
Competing interests: The authors have declared
that no competing interests exist.
Abbreviations: ADHD, attention deficit-
hyperactivity disorder; CAR, conditional
autoregressive; CDC, Centers for Disease Control
and Prevention; CI, confidence interval; CrI,
credible interval; DEHM, den Danske Eulerske
Hemisfæriske Model; EC, elemental carbon; EPA,
Environmental Protection Agency; EQI,
Environmental Quality Index; FDR, false discovery
rate; ICD-9-CM, International Classification of
Diseases, Ninth Revision, Clinical Modification; IL-
8, Interleukin-8; MCMC, Markov chain Monte
Carlo; NIH, National Institutes of Health; NIMH,
National Institute of Mental Health; OC, organic
carbon; PAH, polycyclic aromatic hydrocarbon;
PC1, first principal component; PCA, principal
components analysis; PCRR, Psychiatric Central
Research Register; PM, particulate matter; PM10,
particulate matter smaller than 10 µm; PR,
prevalence ratio; SIA, secondary inorganic aerosol;
SPREAD, SPatial high REsolution Distribution;
UBM, Urban Background Model.
led to considerable debate, along with an upsurge of environmental research, new government
regulation (e.g., the Clean Air Act of 1956 in the UK and the Chinese Air Pollution Control Law
in 2015), and heightened public awareness of the relationship between air quality and health.
Increasing interest in the effect of pollution on neuropsychiatric disorders has only recently
begun to direct attention toward the brain, with in vitro and animal model studies lending
mechanistic insight into how air pollution components can be neurotoxic [32, 33].
Our exploratory analysis and conclusions concerning the significant associations between
environmental quality and the rates of neuropsychiatric disorders are based on 2 independent,
very large datasets. The first dataset is the IBM Health MarketScan Commercial Claims and
Encounters Database [34], comprising insurance claims for 151,104,811 unique US individuals
from 2003–2013. MarketScan was previously used for numerous studies involving, for exam-
ple, estimation of prevalence of diseases in the US: traumatic brain injury [35, 36], attention
deficit-hyperactivity disorder (ADHD) [37], epilepsy [38, 39], and depression [40]. The second
dataset is the collection of Danish national treatment and pollution registers [41] comprising
all individuals born in Denmark between January 1, 1979, and December 31, 2002, who were
alive and residing in Denmark at their 10th birthday (1,436,702 unique individuals).
The environment for the US part of this study appears as 3 sets of variables at the county
level: (i) quality of air, water, land, and “built” environment (e.g., amount of vehicular traffic,
transit access, and pedestrian safety); (ii) weather indices split into number of days with at least
4 hours of pleasant weather (defined according to the design standards for climate-controlled
buildings) and number of days with at least 4 hours of harsh (either too hot or too cold)
weather (this last group of factors is useful in dissecting the outdoor environment’s positive
[open-air activities] and negative [pollution] influences); and (iii) sociodemographic factors,
such as median income, population density, and urbanicity, which are known risk factors for
many psychiatric disorders. Therefore, individuals’ exposures to pollutants were measured at a
county level for the US data. For the Denmark counterpart of our analysis, the environmental
factors were estimated as exposure to air pollution during the initial 10 years of life. Our
hypothesis was that these environmental factors causally contribute toward the onset and
development of the psychiatric disorders in exposed individuals.
Results
For the US cohort, we studied 4 psychiatric and 2 neurological conditions: bipolar disorder,
major depression, personality disorder, schizophrenia, epilepsy, and Parkinson disease, each
defined by sets of specific International Classification of Diseases, Ninth Revision, Clinical
Modification (ICD-9-CM) codes (see Methods section). When we refer to these 6 conditions
below, we are explicitly referring to data captured by IBM MarketScan database, which is the
treated prevalence inferred from US insurance claims (see Table 1); because the data were
potentially influenced by reporting biases, we refer to the IBM MarketScan disease rates as raw
rates, to be further adjusted for confounders.
Spatial patterns of putative environmental risk factors in the US
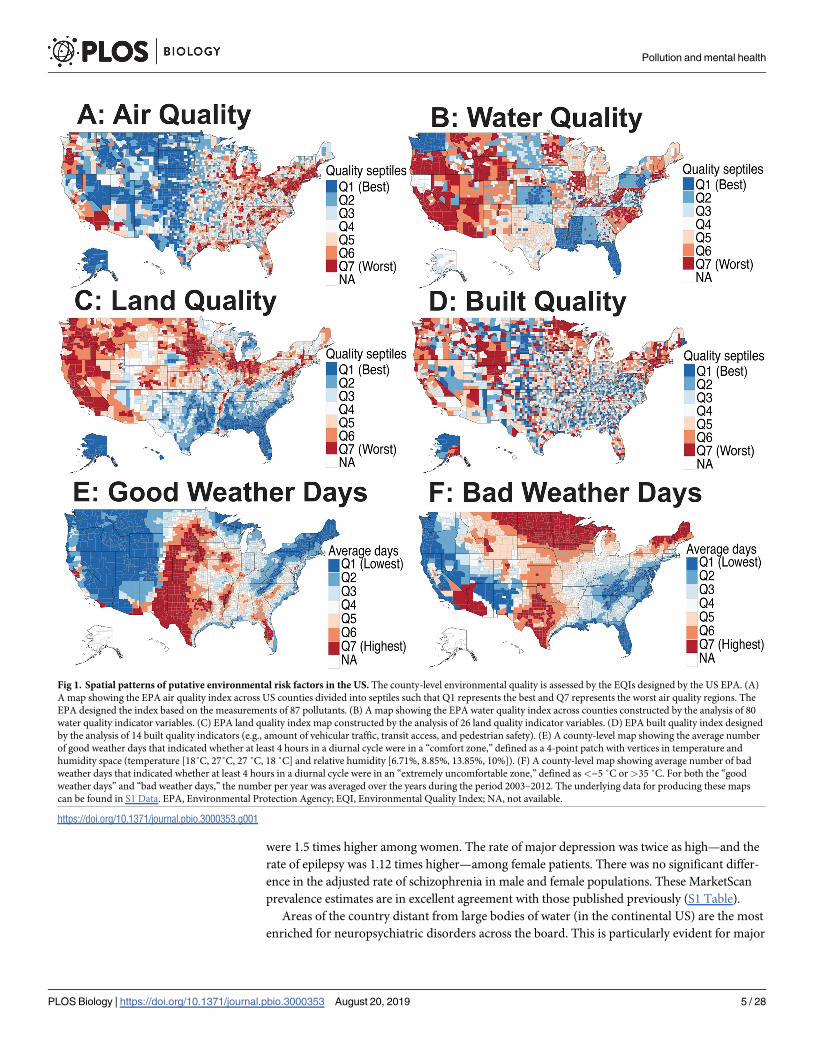
Spatial distribution of environmental risk factors varies significantly across the US (see Fig
1A–1D). Air quality (Fig 1A) is predictably worse near larger cities on both the US East and
West Coasts while generally much better in the middle of the country. Water quality (Fig 1B)
measurements showed very little variation across the US and is generally worse in the western
US, as well as in some interior states (e.g., Wyoming and Illinois). Resolution of the water qual-
ity data facet is not very high, as county water quality descriptors closely follow state bound-
aries. Land quality (Fig 1C) appears to be worse in the north of the continental US as well as in
Pollution and mental health
PLOS Biology | https://doi.org/10.1371/journal.pbio.3000353 August 20, 2019 3 / 28
the west. Importantly, land quality is not highly correlated with air quality across geographical
space, facilitating the disentanglement of associations between factors. Built quality (Fig 1D) is
patchy rather than continuous across counties. Regarding fair- and poor-weather days (Fig 1E
and Fig 1F), central US counties far from coasts tend to have many poor-weather days,
whereas coastal areas tend to be enriched with fair-weather days. Continental counties are cor-
related with a higher number of poor- and fair-weather days. The sociodemographic factors,
including population density, urbanicity, insurance status, and poverty, showed variable pat-
terns across the US (S1 Fig).
Raw prevalence, sex ratio, and spatial disease patterns in the US
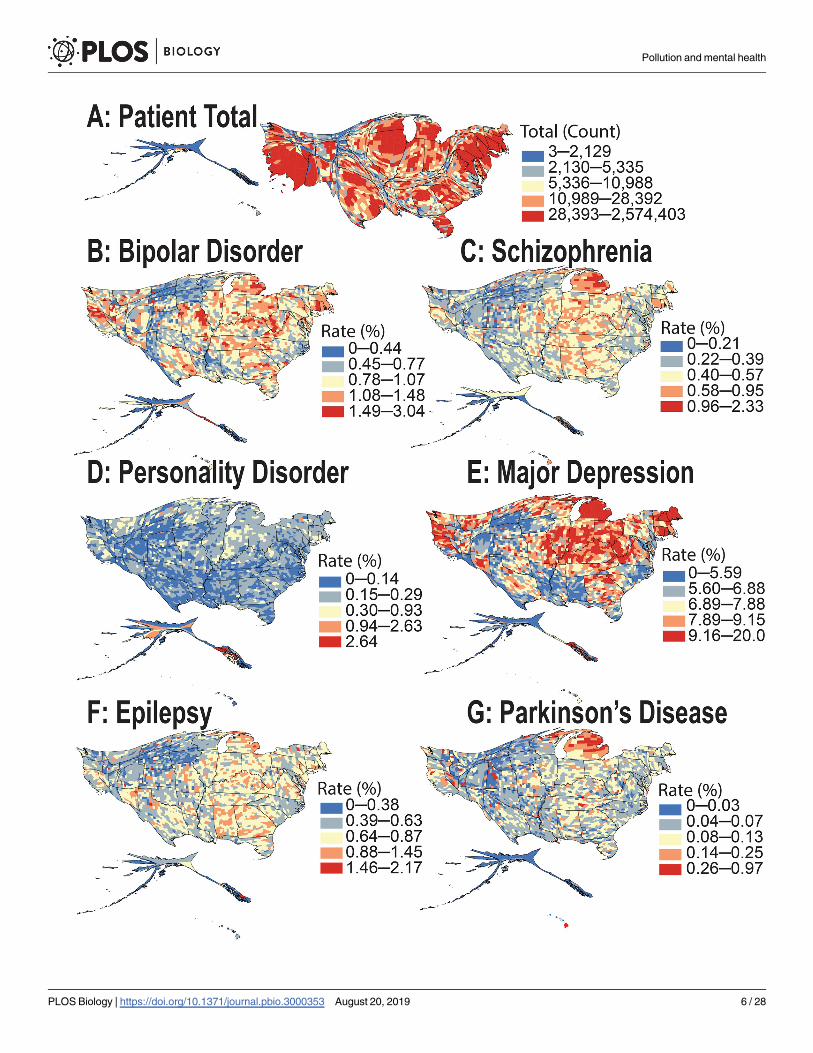
From the health insurance claims analysis of over 151 million individuals represented in the
IBM MarketScan database (during 2003–2013), the observed spatial patterns for the raw preva-
lence of 4 psychiatric and 2 neurological disorders in the US differ geographically to a remark-
able extent (Fig 2A–2G, S2 Fig and S3 Fig). The raw (unadjusted) prevalence rates for bipolar
and personality disorders were 0.82% and 0.15%, respectively, with both disorders 1.6 times
more prevalent among female patients. The prevalence of major depression was 6.64% and was
2.1 times more common among women. Prevalence of schizophrenia and epilepsy was 0.55%
and 0.62%, respectively, with both disorders at 1.2 times higher prevalence among female
patients. In contrast, Parkinson disease was 1.3 times more common in males, with an overall
prevalence of 0.16% (see Table 1). Note that after correcting for potential confounders [regres-
sion analysis], we found that the adjusted rates of bipolar disorder and personality disorder
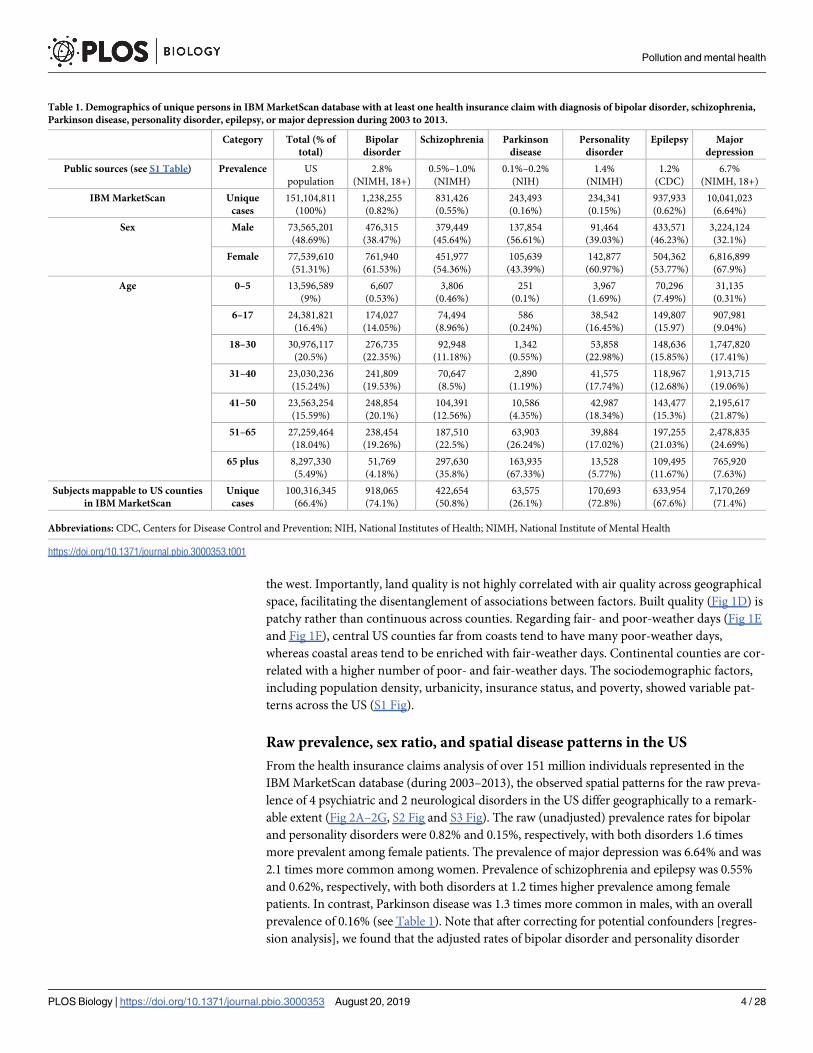
Table 1. Demographics of unique persons in IBM MarketScan database with at least one health insurance claim with diagnosis of bipolar disorder, schizophrenia,
Parkinson disease, personality disorder, epilepsy, or major depression during 2003 to 2013.
Category Total (% of
total)
Bipolar
disorder
Schizophrenia Parkinson
disease
Personality
disorder
Epilepsy Major
depression
Public sources (see S1 Table) Prevalence US
population
2.8%
(NIMH, 18+)
0.5%–1.0%
(NIMH)
0.1%–0.2%
(NIH)
1.4%
(NIMH)
1.2%
(CDC)
6.7%
(NIMH, 18+)
IBM MarketScan Unique
cases
151,104,811
(100%)
1,238,255
(0.82%)
831,426
(0.55%)
243,493
(0.16%)
234,341
(0.15%)
937,933
(0.62%)
10,041,023
(6.64%)
Sex Male 73,565,201
(48.69%)
476,315
(38.47%)
379,449
(45.64%)
137,854
(56.61%)
91,464
(39.03%)
433,571
(46.23%)
3,224,124
(32.1%)
Female 77,539,610
(51.31%)
761,940
(61.53%)
451,977
(54.36%)
105,639
(43.39%)
142,877
(60.97%)
504,362
(53.77%)
6,816,899
(67.9%)
Age 0–5 13,596,589
(9%)
6,607
(0.53%)
3,806
(0.46%)
251
(0.1%)
3,967
(1.69%)
70,296
(7.49%)
31,135
(0.31%)
6–17 24,381,821
(16.4%)
174,027
(14.05%)
74,494
(8.96%)
586
(0.24%)
38,542
(16.45%)
149,807
(15.97)
907,981
(9.04%)
18–30 30,976,117
(20.5%)
276,735
(22.35%)
92,948
(11.18%)
1,342
(0.55%)
53,858
(22.98%)
148,636
(15.85%)
1,747,820
(17.41%)
31–40 23,030,236
(15.24%)
241,809
(19.53%)
70,647
(8.5%)
2,890
(1.19%)
41,575
(17.74%)
118,967
(12.68%)
1,913,715
(19.06%)
41–50 23,563,254
(15.59%)
248,854
(20.1%)
104,391
(12.56%)
10,586
(4.35%)
42,987
(18.34%)
143,477
(15.3%)
2,195,617
(21.87%)
51–65 27,259,464
(18.04%)
238,454
(19.26%)
187,510
(22.5%)
63,903
(26.24%)
39,884
(17.02%)
197,255
(21.03%)
2,478,835
(24.69%)
65 plus 8,297,330
(5.49%)
51,769
(4.18%)
297,630
(35.8%)
163,935
(67.33%)
13,528
(5.77%)
109,495
(11.67%)
765,920
(7.63%)
Subjects mappable to US counties
in IBM MarketScan
Unique
cases
100,316,345
(66.4%)
918,065
(74.1%)
422,654
(50.8%)
63,575
(26.1%)
170,693
(72.8%)
633,954
(67.6%)
7,170,269
(71.4%)
Abbreviations: CDC, Centers for Disease Control and Prevention; NIH, National Institutes of Health; NIMH, National Institute of Mental Health
https://doi.org/10.1371/journal.pbio.3000353.t001
Pollution and mental health
PLOS Biology | https://doi.org/10.1371/journal.pbio.3000353 August 20, 2019 4 / 28
were 1.5 times higher among women. The rate of major depression was twice as high—and the
rate of epilepsy was 1.12 times higher—among female patients. There was no significant differ-
ence in the adjusted rate of schizophrenia in male and female populations. These MarketScan
prevalence estimates are in excellent agreement with those published previously (S1 Table).
Areas of the country distant from large bodies of water (in the continental US) are the most
enriched for neuropsychiatric disorders across the board. This is particularly evident for major
Fig 1. Spatial patterns of putative environmental risk factors in the US. The county-level environmental quality is assessed by the EQIs designed by the US EPA. (A)
A map showing the EPA air quality index across US counties divided into septiles such that Q1 represents the best and Q7 represents the worst air quality regions. The
EPA designed the index based on the measurements of 87 pollutants. (B) A map showing the EPA water quality index across counties constructed by the analysis of 80
water quality indicator variables. (C) EPA land quality index map constructed by the analysis of 26 land quality indicator variables. (D) EPA built quality index designed
by the analysis of 14 built quality indicators (e.g., amount of vehicular traffic, transit access, and pedestrian safety). (E) A county-level map showing the average number
of good weather days that indicated whether at least 4 hours in a diurnal cycle were in a “comfort zone,” defined as a 4-point patch with vertices in temperature and
humidity space (temperature [18˚C, 27˚C, 27 ˚C, 18 ˚C] and relative humidity [6.71%, 8.85%, 13.85%, 10%]). (F) A county-level map showing average number of bad
weather days that indicated whether at least 4 hours in a diurnal cycle were in an “extremely uncomfortable zone,” defined as<−5 ˚C or>35 ˚C. For both the “good
weather days” and “bad weather days,” the number per year was averaged over the years during the period 2003–2012. The underlying data for producing these maps
can be found in S1 Data. EPA, Environmental Protection Agency; EQI, Environmental Quality Index; NA, not available.
https://doi.org/10.1371/journal.pbio.3000353.g001
Pollution and mental health
PLOS Biology | https://doi.org/10.1371/journal.pbio.3000353 August 20, 2019 5 / 28
Pollution and mental health
PLOS Biology | https://doi.org/10.1371/journal.pbio.3000353 August 20, 2019 6 / 28
depression and bipolar disorder, and in Kentucky and Missouri, when comparing Fig 2A to
the rest of the subfigures. At the state level, Alaska shows more psychiatric disorder diagnoses
than expected for the overall population size—particularly for personality disorders and
schizophrenia. Hawaii shows higher-than-expected rates of Parkinson disease and schizophre-
nia, whereas Michigan has an apparent increased prevalence of Parkinson disease, major
depression, bipolar disorder, and schizophrenia. Our mixed-effect regression analyses sug-
gested that Michigan’s apparent higher rate across all disorders is associated with reporting
biases, visible in our analysis as high, state-specific random effects. The US East Coast experi-
ences a higher prevalence of these phenotypes than the West Coast (S2 Fig and S3 Fig). Geos-
patial clusters with a high prevalence of major depression are observed among almost all
counties of Michigan, New Hampshire, and Maine (Fig 2E and S3 Fig).
Association between environmental factors and the risk of neurological
and psychiatric disorders in the US
We considered several environmental factors for the prediction of neurological and psychiatric
disease diagnosis among different age and sex groups at the US county level. These factors
included the quality of air, water, land, built environment, and weather conditions. In addition,
population density, median income, ethnic and racial composition, and the percentages of poor
and insured populations were also included in the model. All environmental predictors were
transformed into septiles, with Q1 representing the best-quality and Q7 representing the worst-
quality regions (US counties). Similarly, for weather variables and sociodemographic covariates,
Q1 and Q7 represent the regions with the least and highest percentages, respectively. We report
the comparison of disease rates between referent group Q1 with all higher septiles (Q2–Q7).
Reviewing results of the application of our mixed-effect Poisson regression model, we
noticed significant variability in the prevalence of neuropsychiatric disorders across different
racial/ethnic groups (Fig 3A–3F). The strongest predictor of mood disorders (major depres-
sion and bipolar disorder) in a county was its percentage of white individuals (using US Cen-
sus race/ethnicity categories). By contrast, a higher percentage of black non-Hispanic
individuals was associated with higher rates of schizophrenia and epilepsy.
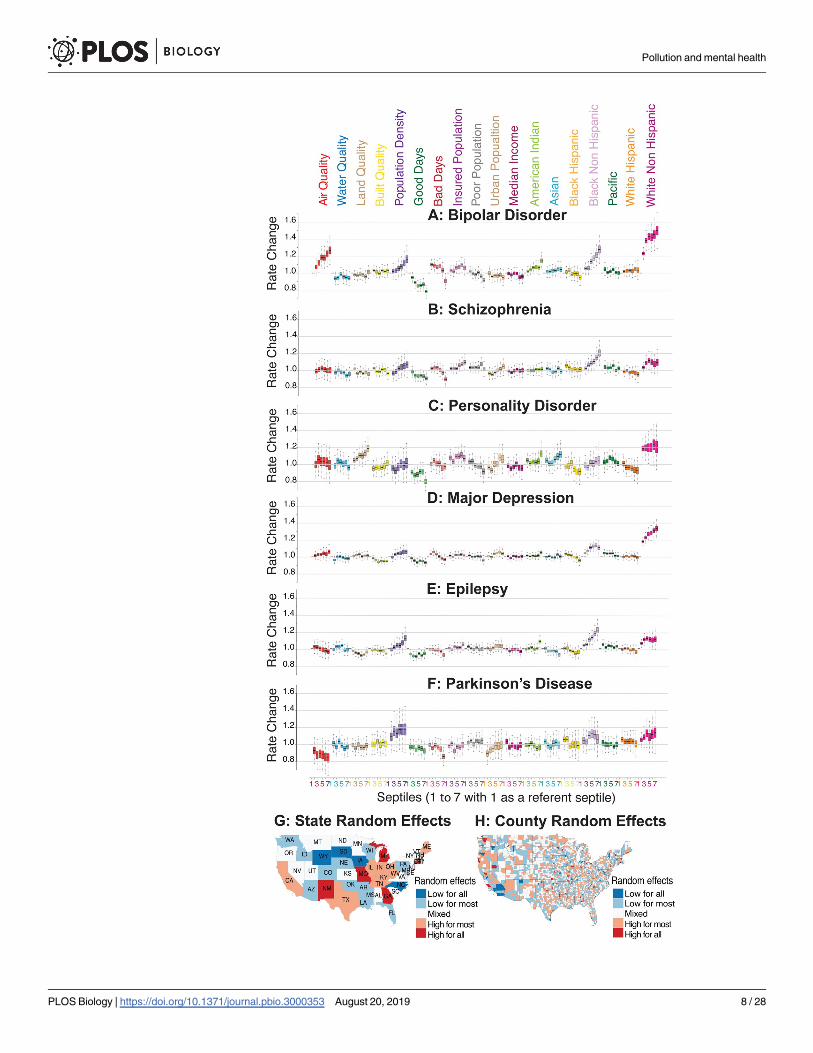
The strongest predictor for bipolar disorder diagnosis, after a population’s ethnicity compo-
sition, was air quality (defined by the US Environmental Protection Agency [EPA] Environ-
mental Quality Index [EQI]). The worst air quality was associated with an approximately 27%
increase (95% credible interval [CrI] 15%–40%, pMCMC<10−4) in the apparent rate of bipolar
disorder (Fig 3A and S2 Table). The estimated rate of bipolar disorder was 16.4% higher (95%
CrI 5.8%–29.6%, pMCMC = 0.0044) in the most densely populated counties (Fig 3A). For major
depression, a slight increase of 6% in the diagnosis rate (95% CrI 0%–12.4%, pMCMC = 0.05)
was observed only among the worst air quality regions (Q7). We also observed a positive asso-
ciation with a small effect size between population density, urbanicity, and the rate of major
depression diagnosis (see Fig 3D and S2 Table). Personality disorder was best predicted by
land pollution (Alaska and Hawaii were not included in this analysis because we did not have
matching high-resolution weather data). The regions with worst land quality (Q7) were
Fig 2. Cartogram maps showing the spatial patterns of apparent neurological and psychiatric disorder prevalence inferred from IBM MarketScan database.
(A) Cartogram map of the total patient population (151 million) present in the MarketScan database during 2003–2013. County and state land areas are rescaled in
proportion to their patient population, producing distorted maps. The squeezed regions contribute smaller shares of patient population compared to their
corresponding land area and vice versa. The total map area remains the same. The subsequent cartogram maps show the prevalence of 4 psychiatric disorders: (B)
bipolar disorder, (C) schizophrenia, (D) personality disorder, and (E) major depression, and 2 neurological disorders: (F) epilepsy and (G) Parkinson disease. The
underlying data for producing these cartogram maps can be found in S1 Data.
https://doi.org/10.1371/journal.pbio.3000353.g002
Pollution and mental health
PLOS Biology | https://doi.org/10.1371/journal.pbio.3000353 August 20, 2019 7 / 28
Pollution and mental health
PLOS Biology | https://doi.org/10.1371/journal.pbio.3000353 August 20, 2019 8 / 28
associated with an estimated 19.2% increase (95% CrI 8.8%–29.9%, pMCMC<10−4) in the
apparent rate of personality disorder (Fig 3C and S2 Table).
The apparent protective effect of pleasant weather days was high across all our target disor-
ders and was highest for bipolar disorder in our analysis. The counties with the highest num-
ber of pleasant weather days (Q7) were associated with an estimated 21.8% decrease (95% CrI
16.8%–26.8%, pMCMC<10−4) in the rate of bipolar disorder (Fig 3A–3F). At first glance, it
seems counterintuitive that across all studied psychiatric and neurological disorders, both
mean numbers of pleasant and harsh days would appear to be associated with a protective
effect in neuropsychiatric disorders (Fig 3A–3F). However, this is not a contradiction or error
because, in the continental climate, the number of days with at least 4 pleasant hours is
strongly correlated with the number of days with at least 4 harsh hours. In these places, the
same day can contribute to both the pleasant and the harsh list (e.g., pleasant in the early
morning or late evening and harsh at midday). Therefore, it is likely that one effect, possibly
the protective days with harsh weather (keeping individuals indoors, away from environmental
exposure to contaminated air and land), is causal, and another effect—the number of pleasant
days—is driven by a secondary correlation.
Random effects at the state and county levels showed dissimilar distribution across all 6 dis-
orders studied here. For example, random effects for Michigan, Missouri, New Mexico, and
Georgia were consistently high, whereas those for South Dakota, Iowa, Wyoming, and North
Carolina were consistently low (see Fig 3G and S4 Fig). There were relatively few counties in
which the county-level random effect was consistently low or high. For example, several coun-
ties in Southern California were low: San Diego, Imperial, Orange, and San Bernardino. Like-
wise, several counties were consistently high: San Luis Obispo in California and Snohomish
and King in Washington (see Fig 3H and S4 Fig).
Sensitivity analysis for the association between air quality and bipolar
disorder
In order to correct for multiple testing, we applied false discovery rate (FDR) correction to the
p-values obtained from the regression analysis. The association between air quality and bipolar
disorder remain statistically significant after FDR correction, whereas a previously observed
weak association of major depression with only worst air quality regions (Q7) did not survive
Fig 3. Relationship between environmental factors and neurological and psychiatric disorders in US. The results
from the US data analysis in which all predictor variables are divided into septiles (7 groups) with each septile
representing approximately 400 counties. Septile 1 (counties with the least exposure or the least percentage) is used as a
referent to compare the disorder rates in the higher septiles (counties with systematically higher exposures or
percentages). For air, water, land, and built qualities, a higher septile corresponds to the group of counties with poor
quality. Similarly, for all other variables, a higher septile represents a higher fraction or the corresponding percentages.
The estimated disorder rate from the mixed-effects regression model is shown for (A) bipolar disorder, (B)
schizophrenia, (C) personality disorder, (D) major depression, (E) epilepsy, and (F) Parkinson disease. (G) Map
showing the aggregated state-level random effects. The random effects for the 6 disorders are aggregated to produce 1
representative map. States shaded red show higher disorder diagnoses, and those shaded blue show lower disorder
diagnoses that is not captured by our model. An apparent high neurological and psychiatric disorder rate in the states
of Michigan, Missouri, Georgia, and New Mexico, and the apparent low rate in the states of South Dakota, Iowa,
Wyoming, and North Carolina could be associated with reporting biases. (H) Map showing aggregated, county-level
random effects. Random effects for the 6 disorders are aggregated to produce 1 representative map. Counties in red
show higher disorder rates, and those in blue show lower disorder rates not captured by our model. County-level
random effects can be thought of as residual variations not explained by fixed-effect predictors and state-level random
effects. There are relatively few counties in which the county-level random effect is consistently low. For example,
several counties are consistently low (San Diego, Imperial, Orange, and San Bernardino Counties in Southern
California), and several counties are consistently high (San Luis Obispo County in California and Snohomish and King
Counties in Washington). The underlying data for this figure can be found in S2 Table.
https://doi.org/10.1371/journal.pbio.3000353.g003
Pollution and mental health
PLOS Biology | https://doi.org/10.1371/journal.pbio.3000353 August 20, 2019 9 / 28

the multiple correction (S2 Table). We performed further sensitivity analysis to test the signifi-
cant association observed between air quality and the rate of bipolar disorder in the US. A vali-
dation study of bipolar disorder’s diagnosis in hospital discharge registers suggests that the
two-separate discharge diagnosis measure was sufficiently sensitive and specific for us to use
in our epidemiological study [42]. We further validated our model by considering a subset of
the population with at least 2 or more insurance claims diagnosed as bipolar disorder during
the study period of 2003–2013. A total of 906,175 individuals (345,318 males and 560,857
females) met this criterion. Validating the model with this new criterion showed similar trends
as reported above (S5A Fig and S6A Fig). Notably, air quality turned out to be the strongest
environmental predictor of bipolar disorder. The regions with worst air quality (Q7) showed a
29% increase (95% CrI 16.4%–43.4%, pMCMC<10−4) in the apparent rate of bipolar disorder
(see S5A Fig and S6A Fig). Lithium is often considered as a gold standard for treating bipolar
disorder [43, 44]. We ran an additional model by redefining the bipolar disorder cohort to
include individuals with a history of at least 1 dispensed prescription of lithium (37,964 indi-
viduals) in addition to those who had at least 1 insurance claim of bipolar disorder. The results
and the trends from these models were comparable to the results reported earlier (S5B and
S5C Fig). Random effects at the state and county levels showed dissimilar distribution across
all neuropsychiatric disorders (see S6B and S6C Fig).
Model validation and adjustment for spatial autocorrelation
The six neuropsychiatric disorders considered in this study showed variable degrees of spatial
autocorrelation at the county level. These spatial dependencies could potentially artificially
reduce variance in observations and inflate the effect size of the covariates, leading to biased
parameter estimates. To probe the importance of the spatial dependency of outcomes, we
tested both nonspatial and spatially explicit (conditional autoregressive [CAR]) models. Bayes-
ian analysis of very large datasets with hierarchical mixed-effects models and spatial correction
was computationally very expensive. Therefore, for this comparative analysis, we did not strat-
ify data by age and gender groups, and therefore the models do not represent age- and sex-cor-
rected estimates. Parameter estimates, analyses of residual spatial autocorrelation, and
Bayesian posterior predictive checks were used to compare model performances. For the non-
spatial model, we used a mixed-effect Poisson regression with the same exposure and covari-
ates as used previously (except for age and sex) and measured random effects at the state and
county levels. For the spatial model, we used county adjacency information (from the US Cen-
sus Bureau) to design binary, first-order adjacency weight matrix and corrected for spatial
autocorrelation using a CAR model. We tested for spatial autocorrelation among the residuals
using Moran’s I test and found no autocorrelation among the residuals.
Comparing 2 versions of spatial analysis, we observed slight variations in some of the
model estimates after accounting for spatial autocorrelation (S7 Fig and S3 Table). For bipolar
disorder, the comparison of best (Q1) and worst (Q7) air quality regions suggests that risk
increases by 29.7% (95% CrI 17.3%–43.3%) under nonspatial setting and by 23.4% (95% CrI
12.7%–36.3%) under spatial correction (S7 Fig and S3 Table). It should be noted that correc-
tion for spatial dependencies slightly reduced the estimated effect of air quality on the rate of
bipolar disorder, but the association remains strong and statistically significant. On the other
hand, a marginally higher rate of major depression (only among the worst air quality regions
[Q7]) remained consistent across the models. After correcting for spatial autocorrelation, the
estimated rate of personality disorder in the worst land quality regions (Q7) increased from
19.7% (95% CrI 9.4%–29.7%) to 25.9% (95% CrI 13.9%–37.7%) compared to the best land
quality regions (Q1) (S7 Fig and S3 Table). In general, for all disorders, the correction of spatial
Pollution and mental health
PLOS Biology | https://doi.org/10.1371/journal.pbio.3000353 August 20, 2019 10 / 28

dependencies slightly reduced the estimates for ethnicity, population density, and weather var-
iables (S7 Fig and S3 Table). With leave-one-out cross-validation, the comparison of nonspa-
tial and spatially explicit models suggests that the predictive performance decreases marginally
in all 6 models after adjusting for spatial autocorrelation. We tested for spatial autocorrelation
among the residuals by computing Moran’s I statistics and found no signs of spatial correlation
in any of the models, suggesting that first-order binary adjacency weights were sufficiently able
to eliminate spatial dependencies.
To further evaluate the robustness of the models, we split the data into 2 subsets (subset 1
and subset 2). For each state, we randomly assigned equal numbers of counties to both subsets.
The 2 subsets included representative samples from 49 states (excluding Alaska and Hawaii),
with subset 1 consisting of 1,532 and subset 2 consisting of 1,557 counties. For each neuropsy-
chiatric disorder, we produced separate models from subset 1 and subset 2 and tested them
against each other. In general, with few exceptions, the model estimates from subset 1 and sub-
set 2 were mostly consistent and comparable (S8 Fig). The association between air quality and
bipolar disorder remained significant in both the models. Importantly, model 1 suggested a
33.6% increase (95% CrI 16.1%–53.5%) and model 2 suggested a 29.6% increase (95% CrI
11.6%–50.7%) in the rate of bipolar disorder when comparing the worst air quality regions
(Q7) with the best air quality regions (Q1). When tested against one another, the 2 indepen-
dent models showed robust prediction capability, with Bayes R-Square for the bipolar disorder
models as follows: subset 1 (0.989) when tested on subset 2 (0.95), and subset 2 (0.987) when
tested on subset 1 (0.948). Models for other phenotypes similarly showed strong prediction
strength when tested with independent datasets (S9 Fig). These independent model validations
indicate robustness of the associations reported earlier in this study.
Childhood individual-level exposure to air pollution and the risk of
psychiatric disorders in Denmark
We used Danish national registers comprising all individuals born in Denmark between January
1, 1979, and December 31, 2002, who were alive and residing in Denmark at their 10th birthday
(1,436,702 unique individuals) to study 4 psychiatric disorders: bipolar disorder, schizophrenia,
personality disorder, and depression. We estimated air pollution exposure for all individuals from
birth until age 10 and studied the association between childhood exposure to air pollution and 4
psychiatric disorders. We performed principal components analysis (PCA) on 14 air quality indi-
cators to obtain a summarized measure of exposure to the air pollution (see S10 Fig, S11 Fig, and
Methods for details). We transformed air pollution exposure into septiles, with Q1 representing
the least exposure and Q7 representing the highest exposure to the air pollutants. It is important
to highlight here that, though the general concept and pipeline are similar, the exposure composi-
tion and the statistical model used for the Denmark data analysis are technically different from the
one used for the US analysis (see Methods for details). The high resolution of the Danish national
registers made it possible to estimate the exposure to air pollution at the individual level—in con-
trast with the US data analysis reported earlier, in which the exposure is measured at the county
level. These differences were primarily dictated by the availability and resolution of the data. Cau-
tion should be made in direct comparison of the results from cross-country analysis.
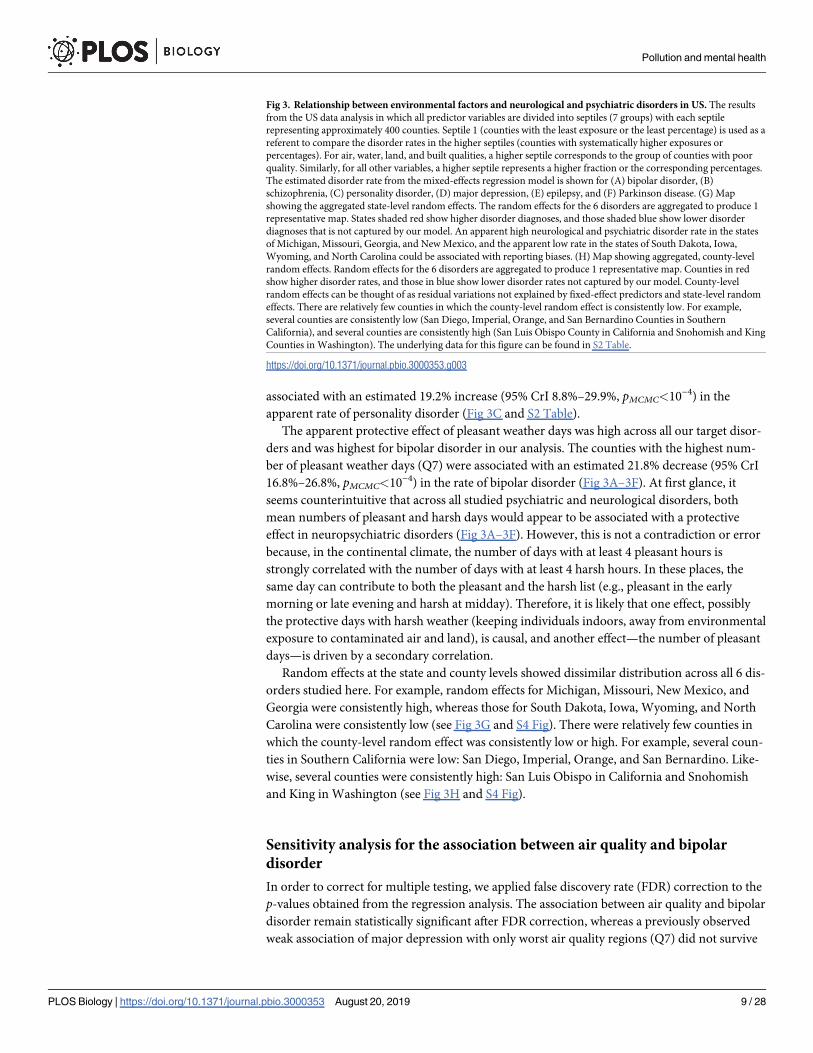
Results from the Cox regression models suggest that, for all 4 psychiatric disorders, the rate
of disorders increases with increasing levels of exposure to air pollution. The estimated rate of
schizophrenia was 148% higher (95% confidence interval [CI] 119%–180%, p< 2 × 10⁻¹⁶)
among individuals in the group with the highest exposure to air pollution (Q7) compared with
those with the least exposure (Q1, the referent group; shown in Fig 4 and S4 Table). The esti-
mated rate of bipolar disorder was 29.4% higher (95% CI 9.4%–52.9%, p< 3 × 10⁻³) and
Pollution and mental health
PLOS Biology | https://doi.org/10.1371/journal.pbio.3000353 August 20, 2019 11 / 28
24.3% higher (95% CI 4.5%–47.9%, p< 0.014) in the exposure categories Q6 and Q7, respec-
tively, compared with Q1. The strongest association was between air pollution and personality
disorder, showing a 162% increase (95% CI 142%–183%, p< 2 × 10⁻¹⁶) in the disorder rate
Fig 4. Association between air quality and the risk of psychiatric disorders in Denmark. The results from the Danish data analysis in which the individual-level
estimates of air quality exposure are divided into septiles, with each septile representing approximately 200,000 individuals. Septile 1 (representing the least exposure) is
used as a referent to compare disorder rates in the higher septiles for bipolar disorder, schizophrenia, personality disorder, and major depression. Higher septiles
represent individuals with systematically higher exposure to low-quality air. Five different models (labelled M0–M4) were run for each phenotype, briefly as follows: M0:
crude model with 7 air-quality–exposure groups; M1: M0 + calendar time using splines; M2: M1 + sex; M3: M2 but restricted to subset of population with no missing
covariates; and M4: M3 + socioeconomic status + urbanization. Further, to cross-validate the models, whole data were split into 2 equal subsets (subset A and subset B),
separate models were run on each subset, and the parameter estimates were compared. The figure shows estimates from subset A, subset B, and from the model using all
the data. The underlying data for this figure can be found in S4 Table.
https://doi.org/10.1371/journal.pbio.3000353.g004
Pollution and mental health
PLOS Biology | https://doi.org/10.1371/journal.pbio.3000353 August 20, 2019 12 / 28
among category Q7 compared with category Q1. The estimated rate of major depression
increased by 50.5% (95% CI 42.8%, 58.7%], p< 2 × 10⁻¹⁶) among the group with the highest
exposure to air pollution (Fig 4). (Note: The complete within-group comparison of estimated
rates can be found in Fig 4 and S4 Table.) The association between air quality and the risk of
all 4 psychiatric disorders remained statistically significant even after correcting for multiple
comparisons (see S4 Table).
To test the robustness of these model estimates, a cross-validation analysis was performed
on the Danish dataset. The whole cohort was randomly partitioned into 2 equal-size subsets
that were analyzed separately, and results of the analyses were compared (Fig 4). The two sub-
sets provided nearly identical results.
Harmonization of the US and Denmark data analysis
In the Denmark analysis, it did not make sense to aggregate data geographically by administra-
tive region when individual-level data at a resolution of 1 square kilometer were available. We
did run the analysis over the Denmark cohort using a Poisson model instead of Cox. The results
were very similar to the initial Cox regression analysis, as shown in the Supporting Information
(S12 Fig). To harmonize the analysis of data from 2 different countries, we adjusted the models
built on the Denmark data for potential socioeconomic confounders such as urbanicity, paren-
tal educational levels, income, and employment status (all measured at an individual level on
their 10th birthday). The information on these covariates was not readily available for the entire
study population, so a subset of the dataset was used for the subsequent analysis. The results
from the adjusted models were consistent and comparable to the results reported in the earlier
models (see Fig 4 and S4 Table). Notably, by adjusting for socioeconomic confounders, the pre-
viously estimated rate of bipolar disorder slightly diminished and that of personality disorder
increased, but the overall trend of association remained comparable.
The air quality index used in the US analysis (designed by the EPA) is a summary measure,
obtained from the PCA of mean exposure to the 87 air quality indicators, whereas for Den-
mark, the exposure is a summary indicator of 14 air quality indicators modeled from birth
until a patient’s 10th birthday. In an attempt to harmonize the 2 analyses, we performed a sen-
sitivity analysis by using the same air quality indicator variables across the 2 studies. First, we
recomputed the US county-level air quality index with a subset of 6 air components (carbon
monoxide [CO], nitrogen dioxide [NO2], ozone [O3], particulate matter smaller than 10 μm
[PM10], particulate matter smaller than 2.5 μm [PM2.5], and sulfur dioxide [SO2]) that were
available for both the US and Denmark. With a mixed-effect Poisson regression model, we
again observed a significant association between the air quality and risk of bipolar disorder in
the US. The counties with the worst air quality (Q7) showed an estimated 11.6% increase in
the rate of bipolar disorder (S13 Fig). Secondly, we reanalyzed Denmark data with the expo-
sure estimated from 6 air components discussed above. The estimates from these models were
again very similar and comparable. Specifically, the rate increase in the highest exposure group
(Q7) compared to the least-exposure group (Q1) was as follows: bipolar disorder 31.4% (95%
CI 7.4%–60.8%, p = 0.007), schizophrenia 104.3% (95% CI 76.3%–136.8%, p< 2 × 10⁻¹⁶), per-
sonality disorder 209.6% (95% CI 183.5%–238%, p< 2 × 10⁻¹⁶), and major depression 68.3%
(95% CI 57.9%–79.4%, p< 2 × 10⁻¹⁶) (S4 Table). (Note that we present complete results of this
analysis, for all 7 groups of environmental quality, in S4 Table.)
Analysis of individual air quality indicators
In this observational study, we hypothesized that different pollutants interact with each other
in a synergistic way that can be captured by PCA and represented by the first principal
Pollution and mental health
PLOS Biology | https://doi.org/10.1371/journal.pbio.3000353 August 20, 2019 13 / 28

component (PC1) of variation over the 87 air quality indicators. A downside of this approach
is that interpretation of the PCA in terms of air pollution is not necessarily straightforward.
The full study of space of exhaustive combinatorial interactions among 87 environmental fac-
tors will be computationally intractable, especially in a setting of Bayesian multilevel mixed-
effect regression. In addition, most of the air pollutants were multicollinear, preventing easy
disentanglement of their individual contributions. We performed a mixed-effect Poisson
regression analysis of the full collection of 87 US air quality indicators and identified several
strong predictors of bipolar disorder prevalence: cyanide compounds (variable A_CN), acro-
lein (A_ Acrolein), acrylonitrile (A_C3H3N), bromoform (A_Bromoform), epichlorohydrin
(A_ECH), polychlorinated biphenyls (A_PCBs), and vinyl acetate (A_ VyAc). The strongest
predictors in a similar analysis conducted for individual air components in the Denmark data-
set (across all 4 neuropsychiatric conditions) included nitrate (variable NO3_mean), ammo-
nium (NH4_mean), sulfate (SO4_mean), EC (EC_mean), and organic carbon (OC_mean).
Full results are available in S5 Table and S14 Fig.
Discussion
The datasets representing US and Denmark populations in this study have different strengths.
The US dataset is 2 orders of magnitude larger than the Danish dataset but is at a county level,
whereas the Danish dataset allows for the computation of individual-level pollutant exposure
during the first years of a patient’s life with a spatial resolution of 1 square kilometer. In the US
data, patient early-life trajectories are not known, and we had to estimate exposure using
county-level pollution measurements, assigning patients to their county of residence during
the period recorded in the insurance data. As some US counties are very large, we should
expect that the estimated quality for individual exposure would be degraded for such counties.
US environmental data have additional variables (e.g., land, built, and water quality) that are
not available for this study for Denmark. Data from Denmark included all eligible individuals,
with information from all psychiatric treatment facilities within the country in the context of
universal healthcare. The potential risk for selection or information bias is thus reduced.
Just as the 2 very large national datasets used in this study have different strengths, they also
have divergent limitations and biases. They reflect life in different cultures, with diverging
approaches to healthcare, population tracking, and environmental monitoring. For example,
apparent disease prevalence is affected by the ascertainment biases, diagnostic biases, social
stigma, and healthcare practices specific to a geographic area, and the variability across the
racial/ethnic categories in the data should be read with these qualifications in mind. Given
these many differences, it is all the more significant that the patterns we see in findings across
2 diverse countries are consistent for bipolar disorder. The Denmark analysis suggests that
poor air quality during the initial years of an individual’s life increases the risk of all 4 psychiat-
ric disorders studied here (bipolar disorder, schizophrenia, personality disorder, and major
depression). In the US data, we see a similar trend for bipolar disorder (and to some extent for
major depression) as that in Denmark, but the signal for schizophrenia and personality disor-
der is absent. It is likely that this difference is due to the limited resolution of the pollutant
exposure estimates for the US data. It is also possible that this difference is partially caused by
differences in study design, exposure composition, or country-specific genetic variation. Our
US analysis was, by necessity, focused on association of disease with recent influence of pollu-
tion, while Denmark data allowed for evaluating corresponding association with cumulative
long-term effect.
In our exploratory analysis, we found that poor air quality is associated with apparently
higher rates of bipolar disorder and major depression in both US and Danish populations. Air
Pollution and mental health
PLOS Biology | https://doi.org/10.1371/journal.pbio.3000353 August 20, 2019 14 / 28
pollution is a complex and variable mixture of small particulate matter (PM), gases, metals,
and organic contaminants generated by transport vehicles, industrial activity, and fires. To
quantify air pollution in the US, we used the EPA air quality index, which is a summary mea-
sure, obtained from the PCA of 87 potential air pollutants. These pollutants include PM10 and
PM2.5, as well as diesel emissions and NO2, itself often used as a proxy measure of air pollution,
and organic substances such as polycyclic aromatic hydrocarbons (PAHs). There are multiple
substances that contribute to the PC1 of the air pollution index shown in S15 Fig. Because mul-
tiple pollutants are collinear in their presence, we are unable to narrow the list of “suspect”
causal pollutants to a specific compound. It is likely that multiple pollutants contribute to dele-
terious effects on the human nervous system in an additive or synergistic way. It is also possi-
ble that measured pollutants serve as surrogate variables to an unmeasured pollutant that
causally affects human disorders. Ultrafine PM (<100 nm) and nanoscale PM (<200 nm), for
example, are not separately assessed in the EPA air quality index yet are likely to track other
indicators. Noise pollution likewise is outside the scope of these indices but is likely to track
other indicators of vehicular and industrial emissions [45].
Growing evidence from human, animal, and in vitro studies demonstrates that airborne
pollutants target the brain and are implicated in neurological and psychiatric disorders etiol-
ogy [46–49]. Yet bipolar disorder’s and depression’s links to air pollution have not been exam-
ined to the same degree as other environmental factors such as psychosocial stressors; at the
same time, studies of air pollution and the central nervous system have focused on disorders of
neurodevelopment and aging such as autism and Alzheimer disease. The patterns uncovered
in our data underline the potential importance of the physical milieu to bipolar disorder and
depression research.
Potential mechanisms
The associations detected in this observational study necessitate an explanation via likely bio-
logical mechanisms linking environmental exposures to neurological and psychiatric disor-
ders. The most causally convincing studies involve experiments with animals. Significantly, a
growing number of experimental animal studies tie environmental factors to inflammatory
and cytotoxic damage to neural tissues and to psychiatric disorders. Below, we highlight those
studies lending mechanistic insight into potential causal pathways underlying our observed
associations.
In an early seminal study, healthy feral dogs chronically exposed to traffic-related pollution
were studied by detailed analysis of tissue pathology [46]. Exposed dogs showed marked
increases in cytopathological, immunological, and genetic damage responses in the lung and
nasal epithelium, blood-brain barrier, and cortical and subcortical cells. Three pathways by
which PM is likely to affect the brain were suggested, as follows. (A) Indirect transport of pollut-
ants via the lungs leads to systemic inflammation. Fine PM first induces respiratory tract inflam-
mation, which then leads to systemic inflammation of peripheral sensory nerves. This results in
the production of brain cytokines, activation of microglia, and genomic oxidative damage; (B)
direct transport by way of intravascular brain macrophages, the downstream effects of which are
the same as the first pathway; and (C) direct transport of pollutants to the brain via nasal respira-
tory damage. In this pathway, olfactory neurons transport fine PM directly to the brain, produc-
ing direct toxic damage to the limbic system and brain degeneration due to oxidative stress.
All 3 pathways of brain exposure to pollution are likely to be present in humans, supported
by postmortem brain tissue studies indicating the physical presence of vanadium and nickel
PM from air pollution, as well as evidence of microglial activation and neuroinflammation
[50]. Recent rodent model studies similarly point to both systemic and nose-to-brain routes
Pollution and mental health
PLOS Biology | https://doi.org/10.1371/journal.pbio.3000353 August 20, 2019 15 / 28

for pollution impacts on the brain. Analysis of rats exposed to different fractions of airborne
PM captured from Riverside, California, showed that 1- to 3-month exposures to PM2.5–10
resulted in both metal accumulation in the brain and up-regulation of genes in inflammatory
cytokine pathways as well as some linked to tumorigenesis [47]. In another study, healthy
4-week-old male mice were exposed to urban-like ambient fine airborne PM pollution in labo-
ratory conditions for 10 months [48]. The animals were subjected to behavioral tests and a bat-
tery of analyses. Analysis of tissues of the exposed animals revealed inflammation of brain
tissues [51], especially in the hippocampus. Moreover, exposed animals showed signs of cogni-
tive impairment in spatial learning and memory and depression-like behavioral symptoms.
Neuroinflammation, excitotoxicity, and psychiatric disorders
Thus, is it clear that both systemic and direct nose-to-brain routes generate neuroinflammation
and oxidative stress. This is important for the current analysis because neuroinflammatory and
excitotoxic processes have been linked to psychiatric disorders generally and bipolar disorder in
particular in animal models and human patients. Because microglia shift from a quiescent to an
activated state and secrete pro-inflammatory cytokines and reactive oxidants when the brain is
injured or their microenvironment is perturbed, the activation of microglia and the cytokines
they produce have come under particular scrutiny. Analysis of postmortem frontal cortex tissue
from bipolar disorder patients compared to matched controls showed higher mRNA and pro-
tein levels of biomarkers of neuroinflammation, as well as signs of increased excitotoxicity [52].
Studies of neuroinflammatory markers in cerebrospinal fluid show increased levels of interleu-
kin-8 (IL-8) in euthymic bipolar patients versus controls, which also correlated with lithium
treatment [53]. A study of heightened neuroinflammation markers in relation to clinical out-
comes was inconclusive; the authors hypothesize that these markers may indicate a vulnerability
to the disorder rather than a reflection of disease course [54].
Depression has also been linked to neuroinflammation and microglia dysregulation, for exam-
ple, after traumatic brain injury [55]. Animal models of depression generated using chronic stress
frameworks such as repeated social defeat or foot-shock show activation and increased branching
of microglia and related inflammatory markers, supporting the hypothesis that microglial
homeostasis perturbations are part of depression’s underlying disease process [56]. Interestingly,
stress-induced depression may also be associated with microglial decline and senescence [57].
As noted above, there is a strong tendency to equate “environment” in neurological and
psychiatric disorders with psychosocial family milieu or infectious disease. Our results indicate
that the physical environment, in particular air quality, warrants further attention in research
seeking to elucidate environmental contributors to neurological and psychiatric disease risk.
In conclusion, we observed a strong positive association between exposure to environmental
pollution and an increase of prevalence in psychiatric disorders in affected patients. Converg-
ing data points to neuroinflammatory mechanisms linking environmental compounds to their
putative psychiatric consequences. However, these strong associations do not necessarily
mean causation; further research will be needed to assess whether air pollution’s neuroinflam-
matory impacts share common pathways with other stress-induced conditions.
Methods
Ethics statement
The University of Chicago IRB determined that the study is IRB exempt, given that patient
data in both countries were preexisting and de-identified.
We first present the materials and methods used for the analysis of the US cohort followed
by a similar description for the Danish cohort.
Pollution and mental health
PLOS Biology | https://doi.org/10.1371/journal.pbio.3000353 August 20, 2019 16 / 28
Data sources for the US analysis
We used the IBM MarketScan health insurance claims database [34] that includes both inpa-
tient and outpatient claims, medical procedures, and prescription medications for 151,104,811
unique patients for the period of 2003 to 2013. The IBM MarketScan health claims database is a
compilation of patient records from over 100 insurance carriers and large, self-insuring compa-
nies in the US. The approved claims are linked across years and geocoded at the county level. In
addition to diagnostic and prescription medicine claims, records include patient’s age, sex, and
geolocation aggregated to the county level. Individual-level race/ethnicity was not available in
the MarketScan database; therefore, 2010 US Census [58] data were used to link county-level
percent racial distributions for the following groups: American Indian, Asian, black Hispanic,
black non-Hispanic, Pacific Islander, white Hispanic, and white non-Hispanic.
We used the EQI [59, 60], a summary measure constructed by the US EPA, to represent the
environmental quality of all counties in the US. The EQI represents 5 US county-level environ-
mental domains (air, water, land, built, and sociodemographic) that are further incorporated
into a single index for the years 2000 to 2005. Data sources and the construction of the EQI
have been described in detail by the EPA [59, 60]. Briefly, 187 data sources were evaluated for
inclusion; those that were retained for their data quality and availability at the county level for
the entire US enabled the use of 219 unique variables across each of the 5 domains: air (87),
water (80), land (26), built (14), and sociodemographic (12). A PCA, performed individually
on each domain, produced 5 domain-specific indices for the corresponding environmental
domain. For most states, the water quality showed very little variation within the state. Two
additional datasets, DAYMET [61] and North American Land Data Assimilation Systems [62],
were used to link weather-related variables.
Disease outcomes
The IBM MarketScan dataset includes time-stamped patient treatment episodes with individ-
ual patient diagnoses. These treatment episodes, both inpatient and outpatient, are represented
with ICD-9 codes; patient sex and age were also recorded, with each patient visible from 1 to
11 years (during 2003 to 2013) in the dataset. The de-identified version of the dataset used
here also contains limited data about the geographic location of patients at the US county
level, which helped us in estimating the environmental exposures.
We studied 4 psychiatric and 2 neurological disorders: bipolar disorder, major depression, per-
sonality disorder, schizophrenia, epilepsy, and Parkinson disease, each disorder defined by sets of
specific ICD-9 codes. We framed our analysis around bipolar disorder and performed compara-
tive analysis with schizophrenia, Parkinson disease, personality disorder, major depression, and
epilepsy. The outcome, bipolar disorder, observed in either inpatient or outpatient settings, was
defined as patients with a bipolar disorder claim over the period of 2003–2013, identified in Mar-
ketScan database by ICD-9 code 296.x (where x refers to 296.00, 296.01, 296.02, 296.03, 296.04,
296.05, 296.06, 296.10, 296.11, 296.12, 296.13, 296.14, 296.15, 296.16, 296.40, 296.41, 296.42,
296.43, 296.44, 296.45, 296.46, 296.50, 296.51, 296.52, 296.53, 296.54, 296.55, 296.56, 296.60,
296.61, 296.62, 296.63, 296.64, 296.65, 296.66, 296.7, 296.80, 296.81, 296.82, 296.89, 296.90, and
296.99). Similarly, we used ICD-9 codes to capture a broad definition of schizophrenia (295.x,
298.x, and 293.82 for psychotic disorder with delusions and 293.82 for psychotic disorder with
hallucinations); 332.x for Parkinson disease; 301.x for personality disorder; 296.2x, 296.3x, and
311 for major depression; and 345.x for epilepsy. When we refer to these 6 conditions, we are
explicitly referring to data captured by IBM MarketScan, which is the treated prevalence inferred
from US insurance claims; because the data was potentially influenced by reporting biases, we
refer to the IBM MarketScan disease rates as raw rates, to be further adjusted for confounders.
Pollution and mental health
PLOS Biology | https://doi.org/10.1371/journal.pbio.3000353 August 20, 2019 17 / 28
Environmental risk factors
The environment appears in our model as 3 sets of variables at the US county level: (i) quality
of air, water, land, and “built” environment (e.g., amount of vehicular traffic, transit access,
and pedestrian safety). These data were divided into septiles, with septile 1 representing the
best and septile 7 the worst environmental quality (Fig 1A–1D); (ii) weather indices split into a
number of days with at least 4 hours of pleasant weather (defined according to the design stan-
dards for climate-control buildings), and number of days with at least 4 hours of harsh (either
too hot or too cold) weather (Fig 1E–1F). This last group of factors is useful in dissecting the
outdoor environment’s positive (open-air activities) and negative (pollution) influences; and
(iii) Population density and urbanicity status (S1 Fig), known risk factors for many psychiatric
disorders.
The domain-specific EQIs for air, water, land, and built quality were used as the main expo-
sure variables. We conducted analyses using septiles of the domain-specific EQIs to compare
higher septiles (7 = worse quality) to the lowest septile (1 = best quality) across all US counties.
Our model also included county-level median income, population density, and the percentages
of poor, insured, and urban population (see S1 Fig). In this study, we made use of 2 county-
level weather variables. The first weather variable was a measure for “good days” that indicated
whether at least 4 hours in a diurnal cycle were in a “comfort zone,” defined as a 4-point patch
with vertices in temperature and humidity space (temperature [18 ˚C, 27 ˚C, 27 ˚C, 18 ˚C] and
specific humidity [6.71%, 8.85%, 13.85%, 10%]). The second weather variable was a measure of
“bad days” that indicated whether at least 4 hours in a diurnal cycle were in an “extremely
uncomfortable zone,” defined as< −5 ˚C or > 35 ˚C. Good days and bad days are not mutu-
ally exclusive; for each, the number per year was averaged over the years during the period
2003–2012. The 4-hours-per-day measure was selected as a reasonable time interval that can
be used for outdoor activities. We did not perform a maximization of association of weather
predictors and disorder rates to select these indices.
Statistical analysis
We used a mixed-effects regression, modeling counts of neurological and psychiatric disorders
per (age and sex) group per county with a Poisson distribution, where the logarithm of the
Poisson rate is defined by a linear combination of predictors and random effects. We imple-
mented this approach using Markov chain Monte Carlo (MCMC) algorithms. Time in our
regression analysis was handled in the following way: for each county/demographic group, we
computed the “offset,” which we defined as the total number of patients in a given county, visi-
ble to the dataset within the 11-year interval (2003–2013). The IBM MarketScan database com-
prised a total of 151,104,811 unique individuals; 79.48% of them had at least 1 disease-specific
claim recorded in the dataset, and 53.89% had at least 1 medication-specific claim. Overall,
about 17.61% of the individuals did not have any disease- or medication-related claims and
were considered as healthy insured individuals. Our analysis consisted of a subset of the IBM
MarketScan database restricting to those individuals whose place of residence was known at
the US county level (Table 1). We used a county-identifiable IBM MarketScan population of
100,316,345 for computing the offset. For each disorder and county, we computed the unique
number of patients with a disorder diagnosis; we again stratified patients by sex and age within
the county. We then used both offsets and counts of patients with the disorder diagnosis in the
mixed-effect regression model. Fixed-effect covariates included individual-level sex (female as
a referent); individual-level age category (0–5 [referent], 6–17, 18–30, 31–40, 41–50, 51–65,
and 66 and above); county-level race/ethnicity; median income; the quality of air, water, land,
built, and weather; and percentages of poor and insured population.
Pollution and mental health
PLOS Biology | https://doi.org/10.1371/journal.pbio.3000353 August 20, 2019 18 / 28
We transformed county-level sociodemographic variables, population density, weather var-
iables, and racial composition into septiles such that higher septiles represent higher numbers
and percentages. Similarly, we transformed air, water, land, and built EQIs into septiles such
that higher septiles represent worse quality. We modeled these variables comparing different
septiles to estimate relative prevalence ratios (PRs) and CrIs. In addition to the fixed effect,
random effects were measured at the county and the state levels. State-level random effects
likely absorbed state-specific differences in both disorder reporting and true prevalence,
whereas the county-level random effects can be thought of as residual variations not explained
by our fixed-effect predictors and state-level random effects. We ran several models and com-
pared them by using deviance information criteria. For each model, 120,000 MCMC iterations
were run with a burin of 20,000 and a thinning interval of 10. The statistical analyses were con-
ducted in R version 3.4.0 and RStudio version 1.0.143 using a mixed-effect regression model
implemented in MCMCglmm package [63].
Cross-validation and adjusting for spatial autocorelation
The 6 neuropsychiatric disorders considered in this study showed variable degrees of spatial
autocorrelation between the observations. These spatial dependences have tendency to artifi-
cially reduce variance in observations and inflate the effect size of covariates, leading to the
biased estimates from regression analysis. To uncover the consequences of overlooking this
spatial dependency component, we tested both nonspatial and spatially explicit (CAR) models.
The mixed-effects hierarchical models with big data and Bayesian framework were computa-
tionally very expensive with no guarantee of convergence, so we reduced the model complexity
and computation time by aggregating (previously age- and sex-stratified) disease data at the
US county level; for each county, we obtained the count of individuals with the respective dis-
ease diagnosis and the total number of individuals at risk. In other words, for comparing spa-
tially explicit and nonspatial models, we did not stratify data by the age and gender groups,
and hence the models do not represent age- and sex-corrected estimates. Parameter estimates,
analyses of residual spatial autocorrelation, and Bayesian posterior predictive checks were used
to compare model performance.
We used county adjacency information (from the US Census Bureau) to a design binary,
first-order adjacency weight matrix that has been previously reported to be a good choice for
Bayesian models [64]. Neighbors are defined as counties that share a common boundary, and
a weight of 1 was assigned if the 2 counties are neighbors and 0 otherwise. We used mixed-
effects Poisson regression with the same exposure and covariates as used previously (except for
age and sex) and measured random effects at the state and the county levels. In addition, we
corrected for spatial autocorrelation using a CAR model. Because we used a slightly different
implementation of the model in contrast to the one mentioned previously, we provide com-
parative analysis of nonspatial and spatially explicit models to make a fair comparison. We
evaluated the spatial autocorrelation among the residuals using Moran’s I test.
Thereafter, we validated nonspatial and spatially explicit models using leave-one-out cross-
validation. To further evaluate the robustness of the models, we split the data into 2 subsets
(subset 1 and subset 2), produced independent models from each subset, and tested them
against each other. In order to have a complete state-level sample representation, we randomly
picked a similar number of counties from each state and assigned them to either of the subsets.
Subset 1 and subset 2 represented 1,532 and 1,557 counties, respectively (note that we did not
match counties in subset 1 and 2 based on any predictor variable or covariates such as urbani-
city, environmental quality, weather quality, etc.). We evaluated the model predictive perfor-
mance by using Bayes R-Square [65].
Pollution and mental health
PLOS Biology | https://doi.org/10.1371/journal.pbio.3000353 August 20, 2019 19 / 28

For each model, we ran 4 MCMC chains each with 3,500 iterations and burin of 1,500. We
used R version 3.4.0 and RStudio version 1.0.143 using a mixed-effect regression model with
spatial autocorrelation structure implemented in BRMS package [66].
Key assumptions
This is an observational study that has several limitations and assumptions. The results
reported in this study should be interpreted with these assumptions in mind. First, the “envi-
ronment” in our analyses refers to the outdoor environment. The EPA has converted these
outside environment measurements to EQIs, where the use of EQI as a measure of exposure
assumes that exposure to “environment” is consistent in all individuals but the extent of envi-
ronmental exposure was not assessable. Second, we generated the data corresponding to the
observed counts of people within each county diagnosed with bipolar disorder, schizophrenia,
Parkinson disease, personality disorder, major depression, and epilepsy using a Poisson pro-
cess with the rate varying over the counties. The logarithm of Poisson rate of disease rate
depends on a linear combination of fixed and random effects. Third, we used the count data
from the insurance claims resulting in diagnosis of specific conditions in which we did not
take disease severity into account. Finally, the MarketScan database has claims ranging from
the year 2003 to 2013, and the EPA’s EQI database was constructed based on the counties’ data
from 2000 to 2005. Using the air quality index, we grouped counties into septiles, with each
septile representing slightly over 400 counties. We assumed that the county-level environmen-
tal quality (in terms of septiles) did not change drastically between 2006 and 2013.
Validation on Danish national cohort
Study population. Since 1968, the Danish Civil Registration System [41] has maintained
information on all residents, including sex, date of birth, continuously updated information
on vital status, and a unique personal identification number that can be used to link informa-
tion from various national registries. The study included data about all Danes who were born
in Denmark between January 1, 1979, and December 31, 2002, and were alive and residing in
Denmark at their 10th birthday (N = 1,436,702) [41]. Individuals who were born between the
two dates but emigrated or died before their 10th birthday were excluded from the analysis. In
addition, there were 1,628 (0.1% of the total study population) individuals for whom there was
no information regarding exposure to air pollution who were excluded from the analysis. The
final study population consisted of 1,435,074 individuals who were followed from their date of
birth until the end of 2016.
Exposure estimation. The integrated Danish air quality dispersion modelling system
THOR [67, 68] was used to model the atmospheric concentration of 14 compounds; CO, ele-
mental carbon (EC), organic carbon (OC), ammonium (NH4), NO2, nitrate (NO3), nitrogen
oxide (NOX), O3, PM10, PM2.5, sea salt, secondary inorganic aerosols (SIAs), SO2, and sulfate
(SO4) for the period of 1979 and onwards with a spatial resolution of 1 km × 1 km. The THOR
system is a coupling between the regional model den Danske Eulerske Hemisfæriske Model
(DEHM) [69, 70] covering the Northern Hemisphere and the Urban Background Model
(UBM) covering Denmark with a spatial resolution of 1 km × 1 km. For this area, high-resolu-
tion emission data based on the SPatial high REsolution Distribution (SPREAD) model for
emissions to air [71] were included. The model simulations cover the period from 1979 and
onwards. We summed the daily mean concentration of 14 environmental compounds at each
individual’s residential address (extracted from the 1 km × 1 km dataset) from birth until their
10th birthday and subsequently divided the result by the total number of daily data points avail-
able to get a mean individual-level exposure to the air pollution. The completeness of Danish
Pollution and mental health
PLOS Biology | https://doi.org/10.1371/journal.pbio.3000353 August 20, 2019 20 / 28
data was very high; indeed, a total of 1,401,515 persons (97.7%) had information on exposure
measurements available on 90% or more of the days from birth until their 10th birthday.
In accordance with the design of the US EPA’s air quality index [59], we performed a PCA
on the mean individual-level exposure to the 14 environmental compounds for complete
study population and retained the PC1 as being representative of the individual-level exposure
to air pollution (S10 Fig and S11 Fig). We further divided PC1 into 7 groups and compared
psychiatric disorder rate among individuals in each of the 6 highest PC1 groups (Q2–Q7),
with the rate among individuals in referent group Q1 (Fig 4).
Key assumptions. All the atmospheric components, with exception of O3 and sea salt,
had positive loadings on PC1 (S10C and S10D Fig). In other words, 12 of the 14 compounds
had a positive relationship with PC1, whereas O3 and sea salt had a negative relationship with
PC1. Though PC1 is a good representative for most of the putative pollutants, caution should
be made in interpreting the results reported in this study keeping the inverse relationship of
O3 and sea salt with PC1 in mind.
We observed a decrease in mean concentration levels of all measured air compunds in Den-
mark over time, except for O3 and sea salt, which showed an increase over time (see S11 Fig).
This is in line with the overall decreasing trend in the anthropogenic emissions of the main
pollutants in Europe (see, e.g., https://www.eea.europa.eu/data-and-maps/indicators/main-
anthropogenic-air-pollutant-emissions/assessment-4). Though we measured exposure for all
individuals from birth to age 10, individuals born earlier were more likely to have been
exposed to higher levels of air pollutants because overall pollution levels were higher in Den-
mark during the earlier years. This trend is reflected in the PCA as well; elderly subjects were
generally assigned to higher scores on the PC1 axis.
Note also that the low-quality air exposure for the US study was estimated from 87 different
compounds, while the exposure for Denmark study included estimates from 14 compounds.
There were 6 air components in common (CO, NO2, O3, PM10, PM2.5, and SO2). We per-
formed a separate analysis on all air compounds available to us and on mutually common
components between the 2 counties.
Disease outcomes. Information on 4 psychiatric disorders (bipolar disorder, schizo-
phrenia, personality disorder, and major depression) was obtained from the Danish Psychi-
atric Central Research Register (PCRR) [72], which contains records of all the admissions to
psychiatric inpatient facilities since 1969 and visits to the outpatient psychiatric depart-
ments and emergency departments since 1995. The diagnostic system was based on the
Danish modification of the ICD-8 from 1969 to 1993 and ICD-10 from 1994 onwards. The
following diagnostics codes were used to obtain the patient records: bipolar disorders (ICD-
10 codes F30–F31; ICD-8 codes 296.19, 296.39, and 298.19), schizophrenia (F20; 295.x9
excluding 295.79), personality disorders (F60; 301.x9 [excluding 300.49], 305.x9, 305.68,
and 307.99), and major depression (F32–F33; 296.09, 296.29, 298.09, and 300.49). The out-
comes listed were patients having at least 1 diagnostic visit related to bipolar disorder,
schizophrenia, personality disorder, or major depression. The total person-years of follow-
up for the 4 psychiatric disorders in the Danish data analysis were as follows: 21,954,767 for
bipolar disorder, 21,688,539 for depression, 21,761,562 for personality disorder, and
21,913,828 for schizophrenia.
Statistical analysis. A PC1 score representing the relative cumulative scores of an individ-
ual’s exposures to air pollution was divided into septiles, with each septile representing slightly
over 200,000 individuals. We performed a statistical analysis by using Cox proportional haz-
ards regression models with age as the underlying time scale (each person was compared only
to persons of the exact same age). We employed the models, which were adjusted for sex and
birth date using splines, to compare the disorder rate in referent group Q1 to the rest of the
Pollution and mental health
PLOS Biology | https://doi.org/10.1371/journal.pbio.3000353 August 20, 2019 21 / 28

groups (Q2–Q7) separately for each of the 4 mental disorders. The analyses of Denmark data
were performed on the secured platform of Statistics Denmark using the packages “survival”
[73] and function “coxph” on R version 3.4.3 and RStudio version 1.1.383.
Harmonization of US and Denmark data analysis
In order to make US and Denmark data analysis more comparable, we first ran additional
models on the Denmark data by including potential socioeconomic confounders into the
models, such as urbanicity, parental educational level (primary school, high school/vocational
training, and higher education), parental labor market affiliation (employed, unemployed, and
outside workforce for other reasons), and household income (all measured at an individual
level on their 10th birthday). The information on all covariates was only available for a subset
of the population (n = 1,336,204; 93.1% of the total). We therefore performed these additional
analyses for all 4 psychiatric disorders only in this subset. We again divided the covariates into
different groups and observed the relative change in disorder rate among these groups.
To further harmonize the analysis from the two different countries, we ran a version of
analysis keeping only air pollutants that were measured in both the US and Denmark. The
EPA air quality index used in the US analysis is a summary measure, obtained from the PCA
of mean exposure to the 87 potential air pollutants, whereas for Denmark the exposure is a
summary measure of 14 pollutants modelled from birth until a patient’s 10th birthday. A sub-
set of 6 air pollutants (CO, NO2, O3, PM10, PM2.5, and SO2) were available in both the US and
Denmark. For the US, we reconstructed the county-level air quality index using the measured
levels of these 6 air pollutants, and for Denmark, we recomputed the individual-level exposure
to the above 6 air pollutants, both through the PCA as discussed earlier. After harmonizing the
exposure composition, a mixed-effect Poisson regression model was used for the US data anal-
ysis, and a Cox regression was used for the Danish data analysis in a similar manner as dis-
cussed previously. The results were compared by matching the psychiatric disorder rates in the
referent group (Q1) to the groups with systematically higher exposure (Q2–Q7) to the air
pollution.
Both datasets were, in principle, amenable to analysis with the same methodology, such as
Cox or Poisson regression. The major practical difference between these models was that the
Cox regression (or proportional hazards regression) represents subjects in the study separately,
with 1 row per individual. This representation works well for smaller datasets, such as the
whole Denmark population, but is practically intractable for very large samples, such as the US
dataset of over 150 million unique individuals. Poisson regression is similar to Cox regression
in interpreting the risk associated with individual factors but allows for pooling individuals
with the same characteristics (age, sex, county, state of disease) into one group, thus compress-
ing data and making it manageable for practical computation. For that reason, we applied Cox
regression to the smaller Denmark dataset but used Poisson regression with the US data. For
comparison of the 2 analyses, we also ran Poisson regression analysis over the Denmark data-
set; the results were virtually identical to the Cox regression version.
Data availability statement
IBM MarketScan databases are available to purchase by Federal, nonprofit, academic, pharma-
ceutical, and other researchers. Use of the data is contingent on completing a data use agree-
ment and purchasing the data needed to support the study. More information about licensing
the IBM MarketScan databases is available at https://www.ibm.com/us-en/marketplace/
marketscan-research-databases.
Pollution and mental health
PLOS Biology | https://doi.org/10.1371/journal.pbio.3000353 August 20, 2019 22 / 28

Access to individual-level Denmark data is governed by Danish authorities. These include
the Danish Data Protection Agency, the Danish Health Data Authority, the Ethical Commit-
tee, and Statistics Denmark. Each scientific project must be approved before initiation, and
approval is granted to a specific Danish research institution. Researchers at Danish research
institutions may obtain the relevant approval and data. International researchers may gain
data access if governed by a Danish research institution having needed approval and data
access.
Supporting information
S1 Data. Complete study data used for the US analysis.
(XLSX)
S1 Fig. US county-level sociodemographic covariates.
(TIF)
S2 Fig. US state-level disease prevalence.
(TIF)
S3 Fig. US county-level disease prevalence.
(TIF)
S4 Fig. County- and state-level random effects in the US.
(TIF)
S5 Fig. Regression results of bipolar disorder sensitivity analysis in the US.
(TIF)
S6 Fig. Random effects from bipolar disorder sensitivity analysis in the US.
(TIF)
S7 Fig. Adjustment for spatial autocorrelation in the US analysis.
(TIF)
S8 Fig. Cross-validation of US models by splitting data into 2 partitions.
(TIF)
S9 Fig. Predictive performance of US cross-validation models.
(TIF)
S10 Fig. Air quality and exposure estimation for the Danish national cohort.
(TIF)
S11 Fig. Trends in air quality over time in Denmark.
(TIF)
S12 Fig. Comparison of results from Cox and Poisson models in Denmark.
(TIF)
S13 Fig. Regression estimates with reduced exposure to 6 air pollutants in the US.
(TIF)
S14 Fig. Regression estimates for individual air pollutant exposure in Denmark.
(TIF)
S15 Fig. US EPA county-level air quality and the rate of bipolar disorder in the US. PCA of
EPA air quality measurements to produce air quality index. EPA, Environmental Protection
Pollution and mental health
PLOS Biology | https://doi.org/10.1371/journal.pbio.3000353 August 20, 2019 23 / 28
Agency; PCA, principal components analysis.
(TIF)
S1 Table. Prevalence of neuropsychiatric disorders from various published resources.
(DOCX)
S2 Table. Regression results from the US data analysis.
(XLSX)
S3 Table. Regression results from US data with nonspatial and spatially explicit models.
(XLSX)
S4 Table. Regression results from Denmark data analysis.
(XLSX)
S5 Table. US and Denmark regression results with individual air pollutants.
(XLSX)
Acknowledgments
We are grateful to E. Gannon, R. Melamed, and M. Rzhetsky for comments on earlier versions
of this manuscript.
Author Contributions
Conceptualization: Oleguer Plana-Ripoll, Hannah Landecker, Patrick F. Sullivan, Carsten
Bøcker Pedersen, Andrey Rzhetsky.
Data curation: Atif Khan, Oleguer Plana-Ripoll, Sussie Antonsen, Jørgen Brandt, Camilla
Geels, Carsten Bøcker Pedersen, Andrey Rzhetsky.
Formal analysis: Atif Khan, Oleguer Plana-Ripoll, Sussie Antonsen, Camilla Geels, Hannah
Landecker.
Funding acquisition: Andrey Rzhetsky.
Investigation: Atif Khan, Oleguer Plana-Ripoll, Patrick F. Sullivan, Carsten Bøcker Pedersen,
Andrey Rzhetsky.
Methodology: Oleguer Plana-Ripoll, Sussie Antonsen, Jørgen Brandt, Camilla Geels, Hannah
Landecker, Patrick F. Sullivan, Carsten Bøcker Pedersen, Andrey Rzhetsky.
Project administration: Andrey Rzhetsky.
Resources: Andrey Rzhetsky.
Software: Atif Khan, Oleguer Plana-Ripoll.
Supervision: Andrey Rzhetsky.
Visualization: Atif Khan.
Writing – original draft: Atif Khan, Oleguer Plana-Ripoll, Hannah Landecker, Patrick F. Sul-
livan, Carsten Bøcker Pedersen, Andrey Rzhetsky.
Writing – review & editing: Sussie Antonsen, Hannah Landecker, Patrick F. Sullivan, Carsten
Bøcker Pedersen, Andrey Rzhetsky.
Pollution and mental health
PLOS Biology | https://doi.org/10.1371/journal.pbio.3000353 August 20, 2019 24 / 28
References1. Insel TR. Assessing the economic costs of serious mental illness. Am J Psychiatry. 2008; 165(6):663–
5. Epub 2008/06/04. https://doi.org/10.1176/appi.ajp.2008.08030366 PMID: 18519528.
2. Tsuang M. Schizophrenia: genes and environment. Biol Psychiatry. 2000; 47(3):210–20. Epub 2000/
02/22. PMID: 10682218.
3. Badner JA, Gershon ES. Meta-analysis of whole-genome linkage scans of bipolar disorder and schizo-
phrenia. Mol Psychiatry. 2002; 7(4):405–11. Epub 2002/05/03. https://doi.org/10.1038/sj.mp.4001012
PMID: 11986984.
4. Craddock N, Sklar P. Genetics of bipolar disorder: successful start to a long journey. Trends Genet.
2009; 25(2):99–105. Epub 2009/01/16. https://doi.org/10.1016/j.tig.2008.12.002 PMID: 19144440.
5. Lichtenstein P, Yip BH, Bjork C, Pawitan Y, Cannon TD, Sullivan PF, et al. Common genetic determi-
nants of schizophrenia and bipolar disorder in Swedish families: a population-based study. Lancet.
2009; 373(9659):234–9. Epub 2009/01/20. https://doi.org/10.1016/S0140-6736(09)60072-6 PMID:
19150704; PubMed Central PMCID: PMC3879718.
6. Schizophrenia Working Group of the Psychiatric Genomics C. Biological insights from 108 schizophre-
nia-associated genetic loci. Nature. 2014; 511(7510):421–7. Epub 2014/07/25. https://doi.org/10.1038/
nature13595 PMID: 25056061; PubMed Central PMCID: PMC4112379.
7. Pardiñas AF, Holmans P, Pocklington AJ, Escott-Price V, Ripke S, Carrera N, et al. Common schizo-
phrenia alleles are enriched in mutation-intolerant genes and maintained by background selection.
bioRxiv. 2016. https://doi.org/10.1101/068593
8. Polderman TJ, Benyamin B, de Leeuw CA, Sullivan PF, van Bochoven A, Visscher PM, et al. Meta-
analysis of the heritability of human traits based on fifty years of twin studies. Nat Genet. 2015; 47
(7):702–9. Epub 2015/05/20. https://doi.org/10.1038/ng.3285 PMID: 25985137.
9. Bortolato B, Kohler CA, Evangelou E, Leon-Caballero J, Solmi M, Stubbs B, et al. Systematic assess-
ment of environmental risk factors for bipolar disorder: an umbrella review of systematic reviews and
meta-analyses. Bipolar Disord. 2017; 19(2):84–96. https://doi.org/10.1111/bdi.12490
WOS:000401266800003. PMID: 28470927
10. Marangoni C, Hernandez M, Faedda GL. The role of environmental exposures as risk factors for bipolar
disorder: A systematic review of longitudinal studies. J Affect Disorders. 2016; 193:165–74. https://doi.
org/10.1016/j.jad.2015.12.055 WOS:000369586000025. PMID: 26773919
11. Radua J, Ramella-Cravaro V, Ioannidis JPA, Reichenberg A, Phiphopthatsanee N, Amir T, et al. What
causes psychosis? An umbrella review of risk and protective factors. World Psychiatry. 2018; 17(1):49–
66. https://doi.org/10.1002/wps.20490 WOS:000422959200016. PMID: 29352556
12. Lesch KP. Gene-environment interaction and the genetics of depression. J Psychiatry Neurosci. 2004;
29(3):174–84. Epub 2004/06/03. PMID: 15173894; PubMed Central PMCID: PMC400687.
13. Allardyce J, Boydell J. Review: the wider social environment and schizophrenia. Schizophr Bull. 2006;
32(4):592–8. Epub 2006/07/20. https://doi.org/10.1093/schbul/sbl008 PMID: 16849399; PubMed Cen-
tral PMCID: PMC2632272.
14. Schmidt CW. A deeper look into mental illness. Environ Health Persp. 2007; 115(8):A404–A10. https://
doi.org/10.1289/ehp.115-a404 WOS:000248531400018. PMID: 17687431
15. van Os J, Kenis G, Rutten BP. The environment and schizophrenia. Nature. 2010; 468(7321):203–12.
Epub 2010/11/12. https://doi.org/10.1038/nature09563 PMID: 21068828.
16. Lieb K, Zanarini MC, Schmahl C, Linehan MM, Bohus M. Borderline personality disorder. Lancet. 2004;
364(9432):453–61. Epub 2004/08/04. https://doi.org/10.1016/S0140-6736(04)16770-6 PMID:
15288745.
17. Estes ML, McAllister AK. Maternal immune activation: Implications for neuropsychiatric disorders. Sci-
ence. 2016; 353(6301):772–7. Epub 2016/08/20. https://doi.org/10.1126/science.aag3194 PMID:
27540164; PubMed Central PMCID: PMC5650490.
18. Szyszkowicz M, Willey JB, Grafstein E, Rowe BH, Colman I. Air pollution and emergency department
visits for suicide attempts in vancouver, Canada. Environ Health Insights. 2010; 4:79–86. Epub 2010/
11/17. https://doi.org/10.4137/EHI.S5662 PMID: 21079694; PubMed Central PMCID: PMC2978939.
19. Evans GW. The built environment and mental health. J Urban Health. 2003; 80(4):536–55. Epub 2004/
01/08. https://doi.org/10.1093/jurban/jtg063 PMID: 14709704; PubMed Central PMCID: PMC3456225.
20. Guite HF, Clark C, Ackrill G. The impact of the physical and urban environment on mental well-being.
Public Health. 2006; 120(12):1117–26. Epub 2006/11/14. https://doi.org/10.1016/j.puhe.2006.10.005
PMID: 17097120.
Pollution and mental health
PLOS Biology | https://doi.org/10.1371/journal.pbio.3000353 August 20, 2019 25 / 28
21. Mair C, Diez Roux AV, Galea S. Are neighbourhood characteristics associated with depressive symp-
toms? A review of evidence. J Epidemiol Community Health. 2008; 62(11):940–6, 8 p following 6. Epub
2008/09/09. https://doi.org/10.1136/jech.2007.066605 PMID: 18775943.
22. Diez Roux AV, Mair C. Neighborhoods and health. Ann N Y Acad Sci. 2010; 1186:125–45. Epub 2010/
03/06. https://doi.org/10.1111/j.1749-6632.2009.05333.x PMID: 20201871.
23. Attademo L, Bernardini F, Garinella R, Compton MT. Environmental pollution and risk of psychotic dis-
orders: A review of the science to date. Schizophr Res. 2017; 181:55–9. Epub 2016/10/11. https://doi.
org/10.1016/j.schres.2016.10.003 PMID: 27720315.
24. Nemery B, Hoet PH, Nemmar A. The Meuse Valley fog of 1930: an air pollution disaster. Lancet. 2001;
357(9257):704–8. Epub 2001/03/15. https://doi.org/10.1016/S0140-6736(00)04135-0 PMID:
11247570.
25. Logan WP. Mortality in the London fog incident, 1952. Lancet. 1953; 1(6755):336–8. Epub 1953/02/14.
https://doi.org/10.1016/s0140-6736(53)91012-5 PMID: 13012086.
26. Bell ML, Davis DL. Reassessment of the lethal London fog of 1952: novel indicators of acute and
chronic consequences of acute exposure to air pollution. Environ Health Perspect. 2001;109 Suppl
3:389–94. Epub 2001/06/28. https://doi.org/10.1289/ehp.01109s3389 PMID: 11427388; PubMed Cen-
tral PMCID: PMC1240556.
27. Wilkins ET. Air pollution and the London fog of December, 1952. J R Sanit Inst. 1954; 74(1):1–15; dis-
cussion, -21. Epub 1954/01/01. PMID: 13118590.
28. Bhatia R. Policy and regulatory action can reduce harms from particulate pollution: comment on "expo-
sure to particulate air pollution and cognitive decline in older women". Arch Intern Med. 2012; 172
(3):227–8. Epub 2012/02/15. https://doi.org/10.1001/archinternmed.2011.799 PMID: 22332152.
29. Weuve J, Puett RC, Schwartz J, Yanosky JD, Laden F, Grodstein F. Exposure to particulate air pollution
and cognitive decline in older women. Arch Intern Med. 2012; 172(3):219–27. Epub 2012/02/15. https://
doi.org/10.1001/archinternmed.2011.683 PMID: 22332151; PubMed Central PMCID: PMC3622279.
30. Xu P, Chen Y, Ye X. Haze, air pollution, and health in China. Lancet. 2013; 382(9910):2067. Epub
2013/12/24. https://doi.org/10.1016/S0140-6736(13)62693-8 PMID: 24360386.
31. Terry JP, Jia G, Boldi R, Khan S. The Delhi ’gas chamber’: smog, air pollution and the health emergency
of November 2017. Weather. 2018; 73(11):348-+. https://doi.org/10.1002/wea.3242
WOS:000451631600009.
32. Costa LG, Cole TB, Coburn J, Chang YC, Dao K, Roque PJ. Neurotoxicity of traffic-related air pollution.
Neurotoxicology. 2017; 59:133–9. Epub 2015/11/28. https://doi.org/10.1016/j.neuro.2015.11.008
PMID: 26610921; PubMed Central PMCID: PMC4875879.
33. Costa LG, Cole TB, Coburn J, Chang YC, Dao K, Roque P. Neurotoxicants are in the air: convergence
of human, animal, and in vitro studies on the effects of air pollution on the brain. Biomed Res Int. 2014;
2014:736385. Epub 2014/02/14. https://doi.org/10.1155/2014/736385 PMID: 24524086; PubMed Cen-
tral PMCID: PMC3912642.
34. Health IW. IBM MarketScan Research Databases 2019. Available from: https://www.ibm.com/
downloads/cas/4QD5ADRL. [cited 2016 Jan 1].
35. Graves JM, Mackelprang JL, Moore M, Abshire DA, Rivara FP, Jimenez N, et al. Rural-urban disparities
in health care costs and health service utilization following pediatric mild traumatic brain injury. Health
Serv Res. 2019; 54(2):337–45. Epub 2018/12/07. https://doi.org/10.1111/1475-6773.13096 PMID:
30507042; PubMed Central PMCID: PMC6407359.
36. Hu J, Ugiliweneza B, Meyer K, Lad SP, Boakye M. Trend and geographic analysis for traumatic brain
injury mortality and cost based on MarketScan database. J Neurotrauma. 2013; 30(20):1755–61. Epub
2013/05/07. https://doi.org/10.1089/neu.2013.2857 PMID: 23642155.
37. Layton TJ, Barnett ML, Hicks TR, Jena AB. Attention deficit–hyperactivity disorder and month of school
enrollment. New England Journal of Medicine. 2018 Nov 29;379(22):2122-30. https://doi.org/10.1056/
NEJMoa1806828 PMID: 30485780
38. Kalilani L, Faught E, Kim H, Burudpakdee C, Seetasith A, Laranjo S, et al. Assessment and effect of a
gap between new-onset epilepsy diagnosis and treatment in the US. Neurology. 2019. Epub 2019/04/
12. https://doi.org/10.1212/WNL.0000000000007448 PMID: 30971487.
39. Sapkota S, Kobau R, Pastula DM, Zack MM. People with epilepsy are diagnosed most often with
unspecified epilepsy, followed by focal epilepsy, generalized convulsive epilepsy, and generalized non-
convulsive epilepsy-US MarketScan data, 2010–2015. Epilepsy Behav. 2018; 79:244–6. Epub 2017/
12/19. https://doi.org/10.1016/j.yebeh.2017.11.004 PMID: 29249447.
40. Cohrs AC, Leslie DL. Depression in Parents of Children Diagnosed with Autism Spectrum Disorder: A
Claims-Based Analysis. Journal of Autism and Developmental Disorders. 2017; 47(5):1416–22. https://
doi.org/10.1007/s10803-017-3063-y WOS:000399178800013. PMID: 28214978
Pollution and mental health
PLOS Biology | https://doi.org/10.1371/journal.pbio.3000353 August 20, 2019 26 / 28
41. Pedersen CB. The Danish Civil Registration System. Scand J Public Health. 2011; 39(7 Suppl):22–5.
Epub 2011/08/04. https://doi.org/10.1177/1403494810387965 PMID: 21775345.
42. Sellgren C, Landen M, Lichtenstein P, Hultman CM, Langstrom N. Validity of bipolar disorder hospital
discharge diagnoses: file review and multiple register linkage in Sweden. Acta Psychiatr Scand. 2011;
124(6):447–53. Epub 2011/08/16. https://doi.org/10.1111/j.1600-0447.2011.01747.x PMID: 21838734.
43. Geddes JR, Miklowitz DJ. Treatment of bipolar disorder. Lancet. 2013; 381(9878):1672–82. Epub
2013/05/15. https://doi.org/10.1016/S0140-6736(13)60857-0 PMID: 23663953; PubMed Central
PMCID: PMC3876031.
44. Hirschowitz J, Kolevzon A, Garakani A. The pharmacological treatment of bipolar disorder: the question
of modern advances. Harv Rev Psychiatry. 2010; 18(5):266–78. Epub 2010/09/10. https://doi.org/10.
3109/10673229.2010.507042 PMID: 20825264.
45. Tzivian L, Winkler A, Dlugaj M, Schikowski T, Vossoughi M, Fuks K, et al. Effect of long-term outdoor air
pollution and noise on cognitive and psychological functions in adults. Int J Hyg Environ Health. 2015;
218(1):1–11. Epub 2014/09/23. https://doi.org/10.1016/j.ijheh.2014.08.002 PMID: 25242804.
46. Calderon-Garciduenas L, Azzarelli B, Acuna H, Garcia R, Gambling TM, Osnaya N, et al. Air pollution
and brain damage. Toxicol Pathol. 2002; 30(3):373–89. Epub 2002/06/08. https://doi.org/10.1080/
01926230252929954 PMID: 12051555.
47. Ljubimova JY, Braubach O, Patil R, Chiechi A, Tang J, Galstyan A, et al. Coarse particulate matter
(PM2.5–10) in Los Angeles Basin air induces expression of inflammation and cancer biomarkers in rat
brains. Sci Rep. 2018; 8(1):5708. Epub 2018/04/11. https://doi.org/10.1038/s41598-018-23885-3
PMID: 29632393; PubMed Central PMCID: PMC5890281.
48. Fonken LK, Xu X, Weil ZM, Chen G, Sun Q, Rajagopalan S, et al. Air pollution impairs cognition, pro-
vokes depressive-like behaviors and alters hippocampal cytokine expression and morphology. Mol Psy-
chiatry. 2011; 16(10):987–95, 73. Epub 2011/07/06. https://doi.org/10.1038/mp.2011.76 PMID:
21727897; PubMed Central PMCID: PMC3270364.
49. Gerlofs-Nijland ME, van Berlo D, Cassee FR, Schins RPF, Wang K, Campbell A. Effect of prolonged
exposure to diesel engine exhaust on proinflammatory markers in different regions of the rat brain. Parti-
cle and Fibre Toxicology. 2010; 7. Artn 12 https://doi.org/10.1186/1743-8977-7-12
WOS:000279293200001. PMID: 20478040
50. Calderon-Garciduenas L, Solt AC, Henriquez-Roldan C, Torres-Jardon R, Nuse B, Herritt L, et al. Long-
term Air Pollution Exposure Is Associated with Neuroinflammation, an Altered Innate Immune
Response, Disruption of the Blood-Brain Barrier, Ultrafine Particulate Deposition, and Accumulation of
Amyloid beta-42 and alpha-Synuclein in Children and Young Adults. Toxicologic Pathology. 2008; 36
(2):289–310. https://doi.org/10.1177/0192623307313011 WOS:000267457400011. PMID: 18349428
51. Gerlofs-Nijland ME, van Berlo D, Cassee FR, Schins RP, Wang K, Campbell A. Effect of prolonged
exposure to diesel engine exhaust on proinflammatory markers in different regions of the rat brain. Part
Fibre Toxicol. 2010; 7:12. Epub 2010/05/19. https://doi.org/10.1186/1743-8977-7-12 PMID: 20478040;
PubMed Central PMCID: PMC2883965.
52. Rao JS, Harry GJ, Rapoport SI, Kim HW. Increased excitotoxicity and neuroinflammatory markers in
postmortem frontal cortex from bipolar disorder patients. Mol Psychiatry. 2010; 15(4):384–92. Epub
2009/06/03. https://doi.org/10.1038/mp.2009.47 PMID: 19488045; PubMed Central PMCID:
PMC2844920.
53. Isgren A, Jakobsson J, Palsson E, Ekman CJ, Johansson AG, Sellgren C, et al. Increased cerebrospi-
nal fluid interleukin-8 in bipolar disorder patients associated with lithium and antipsychotic treatment.
Brain Behav Immun. 2015; 43:198–204. Epub 2014/12/03. https://doi.org/10.1016/j.bbi.2014.10.001
PMID: 25451615.
54. Isgren A, Sellgren C, Ekman CJ, Holmen-Larsson J, Blennow K, Zetterberg H, et al. Markers of neuroin-
flammation and neuronal injury in bipolar disorder: Relation to prospective clinical outcomes. Brain
Behav Immun. 2017; 65:195–201. Epub 2017/05/10. https://doi.org/10.1016/j.bbi.2017.05.002 PMID:
28483660.
55. Fenn AM, Gensel JC, Huang Y, Popovich PG, Lifshitz J, Godbout JP. Immune activation promotes
depression 1 month after diffuse brain injury: a role for primed microglia. Biol Psychiatry. 2014; 76
(7):575–84. Epub 2013/12/03. https://doi.org/10.1016/j.biopsych.2013.10.014 PMID: 24289885;
PubMed Central PMCID: PMC4000292.
56. Yirmiya R, Rimmerman N, Reshef R. Depression as a microglial disease. Trends Neurosci. 2015; 38
(10):637–58. Epub 2015/10/08. https://doi.org/10.1016/j.tins.2015.08.001 PMID: 26442697.
57. Kreisel T, Frank MG, Licht T, Reshef R, Ben-Menachem-Zidon O, Baratta MV, et al. Dynamic microglial
alterations underlie stress-induced depressive-like behavior and suppressed neurogenesis. Mol Psychi-
atry. 2014; 19(6):699–709. Epub 2013/12/18. https://doi.org/10.1038/mp.2013.155 PMID: 24342992.
Pollution and mental health
PLOS Biology | https://doi.org/10.1371/journal.pbio.3000353 August 20, 2019 27 / 28
58. Bureau UC. 2010 Census Urban Area Facts 2017. Available from: https://www.census.gov/geo/
reference/ua/uafacts.html. [cited 2018 Jan 1].
59. Lobdell DT, Jagai JS, Rappazzo K, Messer LC. Data sources for an environmental quality index: avail-
ability, quality, and utility. Am J Public Health. 2011; 101 Suppl 1:S277–85. Epub 2011/08/13. https://
doi.org/10.2105/AJPH.2011.300184 PMID: 21836111; PubMed Central PMCID: PMC3222503.
60. Messer LC, Jagai JS, Rappazzo KM, Lobdell DT. Construction of an environmental quality index for
public health research. Environ Health. 2014; 13(1):39. Epub 2014/06/03. https://doi.org/10.1186/1476-
069X-13-39 PMID: 24886426; PubMed Central PMCID: PMC4046025.
61. Ch Miliaresis G. Spatial decorrelation stretch of annual (2003–2014) Daymet precipitation summaries
on a 1-km grid for California, Nevada, Arizona, and Utah. Environ Monit Assess. 2016; 188(6):361.
Epub 2016/05/26. https://doi.org/10.1007/s10661-016-5365-5 PMID: 27220500.
62. NASA. Land data assimilation systems 2018. Available from: https://ldas.gsfc.nasa.gov/faq/. [cited
2019 Jan 1].
63. Hadfield JD. MCMC Methods for Multi-Response Generalized Linear Mixed Models: The MCMCglmm
R Package. J Stat Softw. 2010; 33(2):1–22.
64. Duncan EW, White NM, Mengersen K. Spatial smoothing in Bayesian models: a comparison of weights
matrix specifications and their impact on inference. Int J Health Geogr. 2017; 16(1):47. Epub 2017/12/
17. https://doi.org/10.1186/s12942-017-0120-x PMID: 29246157; PubMed Central PMCID:
PMC5732501.
65. Gelman A, Goodrich B, Gabry J, Vehtari A. R-squared for Bayesian regression models2018. 1–6 p.
66. Burkner PC. brms: An R Package for Bayesian Multilevel Models Using Stan. J Stat Softw. 2017; 80
(1):1–28. WOS:000408409900001.
67. Brandt J, Christensen JH, Frohn LM, Palmgren F, Berkowicz R, Zlatev Z. Operational air pollution fore-
casts from European to local scale. Atmospheric Environment. 2001; 35:S91–S8.
WOS:000169404000011.
68. Im U, Christensen JH, Ketzel M, Ellermann T, Geels C, Hansen KM, et al., editors. Air Pollutant Trends
over Denmark over the Last 37 Years as Simulated by the Integrated Model System THOR2018;
Cham: Springer International Publishing.
69. Frohn LM, Christensen JH, Brandt J, Hertel O. Development of a high resolution integrated nested
model for studying air pollution in Denmark. Phys Chem Earth Pt B. 2001; 26(10):769–74. https://doi.
org/10.1016/S1464-1909(01)00084-3 WOS:000170712000003.
70. Jensen SS, Ketzel M, Becker T, Christensen J, Brandt J, Plejdrup M, et al. High resolution multi-scale
air quality modelling for all streets in Denmark. Transport Res D-Tr E. 2017; 52:322–39. https://doi.org/
10.1016/j.trd.2017.02.019 WOS:000401398400023.
71. Plejdrup MS, Gyldenkærne S. Spatial Distribution of Emissions to Air–the SPREAD Model. Aarhus Uni-
versity, Denmark: National Environmental Research Institute, 2011 Contract No.: FR823.
72. Mors O, Perto GP, Mortensen PB. The Danish Psychiatric Central Research Register. Scand J Public
Health. 2011; 39(7 Suppl):54–7. Epub 2011/08/04. https://doi.org/10.1177/1403494810395825 PMID:
21775352.
73. Therneau TM, Lumley T. Package ‘ survival ‘. R Top Doc. 2015. https://doi.org/10.1016/j.jhydrol.2011.
07.022
Pollution and mental health
PLOS Biology | https://doi.org/10.1371/journal.pbio.3000353 August 20, 2019 28 / 28