Management Tools 2009 - Global management consulting firm - Bain

1
Environmental Policy Tools and Firm-level Management Practices in Norway
National project leader: Bjarne E. Ytterhus, Norwegian School of Management (BI)
e-mail: [email protected]
in cooperation with OECD Environment Directorate
The views expressed in this report are those of the authors and do not necessarily reflect those of the institutes with which they are affiliated, or the OECD.

2
PREFACE
ECONOMIC TRENDS: AN OPEN, RESOURCE BASED, GROWING ECONOMY
The Norwegian economy experienced strong growth during the 1990s. GDP increased by 35% and in 1999 GDP per person was 25.600 USD compared to an OECD average of 21.300 USD. Economic performance was strongly influenced by the growth of the petroleum sector.
The Norwegian economy has a strong international orientation. Exports contribute 38% of GDP. Crude oil and natural gas exports represent 35% of total export revenues. Norway is the world’s second largest exporter of crude oil (OECD, 2001). Fisheries are another important industry. Fish catches increased by 60% in the nineties and aquaculture production, mainly of salmon, by 120% in the same period. In value terms, Norway is the largest fish exporter in the world.
The manufacturing industries contribute less than 15% to GDP and employment. Manufacturing output has an intensive energy mix because of cheap hydroelectricity. Norway is one of the world’s largest producers of primary aluminium, magnesium, ferro-alloys and pulp and paper.
In addition to the energy- and pollution-intensive sectors, machinery, ship- and platform-building related to the oil and gas industry dominate the economy and labour market in the areas where they are located. Principal figures for the main manufacturing sectors are shown in the Annex I, Table A and selected economic trends for Norway, 1980 – 99 in the box below:
Selected Economic Trends, 1980 – 99
(% change in volume)
1980 - 90 1990 - 99GDP 27 35Population 4 5GDP/capita 22 28
Agricultural production 12 -8Manufacturing 11 19Oil and gas production 74
Fisheries production Wild fish 60 Aquaculture 120
Total primary energy supply 14 18Energy intensity (per GDP) -10 -12
Source: Statistics Norway and OECD (2001)

3
TABLE OF CONTENTS
PREFACE....................................................................................................................................................... 2
EXECUTIVE SUMMARY ............................................................................................................................ 4
Objectives.................................................................................................................................................... 4 Context of the study .................................................................................................................................... 4 Research method and Norwegian sample characteristics............................................................................ 4 Key findings ................................................................................................................................................ 5 Further research........................................................................................................................................... 6
1. INTRODUCTION ...................................................................................................................................... 8
2. OVERVIEW OF SAMPLE ...................................................................................................................... 10
2.1 Spatial Scope of the Market ................................................................................................................ 12 2.2 R&D Expenditures .............................................................................................................................. 14
3. ENVIRONMENTAL POLICY IN NORWAY: TRENDS AND CHALLENGES.................................. 15
3.1 Environmental Pressures ..................................................................................................................... 15 3.2 State of the environment ..................................................................................................................... 17 3.3 Responses to environmental problems ................................................................................................ 19
4. ENVIRONMENTAL MANAGEMENT AND PERFORMANCE.......................................................... 23
4.1 Environmental management systems and tools................................................................................... 23 4.2 Environmental measures, innovation and performance ...................................................................... 27 4.3 A certified EMS may matter ............................................................................................................... 28 4.4 Some additional characteristics by EMS firms: .................................................................................. 30
5. INFLUENCE OF STAKEHOLDERS AND IMPORTANCE OF MOTIVATIONS............................... 31
5. INFLUENCE OF STAKEHOLDERS AND IMPORTANCE OF MOTIVATIONS............................... 32
5.1 Environmental stakeholders ................................................................................................................ 32 5.2 Importance of motivations .................................................................................................................. 35
6. THE ROLE OF PUBLIC ENVIRONMENTAL POLICY ....................................................................... 38
7. ENVIRONMENTAL PRACTICE AND COMMERCIAL PERFORMANCE ....................................... 44
7.1 Commercial performance.................................................................................................................... 44 7.2 Relationship between commercial performance and environmental practice ..................................... 45 7. 3 Environmental and commercial performance .................................................................................... 46
8. REFERENCES ......................................................................................................................................... 48
8. REFERENCES ......................................................................................................................................... 49
ANNEX I: ADDITIONAL RESULTS......................................................................................................... 51

4
EXECUTIVE SUMMARY
Objectives
The objective of this study is to provide practical policy advice concerning the effectiveness and efficiency of alternative public environmental policy, including both traditional environmental policy tools (direct regulation, market-based instruments, etc…) and incentives to introduce environmental management systems (EMS’s) and other programmes that encourage environmental innovations. Questions to be addressed include:
• Do different types of policies (i.e. market-based measures, voluntary approaches, direct regulation) result in different organisational responses within the firm?
• How can public authorities support the introduction of management practices that lead to improved environmental performance (including innovation)?
• How can scarce public resources be better targeted to ensure that both “leaders” and “laggards” improve their environmental performance?
Context of the study
To provide understanding of the firm’s commercial performance motivations, decision-making procedures and organisational structure when designing and implementing environmental policies, the OECD Environmental Directorate initiated a project on “Environmental Policy Design and Firm-Level Management”. This project was supported by OECD’s Working Party on National Environmental Policies and financed by voluntary contributions from the seven participating governments. Research teams from the seven countries executed an industrial survey exploring the links between public (government) environmental policies and private (firm) environmental management and innovation. The participating countries were Canada, France, Germany, Hungary, Japan, Norway and the U.S.
Research method and Norwegian sample characteristics
The research method used was a standardised survey sent to most manufacturing facilities in Norway with at least 50 employees. The respondents were chief executive officers and heads of environmental, health and safety departments. Selected sample characteristics are presented below:

5
Figure 1: Selected Sample Characteristics
• Sample size: 891 manufacturing facilities • Response rate: 34,7% • Firm size: Average number of employees per facility was
193 (early 40% of the respondents were facilities between 50 – 100 employees)
• Average annual value of shipment over the last three years :
377 Million NOK (45 Million Euro)
• Stock market listing: 15,5% of responding firms listed on the stock exchange:exchange:
• Scope of market: More than 48% of facilities characterized their main market as global.
• Facilities customers:. 50% of the primary customers were firms in other manufacturing sectors
• Relative share of facilities with R&D budgets specially related to environmental matters:
15%
Key findings
Environmental Management
Share of facilities having:
• At least one person designated as responsible for environmental matters: 85% • A written environmental policy: 77% • A public environmental report: 54% • Environmental training programmes: 45% • External environmental auditing: 45% • An environmental management system (EMS) in place: 39% • A certified EMS in place 28%
Environmental performance
• Sectors such as pulp and paper, chemicals and basic metals are more active than other sectors in implementing environmental activities, i.e. environmental management practices and undertaken (technical) actions to reduce environmental impacts.
• We observe a positive relationship between firm size and the likelihood of having an EMS in place.
• A certified EMS may have an effect on environmental performance: o Certified EMS firms undertake more actions to reduce damages caused by environment
than non-certified firms. o A certified EMS may be a good predictor for firms’ progress with respect to changes in
impacts on the environment.
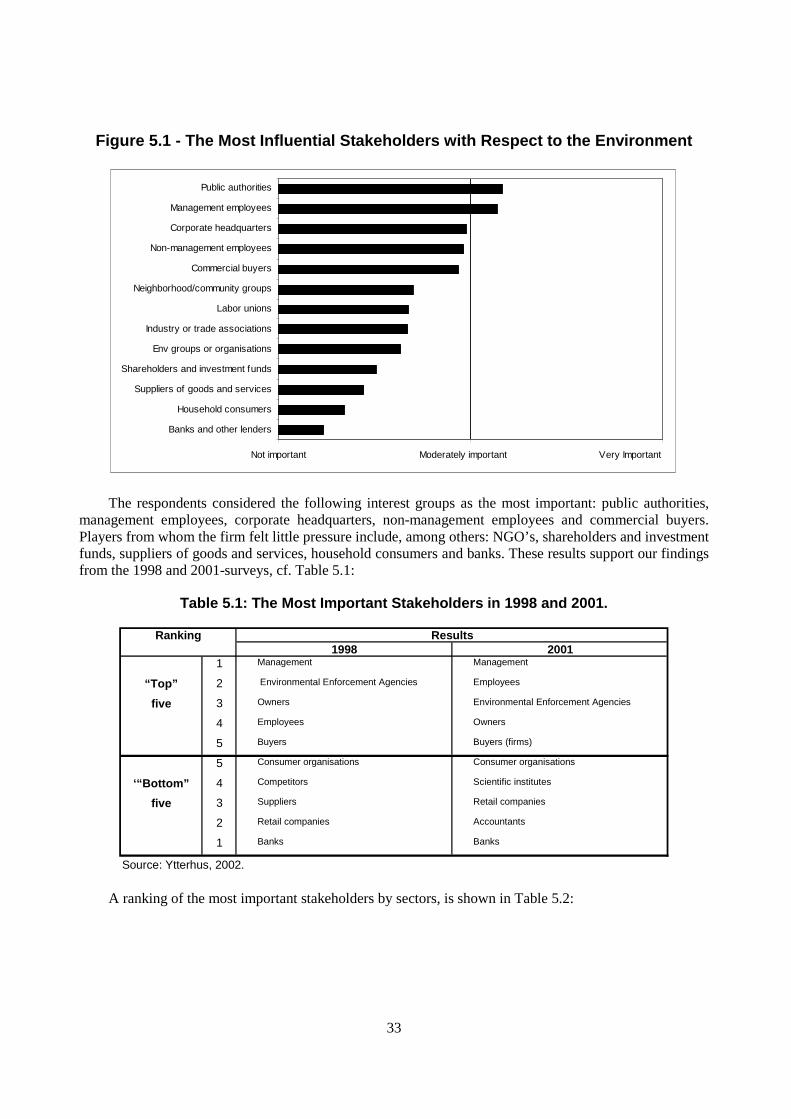
Environmental stakeholders
• The most important stakeholders in an environmental context were: public authorities, management employees, corporate headquarters, non-management employees and commercial buyers.
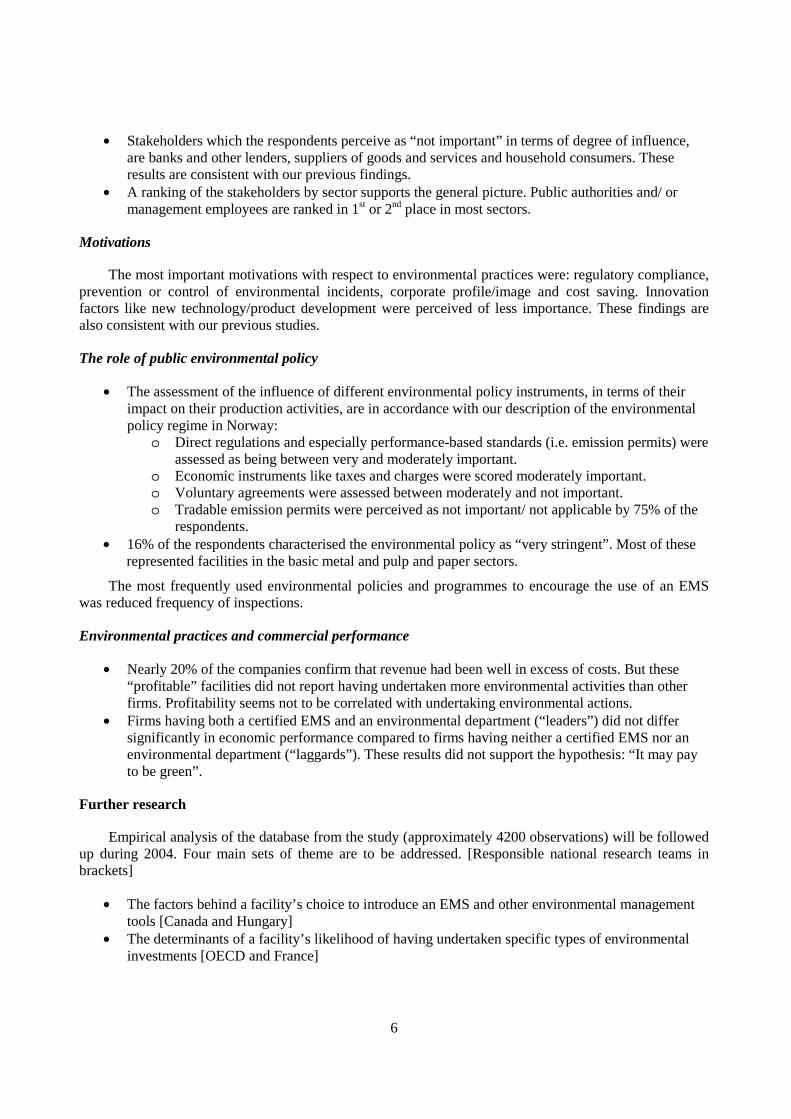
6
• Stakeholders which the respondents perceive as “not important” in terms of degree of influence, are banks and other lenders, suppliers of goods and services and household consumers. These results are consistent with our previous findings.
• A ranking of the stakeholders by sector supports the general picture. Public authorities and/ or management employees are ranked in 1st or 2nd place in most sectors.
Motivations
The most important motivations with respect to environmental practices were: regulatory compliance, prevention or control of environmental incidents, corporate profile/image and cost saving. Innovation factors like new technology/product development were perceived of less importance. These findings are also consistent with our previous studies.
The role of public environmental policy
• The assessment of the influence of different environmental policy instruments, in terms of their impact on their production activities, are in accordance with our description of the environmental policy regime in Norway:
o Direct regulations and especially performance-based standards (i.e. emission permits) were assessed as being between very and moderately important.
o Economic instruments like taxes and charges were scored moderately important. o Voluntary agreements were assessed between moderately and not important. o Tradable emission permits were perceived as not important/ not applicable by 75% of the
respondents. • 16% of the respondents characterised the environmental policy as “very stringent”. Most of these
represented facilities in the basic metal and pulp and paper sectors.
The most frequently used environmental policies and programmes to encourage the use of an EMS was reduced frequency of inspections.
Environmental practices and commercial performance
• Nearly 20% of the companies confirm that revenue had been well in excess of costs. But these “profitable” facilities did not report having undertaken more environmental activities than other firms. Profitability seems not to be correlated with undertaking environmental actions.
• Firms having both a certified EMS and an environmental department (“leaders”) did not differ significantly in economic performance compared to firms having neither a certified EMS nor an environmental department (“laggards”). These results did not support the hypothesis: “It may pay to be green”.
Further research
Empirical analysis of the database from the study (approximately 4200 observations) will be followed up during 2004. Four main sets of theme are to be addressed. [Responsible national research teams in brackets]
• The factors behind a facility’s choice to introduce an EMS and other environmental management tools [Canada and Hungary]
• The determinants of a facility’s likelihood of having undertaken specific types of environmental investments [OECD and France]

7
• The determinants of the degree of environmental innovation and integration exhibited by the facility [Japan and Germany]
• The links between the aforementioned factors and the facility’s commercial performance (profitability and sales) [United States and Norway]
In all cases, the specific role of public environmental policy is to be emphasised.

8
1. INTRODUCTION
The objective of this report is to improve our understanding of the firm’s commercial motivations, decision-making procedures and organisational structure when designing and implementing environmental policies. Such organisational issues are usually not reflected in discussions of the relative merits of different policy instruments. Assessments of public environmental policy measures often treat the internal workings of the firm as a “black box”, assuming that firms will respond in a predictable manner.
However, heterogeneity of different firms’ responses to extreme pressure, including regulatory pressure, has created interest for exploring the role of firm-specific factors in determining environmental performance. During 2002, the OECD Environmental Directorate initiated a project on “Environmental Policy Design and Firm-Level Management” supported by OECD’s Working Party on National Environmental Policies. Seven countries1 have executed an industrial survey exploring the links between public (government) environmental policies and private (firm) environmental management and innovation. Figure 1.1 highlights the main elements of the project.
Figure 1.1: Project Overview
•Improved environmental performance
•Technological
innovation (Product and process)
•Structural characteristics
•Decision making procedures
•Organisational structures
•Commercial motivations
•Direct forms of regulation
•Economic instruments
•Voluntary approaches
•Incentives for environmental management
Environmental policy design
FirmsReduced
environmental impact
The Norwegian partner in the OECD project is the Centre for Environmental Studies, Norwegian School of Management (BI). Since 1994 the Centre has executed an industrial survey called the Business Environmental Barometer (BEB). The mission of the BEB-project has been to contribute to the
1 The participating countries are Canada, France, Germany, Hungary, Japan, Norway and the U.S. List of
participating research teams are presented in Annex II.

9
improvement of environmental management and environmental performance of business and industry and tracking changes over time. The BEB-project started out in the Nordic countries (Wolff R. et al, 1995 and Ytterhus B. & Synnestvedt, 1996). Since then surveys have been conducted periodically by research teams in 10-12 European countries, mapping “the greening of industry” (Belz F. & Strannegård L., 1997 and Kestemont M.P. & Ytterhus B. 2001).
The objectives of the BEB-project have been to map how the chief executive officers in manufacturing companies perceive:
• The driving forces behind companies’ environmental strategies and actions. • The companies’ implementation of environmental strategies and action. • Economic and environmental performance in manufacturing firms.
Compared to the OECD project, the BEB-project has focused mainly on the links between
stakeholders, the firm and the environmental performance and less on public environmental policy measures. The shift in focus to environmental policy design, while keeping the internal workings of the firm in mind, means that we have expanded the scope in combining environmental economics and environmental management.
When reading our report, we hope to clarify the following questions:
• Is there a distinct role played by environmental management tools? (Chapter 4) • Does a certified environmental management system (EMS) matter? (Chapter 4) • What are the most important stakeholders for the firm’s implementation of environmental
activities? (Chapter 5) • How do firms assess the influence of different environmental policy instruments? (Chapter 6) • What are the most frequently used environmental policies and programmes to encourage use of an
environmental management system? (Chapter 6) • Is there a relationship between commercial and environmental performance? (Chapter 7)
The research method used was a standardised survey sent to most manufacturing companies in
Norway.

10
2. OVERVIEW OF SAMPLE
The Norwegian sample consists of 891 manufacturing companies with minimum 50 employees i.e. most firms within the population2. The respondents were chief executive officers and heads of environmental, health and safety departments. The questionnaire was sent out by post in March 2003 and we received 197 responses. In May 2003 we kindly asked the missing respondents to fill in the questionnaire and another 112 responses were received. In total we obtained 309 responses, equivalent to a response rate of 34,7%, which is acceptable for a questionnaire of 10 pages length.
Table 2.1 presents the number of respondents and response rates by sector in more detail. All tables and figures in the main chapters are based on responses from facilities of 50 employees or more. In Annex I we present some results based on all responding firms.
Table 2.1: Number of Respondents and Response Rates by Sector
Nace/ code Manufacturing sector
Total sample 1)
Responses n0
2)Responses n1
3)
Response rates 4)
15 Man. of food products and beverages 144 32 29 22,2 %16 Man. of tobacco products 1 1 1 100,0 %17 Man. of textiles 27 8 8 29,6 %18 Man. of wearing apparel; dressing and dyeing of fur 7 2 2 28,6 %19 Tanning and dressing of leather; manufacture of luggage, handbags, footwear etc. 2 0 0 0,0 %20 Man. of wood and products of wood and cork except furniture 70 29 20 41,4 %21 Man. of paper and paper products 22 10 10 45,5 %22 Publishing, printing and reproduction of recorded media. 32 15 12 46,9 %23 Man. of coke, refined petroleum products and nuclear fuel 0 0 024 Man. of chemicals and chemical products 42 18 15 42,9 %25 Man. of rubber and plastics products. 25 6 6 24,0 %26 Man. of other non- metallic products. 38 14 12 36,8 %27 Man. of basic metals 39 18 16 46,2 %28 Man. of fabricated metal products, except machinery and equipment 98 36 27 36,7 %29 Man. of other machinery and equipment 84 32 23 38,1 %30 Man. of office, accounting and computing machinery 4 0 0 0,0 %31 Man. of electrical machinery and apparatus 37 11 8 29,7 %32 Man. of radio, television and communication equipment 18 4 4 22,2 %33 Man. of medical, precision and optical instruments, watches and clocks' 22 8 6 36,4 %34 Man. of motor vehicles, trailers and semi-trailers 22 11 11 50,0 %35 Man. of other transport equipment 93 33 26 35,5 %36 Man. of furniture 59 20 16 33,9 %37 Recycling 5 1 0 20,0 %
All manufacturing sectors 891 309 252 34,7 %1) Includes some facilities with less than 50 employees2) All respondents3) Responding facilities with 50 employees or more4) Based on all respondents
2According to Statistics Norway, the total population was approximately 1100 facilities in 2003 (NACE code 15-37).

11
The proportion of individual sectors to the total sample and average firm size for selected sectors and firm3 size by respondents, are shown in Figures 2.1 and 2.2:
Figure 2.1: Sectoral Composition of the Sample
4,0 %
6,0 %
6,3 %
7,9 %
9,1 %
10,7 %
11,9 %
14,7 %
0 % 5 % 10 % 15 % 20 %
Paper and paper products
Chemicals and chemical products
Basic metals
Wood and products of wood
Machinery and equipment
Fabricated metal products
Food and tobacco products
Transport equipment
2124
272
029
2815
-16
34
-35
Figure 2.2: Distribution of Facility Size
(number of employees)
38,9 % 40,5 %
14,3 %
6,3 %
0 %
10 %
20 %
30 %
40 %
50 %
50 - 99 100 - 249 250 - 500 >500
The most represented industries in the survey were manufacturers of transport equipment, fabricated metal products, food and beverages, machinery and equipment and wood product (see Figure 2.1).4 As can be seen in Figure 2.2, nearly 40% of the respondents are facilities within the interval 50-100 employees and 80% are SME’s, i.e. facilities with less than 250 employees.
3 We use the word “firm” sometimes, but all tables and figures in the Chapter 2-7 are based on responses
from facilities with 50 employees or more. 4 In the Annex, Table A, principal figures for the main Norwegian manufacturing industries are presented.

12
Previous reports have shown that large firms have been more active with respect to environment-related activities than smaller companies (Ytterhus and Synnestvedt, 1996). Therefore, we might expect a relatively higher response rate from large companies, since environmentally active firms may be more likely to respond to the questionnaire. In Table 2.2, we present the frequency distribution of responses by size of the facility relative to the similar distribution of the total sample of facilities to which questionnaires were mailed. The last column in Table 2.2 indicates the differences between the frequency distribution of the total population and the responses by the size of the firm.5
Table 2.2: Number of Respondents by Size of Facility
Facility size (Number of employees)
Responses ni1
3)
Response rates 4)
I = Ni / N (%) II = ni / n (%) II - I
50-99 98 33,8 % 51,4 % 50,2 % -1,2 %
100-249 102 35,4 % 32,3 % 33,0 % 0,7 %
250-499 36 44,3 % 9,9 % 12,6 % 2,7 %More than 500 16 22,8 % 6,4 % 4,2 % -2,2 %
Total N = 891 n = 309 252 34,7 % 100,0 % 100,0 % 0,0 %1) Includes some facilities with less than 50 employees2) All respondents3) Responding facilities with 50 employees or more4) Based on all respondents
8857
Responses ni0
2)
155
102
3913
Total sample (Ni)
1)
458
288
A last check on representation and survey bias was done in analysing if there were any differences in the answers we received during March and May 2003, i.e. from the first postal questionnaire and the reminder. There were no significant differences between the answers in the 1st and 2nd response rounds, supporting the hypothesis that those who did not respond at all, would not have responded very differently in any event i.e. it is not likely to be any response bias.
2.1 Spatial Scope of the Market
The respondents were asked to answer which market they considered to be their most important. The results are presented in Figure 2.3.
5 In the Annex, Table B, we present a similar comparison by sectors. For most sectors there are just minor
differences, except “Food and beverages” which are “underrepresented”. Sectors like “Pulp and paper”, “Chemicals”, and “Basic Metals” are “over-represented”.

13
Figure 2.3: Spatial Scope of Facilities’ Market
7 %
40 %
11 %
43 %
6 %
48 %
36 %
10 %
0 %
20 %
40 %
60 %
Local National Regional Global
SME's
All
Nearly 50% of the respondents characterized their most important market as global, while only 6% reported they mainly were local producers. While 80% of the facilities consisted of SME’s, more than 40% operated in global markets. These results may be surprising since we generally do not associate SME’s with international trade. There are at least two explanations:
• The respondents’ facilities are subsidiaries to large, international companies. • Many small Norwegian firms within sectors like pulp and paper, metal products, machinery and
equipment are suppliers to international enterprises.
Figure 2.4 confirms that the manufacturing facilities are marketing their products to other firms. Half of the facilities identified their primary customers as firms in other manufacturing sectors, while more than 40% of the primary customers were either wholesalers or retailers.
Figure 2.4: Facilities’ Customers
47 %44 %
4 % 5 %
50 %
41 %
6 %3 %
0 %
20 %
40 %
60 %
Othermanufacturing
firms
Wholesalers orretailers
Households Other facilitiesw ithin your f irm
SME's
All

14
Chapter 2: Summary
• Sample: 891 manufacturing facilities • Response rate: 34,7% • Firm size: Nearly 40% of the respondents were facilities between
50 – 100 employees
• Average number of employees in facility (fully employed in the last three years):
193
• Average annual value of shipment over the last three years (45 Mill Euro):
377 Mill NOK
• Responding firms listed on the stock exchange: 15,5% • Scope of market: More than 48% characterized their main market
as global.
• Facilities customers: 50% of the primary customers were firms in other manufacturing sectors.
• Relative share of facilities with R&D budgets specially related to environmental matters:
15%
2.2 R&D Expenditures
The average annual budget on R&D over the last three years was 7,9 million NOK (0,95 million EUR). Only 15% of the facilities had an R&D budget specially related to environmental matters.

15
3. ENVIRONMENTAL POLICY IN NORWAY: TRENDS AND CHALLENGES6
This chapter follows the Pressure-State-Response model (OECD, 1994), looking at
• Environmental pressure (Section 3.1) • State of environment (Section 3.2) • Responses to environmental problems (Section 3.3)
3.1 Environmental Pressures
In the introduction, we presented the main driving forces behind environmental pressures in Norway. While GDP increased by 35% in the 1990s, SO2 emissions fell by 44% during the same period. This is an example of strong decoupling between economic growth and environmental impacts. Strong decoupling makes it possible to “produce more with less environmental burden” in terms of emissions and waste quantities.
Concerning greenhouse gases (GHG), only weak decoupling has been achieved. Since 1990, GHG-emissions have risen by 8 per cent measured in CO2-equivalents (Statistics Norway, 2002). This development is mainly due to a rise in CO2-emissions. To summarise these trends, we present the relative growth in mainland Norway’s GDP, greenhouse gases and sulphur dioxide emissions during 1987 – 2000 in Figure 3.1.
6 The text is mainly based on White papers no. 58 (1996 – 97) and no. 25 (2002 – 2003) to the Parliament,
OECD’s review of Norwegian Environmental Policy (OECD, 1999 and 2001) and Bent Arne Sæther, Ministry of Environment (1997).

16
Figure 3.1: Relative Trends in GDP and Emissions of Greenhouse Gases and SO2
For each year, the figures above are expressed as percentages of the 1987- level (index=100). For example, the figures for mainland GDP are 30% above the 1987- level in 2000. But sulphur emissions in 1999 were only 39% of the 1987- level. In Table 3.1 selected indicators on changes in environmental pressures in the period 1980 – 1999, are presented:
Table 3.1: Environmental Pressure Indicators 1980 – 99 (% change)
1980 - 90 1990 - 99
Selected environmental pressuresCO2 emissions from energy production and use -3 19SO2 emissions -62 -44Nox emissions 16 2
Coastal eutrophicationTotal P -19Total N -9
Pesticide use -14 -33
Municipal waste 18 32
Total final energy consumption 10 11
Road freight traffic 57 55
Source: Statistics Norway and OECD (2001)
1988 1992 1994 1996 1990 2000 1998
140
120
100
80
60
40
20
GDP
Greenhouse gases
SO2
Source: Natural- Resources and the Environment, 2001. Statistics Norway

17
Table 3.1 indicates strong decoupling for SO2-emissions, use of pesticides and partly coastal eutrophication. Weak decoupling has been achieved in CO2, NOx and nitrate in effluents. Municipal waste grew at the same rate as GDP. In addition, concern has grown about pollution from offshore petroleum operations and fragmentation of wilderness areas (OECD, 2001).
Another way to illustrate the linkage between economic and environmental development, is using the eco-efficiency concept (OECD, 1997). Eco-efficiency is often defined as a ratio between an economic and environmental indicator. In Table 3.2, percentage changes in two indexes are calculated for selected industries in our sample:
1. Gross product relative to global warming potential (GWP measures by CO2-equivalents)7 2. Gross product relative to acidification compounds (potential acid equivalents)8
A positive sign on the change in the eco-efficiency indexes, illustrates a decoupling.
Table 3.2: Economic and Environmental Indicators for Selected Industries
Gross product (fixed
prices)
Global Warming Potential
GWP
Potential Acid
Equivalents PAE
1: Gross product/ GWP
2: Gross product/ PAE
15 - 16 Food and tobacco 2 32 -17 -25 19
21 Pulp and paper 23 90 31 -34 -6
24 Chemicals 19 20 41 4 -12
27 - 28 Metals (Basic and fabricated) 16 -25 -33 56 74
29 Machinery 10 21 -17 -9 34
NACE code Industry
Percentage change in 1991-96
The food industry experienced a decoupling with respect to acidifying compounds, but deterioration with respect to GHG-emissions during 1991 – 96. The pulp and paper sector experienced the poorest development measured with changes in the eco-efficiency indexes among the industries listed in Table 3.2 Conversely, the metal industry experienced a very positive development with respect to decoupling, but metal firms still have significant CO2-emissions as a result of using carbon in their production process. The chemical industry experienced weak decoupling with respect to GHG-emissions, but deterioration with respect to acidifying compounds.
3.2 State of the environment
The environmental pressure results in changes in the state of the environment. In White Paper no. 58 (1996 – 97) to the Parliament (Stortinget) on environmental policy for sustainable development, eight priority areas were established, see Table 3.3. These priority areas provide the basic results of the monitoring system used by the environmental authorities in Norway. Strategic objectives and national targets have been set for each of these priority areas. Some targets reflect international agreements ratified by Norway, e.g. the Kyoto Protocol.
7 GWP: A weighted sum of greenhouse gases in CO2-equivalents 8 PAE: A weighted sum of SO2, NOX and NH3

18
Table 3.3: Eight priority areas of environmental policy, 1999
Priority area and topic Pressure indicators Selected targets Base year Deadline 1999 level

19
3.3 Responses to environmental problems
3.3.1 The framework for environmental policy in Norway
“Norway probably has the most extensive framework for environmental policy of all countries in the world” (OECD, 1999).
Norway was among the first countries to establish a Ministry of Environment, in 1972. The Ministry is responsible for nature conservation and pollution control, assessing, and reporting on environmental trends and proposing cross-sectoral measures and national goals. Under the authority of the Ministry, there are different environmental bodies including the important State Pollution Control Authority (SFT in Norwegian).
Various inter-ministerial committees have supported co-ordination on environmental matters. In 1997 (White Paper no. 58) the authorities reshaped and reinforced policy on economic-environmental integration. To improve sectoral integration, Ministries were requested to define and adopt sectoral action plans. As reported in Section 3.2, eight areas of environmental policy were identified.
Norway has a three-tier governmental system with 19 counties and 435 municipalities. Municipalities were given greater responsibilities for implementation of environmental policies during the 1990s. Today municipalities have primary authority over waste water treatment and waste management.
3.3.2 Instruments of environmental policy
The environmental policy instruments are often divided into three main categories:
A. Command and control instruments like performance-based standards (e.g. emission permits), technology-based standards (e.g. abatement equipment) and input bans.
B. Economic instruments such as taxes, charges, subsidies and tradable emission permits. C. Voluntary agreements and information (e.g. negotiated agreements and eco-labels).
In addition, voluntary private actions such as the introduction of environmental management systems (EMS) to follow-up environmental activities have been established in many industries during the last decade (cf. chapter 4).
A. Command and control instruments
Direct regulations based on environmental legislation were established in the latter part of the 1970s and the first part of the 1980s. Several amendments have been made during the 1990s as part of an environmental regulatory reform. Regulations are still a dominant instrument in Norway.
The Pollution Control Act (1981 and amended in 1989 and 1993) contains provision that SFT may grant emission permits. The SFT relies on ambient air and water guideline, which forms an important basis for granting emission permits (Sæther, 1997). The Pollution Control Act covers all forms of pollution from stationary sources, and is based on the application of “integrated pollution control”. Issued under the Pollution Control Act, discharge permits have been the main instruments to reduce emissions from industry, i.e. a reduction in SO2 emissions from industry by more than 40% during the 1990s. Maximum limits on the sulphur content of fuel oil, may also be an important reason for this development.
During the 1980s, the emission permits covered large and easily visible emissions, and the system could be described as “recipient-oriented”. The emission permit system with air/water quality guidelines
20
devoted much attention to large point source of industry, and too little attention to diffuse source and municipal waste.
During the 1990’s, there was a general increase in the flexibility of regulations. Regulation relating to internal control within the facility (safety, environment and health at work, called the HSE-regulation) took effect in 1992, and the SFT concentrated more on the control of internal systems in industry. As a consequence, technology-based standards became less important in this period.
Regulation of SMEs would be very resource-consuming, particularly in terms of the costs of issuing permits. Therefore, SFT issues regulations covering particular parts of industry (i.e. regulation of photo-chemicals). The Product Control Act (1976, and amended in 1990 and 1993) was amended as a response to growing concern from an increasing flow of products, containing hazardous chemicals. In principle, the Act covers all kinds of products.
Together, the Pollution Control Act and the Product Control Act provide the foundation of direct environmental regulation in Norway (Sæther, 1997)9.
B. Economic instruments
“Norway has consistently been one of the leaders among OECD-countries in using economic instruments” (OECD, 2001).
During the 1990s, a shift away from command-and-control instruments towards strengthening the use of taxes/charges was initiated. The more general search for increasing the efficiency of policy instruments put more emphasis on the economics of environmental regulations. Three major commissions provided a comprehensive basis for decisions on the use of economic instruments in environmental policy. Several environmental taxes10 were launched in the 1990s, such as the CO2-tax (1991), the tax on non-refillable beverage containers (1994), the tax on final waste treatment (1999) and a large increase in the sulphur tax (2000). Energy products are also subject to a range of taxes in Norway, motivated by environmental and fiscal objectives. There is a relatively high rate of taxation on petroleum products, representing up to 70% of the market price. More than 8% of tax revenue in Norway was produced by environmental related taxes in 1998, compared to 5.3% as an OECD average.
The implementation of environmental taxes in Norway strikes a balance between cost-effectiveness, international competitiveness and regional development, with the latter two often overriding environmental and cost-effectiveness concerns (OECD, 1999). The Environmental Tax Commission (1992) pointed out that 40% of CO2 emissions and 60% of SO2 emissions were exempted from taxation at that time. The main reason was that Norway would suffer a considerable loss of unemployment from a unilateral increase in the carbon tax. Energy-intensive industries were exempted from the sulphur tax until 200011.
In 1999, 64% of total CO2 emissions were covered by the CO2 tax. Several mainland exporting industries are still totally exempt from CO2 taxation, such as aluminium, ferro-alloys, fertilizer and chemicals firms.
9 Other laws like the Planning and Building Act (1985) are also important instruments in providing basis for
land-use and protection of the environment. For nature protection, the Nature Conservation Act and the Wildlife Act are important laws.
10 Taxes with an explicit environmental purpose. 11 Later analysis has shown that the marginal abatement costs were higher than anticipated for energy-
intensive industries, and thus the tax did not meet its environmental objective.

21
An important challenge for Norway today is to meet the Kyoto Protocol Commitments, cf. Table 3.3. By 1999 the manufacturing sectors were responsible for 28% of the GHG emissions12. During the 1990s, GHG emissions from manufacturing sectors increased by 8% and are estimated to rise by 17% during 1990 – 2010.
To cope with this challenge, a Commission in 1999 recommended an extensive national trading quota system to be introduced. During 2002, the Storting decided to reduce GHG emissions by means of a domestic emission-trading system for some branches of industry from 2005. The emission trading system will also apply to emission sources that do not pay a CO2 tax. The overall ceiling for quotas is based on a reduction of total GHG emissions by 20% from 1990. Plans are made to link the Norwegian System to the proposed EU emission-trading scheme.
C. Voluntary agreements and information
“The quality of environmental information in Norway is generally very good” (OECD, 2001)
During the 1990s there was a shift towards control of internal systems in firms and implementation of economic instruments, rather than more prescriptive policies. In addition, greater focus on products and “diffuse” sources of environmental problems like waste generation, was the background for implementing “voluntary agreements” to promote waste recycling. Several agreements were signed during the mid-nineties with various industry branches and the Ministry of Environment regarding paper, cardboard, glass, lead accumulations and car parts. These agreements were developed within the existing regulatory framework.
As the emissions of greenhouse gases increased and several commissions proposed a CO2 tax on fossil fuel, the industry preferred voluntary agreements to reduce greenhouse gas emissions. In 1997, the aluminium industry signed such an agreement with the Ministry of Environment to reduce greenhouse gas emissions per unit of aluminium by 55% in the period of 1990-2005. This corresponds to a 4% reduction in total Norwegian GHG emissions.
An industrial Energy Efficiency Network, covering 80% of energy use in the industrial sector, has improved energy efficiency and reduced emissions through voluntary agreements with industry since 1989. But in spite of these examples, agreements between authorities and industry have not played an important role in environmental policy in general, except in areas like waste management policies.
Information as a policy instrument is important when it comes to products. The Product Control Act (1976) has been amended as a response to growing concern over potential environmental damages from new products, in particular hazardous chemicals. The common Nordic scheme for voluntary eco-labeling, “The Nordic Swan”, encompasses products such as detergents, paper products, glue and sanitary products.
Energy labeling on ‘white goods’ (refrigerators, washing machines etc.) has been carried out since 1996 to provide consumers with information concerning energy efficiency. Existing rules in the Accounting Act represents another example of a general provision to provide information from industry with significant impacts on the environment, i.e. such firms should report on pollution, energy use and waste management13.
12 16,2 mill out of total 56.2 mill. tonnes of CO2-equivalents. Norway has an annual emission allowance of
52.5 mill. tonnes CO2-equivalents under the Kyoto Protocol. 13 A study by Ruud and Larsen (2003) states that just 30% of the largest companies in Norway are reporting
in accordance with these new regulations in the Accounting Act.

22
Chapter 3: Summary
• Environmental management policies in Norway aim to strike a balance between considerations of cost-effectiveness, international competitiveness and regional development – with the latter two considerations often overriding environmental and cost-effectiveness concerns. (OECD, 1999)
• Direct environmental regulations are still dominant. The Pollution Control Act and the Product Control Act provide the foundation of direct environmental regulation in Norway.
• Two important trends have taken place over the last decades: - A shift from technology-based standards towards performance-based
standards - A shift from control of details towards control of internal systems in
business and industry • Increasingly ambitious targets in environmental policy, resulting in an increased
emphasis on cost-effectiveness and the use of economic instruments and negotiated agreements.
• Norway has consistently been one of the leaders among OECD countries in using economic instruments (OECD, 2001). More than 8 per cent of tax revenue was produced by environmentally-related taxes in 1998 compared to 5.3% as an OECD average.
• In 1999, 64% of the total CO2-emissions were covered by the CO2 tax, but important industries like aluminium, ferro-alloys and cement still receive an exemption from the CO2 tax.
• To meet the Kyoto Protocol commitment, the Storting has decided to implement a domestic GHG-emission trading scheme in Norway from 2005, applying also to emission sources that do not pay a CO2-tax today.
• Agreements between authorities and industries have not played an important role in Norwegian environmental policy, except in waste management policies.
The GRIP Centre for Sustainable Production and Consumption was established by the Ministry of Environment in co-operation with Trade Associations. GRIP is providing private and public sectors with information tools and sector manuals on different topics, e.g. on “Best Practice” and “Eco-Efficiency”.
Green Business Network Norway (BBU) is another important player in promoting voluntary environmental activities in Norwegian businesses and industries.

23
4. ENVIRONMENTAL MANAGEMENT AND PERFORMANCE
4.1 Environmental management systems and tools
Even if the introduction of an environmental management system (EMS) is voluntary, in some ways EMS has become an essential prerequisite for international business exchange. One goal of the project is to examine whether the presence of an EMS is associated with improved environmental performance or not.
To follow-up environmental activities over time, 85% of the Norwegian manufacturing companies reported to have at least one person with explicit responsibility for environmental concerns. The location of this individual within the firm is shown in Figure 4.1:
Figure 4.1: Location of Persons Designated as being Responsible for the Environment
0,9 %
0,9 %
3,6 %
13,5 %
29,7 %
33,8 %
17,6 %
0 % 10 % 20 % 30 % 40 % 50 %
Finance/ Accounting
Product Development
Human resources
Other departments
Special env departmentor equivalent
Senior Management
Production/ operations
The graph indicates that nearly two-thirds of the individuals responsible for environmental concerns
belong to line management, equally split between production/operations and senior management. Just 17% of the individuals were located in special environmental departments. An environmental management system will enable the enterprise to co-ordinate and carry out environmental actions. In Figure 4.2, the prevalence of environmental management practices and tools is presented.

24
Figure 4.2: Activities in respect of environmental management systems
(share of facilities that responded affirmatively)
12,1 %
24,1 %
31,0 %
44,5 %
44,7 %
50,7 %
54,4 %
76,6 %
80,8 %
0 % 20 % 40 % 60 % 80 % 100 %
Env criteria used to evaluate/compensateemployees
Benchmark env performance
Env accounting
Env training programme for employees
External env audits
Env performance indicators/goals
Public env report
Written env policy
Internal env audits
Almost 8 out of 10 firms have prepared a written environmental policy and have carried out internal environmental audits. More than 5 out of 10 publish a public environmental report and 45% have set up training programmes in the environmental area.
In Figure 4.3, the share of firms in different sectors that confirmed they have a written environmental policy is presented.
Figure 4.3: Written Environmental Policy by Sectors
(share of facilities that confirmed the activity had been carried out)
61,1 %
71,4 %
75,0 %
76,0 %
88,2 %
93,3 %
100,0 %
100,0 %
0 % 20 % 40 % 60 % 80 % 100 %
Wood and products of wood
Food and tobacco products
Fabricated metal products
Machinery and equipment
Transport equipment
Chemicals and chemical products
Paper and paper products
Basic metals

25
The “polluting” sectors (basic metal, paper an chemicals) are at the top of the list, while the “wood
sector” is lagging behind the others. In the BEB-project (Ytterhus, 2002), we have mapped practices in environmental management for nearly a decade, and some trends may be of interest to the reader. Here we select two indicators of environmental practices from the BEB-project in 1998 and 200114 to compare with the 2003 results: These indicators were “having a written environmental policy” and “having an environmental training programme”.
Figure 4.4: Environmental Management Practices
(Share of firms that confirmed that the activities had been carried out.)
17 %
47 %
45 %
70 %
45 %
77 %
0 % 20 % 40 % 60 % 80 % 100 %
The firm has its ownenvironmental training
program
The firm has a writtenenvironmental policy 2003
2001
1998
The prevalence of different environmental management practices, indicates a positive trend:
• Whereas in 1998, 5 of 10 enterprises had a written environmental strategy, this share increased to 7 of 10 in 2001, and nearly to 8 of 10 in 2003.
• From 1998 to 2001 there was a rise with respect to training. The reason for this may be that in the 1998-survey; “lack of competent personnel” was reported to be the most important obstacle to the implementation of environmental activities (Kestemont and Ytterhus, 2000). Since 2001, the reported degree of having a training programme has not changed.
4.1.1 Environmental Management Systems (EMS)
Routines for implementation and follow-up of environmental activities over time are established through environmental management practice like introducing and environmental management system (EMS). In our sample, 35% of the respondents confirm they have an EMS in place.
It is often found that there is a positive relationship between firm size and the likelihood of having an EMS in place (Johnstone et al, 2002). This may be explained by economies of scale in administration costs or by the reason that management systems in general are more extended in large than smaller firms, increasing the potential benefits from their introductions.
14 See Ytterhus (2002) for more trends on Environmental management in Norway.

26
Figure 4.5: Facilities that have actually implemented an EMS by size of facility
(number of employees).
0 %
25 %
50 %
75 %
100 %
<50 50-70 70-90 90-120 120-150 150-210 210-300 300-500 500-900 >900
The relationship between having an EMS in place and firm size, is positive as expected, cf. Figure 4.5: While just 25% of the smallest firms have an EMS in place, 75% of the largest firms have implemented an EMS. Out of facilities with 50 employees or more, 71 confirmed they had a certified EMS in place. An environmental certification such as ISO 14001 requires a management concern to be addressed in the same systematic manners as business issues like cost and quality (Coglianese and Nash, 2001)
Since the introduction of environmental activities in firms have been increasing during the last decade, it is instructive to examine whether these activities are integrated with other management practices. We should for example expect integration between environmental activities and quality management systems, because of the links between quality management systems standards such as ISO 9000 and environmental management systems standards such as ISO 14001.

27
Figure 4.6: Environmental Activities Integrated with Other Management Practices
31 %
7 %
76 %
74 %
29 %
42 %
25 %
23 %
13 %
13 %
32 %
28 %
44 %
70 %
10 %
13 %
39 %
30 %
0 % 20 % 40 % 60 % 80 % 100 %
Quality managementsystem
Health/safetymanagement system
Full-cost/activity-based accounting
Managementaccounting system
Process or job controlsystem
Inventory/materialsrequiremt planning
Fully
Partially
Not at all
From Figure 4.6, it can be observed that only 4 of 10 have fully integrated their environmental activities with the quality management system and their process or job control system. However, 7 of 10 confirm they have integrated their environmental activities with health/safety management systems.15
4.2 Environmental measures, innovation and performance
Rnvironmental impacts are generated at different stages of the product life cycle. In Ytterhus (2002) we have shown that the most reported environmental actions undertaken are related to the last part of the value chain.16 The environmental activities reported as having been undertaken in this section, may be seen as complements to management practices discussed above. First we compare the results on
• Environmental performance measures monitored • Environmental actions undertaken to reduce environmental impacts
15 In 1992, a regulation relating to internal control in pursuance with the Pollution Act, took effect. This regulation applied to all private and public enterprises and covered both the internal and external environment, i.e. safety, environment and health at work. 16 For example did 80% of the respondents undertake actions to reduce solid waste, 70% reducing discharges of effluents to water, and just 50% reducing use of water and substitute hazardous inputs.

28
Figure 4.7: Actions undertaken to Reduce Environmental Impacts and Performance Measures regularly Monitored
39 %
48 %
63 %
73 %
79 %
85 %
14 %
38 %
57 %
57 %
63 %
78 %
84 %
36 %
18 %
37 %
0 % 20 % 40 % 60 % 80 % 100 %
Global pollutants
Soil contamination
Local/regional air pollution
Aesthetic effects
Wastewater effluent
Use of natural resources
Risk of severe accidents
Solid waste generation
Actions undertaken toreduce environmentalimpacts
Performance measuresregularly monitored
There is certainly a positive correlation between performance measures monitored and undertaken environmental actions, cf. Figure 4.7.17 Some more results on environmental actions undertaken are found in Annex I:
• In Table C, we report results on actions to reduce environmental impacts by selected sectors. As we may expect, the “polluting” sectors (paper, chemicals and basic metals) have undertaken more actions than the sample average.
• In Figure D, we have shown results on actions undertaken by company size. For example, 25% of the smallest firms report that they have taken actions to reduce local or regional air pollution versus 60% of the largest companies. On actions to reduce solid waste generation and risk of severe accidents, we observe only minor differences with respect to facility size.
• In Figure E, we report how respondents perceive changes in environmental impacts per unit of output. A significant decrease in environmental impacts per unit of output are perceived in most areas, but especially concerning use of natural resources, solid waste generation and risk of severe accidents. These are also the three most reported actions undertaken, cf. Figure 4.7.
4.3 A certified EMS may matter
The presence of an EMS18 may be associated with improved environmental performance. Therefore an issue of general interest would be to explore if the presence of a certified EMS is significantly
17 Surprisingly, just 46 of 306 (i.e. 15%) confirmed to have undertaken actions to reduce impacts of global
pollutants (greenhouse gases) while 110 out of 305 (i.e. 36%) confirmed they had undertaken action to reduce local or regional air pollution.

29
associated with firms’ propensities to undertake actions to reduce their environmental impacts. The relationship is summarised in Table 4.1.
Table 4.1: Relationship Between certified EMS and Environmental Actions Undertaken
Actions No Yes P-value
use of natural resources 53,9 % 85,9 % 0,000
solid waste generation 78,3 % 98,6 % 0,000
wastewater effluent 51,7 % 70,4 % 0,005
local/regional air pollution 33,5 % 50,7 % 0,009
global pollutants 10,0 % 23,9 % 0,005
aesthetic effects 52,2 % 67,6 % 0,018
soil contamination 28,9 % 57,7 % 0,000
risk of severe accidents* 75,1 % 83,8 % 0,097
*) Not statistically significant
Certified EMS
The overall results support our hypothesis that a “certified EMS may matter”. In Table 4.1 we observe that certified EMS firms (n=68) undertake more activities to reduce damages to the environment than non-certified firms (n=177). All actions were statistically significant based on results of a chi-square test, except actions to reduce risk of severe accidents.
To explore whether EMS make a difference in firms’ environmental performance or improvements are caused by other factors, we group the firms using the following selection criteria.
• Firms with a certified environmental management system (ISO 14001, EMAS) form one group. • Management commitment refers to the priority given by the board of directors or top management
to environmental improvement. Firms with a separate environmental department are used as a proxy variable for management commitment in the following paragraphs.
By differentiating firms based on these two factors, we can classify firms into one of four groups, cf.
Table 4.2 (Coglianese and Nash, 2001):
18 An EMS is built on the concept of total quality management (TQM), i.e. it requires managers to
continuously improve their environmental performance (plan-do-check-act cycle)

30
Table 4.2: Environmental Department and Certified EMS facilities
Yes No Total
Yes 1) 40 2) 28 68
No 3) 69 4) 108 177
Total 109 136 2451) "Leaders" (Having both a certified EMS and Env deptartment)2) "Only EMS" firms (Having a certified EMS but no Env department)3) "Only Env. department" firms (Having an Env department but no certified EMS)4) "Laggards" (Neither having a certified EMS nor Env department.)
Env. department
Certified EMS
Based on the differentiation of the firms in Table 4.2, we are able to explore the relationship between “leaders”19, “laggards” and undertaken environmental actions.
Table 4.3: Relationship between "Leaders", "Laggards" and Actions Undertaken
Actions "Leaders" "Laggards" P-value
use of natural resources 90,0 % 54,6 % 0,000
solid waste generation 97,5 % 76,9 % 0,001
wastewater effluent 77,5 % 48,1 % 0,001
local/regional air pollution 60,0 % 30,8 % 0,001
global pollutants 32,5 % 5,6 % 0,000
aesthetic effects 77,5 % 48,1 % 0,001
soil contamination 65,0 % 24,1 % 0,000
risk of severe accidents 92,1 % 70,8 % 0,005
Table 4.3 supports our previous findings: The presence of a certified EMS (and environmental department) is associated with increased environmental activity. In all cases, “leaders” are more likely to undertake more environmental actions than the “laggards”. The results based on a chi-square test confirm that the results are statistically significant.
4.4 Some additional characteristics by EMS firms20:
• Global firms have a greater probability of having implemented an EMS than other firms. • Firms listed on the stock exchange have a greater probability of having implemented an EMS than
other firms. • Firms with head office in a foreign country have more often implemented an EMS than other
firms.
19 Some characteristics of the “Leaders” (i.e. having both a certified EMS and an environmental department):
They are larger and more global than the average facility. As many as 25% (10 out of 40) are in Basic metal. Transport equipment facilities are also “over-represented” (7 out of 40 facilities).
20 Results from analysis of the Norwegian data undertaken by Mrs. Celine Serravalle, OECD.

31
Chapter 4: Summary
Environmental Management Share of facilities having:
• At least one person responsible for environmental concerns: 85% • A written environmental policy: 77% • A public environmental report: 54% • Environmental training programmes: 45% • External environmental auditing: 45% • An environmental management system (EMS) in place: 39% • A certified EMS in place 28% • We observe a positive development over time concerning environmental practices
Environmental performance
• Sectors like Pulp and paper, Chemicals and Basic metal are more active than other sectors in implementing environmental activities, i.e. environmental management practices and undertaken (technical) actions to reduce environmental impacts.
• We observe a positive relationship between firm size and the likelihood of having an EMS in place.
• A certified EMS may matter: o Certified EMS firms undertake more actions to reduce damages caused by
environment than non-certified firms. o A certified EMS may be a good predictor for firms’ environmental progress.

32
5. INFLUENCE OF STAKEHOLDERS AND IMPORTANCE OF MOTIVATIONS
5.1 Environmental stakeholders
Many aspects influence the management’s view of the company’s future possibilities on the market. One of them is the pressure from their stakeholders. Public authorities, customers, employees and competitors are examples of stakeholders in an environmental context. Since enterprises are players in social systems, they have to take into account the demand made by their stakeholders to survive in the long term. Enterprises adapt to the demands from the stakeholders in different ways:
• Minimum solutions where enterprises, for instance observes statutory environmental requirements. This means that they pursue a “neutral” strategy.
• A “proactive” strategy where the enterprise implements activities beyond the statutory requirements. Examples of such activities would be the introduction of an environmental management system, a certified EMS, as well as environmental labelling of products. These are all examples on non-statutory environmental activities. However, cost reductions for example through the reduced use of energy and less waste, may make it profitable for enterprises to implement an environmental management system. Moreover, environmental labelling may in some cases give enterprises a competitive advantage through branding and product differentiation.
In the next paragraphs we are assessing the role played by regulatory, commercial and other
stakeholders in firms’ incentives to undertake environmental initiatives. Firms were requested to rank the influence of various stakeholders on environmental behaviour. The stakeholders can be classified as follows (Johnstone et al, 2002):
• Public authorities (environmental enforcement agencies, national or European legislators) • Internal stakeholders (manager, parent firm, employees) • External community stakeholders (NGO’s, scientific institutes, local communities, etc.) • Supply chain (consumers, retail companies, etc.) • Financial companies (accountants, banks, insurance companies, etc.)
The results of ranking the relative influence of the various stakeholders is summarised in Figure 5.1.
33
Figure 5.1 - The Most Influential Stakeholders with Respect to the Environment
1 2 3
Banks and other lenders
Household consumers
Suppliers of goods and services
Shareholders and investment funds
Env groups or organisations
Industry or trade associations
Labor unions
Neighborhood/community groups
Commercial buyers
Non-management employees
Corporate headquarters
Management employees
Public authorities
Not important Moderately important Very Important
The respondents considered the following interest groups as the most important: public authorities, management employees, corporate headquarters, non-management employees and commercial buyers. Players from whom the firm felt little pressure include, among others: NGO’s, shareholders and investment funds, suppliers of goods and services, household consumers and banks. These results support our findings from the 1998 and 2001-surveys, cf. Table 5.1:
Table 5.1: The Most Important Stakeholders in 1998 and 2001.
1998 20011 Management Management
“Top” 2 Environmental Enforcement Agencies Employees
five 3 Owners Environmental Enforcement Agencies
4 Employees Owners
5 Buyers Buyers (firms)
5 Consumer organisations Consumer organisations
‘“Bottom” 4 Competitors Scientific institutes
five 3 Suppliers Retail companies
2 Retail companies Accountants
1 Banks Banks
Source: Ytterhus, 2002.
Ranking Results
A ranking of the most important stakeholders by sectors, is shown in Table 5.2:

34
Table 5.2: Ranking of Stakeholders' importance by Sector
NACE 15+16 20 21 24 27 28 29 34+35
Rank
Food and tobacco products
Wood and products of wood
Paper and paper products
Chemicals and chemical products Basic Metals
Fabricated metal products
Machinery and equipment
Transport equipment
1stPublic authorities
Public authorities
Commercial buyers
Public authorities
Management employees
Management employees
Management employees
Management employees
2ndManagement employees
Management employees
Management employees
Management employees
Public authorities
Public authorities
Public authorities
Public authorities
3rdCommercial buyers
Non-management mployees
Industry or trade associations
Neighborhood/ community groups
Non-management employees
Non-management employees
Non-management employees
Non-management employees
4th
Non-management mployees Labor unions
Public authorities
Non-management employees Labor unions Labor unions
Commercial buyers
Commercial buyers
5thCorporate headquarters
Corporate headquarters
Neighborhood/ community groups
Corporate headquarters
Commercial buyers
Commercial buyers
Corporate headquarters
Corporate headquarters
6th
Industry or trade associations
Neighborhood/ community groups
Corporate headquarters
Industry or trade associations
Env groups or organisations
Corporate headquarters
Shareholders and inv funds
Neighborhood/ community groups
7th
Neighborhood/ community groups
Commercial buyers
Non-management mployees
Commercial buyers
Corporate headquarters
Industry or trade associations
Env groups or organisations Labor unions
8thEnv groups or organisations
Industry or trade associations
Env groups or organisations Labor unions
Neighborhood/ community groups
Env groups or organisations
Neighborhood/ community groups
Shareholders and inv funds
9th Labor unionsEnv groups or organisations
Shareholders and inv funds
Env groups or organisations
Shareholders and inv funds
Neighborhood/ community groups Labor unions
Industry or trade associations
10th
Suppliers of goods and services
Shareholders and inv funds
Suppliers of goods and services
Household consumers
Industry or trade associations
Shareholders and inv funds
Suppliers of goods and services
Env groups or organisations
11thHousehold consumers
Suppliers of goods and services Labor unions
Suppliers of goods and services
Banks and other lenders
Suppliers of goods and services
Industry or trade associations
Suppliers of goods and services
12thShareholders and inv funds
Banks and other lenders
Household consumers
Shareholders and inv funds
Household consumers
Banks and other lenders
Household consumers
Banks and other lenders
13thBanks and other lenders
Household consumers
Banks and other lenders
Banks and other lenders
Suppliers of goods and services
Household consumers
Banks and other lenders
Household consumers
The sectoral results support the general picture depicted in Figure 5.1: public authorities and/or
management employees are ranked in 1st and/or 2nd place in all sectors. Paper producers rank commercial buyers in first place21. Chemical producers rank neighbourhood/community groups as the third most important stakeholder. On the opposite end of the ranking, i.e. stakeholders that the respondents perceive
21 Some commercial buyers such as German publishing companies have since the mid- nineties put pressure
on their suppliers to deliver paper from well-managed forests. An example often mentioned in Norway was the Axel Springer Verlag requesting Norske Skog to process timber from sustainable forests. This development has created international labelling schemes for forest products like FSC (Forest Stewardship Council) and PEFC (Pan European Forest Certification). By the end of 2000, 70% of the timber traded in Norway was subject to forest management certified by PEFC.

35
as “not important” in an environmental setting, we find banks and other lenders, suppliers of goods and household consumers. Pressure from household consumers and the financial sector is perceived as very weak in Norway. These results are similar to our previous findings (Ytterhus, 2002).
5.1.1 Environmental obstacles
What may have been obstacles to the implementation of environmental activities? Among others, this question is relevant for environmental authorities when deciding how to stimulate environmental adaptation in business and industry. The questionnaire had no specific question about “obstacles”, but some results from previous survey may be of interest to the readers. These findings support the results of why “household consumers” had a very low ranking as an environmental stakeholder.
In the BEB-survey in 2001 the following question was asked: “To what extent may the following obstacles have made difficult the implementation of environmental activities in your enterprise?” A similar question formed part of the BEB-survey from 1998. Thus, we are able to compare the opinions of the business leaders as to what the biggest obstacles were in 1998 and 2001 cf. Table 5.3:
Table 5.3: Significant Obstacles to the Implementation of Environmental Activities.
1998 20011 - Lack of skilled human resources - Too costly
2 - Too costly - No competitive advantage
3 - No market demand for “green” products - No market demand for “green” products
4 - No competitive advantage - No legal requirements
5 - No technical solutions available - Lack of skilled human resources
Source: Ytterhus, 2002.
Ranking Largest obstacles
Some conclusions to be drawn:
• In 2001 “too costly” is classified as the most important obstacle. Both in the Norwegian survey, and even more clearly in the European study from 1998, financial circumstances were focused on as an important obstacle. (Kestemont and Ytterhus, 2001)
• Both in 2001 and 1998 “no market demand for “green” products” was perceived as an important obstacle. This is consistent with the perceived low pressure from household consumers by the respondents.
5.2 Importance of motivations
Traditionally, the prevailing view on the relationship between environmental activities and the goals of the enterprise has been that environmental activities increase costs and thus reduces the profitability of the enterprise. During the 1990s, however, concepts like eco-efficiency were introduced. Eco-efficiency could be defined as “to produce more by using less” (WBCSD, 1997). In real terms this means that it is possible to add more value without a corresponding increase in the effects on the environment. If an enterprise can reduce the use of energy or other input factors, this will be beneficial to the environment, and the enterprise may save money. Environmental activities may also result in a more positive profile for the enterprise. In total, cost reductions and an improved image in the markets due to environmental activities may lead to win/win situations from which both the enterprise and the environment will benefit.

36
In the questionnaire, two questions on motivation were asked. First, we present results on the most important motivations to the environmental practices in Figure 5.2:
Figure 5.2: The most Important Motives with Respect to Environmental Practices
0 1 2
Similar facilities adopting similar practices
New product development
New technology development
Cost savings
Corporate profile/image
Prevent or control environmental incidents
Regulatory compliance
Not important Moderately important Very important
Four factors were ranked as moderately important/very important: Regulatory compliance, prevention or control of environmental incidents, corporate profile/image and cost savings. Innovation factors like new product/new technology development clearly got a lower ranking. The most important factors are all, directly or indirectly, influenced by the “bottom” line:
• Environmental incidents and non-regulatory compliance may result in worse corporate image and a loss of revenue.
• “Soft” factors like corporate profile/ image have been listed as an important motivation for implementing environmental activities in our previous surveys (Ytterhus, 2002).
• Cost savings by reducing the use of energy or inputs are reported in several case studies (www.wbcsd.org).
The results from Figure 5.2 are supported by another question in our survey on motivation to
introduce an EMS, cf. Figure 5.3:

37
Figure 5.3: Most important Motivation Factors for Introducing an EMS
0 1 2
To allow for differentiation of our products
Regulators' incentives made it attractive
To reduce applicability of some regulations
Other facilities are adopting similar systems
To improve relations w ith regulatory authorities
To improve information about facility's operations
To better identify future environmental liabilities
To create cost savings in terms of use of inputs
To improve facility's prof ile/image
To improve efforts to achieve regulatory compliance
To prevent or control pollution
To create cost savings in terms of w aste management
Not important Moderately important Very important
Again, factors like cost savings, pollution prevention and control, regulatory compliance and company
profile/image were ranked as important motives in introducing an EMS. The presence of regulators’ incentives received a very low ranking by the respondents.
Chapter 5: Summary
Environmental stakeholders. • The most important stakeholders in an environmental context are: Public authorities,
management employees, corporate headquarters, non-management employees and commercial buyers. Stakeholders, which the respondents perceive as “not important”, are banks and other lenders, suppliers of goods and services and household consumers. These results are consistent with our previous findings.
• A ranking of the stakeholders by sectors, support the general picture. Public authorities and/ or management employees are ranked in 1st or 2nd place in most sectors.
Motivations. • The most important motivations with respect to the environmental practices were: Regulatory
compliance, prevention or control of environmental incidents, corporate profile/ image and cost saving. Innovation factors like new technology/ product development were perceived of less importance. These findings are also consistent with our previous studies.

38
6. THE ROLE OF PUBLIC ENVIRONMENTAL POLICY
As pointed out in Chapter 3, various types of direct regulation are still dominant in Norwegian environmental policy. However, a gradual increase in economic instruments, such as taxes and charges during the 1990s and decisions on a domestic GHG-emissions trading scheme from 2005 to meet the Kyoto Protocol commitments, have made economic instruments more important elements of the public policy regime. And finally, while some agreements between authorities and business have been negotiated, voluntary agreements have not played an important role in Norway, except in solid waste management. In the survey we asked the respondents to assess different environmental policy instruments in terms of their impact on their production activities. The main results are found in Figure 6.1.
Figure 6.1: The Role of Public Environmental Policy
0 1 2
Tradeable emission permits or credits
Supply information measures
Voluntary/negotiated agreements
Technical assistance programmes
Demand information measures
Subsidies/tax preferences
Input taxes
Liability for env damages
Emmission/effluent taxes/charges
Tech-based standards
Input bans
Performance-based standards
Not important Moderately important Very important
The respondents assessed direct regulations, and especially performance-based standards (i.e. emission permits) between very and moderately important. Taxes and charges reported a score as moderately important. Demand information measures and voluntary/negotiated agreements got a lower rank. Tradable emission permits was perceived as not important/not applicable by 75% of the respondents. A ranking of the most important instruments in terms of their impact on the production activities by sectors, are presented in Table 6.1.

39
Table 6.1: The Role of Public Environmental Policy - Ranking of Instruments by Sector
NACE 15+16 20 21 24 27 28 29 34+35
Rank
Food and tobacco products
Wood and products of wood
Paper and paper products
Chemicals and chemical products Basic Metals
Fabricated metal products
Machinery and equipment
Transport equipment
1st
Emmission, effluent taxes or charges Input taxes Input taxes Input bans
Performance-based standards
Emmission, effluent taxes or charges Input bans
Liability for env damages
2ndTech-based standards Input bans
Tech-based standards
Tech-based standards
Liability for env damages
Tech-based standards
Emmission, effluent taxes or charges Input bans
3rdLiability for env damages
Tech-based standards
Emmission, effluent taxes or charges
Performance-based standards Input taxes Input bans
Tech-based standards
Subsidies/ tax preferences
4th Input taxes
Emmission, effluent taxes or charges
Subsidies/ tax preferences
Emmission, effluent taxes or charges
Emmission, effluent taxes or charges Input taxes
Liability for env damages
Tech-based standards
5th
Performance-based standards
Liability for env damages Input bans Input taxes
Tech-based standards
Liability for env damages Input taxes Input taxes
6th
Demand information measures
Demand information measures
Liability for env damages
Liability for env damages
Demand information measures
Demand information measures
Subsidies/ tax preferences
Emmission, effluent taxes or charges
7th Input bans
Performance-based standards
Voluntary/ negotiated agreements
Subsidies/ tax preferences
Supply information measures
Supply information measures
Technical assistance programmes
Performance-based standards
8thSubsidies/ tax preferences
Technical assistance programmes
Tradeable emission permits or credits
Voluntary/ negotiated agreements
Voluntary/ negotiated agreements
Subsidies/ tax preferences
Voluntary/ negotiated agreements
Demand information measures
9th
Technical assistance programmes
Voluntary/ negotiated agreements
Demand information measures
Demand information measures
Subsidies/ tax preferences
Voluntary/ negotiated agreements
Performance-based standards
Technical assistance programmes
10th
Voluntary/ negotiated agreements
Subsidies/ tax preferences
Performance-based standards
Technical assistance programmes Input bans
Technical assistance programmes
Tradeable emission permits or credits
Supply information measures
11th
Supply information measures
Supply information measures
Technical assistance programmes
Tradeable emission permits or credits
Tradeable emission permits or credits
Performance-based standards
Demand information measures
Voluntary/ negotiated agreements
12th
Tradeable emission permits or credits
Tradeable emission permits or credits
Supply information measures
Supply information measures
Technical assistance programmes
Tradeable emission permits or credits
Supply information measures
Tradeable emission permits or credits
The picture in Table 6.1 is more mixed than the overall results in Figure 6.1. Performance-based
standards got one of the highest scores in “polluting” industries such as basic metals and chemicals. In four industries, (i.e. food, wood, pulp & paper and fabricated metals) economic instruments were ranked as the most important. Voluntary agreements and tradable emission permits got a very low ranking in most industries as instruments in terms of their impacts on production activities. In summary, the results in Table 6.1 are more or less as we would expect:
• Direct regulations are still dominant in many sectors, especially performance-based standards like emission permits.

40
• Economic instruments like taxes and charges were launched during the 1990s, but some exporting industries (aluminium, fertilizer and chemical firms) are exempted from CO2-taxation.
• Voluntary agreements have not played an important role in the Norwegian environmental policy, cf. the low ranking in Table 6.1.
The relationship between the most important policy instruments and actions undertaken to reduce
environmental impacts, are shown in the Annex, Table F. The respondents who perceive performance-based standards as most important, have undertaken most actions in areas like solid waste generation, wastewater effluent, local/regional air pollution and aesthetic effects. Among the few respondents perceiving voluntary agreements as very important, these had relatively undertaken most action to reduce global pollutants and soil contamination. Further, the respondents were asked to describe the environmental policy regime to which their facility was subjective. Results are shown in Figure 6.2 and 6.3.
Figure 6.2: Perceived Stringency of Environmental policy regime
40 %
43 %
16 %
0 % 10 % 20 % 30 % 40 % 50 %
Not particularlystringent
Moderate stringency
Very stringent

41
Figure 6.3: Perceived Stringency of Environmental Policy by Sector
11 %
5 %
30 %
20 %
63 %
4 %
10 %
16 %
0 %
10 %
20 %
30 %
40 %
50 %
60 %
70 %
Food andtobacco
Wood Paper Chemicals Basic metals Fabr. metal Machinery Transportequip.
Most respondents describe the environmental system they are facing as moderately stringent (43%) or
not particularly stringent (40%). Only 16% of the respondents characterised the policy as “very stringent”. Most of these respondents belonged to industries such as basic metals and pulp and paper. The numbers in Figure 6.3 indicate that 63% of the firms responding in basic metals perceive the policy as “very stringent”, while just 4% of the responding firms in the fabricated metals sector were of the same opinion.
In chapter 4 we concluded by saying that a certified EMS might be a good predictor for a firm’s environmental progress. Therefore some programmes and policies have been put in place to encourage firms to implement an environmental management system (EMS). In Figure 6.4, the most frequent incentives mentioned by the respondents are indicated.

42
Figure 6.4: The Most Common Environmental Policies and Programmes to Encourage an EMS
6 %
7 %
9 %
14 %
32 %
39 %
46 %
49 %
51 %
68 %
0 % 20 % 40 % 60 % 80 %
Waiving environmental regulations
Reducing stringency of regulatory thresholds
Providing preferences for public procurement
Providing f inancial support
Providing special recognition or aw ard
Expediting env permits
Providing technical assistance
Proving information about value of such systems
Consolidating env permits
Reduced frequency of inspections
Reduced frequency of regulatory inspections22 were mentioned by 68% of the firms responding, and consolidating environmental permits was perceived as a motivation for implementing EMS by 50%. Frequency of inspections during the last three years reported by the respondents, are found in Figure 6.5.
Figure 6.5: Frequency of Inspections
34 %
25 %
19 %
10 %
3 %5 %
2 % 2 %
0 %
10 %
20 %
30 %
40 %
0 1 2 3 4 5 6 >6
No. of inspections
22 According to a newsletter from State Pollution Control Authority (SFT) from January 2003, SFT reduces
inspection frequencies in firms with a certified EMS (EMAS or ISO 14001). Firms have to pay a charge for such inspections and fewer inspections will therefore reduce costs for the firms.

43
Chapter 6: Summary
• The assessment of different environmental policy instruments in terms of their impact on their production activities, are in accordance with the description of the environmental policy in chapter 3:
o Direct regulations and especially performance-based standards (i.e. emission permits) were assessed between very and moderately important.
o Economic instruments like taxes and charges received an average score of moderately important.
o Voluntary agreements were assessed between moderately important and not important.
o Tradable emission permits were perceived as not important/ not applicable by 75% of the respondents.
• 16% of the respondents characterised the environmental policy as “very stringent”. Most of these represented facilities in basic metals and pulp and paper.
• The most frequently used environmental policies and programmes to encourage use of an EMS, was reduced frequency of inspections.

44
7. ENVIRONMENTAL PRACTICE AND COMMERCIAL PERFORMANCE
The link between corporate environmental performance and financial performance has received significant attention over recent years, in the business community as well as in economic research. A large number of papers present arguments supporting the view that improved environmental performance is profitable23, challenging the more “traditional” view that corporate environmental protection primarily increases the costs of the firm. A general argument forwarded by most economists is: “There are no $100 bills lying on the pavement”. If it pays to take environmental concerns into account, why do not all companies operate within a higher environmental standard? This argument indicates that the profitability is unaffected or actually reduced by taking environmental concerns. However, taking information imperfections and time-consuming adjustments to changed incentive structures (due to changed stakeholder preferences, new regulations etc) into consideration, this argument might require some qualification. By investing in improved technologies or improved business practice, a company may signal a good environmental profile to customers and other stakeholders, as well as increasing its chances of qualifying for inclusion in screened funds. It may take some time before incentives for improved environmental practice materialize in improved economic performance.
A number of empirical studies on the relationship between environmental and financial performance subject have also been conducted in recent years24. Perhaps not surprisingly the studies give no clear picture of the sign and strength of the correlation between the two (groups of) variables. Differences in data sets, e.g. data from different countries, sectors or time span, in addition to differences in the choice of indicators and methods, are all factors affecting the outcome of the analysis. The empirical literature indicates that there is considerable uncertainty about the relationship between environmental performance and economic performance; and the relation to good management in general. The empirical studies in this field investigate firms with a wide range of environmental profiles, reflecting different priorities with respect to the implementation of environmental management systems, investments etc.
Some results are presented in the following figures and tables. But the reader has to keep in mind that this survey was not designed to focus directly on the links between commercial and environmental performance.
7.1 Commercial performance
In Figures 7.1 and 7.2, we report on two commercial performance indicators for the facility - changes in the value of shipments and profitability over the last three years:
• 41% report stagnation, while 36% confirm an increase in the value of shipments. • Nearly 50% report small profits, and nearly 18% confirm that revenue has been well in excess of
costs. We define these facilities as “profitable”, in the following sections.
23 See e.g. Schmidtheiny and Zorraquin (1996), Porter and van der Linde (1995a, 1995b). 24 See e.g. Hart and Ahuja (1996), Klassen and McLaughlin (1996), Hamilton (1995).

45
Figure 7.1: Changes in the Value of Shipments (last 3 years)
5,2 %
17,5 %
41,0 %
29,1 %
7,2 %
0 %
10 %
20 %
30 %
40 %
50 %
They havesignificantlydecreased
They havedecreased
They havestayed about the
same
They haveincreased
They havesignificantlyincreased
Figure 7.2: Assessment of Facility's overall Business Performance (last 3 years)
5,2 %
16,9 %
10,9 %
48,4 %
18,5 %
0 %
20 %
40 %
60 %
Revenue has beenso low as to produce
large losses
Revenue has beeninsuff icient to cover
costs
Revenue hasallow ed us to break
even
Revenue has beensuff icient to make a
small profit
Revenue has beenw ell in excess of
costs
7.2 Relationship between commercial performance and environmental practice
Tables 7.1 and 7.2 report on management practices and actions undertaken to reduce environmental impacts in the most “profitable” facilities (i.e. facilities where revenue was well in excess of costs) and the average facility (cf. Figures 4.2 and 4.7 in Chapter 4).

46
Table 7.1: Management Practices in "profitable" Facilities vs. ”other” Facilities
Practice Implemented: p-value
Written env policy 85,7 % 79,3 % 0,234
Env criteria used to evaluate/compensate employees 18,6 % 10,6 % 0,120
Env training programme for employees 48,9 % 43,5 % 0,310
External env audits 40,9 % 45,5 % 0,350
Internal env audits 80,0 % 81,0 % 0,510
Benchmark env performance 31,0 % 22,6 % 0,173
Env accounting 34,1 % 30,4 % 0,381
Public env report 62,8 % 52,6 % 0,146
Env performance indicators/goals 50,0 % 50,8 % 0,522
Profitable facilities n=43
Other facilities n=192
Table 7.2: Environmental Actions undertaken in “profitable” Facilities vs. ”other” Facilities
Action undertaken:Profitable
facilities n=46Other facilities
n=250 p-value
Reduce use of natural resources 69,6 % 61,5 % 0,196
Reduce solid waste generation 89,1 % 82,9 % 0,211
Reduce wastewater effluent 60,9 % 56,1 % 0,337
Reduce local/regional air pollution 41,3 % 37,7 % 0,387
Reduce global pollutants 13,0 % 14,1 % 0,531
Reduce aesthetic effects 58,7 % 56,1 % 0,440
Reduce soil contamination 34,8 % 37,6 % 0,431
Reduce risk of severe accidents 78,3 % 77,4 % 0,536
As shown in the two tables above, there was no statistically significant difference between the “profitable” facilities and the other firms on management practices and environmental action undertaken. The conclusion drawn from Table 7.1 & 7.2 may therefore be that profitability is not a main driver in implementing environmental practices and undertaking environmental actions.
7. 3 Environmental and commercial performance
In Chapter 4, Table 4.2, we grouped the facilities into
• “Leaders” (facilities having both a certified EMS and an environmental department) • “Laggards”25 (facilities having neither a certified EMS nor an environmental department)
Figures 7.3 and 7.4 present a comparison between “leaders” and the “laggards” versus commercial performance.
25 The ”laggards” are smaller in average than the other facilities (60% have 50-99 employees) and mainly
representing sectors like Food, Wood and Fabricated metals.

47
Figure 7.3: "Leaders’" and "Laggards’" and Changes in the Value of Shipment s (last 3 years)
0 %
10 %
20 %
30 %
40 %
50 %
They havesignif icantlydecreased
They havedecreased
They have stayedabout the same
They haveincreased
They havesignif icantlyincreased
Laggards
Leaders
Figure 7.4: "Leaders’” and "Laggards'" and Profitability
.
0 %
10 %
20 %
30 %
40 %
50 %
60 %
Revenue has beenso low as to produce
large losses
Revenue has beeninsuff icient to cover
costs
Revenue has allow edus to break even
Revenue has beensuff icient to make a
small profit
Revenue has beenw ell in excess of
costs
Laggards
Leaders
The comparison between “leaders” and “laggards” indicates no significant differences in economic performance.26 One reason might be the aggregation of firms into two categories. This aggregation does not catch specific sector development for domestic and international firms. For Norway this is important, since we have observed a counter-economic development in the mainland economy and international markets.
26 In Ytterhus (2002), another definition of “leaders” and ”laggards” was used. The firms were ranked
according to management practice/ environmental actions undertaken by using specific environmental indicators. The “leaders” were defined as the best (e.g. the top 20) and the “laggards” as the firms that got the lowest ranks. This report supported the hypothesis: It may pay to be “Green”.

48
Chapter 7: Summary
• Nearly 20% of the companies confirm that revenue had been well in excess of costs. But these “profitable” facilities did not undertake more environmental activities than other firms. Profit does not seem to be associated with undertaking environmental actions.
• Firms having both a certified EMS and an environmental department (“leaders”) compared to “laggards” (having neither a certified EMS nor an environmental department) did not differ significantly with respect to economic performance. These results did not support the hypothesis: “it may pay to be green”.

49
8. REFERENCES
Belz F and Strannegård L (1997) International Business Environmental Barometer (Oslo: Cappelen Akademisk Forlag).
Coglianese, Cary and Jennifer Nash, eds. (2001) Regulating from the Inside: Can Environmental Management Systems Achieve Policy Goals (Washington D.C.: RFF, 2001).
Hamilton, J. (1995): Pollution as news: Media and stock market reactions to the Toxics Release Inventory data, Journal of Environmental Economics and Management Vol. 28, pp. 98-113.
Hart & Ahuja (1996) “Does it pay to be green? An empirical examination of the relationship between emission reduction and firm performance” Business Strategy and the Environment Vol. 5.
Johnstone N, Scapecchi, P, Ytterhus B and Wolff (2002): The Firm, Environmental Management and Environmental Measure: Lessons from a survey of European manufacturing firms (Unpublished paper).
Kestemont M. P and Ytterhus B. E (2000). “European Business Environmental Barometer” (www.iag.ucl.ae.be/recherches/cese/)
Klassen & McLaughlin (1996) “The impact of environmental management on firm performance” in Management Science Vol. 42, No. 8, pp. 1199-1214.
OECD (1994): Environmental indicators: OECD Core Set (Paris: OECD).
OECD (1999): Sustainable Economic Growth: Natural Resources and the Environment in Norway. Economics Department Working Papers No 218.
OECD (2001): Environmental Performance Reviews: Norway (Paris: OECD).
Porter, M. and C. van der Linde (1995a) “Green and Competitive: Ending the Stalemate” Harvard Business Review, Sept.-Oct., pp. 119-134.
Porter, M. and C. van der Linde (1995b): Toward a new conception of the Environment-Competitiveness Relationship, Journal of Economic Perspectives Vol. 9, No. 4, pp. 97-118.
Ruud, Audun and Olav M. Larsen (2003): “Miljørapportering i store norske foretak: Fungerer Regnskapsloven etter intensjonen?” ProSus Rapport nr. 5/03. Oslo: ProSus.
Schmidtheiny, S and F.J.L. Zorraquin (1996): Financing Change: The Financial Community, Eco-Efficiency, and Sustainable Development (Cambridge, Massachusetts: MIT Press).
Statistics Norway (2002). Natural Resources and the Environment 2002. (Oslo: Statistics Norway)
St. melding nr. 58 (1996 – 1997). Miljøpolitikk for en bærekraftig utvikling.
St. melding nr. 25 (2002 – 2003) Regjeringens miljøvernpolitikk og rikets miljøstand.

50
Sæther B. A. (1997): Environmental Regulatory Reform in Norway. Ministry of Environment (unpublished paper).
WBCSD (1997): Eco-Efficiency. The Business link to Sustainable Development (Cambridge, Mass.: MIT Press).
Wolff R et al (1995): The Nordic Business Environmental Barometer. (Oslo: Bedriftsøkonomens Forlag)
Ytterhus B. E (2002): The Norwegian Business Environmental Barometer. Norwegian School of Management, Oslo. (Unpublished paper).
Ytterhus, B. E and Synnestvedt T (1996) “The process of greening: Results from the Nordic Business Environmental Barometer”in Eco- Management and Auditing. Vol. 3, No 1.

51
ANNEX I: ADDITIONAL RESULTS
Table A: Summary data for the main manufacturing sectors (1999)
% of total % of total
15-37 Total for all manufacturing sectors 139,3 1) 100,0 % 291,5 2) 100,0 %15-16 Food, beverages and tobacco 29,4 21,1 % 54,0 38,8 %
20 Wood and wood products 4,8 3,4 % 14,6 10,5 %
21 Pulp, paper and paper products 5,8 4,2 % 9,5 6,8 %
24 Chemicals and chemical products 10,6 7,6 % 13,9 10,0 %
27 Basic metals 9,7 7,0 % 13,9 10,0 %
28 Metal products 8,4 6,0 % 21,0 15,1 %
29 Machinery and equipment 10,9 7,8 % 23,7 17,0 %
34-35 Transport equipment 7,4 5,3 % 21,0 15,1 %Sum of the most important sectors 87,0 62,5 % 171,6 123,2 %
1) 12% of total GDP2) 14% of total employment
Source: Manufacturing statistics, 1999. Statistics Norway.
Manufacturing sectorNace- code
Value added
Billion NOK In 1000
No. of employees
Figure B: Representation of sectors in the sample
-12 %
-7 %
7 %
12 %
8 %
-3 %
11 %
2 %3 %
-6 %
3 %
-1 %
-15 %
-10 %
-5 %
0 %
5 %
10 %
15 %
Series1 -0,12 -0,07 0,07 0,12 0,08 -0,03 0,11 0,02 0,03 -0,06 0,03 -0,01
15-16 17-19 20 21-22 24 25-26 27 28 29 30-33 34-35 36

52
Table C: Actions undertaken to reduce environmental impacts - by sectors
NACE Sector
use of natural resources
solid waste generation
wastewater effluent
local/ regional air pollution
global pollutants
aesthetic effects
soil contami- nation
risk of severe accidents
15+16 Food and tobacco products 78,8 % 84,8 % 69,7 % 33,3 % 9,1 % 57,6 % 15,2 % 65,6 %
20 Wood and products of wood 60,7 % 79,3 % 58,6 % 31,0 % 10,3 % 41,4 % 48,3 % 76,9 %
21 Paper and paper products 90,0 % 100,0 % 90,0 % 70,0 % 20,0 % 80,0 % 50,0 % 90,0 %
24 Chemicals and chemical products 66,7 % 83,3 % 88,9 % 61,1 % 27,8 % 66,7 % 61,1 % 87,5 %
27 Basic Metals 88,9 % 94,4 % 83,3 % 61,1 % 22,2 % 88,9 % 66,7 % 88,9 %
28 Fabricated metal products 31,4 % 71,4 % 31,4 % 37,1 % 8,6 % 51,4 % 25,7 % 68,6 %
29 Machinery and equipment 41,9 % 71,0 % 48,4 % 6,5 % 6,5 % 40,0 % 38,7 % 60,0 %
34+35 Transport equipment 56,8 % 84,1 % 52,3 % 45,5 % 18,2 % 65,9 % 56,8 % 90,5 %
15-37 Total (all sectors) 60,7 % 83,3 % 56,9 % 36,1 % 15,0 % 55,1 % 39,9 % 76,8 %
Figure D: Actions undertaken to reduce environmental impacts - by size
0 %
20 %
40 %
60 %
80 %
100 %
aestheticeffects
global pollutants local/regional airpollution
risk of severeaccidents
soilcontamination
solid w astegeneration
use of naturalresources
w astew atereff luent
<100
100-250
250-500
>500

53
Figure E: Changes in environmental impacts per unit of output
0 %
10 %
20 %
30 %
40 %
50 %
60 %
70 %
80 %
Use of naturalresources
Solid w astegeneration
Wastew atereffluent
Local orregional air
pollution
Globalpollution
Aestheticeffects
Soilcontamination
Risk ofsevere
accidents
Decrease
No change
Increase
Table F: Relationship between the most important environmental policy instruments and actions undertaken to reduce environmental impact
Freq.
input bans 84 66 % 87 % 68 % 39 % 23 % 52 % 45 % 78 %
tech-based standards 63 67 % 92 % 68 % 41 % 21 % 64 % 46 % 83 %
performance-based standards 54 74 % 96 % 82 % 54 % 26 % 74 % 52 % 93 %
input taxes 22 76 % 97 % 61 % 36 % 19 % 53 % 40 % 84 %
emmission/effluent taxes/charges 69 77 % 94 % 71 % 37 % 19 % 61 % 44 % 84 %
tradeable emission permits or credits 26 81 % 89 % 81 % 50 % 19 % 62 % 58 % 96 %
liability for env damages 67 71 % 93 % 70 % 40 % 25 % 63 % 51 % 83 %
demand information measures 36 64 % 86 % 58 % 33 % 19 % 64 % 39 % 78 %
supply information measures 18 61 % 72 % 44 % 17 % 22 % 39 % 39 % 72 %
voluntary/negotiated agreements 20 75 % 80 % 55 % 40 % 50 % 68 % 65 % 70 %
subsidies/tax preferences 50 72 % 86 % 66 % 35 % 20 % 50 % 46 % 80 %
technical assistance programmes 16 63 % 94 % 56 % 25 % 31 % 38 % 44 % 73 %
soil
cont
amin
atio
n
risk
of s
ever
e ac
cide
nts
Imp
act
of
env
po
licy
inst
rum
ents
on
p
rod
uct
ion
(V
ery
imp
ort
ant)
:
Undertaken environmental action
use
of n
atur
al
reso
urce
s
solid
was
te
gene
ratio
n
was
tew
ater
ef
fluen
t
loca
l/reg
iona
l ai
r po
llutio
n
glob
al
pollu
tant
s
aest
hetic
ef
fect
s