Environmental Justice Report - thempc.org · Metropolitan Planning Organization (CORE MPO) are...
48
Environmental Justice Report OF THE COASTAL REGION METROPOLITAN PLANNING ORGANIZATION Prepared by The Coastal Region Metropolitan Planning Organization (CORE MPO) The Chatham County - Savannah Metropolitan Planning Commission (MPC) P.O. Box 8246, 110 East State Street Savannah, Georgia 31412-8246 Phone: (912) 651.1440 www.thempc.org Developed in 2002 Updated in 2004, 2009, 2011, 2012 and 2015
Transcript of Environmental Justice Report - thempc.org · Metropolitan Planning Organization (CORE MPO) are...

Environmental Justice Report OF
THE COASTAL REGION METROPOLITAN PLANNING ORGANIZATION
Prepared by The Coastal Region Metropolitan Planning Organization (CORE MPO)
The Chatham County - Savannah Metropolitan Planning Commission (MPC) P.O. Box 8246, 110 East State Street
Savannah, Georgia 31412-8246 Phone: (912) 651.1440
www.thempc.org
Developed in 2002
Updated in 2004, 2009, 2011, 2012 and 2015

2
The Chatham County-Savannah Metropolitan Planning Commission (MPC) and Coastal Region Metropolitan Planning Organization (CORE MPO) are committed to the principle of affirmative action and prohibit discrimination against otherwise qualified persons on the basis of race, color, religion, national origin, age, physical or mental disability, and where applicable, sex (including gender identity and expression), marital status, familial status, parental status, religion, sexual orientation, political beliefs, genetic information, reprisal, or because all or part of an individual's income is derived from any public assistance program in its recruitment, employment, facility and program accessibility or services. MPC and CORE MPO are committed to complying with and enforcing the provisions of the Title VI of the Civil Rights Act and other federal and state non-discrimination authorities. CORE MPO is also committed to taking positive and realistic affirmative steps to ensure the protection of rights and opportunities for all persons affected by its plans and programs. The opinions, findings, and conclusions in this publication are those of the author(s) and those individuals are responsible for the facts and the accuracy of the data presented herein. The contents of this report do not necessarily reflect the views or policies of the Department of Transportation, State of Georgia, the Federal Highway Administration, or the Federal Transit Administration. This report does not constitute a standard, specification of regulation.

3
Table of Contents Executive Summary ........................................................................................................................ 5
Chapter 1: Introduction to Environmental Justice .......................................................................... 6
1.1 Definition of Environmental Justice (EJ) ............................................................................. 6
1.2 Regulations of Environmental Justice .................................................................................. 6
1.2.1 Demographic Terms ....................................................................................................... 7
1.2.2 Disproportionate Effects Tests and Benefits .................................................................. 8
1.3 CORE MPO Approach to Environmental Justice ................................................................. 9
1.3.1 Objective ........................................................................................................................ 9
1.3.2 Procedures ...................................................................................................................... 9
Chapter 2: Identify Potential Burdens and Benefits ..................................................................... 10
2.1 Establishment of Objectives and Goals .............................................................................. 10
2.2 Identification of Performance Measures ............................................................................. 10
2.3 Identification of Benefits and Burdens in the Study Area .................................................. 11
Chapter 3: Identify the EJ Populations and Their Needs .............................................................. 13
3.1 Determine the Physical Components of the CORE MPO EJ Planning Area ..................... 13
3.2 Define the CORE MPO EJ Planning Area and the EJ Population ..................................... 14
3.2.1 Data .............................................................................................................................. 14
3.2.2 CORE MPO EJ Populations and EJ Target Areas ....................................................... 15
3.2.3 CORE MPO EJ Map Production ................................................................................. 20
3.3 Identification of the Transportation Needs of EJ Target Populations ................................. 23
3.3.1 Typical Transportation Needs of Low Income Populations ........................................ 23
3.3.2 Typical Transportation Needs of Minority Populations .............................................. 23
3.3.3 Transportation Needs of Other Populations ................................................................. 24
Chapter 4: Correlation of Benefits and Burdens to EJ Target Populations .................................. 25
4.1 Identification of Measures .................................................................................................. 25
4.2 Application of Measures in MTP ........................................................................................ 25
4.2.1 EJ Analysis for Highway Element ............................................................................... 26
4.2.2 EJ Analysis for Transit Element .................................................................................. 28
4.2.3 EJ Analysis for Bike/Pedestrian Element .................................................................... 29
4.3 Application of Measures in TIP .......................................................................................... 29
4.4Findings and Conclusions .................................................................................................... 30

4
Chapter 5: Discussion of Possible Mitigation Strategies .............................................................. 32
5.1 Possible Mitigation Strategies............................................................................................. 32
5.2 Actions Taken ..................................................................................................................... 32
Chapter 6: Public Participation Activities ..................................................................................... 34
6.1 Participation Selection ........................................................................................................ 34
6.2 Outreach Methods ............................................................................................................... 35
6.3 Public Outreach Contacts .................................................................................................... 35
6.4 Information Presentation Methods ...................................................................................... 35
6.5 Discussion of Issues Raised Regarding EJ ......................................................................... 36
Chapter 7: Overall EJ Findings, Conclusions, and Recommendations ........................................ 37
Chapter 8: EJ Document Maintenance and Update ...................................................................... 38
Appendix: Historic EJ Related Maps ............................................................................................ 39

5
Executive Summary
Environmental Justice (EJ) is a federal requirement of federal, state, and local agencies and has legal basis in Title VI of the Civil Rights Act of 1964, Executive Order 12898 of 1994, and National Environmental Policy Act (NEPA). These regulations require that all agencies receiving federal assistance demonstrate compliance with related laws so that all the populations in the agency’s study area enjoy the same benefits of the federal investments, bare the same burdens resulted from the federal projects, and have equal participation in the local and state issues.
The Coastal Region Metropolitan Planning Organization (CORE MPO) is the Metropolitan Planning Organization (MPO) for the Savannah area. CORE MPO is responsible for transportation planning and project selection in the region.
This document details the CORE MPO’s approach to Environmental Justice in the CORE MPO metropolitan transportation planning area. The regulatory framework for the CORE MPO EJ study was outlined at first, including the EJ laws and important terms. The potential benefits and burdens of transportation projects were identified and the CORE MPO EJ target populations and target areas were then defined. In the next step, the potential burdens and benefits were correlated with the target populations and target areas to detect whether Environmental Justice concerns arise in the CORE MPO planning area, particularly in the long-range transportation planning process. Where EJ concerns do happen, mitigation strategies were discussed. Since equal public participation is one of the most important requirements for the EJ analysis, the public involvement process of the transportation plan update is discussed. The final chapters of this document discuss overall findings, conclusions and recommendations of the CORE MPO’s Environmental Justice program as well as the EJ document update.

6
Chapter 1: Introduction to Environmental Justice
1.1 Definition of Environmental Justice (EJ)
The U.S. EPA Office of Environmental Justice (EJ) defines EJ as
“The fair treatment and meaningful involvement of all people regardless of race, color, national origin, or income with respect to the development, implementation and enforcement of environmental laws, regulations and policies. Fair treatment means that no group of people, including racial, ethnic, or socio-economic group should bear a disproportionate share of the negative environmental consequences resulting from industrial, municipal, and commercial operations or the execution of federal, state, local and tribal programs and policies.”
In general, this means that for any program or activity for which any federal funds will be used, the agency receiving the federal funds:
Must make a meaningful effort to involve low income and minority populations in the processes established to make the decision about the use of the federal funds; and
Must evaluate the nature, extent, and incidence of probable favorable and adverse human health or environmental impacts of the program or activity upon minority or low-income populations.
1.2 Regulations of Environmental Justice
Recognizing that the impacts of federal programs and activities may raise questions of fairness to affected groups, President Clinton in 1994 signed Executive Order 12898: Federal Actions to Address Environmental Justice in Minority Populations and Low-income Populations. This Order served to amplify the provisions of Title VI of the Civil Rights Act of 1964.
Title VI of the 1964 Civil Rights Act states that “No person in the United States shall, on the ground of race, color, or national origin, be excluded from participation in, be denied the benefits of, or be subjected to discrimination under any program or activity receiving Federal financial assistance.” Title VI bars intentional discrimination as well as disparate impact discrimination (i.e. a neutral policy or practice that has a disparate impact on low income and minority groups).
The Environmental Justice Executive Order amplifies Title VI by providing that “each Federal agency shall make achieving Environmental Justice part of its mission by identifying and addressing, as appropriate, disproportionately high and adverse human health or environmental effects of its programs, policies and activities on minority and low-income populations.”
In compliance with the Executive Order, the U.S. Department of Transportation (USDOT) issued its final order in 1997 to describe the process to incorporate EJ principles into existing programs, policies, and activities. In response, the Federal Highway Administration (FHWA) issued its action statement to address Environmental Justice in 1998, outlining specific issues to be addressed about EJ to assure that States and MPOs are in compliance with EJ guidelines.

7
In response to the USDOT order and the FHWA guidelines, the Georgia Department of Transportation (GDOT) developed Environmental Justice Planning Guidelines to guide GDOT and the local transportation planning agencies in the State of Georgia to address EJ issues (see the GDOT website at http://www.dot.ga.gov/BuildSmart/research/Documents/1018.pdf#search=EJ%20Guidance%20for%20transportation%20planning).
The Coastal Region Metropolitan Planning Organization (CORE MPO) was designated a Transportation Management Area (TMA) in 2002 and is subject to the FHWA/FTA certification review process. CORE MPO prepares this Environmental Justice report not only in response to the federal and state requirements, but also to facilitate the fair transportation planning process in the Savannah area.
In order to get a full understanding of Environmental Justice issues, the EJ terms must be defined. Below are the definitions of the EJ demographic and impact terms.
1.2.1 Demographic Terms
The first step in EJ compliance is to identify the low-income and minority populations who should be involved in the decision making process and who may be impacted by the expenditure of federal transportation funds. What constitutes low income and minority populations are defined by the GDOT Environmental Justice Guidelines as follows:
Low-Income means a person whose median household income is at or below the Department of Health and Human Services poverty guidelines.
Low-Income Population means any readily identifiable group of low-income persons who live in geographic proximity, and, if circumstances warrant, geographically dispersed/transient persons who will be similarly affected by a proposed USDOT program, policy or activity.
Minority means a person who is: (1) Black (a person having origins in any of the black racial groups of Africa); (2) Hispanic (a person of Mexican, Puerto Rican, Cuban, Central or South American, or other Spanish culture or origin, regardless of race); (3) Asian American (a person having origins in any of the original peoples of the Far East, Southeast Asia, the Indian subcontinent, or the Pacific Islands); (4) American Indian and Alaskan Native (a person having origins in any of the original people of North America and who maintains cultural identification through tribal affiliation or community recognition); and (5) Native Hawaii or Other Pacific Islanders (a person having origins in any of the original peoples of Hawaii, Guam, Samoa, or other Pacific Islands). Additionally, any person who responded to the US Census as being either solely or a mix of one of these minority groups qualifies as being in the minority population.
Minority Population means any readily identifiable groups of minority persons who live in geographic proximity, and if circumstances warrant, geographically dispersed/transient persons who will be similarly affected by a proposed USDOT program, policy or activity.
Besides the minority and low-income populations, GDOT also suggests that MPOs consider the Elderly, Children, Disabled and other populations. In this analysis, these populations are defined as below:

8
Disabled Population includes people with mobility limitation, self-care limitation, or people with both mobility limitation and self-care limitation.
The Elderly Population refers to the people that are 65 years and older.
Children refers to the people who are 16 years and younger.
1.2.2 Disproportionate Effects Tests and Benefits
After the target populations have been identified, the actual EJ analysis or “test” for disproportionately high and adverse effects and equal benefits should be conducted. The definitions of these concepts are contained in the GDOT Environmental Justice Planning Guidelines as follows:
Adverse Effects means the totality of significant individual or cumulative human health or environmental effects, including interrelated social and economic effects, which may include, but are not limited to: mental or physical impairment, infirmity, illness or death; air, noise, and water pollution and soil contamination; destruction or disruption of man-made or natural resources; destruction or diminution of aesthetic values; destruction or disruption of the availability of public and private facilities and services; vibration; adverse employment effects; displacement of persons, businesses, farms, or non-profit organizations; increased traffic congestion, isolation, exclusion or separation of minority or low-income individuals within a given community or from the broader community; and the denial of, reduction in, or significant delay in the receipt of, benefits of DOT programs, policies, and activities.
Disproportionately High and Adverse Effect on Minority and Low-Income Populations means an adverse effect that: (1) is predominately borne by a minority population and/or a low-income population, or (2) will be suffered by the minority population and/or low-income population and is appreciably more severe or greater in magnitude than the adverse effect that will be suffered by the non-minority population and/or non-low-income population.
Besides disproportionately high and adverse human health or environmental effects, Executive Order 12898 also applies to the need to demonstrate equal benefits from transportation investments. EJ tests and analysis should also evaluate the benefits of projects and positive benefits from transportation plans.
Benefits: For a specific project, corridor or sub-area, benefits should include all of the benefits listed in the purpose and need statement. For a metropolitan transportation system, benefits should refer to how the Metropolitan Transportation Plan (MTP) and the Transportation Improvement Program (TIP) promote the safety, mobility, economic productivity, human environment, natural environment, and other goals identified in State and local plans for all populations served by the transportation agency.
When evaluating adverse impact or proportionate benefits, two questions must be addressed:
1) What type of impacts should be identified and evaluated, and 2) How can the positive and negative impacts be “tested” quantitatively?
9
1.3 CORE MPO Approach to Environmental Justice
1.3.1 Objective
As the designated Metropolitan Planning Organization (MPO) that does transportation planning for the Savannah area, the Coastal Region Metropolitan Planning Organization (CORE MPO) determined to assess the impacts of the transportation planning process, the Metropolitan Transportation Plan (MTP) and the Transportation Improvement Program (TIP) on minority and low-income populations. Besides, CORE MPO defined the other target populations (the disabled, the elderly, and the children), identified their transportation needs, and tried to explore ways to satisfy these needs.
CORE MPO identified three principles to ensure that Environmental Justice considerations are properly integrated into the transportation planning process.
1. Adequate public involvement of the target populations (low-income, minority, the disabled, the elderly, and children) in regional transportation decision-making.
2. Assess whether there are disproportionately high and adverse impacts on the target populations resulting from federal programs.
3. Assure that the target populations receive a proportionate share of benefits of federal transportation investments.
1.3.2 Procedures
CORE MPO determined to follow the process from the GDOT EJ planning guidelines to address the Environmental Justice issues in the CORE MPO transportation planning area. The process includes the following procedures:
1. Identify the potential burdens and benefits; 2. Identify the target populations within the study area; 3. Correlate the identified burdens and benefits to the target populations; 4. Note possible mitigation strategies for identified disproportionate burdens; 5. Determine which public participation methodologies to use; 6. Make Environmental Justice recommendations; and 7. Evaluate the implementation of the EJ process.

10
Chapter 2: Identify Potential Burdens and Benefits
2.1 Establishment of Objectives and Goals
The first step in identifying and addressing potential burdens and benefits on EJ populations occurs during the establishment of goals and objectives in the planning process. CORE MPO developed its EJ objectives and goals corresponding to the FHWA guidelines (Publication NHI-02-034), thus the overall goals that address EJ in the planning process include the following:
Enhance accessibility and mobility; Promote system preservation; Enhance quality of life and health; Improve safety; Promote economic development; and Improve operational efficiency.
2.2 Identification of Performance Measures
The next step involves establishing meaningful performance measures to determine burdens and benefits. These measures are developed to test against the planning goals defined above.
The GDOT EJ Guidelines suggest some performance measures such as average number of jobs within 20 minutes by driving, average number of jobs within 40 minutes by bus, transit ridership per capita, frequency of transit service, number of high-accident locations, accidents per year, average travel time for home-based work trip, average travel time for home-based other trips, percent of population close to a hospital, percent of population close to a college and percent of population close to a major retail destination.
Even though these measures are comprehensive, it is difficult to determine how some of them can be correlated to the EJ target populations. CORE MPO decided to perform the EJ analysis by ensuring fair public involvement and by comparing the total proposed improvements within and outside of the EJ target areas. Specifically, the performance measures include the following transportation modes:
Highway
o Highway Investments o Displacement from Highway Projects
Public Transit
o Fixed Route Bus Service o Teleride Service o Shuttle Bus and Van Pool o Water Ferry Service
Bike Routes and Pedestrian Accessibility
Other Modes

11
2.3 Identification of Benefits and Burdens in the Study Area
With the performance measures established, the potential benefits and burdens can be identified. The following table lists some of the benefits and burdens and possible mitigation strategies identified by CORE MPO.
Table 2.1: Potential Benefits and Burdens
Proposed Project
Type
Possible Benefits Possible Burdens Possible Mitigation Strategies
Highway System
New Road
Enhance accessibility and mobility;
Promote economic development;
Improve safety;
Improve operational efficiency.
Benefits limited to populations with motor vehicles;
Increase in noise and air pollution;
Might impact existing neighborhoods.
Signal synchronization, pedestrian crosswalks, bike lanes, bus route addition, etc;
Select ROW for minimum impacts;
Try to incorporate context-sensitive design to maintain the neighborhoods.
Resurface/Upgrade of existing roadways
Promote system preservation;
Improve safety;
Improve operational efficiency.
Expansion of shoulder width impinges on residential property;
Diverted traffic during project construction causes heavy traffic and dangerous conditions on city streets;
Noise and air pollution during construction.
Build curbing and sidewalks rather than shoulders;
Close large section of roadways on weekends to increase resurfacing productivity;
Reroute traffic to major streets if possible.
Public Transit
Fixed Route Bus Service and Water Ferry Service
Enhance accessibility by transit to EJ populations;
Reduce reliance on motor vehicles and improve air quality;
Increase mobility to EJ populations.
Buses are sometimes smelly and noisy;
Bus headways in certain routes might be too long;
Possible capacity problems with ferry boats;
Some bus shelters are not wheelchair accessible.
Try to create a comfortable environment for the bus and ferry boat riders;
Improve transit frequency if possible;
Bus routes should be within walking distance of EJ populations;
Install bus shelters accessible by wheelchairs.

12
Teleride Service and Van Pool
Provide transportation for people with mobility limitations;
The service can be enjoyed by the EJ target populations not living in the EJ target areas.
There might be problems with ride reservation /cancellation;
Riders are sensitive to driver’s comments and behavior.
Improve the ride reservation system;
Provide appropriate training to both drivers and riders.
Pedestrian and Bicycle Projects/Features
Addition of Pedestrian Amenities and / or Safety Provisions;
Addition of Bike Routes to Existing Roads
Improve quality of life, health and environment by encouraging people to use the bike/pedestrian facilities;
Improve safety to pedestrians and bike riders;
Provide an alternative to motor vehicles.
“Bump-outs” and traffic calming measures make commercial deliveries difficult;
Bike routes takes space for passing turning cars at intersections and reduce on-street parking.
Need to come up with some original improvement plans to accommodate both motor vehicle traffic and bike/pedestrian usage.
Other Transportation Projects
Multi-modal connections
ITS improvements
CMP strategies
Enhance mobility and accessibility;
Improve safety;
Enhance system preservation and operational efficiency.
Some ITS projects might be expensive to implement.
Multi-modal incorporates transit stations and other modes;
Have a comprehensive design before any ITS projects are implemented.

13
Chapter 3: Identify the EJ Populations and Their Needs
The basic step of the CORE MPO Environmental Justice analysis is defining the target populations and areas in the Savannah area where the Environmental Justice in transportation planning might be a concern. The result of this analysis will be used to help determine criteria for the selection of transportation improvements. It will also provide a methodology for conducting Environmental Justice analysis on the Metropolitan Transportation Plan (MTP) and the Transportation Improvement Program (TIP).
3.1 Determine the Physical Components of the CORE MPO EJ Planning Area
The current CORE MPO Metropolitan Planning Area (MPA) boundary includes all of Chatham County, the portion of the 2010 Savannah Urbanized Area located in Effingham County, the City of Richmond Hill, and the portion of the 2010 Savannah Urbanized Area located in unincorporated Bryan County (see map below).
Due to the irregularity of the CORE MPO MPA boundary, availability of census data and the fact that travels follow no specific boundaries, CORE MPO’s EJ planning area will cover the Savannah Metropolitan Statistical Area (MSA) that includes all of Bryan, Chatham and Effingham Counties.
§̈¦516
§̈¦16
§̈¦95
§̈¦516
§̈¦16
£¤17
£¤17
UV21
UV21
UV21
UV21
§̈¦95
§̈¦95
§̈¦16
HAR
RYS
TR
UM
AN
PKW
Y
JIMMY
DELOACH PKWY
UV204
UV204
VETERANS
PK
WY
UV30
£¤17
£¤17
£¤80
£¤80
£¤80
£¤80
£¤80
PO
OL
ER
PK
WY
ChathamBryan
Effingham
μ0 105
Miles
CORE MPO Metropolitan Planning Area (MPA)
Legend
CORE MPO MPA Boundary
Buckhead Urban Cluster
Rincon Urban Cluster
Savannah Urbanized Area
Tybee Island Urban Cluster

14
For the purpose of identifying the CORE MPO EJ populations, the physical components of the CORE MPO EJ planning area must be determined. These components are useful in determining the target population’s transportation needs.
According to the GDOT Environmental Justice Guidelines, the facilities in the study area that are suggested to be identified include: business areas, schools, hospitals, other Medical facilities, fire/police stations, libraries, recreation facilities, existing roads, trails/transit lines/subways and related stations, hazardous materials sites, transfer stations, landfills, water and sewage treatment facilities, large generators or attractions for transportation such as sports arenas/stadiums, theme parks, major industrial or business sites, universities/colleges, shopping malls, religious institutions such as churches, monasteries and nunneries, airports, intermodal facilities, ports, bus depots, power plants, other industrial facilities, parks, bodies of water/wetlands/preserves, governmental buildings/complexes, and utility substations (electric, gas generators, water storage, phone, etc.).
Of all these physical components, the educational facilities, medical facilities, law enforcement units, fire departments, transit routes and bikeway routes are considered most germane to the CORE MPO Environmental Justice analysis.
3.2 Define the CORE MPO EJ Planning Area and the EJ Population
The US Census Bureau provides population and household information on its website. Since most data are available at the census tract level, the CORE MPO Environmental Justice analysis uses census tracts as the basic geography. Maps were produced to highlight the areas of concern that contain concentrations of populations targeted for consideration in the Environmental Justice regulations. These maps were later used to compare with the Metropolitan Transportation Plan and the Transportation Improvement Program in targeted and non-targeted areas as a basis of analysis for beneficial investment or disproportionate negative impact.
The target EJ populations in the CORE MPO transportation planning area include minority populations (blacks, Hispanic populations, Asian Americans, American Indians and Alaskan Natives, Native Hawaiian or Other Pacific Islanders, and people with two or more races) and Low-Income populations (persons below poverty). The concentration of elderly, children and disabled populations are not used in the analysis, though their distributions are defined and their needs are identified through the process. This information is used for the equitable public involvement process and for planning other related transportation improvements.
The suggested thresholds used for defining the EJ populations come from the GDOT Environmental Justice Planning Guidelines - using the regional average as a standard. Thus this study identifies those census tracts that have a larger minority concentration or a larger percentage of poverty concentration than the regional average.
3.2.1 Data
The data for the CORE MPO EJ analysis in the transportation planning area is divided into two parts: digital maps and tabular data.

15
The Digital Map:
The digital maps for census tracts are from the 2010 Census Tiger files.
The highway project layer as defined in the Metropolitan Transportation Plan comes from the CORE MPO 2040 travel demand forecasting model.
The transit layers were developed through the cooperation between CORE MPO and the Chatham Area Transit Authority (CAT).
The bikeway layer and roadway amenity layer were developed by CORE MPO.
The Socio-Economic Data:
Detailed race and ethnicity data (100% count data) is available at the census tract level. The latest information is from the 2010 decennial census.
The 2010 Census data divides people into more than 70 categories based on the combinations of various race and ethnicity. For this EJ analysis, the minority persons are defined as those that are not “non-Hispanic white”. People with two or more races are included in the minority category.
Since seniors over 65 and children under age 10 are more vulnerable in their transportation needs, they are singled out in the data extraction process.
The poverty data is extracted from the 2008-2012 American Community Survey (ACS), which is also available at the Census tract level. The ACS data contains high margins of error (MOE) due to its sampling method and is a lot less reliable at a smaller geography such as census tract.
It should be noted that because of the sampling method and the years the data is collected, the ACS data does not match exactly to the 100% decennial population count data both county wise and tract wise. The percentages were calculated based on the respective data sources.
3.2.2 CORE MPO EJ Populations and EJ Target Areas
The demographic profiles of the Savannah MSA as well as the Environmental Justice thresholds are listed in Tables 3.1 and 3.2 below.
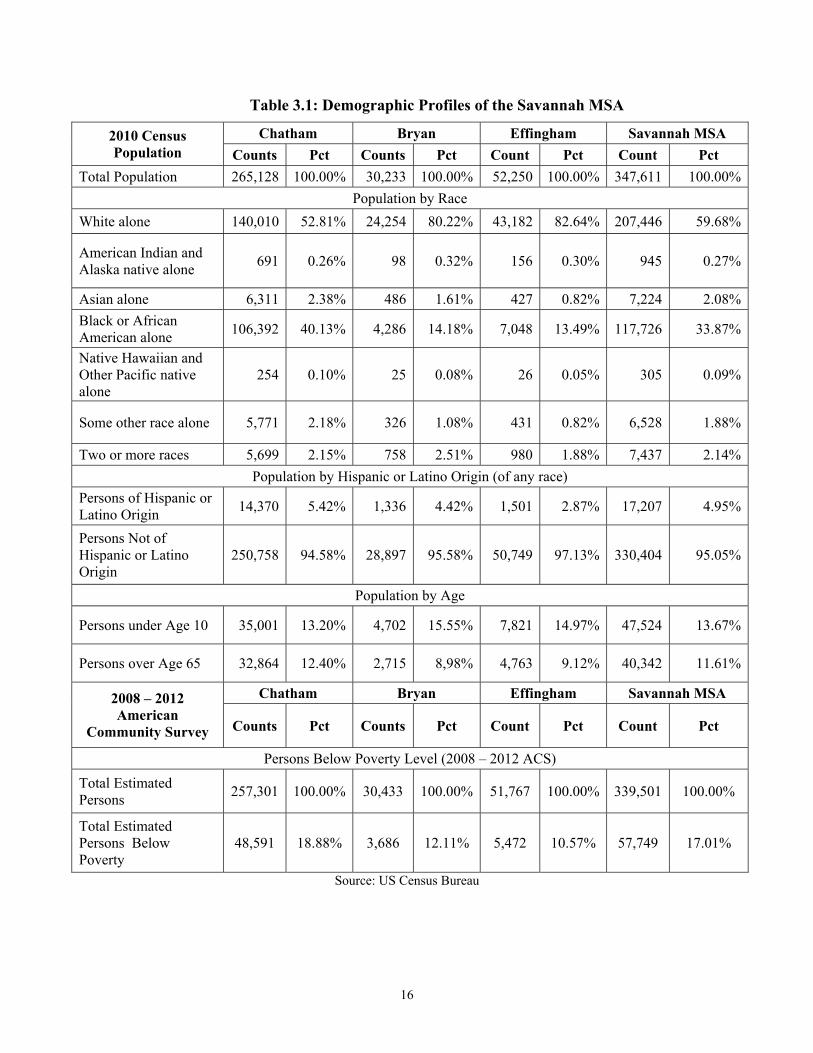
In the Savannah MSA, Chatham County is the population center. It has a more diverse population composition than Bryan and Effingham Counties. The African Americans compose most of the minority populations in the area. There is a much larger African American concentration in Chatham County. Bryan County and Effingham County are dominated by white population. Percentage wise, Bryan County is more diverse than Effingham County in race and ethnicity.
Chatham County is also the employment center of the Savannah MSA. However, it has the highest poverty rate among the three counties. Effingham County has the lowest poverty rate.
Bryan County has the highest concentration of children under Age 10, followed by Effingham County and Chatham County. On the other hand, Chatham County has the highest concentration of seniors over 65 years of age and Bryan County has the lowest concentration of senior citizens.
16
Table 3.1: Demographic Profiles of the Savannah MSA
2010 Census Population
Chatham Bryan Effingham Savannah MSA
Counts Pct Counts Pct Count Pct Count Pct
Total Population 265,128 100.00% 30,233 100.00% 52,250 100.00% 347,611 100.00%
Population by Race
White alone 140,010 52.81% 24,254 80.22% 43,182 82.64% 207,446 59.68%
American Indian and Alaska native alone
691 0.26% 98 0.32% 156 0.30% 945 0.27%
Asian alone 6,311 2.38% 486 1.61% 427 0.82% 7,224 2.08%
Black or African American alone
106,392 40.13% 4,286 14.18% 7,048 13.49% 117,726 33.87%
Native Hawaiian and Other Pacific native alone
254 0.10% 25 0.08% 26 0.05% 305 0.09%
Some other race alone 5,771 2.18% 326 1.08% 431 0.82% 6,528 1.88%
Two or more races 5,699 2.15% 758 2.51% 980 1.88% 7,437 2.14%
Population by Hispanic or Latino Origin (of any race)
Persons of Hispanic or Latino Origin
14,370 5.42% 1,336 4.42% 1,501 2.87% 17,207 4.95%
Persons Not of Hispanic or Latino Origin
250,758 94.58% 28,897 95.58% 50,749 97.13% 330,404 95.05%
Population by Age
Persons under Age 10 35,001 13.20% 4,702 15.55% 7,821 14.97% 47,524 13.67%
Persons over Age 65 32,864 12.40% 2,715 8,98% 4,763 9.12% 40,342 11.61%
2008 – 2012 American
Community Survey
Chatham Bryan Effingham Savannah MSA
Counts Pct Counts Pct Count Pct Count Pct
Persons Below Poverty Level (2008 – 2012 ACS)
Total Estimated Persons
257,301 100.00% 30,433 100.00% 51,767 100.00% 339,501 100.00%
Total Estimated Persons Below Poverty
48,591 18.88% 3,686 12.11% 5,472 10.57% 57,749 17.01%
Source: US Census Bureau

17
Table 3.2: Thresholds of CORE MPO EJ Target Populations
Census Population Chatham Bryan Effingham Savannah MSA Threshold
2010 Total Population 265,128 30,233 52,250 347,611
Not Hispanic or Latino – White Alone
133,492 23,446 42,311 199,249
Minority – All Others 131,636 6,787 9,939 148,362 42.68%
Persons under Age 10 35,001 4,702 7,821 47,524
Persons over Age 65 32,864 2,715 4,763 40,342
Under 10 or Over 65 67,865 7,417 12,584 87,866 25.28%
2008-2012 ACS Total Estimated Persons for Poverty
257,301 30,433 51,767 339,501
2008-2012 Estimated Persons Below Poverty Level
48,591 3,686 5,472 57,749 17.01%
Source: US Census Bureau 2010 Decennial Census and 2012 ACS 5-year Estimates
EJ Thresholds
The minority threshold is updated every 10 year based on decennial census. The low-income/poverty threshold is updated based on the latest ACS data coinciding with the latest decennial census. The threshold is calculated as the average which is derived by dividing the total EJ population of the whole region by the total regional population.
Minority Concentration
The minority concentrated areas were defined as those census tracts with a minority percentage greater than the regional average of 42.68%. In the Savannah MSA, the African Americans compose most of the minority population, followed by Hispanic/Latino and Asian. People of two or more races are also increasing.
The minority concentrated areas are located mostly in Chatham County. Bryan County and Effingham County are more homogenous in race and ethnicity, so their minority concentrations have not reached the threshold. The minority populations are concentrated in the Savannah urban cores except the downtown area, the north side of Ardsley Park, and several neighborhoods just south of DeRenne Avenue. Some other minority concentrated areas include Garden City south of Smith Avenue along SR 21 and SR 25, areas along Veterans Parkway, Hunter Army Airfield, and areas south of Montgomery Cross Road that is along SR 204. Because of the rapid development in the Westside of Chatham County, the minority concentrated areas also expand into Port Wentworth, Pooler and West Savannah along the SR 21 corridor (see Figure 3.1 – EJ Target Populations).

18
Low Income
The low-income areas were defined as those census tracts with persons below poverty level larger than the regional poverty concentration average of 17.01%. Some of these areas are consistent with the minority concentrated census tracts – in the Savannah urban core, in Garden City, and areas around the Savannah Mall and around the US 17/SR 204 interchange area, but there are some differences. Downtown Savannah is identified as a low-income area but not a minority area. This might be due to the concentration of SCAD students in this area. Hunter Army Airfield and the areas along Veterans Parkway are not considered low-income areas even though there is a large minority concentration here. The areas around the City of Richmond Hill in Bryan County and those census tracts north of Fort Steward are identified as low-income areas. In Effingham County, the areas around the City of Guyton are identified as low-income areas (see Figure 3.1 – EJ Target Populations).
EJ Target Areas
The EJ target areas are defined as those census tracts that meet either of the two criteria: 1) minority concentration larger than 42.68%, or 2) Poverty concentration larger than 17.01%. The map is shown in Figure 3.2, EJ Target Areas. The data shows that Chatham County’s majority populations are EJ target populations.
Table 3.3: EJ vs. Non-EJ Populations
Census Population Chatham Bryan Effingham Savannah MSA Pct
2010 Total Population 265,128 30,233 52,250 347,611 100.00%
EJ Populations 182,802 14,878 1,323 199,003 57.25%
Non-EJ Populations 82,326 15,355 50,927 148,608 42.75%
Other Areas
Besides the EJ target areas defined above, CORE MPO delineated the concentrated areas for elderly people over 65 years and children below Age 10. Though these areas are not part of the official EJ areas, their delineation helps CORE MPO and CAT (the Chatham Area Transit Authority – the public transportation provider for the Savannah Urbanized Area) to plan for efficient transportation systems to serve these populations.
Some of the minority areas and poverty concentrated areas also coincide with areas where young children and senior citizens live – in the Savannah urban core and the Hunter Army Airfield area, for example. In other urban centers such as Richmond Hill and Pembroke in Bryan County and the Guyton area in Effingham County, both poverty and age-related populations are concentrated. However, it seems that the age-related population is more widely disbursed. The Island areas and Bloomingdale in Chatham County, as well as the Southwest corner and Springfield in Effingham County all have concentrations of these populations (see Figure 3.1 – EJ Target Areas).
19
2010 Census vs. 2000 Census
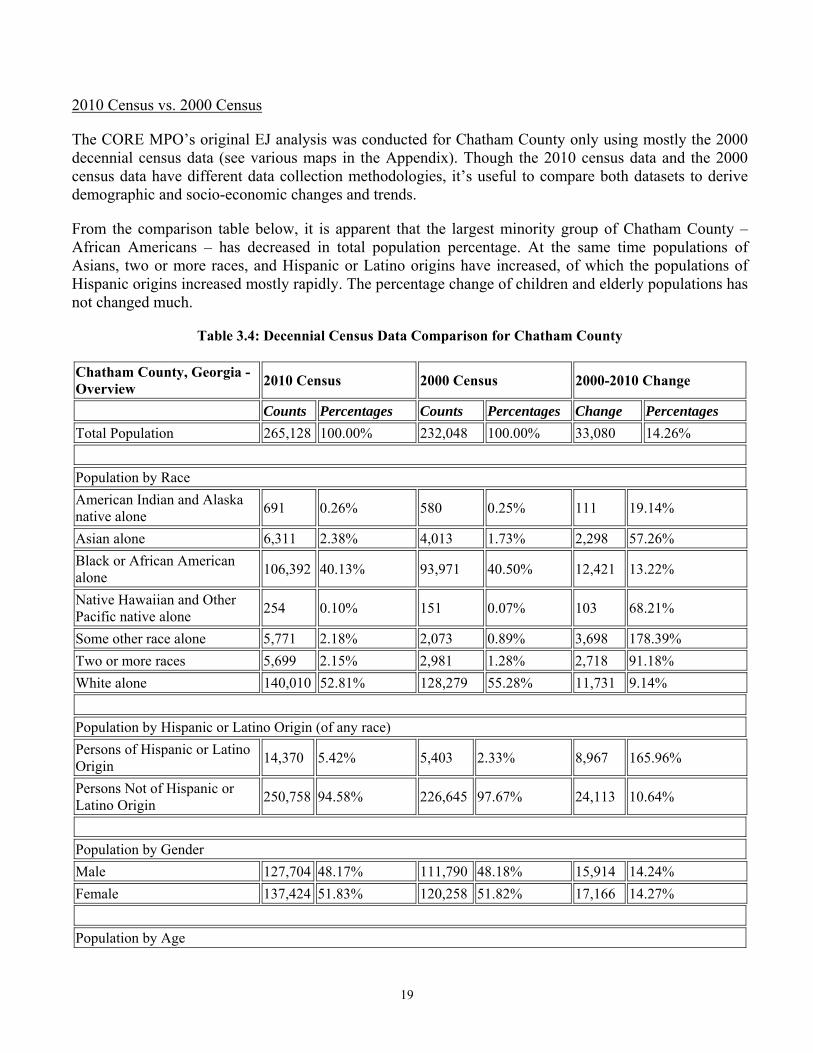
The CORE MPO’s original EJ analysis was conducted for Chatham County only using mostly the 2000 decennial census data (see various maps in the Appendix). Though the 2010 census data and the 2000 census data have different data collection methodologies, it’s useful to compare both datasets to derive demographic and socio-economic changes and trends.
From the comparison table below, it is apparent that the largest minority group of Chatham County – African Americans – has decreased in total population percentage. At the same time populations of Asians, two or more races, and Hispanic or Latino origins have increased, of which the populations of Hispanic origins increased mostly rapidly. The percentage change of children and elderly populations has not changed much.
Table 3.4: Decennial Census Data Comparison for Chatham County
Chatham County, Georgia - Overview
2010 Census 2000 Census 2000-2010 Change
Counts Percentages Counts Percentages Change Percentages
Total Population 265,128 100.00% 232,048 100.00% 33,080 14.26%
Population by Race
American Indian and Alaska native alone
691 0.26% 580 0.25% 111 19.14%
Asian alone 6,311 2.38% 4,013 1.73% 2,298 57.26%
Black or African American alone
106,392 40.13% 93,971 40.50% 12,421 13.22%
Native Hawaiian and Other Pacific native alone
254 0.10% 151 0.07% 103 68.21%
Some other race alone 5,771 2.18% 2,073 0.89% 3,698 178.39%
Two or more races 5,699 2.15% 2,981 1.28% 2,718 91.18%
White alone 140,010 52.81% 128,279 55.28% 11,731 9.14%
Population by Hispanic or Latino Origin (of any race)
Persons of Hispanic or Latino Origin
14,370 5.42% 5,403 2.33% 8,967 165.96%
Persons Not of Hispanic or Latino Origin
250,758 94.58% 226,645 97.67% 24,113 10.64%
Population by Gender
Male 127,704 48.17% 111,790 48.18% 15,914 14.24%
Female 137,424 51.83% 120,258 51.82% 17,166 14.27%
Population by Age

20
Persons 0 to 4 years 18,526 6.99% 15,663 6.75% 2,863 18.28%
Persons 5 to 17 years 41,481 15.65% 42,420 18.28% -939 -2.21%
Persons 18 to 64 years 172,257 64.97% 144,195 62.14% 28,062 19.46%
Persons 65 years and over 32,864 12.40% 29,770 12.83% 3,094 10.39%
3.2.3 CORE MPO EJ Map Production
Several dot density maps were produced to demonstrate the EJ target population distributions. Several thematic maps were also produced to delineate respective EJ target areas. In order to display the comprehensive information, an overall “EJ Target Populations” map (see Figure 3.1) was produced. Another map showing only the minority concentrated areas or poverty concentrated areas is produced to show “EJ Target Areas” (see Figure 3.2). This “EJ Target Areas” map were later overlain with the critical facilities, planned roadway improvement projects, bus routes, bikeway layers and other information for further analysis.

21
Figure 3.1: EJ Target Populations for the Savannah MSA
South Carolina
A t l a n t i c O c e a n
§̈¦16
Chatham
Bryan
Effingham
§̈¦95
§̈¦95
0 5 102.5Miles
±
Environmental Justice Target Populations
EJ Areas
Minority, Low Income and Age
Minority and Low Income
Low Income and Age
Low Income Only
Minority and Age
Minority Only
Age Only
Non EJ Areas

22
Figure 3.2: EJ Target Areas
South Carolina
A t l a n t i c O c e a n
§̈¦16
Chatham
Bryan
Effingham
§̈¦95
§̈¦95
0 5 102.5Miles
±
Environmental Justice Target Areas
Legend
Minority
Low Income

23
3.3 Identification of the Transportation Needs of EJ Target Populations
Identifying the needs of the EJ target populations is an ongoing process. The needs identified below might be expanded and refined in the future.
3.3.1 Typical Transportation Needs of Low Income Populations
The transportation needs of the low-income populations might include the following:
1. There is a lack of a reliable, accessible, affordable, convenient and timely transportation system that can respond to an individual’s full range of daily activities.
Geographical mismatch between the locations of candidate workers and entry-level jobs poses a problem.
Access to employment centers, community activities, family and friends, medial facilities and shopping that are located in the outlying areas continue to be a problem.
Commute by transit to any destination should not be time prohibited. Commuters are reluctant to take transit to a destination that requires a travel time of more than 45 minutes.
Pedestrians are exposed to inclement weather, automobile emissions from high volume traffic, and barriers such as freeways, buildings, and high-speed roads with multiple lanes. Pedestrian facilities should be provided which makes it safe, convenient, continuous and comfortable and eliminate barriers to walking.
Bus stops along roads without sidewalks, the absence of curb cuts on paths leading to bus stops, and platforms that have no means of access from the ground or street level or those that do not have tactical warnings at their edges all pose barriers to riders with mobility limitations.
2. There is a lack of commitment to transportation and public transit by employers and the general public.
Some employers are reluctant to assist in the planning and/or coordination of transportation services.
General public needs to support local sales tax to help low-income people.
3. There is a lack of alternative modes of transportation.
There is a lack of sidewalks in growing and new growth areas and a lack of transportation bikeways in the planning area.
There are barriers to walking and biking that need to be eliminated.
3.3.2 Typical Transportation Needs of Minority Populations
The transportation needs of the minority population with higher income are not easy to be discerned. In the Environmental Justice study it has been identified that analyses must be conducted to ensure that none of the minority communities are disproportionately adversely impacted as a result of federal investments. In addition, all of the minority populations should be actively engaged in the public involvement process. The increase of minority groups (e.g. Hispanic/Latino persons) might mean the

24
increase of Limited-English-Proficient (LEP) speakers that require translation services in the transportation planning process and public transportation services.
3.3.3 Transportation Needs of Other Populations
The transportation needs of people with mobility limitations can be identified through the low-income population’s needs as mentioned above, but accessibility by wheelchairs must be emphasized.
The access to bus stops, schools, community and recreational centers, and safe pedestrian/bike facilities are very important to children.
The wider transportation needs for the elderly people are difficult to define, but appropriate signage (such as large backlit signs that are easy to read) along the roadways, accessibility to hospitals and retail centers, and convenient bus services and pedestrian facilities might help to serve this population.

25
Chapter 4: Correlation of Benefits and Burdens to EJ Target Populations
The ultimate result of the MPO planning process is the Metropolitan Transportation Plan (MTP). The Transportation Improvement Program (TIP) is the subset or short-range programming document of the MTP that has specific funding identified and project scheduled over the next four years. In the CORE MPO Environmental Justice analysis, funding or investments are applied to the set of projects in the MTP and TIP to compare the relative treatment of and the impacts on the target populations and non-target populations in the planning area. This should provide some information on whether or not the transportation investments being made in the region are having disproportionate adverse impacts on the target populations and if the benefits from these investments are equally distributed.
4.1 Identification of Measures
In order to identify whether there are any adverse or disproportionate impacts on the target populations, measures need to be identified. These measures would compare the relative treatment of the target vs. non-target populations and areas in the planning process, and in the MTP and the TIP. They are not intended to measure how the implementers carry out the plan. For the measures to be meaningful and capable of being applied, CORE MPO determined to use the following indicators.
Highway Investments in EJ Target vs. Non-Target Areas Displacement from Highway Projects in EJ Target vs. Non-Target Areas Planned Bikeways in EJ Target vs. Non-Target Areas Public Transit Services in EJ Target vs. Non-Target Areas
4.2 Application of Measures in MTP
The CORE MPO’s Metropolitan Transportation Plan is a multi-modal plan that is based on the socio-economic development of Chatham County and its surrounding areas and is intended to provide efficient transportation services to all the residents in this area. Its multi-modal approach incorporates highway development, transit service, freight movement, bike/pedestrian planning, and other related transportation improvements. The EJ analysis is performed according to all these modes.
The tables below show the funding allocation percentage of these modes in the 2040 MTP and the existing work trip mode shares. It should be noted that the 2040 MTP is being updated for the expanded CORE MPO MPA, so all of the information contained in the following tables is subject to change and will be finalized approaching December 2015.
26
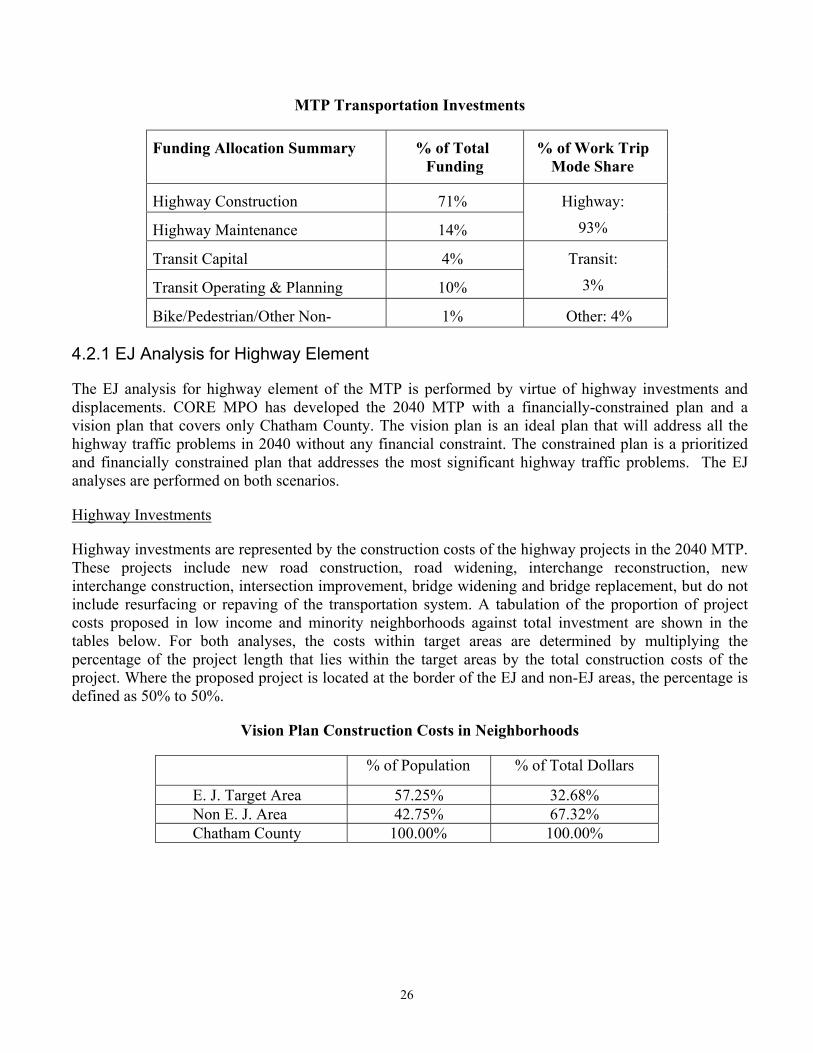
MTP Transportation Investments
Funding Allocation Summary % of Total Funding
% of Work Trip Mode Share
Highway Construction 71% Highway:
93% Highway Maintenance 14%
Transit Capital 4% Transit:
3% Transit Operating & Planning 10%
Bike/Pedestrian/Other Non- 1% Other: 4%
4.2.1 EJ Analysis for Highway Element
The EJ analysis for highway element of the MTP is performed by virtue of highway investments and displacements. CORE MPO has developed the 2040 MTP with a financially-constrained plan and a vision plan that covers only Chatham County. The vision plan is an ideal plan that will address all the highway traffic problems in 2040 without any financial constraint. The constrained plan is a prioritized and financially constrained plan that addresses the most significant highway traffic problems. The EJ analyses are performed on both scenarios.
Highway Investments
Highway investments are represented by the construction costs of the highway projects in the 2040 MTP. These projects include new road construction, road widening, interchange reconstruction, new interchange construction, intersection improvement, bridge widening and bridge replacement, but do not include resurfacing or repaving of the transportation system. A tabulation of the proportion of project costs proposed in low income and minority neighborhoods against total investment are shown in the tables below. For both analyses, the costs within target areas are determined by multiplying the percentage of the project length that lies within the target areas by the total construction costs of the project. Where the proposed project is located at the border of the EJ and non-EJ areas, the percentage is defined as 50% to 50%.
Vision Plan Construction Costs in Neighborhoods
% of Population % of Total Dollars
E. J. Target Area 57.25% 32.68% Non E. J. Area 42.75% 67.32% Chatham County 100.00% 100.00%

27
Constrained Plan Construction Costs in Neighborhoods
% of Population % of Total Dollars
E. J. Target Area 57.25% 39.63% Non E. J. Area 42.75% 60.37% Chatham County 100.00% 100.00%
Amenity Corridors
Highway Investments also include protection of the amenities corridors which consist of canopied roadways, palm-lined causeways, historic road segments, scenic vistas, gateways to the communities, etc. These roadways are targeted for preservation and should not be impacted by widening or new project construction. The most typical of amenities in the Savannah area are canopy roadways and historic roadway segments. Gateways to the communities are also important to travelers. The table below lists the percentage of these amenities in the EJ/Non-EJ areas.
Amenity Corridor Length in Neighborhoods
% of Total Population
% of Total Canopy Road
Miles
% of Total Historic Road
Miles
% of Total Gateway to Community
Miles E. J. Target Area 57.25% 57.63% 54.72% 56.41% Non E. J. Area 42.75% 42.37% 45.28% 43.59% Chatham County 100.00% 100.00% 100.00% 100.00%
Highway Displacements
Highway projects can have adverse impacts on the quality of life within the EJ target and non-target areas. One measure of negative impact on an area is the amount of real estate actions that are imposed upon the area, referred to as right-of-way acquisition. The following tables list the percentages of right-of-way costs in the EJ target and non-target areas. It should be noted that:
1. The costs within target areas are determined by multiplying the percentage of the project length that lies within the target areas by the total right-of-way costs of the project. Where the proposed project is located at the border of the EJ and non-EJ areas, the percentage is defined as 50% to 50%.
2. Right-of-way costs include both acquisition costs for residential areas and commercial areas.
Aspiration Plan Right-of-Way Costs in Neighborhoods
% of Population % of Total Dollars
E. J. Target Area 57.25% 25.52% Non E. J. Area 42.75% 74.48% Chatham County 100.00% 100.00%

28
Constrained Plan Right-of-Way Costs in Neighborhoods
% of Population % of Total Dollars
E. J. Target Area 57.25% 34.86% Non E. J. Area 42.75% 65.14% Chatham County 100.00% 100.00%
4.2.2 EJ Analysis for Transit Element
Since the low-income populations and some of the minority populations don’t have access to motor vehicles, the transit system provides the means for these EJ populations to get to their employment centers, to do shopping, and to travel to other destinations. The transit system also provides transportation for children to go to school, for the elderly to go to the medical facilities, and for people with mobility limitations to reach their destinations.
The transit system in the Savannah area is managed by the Chatham Area Transit Authority (CAT) and is divided into various parts: fixed route bus service, shuttle bus and van pool service, Teleride service, water ferry service and accessible taxi service.
Fixed Route Bus Service
The CAT service area includes the City of Savannah, part of Garden City, and the unincorporated Chatham County between them. CAT is working on expanding its service area into other municipalities within Chatham County, especially on the Westside where a lot of entry-level jobs are located. The table below shows the information on fixed bus route coverage and bus stops within EJ and non-EJ areas. It should be noted that many bus routes overlap with one another, but the calculation below only counts the road segments once. If individual routes and headways are considered in the analysis, the percentages of bus service in the EJ areas are much larger.
Fixed Bus Route Coverage in Neighborhoods
% of Total Population % of Total Bus Route Mileage
% of Total Bus Stops
E. J. Target Area 57.25% 58.21% 67.39% Non E. J. Area 42.75% 41.79% 32.61% Chatham County 100.00% 100.00% 100.00%
Shuttle Bus and Van Pool Service
Besides the fixed route bus service, CAT provides free shuttle service in the historic downtown area – also an EJ target area. This service provides a means of affordable transportation to the low-income populations as well as visitors in Downtown Savannah and serves as connectors or transfer stations to the fixed route bus services.
In addition, the vanpool program serves those employment sites not currently served by CAT’s fixed route bus service. It provides flexible service within all of Chatham County and regionally to adjacent
29
Georgia and South Carolina counties. There are three (3) vans to provide the services, each with a capacity of 15 passengers and with 5 trips per day.
Teleride Service
The CAT Teleride transportation system is a door-to-door transportation service and serves eligible disabled persons in Chatham County that include persons who are unable, due to a permanent or temporary physical or mental disability to use the fixed-route public transportation system. The service area is the ¾ mile buffer zone of the fixed transit routes.
Through the New Freedom program implemented under SAFETEA-LU (Safe, Accountable, Flexible, Efficient Transportation Equity Act – a Legacy for Users), CAT was able to purchase several accessible taxi vehicles to complement the Teleride service. CAT contracted with a local taxi company and started implementation of the CAT Freedom program in 2011. Half of the fares can be reimbursed through the New Freedom grant funds.
Water Ferry Service
The Savannah Belles Ferry Service provides water transportation from Savannah’s Historic Downtown District (an EJ target area) to Hutchinson Island. The service is provided by three ferry boats daily with 30-minute headways and each with a capacity of eighty-five (85) passengers. The ferries take people (including the low-income and minority populations) to Hutchison Island to work and get them back at the end of the day. The EJ populations and others can utilize the transit services via various bus routes within the county to reach downtown, and then they can take advantage of the water ferry service.
4.2.3 EJ Analysis for Bike/Pedestrian Element
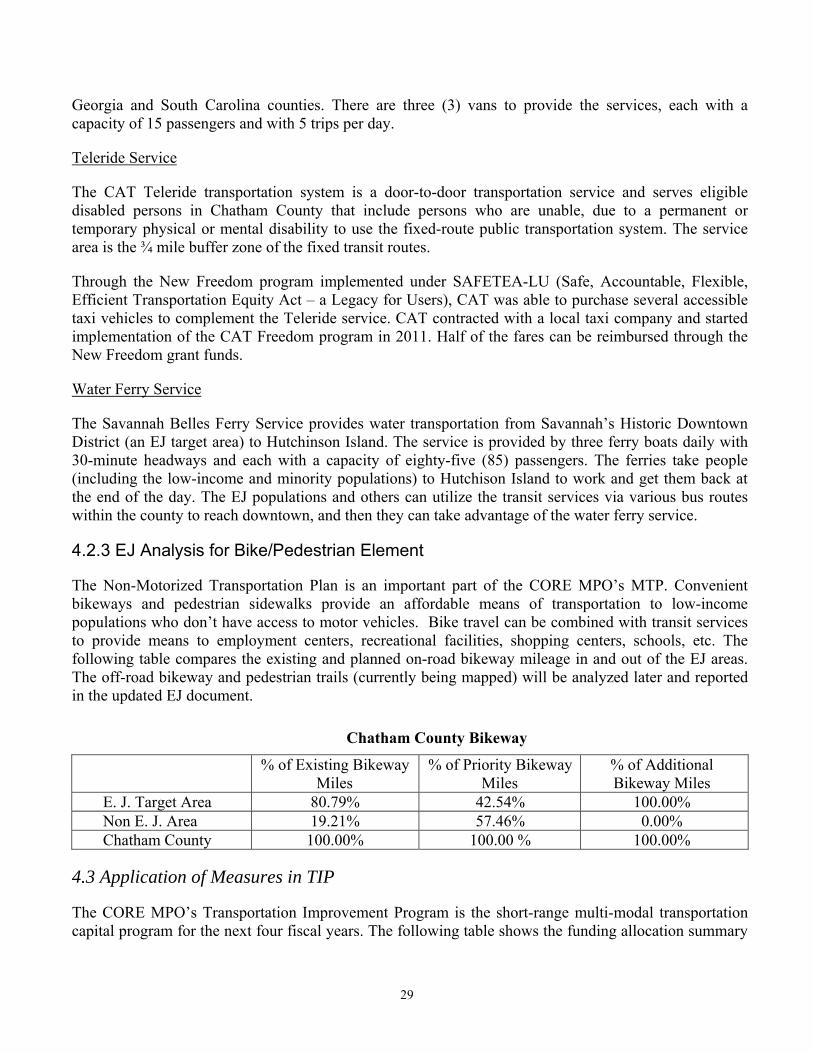
The Non-Motorized Transportation Plan is an important part of the CORE MPO’s MTP. Convenient bikeways and pedestrian sidewalks provide an affordable means of transportation to low-income populations who don’t have access to motor vehicles. Bike travel can be combined with transit services to provide means to employment centers, recreational facilities, shopping centers, schools, etc. The following table compares the existing and planned on-road bikeway mileage in and out of the EJ areas. The off-road bikeway and pedestrian trails (currently being mapped) will be analyzed later and reported in the updated EJ document.
Chatham County Bikeway
% of Existing Bikeway Miles
% of Priority Bikeway Miles
% of Additional Bikeway Miles
E. J. Target Area 80.79% 42.54% 100.00% Non E. J. Area 19.21% 57.46% 0.00% Chatham County 100.00% 100.00 % 100.00%
4.3 Application of Measures in TIP
The CORE MPO’s Transportation Improvement Program is the short-range multi-modal transportation capital program for the next four fiscal years. The following table shows the funding allocation summary

30
of the projects in the FY 2015-2018 TIP. The projects used for the analysis do not include the lump sum categories. Those lump sum funds are used countywide with a majority in the EJ area (safety, signal, etc.). The EJ analysis for the TIP will be conducted with each TIP development cycle.
Transportation Improvement Program
% of Population % of Total Dollars
E. J. Target Area Other 57.25% 37.66%
E. J. Target Area Transit Non E. J. Area Other
42.75% 62.33% Non E. J. Area Transit Chatham County 100.00% 100.00%
4.4Findings and Conclusions
In the CORE MPO’s endeavors to address the Environmental Justice in the Savannah area, there are some findings derived from the analysis performed above. For the Metropolitan Transportation Plan, different modes are addressed below.
1. The highway system shows proportionate benefits and impacts in and out of the EJ areas.
For the highway system, construction costs and displacement costs are approximately proportionate to each other within the EJ target areas (around 1/3 of their respective total cost). This makes a lot of sense considering that the EJ target areas are located in the Savannah urban core and that there are many limitations for new development or system expansion. In this area the preservation of the existing system weighs more heavily than in the non-target areas. This can be particularly reflected in the amenity program in which the historic roadway segments, canopy roads and community gateway areas will all receive proportionate investments for protection as well as management as the population composition in the EJ area.
To improve highway traffic flow in the EJ areas, management strategies (signal coordination and synchronization, etc.) and high-tech investments such as ITS measures will be applied. Moreover, a large percentage of the highway maintenance money will be invested in the EJ area.
2. The transit system caters to the transportation needs of the EJ populations and receives more funding than its mode share percentage.
Overall, the transit system gets 14% of the total MTP funding while its existing work trip mode share is only 3%. Since the majority of the transit system users are EJ target populations, the study results show that the MTP transit system doesn’t have EJ concerns and that the transit services are overall proficient to serve the EJ target populations.
The fixed route bus service not only provides a means of public transportation to the target minority and low-income populations, but also serves school children and the mobility limited populations. At least fifty-two (52) schools are located on the bus lines and all the buses are low-floor and accessible to wheelchairs. In addition, the bus routes are located within walking distance of major universities, entertainment centers and theaters, major government buildings and facilities, hospitals and nursing

31
homes, hotels, post offices, libraries, shopping centers, subdivisions and apartments, and various points of interest. In the EJ target areas, the bus routes are more interconnected and headways are shorter than non-EJ areas, which makes transfer a lot easier. Besides, the bus routes extend outward to various destinations as listed above and provide an affordable means of transportation to the EJ populations who need to go back and forth between EJ and non-EJ areas. The bus service plays the role of multi-modal connector as well since all the buses have racks for bicycles.
The free shuttle service in the historic downtown enhances the transferability of the fixed route bus system and makes the bus headways in this area shorter.
The vanpool service and water ferry service provide additional conveniences for all of the EJ populations to commute between home and work regardless whether these destinations are within or outside the EJ areas.
The Teleride service and the CAT Freedom taxi service cater to the people with mobility limitations, who are considered expanded EJ target populations.
3. The other modes help to satisfy the transportation needs of EJ populations.
The planned bikeway system in Chatham County is designed to provide a convenient transportation means to the EJ and non-EJ populations. The bike travel can be combined with the transit services to satisfy transportation needs of the EJ populations.
The existing and additional bikeways in Chatham County are mostly located within the EJ target areas. The planned on-road priority bikeway corridors connect the EJ area to the outlying areas. Overall, there are no disproportionate burdens to the minority and low-income populations in the EJ target areas.
The federal law requires that any new road construction or widening project will incorporate bike lanes and sidewalks. It is also one of the objectives of the CORE MPO’s plans and programs. Sidewalks will be a part of the roadway design where appropriate.

32
Chapter 5: Discussion of Possible Mitigation Strategies
Though there are no apparent EJ problems in the Savannah area, no plan or service is perfect. There are some strategies that need to be explored to address the transportation needs in the Savannah area and certain actions would be taken to provide better services to the EJ target populations.
5.1 Possible Mitigation Strategies
There are various strategies to move traffic more efficiently, be it highway, transit, or other modes. With regards to Environmental Justice, generally there are four mitigation strategies, including avoidance of projects, minimize the impacts, mitigation strategies for unavoidable impacts, and offsetting enhancements. In the CORE MPO planning area, these strategies are all explored.
The CORE MPO EJ area is located mostly in the Savannah urban core that has a lot of limitations for further development. There is a large concentration of identified historic roadways and canopied roadways. The residents of these areas would like to keep the neighborhoods intact and preserved, thus some projects are not included in the plan to preserve the natural and cultural resources.
For some areas that a highway project is inevitable, efforts will be made to minimize the impacts, such as retrofitting a project to include desired landscaping that is consistent with the neighboring areas. The CORE MPO amenities program addresses these issues directly. In addition, traffic management and ITS strategies would be applied more in the EJ target areas due to its development limitations.
Development of efficient multi-modal programs is another mitigation strategy. Though the transit and bikeway travel in the CORE MPO planning area are sufficient to provide fair amount of transportation to the EJ populations, improvements can still be made.
CORE MPO also included a discussion about overall EJ mitigation in the MTP.
There are three fundamental principles of Environmental Justice. These principles include the avoidance of unusually high adverse health, social and economic impacts on minority and low-income populations; the inclusion of all potentially affected communities in the decision making process; and to prevent the denial of benefits by minority and low income communities and populations.
MPOs can mitigate the adverse affects of projects on Environmental Justice communities in a variety of ways, including the utilization of advanced analytical capabilities to ensure compliance; the early identification of impacts on low income and minority populations and to ensure the fair distribution of both the burdens and the benefits associated with transportation investments; and to have an inclusive and active public participation process that does not provide barriers to participation by minority and low income populations in the decision making process.
5.2 Actions Taken
In order to provide better transportation services to the EJ populations in the CORE MPO planning area, some actions have been taken.

33
CORE MPO has made many efforts to initiate the roadway amenities program. So far the City of Savannah, Chatham County, and the Metropolitan Planning Commission all passed the resolution to dedicate staff and funding for this program. Various roadways for protection have been identified and mapped resulting from coordination from all concerned parties, and funding is being pursued to implement the program. The MPO has developed a Context Sensitive Design Manual for reference by the implementation agencies. The MPO staff and the MPC staff have worked cooperatively in developing the Unified Zoning Ordinance (UZO) to make sure that the amenity corridors are protected in the legal document.
CORE MPO has made a great effort to engage the target populations in all plans and programs and the transportation planning process.
CORE MPO has identified and ranked all the on-road bikeways and will assist in implementing the plan as funds become available.
CORE MPO has made it a policy and passed a resolution to provide sidewalks and curb cuts as appropriate.
CAT has replaced all the old buses with the low-floor fleet that are accessible to wheelchairs and has improved the Teleride reservation and complaint system.
CAT has purchased three water ferryboats to move people to and from Hutchinson Island.
CAT has expanded the fixed-route bus service to the outlying employment centers where a lot of entry-level jobs are located. The agency is working diligently to analyze the transportation needs and to design the most efficient bus routes.
CAT has installed wheelchair accessible bus shelters to protect the passengers who are waiting for the transit service in many bus stops. Funding is being pursued and programmed to install more bus shelters and other transit amenities.

34
Chapter 6: Public Participation Activities
Recognizing the importance of involving the public in planning for the future of this region, CORE MPO developed a Participation Plan (PP), a Limited English Proficiency (LEP) Plan, and the Coordinated Public Transit – Human Serviced Transportation Plan (HST), providing the opportunity for the community to play an integral part in the transportation planning process. The CORE MPO’s Advisory Committee on Accessible Transportation (ACAT) also provides input on the MPO’s planning process and the CAT Teleride Handbook development/update. These plans provide guidance to the CORE MPO’s and CAT’s participation process and outline specific procedures for the public to participate in, to review, and to comment upon the formulation of transportation plans, policies, projects and proposed changes.
6.1 Participation Selection
The efforts to obtain meaningful public input for EJ consists of two parts: through appropriate committee participation, and through resident participation.
Committee Participation
The CORE MPO’s Citizens Advisory Committee (CAC) is representative of all cross-section of the community and functions as a public information and involvement committee. The CAC is entrusted with informing the CORE MPO Board of the community’s perspective while providing information to the community about transportation policies and issues.
The Advisory Committee on Accessible Transportation (ACAT) serves as the forum for cooperative decision-making with regard to accessible transportation related issues in the Savannah area. ACAT acts as a liaison between the transportation planning process and the traditionally underserved communities, including those communities with high concentrations of minority, low-income, disabled and elderly populations. ACAT ensures that the transportation planning process is current and responsive to all applicable laws, rules, and regulations, including the EJ related laws and regulations.
The Technical Coordinating Committee (TCC) and the Economic Development and Freight Advisory Committee (EDFAC) will be distributed the draft Title VI program document (including EJ report) for review, comment and discussion before they endorse the program.
The CORE MPO Board will have the final adoption of the Title VI program (including EJ report) by signing a supporting resolution.
All of the CORE MPO plans and programs go through these committees for review and comment before they can be adopted by the CORE MPO Board.
Resident Participation
Besides the committees that represent various populations and communities in the Savannah area, CORE MPO makes efforts to involve all the transportation system users (motorists, transit riders, bicyclists, pedestrians, etc.) in the public involvement process. CORE MPO has made a particular effort to include

35
the EJ target populations in the MTP development process, including minorities, low-income persons, disabled people, elderly populations, child advocates or school personnel, and LEP persons.
6.2 Outreach Methods
CORE MPO involves the advisory committees in each step of the development and update of the Metropolitan Transportation Plan, the Transportation Improvement Program, the Congestion Management Process, the Unified Planning Work Program, as well as the other special studies and projects. The project development status reports and related materials are emailed to the committee members for review and posted at the MPO website before the committee meetings. Then the CORE MPO staff presents the information to the committees at their respective meetings, invite comments and answer questions. All of the comments from the committees are then investigated in the plan development process and finally incorporated into the plan.
The public involvement of the Savannah area residents includes sending the draft plans and programs to all the review agencies and libraries, advertising the public meeting notices on newspapers and magazines and TV/radio stations, sending invitations to all the neighborhood associations (including the EJ population concentrated neighborhoods), advertising the meeting notices on the MPC/CORE MPO websites and community calendars, etc.
The public involvement of the EJ populations include advertising public meeting notices to the minority-owned newspapers and magazines as well as radio stations serving these populations, advertising the meetings in the churches located in the target areas, advertising the meetings on buses and Teleride vehicles, holding the public meetings in the EJ target areas where it’s accessible to all the people, etc. CORE MPO has also translated some vital documents to Spanish and Chinese to help LEP persons (segments of the minority groups) to understand the MPO’s planning process. CAT has translated its bus route brochures into Spanish to assist the transit users with English Proficiency limitations.
CORE MPO staff has made a lot of efforts to attend neighborhood association meetings after work and assisted in preparing mapping and statistical information to facilitate these meetings.
6.3 Public Outreach Contacts
The CORE MPO’s public outreach contacts include the news media, neighborhood associations, people who have come to the CORE MPO public meetings before, people who have sent comments to CORE MPO before about their transportation needs, as well as stakeholders identified through the development of a special study.
6.4 Information Presentation Methods
Besides giving formal presentations with visualization tools (pictures, maps, videos, etc.), CORE MPO staff members prepare information boards with maps and descriptions, take questions on the floor, and have face-to-face conversations with the participants at or after the public meetings. Staff also distributes comment sheets to the participants so that they can either write down their comments right at the meetings or bring back to their neighborhoods for distribution.

36
For the MTP development, CORE MPO has organized all of the received comments in a database, categorized them, and responded appropriately. Where CORE MPO felt that the issues raised are beyond the CORE MPO responsibilities, these questions and comments were forwarded to the appropriate agencies that are responsible for the projects or programs.
CORE MPO will utilize written translation or verbal interpretation services per the LEP plan where funding allows and where LEP persons are involved.
6.5 Discussion of Issues Raised Regarding EJ
CORE MPO has developed a Title VI / Nondiscrimination Complaint form to handle Civil Rights complaints that rise from the MPO’s transportation planning process. After a complaint is received, CORE MPO will follow through the process, including identifying problems and resolving them.

37
Chapter 7: Overall EJ Findings, Conclusions, and Recommendations
The Coastal Region Metropolitan Planning Organization (CORE MPO) goes through a federal certification review every four years. FHWA/FTA issued the following statement regarding the CORE MPO’s environmental justice process in the 2009 certification report.
Review Team Findings
The CORE MPO strives to include all segments of the population during the transportation planning process. Toward this goal, the MPO provides opportunities for public participation and access to information by minority and low‐income communities. All MPO meetings are accessible by transit. The ACAT committee is a standing committee of the MPO that provides the nexus between transportation planning and those populations that are traditionally underserved. Additionally, the CORE completed a detailed Environmental Justice (EJ) analysis for the MPO area. This report identified low‐income and minority populations who may be impacted by the transportation planning process through a burdens and benefit analysis. The CORE MPO summarized the EJ analysis in tabular form and digital maps.
Notable Strength
The MPO is commended for producing a detailed in‐house analysis of Environmental Justice areas in Chatham County.
Recommendation
The MPO process for handling Title VI complaints needs to be developed and clearly documented.
MPO Follow Up Actions
CORE MPO developed a process for handling Title VI complaints and a Limited English Proficiency (LEP) Plan after the 2009 federal certification review. These documents are a part of the Title VI program that is related to the Environmental Justice program.
The 2013 federal certification review did not make any specific recommendations regarding the CORE MPO’s Environmental Justice program.

38
Chapter 8: EJ Document Maintenance and Update
The Coastal Region Metropolitan Planning Organization (CORE MPO) maintains the EJ document and updates it when new information becomes available. The following lists some of the efforts that the MPO has undertaken or is in the process of carrying out.
With the release of the 2010 census data, the MPO compared the maps and statistics between the censuses to determine the EJ focus area change in Chatham County.
The MPO updated its Metropolitan Planning Area (MPA) boundary in 2015, and the staff then updated the EJ maps and statistics that reflect the multi-county boundary.
The MPO is updating the 2040 MTP to reflect the new MPA. EJ analysis will be performed on the updated plan when data is available. The MPO’s public involvement will target any new EJ areas (if any) to make sure all the residents in the Savannah area will have an opportunity to participate in the CORE MPO planning process.
The MPO strives to make the EJ document, the LEP Plan and the Participation Plan an integral part of the public participation process. The MPO strives to make sure that no EJ populations will be negatively impacted by the MPO’s plans and programs.

39
Appendix: Historic EJ Related Maps
The Coastal Region Metropolitan Planning Organization (CORE MPO) has utilized a series of maps besides the EJ delineation map included in the EJ document to facilitate the EJ analysis, human services – public transportation needs analysis and LEP analysis. The following lists some of the example maps that have been created in the past.

40

41

42

43

44

45

46

47
Black Population 2000 - FHWA HEPGIS Maps
Black Population 2010 - FHWA HEPGIS Maps
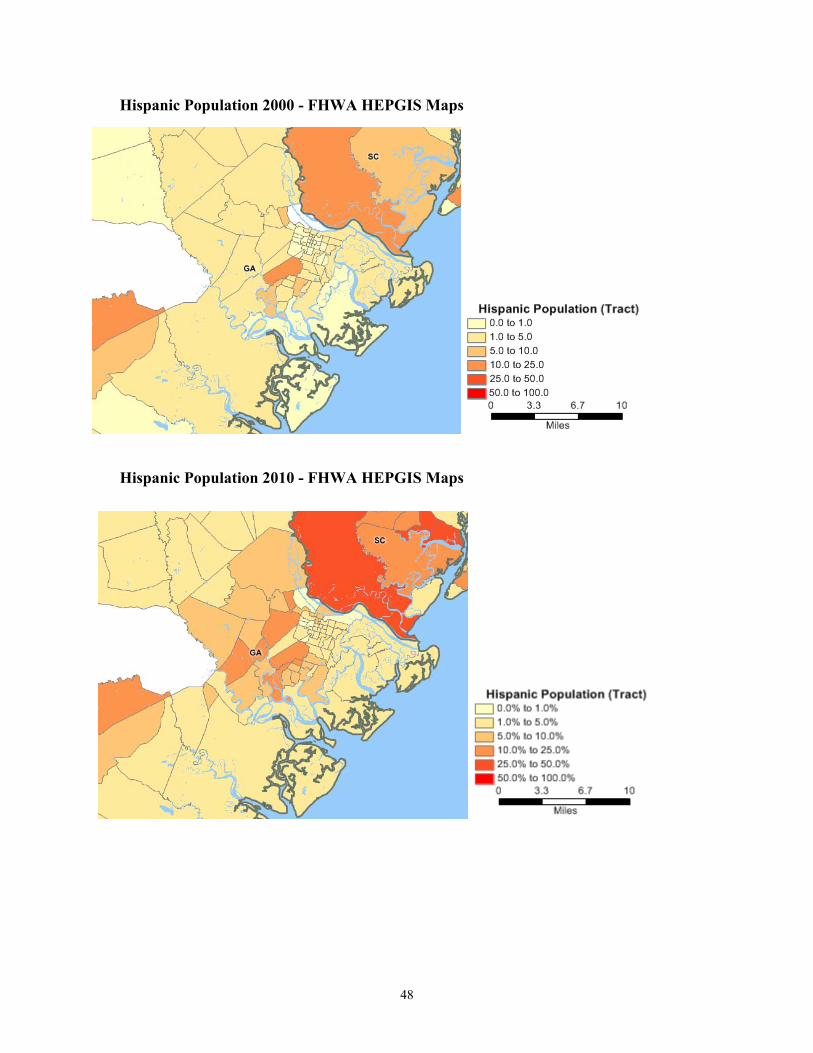
48
Hispanic Population 2000 - FHWA HEPGIS Maps
Hispanic Population 2010 - FHWA HEPGIS Maps