ENVIRONMENTAL AND HEALTH IMPACT FROM MODERN CARS
114
Publication 2002:62 ENVIRONMENTAL AND HEALTH IMPACT FROM MODERN CARS A comparsion between two petrol and two diesel cars with varying emission control technology
Transcript of ENVIRONMENTAL AND HEALTH IMPACT FROM MODERN CARS
Publication 2002:62
ENVIRONMENTAL AND HEALTHIMPACT FROM MODERN CARS
A comparsion between two petrol andtwo diesel cars with varying emission
control technology
Titel: Environmental and Health Impact from Modern Cars
Keywords: petrol, diesel, cars, emissions, particles, VOC, air pollution, fossil fuels, NOx, particle filter
Author: Peter Ahlvik Ecotraffic R&D3 AB
Contact persons: Pär Gustafsson and Olle Hådell, Swedish National Road Administration, Vehicle Standards Division
Publikation number: 2002: 62
ISSN: 1401-9612
Printed: May 2002
Edition: 150 copies. Also available for downloading at http://www.vv.se/publ_blank/bokhylla/miljo/lista.htm
Distributor: SNRA, Head Office, SE-781 87 Borlänge, phone +46 243-755 00,
fax +46 243 755 50, e-mail: [email protected]
Modern petrol and diesel cars
Ecotraffic ERD3 AB
Peter Ahlvik
May 2002
ENVIRONMENTAL AND HEALTHIMPACT FROM MODERN CARS
A comparison between two petrol andtwo diesel cars with varying emission
control technology
A report for theSwedish National Road Administration
Modern petrol and diesel cars
Ecotraffic ERD3 AB May 2002
PREFACEThe transport sector contributes significantly to the air pollution and particularly influencesthe local air quality. Beside the question of air quality, the consumption of fossil fuels inthe transport sector and the CO2-emissions from this use is an issue of increasing impor-tance.
For a long period of time, the emissions from light-duty vehicles have been in focus and alot of measures have been taken to reduce the emissions from these vehicles.
The market penetration for light duty diesel cars has been increasing in the most markets inEurope and is now over 30 % (2001). In Sweden, however, the market share for diesel carshas decreased the last three years and is now slightly above 5 %.
The issue of whether petrol or diesel fuel should be used as fuel in passenger cars has beenlively debated during the last years, particularly in Sweden. Especially the particle emis-sions from diesel cars have been in focus. This study is an attempt to contribute with somemore facts to the subject.
The study presented in this report is built on new investigations of two petrol and two die-sel cars with varying emission control strategies. Tests have been carried out both in theEuropean driving cycle and in other driving cycles. Beside the regulated substances, analy-sis has been made on unregulated substances as well. The data has also been comparedwith data from earlier studies.
The report has been written by Peter Ahlvik, Ecotraffic ERD3 AB. The author is liable tothe results and the assessments in the report.
Borlänge, May 2002
Swedish National Road Administration, Vehicle Standards Division
Modern petrol and diesel cars
Ecotraffic ERD3 AB May 2002
i
TABLE OF CONTENTS Page
SAMMANFATTNING (SWEDISH SUMMARY)
EXECUTIVE SUMMARY
1 INTRODUCTION ...................................................................................................... 1
2 BACKGROUND......................................................................................................... 3
3 METHODOLOGY..................................................................................................... 53.1 Literature survey ................................................................................................... 53.2 Selection of vehicle technology ............................................................................. 5
3.2.1 Conventional three-way catalyst (TWC) .................................................................. 53.2.2 Direct injection of petrol (SIDI)................................................................................. 63.2.3 Direct injection of diesel (CIDI)................................................................................. 73.2.4 Direct injection of diesel (CIDI) with a particulate trap ......................................... 8
3.3 Experimental .......................................................................................................... 93.3.1 Test facilities................................................................................................................ 93.3.2 Vehicles ...................................................................................................................... 103.3.3 Fuels ........................................................................................................................... 143.3.4 Test matrix................................................................................................................. 143.3.5 Emission measurement............................................................................................. 153.3.6 Driving cycles ............................................................................................................ 18
3.4 Calculation of effects ........................................................................................... 203.4.1 Lifecycle perspective................................................................................................. 213.4.2 Respiratory diseases − acute .................................................................................... 213.4.3 Respiratory diseases − cancer risk .......................................................................... 233.4.4 Regional effects ......................................................................................................... 243.4.5 Global effects ............................................................................................................. 24
4 RESULTS.................................................................................................................. 264.1 Regulated emissions............................................................................................. 26
4.1.1 Emission comparison................................................................................................ 264.1.2 Structure of figures................................................................................................... 294.1.3 CO emissions ............................................................................................................. 294.1.4 HC emissions ............................................................................................................. 314.1.5 NOX emissions ........................................................................................................... 334.1.6 Particulate emissions ................................................................................................ 354.1.7 CO2 emissions and fuel consumption ...................................................................... 404.1.8 Complementary results from overtaking................................................................ 42
4.2 Unregulated emissions......................................................................................... 434.2.1 Nitrogen containing compounds.............................................................................. 434.2.2 Light aromatics ......................................................................................................... 444.2.3 Aldehydes................................................................................................................... 464.2.4 Alkenes....................................................................................................................... 474.2.5 Polycyclic aromatic compounds (PAC)................................................................... 494.2.6 Acrylamide ................................................................................................................ 524.2.7 Particle number and particle size distribution....................................................... 53
4.3 Impact on environment and health .................................................................... 694.3.1 Local effects, acute respiratory diseases ................................................................. 70

Modern petrol and diesel cars
Ecotraffic ERD3 AB May 2002
ii
4.3.2 Local effects, cancer risk .......................................................................................... 734.3.3 Regional effects ......................................................................................................... 754.3.4 Global effects ............................................................................................................. 77
5 DISCUSSION AND CONCLUSIONS.................................................................... 80
6 ACKNOWLEDGEMENTS..................................................................................... 83
7 REFERENCES ......................................................................................................... 84
LIST OF TABLES PageTable 1: Vehicle specifications----------------------------------------------------------------13Table 2: Measurement methods for emissions ----------------------------------------------16Table 3. PAC analysed-------------------------------------------------------------------------17Table 4. Reactivity adjustment factor (RAF)------------------------------------------------22Table 5. Unit risk factors for cancer (*10-6) ------------------------------------------------23Table 6. Global warming potential (relative to CO2) --------------------------------------25Table 7. Comparison of emissions with certification data (VCA) ------------------------26Table 8. Corrections for some of the alkenes -----------------------------------------------48Table 9. Emissions of acrylamide ------------------------------------------------------------53
LIST OF FIGURES PageFigure 1. Testing of the Peugeot HDi in the emission test cell at MTC (courtesy of
MTC)-----------------------------------------------------------------------------------10Figure 2. Schematic illustration of overtaking-----------------------------------------------20Figure 3. Comparison of emissions with a Honda ULEV ----------------------------------27Figure 4. Emission deterioration for the Honda ULEV-------------------------------------28Figure 5. CO emissions in NEDC at +22°C and –7°C -------------------------------------29Figure 6. CO emissions in US06 and during overtaking -----------------------------------30Figure 7. HC emissions in NEDC at +22°C and –7°C -------------------------------------31Figure 8. HC emissions in US06 and during overtaking -----------------------------------32Figure 9. NOX emissions in NEDC at +22°C and –7°C ------------------------------------33Figure 10. Comparison of emissions at +22°C and at –7°C (source: Audi, MTZ
[37]) -----------------------------------------------------------------------------------34Figure 11. NOX emissions in US06 and during overtaking -----------------------------------35Figure 12. Particulate emissions in NEDC at +22°C and –7°C -----------------------------36Figure 13. Particulate emissions in US06 ------------------------------------------------------37Figure 14. Particulate emissions from petrol cars with TWC --------------------------------39Figure 15. Particulate emissions from a direct injection petrol car in two studies--------39Figure 16. CO2 emissions -------------------------------------------------------------------------40Figure 17. Fuel consumption ---------------------------------------------------------------------41Figure 18. Vehicle speed traces during overtaking --------------------------------------------42Figure 19. Vehicle distance driven during overtaking ----------------------------------------43Figure 20. N2O emissions -------------------------------------------------------------------------44Figure 21. Emissions of ammonia (NH3)--------------------------------------------------------45Figure 22. Benzene emissions --------------------------------------------------------------------45Figure 23. Aldehyde emissions -------------------------------------------------------------------46

Modern petrol and diesel cars
Ecotraffic ERD3 AB May 2002
iii
Figure 24. 1,3-butadiene emissions (corrected and uncorrected) at +22°C ---------------47Figure 25. Emissions of alkenes at +22°C------------------------------------------------------48Figure 26. Emissions of alkenes at -7°C --------------------------------------------------------49Figure 27. Emissions of polycyclic aromatic compounds (PAC) at +22°C and –7°C ----50Figure 28. Emissions of polycyclic aromatic compounds (PAC) at +7°C ------------------51Figure 29. PAC emissions at various temperatures for two petrol cars and one
diesel car ------------------------------------------------------------------------------52Figure 30. Total particle number emissions in the NEDC cycle -----------------------------54Figure 31. Total particle number emissions in the US06 and overtaking tests ------------55Figure 32. Real time particle number (#/s) traces in NEDC at +22°C, Peugeot ----------56Figure 33. Real time particle number (#/s) traces in NEDC at +22°C, VW Golf----------57Figure 34. Real time particle number (#/s) traces in US06, all cars ------------------------58Figure 35. Real time particle number (#/s) traces during overtaking -----------------------58Figure 36. Particle size distribution in NEDC, Peugeot cars at +22°C --------------------60Figure 37. Particle size distribution in NEDC, Peugeot cars at -7°C-----------------------61Figure 38. Particle size distribution in NEDC, VW cars at +22°C--------------------------62Figure 39. Particle size distribution in NEDC, VW cars at -7°C ----------------------------62Figure 40. Particle size distribution in US06 for the Peugeot cars--------------------------63Figure 41. Particle size distribution in US06 for the VW Golf cars -------------------------64Figure 42. Particle size distribution during overtaking for the Peugeot cars --------------65Figure 43. Particle size distribution during overtaking for the VW Golf cars (VW
Golf diesel tested in 6th gear) -------------------------------------------------------65Figure 44. Total particle number emissions for IDI and DI engines (VW Golf) -----------66Figure 45. Total number of particles (#/s), VW Golf TD (IDI) vs. VW Golf TDI (DI) ----67Figure 46. Real time SMPS results in NEDC on 5 nm particles (#/s) -----------------------68Figure 47. Real time SMPS results for the first 5 minutes of NEDC on 5 nm
particles (#/s) -------------------------------------------------------------------------68Figure 48. SMPS results on 5 nm particles in NEDC (#/km)---------------------------------69Figure 49. Ozone forming potential -------------------------------------------------------------70Figure 50. Local NOX emissions -----------------------------------------------------------------71Figure 51. Local particulate emissions----------------------------------------------------------72Figure 52. Cancer risk index ---------------------------------------------------------------------73Figure 53. Cancer risk index ---------------------------------------------------------------------74Figure 54. Acidification potential ----------------------------------------------------------------76Figure 55. Eutrophication potential -------------------------------------------------------------77Figure 56. Emissions of greenhouse gases------------------------------------------------------78Figure 57. Energy use -----------------------------------------------------------------------------79

Modern petrol and diesel cars
Ecotraffic ERD3 AB May 2002
iv
SAMMANFATTNING (SWEDISH SUMMARY)
Inledning och bakgrundTransportsektorn bidrar påtagligt till luftföroreningarna och speciellt gäller detta för denlokala luftkvaliteten, eftersom fordon ofta används i tätt befolkade områden. I ett specielltavseende har de lätta fordonen varit föremål för ett stort intresse under den senaste tidenoch detta gäller partikelemissionerna från dieselbilar. Eftersom marknadsandelen för die-selbilar har ökat på de flesta marknaderna i Europa (till över 30% 2001) har denna frågaaktualiserats allt mer. Sverige har varit ett undantag i detta avseende. Här har marknadspe-netrationen minskat långsamt under de 3 senaste åren och nu verkar den ha stabiliserats pånågot över 5%. För att fordonstillverkarna skall kunna klara sitt frivilliga åtagande attminska CO2 emissionerna i framtiden är en ökad marknadsandel för dieselbilar en möjligväg.
Eftersom det finns relativt få data på icke reglerade emissioner från moderna dieselbilar,var det av speciellt intresse att generera sådana data. Det ansågs också av vikt att jämföradessa data med de från moderna bensindrivna bilar. Efter diskussioner med Vägverket er-hölls stöd för att genomföra projektet. MTC anlitades för att utföra den experimentella de-len i projektet.
MetodikNedanstående 4 bilar valdes för undersökningen efter diskussioner med Vägverket, återför-säljare och biltillverkare:
• En dieseldriven Peugeot 307 2.0 HDi FAP, utrustad med partikelfilter• En dieseldriven VW Golf 1,9 TDI (utan partikelfilter)• En bensindriven Peugeot 307 med 1,6-liters motor• En bensindriven VW Golf med 1,6-liters motor
Bilarna utlånades vänligen av de svenska återförsäljarna eller av tillverkaren i ett fall (Peu-geot 307 HDi FAP).
Bilarna testades enligt den europeiska NEDC körcykeln vid temperaturerna +22°C och−7°C. Som komplement valdes den amerikanska US06 körcykeln, som har ett mer aggres-sivt körmönster än NEDC körcykel, för att representera denna typ av körning. Slutligensimulerades en omkörning av en långtradare för att generera data med en motorbelastningmotsvarande full last.
Mätningar av reglerade och flera icke reglerade emissionskomponenter utfördes, inklusivetoxiska föreningar och mätning av partiklarnas storleksfördelning.

Modern petrol and diesel cars
Ecotraffic ERD3 AB May 2002
v
ResultatEftersom en stor mängd figurer och resultat presenteras i rapporten visas endast några avde viktigaste resultaten och slutsatserna i denna sammanfattning. De emissionskomponen-terna respektive effekter på hälsa och miljö från emissioner som speciellt lyfts fram i sam-manfattningen är:
• HC emissioner• NOX emissioner• Partikelemissioner (massa och totalt antal partiklar)• Ozonbildningspotential• Cancer risk index• Försurning
Eftersom bilarna testades både vid ”normal” (+22°C) och lägre (-7°C) temperatur, visarnågra av diagrammen resultat för båda dessa temperaturer. I figurerna har följande beteck-ningar för bilarna använts:
• SI-P: Den bensindrivna Peugeot 307• SI-G: Den bensindrivna VW Golfen• CI-CR/DPF: Den dieseldrivna Peugeot 307 med common rail (CR) insprutning och
dieselpartikelfilter (DPF)• CI-UI/HP: Den dieseldrivna VW Golfen med högtrycks insprutning (HP) med en-
hetsinjektorer (UI)
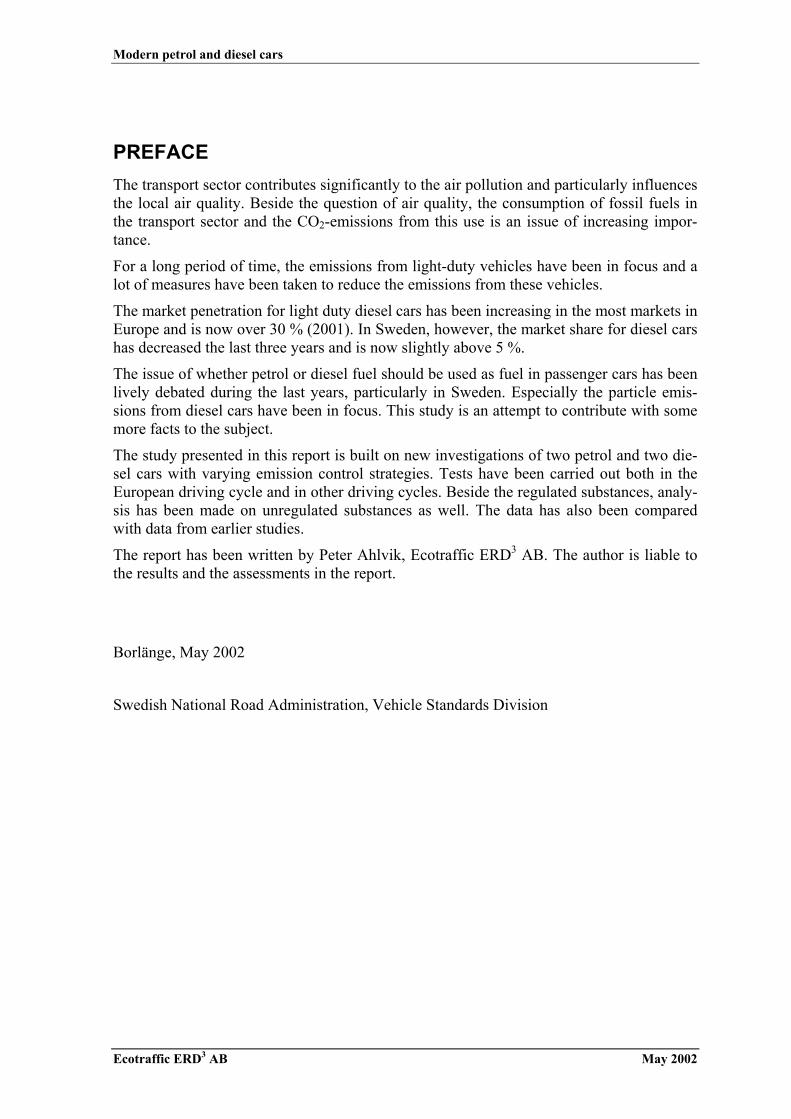
Valda emissionskomponenterFrån resultaten för HC emissionerna i Figur S.1 framgår att nivån generellt är väsentligthögre för bensinbilarna än för deras dieseldrivna motsvarigheter. Dessutom påverkas HCemissionerna för bensinbilarna mer av temperaturen än vad som är fallet för dieselbilarna.En användning av avancerad teknik för att generellt minska kallstartemissionerna skullekunna minska HC emissionerna väsentligt i framtiden.
De lägre nivåerna av HC emissioner för dieselbilarna indikerar också att emissionerna avtoxiska flyktiga föreningar bör vara låga. Så var också fallet för de flesta av dessa emis-sionskomponenter.
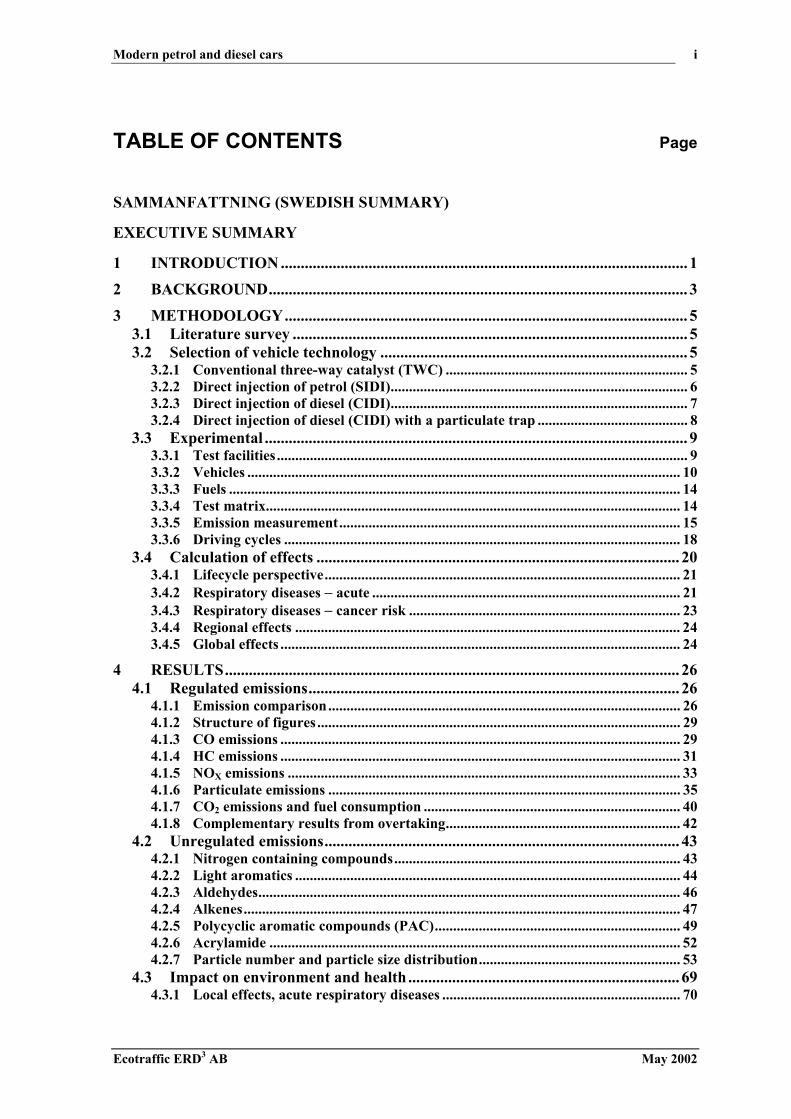
Resultaten i Figur S.2 för NOX emissionerna − allmänt ansett som ett stort problem fördieselbilar − bekräftar förväntningarna om en högre nivå för dieselbilarna. Bensinbilarnakan utnyttja möjligheten att använda en så kallad trevägskatalysator (TWC) för att reduceraNOX emissionerna, medan de oxidationskatalysatorer som används till dieselbilar har enmycket ringa inverkan på NOX emissionerna. Något förvånande var den avsevärt högreNOX nivån vid den lägre temperaturen för dieselbilarna. Den endra rimliga förklaringen tilldenna trend är att avgasåterföringen (EGR) stängs av under kallstartdelen av testcykeln. Iframtiden kommer NOX reducerande katalysatorer att vara nödvändiga för att dieselbilar
Modern petrol and diesel cars
Ecotraffic ERD3 AB May 2002
vi
skall kunna nå en NOX nivå likvärdig den för bensinbilar. Sådana katalysatorer utvecklasför närvarande.
HC emissioner i NEDC vid +22°C and -7°C
0,013
0,20
0,52
0,010
0,05
0,08
0,0120,027
0,0
0,1
0,2
0,3
0,4
0,5
0,6
SI-P SI-G CI-CR/DPF CI-UI/HP
HC
em
issi
oner
(g/k
m)
Temperatur: +22°CTemperatur: -7°C
DieselBensin
Figur S.1. HC emissioner i NEDC
NOX emissioner i NEDC vid +22°C and -7°C
0,61
0,55
0,040 0,052
0,37 0,37
0,033
0,073
0,0
0,1
0,2
0,3
0,4
0,5
0,6
0,7
SI-P SI-G CI-CR/DPF CI-UI/HP
NO
X em
issi
oner
(g/k
m)
Temperatur: +22°CTemperatur: -7°C
DieselBensin
Figur S.2. NOX emissioner i NEDC

Modern petrol and diesel cars
Ecotraffic ERD3 AB May 2002
vii
Partikelemissionerna anses vara ett stort problem för dieselbilar. Som förväntat var ocksånivån för partikelemissionerna högst för den dieselbil som inte hade något partikelfilter(Figur S.3), även om nivån för denna bilindivid faktiskt låg under Euro IV kraven. En nymotor med lägre partikelemissioner än den testade har introducerats under hösten 2001 ochbörjan av 2002. Partikelemissionerna var generellt lägre för dieselbilen med partikelfilterjämfört med bensinbilarna. Partikelnivån låg högre för bensinbilarna vid den lägre tempe-raturen än vid den ”normala” testtemperaturen. Emellertid var nivån vid den låga tempe-raturen väsentligt lägre än för tidigare resultat i litteraturen, vilket indikerar att en avsevärdförbättring har skett inom detta område.
Partilkelemissioner i NEDC vid +22°C and -7°C
0,7 1,30,3
22,1
2,1
5,3
0,3
32,4
0
5
10
15
20
25
30
35
SI-P SI-G CI-CR/DPF CI-UI/HP
Part
ikel
emis
sion
er (m
g/km
) Temperatur: +22°CTemperatur: -7°C
DieselBensin
Figur S.3. Parikelemissioner i NEDC
Antalet partiklar och partikelstorleksfördelningen mättes med en elektrisk lågtrycksim-paktor (ELPI). Detta instrument kan mäta antalet partiklar av 12 olika storlekar för en ae-rodynamisk diameter mellan 7 nm och 6 µm. En av fördelarna med ELPI-instrumentet äratt det kan mäta partikelemissionerna i realtid.
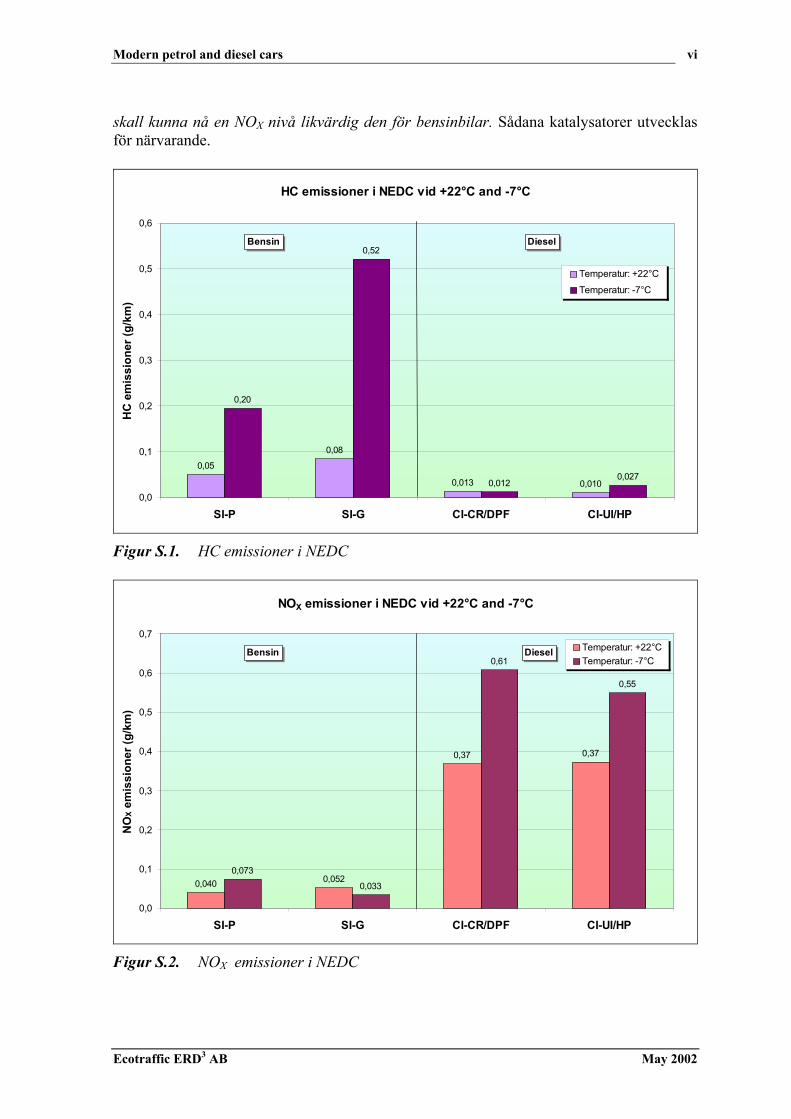
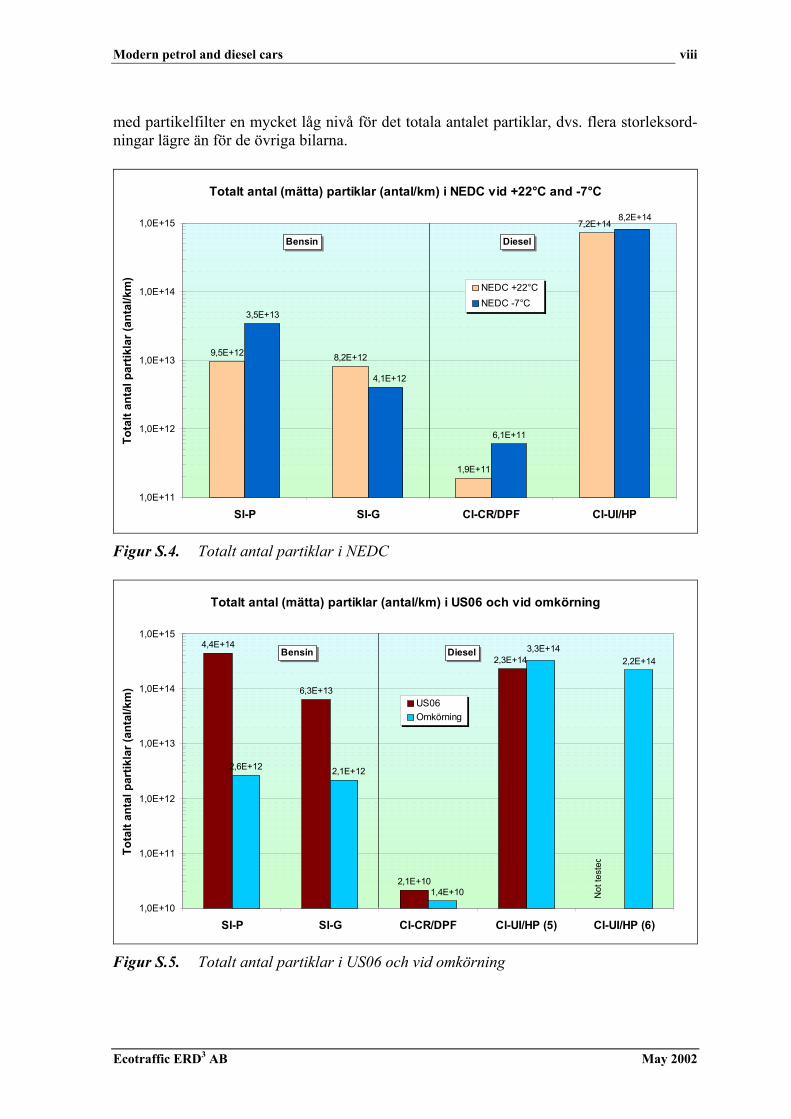
Resultaten för det totala antalet partiklar i NEDC cykeln visas i Figur S.4. Motsvaranderesultat i US06 och vid omkörning visas i Figur S.5. Notera att båda figurerna har logarit-miska skalor på y-axlarna.
Antalet partiklar i NEDC cykeln (Figur S.4) var högst för dieselbilen utan partikelfilter.De två bensinbilarna låg ungefär 2 storleksordningar (dvs. 2 tiopotenser) lägre. Den lägstanivån erhölls med dieselbilen med partikelfilter, dvs. ungefär en storleksordning lägre änför bensinbilarna.
I US06 körcykeln (Figur S.5) ökade antalet partiklar väsentligt jämfört med resultaten frånNEDC körcykeln till en nivå ungefär lika hög som för dieselbilen utan partikelfilter. Nivånför omkörningstestet var lägre för bensinbilen än i US06. I båda testerna hade dieselbilen
Modern petrol and diesel cars
Ecotraffic ERD3 AB May 2002
viii
med partikelfilter en mycket låg nivå för det totala antalet partiklar, dvs. flera storleksord-ningar lägre än för de övriga bilarna.
Totalt antal (mätta) partiklar (antal/km) i NEDC vid +22°C and -7°C
9,5E+12 8,2E+12
1,9E+11
3,5E+13
6,1E+11
7,2E+14
4,1E+12
8,2E+14
1,0E+11
1,0E+12
1,0E+13
1,0E+14
1,0E+15
SI-P SI-G CI-CR/DPF CI-UI/HP
Tota
lt an
tal p
artik
lar (
anta
l/km
)
NEDC +22°CNEDC -7°C
Bensin Diesel
Figur S.4. Totalt antal partiklar i NEDC
Totalt antal (mätta) partiklar (antal/km) i US06 och vid omkörning
4,4E+14
6,3E+13
2,1E+10
2,6E+12
2,2E+142,3E+14
1,4E+10
3,3E+14
2,1E+12
1,0E+10
1,0E+11
1,0E+12
1,0E+13
1,0E+14
1,0E+15
SI-P SI-G CI-CR/DPF CI-UI/HP (5) CI-UI/HP (6)
Tota
lt an
tal p
artik
lar (
anta
l/km
)
US06Omkörning
Bensin Diesel
Not
test
ed
Figur S.5. Totalt antal partiklar i US06 och vid omkörning

Modern petrol and diesel cars
Ecotraffic ERD3 AB May 2002
ix
Inverkan av emissioner på hälsa och miljöI utvärderingarna av effekterna på hälsa och miljö har den årliga medeltemperaturen på+7°C använts i de flesta fallen. Enda undantaget var för ozonbildningspotentialen där entemperatur på +14°C användes i ställer. För att ge ett visst perspektiv på jämförelserna vi-sas också resultaten för bilar av årsmodell 1993/1994 från en tidigare studie. För att för-enkla presentationen av resultaten har ett index använts (referensnivå: bensinbilar av års-modell 1993/1994).
Ozonbildningspotentialen, som visas i Figur S.6 var generellt lägre för dieselbilarna än förderas bensindrivna motsvarigheter. Orsaken är främst de väsentligt lägre HC emissionernajämfört med bensinbilarna. Emellertid skall man också notera att nivåerna är väsentligtlägre för de nya bilarna är för de gamla oberoende av drivmedel.
Ozonbildningspotential utvärderad för en medeltemperatur av +14°CReferens (index=100): bensindrivna bilar av årsmodell 93/94
16,4
38,3
14,2
2,1 2,4
100
0
20
40
60
80
100
120
Petrol 93/94 SI-P SI-GDiesel 93/94
CI-CR/DPF CI-UI/HP
Ozo
nbild
ning
spot
entia
l (be
nsin
93/
94=1
00) DieselBensin
Figur S.6. Ozonbildningspotential (index: bensin 93/94=100)
Resultaten för cancerriskindexet visas i Figur S.7. Riskfaktorer för de uppmätta förening-arna har använts som viktsfaktorer i beräkningen av cancerriskindexet.
Först bör man notera att nivån för bilarna som testades i denna studie var signifikant lägreän för de äldre bilarna (Figur S.7). På grund av de stora osäkerheterna för riskfaktorernaför varje enskild förening och spridningen mellan bilarna är det svårt att avgöra om diesel-eller bensinbilar har en lägre nivå. Bidraget till cancerriskindexet domineras av de poly-cykliska aromatiska föreningarna (PAC) för bensinbilarna. Dessa emissionskomponenteremitteras primärt vid låga temperaturer. För dieselbilar utan partikelfilter bidrar partikele-missionerna mest till cancerrisken. Den praktiskt taget totala elimineringen av partikele-missionerna när partikelfilter används har en avgörande inverkan på cancerriskindexet.

Modern petrol and diesel cars
Ecotraffic ERD3 AB May 2002
x
Cancerriskindex (bensin 93/94=100)
0
20
40
60
80
100
120
Petrol 93/94 SI-P SI-G Diesel 93/94 CI-CR/DPF CI-UI/HP
Can
cerr
iski
ndex
(ben
sin
93/9
4=10
0)
PACAldehyder
AlkenerBenzene
Partiklar
100
11
71
2,2
15
4,0
Bensin Diesel
Figur S.7. Cancerriskindex (bensin 93/94=100)
Kväveoxider (NOX) och svaveloxider (SOX), liksom även ammoniak (NH3), bidrar till för-surningen. Emellertid måste även drivmedelsproduktionen tas i beaktande, eftersom för-surningen kan anses vara en regional effekt. I Figur S.8 visas resultaten för försurningsin-dexet.
Försurningspotential (i NOX ekvivalenter)Referens (index=100): bensindrivna bilar av årsmodell 93/94
27
59
10 9
112
80 75
2731363741
0
20
40
60
80
100
120
140
160
Petrol 93/94 SI-P SI-GDiesel 93/94
CI-CR/DPF CI-UI/HP
Förs
urni
ng, i
ndex
(ben
sin
93/9
4=10
0)
FordonDrivmedelsprod.
100
DieselBensin
47,5 45,0
143
106 102
Figur S.8. Försurningspotential (index: bensin 93/94=100)

Modern petrol and diesel cars
Ecotraffic ERD3 AB May 2002
xi
En uppdelning i bidrag till försurning från drivmedelsproduktion och från fordonet hargjorts i Figur S.8. Eftersom NOX nivån var mycket låg för bensinbilarna, samtidigt somsvavelhalten i den bensin som användes var låg, domineras försurningen av drivme-delsproduktionen för de nya bensinbilarna. Dieselbilar har höga NOX emissioner och dettaär orsaken till den höga nivån för dessa bilar. I detta fall är bidraget från drivmedelspro-duktionen lägre än för bensinbilarna.
DiskussionInförandet av ny emissionsbegränsande teknologi har väsentligt minskat emissionerna frånbensindrivna personbilar under det senaste decenniet. Efter introduktionen av trevägskata-lysatortekniken (TWC) som avgasreningskoncept har fortsatta förbättringar av denna tek-nik minskat emissionerna ännu mer. Mot bakgrund av detta framsteg har emissionerna fråndieselbilar blivit föremål för större uppmärksamhet från myndigheter och miljöorganisa-tioner. Emellertid har inte emissionsproblemet för bensinbilar vid låga temperaturer hellerlösts fullständigt. Man glömmer också ofta att emissionstester normalt genomförs i etttemperaturintervall av +20°C till +30°C. I det kalla nordiska klimatet måste också lågatemperaturer beaktas. Trots allt uppvisar de testade bensinbilarna en avsevärt förbättringvid dessa temperaturer jämfört med äldre bilar.
Även om emissionerna från dieseldrivna bilar har minskat väsentligt under det senaste de-cenniet har den generella uppfattningen varit att dessa bilar emitterar väsentligt mer hälso-farliga emissioner än deras bensindrivna motsvarigheter. Resultaten i denna studie visar attflera icke reglerade emissionskomponenter från dieselbilar låg på samma nivå som för ben-sinbilar och i flera fall lägre. Två stora problem kvarstår − NOX och partikelemissioner. Idag finns ingen motsvarighet till TWC reningstekniken för dieselbilar för att reducera NOXemissionerna men sådan teknik håller nu på att utvecklas. Ny partikelfilterteknik har kom-mersialiserats av PSA och andra tillverkare kommer att följa detta exempel.
Beräkningen av inverkan på hälsa och miljö från avgasemissionerna ger en bättre insikt änatt enbart redovisa resultaten för emissionskomponenterna. Emellertid bör det också note-ras att i en del fall är indata för dessa beräkningar (t.ex. cancerrisk) ännu fullt utvecklade.
SlutsatserAntalet bilar i denna studie var för få för att tillåta en generalisering av resultaten till attgälla för alla bilar. Urvalet av bilar gjordes med den förutsättningen att inverkan av ny tek-nik skulle kunna jämföras med tidigare genererade resultat från äldre bilar. Följande över-gripande slutsatser kan dras:
• De reglerade emissionerna för alla bilar låg mycket nära certifieringsdata. Därför kanbilarna anses ha varit representativa stickprov för varje bilmodell. De två bensindrivnabilarna i denna studie visade sig ligga på samma nivå som några av de bästa bilar somtidigare testats vid MTC.
• Som förväntat var CO och HC emissionerna generellt sett lägre för dieselbilarna än förbensinbilarna medan resultaten för NOX var de rakt motsatta. Partikelemissionerna varhögre för dieselbilen utan partikelfilter jämfört med dess bensindrivna motsvarighet.Emellertid hade dieselbilen med partikelfilter lägre partikelemissioner än motsvarandebensinbil.
Modern petrol and diesel cars
Ecotraffic ERD3 AB May 2002
xii
• Emissionerna av några kväveföreningar, som ammoniak (NH3) och lustgas (N2O) varlåga för alla bilar.
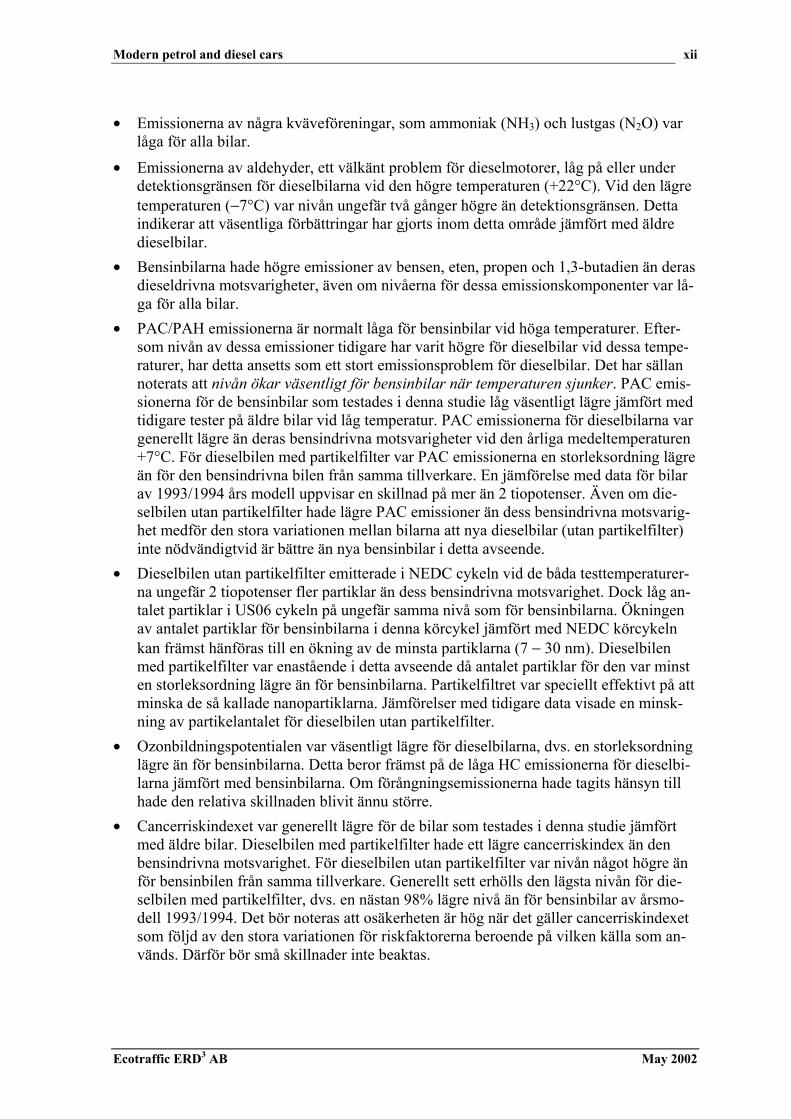
• Emissionerna av aldehyder, ett välkänt problem för dieselmotorer, låg på eller underdetektionsgränsen för dieselbilarna vid den högre temperaturen (+22°C). Vid den lägretemperaturen (−7°C) var nivån ungefär två gånger högre än detektionsgränsen. Dettaindikerar att väsentliga förbättringar har gjorts inom detta område jämfört med äldredieselbilar.
• Bensinbilarna hade högre emissioner av bensen, eten, propen och 1,3-butadien än derasdieseldrivna motsvarigheter, även om nivåerna för dessa emissionskomponenter var lå-ga för alla bilar.
• PAC/PAH emissionerna är normalt låga för bensinbilar vid höga temperaturer. Efter-som nivån av dessa emissioner tidigare har varit högre för dieselbilar vid dessa tempe-raturer, har detta ansetts som ett stort emissionsproblem för dieselbilar. Det har sällannoterats att nivån ökar väsentligt för bensinbilar när temperaturen sjunker. PAC emis-sionerna för de bensinbilar som testades i denna studie låg väsentligt lägre jämfört medtidigare tester på äldre bilar vid låg temperatur. PAC emissionerna för dieselbilarna vargenerellt lägre än deras bensindrivna motsvarigheter vid den årliga medeltemperaturen+7°C. För dieselbilen med partikelfilter var PAC emissionerna en storleksordning lägreän för den bensindrivna bilen från samma tillverkare. En jämförelse med data för bilarav 1993/1994 års modell uppvisar en skillnad på mer än 2 tiopotenser. Även om die-selbilen utan partikelfilter hade lägre PAC emissioner än dess bensindrivna motsvarig-het medför den stora variationen mellan bilarna att nya dieselbilar (utan partikelfilter)inte nödvändigtvid är bättre än nya bensinbilar i detta avseende.
• Dieselbilen utan partikelfilter emitterade i NEDC cykeln vid de båda testtemperaturer-na ungefär 2 tiopotenser fler partiklar än dess bensindrivna motsvarighet. Dock låg an-talet partiklar i US06 cykeln på ungefär samma nivå som för bensinbilarna. Ökningenav antalet partiklar för bensinbilarna i denna körcykel jämfört med NEDC körcykelnkan främst hänföras till en ökning av de minsta partiklarna (7 − 30 nm). Dieselbilenmed partikelfilter var enastående i detta avseende då antalet partiklar för den var minsten storleksordning lägre än för bensinbilarna. Partikelfiltret var speciellt effektivt på attminska de så kallade nanopartiklarna. Jämförelser med tidigare data visade en minsk-ning av partikelantalet för dieselbilen utan partikelfilter.
• Ozonbildningspotentialen var väsentligt lägre för dieselbilarna, dvs. en storleksordninglägre än för bensinbilarna. Detta beror främst på de låga HC emissionerna för dieselbi-larna jämfört med bensinbilarna. Om förångningsemissionerna hade tagits hänsyn tillhade den relativa skillnaden blivit ännu större.
• Cancerriskindexet var generellt lägre för de bilar som testades i denna studie jämförtmed äldre bilar. Dieselbilen med partikelfilter hade ett lägre cancerriskindex än denbensindrivna motsvarighet. För dieselbilen utan partikelfilter var nivån något högre änför bensinbilen från samma tillverkare. Generellt sett erhölls den lägsta nivån för die-selbilen med partikelfilter, dvs. en nästan 98% lägre nivå än för bensinbilar av årsmo-dell 1993/1994. Det bör noteras att osäkerheten är hög när det gäller cancerriskindexetsom följd av den stora variationen för riskfaktorerna beroende på vilken källa som an-vänds. Därför bör små skillnader inte beaktas.

Modern petrol and diesel cars
Ecotraffic ERD3 AB May 2002
xiii
• De miljöeffekter som är främst förknippade med NOX emissioner, såsom NO2 bild-ningspotential, försurning och övergödning, var större för dieselbilarna än deras ben-sindrivna motsvarigheter beroende på de högre NOX emissionerna. Bidraget frånbränsleproduktion var högre för bensinbilarna.
• Som förväntat var utsläppen av klimatgaser och energianvändningen lägre för diesel-bilarna än för bensinbilarna. Detta beror delvis på en lägre energianvändning, delvis påen högre verkningsgrad i drivmedelsproduktionen.
Även om syftet med denna studie var att jämföra emissionerna från dieselbilar med emis-sionerna från bensinbilar, kan det inte undvikas att påpekas att fokuseringen var något stör-re på resultaten från dieselbilarna. Detta beror främst på att de flesta data på icke regleradeemissioner har genererats på bensinbilar. Relativt lite är känt om inverkan av ny teknik idetta avseende. Som förväntat är NOX och partikelemissionerna de största emissions-problemen för dieselbilarna. Resultaten för partikelemissionerna visar att ett partikelfilterär mycket effektivt på att minska dessa emissioner. För båda de nämnda emissionskompo-nenterna har lösningar som kan minska dessa problem introducerats, eller kommer att in-troduceras på marknaden inom en nära framtid. Icke desto mindre, om dieselbilar förbätt-ras i detta avseende så kommer också bensinbilarna att göra det. Testresultaten för de ickereglerade emissionerna, och de effekter på hälsa och miljö som utvärderats, visade lägrenivåer i några fall för dieselbilarna och högre i andra fall jämfört med bensinbilarna. Såsmåningom, när emissionerna från fordon som körs på båda typerna av drivmedel kommeratt kunna minskas till försumbara nivåer, kommer framgent energieffektivitet och emissio-ner av klimatgaser att öka i betydelse.

Modern petrol and diesel cars
Ecotraffic ERD3 AB May 2002
xiv
EXECUTIVE SUMMARY
Introduction and backgroundThe transport sector contributes significantly to the air pollution and in particular, thisstatement is valid for the local air quality, since vehicles often operate in populated areas.In one particular aspect, the light-duty vehicles have been subject much interest lately, andthis is regarding the particulate emissions from diesel-fuelled cars. Since the market pene-tration of diesel cars has been ever increasing on most markets in Europe (to over 30% in2001), this issue has become even more pronounced. Sweden has been an exemption inthis respect. Here, the market penetration has been slowly decreasing during the last 3years and now it seems to have stabilised at level of slightly above 5%. In order for thevehicle manufacturers to meet the agreement to reduce CO2 emissions in the future, an in-creased market share of diesel cars is a possible route.
As there are relatively few data on unregulated emissions from modern diesel cars, it wasof particular interest to generate such data. It was also considered important to comparethese data with data on modern petrol-fuelled cars. After discussions with the Swedish Na-tional Road Administration (SNRA), funding for the project was granted. MTC in Swedenwas commissioned to carry out the experimental part of the project.
ExperimentalThe following four cars were selected for the investigation after discussions with SNRA,the Swedish wholesalers and the car manufacturers:
• A diesel-fuelled Peugeot 307 2.0 HDi FAP, equipped with a particulate filter• A diesel-fuelled VW Golf 1,9 TDI (without particulate filter)• A petrol-fuelled Peugeot 307 with 1.6 litre engine• A petrol-fuelled VW Golf with 1.6 litre engine
The cars were kindly lent by the Swedish wholesalers or by the car manufacturer in onecase (Peugeot 307 HDi FAP).
The cars were tested according to the NEDC cycle at ambient temperatures of +22°C and−7°C. In addition, the US06, having a more aggressive driving pattern than the NEDCdriving cycle was chosen to reflect this type of driving as well. Finally, overtaking of alorry was simulated to generate data on full load operation.
Measurements of regulated and several unregulated emission components were carried out,including air toxics and particle size distribution.
ResultsAs a great number of figures and results are presented in the report, only a few of the mostimportant findings are shown in this summary. The emission components or the specific

Modern petrol and diesel cars
Ecotraffic ERD3 AB May 2002
xv
impacts on health and environment from emissions that are particularly highlighted in theexecutive summary are:
• HC emissions• NOX emissions• Particulate emissions (mass and total number)• Ozone forming potential• Cancer risk index• Acidification
As the cars were tested at both “normal” (+22°C) and lower (−7°C) ambient temperatures,several of the diagrams show the results for both these temperatures. In the figures, thefollowing denotations for the cars are used:
• SI-P: Petrol-fuelled Peugeot 307• SI-G: Petrol-fuelled VW Golf• CI-CR/DPF: Diesel-fuelled Peugeot 307 with common rail (CR) injection and diesel
particulate filter (DPF)• CI-UI/HP: Diesel-fuelled VW Golf with high-pressure (HP) unit injectors (UI)
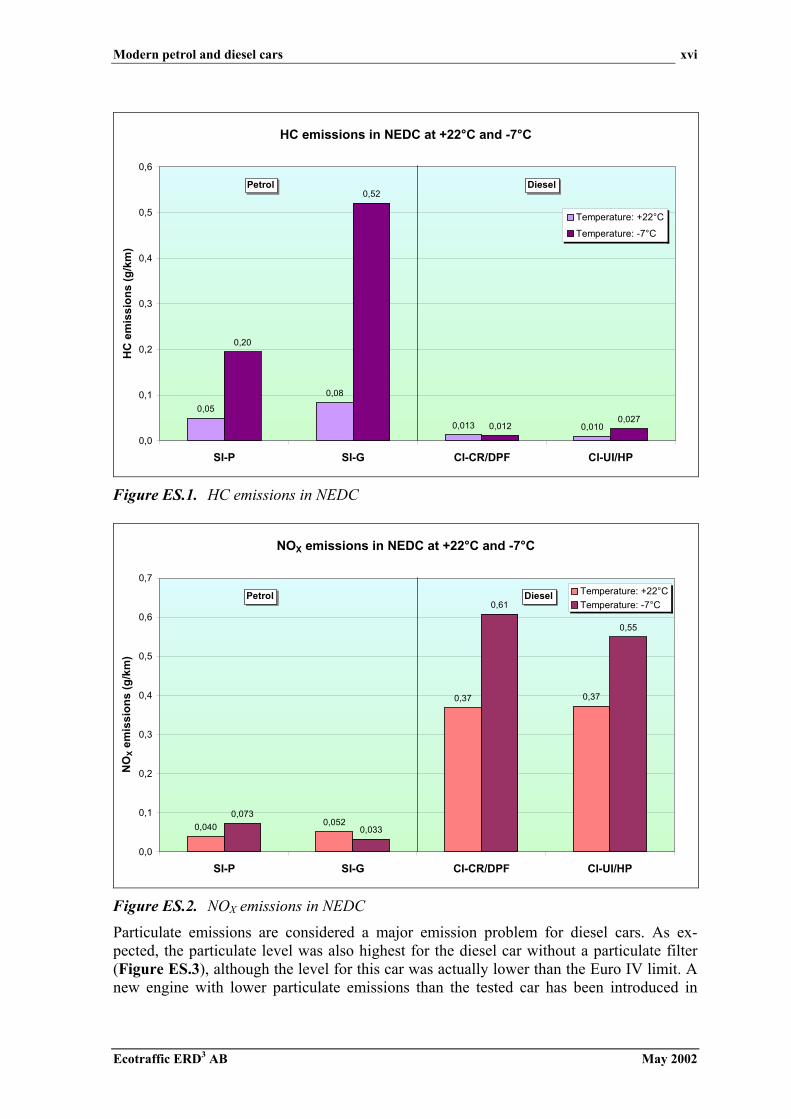
Selected emission componentsIn Figure ES.1, the results on HC emissions show that the level was generally significantlyhigher for the petrol cars than for their diesel counterparts. Moreover, HC emissions frompetrol cars were more influenced by the ambient temperature than are diesel cars. The useof advanced technology for reducing cold start emissions in general could reduce the HClevel considerably in the future.
The lower HC emission level for the diesel cars generally also indicates lower levels oftoxic volatile organic compounds. This was also the case for most of these emission com-ponents.
The results in Figure ES.2 on NOX emissions − generally considered as a main problemfor diesel cars − confirm the expectations of a higher level for diesel cars. Petrol cars ex-ploit reduction of the NOX emissions in a so-called three-way catalyst (TWC), while theoxidation catalysts on diesel cars have very little influence on the NOX emissions. Some-what surprising was the considerably higher NOX level at the lower ambient temperaturefor the diesel cars. The only plausible explanation for this trend is that the exhaust gas re-circulation (EGR) is cut off during the cold start phase of the test cycle. In the future, aNOX reducing catalyst will be necessary for the diesel cars to achieve a NOX level on pairwith the petrol cars. Such catalysts are currently being developed.
Modern petrol and diesel cars
Ecotraffic ERD3 AB May 2002
xvi
HC emissions in NEDC at +22°C and -7°C
0,013 0,010
0,20
0,52
0,05
0,08
0,0120,027
0,0
0,1
0,2
0,3
0,4
0,5
0,6
SI-P SI-G CI-CR/DPF CI-UI/HP
HC
em
issi
ons
(g/k
m)
Temperature: +22°C
Temperature: -7°C
DieselPetrol
Figure ES.1. HC emissions in NEDC
NOX emissions in NEDC at +22°C and -7°C
0,040 0,052
0,37 0,37
0,073
0,033
0,55
0,61
0,0
0,1
0,2
0,3
0,4
0,5
0,6
0,7
SI-P SI-G CI-CR/DPF CI-UI/HP
NO
X em
issi
ons
(g/k
m)
Temperature: +22°CTemperature: -7°C
DieselPetrol
Figure ES.2. NOX emissions in NEDC
Particulate emissions are considered a major emission problem for diesel cars. As ex-pected, the particulate level was also highest for the diesel car without a particulate filter(Figure ES.3), although the level for this car was actually lower than the Euro IV limit. Anew engine with lower particulate emissions than the tested car has been introduced in

Modern petrol and diesel cars
Ecotraffic ERD3 AB May 2002
xvii
autumn 2001 or early 2002. The particulate emissions were generally lower for the dieselcar with a particulate filter than for the petrol cars. The petrol cars had a higher particulatelevel at the low ambient temperature than at the “normal” test temperature. However, thelevel at the low temperature was significantly lower than in previous results in the litera-ture, indicating a considerable improvement in this area.
Particulate emissions in NEDC at +22°C and -7°C
22,1
2,1
5,3
0,3
32,4
0,31,30,7
0
5
10
15
20
25
30
35
SI-P SI-G CI-CR/DPF CI-UI/HP
Part
icul
ate
emis
sion
s (m
g/km
) Temperature: +22°CTemperature: -7°C
DieselPetrol
Figure ES.3. Particulate emissions in NEDC
The particle number and particle size distribution was measured with an electrical low-pressure impactor (ELPI). This instrument measures particle number at 12 stages for anaerodynamic particle size between 7 nm and 6 µm. One of the features of the ELPI instru-ment is that it can measure the particle emissions in real-time.
The results for the total particle number in the NEDC cycle are shown in Figure ES.4. Thecorresponding results in the US06 cycle and during overtaking are shown in Figure ES.5.Note that both figures have logarithmic scales on the y-axes.
The particle number in NEDC (Figure ES.4) was highest for the diesel car without a par-ticulate filter. The two petrol cars had a level that was roughly two orders of magnitudelower. The lowest level was achieved by the diesel car with a particulate filter, i.e. aboutone order of magnitude lower than for the petrol cars.
In the US06 cycle (Figure ES.5), the particle number compared with the results in NEDCincreased considerably for the petrol cars to roughly the same level as for the diesel carwithout a particle filter. The level during overtaking was lower for the petrol cars than inthe US06. In both tests, the diesel car with a particulate filter had very low total number ofparticles, i.e. several orders of magnitude lower than the other cars.

Modern petrol and diesel cars
Ecotraffic ERD3 AB May 2002
xviii
Total (measured) particle number (#/km) in NEDC at +22°C and -7°C
9,5E+12 8,2E+12
1,9E+11
3,5E+13
6,1E+11
7,2E+148,2E+14
4,1E+12
1,0E+11
1,0E+12
1,0E+13
1,0E+14
1,0E+15
SI-P SI-G CI-CR/DPF CI-UI/HP
Tota
l par
ticle
num
ber (
#/km
) NEDC +22°CNEDC -7°C
Petrol Diesel
Figure ES.4. Total particulate number in NEDC
Total (measured) particle number (#/km) in US06 and overtaking
4,4E+14
6,3E+13
2,1E+10
2,6E+12
2,2E+142,3E+14
1,4E+10
3,3E+14
2,1E+12
1,0E+10
1,0E+11
1,0E+12
1,0E+13
1,0E+14
1,0E+15
SI-P SI-G CI-CR/DPF CI-UI/HP (5) CI-UI/HP (6)
Tota
l par
ticle
num
ber (
#/km
)
US06Overtaking
Petrol DieselN
ot te
sted
Figure ES.5. Total particulate number in US06 and during overtaking
Impact of emissions on environment and healthIn the evaluation of the effects on environment and health, the yearly average temperaturein Sweden of +7°C was used in most cases. The only exception was the ozone forming
Modern petrol and diesel cars
Ecotraffic ERD3 AB May 2002
xix
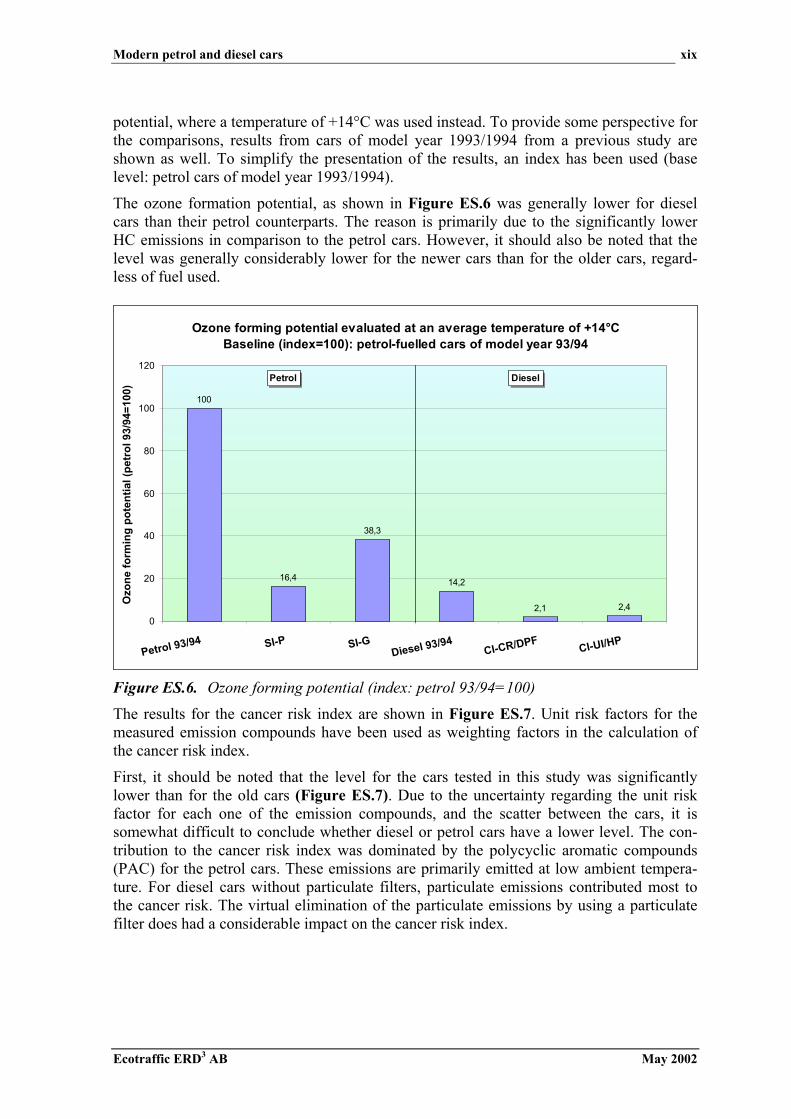
potential, where a temperature of +14°C was used instead. To provide some perspective forthe comparisons, results from cars of model year 1993/1994 from a previous study areshown as well. To simplify the presentation of the results, an index has been used (baselevel: petrol cars of model year 1993/1994).
The ozone formation potential, as shown in Figure ES.6 was generally lower for dieselcars than their petrol counterparts. The reason is primarily due to the significantly lowerHC emissions in comparison to the petrol cars. However, it should also be noted that thelevel was generally considerably lower for the newer cars than for the older cars, regard-less of fuel used.
Ozone forming potential evaluated at an average temperature of +14°CBaseline (index=100): petrol-fuelled cars of model year 93/94
16,4
38,3
14,2
2,1 2,4
100
0
20
40
60
80
100
120
Petrol 93/94 SI-P SI-GDiesel 93/94
CI-CR/DPF CI-UI/HP
Ozo
ne fo
rmin
g po
tent
ial (
petr
ol 9
3/94
=100
) DieselPetrol
Figure ES.6. Ozone forming potential (index: petrol 93/94=100)
The results for the cancer risk index are shown in Figure ES.7. Unit risk factors for themeasured emission compounds have been used as weighting factors in the calculation ofthe cancer risk index.
First, it should be noted that the level for the cars tested in this study was significantlylower than for the old cars (Figure ES.7). Due to the uncertainty regarding the unit riskfactor for each one of the emission compounds, and the scatter between the cars, it issomewhat difficult to conclude whether diesel or petrol cars have a lower level. The con-tribution to the cancer risk index was dominated by the polycyclic aromatic compounds(PAC) for the petrol cars. These emissions are primarily emitted at low ambient tempera-ture. For diesel cars without particulate filters, particulate emissions contributed most tothe cancer risk. The virtual elimination of the particulate emissions by using a particulatefilter does had a considerable impact on the cancer risk index.

Modern petrol and diesel cars
Ecotraffic ERD3 AB May 2002
xx
Cancer risk index (petrol 93/94=100)
0
20
40
60
80
100
120
Petrol 93/94 SI-P SI-G Diesel 93/94 CI-CR/DPF CI-UI/HP
Can
cer r
isk
inde
x (p
etro
l 93/
94=1
00)
PACAldehydesAlkenesBenzeneParticulates
100
11
71
2,2
15
4,0
Petrol Diesel
Figure ES.7. Cancer risk index (petrol 93/94=100)
Oxides of nitrogen (NOX) and sulphur (SOX), as well as ammonia (NH3), contribute to theacidification. However, fuel production has also to be taken into account, as acidificationcould be considered as a regional impact. In Figure ES.8, the results for the acidificationindex are shown.
Acidification potential (in NOX equivalents)Baseline (index=100): petrol-fuelled cars of model year 93/94
27
59,079,7 75,2
41 37 36 31 27
112
9,210,5
0
20
40
60
80
100
120
140
160
Petrol 93/94 SI-P SI-GDiesel 93/94
CI-CR/DPF CI-UI/HP
Aci
dific
atio
n in
dex
(pet
rol 9
3/94
=100
)
VehicleFuel prod.
100
DieselPetrol
47,5 45,0
143
106 102
Figure ES.8. Acidification potential (index: petrol 93/94=100)
Modern petrol and diesel cars
Ecotraffic ERD3 AB May 2002
xxi
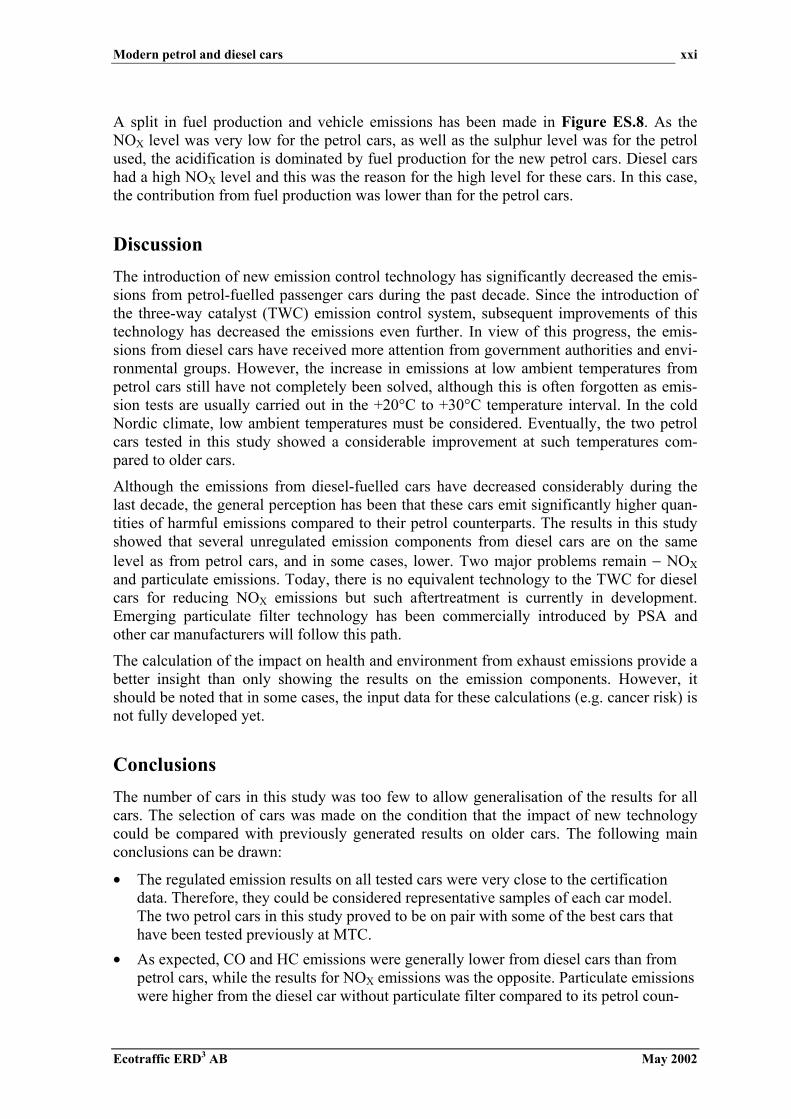
A split in fuel production and vehicle emissions has been made in Figure ES.8. As theNOX level was very low for the petrol cars, as well as the sulphur level was for the petrolused, the acidification is dominated by fuel production for the new petrol cars. Diesel carshad a high NOX level and this was the reason for the high level for these cars. In this case,the contribution from fuel production was lower than for the petrol cars.
DiscussionThe introduction of new emission control technology has significantly decreased the emis-sions from petrol-fuelled passenger cars during the past decade. Since the introduction ofthe three-way catalyst (TWC) emission control system, subsequent improvements of thistechnology has decreased the emissions even further. In view of this progress, the emis-sions from diesel cars have received more attention from government authorities and envi-ronmental groups. However, the increase in emissions at low ambient temperatures frompetrol cars still have not completely been solved, although this is often forgotten as emis-sion tests are usually carried out in the +20°C to +30°C temperature interval. In the coldNordic climate, low ambient temperatures must be considered. Eventually, the two petrolcars tested in this study showed a considerable improvement at such temperatures com-pared to older cars.
Although the emissions from diesel-fuelled cars have decreased considerably during thelast decade, the general perception has been that these cars emit significantly higher quan-tities of harmful emissions compared to their petrol counterparts. The results in this studyshowed that several unregulated emission components from diesel cars are on the samelevel as from petrol cars, and in some cases, lower. Two major problems remain − NOXand particulate emissions. Today, there is no equivalent technology to the TWC for dieselcars for reducing NOX emissions but such aftertreatment is currently in development.Emerging particulate filter technology has been commercially introduced by PSA andother car manufacturers will follow this path.
The calculation of the impact on health and environment from exhaust emissions provide abetter insight than only showing the results on the emission components. However, itshould be noted that in some cases, the input data for these calculations (e.g. cancer risk) isnot fully developed yet.
ConclusionsThe number of cars in this study was too few to allow generalisation of the results for allcars. The selection of cars was made on the condition that the impact of new technologycould be compared with previously generated results on older cars. The following mainconclusions can be drawn:
• The regulated emission results on all tested cars were very close to the certificationdata. Therefore, they could be considered representative samples of each car model.The two petrol cars in this study proved to be on pair with some of the best cars thathave been tested previously at MTC.
• As expected, CO and HC emissions were generally lower from diesel cars than frompetrol cars, while the results for NOX emissions was the opposite. Particulate emissionswere higher from the diesel car without particulate filter compared to its petrol coun-

Modern petrol and diesel cars
Ecotraffic ERD3 AB May 2002
xxii
terpart. However, the diesel car with a particulate filter had lower particulate emissionsthan the corresponding petrol car.
• Emissions of some nitrogen containing compounds, as ammonia (NH3) and nitrousoxide (N2O), were low from all cars.
• The aldehyde emissions, a well-known problem for diesel engines, were at or belowthe detection limit for the diesel cars at high ambient temperature (+22°C). At thelower ambient temperature (−7°C), the level was approximately twice the detectionlimit. This implies that considerable improvements have been made in this area com-pared to diesel cars of the past.
• The petrol cars had higher emissions of benzene, ethene, propene and 1,3-butadienethan their diesel counterparts, although the levels of these emission components werelow for all cars.
• PAC/PAH emissions are usually low from petrol cars at high ambient temperatures. Asthe level of these emissions has previously been higher for diesel cars at these ambientconditions, this has been considered as one of the main emission problems for dieselcars. It has seldom been recognised that the level increases considerably for petrol carswhen the ambient temperature decreases. The PAC level for the petrol cars tested inthis study were considerably reduced compared to previous tests on older cars at thelow ambient temperature. The PAC levels for the diesel cars were generally lower thanfor their petrol counterparts at the average yearly temperature of +7°C. The PAC levelfor the diesel car with a particulate filter was one order of magnitude lower than thepetrol car from the same car manufacturer. A comparison with data on 1993/1994model years of petrol cars gives a difference of more than 2 orders of magnitude. Al-though the diesel car without a particulate filter had lower PAC emissions than its pet-rol counterpart, the great variation between cars implies that new diesel cars (w/o par-ticulate filters) are not necessarily better than new petrol cars in this respect.
• The diesel car without a particulate filter emitted about 2 orders of magnitude moreparticles than its petrol counterpart in the NEDC cycle at both temperatures. However,in the US06 test cycle the number of particles was on roughly the same level as for thepetrol cars. The increase in particulate number for the petrol cars in this cycle com-pared to the NEDC cycle was mainly attributable to an increase of the smallest parti-cles (7 − 30 nm). The diesel car with a particulate filter was outstanding in this respecthaving particulate number emissions at least one order of magnitude lower than thepetrol cars. The particulate filter was particularly effective in reducing the number ofnanoparticles. Comparison with older data showed a reduction of the particulate num-ber for the diesel car without particulate filter.
• The ozone forming potential was considerably lower for the diesel cars, i.e. roughlyone order of magnitude lower than for the petrol cars. This is mainly due to the lowlevel of HC emissions for diesel cars compared to the petrol cars. Should the evapora-tive emissions have been taken into account, the relative difference would have beeneven greater.
• The cancer risk index was generally significantly lower for the cars tested in this studycompared to older vehicles. The diesel car with a particulate filter had a lower cancerrisk index than its petrol counterpart. For the diesel car without a particulate filter, thelevel was slightly higher than for the petrol car from the same manufacturer. In general,the lowest value was obtained for the diesel car with a particulate filter, i.e. almost 98%

Modern petrol and diesel cars
Ecotraffic ERD3 AB May 2002
xxiii
lower level than petrol cars of model year 1993/1994. It should be noted that the un-certainty is high for the cancer risk index due to the varying level for the unit risk fac-tors, depending on which source is used. Therefore, small differences should not beconsidered.
• The environmental effects mostly related to the emissions of NOX, such as NO2 form-ing potential, acidification and eutrophication, were greater for the diesel cars than theirpetrol counterparts, due to the higher NOX emissions. The contribution from fuel pro-duction was higher for the petrol cars.
• As expected, climate change and energy use was lower for the diesel cars than for thepetrol cars. This is partly due to the lower fuel consumption, partly to the higher effi-ciency in fuel production.
Although the scope of this study was to compare the emissions from diesel cars with theemissions from petrol cars, it cannot be avoided to point out that the focus was shifted to-wards the results on the diesel cars. This is mainly because most data on unregulated emis-sions on new cars have been generated on petrol cars. Relatively little is known on the im-pact of new technology in this respect. As expected, the NOX and particulate emissions arethe main emission problem on diesel cars. The results on particulate emissions show that aparticulate filter is very effective in reducing these emissions. For both emission compo-nents, solutions that can alleviate these problems have been introduced, or will be intro-duced on the market in the near future. Nevertheless, as diesel cars are improved in thisrespect, so will petrol cars. The test results on the unregulated emissions, and the effects onhealth and environment that were evaluated, showed lower levels in some cases for dieselcars and higher levels in other cases compared to petrol cars. Eventually, as the emissionsfrom vehicles running on both types of fuels will be reduced to a negligible level, energyefficiency and the emissions of greenhouse gases will become more pronounced in the fu-ture.

Modern petrol and diesel cars
Ecotraffic ERD3 AB May 2002
1
1 INTRODUCTIONThe transport sector contributes significantly to the air pollution and in particular, this isevident for the local air quality, since light and heavy-duty vehicles often operate in popu-lated areas. Therefore, it has been of interest to reduce the exhaust emissions from thesevehicles. First, in the late 1980´s, the focus was on light-duty vehicles but lately, the focushas shifted somewhat towards heavy-duty vehicles. The latest move is logical, as the shareof this vehicle category (of the transportation emissions) seems to be increasing in com-parison to the light-duty vehicles. However, in one particular aspect, the light-duty vehicleshave been subject much interest lately, and this is regarding the particulate emissions fromdiesel-fuelled cars. Since the market penetration of diesel cars has been ever increasing onmost markets in Europe (to over 30% in 2001), this issue has become even more pro-nounced. Sweden has been an exemption in this respect. Here, the market penetration hasbeen slowly decreasing during the last 3 years and now it seems to have stabilised at levelof slightly above 5%.
During the last years, climate gases (mainly CO2) have also been much debated. It has be-come clear that the share of CO2 emissions from the transportation sector is large and in-creasing. Therefore, a voluntary agreement has been made between the European carmanufactures (represented by their organisation ACEA) and the EU commission about re-ducing the CO2 emissions from the fleet of new cars by 25% from 1995 to 2008. Similaragreements has also been made between the car manufactures from Japan (JAMA) andKorea (KAMA) for 2009. Meeting this requirement is not easy. It has been speculated thatincreasing the share of diesel cars and cars with direct injection of petrol will be two of themain measures to meet this limit. Therefore, it is of interest to investigate the emissionsfrom these two categories of engine/fuel technology in comparison to conventional petrol-fuelled cars.
In the EU, stricter emission limits for light-duty vehicles have been introduced subse-quently during the last decade and in 2005/2006, the so-called “Euro IV” emission regula-tion will be enforced. However, there are already numerous petrol-fuelled cars that fulfilthis regulation1 and a few diesel cars can meet this emission level, although the late speci-fication of the regulation in the latter case may have delayed actual certification of the cars.In the USA an in California, even stricter emission levels have been introduced (e.g.SULEV according to the LEV II programme). There are some petrol-fuelled cars availableon the U.S. market that can fulfil these emission limits, implying that there is still consid-erable scope for future development in this area, if this technology could be applied exten-sively.
New diesel cars that can fulfil the Euro IV regulation are about to be introduced on a largerscale within the 2003/2004 timeframe. A 74 kW engine, thought to be a mainstream enginefor many of the cars produced by for the VW group of auto manufacturers, was introducedin the autumn of 2001. Presently, this car fulfils the German D4 emission norm that hasemission limits corresponding to Euro IV. However, it has not yet been certified to theEuro IV emission regulation. Although the recent development in this area has been en-couraging, it has to be noted that the particulate level for diesel cars complying with Euro
1 In some cases, cars have an emission level significantly below Euro IV but the cars are certified to Euro IIIanyway.
Modern petrol and diesel cars
Ecotraffic ERD3 AB May 2002
2
Fact and discussion boxThis is an example of a fact and dis-cussion box. The data and opinion ex-pressed here is not covered in the mainreport but this information is consid-ered to be of general interest.
Ecotraffic’s comments
IV is still far higher than for a (modern) conventional petrol car. This conclusion is valid atan ambient temperature corresponding to the interval of +20 to +30°C used in the test cycle− the difference might be smaller at lower ambient temperatures.
The use of a particulate trap, which recently has been introduced on the market by onemanufacturer (PSA), reduces the particulate emissions to practically the same level as forpetrol-fuelled cars. Regarding the NOX level, the situation is somewhat similar as for theparticulate emissions, since the limit in the present Euro III directive and the future EuroIV directive is higher for diesel cars than for petrol cars. Due to the excess oxygen in theexhaust, reduction of NOX by using conventional catalysts is not possible. New catalystthat seems to have a great potential are now being developed but the introduction of thesecatalysts are highly depending on the widespread availability of ultra low-sulphur dieselfuel (<10 ppm S). At present, such fuel is only available on a few markets in Europe.
Due to the objective to reduce the greenhouse gas (GHG) emissions, as mentioned above,direct injection of petrol has become a very interesting solution. With present technologycomprising direct injection and a lean-burn combustion system, a reduction of the CO2emissions by some 12% (author’s estimate) in comparison to a conventional petrol engineseems possible. The drawback of the technology mentioned is an increase of the NOXemissions, as a conventional three-way catalyst (TWC) cannot be accomplished due to theexcess oxygen in the exhaust. However, new catalyst technology is now being introducedon the market and this technology seems at least to partly overcome this problem. Anotherproblem associated with direct injection of petrol is that the particulate emissions increasein comparison to conventional petrol engines. It seems likely that this problem could bealleviated by improved injection systems and control strategy, but the magnitude of thisimprovement potential is not clear. Although direct injection of petrol was of primary in-terest for this investigation, it was not possible to get access to a vehicle with the newestemission technology, and of comparable size to the other vehicles, within the timeframe ofthe project. However, such tests could be added later.
Separately, some of the facts not covered di-rectly in the main body of the report, but in-formation that could be of general interest,have been shown in separate boxes. In somecases, the discussion of these issues is alsoadded in such boxes. An example of the boxmentioned is shown to the right.
Modern petrol and diesel cars
Ecotraffic ERD3 AB May 2002
3
2 BACKGROUNDIn Sweden, much of the emission research on vehicles and engines has been funded by theSwedish EPA (SEPA). During the initial phase of emission research, SEPA operated itsown emission lab and the research organised in this form continued until 1989. For a pe-riod of 10 years after that, the responsibility for this activity was assumed by the SwedishMotor Vehicle Inspection Co. (ASB). The contract research carried out was managedthrough a 10-year agreement between the SEPA and ASB. The wholly owned subsidiaryMTC (formerly Motortestcenter, a business area of ASB) of ASB carried out the researchwork under the agreement. The agreement was initially (1989) 10 million SEK per year,and as it was indexed, it amounted to approximately 16 million SEK in 1999 (approxi-mately 1,5 million €). However, this agreement was ended in 1999 and in 2000, only a re-duced programme was carried out. In 2001, very little research funded by the government(through SEPA) was conducted in this area.
During the latest years, a shift of some of the responsibility for controlling the air pollutionfrom the transportation sector has been made from SEPA to the Swedish National RoadAdministration (SNRA). SNRA has also been funding some research in this area duringthe past years, although not up to the same level as by SEPA, as described above. It hasbeen logical that SNRA has assumed more of the responsibility in this area than previ-ously, as this authority now has the responsibility for the emissions from transportationsector (including off-road vehicles).
Besides the need for new emission factors for the regulated emissions, it can be concludedthat the public domain database on unregulated emissions is not as comprehensive as forregulated emissions. As the latter is not very comprehensive either, it is conceivable thatmuch more work is needed regarding the unregulated emissions. Particulate emissions andespecially nanoparticles (<50 nm) have been much in focus due to the anticipated healtheffects, such as the probable cause of cancer and increased mortality and morbidity. Re-cently, “new” emission components, such as e.g. benzene and PAH (with benzo(a)pyreneas a marker of PAH), has also been of interest to include in future air quality standards inthe EU. It is likely that the focus on exhaust emissions will broadened in the future to in-clude several emission components that are not regulated today. In view of the trendsmentioned, it is of interest to increase the public domain database in this area.
This project originates from preliminary discussions between Ecotraffic and SNRA in1998. The first proposal for testing and evaluation of the data was modified several timesin order to find a balance between the desire to investigate as much as possible and the cur-rent economical constraints. Due to the limited funding available at SNRA, the projectcould not be started before 2001.
In emission and health effects evaluations for various customers, Ecotraffic had identifiedthe need for more experimental data in this field. In particular, data on vehicles with newemission control technology was found as principally important in this respect. Due to theemission research programme of SEPA, as described above, relatively comprehensive setof data are available on older vehicles. The exception is for some new emission compo-nents, e.g. small particles. Data on new vehicles are also necessary to generate in order tobe able to make forecasts about the emission level from future vehicles. It does not makemuch sense to extrapolate trends for air pollution in the future using data from old vehiclesas the basis for the forecast.
Modern petrol and diesel cars
Ecotraffic ERD3 AB May 2002
4
Since the need for new emission data was identified, it was decided to carry out the emis-sion test programme and to evaluate the impact on health and environment from thoseemissions. Due to the economic constraints, relatively few cars could be tested, but isshould also be recognised that it is possible to extend the testing in the future, when newemission control technology is introduced on the market.

Modern petrol and diesel cars
Ecotraffic ERD3 AB May 2002
5
3 METHODOLOGY
3.1 Literature surveyIn previous work (e.g. [1]2), the author has conducted literature surveys on regulated andunregulated emissions from cars fuelled with various fuels. Therefore, no dedicated litera-ture search and assessment of this literature was carried out in this project. However, whennecessary, literature is referred to for comparisons and for discussion of the results.
3.2 Selection of vehicle technologyTwo main areas of interest were initially identified as interesting to investigate. The firstarea was the new direct injection technology for petrol-fuelled cars and the second areawas the new diesel engines with high-pressure direct injection and/or particulate filters. Inboth cases, many variations of the technologies could be anticipated. Due to the impor-tance of this issue, a brief overview of the various technologies is made below.
3.2.1 Conventional three-way catalyst (TWC)The advance in conventional TWC technology has been tremendous during the last decade.When the LEV programme (1st version, or “LEV I”) was introduced in California in the1990´s it was anticipated that new advanced technologies, such as e.g. electrically heatedcatalysts, would have to be used to meet the ULEV limits. Later it was found that im-provement of the conventional technology made these solutions redundant, although theyhave now been developed to a commercial state. The new Euro IV emission limits are al-most as though as the ULEV limits for the HC emissions, bearing in mind that the drivingcycle is different in the two cases3. Some of the limits in the Euro IV directive (e.g. NOX)are actually tougher than the ULEV. Somewhat surprising, it seems that most of the newpetrol-fuelled cars introduced today are meeting the Euro IV limits, several years beforethe time schedule.
It is somewhat difficult in individual cases (i.e. a certain car model) to exactly pinpoint theimprovements that have enabled the car manufacturers to meet the Euro IV limits withoutthe use of the most sofisticated technology, as mentioned above. A recent overview byAudi of the technology applied for meeting the Californian ULEV emission level could bementioned as an example of the introduction of low-emission technology [2]. Althoughthis engine used a turbocharger, much of the emission control technology used is similarfor naturally aspirated engines. Without going into much detail about the emission controlon TWC engines, two major issues could be mentioned. First, it is of utmost importance toreach the light-off temperature for the catalyst as early as possible. Second, the air-fuelratio has to reach stoichiometric ratio as soon as possible (reducing initial the phase of fuelenrichment). In the first case, the positioning of the catalyst as close to the engine manifoldas possible is of importance. In some cases, a small light-off catalyst (with low thermalinertia) is used before the main catalyst. The improvement of the thermal stability of the 2 Numbers in brackets indicate references that as listed in the reference section in the report.3 The weighting of the cold start is more prominent in the European driving cycle than in the US FTP-75driving cycle.

Modern petrol and diesel cars
Ecotraffic ERD3 AB May 2002
6
catalysts has been crucial to enable the use of these technologies. Thermal insulation of theexhaust system (before the catalyst) to avoid heat losses, as well as strategies to raise theexhaust temperature during the cold start phase are also beneficial. Second, improvementsin the combustion control (air-fuel preparation and combustion system) in combinationwith improved control strategy have enabled that the period without controlling the air-fuelratio to stoichiometric condition has been shortened significantly. Ideally, this should beachieved in a shorter timeframe than the idle period in the test cycles. In the US FTP-75test cycle, the idle period 23 seconds. This period is reduced to 11 seconds in the EuropeanNEDC cycle. It appears that advanced emission control technologies can achieve a light-off period shorter than the idle period in the NEDC cycle. Avoiding fuel enrichment in thefirst accelerations reduces the engine-out emissions considerably.
In order to reduce the fuel consumption of engines with TWC, one option is to avoid thethrottling losses by utilising a fully flexible valvetrain. This type of valvetrain can limit thevolumetric efficiency of the cylinder by closing the inlet valve early or late. Ideally, throt-tling can be totally avoided, thus reducing the fuel consumption considerably. This tech-nology has recently been commercialised by BMW. The conventional TWC emission con-trol can be retained by using this type of valvetrain and this is one of the principal advan-tages of this system in comparison to lean-burn direct injection technology (see below). Infact, some minor advantages for the emission control can be attributed to this valvetraintechnology.
The remaining problems for the emission control with TWC technology are the ageingphenomenon (including total failures) and cold start at low ambient temperatures. As thefirst issue has not been investigated in this project, the second issue was considered tostudy.
3.2.2 Direct injection of petrol (SIDI)Direct injection of petrol has gained considerable interest ever since the Mitsubishi GDIwas first introduced on the European market in 1997 (1996 in Japan). Direct injection ofspark ignition engines (SIDI) enables a significant decrease of the fuel consumption, whichis the main advantage of the concept. This is primarily due to the reduction of throttlelosses but also combustion phenomena, as well as heat losses are of importance. In a com-parison of similar cars by the author, the advantage in fuel consumption for the direct in-jection engine (Mitsubishi GDI) was found about 10% in the NEDC cycle [3]. However, asthe car with SIDI engine was relatively new during testing (it had a low odometer reading)compared to the conventional car, indicating that the real potential might be a few per centhigher.
Although the potential advantage in fuel consumption for the direct injection is appalling,there are also some problems with this technology. First, the excess oxygen does not en-able the use of a conventional TWC catalyst system. Catalysts capable of reducing NOXunder lean conditions have been developed but so far, these catalysts do not have the samereduction capacity as the previously mentioned catalysts for the TWC system. The mostrecent technology, using storage and release type of catalysts (“NOX traps”), has been in-troduced on the market. These systems seem to have the ability to meet the Euro IV limitsand presumably, there is some further development potential for this technology. Anotheroption could be to use a catalyst that uses hydrocarbons as a reducing agent and an assis-tance of non-thermal plasma (NTP), although this technology seems to have been of mostinterest for diesel engines.
Modern petrol and diesel cars
Ecotraffic ERD3 AB May 2002
7
Other issues with SIDI engines are higher HC and particulate emissions than conventionalpetrol engines. Today, it is not clear how great the development potential is in these fieldsbut it is likely that the emission level of the newest cars should be lower than for the firstgeneration of cars.
Although the investigation of a car with a SIDI engine was of interest in this project, it wasnot possible to receive a car with the newest technology within the timeframe of the proj-ect. Characterisation of the emissions from this technology remains to be included in fur-ther investigations.
3.2.3 Direct injection of diesel (CIDI)Direct injection for diesel engines (CIDI4) in passenger cars was first introduced by Fiat,Rover and Audi in 1987-1989 timeframe as direct competition to the indirect injection en-gines (IDI). In the perspective of the subsequent market development, it should be notedthat only the engine from Audi was a real commercial success during the first years. Highnoise and problems with emission control were two major problems initially but in bothcases, the continuos development has alleviated these problems. The major advantage ofthe DI diesel engines is the reduction in fuel consumption by some 10 − 15% compared tothe IDI diesel engines.
About mid 1990, the emission level for the DI engines was roughly comparable to the IDIengines and today, there is a considerable advantage for the DI engines. DI engines havehigher NOX emissions than IDI engines, without EGR in both cases, but the tolerance forexhaust gas recirculation (EGR) is higher in the former case. Thus, with optimum EGR,the DI engine seems to have an advantage. Furthermore, an increase of the injection pres-sure for DI engines, which per definition does not necessarily have to decrease the NOXemissions, increases the EGR tolerance. Consequently, the higher injection pressure avail-able with new injection equipment for DI engines and the subsequent development of theEGR system has shifted the emission advantage towards the DI engines. Injection systemswith high injection pressure were first introduced in the 1997 − 1999 timeframe5. High-pressure distributor pumps, unit injectors (UI) and common rail (CR) injection systems arethe three technologies available today. The second generation of the latter systems is nowbeing introduced (CR gen. II), or is about to be introduced (UI gen. II), but it is anticipatedthat the use of rotary pumps will eventually be discontinued in the future.
Diesel cars meeting the Euro IV emission level are now being introduced on the market.However, as the permitted emission level for NOX emissions in Euro IV is higher for dieselcars than for the corresponding petrol cars, the NOX level is still higher for the diesel cars.In addition, the particulate level is higher implying that further development in this area isnecessary. The other regulated emission components (CO and HC) are, in general, lowerfor diesel cars than for petrol cars.
A potential problem of the DI engines, and in particular engines that have high injectionpressure, which has been discussed is the potential increase in nanoparticles6 in compari-son to IDI engines and DI engines with low injection pressure. However, there are little 4 CIDI: Compression Ignition Direct Injection, i.e. a diesel-cycle engine with direct injection.5 It should be noted that high-pressure injection (>1 500 bar) had been used earlier on heavy-duty engines andon larger marine and industrial engines. However, the application of such technology was new on passengercar size of engines in the timeframe indicated.6 The definition of nanoparticles used in this report is particles with a diameter less than 50 nm.

Modern petrol and diesel cars
Ecotraffic ERD3 AB May 2002
8
data to support this hypothesis. A study conducted by this author did not find any signifi-cant difference between three cars with DI engines and two cars with IDI engines in thisrespect [4]. In view of the relatively little data available in this area (and the potentialhealth effect), the generation of data on new vehicles was considered of high priority.
3.2.4 Direct injection of diesel (CIDI) with a particulate trapThe use of particulate traps on passenger cars is not new. In California, both Mercedes andVW had cars in production in the mid-1980’s that were equipped with particulate traps.However, the durability of these systems was not satisfactory and consequently, the pro-duction of these systems was discontinued. At the same time, the public interest in dieselcars in the USA was declining rapidly, presumably as a response to the engine durabilityproblems experienced by one US manufacturer. Concern about the potentially hazardousemissions from diesel cars was also raised by the US EPA. These issues led to a diminish-ing interest in diesel cars in the USA (that have continued until today). This could alsohave been a reason to why the development of particulate trap systems was given a verylow priority by the car manufacturers for the subsequent period of (more than) 10 years.
In the 1980’s, as future particulate limits were being discussed in Europe, it was found thatthe particulate emissions could be significantly reduced by further development of the en-gine (“internal measures”). By using such measures, the EU emission levels from late 1980until Euro III (2000/2001) could be met with far less cost and complexity than using a par-ticulate filter. When the Euro IV emission level for 2005/2006 was proposed, it was con-sidered by many experts that this level could not be met without using a particulate filter.However, it has been shown that, in fact, this level can indeed be met without a particulatefilter, at least on small to medium sized cars. On the longer term horizon − in particular,with respect to the future emission limits in USA and California − and for heavier cars, itseems that a particulate filter is the only viable solution7. Consequently, all car manufac-turers and suppliers of exhaust aftertreatment devices are now developing this technology.
It should be noted that filtering the exhaust is not the main problem with particulate filters.Instead, regeneration of the filter (burning of the collected particulate matter) poses themain technical problem. Several technologies have been proposed for filter regeneration.Many of these require ultra-low (or zero) sulphur level in the fuel. As this fuel is not avail-able all over Europe yet8, the widespread use of this technology is not possible (cars cancross the borders). Some of the regeneration strategies are dependent on a catalyst that willconvert SO2 to sulphates9. As these sulphates will be collected on the sampling filter, andcontribute to the particulate matter, the particulate emissions could actually increase undersome circumstances.
One of the solutions that could be somewhat more sulphur-tolerant is the use of a fuel ad-ditive. In fact, the idea of using fuel additives is not new either, it was tested on vehicles inthe USA (e.g. by VW) in mid 1980’s. Copper, iron, cerium, strontium and other additiveshave been tested as means of reducing the regeneration temperature. During the past years,
7 It should be noted that a combustion system without any soot formation is theoretically possible but thecommercial success of this technology is not likely in the foreseeable future.8 Ultra-low sulphur fuel (<10 ppm) has been available in Sweden for more than 10 years and today, this fuelhas almost the whole market for on-road diesel fuel.9 In addition, it could be mentioned that storage and release of sulphates from the catalysts and/or particulatefilters is a particular problem in this respect.

Modern petrol and diesel cars
Ecotraffic ERD3 AB May 2002
9
Filter maintenece and costThe maintenance interval used todayon the filter system by PSA might beacceptable but need improvement inthe future. An ideal system should lastthe life of the engine without the needfor maintenance or replacement. Inaddition, as the additive used shortensthe interval, avoiding such additiveswould be of great importance in thefuture. The cost reduction by omittingthe additive pump and control systemwould also be a driving force behindfuture development in this area. It isplausible that other possible routes butthe system used currently by PSA willbe explored in the future.
Ecotraffic’s comments
this technology has been used on construction mining machinery and other non-road ma-chinery of similar kind. However, the application of this technology on passenger cars hasnot been easy, primarily due to the low exhaust temperature experienced in this type ofuse. In 2000, a further development of this technology was commercially introduced byPeugeot on the model 607 HDi. The system has been described in a SAE Paper by Peugeot[5] and additional information about the development was provided in a SAE Paper byFaurecia [6] and in the Journal of MTZ [7]. As for many other regeneration technologies,the application on a passenger car is very difficult due to the low exhaust temperature. Byutilising the possibilities of raising the exhaust temperature for a short period, regenerationcan be initiated and consequently, this development is essential for a regeneration strategy.Modern CR injection systems provide this opportunity and consequently, the regenerationis intermittent. Using the strategy mentioned,the regeneration is completed in a relativelyshort time.
An important factor regarding durability isthat Peugeot use silicon carbide (SiC) asmonolith material in favour of corderite thatis used in most applications today (e.g.heavy-duty vehicles). SiC is a much toughermaterial than corderite regarding the thermalstability. Needless to say, an electronic con-trol of the regeneration process and diagnosisof the whole system is also necessary. Themaintenance required for the system is thatthe additive has to be refilled and the filtermust be cleaned from ash every 80 000 km(and possibly replaced after a longer periodof use). The collected ash originates mainlyfrom the lubricating oil and therefore, theformulation of low ash oil and a reduction ofthe oil consumption are important aspects forfuture development work.
3.3 Experimental
3.3.1 Test facilitiesThe testing of the vehicles was carried out at MTC in Jordbro, about 20 km south ofStockholm. MTC has been accredited for emission testing according to EN 45001, since1992.
The light-duty test cell at MTC used for this purpose is a climatic test cell capable of test-ing at an ambient temperature of down to –20°C10. The test cell used has a twin-rollerelectric chassis dynamometer, Clayton EIS 50. The dynamometer settings were calculated
10 This is under relatively favourable conditions, i.e. during late autumn to early spring when the temperatureoutside is not so high. In the summer time the limit is approximately –15°C.

Modern petrol and diesel cars
Ecotraffic ERD3 AB May 2002
10
from coast down data provided by the car manufacturers. Figure 1 shows an example of atypical test arrangement for a car on the chassis dynamometer.
Figure 1. Testing of the Peugeot HDi in the emission test cell at MTC (courtesy of MTC)
3.3.2 VehiclesIn the preliminary discussion about vehicles of interest to study, several potential candi-dates were identified. First, it was decided to that a couple of principles should guide thechoice of vehicles. These were:
• As low emissions as possible according to the European driving cycle, i.e. the fulfil-ment of Euro IV was preferred. If the vehicle was not certified to this emission level, itwas still desirable that the emission level would be well below the Euro IV limits.
• Vehicle size should be about the average size (or weight) for European cars, i.e. some-what smaller than the Swedish average size. It was also desirable that all cars should beabout the same size and weight.
• The cars should have approximately the same performance. Using the accelerationfrom zero to 100 km/h as a benchmark, this would necessitate approximately the sameengine power for cars of similar weight.
• The engines should have approximately the same cylinder capacity and number ofcylinders. In general, the specific power for diesel engines has been lower than for pet-rol engines in the past. Recently, this difference has been diminishing, thus implying
Modern petrol and diesel cars
Ecotraffic ERD3 AB May 2002
11
that there should not be much difference in cylinder capacity for cars of similar per-formance.
• It was desirable that two corresponding petrol and diesel cars from the same manufac-turer and of the same car model could be found. This would make the comparison be-tween the two fuels more straightforward.
As described above, it was not possible to get access to a car with a SIDI engine of the de-sirable size category within the timeframe of the project. Therefore, it was decided tochoose cars with conventional TWC emission control system instead. A car having a fullyvariable valvetrain to control engine power instead of using conventional throttling couldpresumably have been available from BMW. However, since this technology is not avail-able from any other manufactures yet, it was not considered at this stage. Due to the con-straints described, conventional TWC technology was considered the only viable option forthe choice of the petrol cars. For cars of the size and weight, as described above, engines ofa total cylinder capacity of some 1,6 to 1,8 litres would have an output of between 70 and95 kW and provide the desired driveability for most customers. The offer of petrol-fuelledcars on the market meeting these criteria is vast, implying that the choice of car manufac-turer and car model could be made with focus on the diesel counterparts instead.
Having determined that the availability of conventional petrol cars was not the limitingfactor, potential diesel car test candidates were identified. During the summer of 2001, VWannounced that they would initiate the production of an engine meeting the German D4emission regulation (in practice, the same emission level as Euro IV) in the VW Golf sizeof cars. The power of that engine is 74 kW, i.e. within the desired power range. The engineis equipped with the latest version of Bosch Unit Injectors (UI-P1.1). However, even inthis case it was not possible to obtain a vehicle within the timeframe of the project. Instead,a 96 kW TDI corresponding to Euro III emission regulations was chosen. This car waseventually the most powerful car of all the cars that were tested. A 74 kW Euro III versionof the same engine has also been marketed in some car models in the VW group of compa-nies. Since this engine is now being replaced by the previously mentioned new versionhaving much lower emissions, it was not within the scope of the project to test the olderversion of that engine. Instead, the 96 kW engine was chosen.
The choice of diesels car having particulate traps is relatively limited today, as only PSA(Peugeot and Citroën) are offering such aftertreatment on their cars at the moment. A Peu-geot 307, or possibly, a Peugeot 406 or a Citroën C5 was in the desired size range of cars.The particulate filter system (FAP) of PSA is offered on engines of 2,2 and 2,0 litre sizestoday. In the latter case, the FAP system is only offered on the most powerful version ofthe 2-litre engine. After discussions with Peugeot, a 307 HDi with FAP was chosen. Thepower of this engine was 80 kW, i.e. lower than in the case of the VW Golf, but more inline with the petrol cars (see below). The car was kindly lent by Peugeot in France, as thiscar had not been introduced at the Swedish market at the time the test programme was ini-tiated.
After the two diesel cars had been selected, the petrol versions of the same cars were alsochosen. In both cases, 1,6 litre engines were the most obvious choices. The power level of80 kW (Peugeot 307 1,6) and 77 kW (VW Golf 1,6) was on a similar level as the Peugeot307 HDi (80kW).

Modern petrol and diesel cars
Ecotraffic ERD3 AB May 2002
12
Since the torque characteristics of naturally aspirated petrol engines and turbocharged die-sel engines is vastly different, it could be anticipated that the passing acceleration withoutdownshifting would be significantly quicker for the diesel counterparts. On the other hand,top speed usually is marginally higher for petrol engines of same power compared to thediesel counterparts due to selection of transmission and final drive ratios. It can be con-cluded that the criterion of selecting cars with the same performance was met, except in theVW Golf TDI case, where significantly better performance than from the other cars couldbe expected. It could be noted that the engine capacity is greater for the diesel engines thanfor the petrol engines. The ratio is 1,25 in the Peugeot case and 1,18 in the VW Golf case.For a couple of years, Ecotraffic has been continuously comparing the fuel consumptionfor petrol and diesel cars of similar performance (i.e. same acceleration 0-100 km/h) on theEuropean market. The database comprised 103 cars of each type at the end of 2001. Theaverage ratio of engine size (diesel/petrol) of all the cars was 1,15, implying that the differ-ence for the cars tested in this study was slightly greater. One should also note that thereare several other differences between petrol and diesel engines than size. For example, thepetrol engines have 4-valve cylinder heads while the diesel engines only have 2 valves.This indicates that the technology level (in this respect) is still not quite as high for dieselengines as for petrol engines.
All the cars were kindly made available by the car manufacturers or the wholesales inSweden. In one case (Peugeot 307 HDi), the car was transported from France but the othercars were chosen from the demonstration car pools of the wholesalers in Sweden.
In Table 1, the specifications of the cars are shown. Abbreviations for the vehicles are pre-sented in the first row below the title of the table. The petrol cars are denoted “SI”, with theaddition of “P” and “G” for Peugeot and Golf respectively. Likewise, diesel cars are de-noted “CI”. The car with common rail injection and diesel particulate filter is designated“CR/DPF” and “UI/HP” is used for the car with high-pressure unit injector
Some comments can be made about the data in Table 1. As the cars were relatively newduring the tests, the odometer reading was quite low. It was considered that the distancedriven prior to the test should be greater than 3 000 km to avoid the so-called “green cata-lyst” effect, which results in particularly low emissions for a brand new car. On the otherhand, the odometer reading should not be too high as the emission deterioration was not tobe taken into account (this could be a separate issue for a follow-up project).

Modern petrol and diesel cars
Ecotraffic ERD3 AB May 2002
13
Table 1: Vehicle specifications
Petrol cars Diesel cars
ParameterPeugeot 307
1.6VW GolfVar. 1.6
Peugeot 3072.0 HDi FAP
VW Golf1.9 TDI
Vehicle denotation.a SI-P SI-G CI-CR/DPF CI-UI/HPModel year 2001 2001 2001 2001Odometer reading (km) 12 205 3 358 7 632 4 677Engine type L4 L4 L4 L4Certification Euro III Euro IV Euro III Euro IIIEnvironmental Classb C3/2000 C1/2005 C3/2000 C3/2000Combustion system SI otto SI otto DI diesel DI dieselInjection system MPI MPI CR UIDisplacement 1 587 1 598 1 997 1 896Bore * stroke 78,5 * 82 76,5 * 86,9 85 * 88 79,5 * 95,5Compression ratio 10,8 11,5 17,8 19,0Valves per cylinder (#) 4 4 2 2Power (kW) 80 77 80 96Rated eng. speed (r/min) 5 750 5 700 4 000 4 000Maximum torque (Nm) 147 148 250 310Max. torque spd (r/min) 4 000 4 500 2 000 1 900Gearbox 5 speed 5 speed 5 speed 6 speedEmission control con-ceptc TWCc TWCc EGRd, OXDe,
DPFfEGRd,OXDd
Notes:a The vehicle denotations in the table are used in the text and in figures and tables in the report.
The denotations are: SI: spark ignition (P for Peugeot and G for Golf); CI: compression igni-tion; CR/DPF: common rail and diesel particulate filter; UI/HP: high-pressure unit injection.
b Sweden uses an environmental classification system for passenger cars. Previously this systemhad 3 classes, ranging from the basic EU level (class 3, or C3) to the class with the lowestemission level (class 1, or C1). In 2002, this system has changed to the corresponding year ofintroduction of the emission limits in Europe (i.e. 2000, 2005). For clarification, both denota-tions are shown in the table, although the classifications have changed this year.
c TWC: Three-way catalyst.d EGR: Exhaust gas recirculation.e OXD: oxidation catalyst for a diesel engine.f DPF: Diesel particulate filter

Modern petrol and diesel cars
Ecotraffic ERD3 AB May 2002
14
3.3.3 FuelsCommercially available petrol and diesel fu-els corresponding to the Swedish Environ-mental Class 1 (EC1) was chosen in bothcases. The reason for these choices was thatsuch fuels have the highest market share onthe Swedish market. Analysis of the fuelquality ensured that the fuel specificationswere within the limits. The aspect of the in-fluence of fuel quality should not be ignoredwhen comparing these results to other results.
The petrol fuel used corresponded to the EC1fuel specification for petrol. This fuel specifi-cation is similar to the EU specification for2005. The petrol did not contain any ethanol,in contrast to the low blending of ethanol (5%vol.) that is common for the petrol distributedin the Stockholm area. It was anticipated thatpetrol fuel without ethanol additive wouldbetter represent a European perspective. Theimproved specification of this fuel comparedto contemporary certification fuel should(presumably) also reduce the impact on theemissions causing adverse health effects.
The diesel fuel used corresponded to the EC1fuel specification for diesel fuel. This fuel isconsiderably “cleaner” than the correspond-ing (current) specification for the European diesel fuel. The rationale for choosing this fuelwas that it is totally dominating the market for diesel fuel for road transport in Sweden.The EC1 diesel fuel has a very low sulphur content (<10 ppm) and it is essentially freefrom polycyclic aromatic hydrocarbons (PAH). Therefore, the impact of this fuel on healthrelated effects should be far less than for conventional diesel fuel (which has been provenon heavy-duty vehicles). It is interesting to note that no testing of unregulated emissionsfrom passenger cars running on this fuel has been carried out previously in Sweden. Thisis in contrast to the heavy-duty vehicles, where this fuel quality has been the topic of nu-merous emission tests.
3.3.4 Test matrixIn order to control the measurement accuracy and scatter, it would have been desirable torepeat the measurements several times, and (possibly) also to conduct a kind of back-to-back test. However, due to the limited budget available, this was not achievable. It shouldbe noted that the differences in emissions between the two types of fuels (petrol and diesel)generally are relatively great for most emission components. Similar conclusions can bedrawn about the difference between results for various test temperatures (-7 and +22°C).Thus, the differences that could be expected were, in general, relatively large compared tothe absolute emission level. Therefore, it was decided to conduct only one test of each
IntercomparisonIt should be noted that the purpose ofthe study was not to compare the prod-ucts from various car manufacturerswith one another. Instead, the objectivewas to show the impact of the two fu-els and the various technical solutionsused on the cars. Based on the resultsgenerated here it cannot be claimedthat one carmaker is “better” than theother carmaker from any particularaspect. Instead, it should be noted thatthe outcome could have been vastlydifferent if other car models had beencompared instead. In some cases, gen-eral conclusions can be made aboutcertain technologies or about the dif-ference between the two fuels. From ageneral point of view, it should benoted that engine (and vehicle) devel-opment is a highly dynamic processand therefore, conclusions that arevalid today might have to be changedin the near future.
Ecotraffic’s comments
Modern petrol and diesel cars
Ecotraffic ERD3 AB May 2002
15
kind, unless some error would occur. Repeating the tests would have necessitated a reduc-tion of the number of cars (from 4 to 2). Reducing the number of cars was not an issue,since additional cars would have been desirable instead in order to elucidate the impact ofvarious technical solutions.
In order to control that the cars were in good condition and that the emission level was cor-responding to the level from the certification data from the manufacturer, a comparisonbetween these data and the measured data was made. After the first test was conducted, itwas decided whether this car sample was representative or not. In all the four cases, thecars were considered to be very close to the certification data, as published by the certifi-cation agency VCA in the UK [8].
The following tests included in the test programme:
• NEDC test at +22°C• NEDC test at –7°C• US06 test• Overtaking, 70 – 110 km/h (simulating overtaking of a lorry), including steady-state
speed at 70 and 110 km/h (before and after overtaking)
All the latter two tests were conducted at “hot” conditions, i.e. a hot engine and at an ambi-ent temperature of +22°C. A more thorough description of the choice of test cycles is madebelow.
3.3.5 Emission measurementMost of the emission measurements were carried out in diluted exhaust from a full-flowdilution tunnel. Mass flow was kept constant using the principle of a critical flow venturi(so-called CVS, or Constant Volume Sampling).
In the overtaking test, emissions of the regulated gaseous emission compounds were meas-ured in raw exhaust. The instantaneous (raw) exhaust mass flow was calculated using CO2measurements in undiluted and diluted exhaust to determine the instantaneous dilutionfactor.
Regulated emissionsThe regulated gaseous emission components were measured with an emission instrumentfrom the Horiba Mexa 9000 series (9400 D).
Particulate matter was collected on 47-mm Teflon coated glass fibre filters, conditioned ina climatic chamber, and weighed on a microscale.
Measurement principles for the emission components mentioned above are listed in Table2.
Unregulated emissionsOf the unregulated emissions, as many compounds as possible were measured on-line. Amass-spectrometer (MS) was used for most of these emission components as shown inTable 2. The MS instrument used was a V&F Airsense 500, a soft ionisation mass spec-trometer.

Modern petrol and diesel cars
Ecotraffic ERD3 AB May 2002
16
Nitrous oxide (N2O) wasanalysed using GC/ECD. Thealdehydes (acetaldehyde andformaldehyde) were analysedby HPLC and acrylamide byHPLC/DAD.
Sampling for off-line chemi-cal analysis was made byusing impingers. The col-lected samples were stored ina freezer, and the analyseswere carried out in one batchfor each emission compo-nent.
PAC emissionsThe emissions of polycyclicaromatic compounds (PAC)comprise mostly of polycyc-lic aromatic hydrocarbons(PAH) but some compoundsalso contain other species buthydrogen and carbon, hencethe denotation “PAC”.
The PAC emissions weresampled from diluted exhauston both particulate and semi-volatile phases. Sampling ofthe PAC emissions was car-ried out for the whole drivingcycle. Particulate samplingwas carried out using 150-mm Teflon coated glass fibre filters (Pallflex T60A20, PallflexInc. USA). The filters were cleaned prior to sampling as described in detail elsewhere [9].Sampling of the semivolatile associated compounds was carried out downstream of thePallflex filter using Polyurethane Foam plugs (PUF), which were also precleaned prior tosampling [9]. After sampling the filters and PUFs were stored in a freezer.
The filters were Soxhlet extracted with dichloro methane (DCM) and the PUF plugs wereSoxhlet extracted with acetone. The crude extract was used for chemical analysis of PACemissions. The PAC was analysed using gas chromatography mass spectrometry, as previ-ously described [9]. Most of the previous analyses of PAC emissions have been carried outat the Stockholm University (R. Westerholm). Due to the time constraints for this project,the analysis was performed by Alcontrol Laboratories in Nyköping, Sweden. In the analy-sis, 12 tri+ PAC (3 or more rings) and 4 di+ PAH compounds were analysed. Previously,up to 29 tri+ compounds, and in some cases over 40 tri+ compounds, have been analysed[10].
Table 2: Measurement methods for emissions
Emission component Method of analysis
Total hydrocarbons (HC) Heated FIDCarbon monoxide (CO) NDIROxides of nitrogen (NOX) Chemiluminescence (CLA)Carbon dioxide (CO2) NDIRFuel consumption (FC) Carbon balancea
Particulate matter (PM) GravimetricBenzene MSEthene MSPropene MS1,3-Butadiene MSAmmonia (NH3) MSNitrous oxide (N2O) GC/ECDAcetaldehyde HPLCFormaldehyde HPLCAcrylamide HPLC/DADPAH GC/MSParticle size ELPI, SMPS
Notes:a Exhaust gas analysis of CO2, HC and CO is used to esti-
mate the fuel consumption.
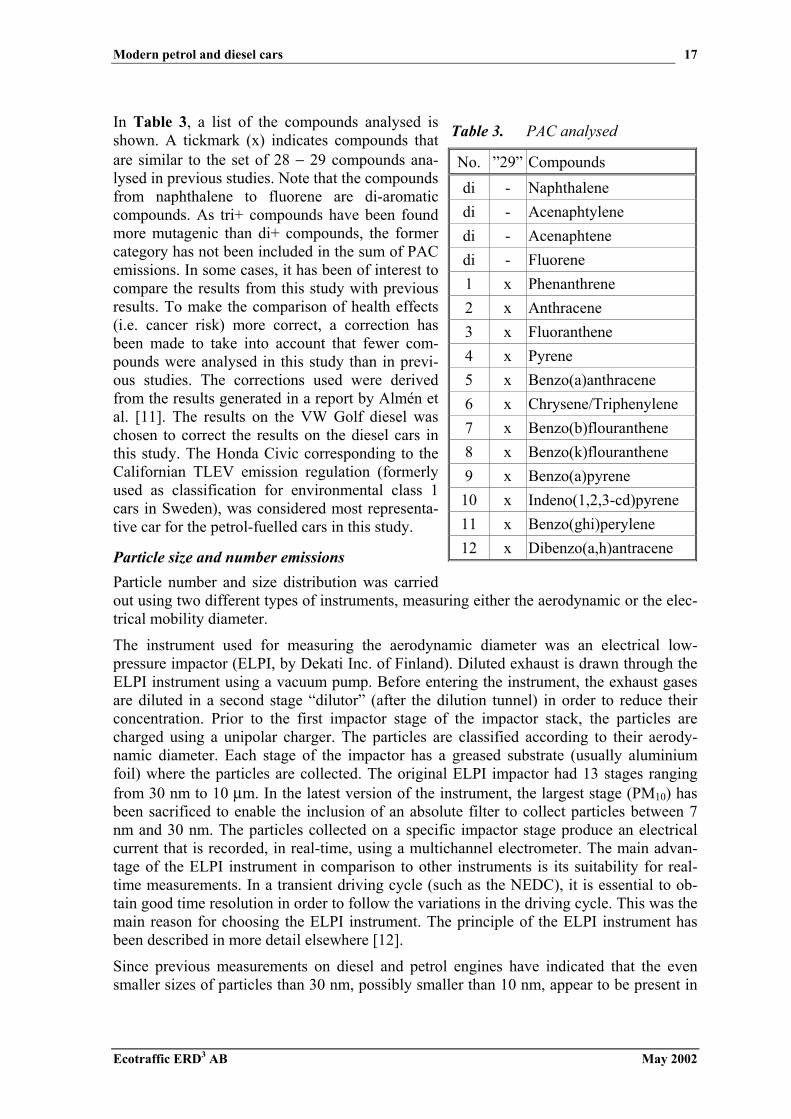
Modern petrol and diesel cars
Ecotraffic ERD3 AB May 2002
17
In Table 3, a list of the compounds analysed isshown. A tickmark (x) indicates compounds thatare similar to the set of 28 − 29 compounds ana-lysed in previous studies. Note that the compoundsfrom naphthalene to fluorene are di-aromaticcompounds. As tri+ compounds have been foundmore mutagenic than di+ compounds, the formercategory has not been included in the sum of PACemissions. In some cases, it has been of interest tocompare the results from this study with previousresults. To make the comparison of health effects(i.e. cancer risk) more correct, a correction hasbeen made to take into account that fewer com-pounds were analysed in this study than in previ-ous studies. The corrections used were derivedfrom the results generated in a report by Almén etal. [11]. The results on the VW Golf diesel waschosen to correct the results on the diesel cars inthis study. The Honda Civic corresponding to theCalifornian TLEV emission regulation (formerlyused as classification for environmental class 1cars in Sweden), was considered most representa-tive car for the petrol-fuelled cars in this study.
Particle size and number emissionsParticle number and size distribution was carriedout using two different types of instruments, measuring either the aerodynamic or the elec-trical mobility diameter.
The instrument used for measuring the aerodynamic diameter was an electrical low-pressure impactor (ELPI, by Dekati Inc. of Finland). Diluted exhaust is drawn through theELPI instrument using a vacuum pump. Before entering the instrument, the exhaust gasesare diluted in a second stage “dilutor” (after the dilution tunnel) in order to reduce theirconcentration. Prior to the first impactor stage of the impactor stack, the particles arecharged using a unipolar charger. The particles are classified according to their aerody-namic diameter. Each stage of the impactor has a greased substrate (usually aluminiumfoil) where the particles are collected. The original ELPI impactor had 13 stages rangingfrom 30 nm to 10 µm. In the latest version of the instrument, the largest stage (PM10) hasbeen sacrificed to enable the inclusion of an absolute filter to collect particles between 7nm and 30 nm. The particles collected on a specific impactor stage produce an electricalcurrent that is recorded, in real-time, using a multichannel electrometer. The main advan-tage of the ELPI instrument in comparison to other instruments is its suitability for real-time measurements. In a transient driving cycle (such as the NEDC), it is essential to ob-tain good time resolution in order to follow the variations in the driving cycle. This was themain reason for choosing the ELPI instrument. The principle of the ELPI instrument hasbeen described in more detail elsewhere [12].
Since previous measurements on diesel and petrol engines have indicated that the evensmaller sizes of particles than 30 nm, possibly smaller than 10 nm, appear to be present in
Table 3. PAC analysed
No. ”29” Compoundsdi - Naphthalenedi - Acenaphtylenedi - Acenaphtenedi - Fluorene1 x Phenanthrene2 x Anthracene3 x Fluoranthene4 x Pyrene5 x Benzo(a)anthracene6 x Chrysene/Triphenylene7 x Benzo(b)flouranthene8 x Benzo(k)flouranthene9 x Benzo(a)pyrene
10 x Indeno(1,2,3-cd)pyrene11 x Benzo(ghi)perylene12 x Dibenzo(a,h)antracene

Modern petrol and diesel cars
Ecotraffic ERD3 AB May 2002
18
great numbers, it was considered necessary to measure even smaller particles. Although thenewest version of the ELPI is capable of measuring particles down to 7 nm, it was of inter-est to extend the measurements even further towards smaller sizes. The Scanning MobilityParticle Sizer (SMPS) is an instrument that can measure particle size according to theelectrical mobility diameter. The advantage of these instruments is the great number ofchannels (sizes) but the drawback is that a measurement event (measuring all channels)usually lasts a couple of minutes. Therefore, these types of instruments are best suited forsteady-state measurements. To overcome this problem, the instrument was locked on acertain channel (size) to gain time resolution. In principle, repeating the measurementsseveral times could have provided data on a number of sizes. Such kind of measurementsare, however, very time consuming and, therefore, they are not considered practical. It wasdecided to measure the 5-nm size class only (according to the electrical mobility). Themeasurement interval for this channel was 4,7 − 5,2 nm. The use of more than one channelwould have been imperative on the time resolution, so this option had to be omitted.
Since the ELPI measures the aerodynamic diameter of the particles, comparison betweenthe results obtained using this instrument and other instruments, such as the SMPS/DMPStype of instruments, can be problematic. In order to be able to compare the results, the par-ticle density as a function of the size, must be known. In a previous project the author hasparticipated in, an evaluation of this kind was made [1]. The results for the intercomparisonof the two instruments were quite satisfactory, on the condition that corrections were madefor the varying particle density. However, one cannot assume that the particle density ob-tained from this experiment is universally applicable on the particulate emissions from allengines and fuels. Therefore, no recalculation of the electrical mobility diameter from theSMPS instrument to aerodynamic diameter was carried out. Thus, the results are not com-pared on the same diagrams either.
One important issue about particle size measurements to note is that the instrument set-upused in this study gives the total number of particles regardless of the composition of theparticles. Due to the low sulphur content of the fuel, sulphate formation should be insig-nificant. On the other hand, volatile particles could be generated due to nucleation. Someexperts claim, that only the solid particles pose a cancer risk. For example, this appears tobe the hypothesis used in evaluations in Germany, as a study commissioned by GermanUBA and managed by the Fraunhofer Institute shows [13]. However, since this hypothesisis not generally accepted in the scientific community, it was chosen to measure all particlesregardless of the nature of the particles. It should be noted that on-going work is trying toestablish an accepted methodology for measuring particle number and size distribution. Nosuch basic research was included in this study.
3.3.6 Driving cyclesThe current driving cycle used in Europe is usually called NEDC (New European DrivingCycle). All the cars had been certified according to this test cycle so was plausible to usethis cycle as one of the test cycles.
As the average load and the accelerations in the NEDC cycle are relatively low in compari-son to a more aggressive driving style, it was considered of interest to choose another cyclein addition to the mentioned cycle. Several official and unofficial cycle candidates wereconsidered. For example, the French Institute INRETS have developed several test cyclesthat are considered to represent modern driving style better than the current official test

Modern petrol and diesel cars
Ecotraffic ERD3 AB May 2002
19
cycles. However, it was decided to use the US06 driving cycle instead of some of the unof-ficial cycle candidates. The US06 cycle comprises heavier accelerations than the NEDCcycle but it also contain microtransients in comparison to the NEDC, which has large por-tions of constant velocity. Another difference is that the US06 cycle is started with a hotengine. In summary, it could be anticipated that some emission components would behigher in the US06 cycle than in the NEDC cycle, due to the significant difference betweenthe test cycles. Running an US06 cycle on a twin-roller chassis dynamometer sometimescause problems11. In these tests, the tyres on the petrol-fuelled Peugeot 307 were skiddingcausing it to be outside the tolerance for a total time of 23 seconds in this test cycle. Al-though this period was relatively short, it cannot be excluded that the results were affected.A slight underestimation of the emissions from this car in US06 could be the result. Therewere no such problems in the tests on the other cars.
As none of the test cycles demands the maximum possible acceleration of the vehicle, itwas decided to include measurement during an overtaking manoeuvre as well. The maxi-mum speed limit in Sweden is 110 km/h (on highways). Some vehicles are limited to 70km/h. Therefore, overtaking from 70 to 110 km/h is an example that is representative forSwedish driving conditions. In other countries in Europe, 80 to 120 km/h might have beenmore appropriate but this was not considered, as the maximum speed would be above themaximum speed limit in Sweden. During overtaking, the car would be run at the highestgear on full throttle without any downshifting. Since the gearbox of the VW Golf dieselhas 6 gears, it was decided to test this car both in 5th and 6th gear.
In Figure 2, a schematic representation of overtaking a lorry is shown. It is anticipated thatthe overtaking starts 100 m before the truck. This corresponds to about 5 seconds at aspeed of 70 km/h, although it is known that many drivers do not respect this distance as aproper safety margin. Since all the data in the overtaking test were logged it is, in principal,possible to evaluate an overtaking with a shorter (or longer) distance before the truck. Thelorry is anticipated to be 24 meters long and the car is approximated to be 4,5 meters long.In total, this equals a distance of 152,5 meters. Figure 2 shows a thin solid line for thedistance travelled by the truck and two dotted lines representing the same speed with a gapbefore (100 m) and after (24 m + 4,5 m) overtaking respectively. The solid line shows thespeed of the car, increasing from 70 km/h to 110 km/h in about 12 s and remaining con-stant after that. After about 17 s, the overtaking is completed.
11 The use of single roller dynamometers is the preferred solution for aggressive driving cycles as this cycle.

Modern petrol and diesel cars
Ecotraffic ERD3 AB May 2002
20
Schematic illustration of overtaking of a lorry
-200
-100
0
100
200
300
400
500
0 2 4 6 8 10 12 14 16 18 20
Time (s)
Dis
tanc
e (m
)
d-truckd, v=70 (-A)d, v=70 (+B)d, v=110d-car
Notes:d: distancev: vehicle speed (km/h)A: dist. before overtakingB: dist. after overtaking
Here 110 km/h is reached
Overtaking is finished
100 m
A= 100 m + 24 m
24 m24 m
B= 24 m + 4,5 m
152,5 m
Figure 2. Schematic illustration of overtaking
3.4 Calculation of effectsTo calculate the effects of the exhaust emissions, a methodology used previously by theauthor has been used also in this study. Since this methodology has been described in moredetail elsewhere [1, 14], no more than a brief overview is provided here. However, in somecases modifications to the calculation scheme has been made and in these cases, a moredetailed description is provided. As in the previous work, only the NEDC driving cycle hasbeen used in the evaluation, although US06 and overtaking was included in this test pro-gramme.
The effects of primary interest have been grouped in local, regional and global effectsalong with the corresponding emission components. These effects are:
Local effects, acute respiratory diseases Ozone (O3) forming potential (NOX and organic gases) Nitrogen dioxide (NO2) Organic gases such as, e.g. aldehydes Particulate matter (PM)
Local effects, cancer risk (numerous emission components) Regional effects
Vegetation injury (NOX, SOX and O3) Visibility (particulate matter and droplets) Acidification (NOX, SOX and NH3) Eutrophication (NOX, and NH3)
Global effects

Modern petrol and diesel cars
Ecotraffic ERD3 AB May 2002
21
Climate change (fossil CO2, CH4, N2O, etc.) Resource use
To simplify the presentation of the results, not all the effects listed above are covered inseparate sections, since a certain emission component sometimes is responsible for severaleffects.
3.4.1 Lifecycle perspectiveThe effects mentioned above can be classified as local, regional and global effects. In or-der to obtain some life cycle perspective on the investigated effects, the fuel cycle emis-sions have also been included for the regional and the global effects. In those cases, thepollution from the vehicle and from the fuel cycle have been shown separately.
Data for the fuel cycle emissions have been collected from a previously published reportby Ecotraffic, “Life of Fuels” (LoF) [15]. The emissions for vehicle production, scrapping,maintenance etc. are not included in the LoF report. However, it is anticipated that the dif-ference between the investigated fuel/engine options is small in this respect.
3.4.2 Respiratory diseases − acute
Ozone forming potentialOzone was identified as an irritant component in a Swedish governmental investigation onenvironment and health and a long-term target for the reduction of ozone has been set (80µg/m3, hourly avg.) [16]. Ozone formation in populated areas is generally limited by theVOC (volatile organic compounds) concentration.
In a previous investigation by this author, a reactivity adjustment factor (RAF) that was1,32 times higher for diesel fuel than petrol was used. This factor was derived using inputdata from an investigation by Bach et al. at EMPA [17]. The RAF was obtained by inter-polating data for +7°C. Other papers of interest in this area have been published by Deckeret al. [18] and Neumann et al. [19], from VW in both cases.
Since ozone formation is higher during the summer than in the winter, a higher than yearlyaverage temperature has been used in this study for evaluating the HC emissions. A tem-perature of +14°C was considered a reasonable average during the ozone season. Data byBach et al. evaluated for +14°C gave a reactivity adjustment factor (RAF) that was 1,26higher for diesel fuel than for petrol. However, the RAF data need to be corrected by tak-ing into account the improvement of new petrol and diesel fuels qualities. No recent datafor the Swedish fuel qualities have been published so the corrections had to be derivedfrom data published elsewhere. The RAF for petrol was corrected by 0,977 in the re-evaluation of the 93/94 test results and by 0,94 for the cars tested in this study to take intoaccount the potential improvement of petrol fuel. Both these corrections were derived fromdata by CARB in California. The factor mentioned later was valid for LEV cars and there-fore, it was considered more appropriate for the new cars tested in this study. Since thereformulated petrol used in the USA also reduces the emissions of HC and VOC species,the (total) reduction of ozone formation is significantly greater than the reduction of theRAF. It could be mentioned that the RAF levels in the previously mentioned study byDecker was slightly different compared to the CARB data.

Modern petrol and diesel cars
Ecotraffic ERD3 AB May 2002
22
The paper by Neumann investigated the impact of Swedish EC1 diesel fuel on RAF andfound a decrease by some 33% for the EC1 fuel in comparison to reference diesel fuel[19]. Considering this correction in addition to the corrections for petrol fuel, yields theRAF levels shown in Table 4. Petrol is used as refer-ence in the left column and diesel is the reference in theright column.
Table 4 shows a relatively small difference in RAFlevel between the fuels and in fact, the level is lower fordiesel fuel. This is due to that the relative improvementby reformulating the diesel fuel has been greater than inthe petrol case. However, it should be noted that thereformulated petrol also reduces the HC emissions.
NO2
Generally, the NO share of the total NOX emissions is much higher than the share of NO2.Since NO2 is the more harmful component, a high share of NO2 in the exhaust is not desir-able. However, most of the NOX is converted to NO2 in the atmosphere. It has been shownthat some catalytic aftertreatment devices, such as oxidising catalysts and DPFs used onheavy-duty engines, could increase the share of NO2 under some driving conditions [20,21]. Thus, the inhaled NO2 from these vehicles could become higher than for vehicles thatdo not convert NO to NO2. Unfortunately, the NO2 emissions could not be measured sepa-rately on-line in this study. The total NOX has been used the evaluation, as an indication ofthe potential NO2 formation. Detailed simulation of the atmosphere chemistry would benecessary to refine the analysis.
AldehydesOf the organic gases, the aldehydes are particularly irritant components and therefore theseemissions are compared separately in addition to the other components described above.There is a clear difference between formaldehyde and acetaldehyde in this respect, as for-maldehyde appears to be much more potent than acetaldehyde.
Particulate matterParticulate matter has been identified as a component causing respiratory diseases [22].Several epidemiological studies have shown, by using statistical methods, that the dailymortality and morbidity correlate with increases in particulate air pollution. A paper byPope et al. is one example of one of the first papers published in this field [23]. Thus, par-ticulate emissions are considered one of the most important emission components to inves-tigate.
Table 4. Reactivity adjust-ment factor (RAF)
Fuel RAFPetrol 1,00 1,19Diesel 0,84 1,00

Modern petrol and diesel cars
Ecotraffic ERD3 AB May 2002
23
3.4.3 Respiratory diseases − cancer riskThe cancer risk factors for theemission components of interestvary significantly depending onthe sources used. It should benoted that the uncertainty re-garding the data for cancer riskfactor assessments is great.Therefore, the results for thiseffect also involve more uncer-tainty than the other investigatedeffects. Several sets of risk fac-tors are also available from or-ganisations such as, for example,U.S. EPA, CARB, CAPCOAand OEHHA of Cal. EPA [25 –29]. A review draft version ofthe latest evaluation by EPA ofcancer risk factors is available(July 2000), but the review hasnot yet been finalised [30].
In this study, the unit risk factors(URFs) by the Swedish re-searchers Törnqvist and Ehren-berg [31] have been used exten-sively as the basis for theevaluation of cancer risk. One ofthe features of the risk factors byTörnqvist and Ehrenberg is that they also consider other forms of cancer than lung cancerand other routes of uptake besides inhalation (e.g. food chain). Their risk estimates havebeen the basis for SEPA in setting the reduction targets of hazardous compounds in ambi-ent air. The URFs used in this study are listed in Table 5 and compared to those by USEPA and OEHHA. The unit risk factors in Table 5 are expressed as the individual mortal-ity risk at a lifetime (70 years) exposure of 1 µg/m3 for each component.
The risk estimate on particulate matter is based on the total particulate mass, as very littledata is available on the impact by particle size on the cancer risk. In the previously men-tioned study published by UBA [13] the mass of the insoluble particles were used. Theshare of the insoluble particles was based on estimations. In this study, no particulateanalysis was performed.
Ethene and propene are included by Törnqvist and Ehrenberg among the components dueto the proven metabolism similarity to that of 1,3 butadiene [31]. The URF for ethene andpropene, which are active through their monoepoxides, have been derived by the dosime-try-rad equivalence method, using γ-radiation as reference standard. EPA and OEHHA useno URFs for ethene and propene.
The URF of formaldehyde is one order of magnitude or more in the evaluation by Törn-qvist and Ehrenberg compared to the two other sets of URFs in Table 5.
Table 5. Unit risk factors for cancer (*10-6)
Component Törnqvist &Ehrenberg
U.S. EPA1990
OEHHA1999
Particulates 70 70 300Benzene 8 8 29Ethene 50 (5)a -b
Propene 10 (1)a -b
1,3-Butadiene 300 300 170Formaldehyde 100 10 6Acetaldehyde 2 2 2.7PAC 28 000c 4 000 1 100
Notes:a EPA has not assigned any URFs for ethene and pro-
pene. The data shown in the table above have been cal-culated by Törnqvist and Ehrenberg assuming the samepotency as 5% of the corresponding epoxides, hence theparenthesis.
b OEHHA has not assigned any URFs for ethene andpropene.
c PAC in this case is defined as tri-aromatics+. Thesecomponents are known to be the biologically most ac-tive components [24].
Modern petrol and diesel cars
Ecotraffic ERD3 AB May 2002
24
In previous studies by this author, PAC has been defined as the sum of 29 different com-pounds. As the only 12 PACs were measured in this case, a correction was made to con-sider this. Most of the PACs are PAHs (Polycyclic Aromatic Hydrocarbons). The majordifference between the URF for PAC is due to that Törnqvist and Ehrenberg (besides tak-ing other forms of cancer than lung cancer into account) also considers other routes of up-take than inhalation (food chain).
3.4.4 Regional effects
AcidificationThe NOX emissions are the main contributor to the acidification from heavy-duty vehiclesin Sweden, since all fuels in use (except diesel fuel quality according to the Europeanspecification) have very low sulphur content. The NOX emissions from fuel productionhave been obtained from the LoF report [15], and the NOX emissions from the vehicleshave been collected from the compiled emission data, as described earlier.
The SOX emissions have been calculated using the sulphur content of the fuels. In case ofdiesel fuel, the EC1 fuel has a limit of 10 ppm sulphur but since the industry average gen-erally is much less than this limit, a level of 4 ppm has been used instead. This is consid-erably lower than the current European specification at 350 ppm. Petrol fuel according tothe Euro IV (2005) and Swedish EC1 petrol fuel specification (<50 ppm S) was anticipatedfor the passenger cars and a level of 30 ppm was assumed for the calculation.
The level of NH3 is generally low from diesel vehicles. For example, Almén found a levelas low as 3 mg/km on two diesel-fuelled trucks [32]. The NH3 emissions from petrol-fuelled cars vary from very low levels to high levels under certain driving conditions (highload and cold start). Since NH3 was measured in this study, the data generated have beenused in calculation of the acidification. When comparisons are made with older results, itshould be noted that the contribution from NH3 was not considered in the old data.
EutrophicationEutrophication comprises the impact of NH3 and NOX. In the evaluation, both these com-pounds have been used without any specific weighting factor for each component. N2Owas not considered, since it is not deposited at such a high rate as the two other emissioncomponents. Instead, the long life of N2O in the atmosphere implies that its contribution tothe climate change should be taken into account.
3.4.5 Global effects
Climate changeMost of the greenhouse gas (GHG) emissions can be attributed to fossil CO2. In somecases, methane (CH4) and NOX can also be of significant importance. The data used in thecalculations of climate change are shown in Table 6.
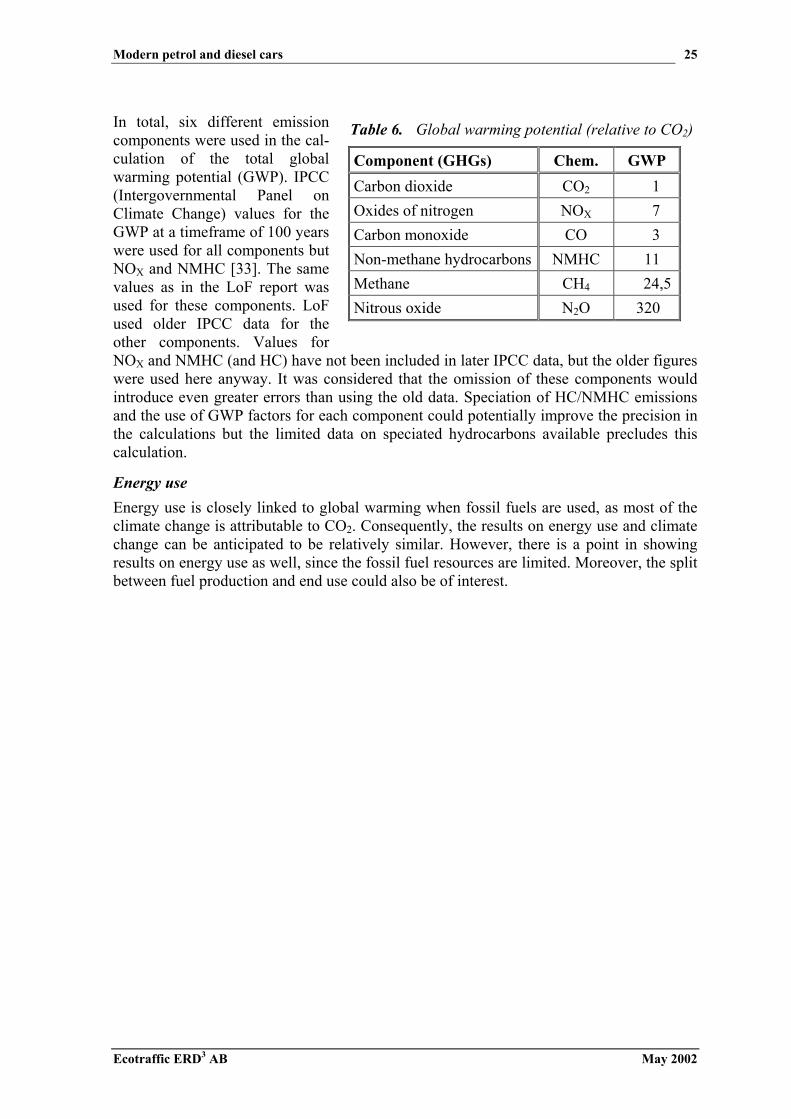
Modern petrol and diesel cars
Ecotraffic ERD3 AB May 2002
25
In total, six different emissioncomponents were used in the cal-culation of the total globalwarming potential (GWP). IPCC(Intergovernmental Panel onClimate Change) values for theGWP at a timeframe of 100 yearswere used for all components butNOX and NMHC [33]. The samevalues as in the LoF report wasused for these components. LoFused older IPCC data for theother components. Values forNOX and NMHC (and HC) have not been included in later IPCC data, but the older figureswere used here anyway. It was considered that the omission of these components wouldintroduce even greater errors than using the old data. Speciation of HC/NMHC emissionsand the use of GWP factors for each component could potentially improve the precision inthe calculations but the limited data on speciated hydrocarbons available precludes thiscalculation.
Energy useEnergy use is closely linked to global warming when fossil fuels are used, as most of theclimate change is attributable to CO2. Consequently, the results on energy use and climatechange can be anticipated to be relatively similar. However, there is a point in showingresults on energy use as well, since the fossil fuel resources are limited. Moreover, the splitbetween fuel production and end use could also be of interest.
Table 6. Global warming potential (relative to CO2)
Component (GHGs) Chem. GWPCarbon dioxide CO2 1Oxides of nitrogen NOX 7Carbon monoxide CO 3Non-methane hydrocarbons NMHC 11Methane CH4 24,5Nitrous oxide N2O 320
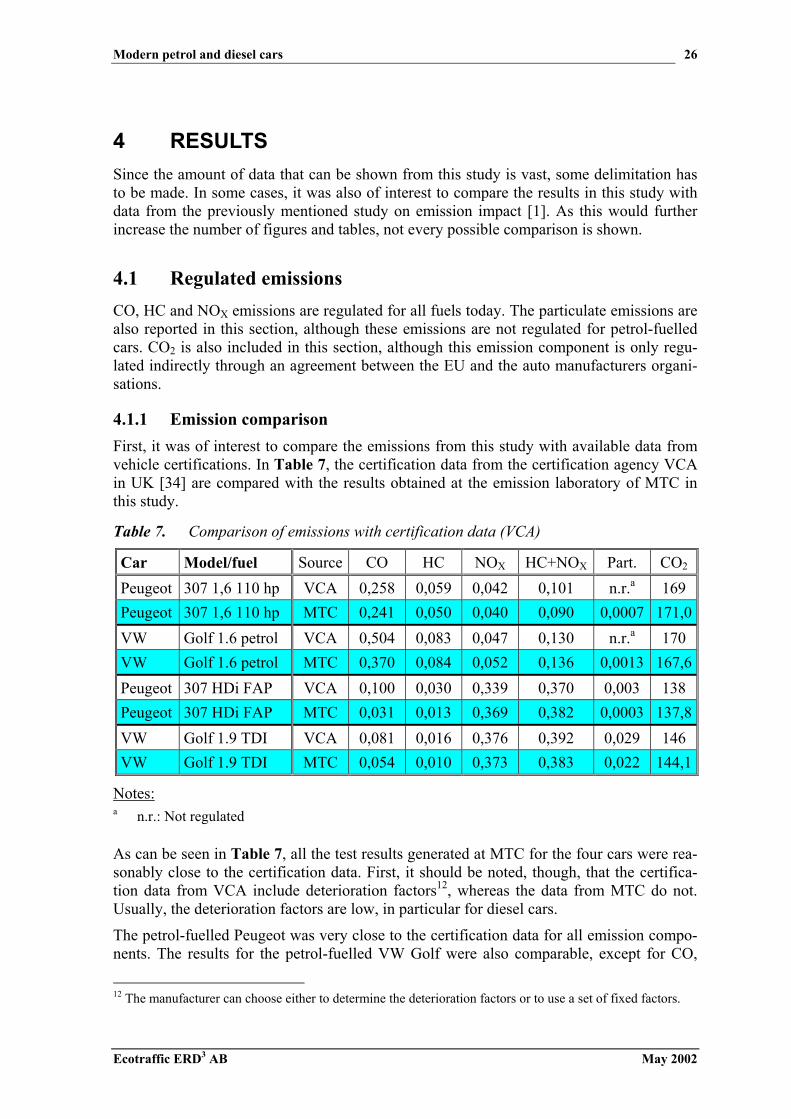
Modern petrol and diesel cars
Ecotraffic ERD3 AB May 2002
26
4 RESULTSSince the amount of data that can be shown from this study is vast, some delimitation hasto be made. In some cases, it was also of interest to compare the results in this study withdata from the previously mentioned study on emission impact [1]. As this would furtherincrease the number of figures and tables, not every possible comparison is shown.
4.1 Regulated emissionsCO, HC and NOX emissions are regulated for all fuels today. The particulate emissions arealso reported in this section, although these emissions are not regulated for petrol-fuelledcars. CO2 is also included in this section, although this emission component is only regu-lated indirectly through an agreement between the EU and the auto manufacturers organi-sations.
4.1.1 Emission comparisonFirst, it was of interest to compare the emissions from this study with available data fromvehicle certifications. In Table 7, the certification data from the certification agency VCAin UK [34] are compared with the results obtained at the emission laboratory of MTC inthis study.
Table 7. Comparison of emissions with certification data (VCA)
Car Model/fuel Source CO HC NOX HC+NOX Part. CO2
Peugeot 307 1,6 110 hp VCA 0,258 0,059 0,042 0,101 n.r.a 169Peugeot 307 1,6 110 hp MTC 0,241 0,050 0,040 0,090 0,0007 171,0VW Golf 1.6 petrol VCA 0,504 0,083 0,047 0,130 n.r.a 170VW Golf 1.6 petrol MTC 0,370 0,084 0,052 0,136 0,0013 167,6Peugeot 307 HDi FAP VCA 0,100 0,030 0,339 0,370 0,003 138Peugeot 307 HDi FAP MTC 0,031 0,013 0,369 0,382 0,0003 137,8VW Golf 1.9 TDI VCA 0,081 0,016 0,376 0,392 0,029 146VW Golf 1.9 TDI MTC 0,054 0,010 0,373 0,383 0,022 144,1
Notes:a n.r.: Not regulated
As can be seen in Table 7, all the test results generated at MTC for the four cars were rea-sonably close to the certification data. First, it should be noted, though, that the certifica-tion data from VCA include deterioration factors12, whereas the data from MTC do not.Usually, the deterioration factors are low, in particular for diesel cars.
The petrol-fuelled Peugeot was very close to the certification data for all emission compo-nents. The results for the petrol-fuelled VW Golf were also comparable, except for CO,
12 The manufacturer can choose either to determine the deterioration factors or to use a set of fixed factors.
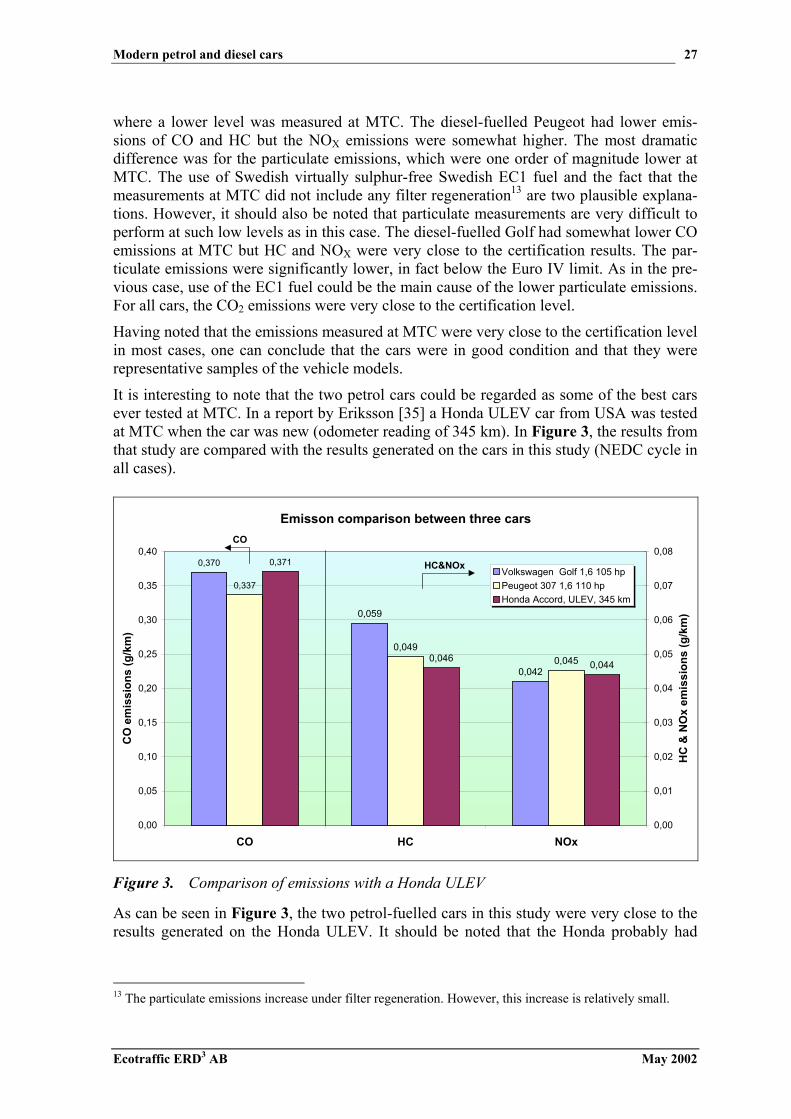
Modern petrol and diesel cars
Ecotraffic ERD3 AB May 2002
27
where a lower level was measured at MTC. The diesel-fuelled Peugeot had lower emis-sions of CO and HC but the NOX emissions were somewhat higher. The most dramaticdifference was for the particulate emissions, which were one order of magnitude lower atMTC. The use of Swedish virtually sulphur-free Swedish EC1 fuel and the fact that themeasurements at MTC did not include any filter regeneration13 are two plausible explana-tions. However, it should also be noted that particulate measurements are very difficult toperform at such low levels as in this case. The diesel-fuelled Golf had somewhat lower COemissions at MTC but HC and NOX were very close to the certification results. The par-ticulate emissions were significantly lower, in fact below the Euro IV limit. As in the pre-vious case, use of the EC1 fuel could be the main cause of the lower particulate emissions.For all cars, the CO2 emissions were very close to the certification level.
Having noted that the emissions measured at MTC were very close to the certification levelin most cases, one can conclude that the cars were in good condition and that they wererepresentative samples of the vehicle models.
It is interesting to note that the two petrol cars could be regarded as some of the best carsever tested at MTC. In a report by Eriksson [35] a Honda ULEV car from USA was testedat MTC when the car was new (odometer reading of 345 km). In Figure 3, the results fromthat study are compared with the results generated on the cars in this study (NEDC cycle inall cases).
Emisson comparison between three cars
0,370
0,337
0,371
0,059
0,042
0,0490,0450,046
0,044
0,00
0,05
0,10
0,15
0,20
0,25
0,30
0,35
0,40
CO HC NOx
CO
em
issi
ons
(g/k
m)
0,00
0,01
0,02
0,03
0,04
0,05
0,06
0,07
0,08
HC
& N
Ox
emis
sion
s (g
/km
)
Volkswagen Golf 1,6 105 hpPeugeot 307 1,6 110 hpHonda Accord, ULEV, 345 km
CO
HC&NOx
Figure 3. Comparison of emissions with a Honda ULEV
As can be seen in Figure 3, the two petrol-fuelled cars in this study were very close to theresults generated on the Honda ULEV. It should be noted that the Honda probably had
13 The particulate emissions increase under filter regeneration. However, this increase is relatively small.

Modern petrol and diesel cars
Ecotraffic ERD3 AB May 2002
28
been optimised for the US FTP-75 driving cycle, whereas the two petrol cars in this studyhad been optimised for the NEDC cycle.
To indicate the potential emission deterioration of new low-emission petrol-fuelled cars,the results from the study by Eriksson are compared with results that have been generatedmore recently by Lu Karlsson on the same car [36]. This comparison is shown in Figure 4.
Emisson deterioration for a Honda ULEV car
0,371
0,57
0,046 0,044
0,10
0,07
0
0,1
0,2
0,3
0,4
0,5
0,6
CO HC NOx
CO
em
issi
ons
(g/k
m)
0,00
0,02
0,04
0,06
0,08
0,10
0,12
HC
& N
Ox
emis
sion
s (g
/km
)
Honda Accord, ULEV, 345 kmHonda Accord, ULEV, 90285 km
CO HC&NOx
Figure 4. Emission deterioration for the Honda ULEV
The results in Figure 4 show that a deterioration by approximately a factor of two, orsomewhat less, could be expected for a mileage of 90 000 km, i.e. roughly half the usefullife of the car. This is consistent with the factor obtained on older cars [1], although theinitial emission level for new cars is considerably lower. Consequently, the deterioration inabsolute numbers (g/km) is far less for new cars compared to old cars.
A few comments on the deterioration of diesel cars might be of interest to add. It could beanticipated that the deterioration for NOX emissions would be very low for new diesel carssimilarly to the results for old cars14. As the CO and HC emissions are largely influencedby catalyst efficiency for new diesel cars, the deterioration factor might be on a similarlevel as for petrol-fuelled cars. However, the deterioration in absolute numbers would belower due to the low engine-out levels in this case.
As mentioned before, no estimate of deterioration has been made in this study. Therefore,the comparisons with older data, where deterioration has been taken into account, are morefavourable than what could be expected if deterioration would be considered also in thiscase.
14 The deterioration for an average fleet of diesel cars could be attributable to some extent to EGR failure ona percentage of cars, as the wear of engine components generally reduces NOX emissions on diesel engines.

Modern petrol and diesel cars
Ecotraffic ERD3 AB May 2002
29
4.1.2 Structure of figuresMost of the figures shown below are organised in a similar way. Petrol cars are shown tothe left in the figures and diesel cars to the right. However, in most of the discussion, petrolcars are compared to the diesel counterparts, as this comparison is more valid. The readershould also note that short vehicle denotations are used instead of long names. The denota-tions used in the figures are:
• SI-P: Petrol-fuelled Peugeot 307• SI-G: Petrol-fuelled VW Golf• CI-CR/DPF: Diesel-fuelled Peugeot 307 with common rail (CR) injection and diesel
particulate filter (DPF)• CI-UI/HP: Diesel-fuelled VW Golf with high-pressure (HP) unit injectors (UI)
4.1.3 CO emissionsThe CO emissions in the NEDC test cycle at the two ambient temperatures (+22 and –7°C)are shown in Figure 5.
CO emissions in NEDC at +22°C and -7°C
0,031
0,88
1,04
0,10 0,110,054
0,37
0,24
0,0
0,2
0,4
0,6
0,8
1,0
1,2
SI-P SI-G CI-CR/DPF CI-UI/HP
CO
em
issi
ons
(g/k
m)
Temperature: +22°C
Temperature: -7°C
DieselPetrol
Figure 5. CO emissions in NEDC at +22°C and –7°C
As expected, the CO level was significantly lower for the diesel cars compared to their pet-rol counterparts (Figure 5). The ratio was almost one order of magnitude regardless of theambient temperature. At the lower temperature, the CO emissions increased for both fuels.Since the level was generally higher for the petrol than for the diesel cars, the increase inabsolute numbers by decreasing temperature was also greater.

Modern petrol and diesel cars
Ecotraffic ERD3 AB May 2002
30
In spite of the increase of CO emissions at lower ambient temperature, both the petrol carswere far below the cold start limit set at this temperature for the UDC part of the cycle inthe current EU regulation. This supplement to the limits at “normal” test temperature isenforced in EU regulations from 2002. The CO emissions in UDC for these cars, at 1,9 and2,8 g/km respectively, were 5 to 8 times below the limit of 15 g/km. This indicates a con-siderable margin to the limit value for this emission compound.
In Figure 6, the CO emissions in the US06 driving cycle and for the fictive overtaking of alorry are shown. The emissions for both test cycles are expressed in g/km. As both tests areperformed with hot starts, high catalyst activity on the CO emissions could be expected forpetrol-fuelled cars. Note that the overtaking test was carried out in both 5th and 6th gear forthe diesel-fuelled VW Golf.
CO emissions in US06 and during overtaking
0,009 0,0000,001 0,000 0,001
0,71
1,60
n.m.
7,0714,54
0,0
0,5
1,0
1,5
2,0
2,5
3,0
3,5
4,0
SI-P SI-G CI-CR/DPF CI-UI/HP (5) CI-UI/HP (6)
CO
em
issi
ons
(g/k
m)
US06 cycleOvertaking
DieselPetrol
The CI-UI/HP car was tested both in 5th and in 6th gear during overtaking
Figure 6. CO emissions in US06 and during overtaking
The CO levels for the petrol cars were higher in the US06 driving cycle than in NEDC,whereas the levels for the diesel cars were practically zero (Figure 6). The more aggres-sive driving pattern in US06 explains the higher CO level for the petrol cars, as fuel en-richment is likely to be used in some of the phases in the test cycle. A hot catalyst for thediesel cars practically eliminates the CO emissions. This is in contrast to the results fromthe NEDC cycle when the low engine load in the UDC phase causes a long period beforecatalyst light-off occurs.
The increase in CO emissions in the overtaking test was dramatic for the petrol cars (notethat the bars are out of scale). The ratio of these emissions (in g/km) was 20 and 60 timeshigher respectively than in the NEDC test. As the overtaking proceed for about 0,5 km, thisimplies that the CO emissions during overtaking is equal to a distance of 10 and 33 kmdriven with the same emission factors as NEDC. As most of the CO emissions in NEDCare generated during the cold start, the relative difference would be even greater if a com-

Modern petrol and diesel cars
Ecotraffic ERD3 AB May 2002
31
parison would be made with the emission level for a hot start or at constant speed. How-ever, as such comparisons often tend to become somewhat speculative and in some casesirrelevant, they are not included here15.
In view of the relatively high CO emissions for the petrol cars at low ambient temperature,and in test cycles with higher accelerations, it is obvious that results from the NEDC testcycle cannot be generalised for all driving conditions. Much work would be needed tocompile a new test cycle that is representative for all driving conditions.
It should be noted that the CO levels from new cars are decreasing due to the significantimpact on CO emissions by the catalyst. As the non-catalyst cars are continuously beingreplaced, the health problems related to the CO emissions are gradually diminishing.
4.1.4 HC emissionsThe HC emissions in the NEDC test cycle at the two ambient temperatures are shown inFigure 7. As expected, the HC emissions were higher for the petrol cars than for the dieselcars. By lowering the ambient temperature, the HC level increased by a factor of 4 to 6 forthe petrol cars. Compared to the cold start limit of 1,8 g/km for the HC emissions in UDC,the level at 0,5 g/km was significantly less for one car. The other car, at a level of 1,4g/km, was also below the limit. In both cases, the margin was less than for CO, as shownabove.
HC emissions in NEDC at +22°C and -7°C
0,013 0,010
0,20
0,52
0,05
0,08
0,0120,027
0,0
0,1
0,2
0,3
0,4
0,5
0,6
SI-P SI-G CI-CR/DPF CI-UI/HP
HC
em
issi
ons
(g/k
m)
Temperature: +22°C
Temperature: -7°C
DieselPetrol
Figure 7. HC emissions in NEDC at +22°C and –7°C
As for the CO emissions, the level of HC emissions was generally lower for the diesel carsthan for the petrol cars. Note that the HC level for the diesel cars was close to the detectionlevel for contemporary instruments and test methodology used (measurement in diluted 15 Data at constant speed at 90 and 110 km/h are available for such calculations if it would be of interest.
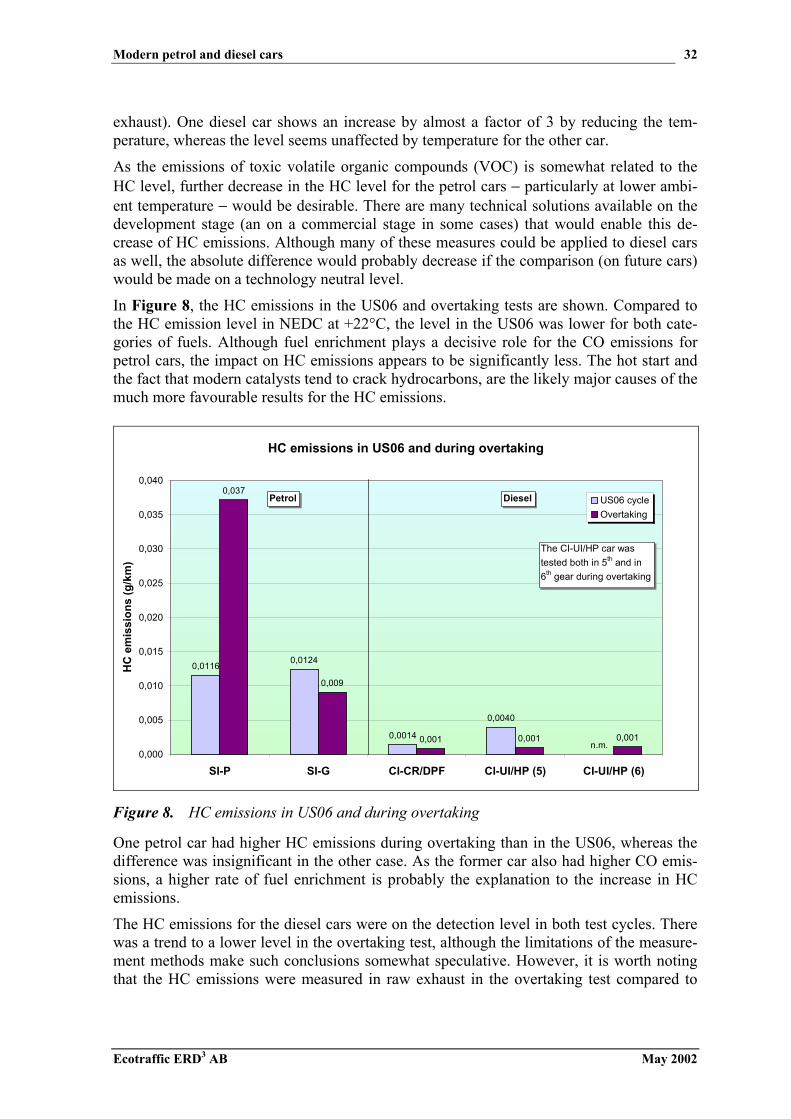
Modern petrol and diesel cars
Ecotraffic ERD3 AB May 2002
32
exhaust). One diesel car shows an increase by almost a factor of 3 by reducing the tem-perature, whereas the level seems unaffected by temperature for the other car.
As the emissions of toxic volatile organic compounds (VOC) is somewhat related to theHC level, further decrease in the HC level for the petrol cars − particularly at lower ambi-ent temperature − would be desirable. There are many technical solutions available on thedevelopment stage (an on a commercial stage in some cases) that would enable this de-crease of HC emissions. Although many of these measures could be applied to diesel carsas well, the absolute difference would probably decrease if the comparison (on future cars)would be made on a technology neutral level.
In Figure 8, the HC emissions in the US06 and overtaking tests are shown. Compared tothe HC emission level in NEDC at +22°C, the level in the US06 was lower for both cate-gories of fuels. Although fuel enrichment plays a decisive role for the CO emissions forpetrol cars, the impact on HC emissions appears to be significantly less. The hot start andthe fact that modern catalysts tend to crack hydrocarbons, are the likely major causes of themuch more favourable results for the HC emissions.
HC emissions in US06 and during overtaking
0,0116 0,0124
0,0014
0,0040
0,037
0,009
0,001 0,001 0,001n.m.
0,000
0,005
0,010
0,015
0,020
0,025
0,030
0,035
0,040
SI-P SI-G CI-CR/DPF CI-UI/HP (5) CI-UI/HP (6)
HC
em
issi
ons
(g/k
m)
US06 cycleOvertaking
DieselPetrol
The CI-UI/HP car was tested both in 5th and in 6th gear during overtaking
Figure 8. HC emissions in US06 and during overtaking
One petrol car had higher HC emissions during overtaking than in the US06, whereas thedifference was insignificant in the other case. As the former car also had higher CO emis-sions, a higher rate of fuel enrichment is probably the explanation to the increase in HCemissions.
The HC emissions for the diesel cars were on the detection level in both test cycles. Therewas a trend to a lower level in the overtaking test, although the limitations of the measure-ment methods make such conclusions somewhat speculative. However, it is worth notingthat the HC emissions were measured in raw exhaust in the overtaking test compared to
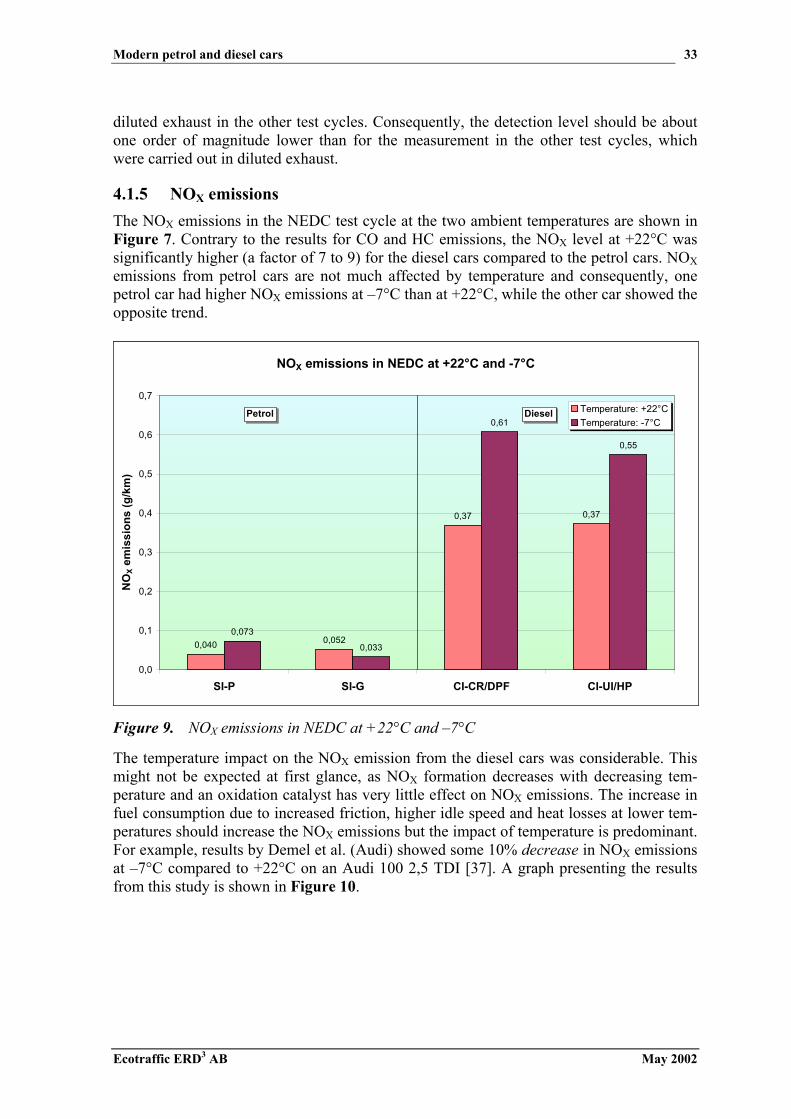
Modern petrol and diesel cars
Ecotraffic ERD3 AB May 2002
33
diluted exhaust in the other test cycles. Consequently, the detection level should be aboutone order of magnitude lower than for the measurement in the other test cycles, whichwere carried out in diluted exhaust.
4.1.5 NOX emissionsThe NOX emissions in the NEDC test cycle at the two ambient temperatures are shown inFigure 7. Contrary to the results for CO and HC emissions, the NOX level at +22°C wassignificantly higher (a factor of 7 to 9) for the diesel cars compared to the petrol cars. NOXemissions from petrol cars are not much affected by temperature and consequently, onepetrol car had higher NOX emissions at –7°C than at +22°C, while the other car showed theopposite trend.
NOX emissions in NEDC at +22°C and -7°C
0,040 0,052
0,37 0,37
0,073
0,033
0,55
0,61
0,0
0,1
0,2
0,3
0,4
0,5
0,6
0,7
SI-P SI-G CI-CR/DPF CI-UI/HP
NO
X em
issi
ons
(g/k
m)
Temperature: +22°CTemperature: -7°C
DieselPetrol
Figure 9. NOX emissions in NEDC at +22°C and –7°C
The temperature impact on the NOX emission from the diesel cars was considerable. Thismight not be expected at first glance, as NOX formation decreases with decreasing tem-perature and an oxidation catalyst has very little effect on NOX emissions. The increase infuel consumption due to increased friction, higher idle speed and heat losses at lower tem-peratures should increase the NOX emissions but the impact of temperature is predominant.For example, results by Demel et al. (Audi) showed some 10% decrease in NOX emissionsat –7°C compared to +22°C on an Audi 100 2,5 TDI [37]. A graph presenting the resultsfrom this study is shown in Figure 10.
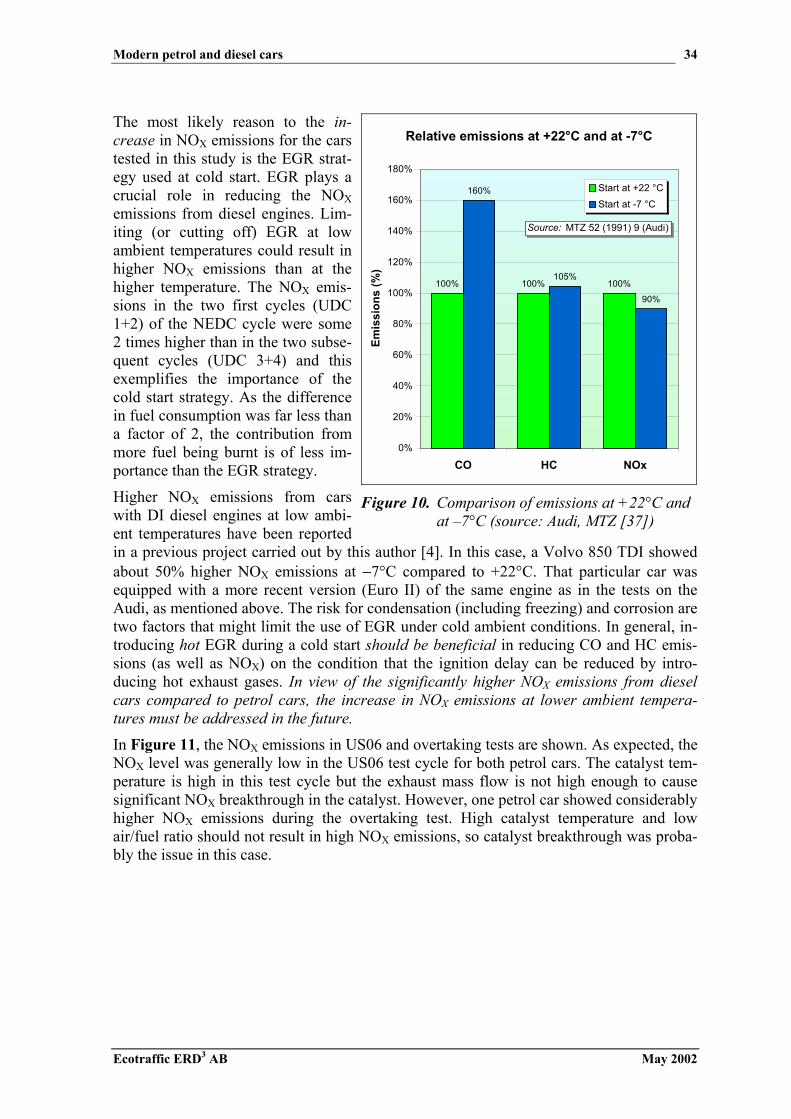
Modern petrol and diesel cars
Ecotraffic ERD3 AB May 2002
34
The most likely reason to the in-crease in NOX emissions for the carstested in this study is the EGR strat-egy used at cold start. EGR plays acrucial role in reducing the NOXemissions from diesel engines. Lim-iting (or cutting off) EGR at lowambient temperatures could result inhigher NOX emissions than at thehigher temperature. The NOX emis-sions in the two first cycles (UDC1+2) of the NEDC cycle were some2 times higher than in the two subse-quent cycles (UDC 3+4) and thisexemplifies the importance of thecold start strategy. As the differencein fuel consumption was far less thana factor of 2, the contribution frommore fuel being burnt is of less im-portance than the EGR strategy.
Higher NOX emissions from carswith DI diesel engines at low ambi-ent temperatures have been reportedin a previous project carried out by this author [4]. In this case, a Volvo 850 TDI showedabout 50% higher NOX emissions at −7°C compared to +22°C. That particular car wasequipped with a more recent version (Euro II) of the same engine as in the tests on theAudi, as mentioned above. The risk for condensation (including freezing) and corrosion aretwo factors that might limit the use of EGR under cold ambient conditions. In general, in-troducing hot EGR during a cold start should be beneficial in reducing CO and HC emis-sions (as well as NOX) on the condition that the ignition delay can be reduced by intro-ducing hot exhaust gases. In view of the significantly higher NOX emissions from dieselcars compared to petrol cars, the increase in NOX emissions at lower ambient tempera-tures must be addressed in the future.
In Figure 11, the NOX emissions in US06 and overtaking tests are shown. As expected, theNOX level was generally low in the US06 test cycle for both petrol cars. The catalyst tem-perature is high in this test cycle but the exhaust mass flow is not high enough to causesignificant NOX breakthrough in the catalyst. However, one petrol car showed considerablyhigher NOX emissions during the overtaking test. High catalyst temperature and lowair/fuel ratio should not result in high NOX emissions, so catalyst breakthrough was proba-bly the issue in this case.
Relative emissions at +22°C and at -7°C
100% 100% 100%
160%
105%
90%
0%
20%
40%
60%
80%
100%
120%
140%
160%
180%
CO HC NOx
Emis
sion
s (%
)
Start at +22 °CStart at -7 °C
Source: MTZ 52 (1991) 9 (Audi)
Figure 10. Comparison of emissions at +22°C andat –7°C (source: Audi, MTZ [37])

Modern petrol and diesel cars
Ecotraffic ERD3 AB May 2002
35
NOX emissions in US06 and during overtaking
1,291,19
1,54
n.m.
0,82
0,95
0,0220,083
0,562
0,0060,0
0,2
0,4
0,6
0,8
1,0
1,2
1,4
1,6
1,8
SI-P SI-G CI-CR/DPF CI-UI/HP (5) CI-UI/HP (6)
NO
X em
issi
ons
(g/k
m)
US06 cycleOvertaking
DieselPetrol The CI-UI/HP car was tested both in 5th
and in 6th gear during overtaking
Figure 11. NOX emissions in US06 and during overtaking
In contrast to the petrol cars, the diesel cars had significantly higher NOX emissions in bothdriving cycles above compared to the NEDC. The increase ranged from a factor of 2(US06) to 4 (overtaking, 6th gear for the Golf TDI). EGR is normally cut off at high loadon light-duty diesel engines due to the decrease of excess air by increasing load. DI en-gines are more dependent on EGR to reduce the NOX emissions than IDI engines16. Hence,the relative increase in NOX emissions by increasing load should be more pronounced forDI engines. Cooling the EGR and increasing the boost pressure enhance the possibilities toincrease the area in the load and speed range where EGR is used. However, this is counter-acted by the desire to increase the specific output of the engines. The drawback with in-creasing NOX emissions at high-load driving cycles cannot be overcome unless NOX after-treatment is introduced and/or a new combustion system that alleviate this problem is de-veloped.
4.1.6 Particulate emissionsIn Figure 12, the particulate mass emissions in the NEDC test cycle at the two ambienttemperatures are shown. Note that the scale used is expressed in mg/km in contrary tog/km, which is the common practice.
16 DI engines also tolerate higher EGR rates than IDI engines. Thus, the NOX emissions can be lower for DIengines although the engine-out emissions are higher. However, at very high load, IDI engines often havelower NOX emissions as no EGR is used in either of the engines.

Modern petrol and diesel cars
Ecotraffic ERD3 AB May 2002
36
Particulate emissions in NEDC at +22°C and -7°C
22,1
2,1
5,3
0,3
32,4
0,31,30,7
0
5
10
15
20
25
30
35
SI-P SI-G CI-CR/DPF CI-UI/HP
Part
icul
ate
emis
sion
s (m
g/km
) Temperature: +22°CTemperature: -7°C
DieselPetrol
Figure 12. Particulate emissions in NEDC at +22°C and –7°C
The results in Figure 12 confirm the general perception that particulate emissions frompetrol cars are very low at high ambient temperatures. Somewhat surprising is the fact thatthe increase in particulate emissions at the lower ambient temperature was relatively small,i.e. significantly less than on tests with older cars (more details are provided below). Theexplanation to this behaviour can probably be derived from the observation that the COand HC emissions were relatively low (especially in comparison to the cold start limits) forthese two cars at −7°C. Consequently, the fuel enrichment during the cold start phase musthave been low, which also should have a positive impact on the particulate emissions. Im-proved petrol quality could also have had an influence on the particulate level (see furtherdiscussion below).
The diesel car without a particulate trap had particulate emissions at +22°C that were be-low the Euro IV limit of 25 mg/km. As the particulate emissions were lower than the certi-fication level as well, the Swedish EC1 diesel fuel was probably the main cause of the fa-vourable results in this case. The particulate level at –7°C was significantly higher than at+22°C implying that the cold start has an impact on the particulate level on this car. Theparticulate level for this car at +22°C was more than one order of magnitude higher thanfor its petrol counterpart. At –7°C the factor was reduced to about 6. It has been shown thatthe particulate level can be reduced below the Euro IV limit17 by internal engine measures.Such engines (3 and 4-cylinder TDI engines) are in production now by the VW group, butas explained before, a car with this technology could not be included in this test pro-gramme. Certification data have not yet been found in the open literature by the author, but
17 To the knowledge of the author, the cars have not been certified according to Euro IV, due to the necessityof an OBD system. However, the German D4 regulation, having the same emission level, should be met.Several other car manufacturers, including the PSA group, have announced that they will introduce cars withan emission level below Euro IV in the near future.

Modern petrol and diesel cars
Ecotraffic ERD3 AB May 2002
37
in a special edition of the journal of MTZ provided by VW, a diagram shows a particulatelevel of about 15 mg/km [38]. Recognising that the use of Swedish diesel fuel would fur-ther somewhat reduce this level, it could be anticipated that the level of 22 mg/km in thistest could be reduced by about 50%. However, this level would still be considerably higherthan for new petrol cars with TWC.
The diesel car with particulate trap shows extremely low particulate levels in the NEDCcycle at both test temperatures. Assuming an engine-out particulate level of 0,03 g/km, thefiltration efficiency would be some 99%. The level measured in this study was lower thanthe certification level. Two factors could play an important role. First, filter regenerationwas not taken into account in this study, although this impact of regeneration has beenshown to be relatively small [10]. Second, the Swedish diesel fuel might also have an im-pact, even on this low particulate level. It could also be anticipated that the low ambientlevel of particulates in the countryside outside Stockholm (and in Sweden in general) com-pared to the levels on the European continent might have some influence on the measuredparticulate level. Furthermore, the test cell air is filtered to a very low particulate level.
In Figure 11, the particulate emissions in the US06 driving cycle is shown. No gravimetricparticulate emission measurements were carried out in the overtaking test, as the governingof the sampling period − varying from vehicle to vehicle − was considered a difficult ob-stacle to be overcome. Furthermore, the short sampling period was anticipated to give toolow particulate mass on the sample filter anyway.
Particulate emissions in the US06 driving cycle
33,0
0,9
3,31,9
0
5
10
15
20
25
30
35
SI-P SI-G CI-CR/DPF CI-UI/HP (5)
Part
icul
ate
emis
sion
s (m
g/km
)
DieselPetrol
Figure 13. Particulate emissions in US06
Figure 11 shows that the particulate mass emissions for the petrol cars in the US06 cyclewere low, i.e. not much higher than in the NEDC cycle at +22°C. However, the majority ofthe particulate emissions in the NEDC cycle are generated during the cold start phase,whereas the US06 does not include a cold start. Consequently, the particulate emissions

Modern petrol and diesel cars
Ecotraffic ERD3 AB May 2002
38
must be generated under completely different conditions in the US06 cycle than in theNEDC cycle. Fuel enrichment could play an important role in the US06 case.
The diesel car without a particulate trap had higher particulate emissions in the US06 cyclethan in the NEDC cycle at +22°C. Higher engine load in the former cycle is probably themain cause for this behaviour.
As in the previous cases, the particulate level of the diesel car with particulate trap wasvery low. The higher exhaust temperature in the US06 cycle might cause sulphate forma-tion in the particulate filter, but as the Swedish EC1 diesel fuel is practically sulphur-free,this should not be an issue in this case.
The particulate emissions from diesel cars without a particulate filter are generally consid-erably higher than from petrol cars with TWC emission control and cars with particulatefilter. As this difference will remain although the Euro IV particulate limit is met, furtherreduction of the particulate level will be necessary in the future on the condition that par-ticulate matter is considered as a health hazard. Therefore, the use of particulate filtersand/or the introduction of a new combustion system that drastically would reduce the par-ticulate level are the two options for the future development of diesel engines.
Comparison of particulate emissions from petrol cars in other studiesIt might be of interest to discuss the particulate emissions from petrol-fuelled cars in somemore detail. As the particulate emissions at the yearly average temperature of +7°C inSweden are of main interest, some results interpolated for this temperature have been com-piled. The author has been participating in two studies analysing the particulate level onpetrol vehicles corresponding to the Euro I emission level. The first study calculated theparticulate level from tests in the US FTP-75, making corrections for the lower weightingfactor of the cold start in this test compared to European driving pattern [39]. The secondstudy evaluated the particulate emissions from tests in the NEDC cycle [1]. It is also ofinterest to mention two additional studies. In a study at MTC, the average particulate levelmeasured on three cars was reported [4]. Fortum and VTT in Finland have conducted astudy on the impact of petrol fuel quality on the particulate emissions that has been sum-marised in an SAE paper [40]. From this study, three cars with TWC have been chosen. InFigure 14, the results from the studies mentioned are summarised and compared with thelevel from the two cars in this study.
The results in Figure 14 show that the level in the two KFB reports and the SAE paper onEU 2000 fuel were on a roughly similar level (14 − 18 mg/km). Improved fuel quality(RFG) reduces the particulate emissions by almost 50%. The fuel quality has presumablyhad some impact in the MTC 9708B report as well, since these tests were run on ordinarySwedish petrol that should be better in this respect than the reference fuel. However, theparticulate level measured in this study is outstanding. First, it could be anticipated that thefurther improved fuel quality of the Swedish fuel that now corresponds to the EU 2005 fuelspecification could have had a positive impact. Second, the petrol cars in this study werenew, and it cannot be excluded that ageing has some impact on the particulate level. Theodometer reading for the cars in the other studies were greater and in the two first men-tioned studies the evaluation was made for an average odometer reading of 80 000 km.However, even if the fuel quality and odometer reading might explain some of the apparentreduction of the particulate emissions, the improved technology on the new cars in thisstudy should also have had a decisive influence on the results.

Modern petrol and diesel cars
Ecotraffic ERD3 AB May 2002
39
Particulate emissions from petrol-fuelled TWC cars in some studiesData have been interpolated for a temperature of +7°C
14,3
4,9
17,4
10,0
2,4
18
0
2
4
6
8
10
12
14
16
18
20
KFB 1997:22 KFB 1999:38 MTC 9708B 2000-01-2017,EU 2000
2000-01-2017,RFG
This study
Part
icul
ate
emis
sion
s (m
g/km
)
Sources: KFB Report 1997:22KFB Report 1999:38MTC 9708BSAE 2000-01-2017
Figure 14. Particulate emissions from petrol cars with TWC
It is also of interest to compare theparticulate level for the petrol carswith cars that use direct injection ofthe fuel. The previously mentionedstudy by Fortum and VTT conductedmeasurements on a car with directinjection of petrol (Mitsubishi GDI).A study by this author also carriedout measurements on a similar car[3]. As in the previously shown fig-ure, the results for +7°C have beeninterpolated from data at +22°C and−7°C. The results from these calcu-lations are shown in Figure 15.
As can bee noted from the results inFigure 15, the particulate emissionswere significantly higher in this casethan for the TWC cars shown inFigure 14. In fact, in the For-tum/VTT study, the level was higherthan for the diesel car without a par-ticulate filter in this study. In theMTC study, the level was similar tothe diesel car without a particulate filter that was tested in this study.
Particulate emissions @ +7°C (interpolated) from a direct injection
petrol-fuelled car in two studies
27
49
82
0
10
20
30
40
50
60
70
80
90
2000-01-2017,EU 2000
2000-01-2017,RFG
MTC 9704,Swe CP
Part
icul
ate
emis
sion
s (m
g/km
)
Sources: SAE 2000-01-2017MTC 9704
Abbreviations: EU 2000: EU 2000 petrolRFG: Reformulated gasoline (Fortum)CP: Swedish commercial petrol fuel (as in 1997)
Figure 15. Particulate emissions from a direct in-jection petrol car in two studies
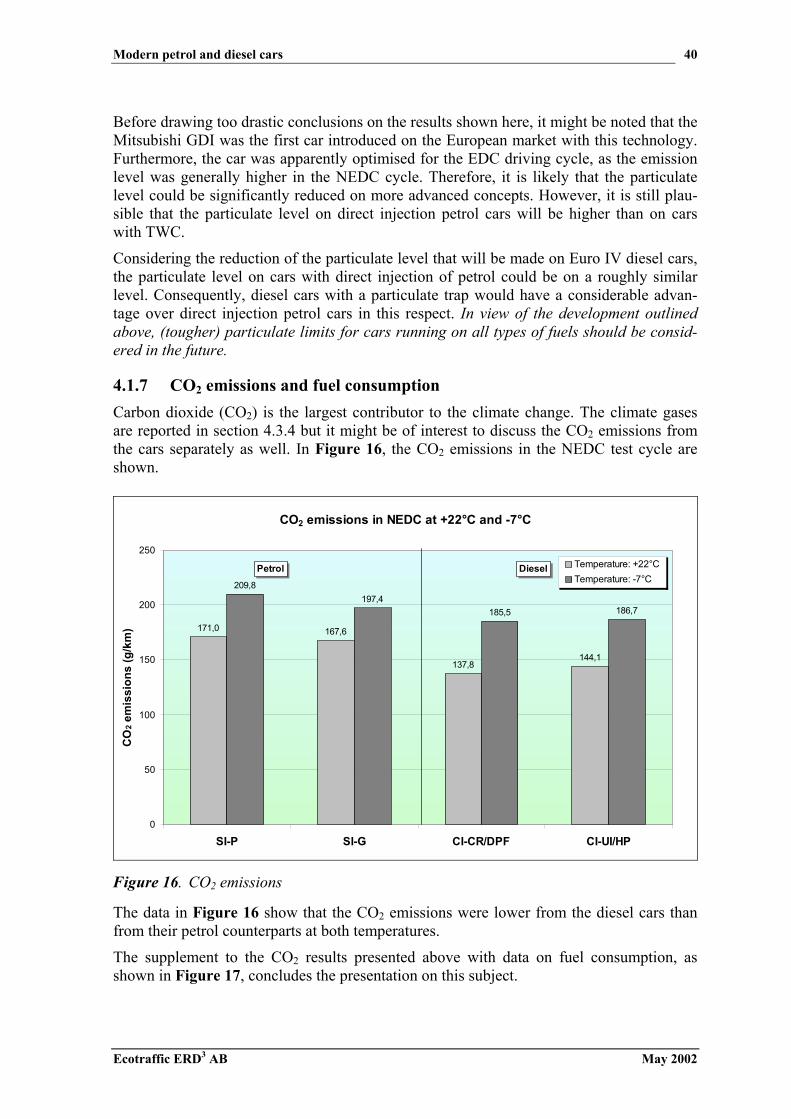
Modern petrol and diesel cars
Ecotraffic ERD3 AB May 2002
40
Before drawing too drastic conclusions on the results shown here, it might be noted that theMitsubishi GDI was the first car introduced on the European market with this technology.Furthermore, the car was apparently optimised for the EDC driving cycle, as the emissionlevel was generally higher in the NEDC cycle. Therefore, it is likely that the particulatelevel could be significantly reduced on more advanced concepts. However, it is still plau-sible that the particulate level on direct injection petrol cars will be higher than on carswith TWC.
Considering the reduction of the particulate level that will be made on Euro IV diesel cars,the particulate level on cars with direct injection of petrol could be on a roughly similarlevel. Consequently, diesel cars with a particulate trap would have a considerable advan-tage over direct injection petrol cars in this respect. In view of the development outlinedabove, (tougher) particulate limits for cars running on all types of fuels should be consid-ered in the future.
4.1.7 CO2 emissions and fuel consumptionCarbon dioxide (CO2) is the largest contributor to the climate change. The climate gasesare reported in section 4.3.4 but it might be of interest to discuss the CO2 emissions fromthe cars separately as well. In Figure 16, the CO2 emissions in the NEDC test cycle areshown.
CO2 emissions in NEDC at +22°C and -7°C
171,0 167,6
137,8144,1
209,8197,4
185,5 186,7
0
50
100
150
200
250
SI-P SI-G CI-CR/DPF CI-UI/HP
CO
2 em
issi
ons
(g/k
m)
Temperature: +22°CTemperature: -7°C
DieselPetrol
Figure 16. CO2 emissions
The data in Figure 16 show that the CO2 emissions were lower from the diesel cars thanfrom their petrol counterparts at both temperatures.
The supplement to the CO2 results presented above with data on fuel consumption, asshown in Figure 17, concludes the presentation on this subject.
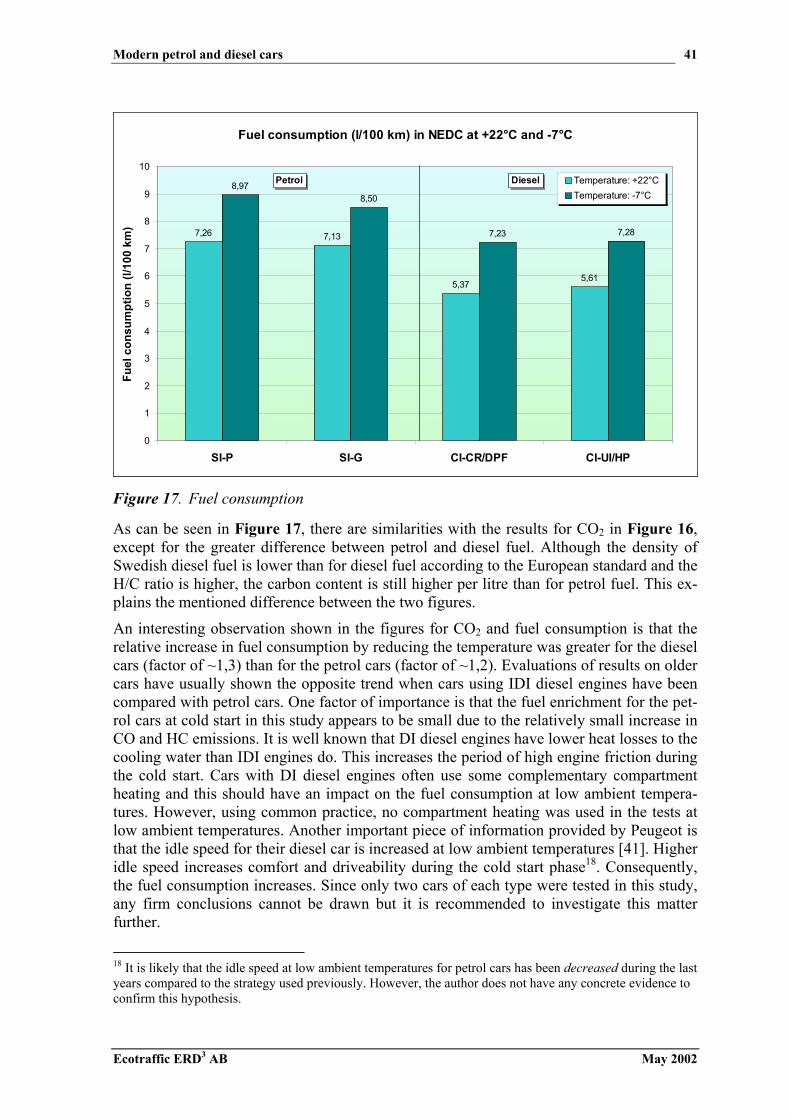
Modern petrol and diesel cars
Ecotraffic ERD3 AB May 2002
41
Fuel consumption (l/100 km) in NEDC at +22°C and -7°C
7,26 7,13
5,375,61
8,978,50
7,23 7,28
0
1
2
3
4
5
6
7
8
9
10
SI-P SI-G CI-CR/DPF CI-UI/HP
Fuel
con
sum
ptio
n (l/
100
km)
Temperature: +22°CTemperature: -7°C
DieselPetrol
Figure 17. Fuel consumption
As can be seen in Figure 17, there are similarities with the results for CO2 in Figure 16,except for the greater difference between petrol and diesel fuel. Although the density ofSwedish diesel fuel is lower than for diesel fuel according to the European standard and theH/C ratio is higher, the carbon content is still higher per litre than for petrol fuel. This ex-plains the mentioned difference between the two figures.
An interesting observation shown in the figures for CO2 and fuel consumption is that therelative increase in fuel consumption by reducing the temperature was greater for the dieselcars (factor of ~1,3) than for the petrol cars (factor of ~1,2). Evaluations of results on oldercars have usually shown the opposite trend when cars using IDI diesel engines have beencompared with petrol cars. One factor of importance is that the fuel enrichment for the pet-rol cars at cold start in this study appears to be small due to the relatively small increase inCO and HC emissions. It is well known that DI diesel engines have lower heat losses to thecooling water than IDI engines do. This increases the period of high engine friction duringthe cold start. Cars with DI diesel engines often use some complementary compartmentheating and this should have an impact on the fuel consumption at low ambient tempera-tures. However, using common practice, no compartment heating was used in the tests atlow ambient temperatures. Another important piece of information provided by Peugeot isthat the idle speed for their diesel car is increased at low ambient temperatures [41]. Higheridle speed increases comfort and driveability during the cold start phase18. Consequently,the fuel consumption increases. Since only two cars of each type were tested in this study,any firm conclusions cannot be drawn but it is recommended to investigate this matterfurther.
18 It is likely that the idle speed at low ambient temperatures for petrol cars has been decreased during the lastyears compared to the strategy used previously. However, the author does not have any concrete evidence toconfirm this hypothesis.

Modern petrol and diesel cars
Ecotraffic ERD3 AB May 2002
42
4.1.8 Complementary results from overtakingSince the overtaking test is not an official test procedure, some additional data from thesetests might be of interest to show. In Figure 18, the vehicle speed traces are shown. Thecommon ripple for a speed signal from a chassis dynamometer is clearly seen, as well asthe difficulties in maintaining the desired constant speed after the acceleration. The diesel-fuelled Golf, having the highest engine power and torque (although the total drivetrain ra-tio also has an impact) provided the greatest acceleration in the 5th gear. In 6th gear the dif-ference between this car and the petrol counterpart (in 5th gear) was smaller. The Peugeotdiesel also had a more brisk acceleration than its petrol counterpart.
Vehicle speed during overtaking
60
70
80
90
100
110
120
0 2 4 6 8 10 12 14 16 18 20
Time (s)
Vehi
cle
spee
d (k
m/h
)
SI-PSI-GCI-CR/DPFCI-UI/HP (5)CI-UI/HP (6)
Figure 18. Vehicle speed traces during overtaking
Although the time for completion of the overtaking was measured, the distance driven is ofgreater importance. A graph with these results is shown in Figure 19. As can be seen inFigure 19, the diesel cars were faster than their petrol counterparts. The difference for thediesel-fuelled Golf in 5th and 6th gear could also be noted.

Modern petrol and diesel cars
Ecotraffic ERD3 AB May 2002
43
Distance driven during overtaking
0,545 0,544
0,524
0,490
0,528
0,460
0,480
0,500
0,520
0,540
0,560
SI-P SI-G CI-CR/DPF CI-UI/HP (5) CI-UI/HP (6)
Tota
l dis
tanc
e (k
m)
Petrol Diesel
Figure 19. Vehicle distance driven during overtaking
4.2 Unregulated emissionsIn this section, the results on the unregulated emissions are presented and discussed. Itshould be noted that the uncertainty for the measurement of several of these emission com-ponents is considerably greater than for the regulated emissions. Likewise, the public do-main database on the unregulated emissions is smaller than for the regulated emissions.
4.2.1 Nitrogen containing compounds
Nitrous oxide (N2O)The emissions of nitrous oxide (N2O) are shown in Figure 20. Somewhat surprisingly, theN2O level was higher for the diesel cars. Older petrol cars, and in particular cars with agedcatalysts, usually have higher N2O emissions than petrol cars with catalysts, implying thatN2O formation in the catalyst is higher than the N2O conversion. A recent study at MTC[36] showed significantly higher N2O emissions (in the NEDC cycle) for all the tested pet-rol cars than the cars in this study. The N2O level ranged from about 24 mg/km to 87mg/km. The newest cars showed the lowest level. Diesel-fuelled vehicles generally haverelatively low emissions of N2O. In view of other published results on N2O emissions,some scepticism regarding the results obtained in this test series must be expressed. Con-sidering that the results for the petrol cars were on a level that could be expected from thediesel cars, and vice versa, it cannot be excluded that some mix-up has been made in thesampling or analysis process. However, MTC has investigated this issue without havingfound any explanation.

Modern petrol and diesel cars
Ecotraffic ERD3 AB May 2002
44
Emissions of nitrous oxide (N2O) at two temperatures
6,6
8,5
26,124,7
8,0
19,1
26,3 26,9
0
5
10
15
20
25
30
SI-P SI-G CI-CR/DPF CI-UI/HP
N2O
em
issi
ons
(mg/
km)
Temperature: +22°CTemperature: -7°C
Petrol Diesel
Figure 20. N2O emissions
Ammonia (NH3)The emissions of ammonia (NH3) are shown in Figure 21. Ammonia can be formed in thecatalyst under low air/fuel ratios. The ammonia emissions were generally low for the petrolcars and below the detection level for the diesel cars. The measurement trace from the MSinstrument (in real-time) oscillated around the zero level for the diesel cars during thewhole test cycle, implying that no ammonia could be detected in the exhaust from thesevehicles. This is plausible, since diesel engines generally operate with air excess and am-monia is formed under rich conditions. An increase in ammonia emissions can be noted forthe petrol cars at the lower ambient temperature. However, the level at this temperaturewas also low.
4.2.2 Light aromaticsOf the light aromatics, only the benzene emissions were measured. Benzene is a knowncarcinogen that is usually found in the emissions from petrol cars, since petrol containsbenzene. However, the benzene level in petrol has been considerably reduced and in thisstudy, petrol corresponding to the EU 2005 petrol specification was used (<1% benzene).Benzene can also be formed from higher aromatics in the fuel.
In Figure 22, the benzene emissions in NEDC at the two temperatures are shown. As ex-pected, the level was higher for the petrol cars than for the diesel cars, although it shouldbe noted that the level for all cars was low. All cars, but the diesel car with a particulatetrap, showed a distinct increase of benzene by lowering the temperature. The increase wasroughly proportional to the increase in HC emissions for the petrol cars when the tem-perature was reduced.
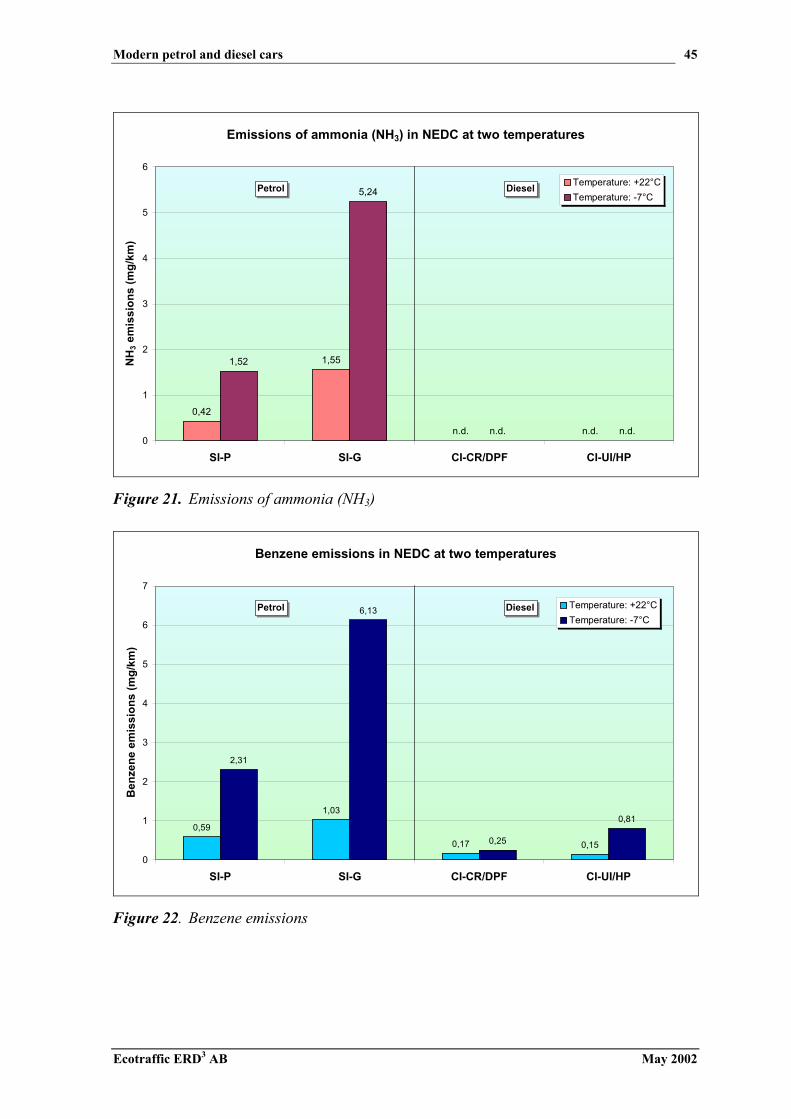
Modern petrol and diesel cars
Ecotraffic ERD3 AB May 2002
45
Emissions of ammonia (NH3) in NEDC at two temperatures
0,42
1,551,52
5,24
n.d.n.d. n.d.n.d.0
1
2
3
4
5
6
SI-P SI-G CI-CR/DPF CI-UI/HP
NH
3 em
issi
ons
(mg/
km)
Temperature: +22°CTemperature: -7°C
Petrol Diesel
Figure 21. Emissions of ammonia (NH3)
Benzene emissions in NEDC at two temperatures
0,59
1,03
0,17 0,15
2,31
6,13
0,25
0,81
0
1
2
3
4
5
6
7
SI-P SI-G CI-CR/DPF CI-UI/HP
Ben
zene
em
issi
ons
(mg/
km)
Temperature: +22°CTemperature: -7°C
Petrol Diesel
Figure 22. Benzene emissions
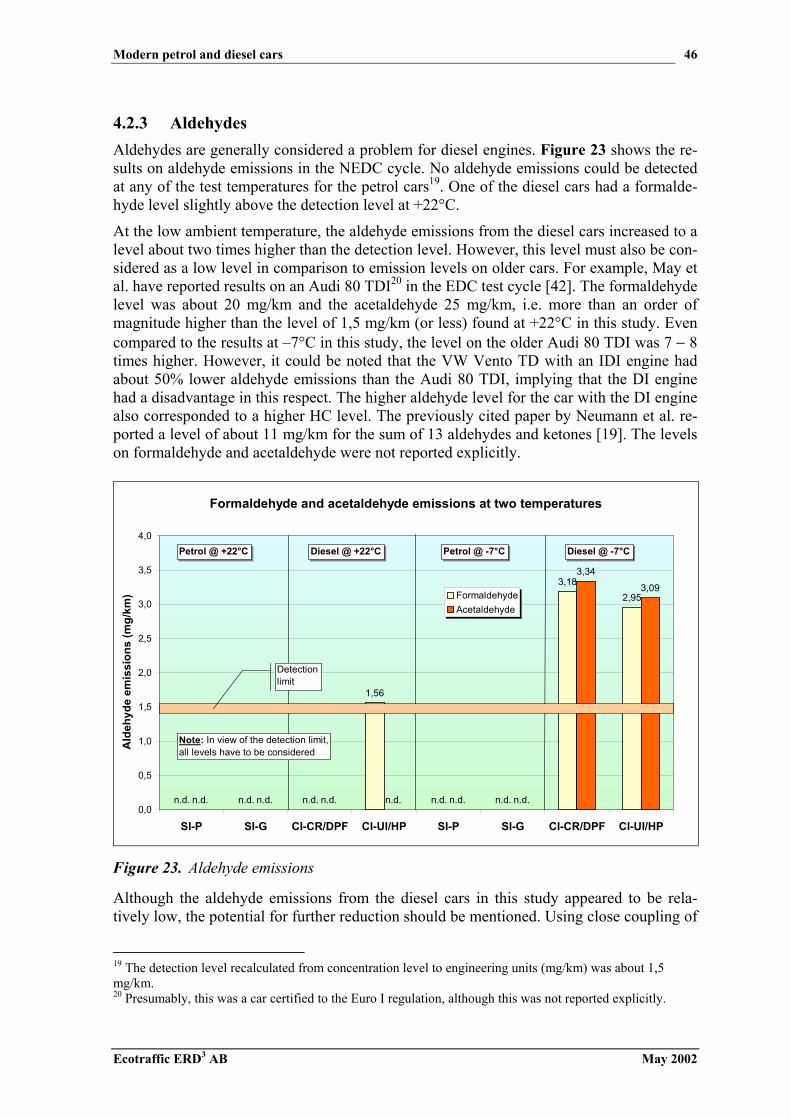
Modern petrol and diesel cars
Ecotraffic ERD3 AB May 2002
46
4.2.3 AldehydesAldehydes are generally considered a problem for diesel engines. Figure 23 shows the re-sults on aldehyde emissions in the NEDC cycle. No aldehyde emissions could be detectedat any of the test temperatures for the petrol cars19. One of the diesel cars had a formalde-hyde level slightly above the detection level at +22°C.
At the low ambient temperature, the aldehyde emissions from the diesel cars increased to alevel about two times higher than the detection level. However, this level must also be con-sidered as a low level in comparison to emission levels on older cars. For example, May etal. have reported results on an Audi 80 TDI20 in the EDC test cycle [42]. The formaldehydelevel was about 20 mg/km and the acetaldehyde 25 mg/km, i.e. more than an order ofmagnitude higher than the level of 1,5 mg/km (or less) found at +22°C in this study. Evencompared to the results at –7°C in this study, the level on the older Audi 80 TDI was 7 − 8times higher. However, it could be noted that the VW Vento TD with an IDI engine hadabout 50% lower aldehyde emissions than the Audi 80 TDI, implying that the DI enginehad a disadvantage in this respect. The higher aldehyde level for the car with the DI enginealso corresponded to a higher HC level. The previously cited paper by Neumann et al. re-ported a level of about 11 mg/km for the sum of 13 aldehydes and ketones [19]. The levelson formaldehyde and acetaldehyde were not reported explicitly.
Formaldehyde and acetaldehyde emissions at two temperatures
1,56
3,182,95
3,34
3,09
n.d. n.d. n.d. n.d. n.d.n.d. n.d. n.d. n.d. n.d. n.d.0,0
0,5
1,0
1,5
2,0
2,5
3,0
3,5
4,0
SI-P SI-G CI-CR/DPF CI-UI/HP SI-P SI-G CI-CR/DPF CI-UI/HP
Ald
ehyd
e em
issi
ons
(mg/
km) Formaldehyde
Acetaldehyde
Petrol @ +22°C Diesel @ +22°C Petrol @ -7°C Diesel @ -7°C
Detection limit
Note: In view of the detection limit,all levels have to be considered
Figure 23. Aldehyde emissions
Although the aldehyde emissions from the diesel cars in this study appeared to be rela-tively low, the potential for further reduction should be mentioned. Using close coupling of
19 The detection level recalculated from concentration level to engineering units (mg/km) was about 1,5mg/km.20 Presumably, this was a car certified to the Euro I regulation, although this was not reported explicitly.

Modern petrol and diesel cars
Ecotraffic ERD3 AB May 2002
47
a light-off catalyst (potentially even located before the turbocharger) closely followed by amain catalyst should be significantly better than an underfloor catalyst in this respect. Withlow-sulphur fuel, sulphate formation of close-coupled catalysts would not be a problem (asit is to some extent today). Consequently, a very active catalyst formulation could be usedfor the close-coupled catalyst. Conversion of NO to NO2 could be an issue with an activecatalyst but using a NOX reduction catalyst would handle this problem anyway. Catalyticcoatings on particulate filter are also discussed, and this could have some impact on thealdehyde emissions as well. In view of the future development indicated above, aldehydeemissions from diesel cars could be practically eliminated in the near future.
4.2.4 AlkenesFirst, it should be mentioned that the MS instrument appeared to have a zero drift for someof the tested emission components. In general, the emissions of the alkenes were high dur-ing the cold start but decreased rapidly to a very low as soon as the cold start period wasover. In some cases, additional emissions were emitted during the EUDC phase. Due to thezero drift, the integrated value sometimes decreased considerably over time after the coldstart phase, which must be an artefact. The problem is illustrated in Figure 24, where acorrection of this apparent error is also shown. The correction was simply made by ex-cluding negative values. It might be possible that the zero drift could have increased thelevel in some cases but this is somewhat difficult to determine. Since no correction wasmade in these cases, a slight overestimation of the level might be the result.
SI-P 1,3-butadiene emissions in NEDC, at -7°C
0
50
100
150
200
250
300
350
400
450
0 120 240 360 480 600 720 840 960 1080 1200
Time (s)
1,3-
buta
dien
e, m
ass
flow
(ug/
s)
0,00
0,05
0,10
0,15
0,20
0,25
0,30
0,35
0,40
0,45
1,3-
buta
dien
e, in
tegr
ated
(mg/
km)
1,3-Butadiene, mass flow1,3-Butadiene, integrated & corrected1,3-Butadiene, integrated
Figure 24. 1,3-butadiene emissions (corrected and uncorrected) at +22°C

Modern petrol and diesel cars
Ecotraffic ERD3 AB May 2002
48
In Table 8, the measurementswhere the values for the alkeneswere corrected are shown. Inthree cases, corrections wereconsidered necessary.
The emissions of the alkenes(ethene, propene and 1,3-buta-diene) at +22°C are shown inFigure 25.
Figure 25 shows that the etheneemissions at +22°C wereroughly similar for the petroland diesel cars respectively fromeach car manufacturer. The pro-pene emissions were considera-bly lower for the diesel cars incomparison to their petrolcounterparts. The 1,3-butadiene emissions were about 50% lower in one case (diesel withparticulate trap) but the difference was small in the other case.
Emissions of alkenes in NEDC at +22°C
0,96
1,21
1,04
1,351,34
1,63
0,33
0,45
0,15 0,15
0,08
0,13
0,0
0,2
0,4
0,6
0,8
1,0
1,2
1,4
1,6
1,8
SI-P SI-G CI-CR/DPF CI-UI/HP
Ethe
ne &
pro
pene
em
issi
ons
(mg/
km)
0,00
0,02
0,04
0,06
0,08
0,10
0,12
0,14
0,16
0,18
1,3-
buta
dien
e em
issi
ons
(g/k
m)
EthenePropene1,3 Butadiene
Petrol Diesel
Figure 25. Emissions of alkenes at +22°C
The emissions of the alkenes at -7°C are shown in Figure 26. Compared to the previousresults in Figure 25 at +22°C, the emissions of the alkenes increased considerably for thepetrol cars at the lower ambient temperature. This is plausible since also the HC emissionsincreased significantly by reducing the ambient temperature. The increase of the alkeneemissions due to reducing the temperature was somewhat lower for the diesel cars, al-
Table 8. Corrections for some of the alkenes
Emission compound correctionVehicle Temp. Ethene Propene 1,3-butaSI-P +22 No No NoSI-P -7 No No NoSI-G +22 Yes No YesSI-G -7 No No YesCI-CR/DPF +22 No No NoCI-CR/DPF -7 No No NoCI-UI/HP +22 No No NoCI-UI/HP -7 No No No

Modern petrol and diesel cars
Ecotraffic ERD3 AB May 2002
49
though the trend is not quite clear. The relative difference between the two fuels was gen-erally greater at the lower ambient temperature, even if the smallest difference was nomore than a factor of two.
Emissions of alkenes in NEDC at -7°C
2,93
4,69
2,02
2,92
4,68
6,91
0,68 0,55
0,30
0,65
0,16 0,15
0,0
1,0
2,0
3,0
4,0
5,0
6,0
7,0
8,0
SI-P SI-G CI-CR/DPF CI-UI/HP
Ethe
ne &
pro
pene
em
issi
ons
(mg/
km)
0
0,1
0,2
0,3
0,4
0,5
0,6
0,7
0,8
1,3-
buta
dien
e em
issi
ons
(g/k
m)
EthenePropene1,3 Butadiene
Petrol Diesel
Figure 26. Emissions of alkenes at -7°C
1,3-butadiene is considered a suspected carcinogen. There is also some evidence that eth-ene and propene might cause cancer but the unit risk factors are considered significantlylower in these cases. 1,3-butadiene that is considered the most important of the alkenes hasgenerally been lower in measurements on diesel cars compared to results on petrol cars.Neumann et al. found that the level of 1,3-butadiene was virtually undetectable for the twocars tested in that study [19]. The results by Almén et al. generated on a VW Golf TD ofMY’93 were somewhat inconclusive [11]. At –7°C a level of 9 mg/m was measured butwith a high scatter of ±7mg/km. No value was noted at +22°C in the report but in the cal-culation of the cancer risk index, a very high contribution from 1,3-butadiene was shown.In view of other results in the literature, some errors in these measurements and/or theevaluations could be anticipated for the higher temperature. A later study by Almén founda level of 7 ±4mg/km for the same car at –20°C [43]. The level on the 3 petrol cars in thesame study was considerably higher, ranging from 13 to 41 mg/km (also at –20°C).
4.2.5 Polycyclic aromatic compounds (PAC)As mentioned in section 3.3.5, 12 tri+ aromatic PAC and 4 di-aromatic PAH were meas-ured. As some previous results include additional compounds, a direct comparison shouldnot be carried out without considering this fact. PAC (and PAH) emissions have generallybeen considered as a major problem for diesel engines. However, the use of aftertreatmentdevices and improved fuel quality can significantly reduce this level, which has also beenthe case for petrol engines. At low ambient temperatures, the PAC emissions tend to in-

Modern petrol and diesel cars
Ecotraffic ERD3 AB May 2002
50
crease more for petrol cars than for diesel cars. Very high PAC emissions at low ambienttemperature have been shown for petrol cars in a couple of reports, e.g. [11, 43, 44].
The results on PAC emissions are shown in Figure 27. The results have been divided intoPACs associated with the particulate fraction (PM) and the semivolatile (PUF) fraction. Inaddition, the total PAC is shown.
Polycyclic aromatic compounds (PAC) at +22 and -7°CParticulate (PM) and semivolatile phase (PUF)
0,18
34,2
0,426,150,33 0,19 1,30
18,5
0,401,111,35
12,0
45,6
1,17 0,17
8,56
0
10
20
30
40
50
60
70
80
90
SI-P, +22°CSI-P, -7°C
SI-G, +22°CSI-G, -7°C
CI-CR/DPF, +22°C
CI-CR/DPF, -7°CCI-UI/HP, +22°C
CI-UI/HP, -7°C
PAC
em
issi
ons
( µg/
km)
PUFPM
1,68
18,1
1,53
79,8
1,36 0,58 1,47
27,1
Diesel @ +22°CPetrol @ +22°C Petrol @ -7°C Diesel @ -7°C
Figure 27. Emissions of polycyclic aromatic compounds (PAC) at +22°C and –7°C
As expected, all cars had very low PAC emissions at +22°C regardless of fuel type (Figure27). The PAC in the semivolatile phase (PUF) was higher than in the particulate phase forthe petrol cars, as generally is the case for petrol cars. The diesel car without particulatefilter had very little PAC in the semivolatile phase at this temperature. On the contrary, thediesel car with the particulate trap had very little PAC in the particulate phase − in fact;both the percentage and the absolute level were lower than for the petrol cars. The mostplausible explanation is that the removal of condensation nuclei increases the semivolatileshare of the PAC emissions. This trend has been seen before with a particulate trap on bothlight-duty [10] and heavy-duty vehicles [20]. The question remains whether PAC in theparticulate phase poses more health hazard than PAC in the semivolatile phase, or viceversa.
At the lower temperature, the PAC emissions increased considerably for the petrol cars butthis trend could also be seen for the diesel car without a particulate filter. The level on thediesel car was exceptional in this respect; i.e. it tended to decrease with decreasing tem-perature. However, it should be noted that the level at both temperatures was very low andin fact, since the PAC emissions were on the detection level in this case, one cannot drawany firm conclusions on the temperature impact. Both diesel cars had lower PAC emissionsthan their petrol counterparts. However, the petrol car with the lowest PAC emissions hadlower PAC emissions than the diesel car without a particulate trap. It could also be noted
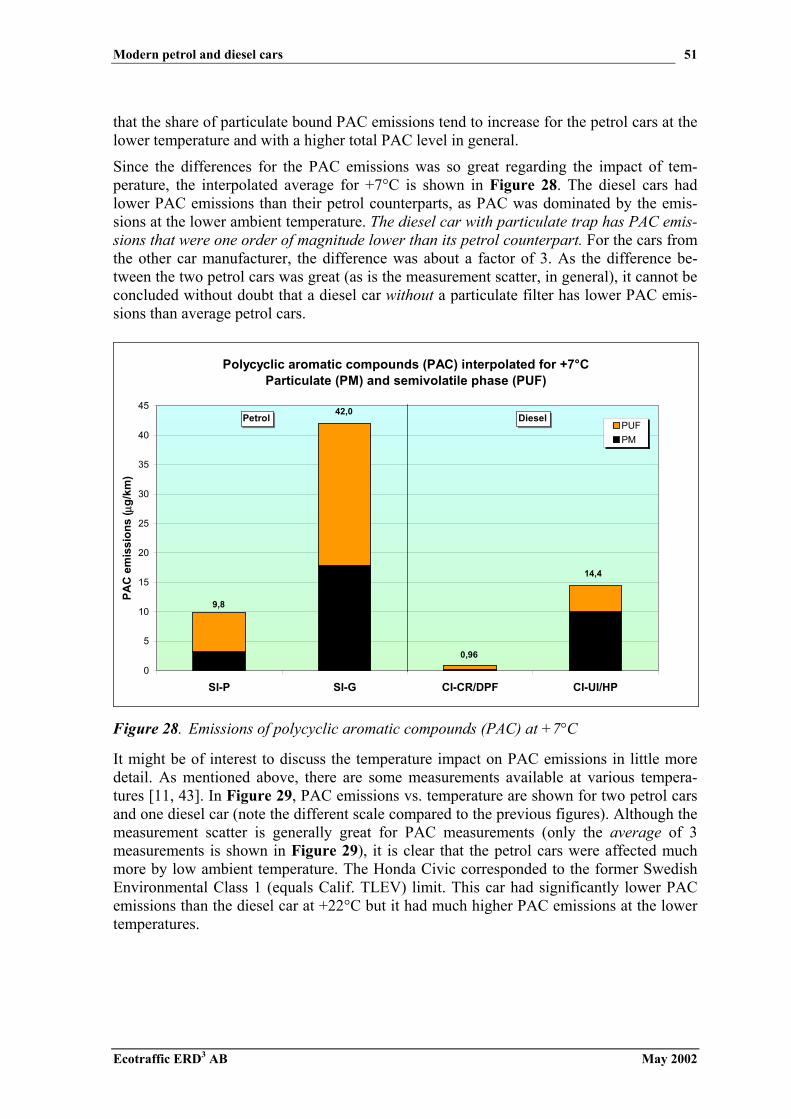
Modern petrol and diesel cars
Ecotraffic ERD3 AB May 2002
51
that the share of particulate bound PAC emissions tend to increase for the petrol cars at thelower temperature and with a higher total PAC level in general.
Since the differences for the PAC emissions was so great regarding the impact of tem-perature, the interpolated average for +7°C is shown in Figure 28. The diesel cars hadlower PAC emissions than their petrol counterparts, as PAC was dominated by the emis-sions at the lower ambient temperature. The diesel car with particulate trap has PAC emis-sions that were one order of magnitude lower than its petrol counterpart. For the cars fromthe other car manufacturer, the difference was about a factor of 3. As the difference be-tween the two petrol cars was great (as is the measurement scatter, in general), it cannot beconcluded without doubt that a diesel car without a particulate filter has lower PAC emis-sions than average petrol cars.
Polycyclic aromatic compounds (PAC) interpolated for +7°CParticulate (PM) and semivolatile phase (PUF)
0
5
10
15
20
25
30
35
40
45
SI-P SI-G CI-CR/DPF CI-UI/HP
PAC
em
issi
ons
( µg/
km)
PUFPM
Petrol Diesel
9,8
42,0
0,96
14,4
Figure 28. Emissions of polycyclic aromatic compounds (PAC) at +7°C
It might be of interest to discuss the temperature impact on PAC emissions in little moredetail. As mentioned above, there are some measurements available at various tempera-tures [11, 43]. In Figure 29, PAC emissions vs. temperature are shown for two petrol carsand one diesel car (note the different scale compared to the previous figures). Although themeasurement scatter is generally great for PAC measurements (only the average of 3measurements is shown in Figure 29), it is clear that the petrol cars were affected muchmore by low ambient temperature. The Honda Civic corresponded to the former SwedishEnvironmental Class 1 (equals Calif. TLEV) limit. This car had significantly lower PACemissions than the diesel car at +22°C but it had much higher PAC emissions at the lowertemperatures.

Modern petrol and diesel cars
Ecotraffic ERD3 AB May 2002
52
Temperature influence on PAC emissions in the NEDC driving cycle Results on two petrol cars and one diesel car
0
500
1 000
1 500
2 000
2 500
3 000
3 500
4 000
4 500
5 000
-20 -15 -10 -5 0 5 10 15 20 25
Temperature (°C)
PAC
em
issi
ons
( µg/
km)
VW Golf DVolvo 855Honda CivicInterpol. Golf @ +7 °CInterpol. Volvo @ +7 °CInterpol. Honda @ +7 °C
Sources: MTC 9501 och MTC 9603Figure adapted by Ecotraffic
Figure 29. PAC emissions at various temperatures for two petrol cars and one diesel car
In view of the results in this study and the results in Figure 29, it can be concluded that asignificant decrease of PAC emissions at low ambient temperatures has been achieved onthe petrol cars in this study. The Honda, being a TLEV car, had relatively low HC emis-sions at –7°C compared to the Volvo that was certified to an older emission regulation.Thus, the “knee” for increase in PAC emissions at low temperature seems to have beenshifted to lower temperatures as well. It could be anticipated that this trend would be evenmore pronounced for the petrol cars in this study. This could explain the significant de-crease in PAC emissions at –7°C compared to the older results.
The low PAC level for the diesel car with a particulate trap is very impressive in compari-son to the old cars. The difference was about two orders of magnitude even if the fact thatfewer compounds were analysed in this study is taken into account. The average PAC levelfor the diesel car without a particulate filter at +7°C has been improved by almost one or-der of magnitude compared to the results on the older diesel car (Figure 29). However, therelatively large increase in PAC emissions by reducing the temperature remains to be ex-plained. Previously, it has been noted that the HC emissions increased by almost a factor of3 in the NEDC cycle by lowering the temperature, whereas the other diesel car did notshow any increase (Figure 7). However, the increase in PAC emissions was almost a fac-tor of 20. More tests would be necessary to reveal if this is a general trend, or if there couldbe some artefacts in the measurement. (Only a single measurement was carried out on eachcar.)
4.2.6 AcrylamideAcrylamide has been noted in Sweden as a compound causing health hazards from the use(or misuse) in tunnel construction. Leaking of acrylamide in spill waster caused poisoningof the water supply in the Hallandsåsen area. Acrylamide is considered neurotoxic and it is

Modern petrol and diesel cars
Ecotraffic ERD3 AB May 2002
53
anticipated to be a possible human carcinogen (IARC class B2). Acrylamide has also re-cently been found in food in a Swedish study [45]. Heating of the food during frying seemsto be the cause of the formation of acrylamide. Acrylamide has also been found in cigarettesmoke.
In an article in a Swedish newspaper“Aftonbladet” in June 16, 2001, the con-sultant company Rototest claimed to havefound acrylamide in automobile exhaust[46]. Besides this information, no publica-tion of data from these tests is known to theauthor. Rototest claimed to have found ac-rylamide in the exhaust at high engine load(fuel enrichment). Another possible, some-what similar, engine operating conditioncould be cold start at low ambient tem-peratures but this was not analysed in thementioned study. To limit the number ofsamples to be analysed in this study, it wasdecided to carry out the analysis of ac-rylamide in US06 and in the overtaking testonly. The results on acrylamide emissionsare shown in Table 9.
In all cases except one (CI-UI/HP), the ac-rylamide level was below the detectionlimit. The detection limit of acrylamide was5 µg/litre of water in the sampled volume.The sampled gas volume was between 6and 14 litres depending on the test cycle and car. The detection limit in Table 9 has beenrecalculated from concentration in the sample to mg/km. The detection limit was approxi-mately 0,3 mg/km in the US06 test cycle. As the sampling during overtaking was made fora longer period than the actual overtaking to avoid problems with timing of the sampling,recalculation of the detection limits is not as straightforward as for the US06 cycle. There-fore, these levels have been omitted in Table 9. In general, the detection limit is higher inthis test than in the US06.
As mentioned previously, only one car in Table 9 had a higher level of acrylamide than thedetection limit. As this level was only a factor of 2 higher than the detection limit, it issomewhat uncertain whether any acrylamide was emitted by this tested car either. An in-creased sampling volume in general and supplemental testing at low ambient conditions isrecommended for future investigations in this area.
4.2.7 Particle number and particle size distributionIt is worth noting that all figures presented in this section use logarithmic scale on the y-axis and in some cases, on the x-axis as well (for particle size distribution). As the possiblenumber of comparisons that could be shown is vast, some limitations have been made.
It should be noted that “total” number of particles refers to the particles that have beenmeasured with the sampling, dilution and instrumentation used. It is possible that smaller
Table 9. Emissions of acrylamide
Car Test cycle Acrylamide(mg/km)
US06 <0,3SI-P
Overtaking n.d.a
US06 <0,3SI-G
Overtaking n.d.US06 <0,3
CI-CR/DPFOvertaking n.d.US06 0,6Overtaking 5th n.d.CI-UI/HPOvertaking 6th n.d.
Note:a n.d.: not detectable. Recalculation of the
detection limit to mg/km is not valid in thiscase, as the sampling period was not con-stant in the overtaking test.

Modern petrol and diesel cars
Ecotraffic ERD3 AB May 2002
54
particles than the smallest size that could be detected were emitted. It could also be possi-ble that particles were generated (e.g. through nucleation during dilution) in the lab that arenot generated in ambient air. This again, would lead to an overestimation of the particlenumber. The opposite is also possible, i.e. an increase in size of particles in the laboratoryin contrast to nucleation in ambient air. It was not within the scope of the project to inves-tigate the measurement methodology, since such work is currently going on in many labo-ratories around the world.
Total particle numberThe “total particle number” per km was obtained by dividing the integrated total number ofparticles in the test cycle divided by the distance. In Figure 30, the total particle number inthe NEDC cycle is shown for the two temperatures.
The impact of temperature (Figure 30) was different on the two petrol cars, i.e. an increaseby reducing the temperature in one case and a decrease in the other case. The impact oftemperature on the diesel car without particle filter was negligible, while the car with aparticulate trap showed an increase (although the level was very low at both temperatures).The level for the petrol cars was roughly 2 orders of magnitude lower than for the dieselcar without a particulate trap. These results are consistent with many other results in thepublic domain literature. The diesel car with a particulate filter had more than one order ofmagnitude lower particle emissions than its petrol counterpart. The difference compared tothe diesel car without a filter was some 3 orders of magnitude, implying that the particulatefilter had a dramatic impact on the particle number, as well as on the particulate mass.
In Figure 31, the total particle number in the US06 and overtaking tests are shown. Com-pared to the results in NEDC above (Figure 30), the results in this case were totally differ-ent.
Total (measured) particle number (#/km) in NEDC at +22°C and -7°C
9,5E+12 8,2E+12
1,9E+11
3,5E+13
6,1E+11
7,2E+148,2E+14
4,1E+12
1,0E+11
1,0E+12
1,0E+13
1,0E+14
1,0E+15
SI-P SI-G CI-CR/DPF CI-UI/HP
Tota
l par
ticle
num
ber (
#/km
) NEDC +22°CNEDC -7°C
Petrol Diesel
Figure 30. Total particle number emissions in the NEDC cycle
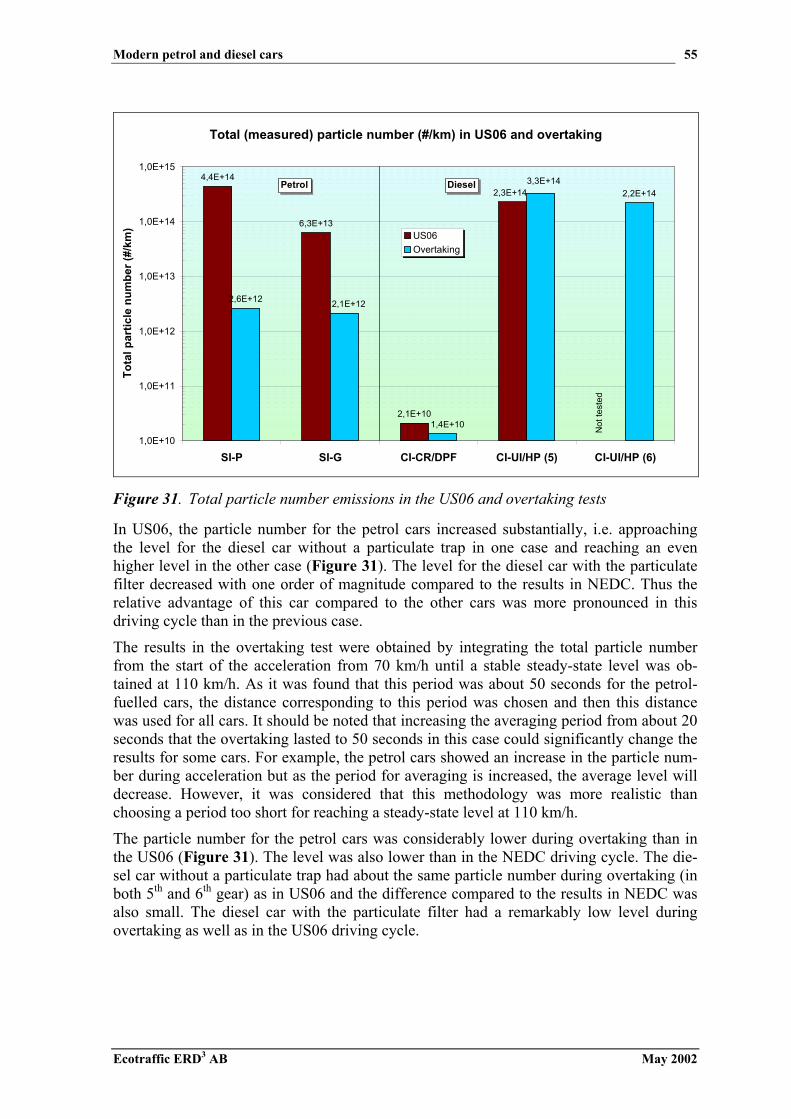
Modern petrol and diesel cars
Ecotraffic ERD3 AB May 2002
55
Total (measured) particle number (#/km) in US06 and overtaking
4,4E+14
6,3E+13
2,1E+10
2,6E+12
2,2E+142,3E+14
1,4E+10
3,3E+14
2,1E+12
1,0E+10
1,0E+11
1,0E+12
1,0E+13
1,0E+14
1,0E+15
SI-P SI-G CI-CR/DPF CI-UI/HP (5) CI-UI/HP (6)
Tota
l par
ticle
num
ber (
#/km
)
US06Overtaking
Petrol Diesel
Not
test
ed
Figure 31. Total particle number emissions in the US06 and overtaking tests
In US06, the particle number for the petrol cars increased substantially, i.e. approachingthe level for the diesel car without a particulate trap in one case and reaching an evenhigher level in the other case (Figure 31). The level for the diesel car with the particulatefilter decreased with one order of magnitude compared to the results in NEDC. Thus therelative advantage of this car compared to the other cars was more pronounced in thisdriving cycle than in the previous case.
The results in the overtaking test were obtained by integrating the total particle numberfrom the start of the acceleration from 70 km/h until a stable steady-state level was ob-tained at 110 km/h. As it was found that this period was about 50 seconds for the petrol-fuelled cars, the distance corresponding to this period was chosen and then this distancewas used for all cars. It should be noted that increasing the averaging period from about 20seconds that the overtaking lasted to 50 seconds in this case could significantly change theresults for some cars. For example, the petrol cars showed an increase in the particle num-ber during acceleration but as the period for averaging is increased, the average level willdecrease. However, it was considered that this methodology was more realistic thanchoosing a period too short for reaching a steady-state level at 110 km/h.
The particle number for the petrol cars was considerably lower during overtaking than inthe US06 (Figure 31). The level was also lower than in the NEDC driving cycle. The die-sel car without a particulate trap had about the same particle number during overtaking (inboth 5th and 6th gear) as in US06 and the difference compared to the results in NEDC wasalso small. The diesel car with the particulate filter had a remarkably low level duringovertaking as well as in the US06 driving cycle.

Modern petrol and diesel cars
Ecotraffic ERD3 AB May 2002
56
Real time particle number resultsA unique feature of the ELPI instrument is its ability to measure particle number in realtime for up to 12 size classes. Thus, the traces of the particle number for each of the 12channels can be recorded and plotted to reveal interesting phenomena that are related to theoperating conditions in the driving cycle. To limit the number of graphs, only the traces ofthe total number of particles has been shown here but it should be noted that the particlesize distribution sometimes shift in real time.
In Figure 32, the results for the real time measurements in NEDC at +22°C are shown forthe Peugeot cars. As can be seen in Figure 32, both cars had higher particle number emis-sions during the cold start phase of the cycle. It is also apparent that the petrol car hadmuch higher spikes, i.e. up to two orders of magnitude higher than for the diesel car. Thelevel of these spikes was much higher than at a steady state-speed of 70, which was re-corded in the overtaking test. Consequently, this appears to be a transient effect. Whetherthe level is a “true” transient effect or simply the effect of some storage and release phe-nomenon (e.g. outgassing of stored volatile compounds) remains to be investigated. Thehigh spikes for the petrol car appears to be the main reason for the significantly highernumber of particles (i.e. more than one order of magnitude) averaged for the whole drivingcycle, as shown in Figure 30 above. Both cars have higher particle number at the high-speed portion at the end of the EUDC cycle.
Total number of particles in real time in NEDC at +22°CDiesel with particulate filter (CI-CR/DPF) vs. petrol (SI-P)
1,0E+07
1,0E+08
1,0E+09
1,0E+10
1,0E+11
1,0E+12
1,0E+13
1,0E+14
0 120 240 360 480 600 720 840 960 1080 1200
Time
Tota
l par
ticle
num
ber (
#/s)
0
100
200
300
400
500
600
700
Spee
d (k
m/h
)
Particle number (#/s), CI-CR/DPFParticle number (#/s), SI-PNominal vehicle speed (km/h)
Figure 32. Real time particle number (#/s) traces in NEDC at +22°C, Peugeot
In Figure 33, the results for the real time measurements in NEDC at +22°C are shown forthe VW Golf cars. In this case, the level for the diesel car was significantly higher than thelevel for the petrol car. It was only for a short period during the cold start phase of the cy-cle that the particle number for the petrol car was on an approximately equal level to thediesel car. In general, the variation was much greater for the petrol car, as could also be

Modern petrol and diesel cars
Ecotraffic ERD3 AB May 2002
57
noted in the previous figure. The petrol car showed a notable impact of the cold start pe-riod (as for the previously discussed petrol car) but the diesel car remained more or lessunaffected by the cold start.
Total number of particles in real time in NEDC at +22°CDiesel with unit injector (CI-UI/HP) vs. petrol (SI-G)
1,0E+07
1,0E+08
1,0E+09
1,0E+10
1,0E+11
1,0E+12
1,0E+13
1,0E+14
0 120 240 360 480 600 720 840 960 1080 1200
Time
Tota
l par
ticle
num
ber (
#/s)
0
100
200
300
400
500
600
700
Spee
d (k
m/h
)
Particle number (#/s), CI-UI/HP Particle number (#/s), SI-G Nominal vehicle speed (km/h)
Figure 33. Real time particle number (#/s) traces in NEDC at +22°C, VW Golf
In Figure 34, the results for the real time measurements in US06 are shown for all the cars.In general, both diesel cars maintained a more stable level than the petrol cars, although thedifference between these two cars was vast. The petrol cars showed a great variation thatwas following the pattern of the driving cycle during approximately 3 minutes in the be-ginning of the driving cycle. After this period, the level was increasing to reach (SI-P) orexceed (SI-G) the level of the diesel car without a particulate filter (CI-UI/HP). Appar-ently, the high-speed portion of the US06 increase the particle number significantly for thepetrol cars. One petrol car (SI-P) remains on the high level of the diesel car without a par-ticulate filter at the end of the cycle, whereas the other petrol car (SI-G) shows a decreasedlevel.
Astonishingly, the diesel car with the particulate filter has low particle number emissionsduring the whole driving cycle in contrast to all the other cars. This indicates a high trap-ping efficiency of the filter and low sulphate formation. In the SAE Paper describing thedevelopment of the particulate filter system, Salvat et al. showed high particulate massemissions at a steady-state speed of 120 km/h with high sulphur fuel (500 ppm), indicatingthat sulphate was formed [5]. The mass emissions and number of particles was signifi-cantly reduced with low-sulphur fuels (10 & 50 ppm). Evidently, the low-sulphur SwedishEC1 diesel fuel used in this test does not contribute significantly to the formation of parti-cles at the high-speed part of the US06 driving cycle, as no increase in total number can beseen. As previously discussed, the particulate mass emissions were also very low in theUS06 driving cycle.

Modern petrol and diesel cars
Ecotraffic ERD3 AB May 2002
58
Total number of particles in real time in US06All four cars
1,0E+07
1,0E+08
1,0E+09
1,0E+10
1,0E+11
1,0E+12
1,0E+13
1,0E+14
0 60 120 180 240 300 360 420 480 540 600
Time (s)
Tota
l par
ticle
num
ber (
#/s)
0
100
200
300
400
500
600
700
Spee
d (k
m/h
)
Part. No. (#/s), SI-PPart. No. (#/s), SI-GPart. No. (#/s), CI-UI/HPPart. No. (#/s), CI-CR/DPFNominal vehicle speed
SI-G
SI-P
CI-UI/HP
CI-CR/DPF
Figure 34. Real time particle number (#/s) traces in US06, all cars
In Figure 35, the results for the real time measurements in the overtaking test are shownfor the all cars.
Total number of particles in real time during overtakingAll four cars (CI-UI/HP tested in 5th and 6th gear)
1,0E+07
1,0E+08
1,0E+09
1,0E+10
1,0E+11
1,0E+12
1,0E+13
1,0E+14
0 10 20 30 40 50 60
Time (s)
Tota
l par
ticle
num
ber (
#/s)
70
120
170
220
270
Spee
d (k
m/h
)Part. No. (#/s), SI-PPart. No. (#/s), SI-GPart. No. (#/s), CI-CR/DPFPart. No. (#/s), CI-UI/HP (5)Part. No. (#/s), CI-UI/HP (6)Nominal vehicle speedSI-G
SI-P
CI-UI/HP (5)
CI-CR/DPF
CI-UI/HP (6)
overtaking is finished in this timeframe
Figure 35. Real time particle number (#/s) traces during overtaking

Modern petrol and diesel cars
Ecotraffic ERD3 AB May 2002
59
As in the previous case (Figure 34), the diesel cars in Figure 35 showed relatively smallvariation during the whole test. The peak in particle number during acceleration was 3 to 4orders of magnitude higher for the petrol cars compared to the steady-state level at 70km/h. The difference between this peak and the steady-state level at 110 km/h was smallerbut still, it was one or almost two orders of magnitude. As for the previous results, the im-pact of the particulate filter was great.
Comparison of total particle number with other studiesAs petrol-fuelled cars previously tested at MTC have showed great variation of particlenumber in the NEDC cycle, it can be concluded that the level presented here for the twopetrol cars is in line with the previous findings. This is on the condition that the upgradingof the ELPI instrument used in this study (by adding an absolute filter as the smallestchannel) is considered.
A report by Färnlund et al. presented and discussed results from measurements on 45 light-duty vehicles performed at the emission laboratory of Rototest [47]. The fuel, engine andaftertreatment technology studied were:
• Cars with DI turbocharged diesel engines (without particulate filter)• One car with a particulate filter (Peugeot 607 HDi)• Cars with naturally aspirated (NA) SI petrol engines• Cars with turbocharged SI engines• Cars with direct injected SI petrol engines.
An ELPI instrument of the same type as in this study (including the smallest filter stage)was also used by Rototest. However, the Rototest chassis dynamometer is of the steady-state type compared to a conventional chassis dynamometer that can handle transients (ve-hicle inertia simulation). Thus, the particle number was measured at 18 different engine-operating points; some of these were at full load. Weighting of the generated test data can“simulate” various driving cycles (albeit without transient effects).
The authors concluded that the number of particles for petrol engines tended to increase asthe air/fuel ratio decreased below stoichiometric condition (λ<1). An increase with higherspecific torque was also seen. An example was that, at full load, a naturally aspirated SIengine could produce the same amount of particles during 0,16 seconds as during one min-ute at 90 km/h. The corresponding factor would be 375, i.e. roughly in line with the in-crease seen in this study for the peak in the acceleration test compared to the steady-statespeed of 70 km/h. The factor in this study was lower when the comparison is made be-tween the peak and a steady-state speed of 90 km/h.
The report by Färnlund et al. also evaluated results for “moderate mixed” and “gentlemixed” driving styles. It is interesting to note that the total particle number for the car witha particulate filter was higher than for the NA SI cars for both evaluated driving styles.Similarly, the difference between this car and the diesel cars without a particulate filter was(only) about a factor of 5. According to the authors, regeneration of the filter was includedin the results but no details on under which conditions this occurred and how this couldhave influenced the results was provided in the report.
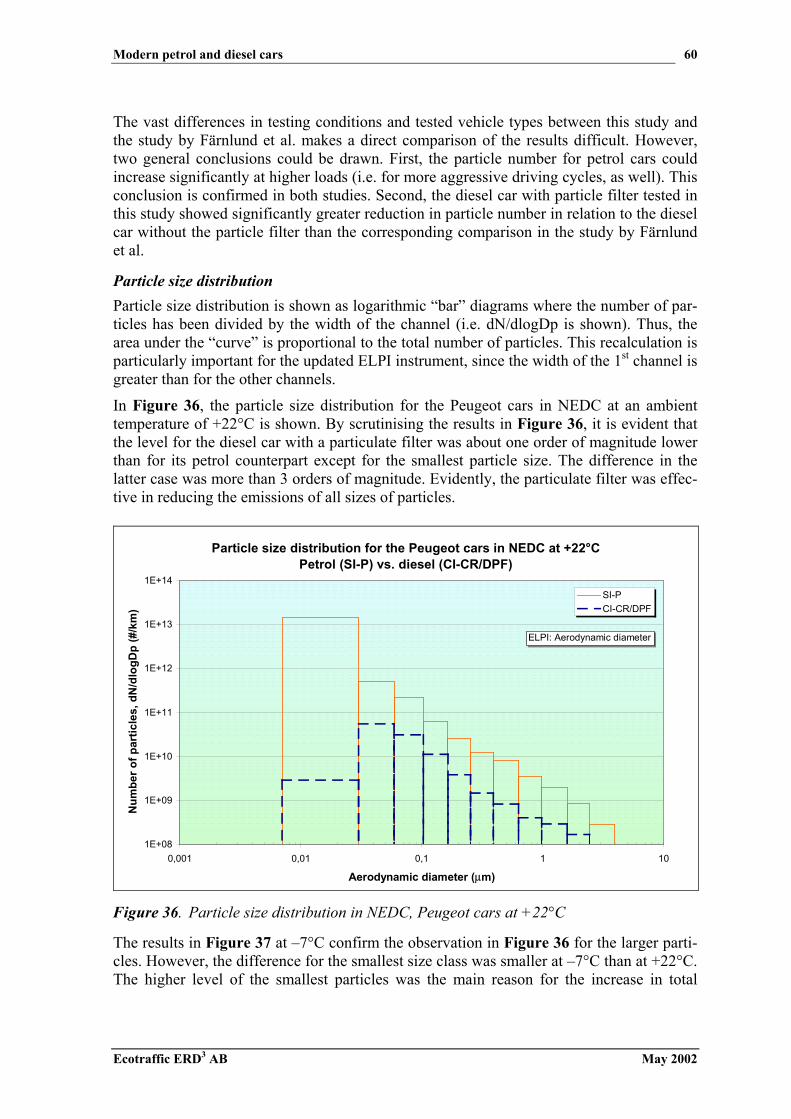
Modern petrol and diesel cars
Ecotraffic ERD3 AB May 2002
60
The vast differences in testing conditions and tested vehicle types between this study andthe study by Färnlund et al. makes a direct comparison of the results difficult. However,two general conclusions could be drawn. First, the particle number for petrol cars couldincrease significantly at higher loads (i.e. for more aggressive driving cycles, as well). Thisconclusion is confirmed in both studies. Second, the diesel car with particle filter tested inthis study showed significantly greater reduction in particle number in relation to the dieselcar without the particle filter than the corresponding comparison in the study by Färnlundet al.
Particle size distributionParticle size distribution is shown as logarithmic “bar” diagrams where the number of par-ticles has been divided by the width of the channel (i.e. dN/dlogDp is shown). Thus, thearea under the “curve” is proportional to the total number of particles. This recalculation isparticularly important for the updated ELPI instrument, since the width of the 1st channel isgreater than for the other channels.
In Figure 36, the particle size distribution for the Peugeot cars in NEDC at an ambienttemperature of +22°C is shown. By scrutinising the results in Figure 36, it is evident thatthe level for the diesel car with a particulate filter was about one order of magnitude lowerthan for its petrol counterpart except for the smallest particle size. The difference in thelatter case was more than 3 orders of magnitude. Evidently, the particulate filter was effec-tive in reducing the emissions of all sizes of particles.
Particle size distribution for the Peugeot cars in NEDC at +22°CPetrol (SI-P) vs. diesel (CI-CR/DPF)
1E+08
1E+09
1E+10
1E+11
1E+12
1E+13
1E+14
0,001 0,01 0,1 1 10
Aerodynamic diameter (µm)
Num
ber o
f par
ticle
s, d
N/d
logD
p (#
/km
)
SI-PCI-CR/DPF
ELPI: Aerodynamic diameter
Figure 36. Particle size distribution in NEDC, Peugeot cars at +22°C
The results in Figure 37 at –7°C confirm the observation in Figure 36 for the larger parti-cles. However, the difference for the smallest size class was smaller at –7°C than at +22°C.The higher level of the smallest particles was the main reason for the increase in total

Modern petrol and diesel cars
Ecotraffic ERD3 AB May 2002
61
number of particles by lowering the temperature, as previously shown in Figure 30. Onepossible reason for a higher level of the smallest particles for the diesel car with the par-ticulate filter at –7°C compared to the level at +22°C could be an increase in the number of“wet” particles.
Particle size distribution for the Peugeot cars in NEDC at -7°CPetrol (SI-P) vs. diesel (CI-CR/DPF)
1E+08
1E+09
1E+10
1E+11
1E+12
1E+13
1E+14
0,001 0,01 0,1 1 10
Aerodynamic diameter (µm)
Num
ber o
f par
ticle
s, d
N/d
logD
p (#
/km
)
SI-PCI-CR/DPF
ELPI: Aerodynamic diameter
Figure 37. Particle size distribution in NEDC, Peugeot cars at -7°C
In Figure 38, the particle size distribution for the VW cars in NEDC at an ambient tem-perature of +22°C is shown. As indicated before, the diesel car had a significantly greaterlevel. In this case, the difference in number of particles was relatively consistent for allsizes but the smallest, where the difference was smaller. However, the difference was nev-ertheless more than one order of magnitude.
The results in Figure 39 at –7°C for the VW cars showed a considerable advantage for thepetrol car compared to its diesel counterpart. The level at this temperature was relativelysimilar for the diesel car compared to the results at +22°C. The level for the petrol car at−7°C was increased in the size range between 25 nm to approximately 400 nm comparedto the level at +22°C. However, the level for the smallest particles was lower at the lowertemperature.
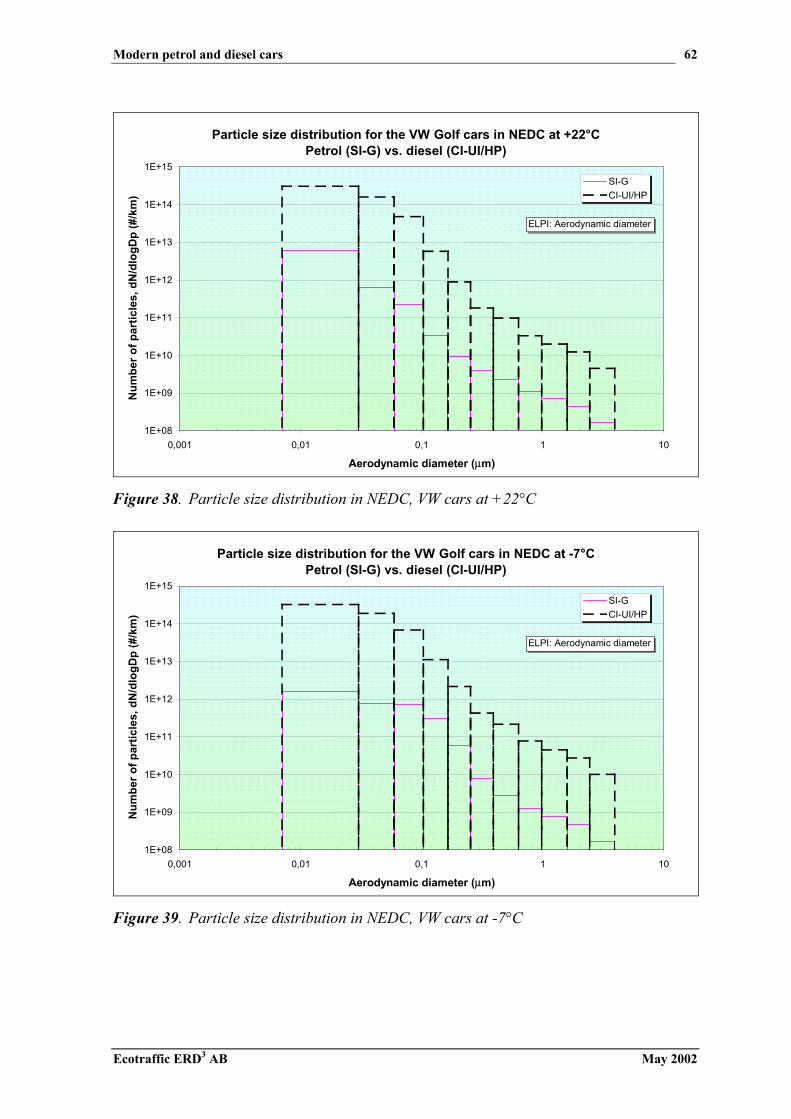
Modern petrol and diesel cars
Ecotraffic ERD3 AB May 2002
62
Particle size distribution for the VW Golf cars in NEDC at +22°CPetrol (SI-G) vs. diesel (CI-UI/HP)
1E+08
1E+09
1E+10
1E+11
1E+12
1E+13
1E+14
1E+15
0,001 0,01 0,1 1 10
Aerodynamic diameter (µm)
Num
ber o
f par
ticle
s, d
N/d
logD
p (#
/km
)
SI-GCI-UI/HP
ELPI: Aerodynamic diameter
Figure 38. Particle size distribution in NEDC, VW cars at +22°C
Particle size distribution for the VW Golf cars in NEDC at -7°CPetrol (SI-G) vs. diesel (CI-UI/HP)
1E+08
1E+09
1E+10
1E+11
1E+12
1E+13
1E+14
1E+15
0,001 0,01 0,1 1 10
Aerodynamic diameter (µm)
Num
ber o
f par
ticle
s, d
N/d
logD
p (#
/km
)
SI-GCI-UI/HP
ELPI: Aerodynamic diameter
Figure 39. Particle size distribution in NEDC, VW cars at -7°C
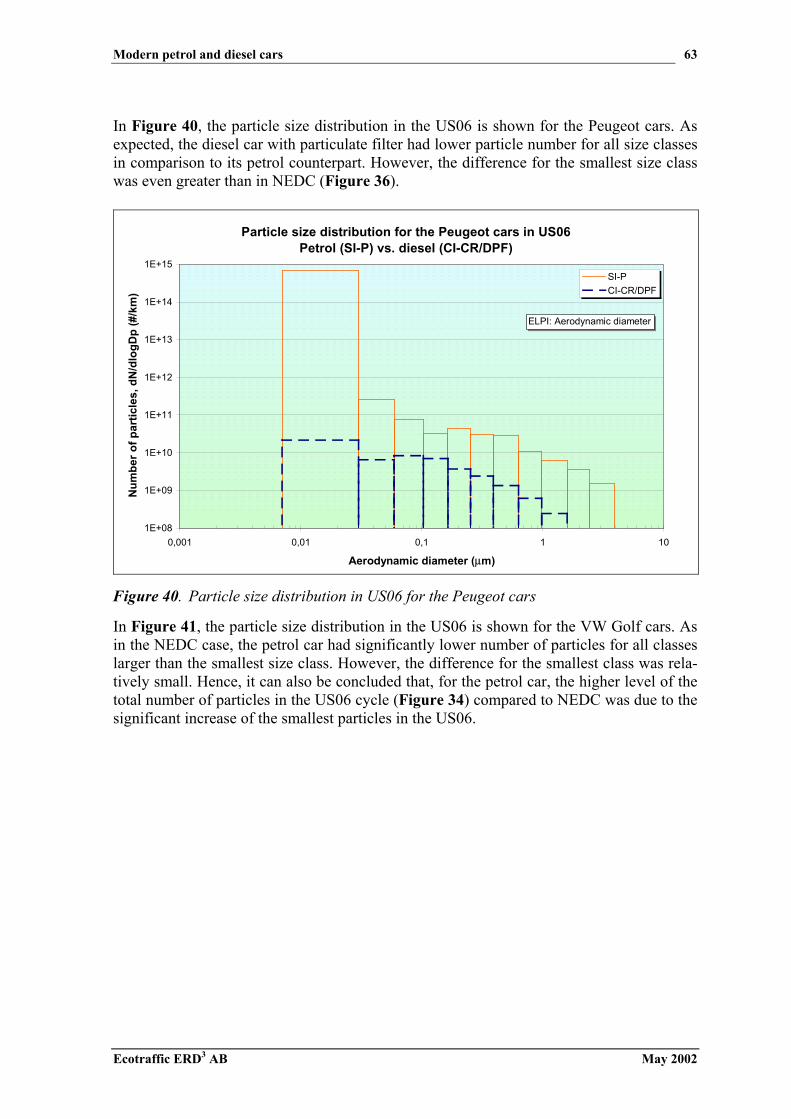
Modern petrol and diesel cars
Ecotraffic ERD3 AB May 2002
63
In Figure 40, the particle size distribution in the US06 is shown for the Peugeot cars. Asexpected, the diesel car with particulate filter had lower particle number for all size classesin comparison to its petrol counterpart. However, the difference for the smallest size classwas even greater than in NEDC (Figure 36).
Particle size distribution for the Peugeot cars in US06Petrol (SI-P) vs. diesel (CI-CR/DPF)
1E+08
1E+09
1E+10
1E+11
1E+12
1E+13
1E+14
1E+15
0,001 0,01 0,1 1 10
Aerodynamic diameter (µm)
Num
ber o
f par
ticle
s, d
N/d
logD
p (#
/km
)
SI-PCI-CR/DPF
ELPI: Aerodynamic diameter
Figure 40. Particle size distribution in US06 for the Peugeot cars
In Figure 41, the particle size distribution in the US06 is shown for the VW Golf cars. Asin the NEDC case, the petrol car had significantly lower number of particles for all classeslarger than the smallest size class. However, the difference for the smallest class was rela-tively small. Hence, it can also be concluded that, for the petrol car, the higher level of thetotal number of particles in the US06 cycle (Figure 34) compared to NEDC was due to thesignificant increase of the smallest particles in the US06.

Modern petrol and diesel cars
Ecotraffic ERD3 AB May 2002
64
Particle size distribution for the VW Golf cars in US06Petrol (SI-G) vs. diesel (CI-UI/HP)
1E+08
1E+09
1E+10
1E+11
1E+12
1E+13
1E+14
1E+15
0,001 0,01 0,1 1 10
Aerodynamic diameter (µm)
Num
ber o
f par
ticle
s, d
N/d
logD
p (#
/km
)
SI-GCI-UI/HP
ELPI: Aerodynamic diameter
Figure 41. Particle size distribution in US06 for the VW Golf cars
In Figure 42, the particle size distributionduring overtaking is shown for the Peugeotcars. Contrary to the NEDC and US06 cycles,the difference for the larger size classes wassmaller, although there was a noticeable dif-ference. Again, there was a considerable dif-ference for the smallest size. However, therelative difference was smaller than for theNEDC and US06 cycles.
In Figure 43, the particle size distributionduring overtaking is shown for the VW Golfcars, where the diesel car was tested in 5h
gear. The results for the 6th gear are notshown as they were very similar to the resultsin 5th gear. In Figure 43, the petrol car had aclear advantage for all size classes. The dif-ference was two orders of magnitude (small-est size) or greater (all other sizes).
Particle size measurementsComparing data on particle size distri-bution generated at MTC with datafrom other laboratories often show ashift towards very small particles in theMTC case. The apparent differencecould be due to the instrument used(ELPI vs. SMPS) or the sampling sys-tem. The “best” measurement principleand methodology in this respect hasnot yet been found. However, resultson particle size distribution musttreated with care, due to the lack ofgeneral understanding of all the phe-nomena in this area.
Ecotraffic’s comments
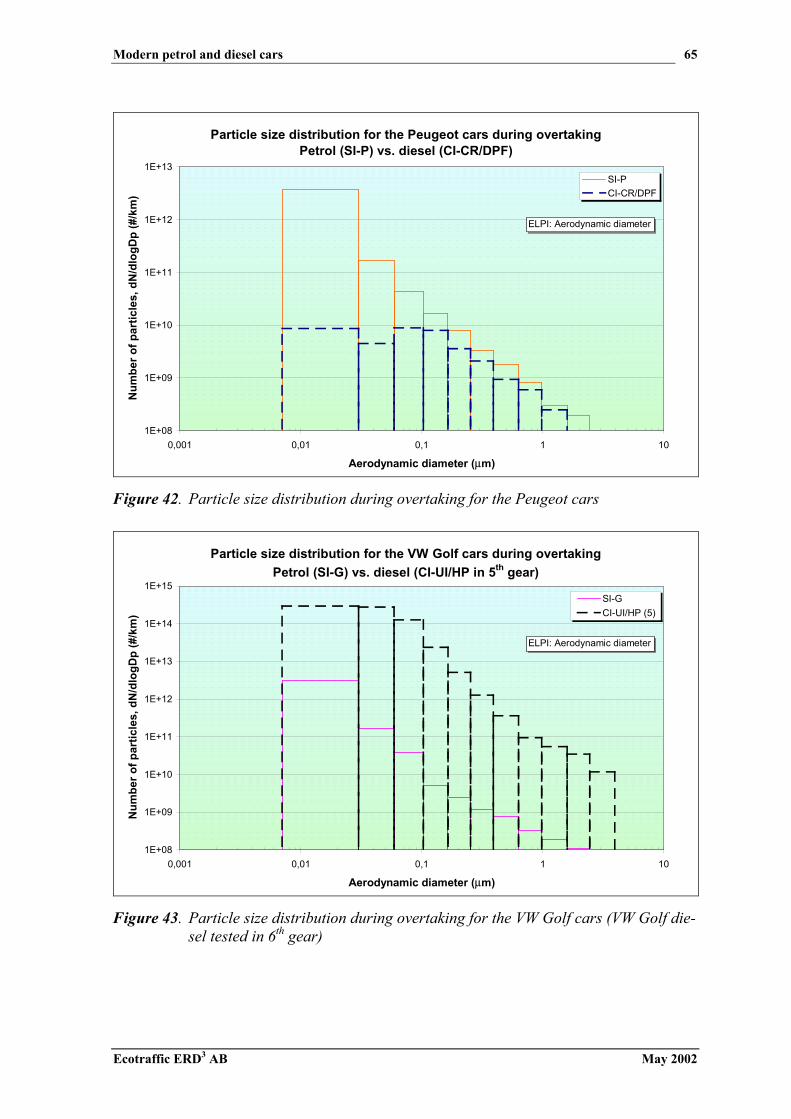
Modern petrol and diesel cars
Ecotraffic ERD3 AB May 2002
65
Particle size distribution for the Peugeot cars during overtakingPetrol (SI-P) vs. diesel (CI-CR/DPF)
1E+08
1E+09
1E+10
1E+11
1E+12
1E+13
0,001 0,01 0,1 1 10
Aerodynamic diameter (µm)
Num
ber o
f par
ticle
s, d
N/d
logD
p (#
/km
)
SI-PCI-CR/DPF
ELPI: Aerodynamic diameter
Figure 42. Particle size distribution during overtaking for the Peugeot cars
Particle size distribution for the VW Golf cars during overtakingPetrol (SI-G) vs. diesel (CI-UI/HP in 5th gear)
1E+08
1E+09
1E+10
1E+11
1E+12
1E+13
1E+14
1E+15
0,001 0,01 0,1 1 10
Aerodynamic diameter (µm)
Num
ber o
f par
ticle
s, d
N/d
logD
p (#
/km
)
SI-GCI-UI/HP (5)
ELPI: Aerodynamic diameter
Figure 43. Particle size distribution during overtaking for the VW Golf cars (VW Golf die-sel tested in 6th gear)

Modern petrol and diesel cars
Ecotraffic ERD3 AB May 2002
66
Impact of high-pressure direct injection on particle size and numberIt has been more or less accepted by the public opinion that new diesel cars emit smallerparticles and greater number of particles than old diesel cars. Thus, the health impact ofnew diesel cars could be even greater than from old cars provided that smaller particlespose a greater health hazard than larger. However, there is very little evidence in support ofthis hypothesis in the open literature. In a previous study by this author, 2 IDI and 3 DIcars were studied [4]. It was found that the car with DI engines did not emit more particlesthan the cars with IDI engines. Instead, there was a trend to an opposite result, althoughthe difference was small. Neither did the DI engines emit larger number of small particles.However, the tested DI engines in that study had rotary pumps that could not provide thehigh injection pressure of modern injection systems. The particulate mass emissions werealso on a roughly similar level. Therefore, the question about the impact of high-pressureinjection is still valid.
In a study commissioned by the engine manufactures association ACEA, a number of pet-rol and diesel-fuelled cars were tested [48]. In this case, DI diesel cars with high-pressureinjection could be compared to older cars. Again, the results did not support the hypothesisabout higher particle number and smaller size for the modern cars. Other researchers havealso reported similar results.
An example can illustrate the differencebetween a car with an older IDI engineand a car with a modern engine withhigh-pressure injection. Data from thecar with the IDI engine were obtainedfrom a study on particulate size meas-urements the author participated in [49].These data were compared with the datagenerated in this study. To ensure thatthe comparison was made correct, thenumber of channels in the ELPI instru-ment included in the evaluation was re-duced for the data in this study to corre-spond to the previous study (8 channels).Likewise, the absolute filter was not in-cluded. The results for the total numberof particles are shown in Figure 44. Thenew Golf with the DI engine had about40% lower number of particles. Al-though this difference was too small todraw any firm conclusions, there is notmuch support for the hypothesis of anincreased number of particles for newdiesel cars, either.
The total particle number traces for the two cars mentioned above are shown in Figure 45(shown in a different scale than previous figures to highlight differences).
Particle number emissions from an old car with IDI engine (Golf 1993)
and a modern DI engine (Golf 2001)
1,1E+14
1,7E+14
1,0E+11
5,0E+13
1,0E+14
1,5E+14
2,0E+14
Golf 1993, IDI Golf 2001, DI
Tota
l par
ticle
num
ber (
#/km
)
Source: SAE 980410Golf '93 IDI
Figure 44. Total particle number emissions forIDI and DI engines (VW Golf)
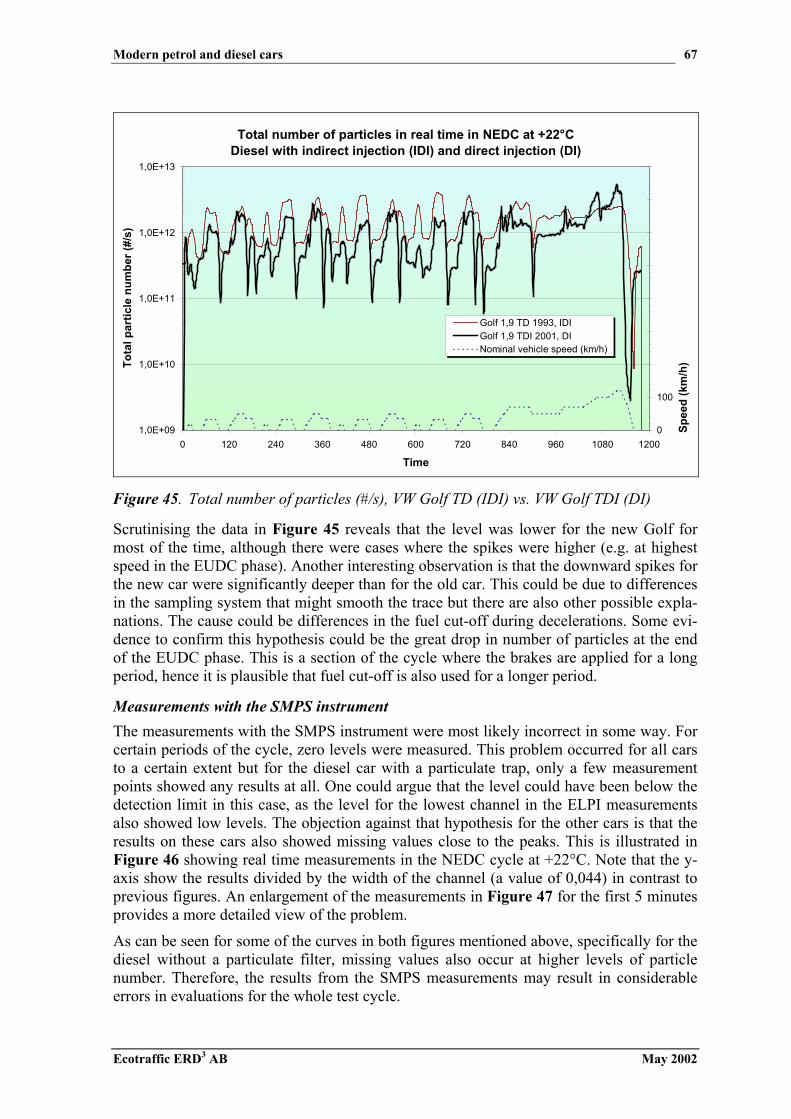
Modern petrol and diesel cars
Ecotraffic ERD3 AB May 2002
67
Total number of particles in real time in NEDC at +22°CDiesel with indirect injection (IDI) and direct injection (DI)
1,0E+09
1,0E+10
1,0E+11
1,0E+12
1,0E+13
0 120 240 360 480 600 720 840 960 1080 1200
Time
Tota
l par
ticle
num
ber (
#/s)
0
100
200
300
400
500
600
700
800
Spee
d (k
m/h
)
Golf 1,9 TD 1993, IDIGolf 1,9 TDI 2001, DINominal vehicle speed (km/h)
Figure 45. Total number of particles (#/s), VW Golf TD (IDI) vs. VW Golf TDI (DI)
Scrutinising the data in Figure 45 reveals that the level was lower for the new Golf formost of the time, although there were cases where the spikes were higher (e.g. at highestspeed in the EUDC phase). Another interesting observation is that the downward spikes forthe new car were significantly deeper than for the old car. This could be due to differencesin the sampling system that might smooth the trace but there are also other possible expla-nations. The cause could be differences in the fuel cut-off during decelerations. Some evi-dence to confirm this hypothesis could be the great drop in number of particles at the endof the EUDC phase. This is a section of the cycle where the brakes are applied for a longperiod, hence it is plausible that fuel cut-off is also used for a longer period.
Measurements with the SMPS instrumentThe measurements with the SMPS instrument were most likely incorrect in some way. Forcertain periods of the cycle, zero levels were measured. This problem occurred for all carsto a certain extent but for the diesel car with a particulate trap, only a few measurementpoints showed any results at all. One could argue that the level could have been below thedetection limit in this case, as the level for the lowest channel in the ELPI measurementsalso showed low levels. The objection against that hypothesis for the other cars is that theresults on these cars also showed missing values close to the peaks. This is illustrated inFigure 46 showing real time measurements in the NEDC cycle at +22°C. Note that the y-axis show the results divided by the width of the channel (a value of 0,044) in contrast toprevious figures. An enlargement of the measurements in Figure 47 for the first 5 minutesprovides a more detailed view of the problem.
As can be seen for some of the curves in both figures mentioned above, specifically for thediesel without a particulate filter, missing values also occur at higher levels of particlenumber. Therefore, the results from the SMPS measurements may result in considerableerrors in evaluations for the whole test cycle.

Modern petrol and diesel cars
Ecotraffic ERD3 AB May 2002
68
Real time SMPS results on particle number in the 5 nm class (4,7-5,2 nm) NEDC at +22°C, all four cars
1,0E+04
1,0E+05
1,0E+06
1,0E+07
1,0E+08
1,0E+09
1,0E+10
1,0E+11
0 120 240 360 480 600 720 840 960 1080 1200
Time (s)
Part
icle
num
ber d
N/d
logD
p (#
/s)
0
100
200
300
400
500
600
700
Spee
d (k
m/h
)
SI-PSI-GCI-CR/DPFCI-UI/HPNom. veh. speed
SI-G
SI-P
CI-UI/HP
CI-CR/DPF
Figure 46. Real time SMPS results in NEDC on 5 nm particles (#/s)
Real time SMPS results on particle number in the 5 nm class (4,7-5,2 nm) First 5 minutes of NEDC at +22°C, all four cars
1,0E+04
1,0E+05
1,0E+06
1,0E+07
1,0E+08
1,0E+09
1,0E+10
1,0E+11
0 20 40 60 80 100 120 140 160 180 200 220 240 260 280 300
Time (s)
Part
icle
num
ber d
N/d
logD
p (#
/s)
0
100
200
300
400
500
600
700
Spee
d (k
m/h
)
SI-PSI-GCI-CR/DPFCI-UI/HPNom. veh. speed
SI-GSI-P
CI-UI/HP
CI-CR/DPF
Figure 47. Real time SMPS results for the first 5 minutes of NEDC on 5 nm particles (#/s)
An attempt to evaluate the number of particles in the cycle was made by averaging the val-ues that were not zero and multiplying this value with the length of the cycle. This givesthe results in Figure 48. As can be seen the diesel car with a particulate filter had the low-

Modern petrol and diesel cars
Ecotraffic ERD3 AB May 2002
69
est level but on the other hand, only a few measurement points were recorded on this car.The petrol cars show somewhat lower (SI-G) or significantly higher (SI-P) levels than thediesel car without a particulate filter. However, as mentioned above, the results from theSMPS measurements may not be reliable. Therefore, the results from the other tests withthe SMPS instrument are not reported here.
SMPS results on particle number in the 5 nm class (4,7-5,2 nm)NEDC (#/km) at +22°C and -7°C, all four cars
4,1E+09
1,2E+08
1,7E+05
9,3E+09
1,1E+05
6,3E+08
2,9E+084,1E+08
1,0E+05
1,0E+06
1,0E+07
1,0E+08
1,0E+09
1,0E+10
SI-P SI-G CI-CR/DPF CI-UI/HP
Part
icle
num
ber (
#/km
)
NEDC +22°CNEDC -7°C
Petrol Diesel
Figure 48. SMPS results on 5 nm particles in NEDC (#/km)
4.3 Impact on environment and healthAs mentioned before, the evaluation of the impact on environment and health include theresults on older cars (model year 1993/1994) generated in a study mentioned before [1].Although the Swedish emission regulation at that time corresponded to previous regula-tions in the USA and in California, one can say that the emission level of these carsroughly corresponded to Euro 1.
Showing the old data provide some perspective to the results generated in this study. How-ever, there are some important comments that should be made. The previous study tookdriving pattern, ageing (emission deterioration) and climate into consideration. Drivingpattern is not an issue, as the NEDC cycle is used extensively for the evaluation in thisstudy as well. Climate is also taken into consideration, as the same average temperature(+7°C) is used in all cases. However, one should note that no correction for the ageing ismade for the new cars evaluated in this study. The emission level for the old cars had beencorrected to an average odometer reading of 80 000 km. Therefore, the improvementshown here is probably an overestimation. One should also note that only two cars runningon each fuel has been tested in this study. Consequently, these cars cannot be consideredrepresentative for the whole population of new cars.

Modern petrol and diesel cars
Ecotraffic ERD3 AB May 2002
70
4.3.1 Local effects, acute respiratory diseases
Ozone (O3) formation potentialAs mentioned before, the ozone formation potential was calculated by using HC emissiondata interpolated to +14°C and applying reactivity adjustment factors for each fuel. To re-flect the improvement of the new fuel qualities, the results for the old cars was recalculatedas well. The results for the ozone forming potential are shown in Figure 49.
Ozone forming potential evaluated at an average temperature of +14°CBaseline (index=100): petrol-fuelled cars of model year 93/94
16,4
38,3
14,2
2,1 2,4
100
0
20
40
60
80
100
120
Petrol 93/94 SI-P SI-GDiesel 93/94
CI-CR/DPF CI-UI/HP
Ozo
ne fo
rmin
g po
tent
ial (
petr
ol 9
3/94
=100
) DieselPetrol
Figure 49. Ozone forming potential
Due to the significantly lower HC emissions from the diesel cars, the ozone forming po-tential, as shown in Figure 49, was generally significantly lower for this category of vehi-cles compared to the petrol cars. This is valid regardless whether new or old cars are com-pared. However, one should also note that the improvement for the new petrol cars wasvast for both fuel categories. Comparing the ozone forming potential averaged for the forthe new petrol cars with the average for the new diesel cars, yields a difference of morethan one order of magnitude.
Note that the evaporative emissions from the vehicles were not included in the evaluationof the ozone forming potential, neither was this done for the evaporation losses from fueldistribution and refuelling. As these emissions were higher for petrol cars, the ozone for-mation from these cars is underestimated.
There is some concern about the validity of the RAF values used in the evaluation and newdata on this issue might slightly change the results. It is also important to note that theevaporative emissions from the vehicles, or from fuel distribution and refuelling has not

Modern petrol and diesel cars
Ecotraffic ERD3 AB May 2002
71
been included in the analysis. Should this be taken into account, the relative“disadvantage” for the petrol cars would increase substantially21.
Nitrogen dioxide (NO2) forming potentialAs mentioned before, the total NOX emissions (calculated as NO2) were compared as thepotential for NO2 formation. Therefore, the results and comments are similar to the resultsin Figure 9, except that the results have been evaluated for +7°C in this case. To simplifythe presentation, an index has been shown. As the NOX emissions have been commentedbefore, only a few notes are added here.
It can be seen in Figure 9 that the improvement of NOX emissions for the petrol cars since1993/1994 has been considerable. The improvement for the diesel cars was less, both inrelative and absolute numbers. As mentioned before, the higher NOX emissions at –7°Ccompared to +22°C for the new diesel cars is a contributing factor to that the reduction hasnot been as great as expected. In the future, a significant reduction of the NOX emissionsfrom diesel cars will be necessary. As the aftertreatment devices used on diesel cars todayhas very little impact on the NOX emissions, a NOX reducing catalyst could reduce thelevel significantly. With a conversion efficiency of 90%, a similar level to the results onthe petrol cars could be achieved22. Such devices are currently being developed.
NOX emissions evaluated at an average temperature of +7°CBaseline (index=100): petrol-fuelled cars of model year 93/94
15,8 11,8
100
192
137129
0
50
100
150
200
250
Petrol 93/94 SI-P SI-GDiesel 93/94
CI-CR/DPF CI-UI/HP
NO
X em
issi
ons
(pet
rol 9
3/94
=100
)
DieselPetrol
Figure 50. Local NOX emissions
21 Note that the evaporative emissions from diesel cars and from the fuel distribution of diesel fuel are negli-gible.22 Reducing the engine-out NOX emission level by 50% (to Euro IV) would require “only” 80% reductionefficiency of the catalyst to achieve similar results as in the example showed.
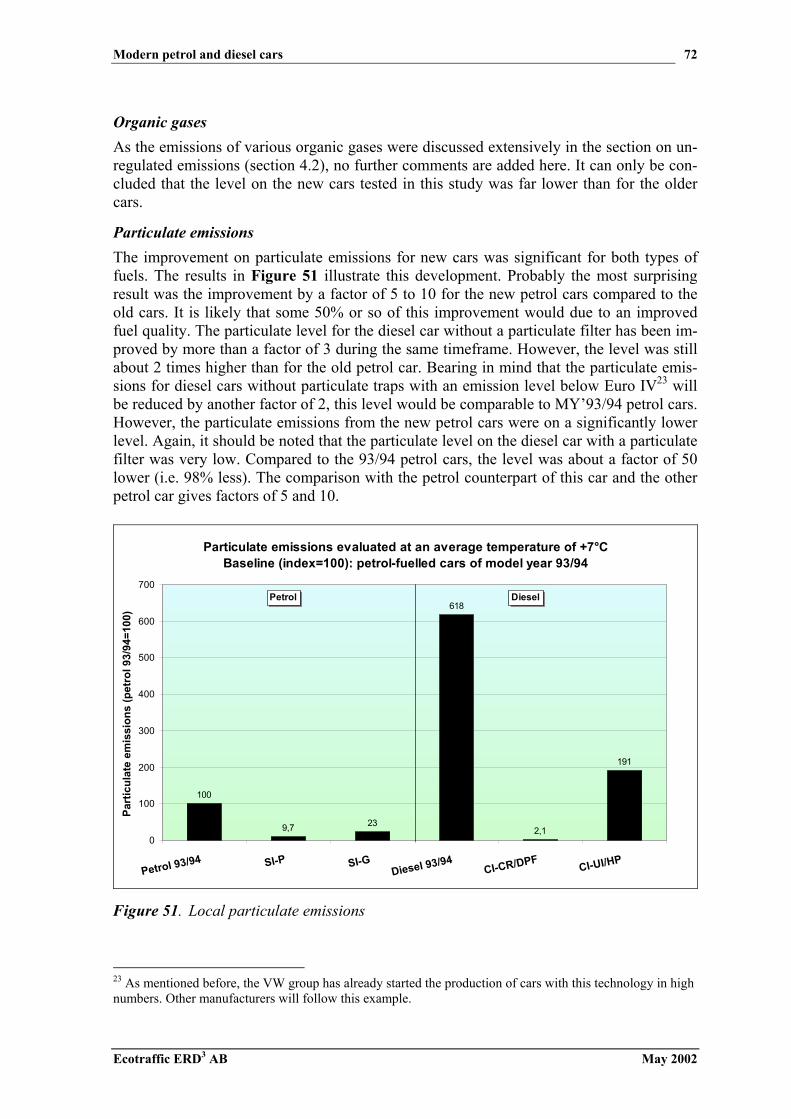
Modern petrol and diesel cars
Ecotraffic ERD3 AB May 2002
72
Organic gasesAs the emissions of various organic gases were discussed extensively in the section on un-regulated emissions (section 4.2), no further comments are added here. It can only be con-cluded that the level on the new cars tested in this study was far lower than for the oldercars.
Particulate emissionsThe improvement on particulate emissions for new cars was significant for both types offuels. The results in Figure 51 illustrate this development. Probably the most surprisingresult was the improvement by a factor of 5 to 10 for the new petrol cars compared to theold cars. It is likely that some 50% or so of this improvement would due to an improvedfuel quality. The particulate level for the diesel car without a particulate filter has been im-proved by more than a factor of 3 during the same timeframe. However, the level was stillabout 2 times higher than for the old petrol car. Bearing in mind that the particulate emis-sions for diesel cars without particulate traps with an emission level below Euro IV23 willbe reduced by another factor of 2, this level would be comparable to MY’93/94 petrol cars.However, the particulate emissions from the new petrol cars were on a significantly lowerlevel. Again, it should be noted that the particulate level on the diesel car with a particulatefilter was very low. Compared to the 93/94 petrol cars, the level was about a factor of 50lower (i.e. 98% less). The comparison with the petrol counterpart of this car and the otherpetrol car gives factors of 5 and 10.
Particulate emissions evaluated at an average temperature of +7°CBaseline (index=100): petrol-fuelled cars of model year 93/94
100
23
618
191
2,19,70
100
200
300
400
500
600
700
Petrol 93/94 SI-P SI-GDiesel 93/94
CI-CR/DPF CI-UI/HP
Part
icul
ate
emis
sion
s (p
etro
l 93/
94=1
00)
DieselPetrol
Figure 51. Local particulate emissions
23 As mentioned before, the VW group has already started the production of cars with this technology in highnumbers. Other manufacturers will follow this example.

Modern petrol and diesel cars
Ecotraffic ERD3 AB May 2002
73
4.3.2 Local effects, cancer riskThe results on the cancer risk index are probably the most interesting results. However, theuncertainty about the results is also greatest for this effect. In particular, the values for theunit risk factors is an area of concern but also the measurement of some of the unregulatedemission components is a difficult task. Therefore, results should differ by at least a factorof 2 or more to be considered as a real difference.
In Figure 52, the cancer risk index is shown. To simplify the presentation, the alkenes andaldehydes are grouped together.
Cancer risk index (petrol 93/94=100)
0
20
40
60
80
100
120
Petrol 93/94 SI-P SI-G Diesel 93/94 CI-CR/DPF CI-UI/HP
Can
cer r
isk
inde
x (p
etro
l 93/
94=1
00)
PACAldehydesAlkenesBenzeneParticulates
100
11
71
2,2
15
4,0
Petrol Diesel
Figure 52. Cancer risk index
For the 93/94 cars, there was a difference between petrol and diesel cars, but as the differ-ence was only about 30%, it should not be considered as significant (Figure 52). However,these results were considered somewhat sensational when the report previously cited waspublished24 [1]. The projections in the report for 2000 (Euro III) and 2010 showed an ap-proximately similar level for petrol and diesel cars, but of course, a substantial improve-ment with new technology in both cases. It should be noted that the recent improvement offuel qualities for petrol and diesel fuel was not taken into consideration in the evaluation ofthe 1993/1994 cars. As the data for making corrections to consider the fuel improvementsis somewhat limited, it was decided to keep the old data unchanged. This would also betterillustrate the total improvement over time (by both fuel and engine technology).
24 Emission data for making this kind of analysis had been more or less available already 5 − 10 years earlier.A set of unit risk factors had also been established by Swedish researchers. However, an analysis of this kindhad not been carried out before using all the available data and making the necessary corrections of the emis-sion factors.
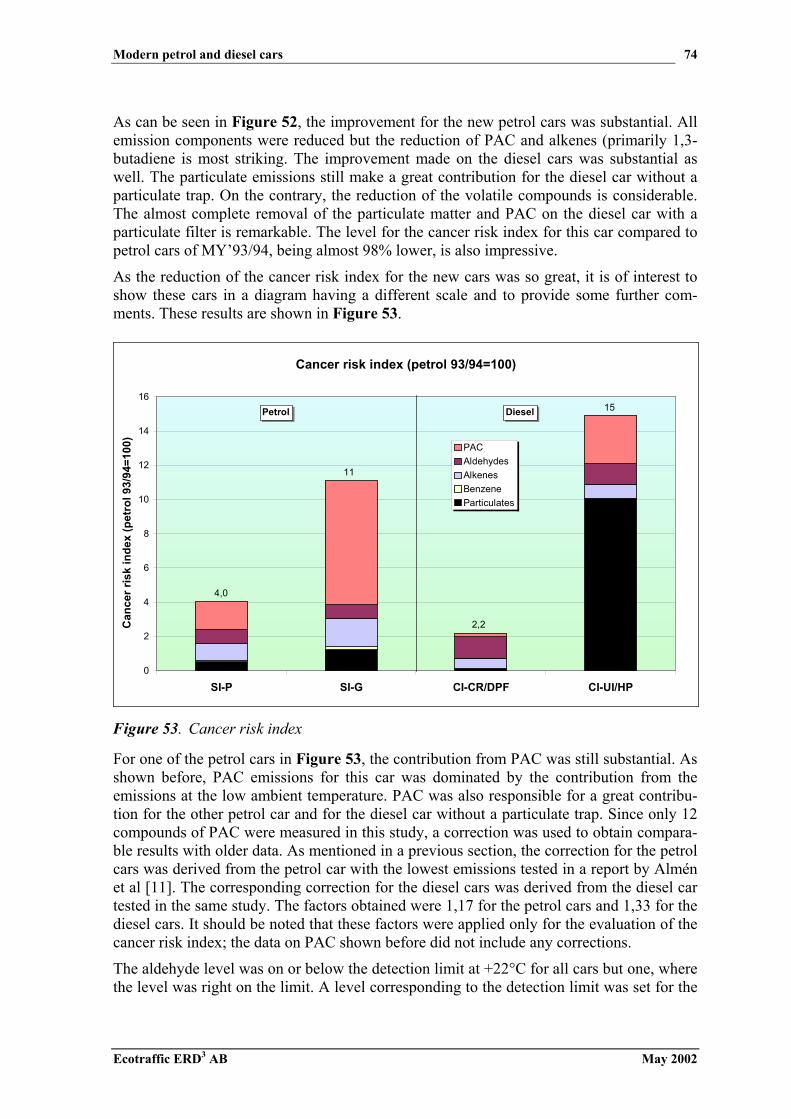
Modern petrol and diesel cars
Ecotraffic ERD3 AB May 2002
74
As can be seen in Figure 52, the improvement for the new petrol cars was substantial. Allemission components were reduced but the reduction of PAC and alkenes (primarily 1,3-butadiene is most striking. The improvement made on the diesel cars was substantial aswell. The particulate emissions still make a great contribution for the diesel car without aparticulate trap. On the contrary, the reduction of the volatile compounds is considerable.The almost complete removal of the particulate matter and PAC on the diesel car with aparticulate filter is remarkable. The level for the cancer risk index for this car compared topetrol cars of MY’93/94, being almost 98% lower, is also impressive.
As the reduction of the cancer risk index for the new cars was so great, it is of interest toshow these cars in a diagram having a different scale and to provide some further com-ments. These results are shown in Figure 53.
Cancer risk index (petrol 93/94=100)
0
2
4
6
8
10
12
14
16
SI-P SI-G CI-CR/DPF CI-UI/HP
Can
cer r
isk
inde
x (p
etro
l 93/
94=1
00)
PACAldehydesAlkenesBenzeneParticulates
4,0
11
2,2
15Petrol Diesel
Figure 53. Cancer risk index
For one of the petrol cars in Figure 53, the contribution from PAC was still substantial. Asshown before, PAC emissions for this car was dominated by the contribution from theemissions at the low ambient temperature. PAC was also responsible for a great contribu-tion for the other petrol car and for the diesel car without a particulate trap. Since only 12compounds of PAC were measured in this study, a correction was used to obtain compara-ble results with older data. As mentioned in a previous section, the correction for the petrolcars was derived from the petrol car with the lowest emissions tested in a report by Alménet al [11]. The corresponding correction for the diesel cars was derived from the diesel cartested in the same study. The factors obtained were 1,17 for the petrol cars and 1,33 for thediesel cars. It should be noted that these factors were applied only for the evaluation of thecancer risk index; the data on PAC shown before did not include any corrections.
The aldehyde level was on or below the detection limit at +22°C for all cars but one, wherethe level was right on the limit. A level corresponding to the detection limit was set for the
Modern petrol and diesel cars
Ecotraffic ERD3 AB May 2002
75
cars that had a level below the detection limit. This could lead to an overestimation of thecontribution from the aldehydes in these cases but it was motivated by the “precautionaryprinciple”. Both diesel cars had a level 2 times higher than the detection limit at –7°C andthis level was used in the calculations. Note that the unit risk factor (URF) used for for-maldehyde (the greatest contributor of the aldehydes) was relatively high, e.g. 10 timeshigher than in the previously cited EPA evaluation. Using a significantly lower URF wouldalso reduce the importance of formaldehyde in this respect.
As the emissions of 1,3-butadiene were higher for petrol cars than for diesel cars, this isalso shown in the greater total contribution from the alkenes. Anyway, the contributionfrom the alkenes was totally dominated by 1,3-butadiene for all vehicles.
Benzene has very little impact on the cancer risk in this evaluation. However, one shouldnote that as the evaporative emissions are not included in the results, the contribution frombenzene would be significantly greater if this had been taken into account as well. Notethat the contribution from benzene for the MY’93/94 petrol cars in Figure 52 was alsosmall. Recent measurements of ambient air quality in Sweden show that the level of ben-zene is still relatively high, and in many cases, it is higher than the future limits for ambi-ent air quality in the EU. There are many other sources to benzene in ambient air thancatalyst cars (e.g. wood burning and cars w/o catalyst). However, in view of the apparentimprovement by the introduction of catalysts, it is still puzzling to find that the reduction ofthe ambient level of benzene progress at such slow speed.
The contribution to the cancer risk index from particulate matter was discussed above butthe picture is even more clear in Figure 53. It should be noted that only the total particlemass has been taken into account. Whether the particle size distribution has any impact oncancer risk is yet somewhat unclear. The other issue to take into account is the relationbetween volatile and solid particles.
4.3.3 Regional effects
AcidificationThe evaluation of acidification in this study comprises NOX, SOX and NH3. Data for fuelproduction have been obtained from “Life of fuels” a previous lifecycle analysis carriedout by Ecotraffic [15]. This study contained no data on emissions of NH3 from fuel pro-duction but the levels that could be expected are very low. A recalculation of the results forthe old cars have been carried out to take into account that the sulphur level in both fueltypes has been reduced. A level of 4 ppm (limit: <10ppm) for diesel fuel and a level of 30ppm (limit: 50 ppm) for petrol was anticipated to be representative levels for commercialfuels. In both cases, the sulphur level was so low that the contribution to the acidificationfrom fuel sulphur was negligible.
In Figure 54, the results on acidification potential have been shown. The results are di-vided into the stages fuel production (including distribution and refuelling) and the end usein the vehicle.
The results in Figure 54, show that the level for acidification from diesel cars in generalwas considerably higher than from petrol cars. The new diesel cars were about equal to theold petrol cars in this respect. The relatively high level for the diesel cars was mainly dueto the high NOX levels from the vehicles. The contribution from fuel production wasgreater for petrol in comparison to diesel fuel. Diesel cars have lower fuel consumption

Modern petrol and diesel cars
Ecotraffic ERD3 AB May 2002
76
and the production of diesel fuel generates less NOX and SOX per unit of energy in the fuelthan the production of petrol does. Hence, the contribution from fuel production was alsolower in the diesel case.
Acidification potential (in NOX equivalents)Baseline (index=100): petrol-fuelled cars of model year 93/94
27
59,079,7 75,2
41 37 36 31 27
112
9,210,5
0
20
40
60
80
100
120
140
160
Petrol 93/94 SI-P SI-GDiesel 93/94
CI-CR/DPF CI-UI/HP
Aci
dific
atio
n in
dex
(pet
rol 9
3/94
=100
)
VehicleFuel prod.
100
DieselPetrol
47,5 45,0
143
106 102
Figure 54. Acidification potential
The reduction in NOX emissions, as seen in previous results, can be noted in Figure 54 aswell, since the contribution from SOX and NH3 from the vehicles was negligible. Due tothe significant reduction of NOX emissions from the petrol cars, the acidification wasdominated by the emissions from fuel production. It could be noted that the level for fuelproduction in modern plants probably would be somewhat lower than in the Life of Fuelsreport, since this report is 10 years old. Anyway, the necessity of reducing the NOX andSOX emissions from fuel production as well as from the vehicles is evident.
EutrophicationAs noted before, the emissions of ammonia (NH3) were very low for all cars in this study.A similar conclusion can be made for the N2O emissions. Therefore, NOX emissions arethe main source of nitrogen containing compounds in the exhaust from these vehicles. Asmentioned before, NH3 emissions were not included in the calculation of effects on the oldcars. Consequently, a slight underestimation might be the case for the old petrol cars, as theNH3 emissions would probably not have been negligible in this case. It should also benoted that the nitrogen counting compounds do not behave in a similar manner in the at-mosphere. NOX and NH3 are deposited relatively fast, in contrast to N2O that has lasts inthe atmosphere for well over hundred years. Therefore, only NOX and NH3 have beentaken into account in calculating the eutrophication potential.
The results for the eutrophication potential are shown in Figure 55. The results on eutro-phication are showing a somewhat similar trend to the results on acidification above
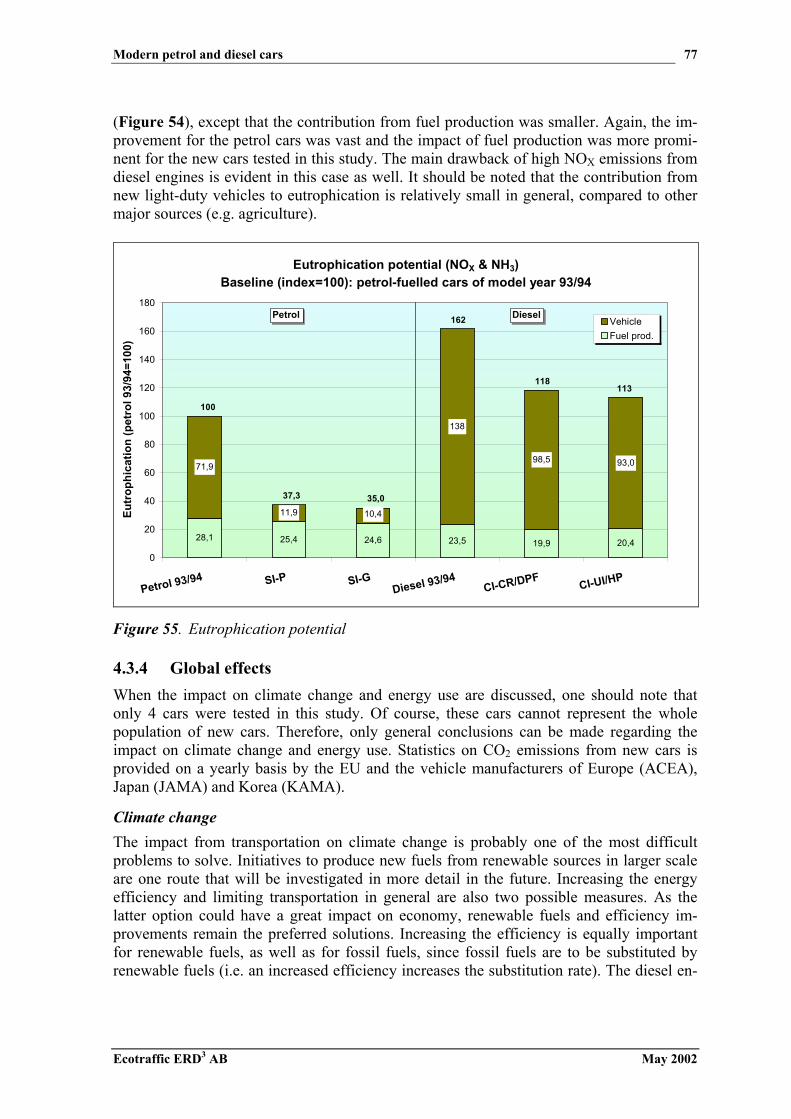
Modern petrol and diesel cars
Ecotraffic ERD3 AB May 2002
77
(Figure 54), except that the contribution from fuel production was smaller. Again, the im-provement for the petrol cars was vast and the impact of fuel production was more promi-nent for the new cars tested in this study. The main drawback of high NOX emissions fromdiesel engines is evident in this case as well. It should be noted that the contribution fromnew light-duty vehicles to eutrophication is relatively small in general, compared to othermajor sources (e.g. agriculture).
Eutrophication potential (NOX & NH3)Baseline (index=100): petrol-fuelled cars of model year 93/94
28,1 25,4 24,6 23,5 19,9 20,4
71,9
11,9 10,4
98,5 93,0
138
0
20
40
60
80
100
120
140
160
180
Petrol 93/94 SI-P SI-GDiesel 93/94
CI-CR/DPF CI-UI/HP
Eutr
ophi
catio
n (p
etro
l 93/
94=1
00)
VehicleFuel prod.
100
DieselPetrol
37,3 35,0
162
118113
Figure 55. Eutrophication potential
4.3.4 Global effectsWhen the impact on climate change and energy use are discussed, one should note thatonly 4 cars were tested in this study. Of course, these cars cannot represent the wholepopulation of new cars. Therefore, only general conclusions can be made regarding theimpact on climate change and energy use. Statistics on CO2 emissions from new cars isprovided on a yearly basis by the EU and the vehicle manufacturers of Europe (ACEA),Japan (JAMA) and Korea (KAMA).
Climate changeThe impact from transportation on climate change is probably one of the most difficultproblems to solve. Initiatives to produce new fuels from renewable sources in larger scaleare one route that will be investigated in more detail in the future. Increasing the energyefficiency and limiting transportation in general are also two possible measures. As thelatter option could have a great impact on economy, renewable fuels and efficiency im-provements remain the preferred solutions. Increasing the efficiency is equally importantfor renewable fuels, as well as for fossil fuels, since fossil fuels are to be substituted byrenewable fuels (i.e. an increased efficiency increases the substitution rate). The diesel en-
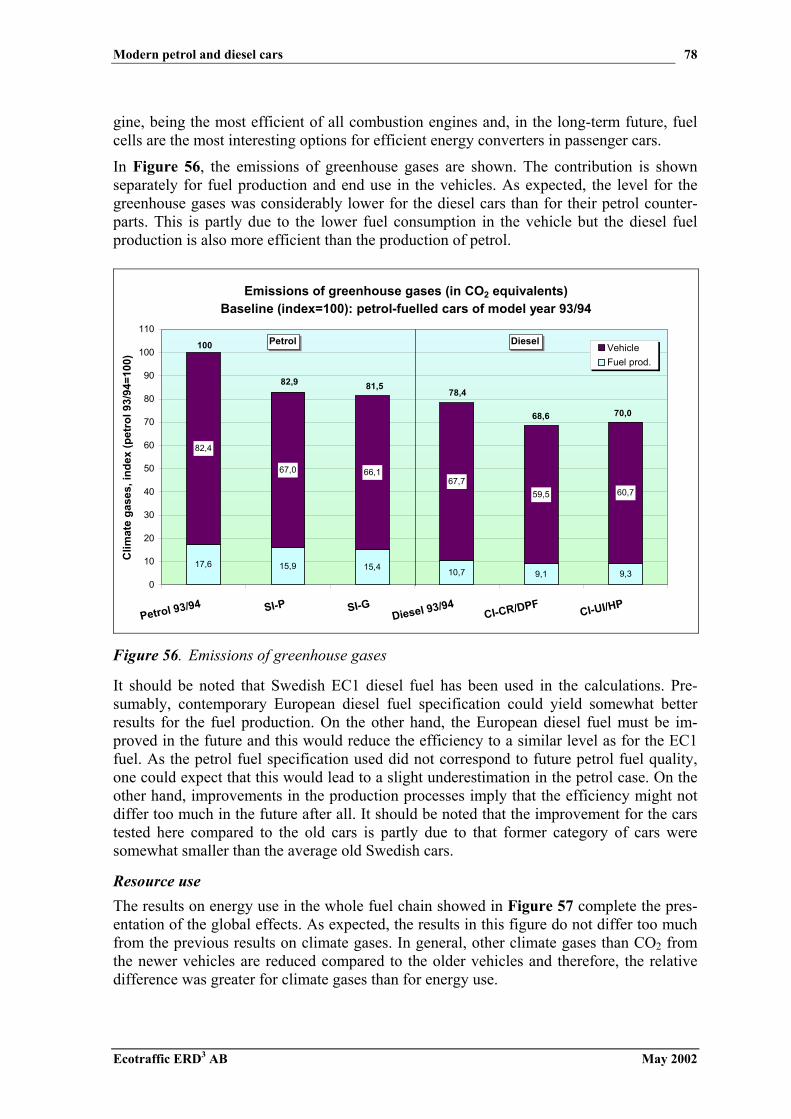
Modern petrol and diesel cars
Ecotraffic ERD3 AB May 2002
78
gine, being the most efficient of all combustion engines and, in the long-term future, fuelcells are the most interesting options for efficient energy converters in passenger cars.
In Figure 56, the emissions of greenhouse gases are shown. The contribution is shownseparately for fuel production and end use in the vehicles. As expected, the level for thegreenhouse gases was considerably lower for the diesel cars than for their petrol counter-parts. This is partly due to the lower fuel consumption in the vehicle but the diesel fuelproduction is also more efficient than the production of petrol.
Emissions of greenhouse gases (in CO2 equivalents)Baseline (index=100): petrol-fuelled cars of model year 93/94
9,3
82,4
67,0 66,167,7
59,5 60,7
9,110,715,415,917,6
0
10
20
30
40
50
60
70
80
90
100
110
Petrol 93/94 SI-P SI-GDiesel 93/94
CI-CR/DPF CI-UI/HP
Clim
ate
gase
s, in
dex
(pet
rol 9
3/94
=100
) VehicleFuel prod.
100
82,9 81,578,4
68,6 70,0
DieselPetrol
Figure 56. Emissions of greenhouse gases
It should be noted that Swedish EC1 diesel fuel has been used in the calculations. Pre-sumably, contemporary European diesel fuel specification could yield somewhat betterresults for the fuel production. On the other hand, the European diesel fuel must be im-proved in the future and this would reduce the efficiency to a similar level as for the EC1fuel. As the petrol fuel specification used did not correspond to future petrol fuel quality,one could expect that this would lead to a slight underestimation in the petrol case. On theother hand, improvements in the production processes imply that the efficiency might notdiffer too much in the future after all. It should be noted that the improvement for the carstested here compared to the old cars is partly due to that former category of cars weresomewhat smaller than the average old Swedish cars.
Resource useThe results on energy use in the whole fuel chain showed in Figure 57 complete the pres-entation of the global effects. As expected, the results in this figure do not differ too muchfrom the previous results on climate gases. In general, other climate gases than CO2 fromthe newer vehicles are reduced compared to the older vehicles and therefore, the relativedifference was greater for climate gases than for energy use.
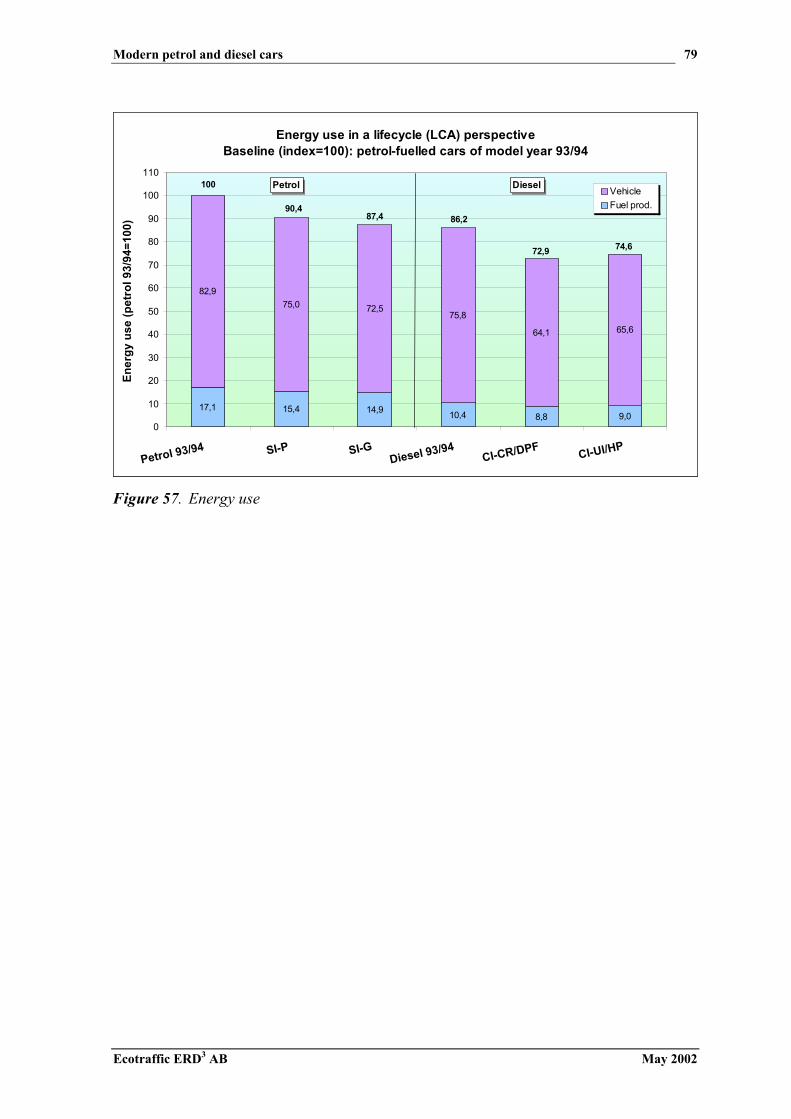
Modern petrol and diesel cars
Ecotraffic ERD3 AB May 2002
79
Energy use in a lifecycle (LCA) perspectiveBaseline (index=100): petrol-fuelled cars of model year 93/94
17,1 15,4 14,9 10,4 8,8 9,0
82,975,0 72,5
75,8
64,1 65,6
0
10
20
30
40
50
60
70
80
90
100
110
Petrol 93/94 SI-P SI-GDiesel 93/94
CI-CR/DPF CI-UI/HP
Ener
gy u
se (p
etro
l 93/
94=1
00)
VehicleFuel prod.
100 DieselPetrol
90,487,4 86,2
72,9 74,6
Figure 57. Energy use
Modern petrol and diesel cars
Ecotraffic ERD3 AB May 2002
80
5 DISCUSSION AND CONCLUSIONSThe introduction of new emission control technology has decreased the emissions frompetrol-fuelled passenger cars during the past decade. Since the introduction of the three-way catalyst (TWC) emission control system, subsequent improvements of this technologyhas decreased the emissions even further. In view of this progress, the emissions from die-sel cars have received more attention from government authorities and environmentalgroups. However, the increase in emissions at low ambient temperatures from petrol carsstill have not completely been solved, although this is often forgotten as emission tests areusually carried out in the +20°C to +30°C temperature interval. In the cold Nordic climate,low ambient temperatures must be considered. Eventually, the two petrol cars tested in thisstudy showed a considerable improvement at such temperatures compared to older cars.
Although the emissions from diesel-fuelled cars have decreased considerably during thelast decade, the general perception has been that these cars emit significantly higher quan-tities of harmful emissions compared to their petrol counterparts. The results in this studyshowed that several unregulated emission components from diesel cars are on the samelevel as from petrol cars, and in some cases, lower. Two major problems remain − NOXand particulate emissions. Today, there is no equivalent technology to the TWC for dieselcars for reducing NOX emissions but such aftertreatment is currently in development.Emerging particulate filter technology has been commercially introduced by PSA andother car manufacturers will follow this path.
The calculation of the impact on health and environment from exhaust emissions provide abetter insight than only showing the results on the emission components. However, itshould be noted that in some cases, the input data for these calculations (e.g. cancer risk) isnot fully developed yet.
The number of cars in this study was too few to allow generalisation of the results for allcars. The selection of cars was made on the condition that the impact of new technologycould be compared with previously generated results on older cars. The following mainconclusions can be drawn:
• The regulated emission results on all tested cars were very close to the certificationdata. Therefore, they could be considered representative samples of each car model.The two petrol cars in this study proved to be on pair with some of the best cars thathave been tested previously at MTC.
• As expected, CO and HC emissions were generally lower from diesel cars than frompetrol cars, while the results for NOX emissions was the opposite. Particulate emissionswere higher from the diesel car without particulate filter compared to its petrol coun-terpart. However, the diesel car with a particulate filter had lower particulate emissionsthan the corresponding petrol car.
• Emissions of some nitrogen containing compounds, as ammonia (NH3) and nitrousoxide (N2O), were low from all cars.
• The aldehyde emissions, a well-known problem for diesel engines, were at or belowthe detection limit for the diesel cars at high ambient temperature (+22°C). At thelower ambient temperature (−7°C), the level was approximately twice the detection

Modern petrol and diesel cars
Ecotraffic ERD3 AB May 2002
81
limit. This implies that considerable improvements have been made in this area com-pared to diesel cars of the past.
• The petrol cars had higher emissions of benzene, ethene, propene and 1,3-butadienethan their diesel counterparts, although the levels of these emission components werelow for all cars.
• PAC/PAH emissions are usually low from petrol cars at high ambient temperatures. Asthe level of these emissions has previously been higher for diesel cars at these ambientconditions, this has been considered as one of the main emission problems for dieselcars. It has seldom been recognised that the level increases considerably for petrol carswhen the ambient temperature decreases. The PAC level for the petrol cars tested inthis study were considerably reduced compared to previous tests on older cars at thelow ambient temperature. The PAC levels for the diesel cars were generally lower thanfor their petrol counterparts at the average yearly temperature of +7°C. The PAC levelfor the diesel car with a particulate filter was one order of magnitude lower than thepetrol car from the same car manufacturer. A comparison with data on 1993/1994model years of petrol cars gives a difference of more than 2 orders of magnitude. Al-though the diesel car without a particulate filter had lower PAC emissions than its pet-rol counterpart, the great variation between cars implies that new diesel cars (w/o par-ticulate filters) are not necessarily better than new petrol cars in this respect.
• The diesel car without a particulate filter emitted about 2 orders of magnitude moreparticles than its petrol counterpart in the NEDC cycle at both temperatures. However,in the US06 test cycle the number of particles was on roughly the same level as for thepetrol cars. The increase in particulate number for the petrol cars in this cycle com-pared to the NEDC cycle was mainly attributable to an increase of the smallest parti-cles (7 − 30 nm). The diesel car with a particulate filter was outstanding in this respecthaving particulate number emissions at least one order of magnitude lower than thepetrol cars. The particulate filter was particularly effective in reducing the number ofnanoparticles. Comparison with older data showed a reduction of the particulate num-ber for the diesel car without particulate filter.
• The ozone forming potential was considerably lower for the diesel cars, i.e. roughlyone order of magnitude lower than for the petrol cars. This is mainly due to the lowlevel of HC emissions for diesel cars compared to the petrol cars. Should the evapora-tive emissions have been taken into account, the relative difference would have beeneven greater.
• The cancer risk index was generally significantly lower for the cars tested in this studycompared to older vehicles. The diesel car with a particulate filter had a lower cancerrisk index than its petrol counterpart. For the diesel car without a particulate filter, thelevel was slightly higher than for the petrol car from the same manufacturer. In general,the lowest value was obtained for the diesel car with a particulate filter, i.e. almost 98%lower than petrol cars of model year 1993/1994. It should be noted that the uncertaintyis high for the cancer risk index due to the varying level for the unit risk factors, de-pending on which source is used. Therefore, small differences should not be consid-ered.
• The environmental effects mostly related to the emissions of NOX, such as NO2 form-ing potential, acidification and eutrophication, were greater for the diesel cars than their
Modern petrol and diesel cars
Ecotraffic ERD3 AB May 2002
82
petrol counterparts, due to the higher NOX emissions. The contribution from fuel pro-duction was higher for the petrol cars.
• As expected, climate change and energy use was lower for the diesel cars than for thepetrol cars. This is partly due to the lower fuel consumption, partly to the higher effi-ciency in fuel production.
Although the scope of this study was to compare the emissions from diesel cars with theemissions from petrol cars, it cannot be avoided to point out that the focus was shifted to-wards the results on the diesel cars. This is mainly because most data on unregulated emis-sions on new cars have been generated on petrol cars. Relatively little is known on the im-pact of new technology in this respect. As expected, the NOX and particulate emissions arethe main emission problem on diesel cars. The results on particulate emissions show that aparticulate filter is very effective in reducing these emissions. For both emission compo-nents, solutions that can alleviate these problems have been introduced, or will be intro-duced on the market in the near future. Nevertheless, as diesel cars are improved in thisrespect, so will petrol cars. The test results on the unregulated emissions, and the effects onhealth and environment that were evaluated, showed lower levels in some cases for dieselcars and higher levels in other cases compared to petrol cars. Eventually, as the emissionsfrom vehicles running on both types of fuels will be reduced to a negligible level, energyefficiency and the emissions of greenhouse gases will become more pronounced in the fu-ture.

Modern petrol and diesel cars
Ecotraffic ERD3 AB May 2002
83
6 ACKNOWLEDGEMENTSPeugeot, PSA, Volkswagen of Germany, and the Swedish wholesalers Svenska Volks-wagen and KW Bruun Autoimport are acknowledged for lending the cars, assistance in thetest process and for valuable comments on the results.
The staff at MTC is acknowledged for their skill in preparation, testing and analysing thevarious emission components.
This work was funded by the Swedish National Road Administration (SNRA). PärGustafsson and Olle Hådell at SNRA are acknowledged for their contribution in discussingand setting up the test programme and for valuable comments on the results.
Modern petrol and diesel cars
Ecotraffic ERD3 AB May 2002
84
7 REFERENCES 1 Ahlvik P. and Brandberg Å. (Ecotraffic): “Exhaust emissions from light-duty vehi-
cles fuelled by various fuels – Impact on health, environment and energy use.” KFBReport 1999:38, 1999, in Swedish.
2 Pfalzgraf B., Fitzen M., Siebler J., Erdmann H.-D. (Audi): “First ULEV TurboGasoline Engine.” SAE Paper 2001-01-1350, 2001.
3 Ahlvik P. (Ecotraffic): “Characterization of emissions from cars with lean-burn anddirect injection gasoline engines.” MTC Report MTC 9704, 1998.
4 Ahlvik P. (Ecotraffic) and de Serves C. (MTC): “Characterization of particulateemissions from 11 gasoline and 5 diesel-fuelled cars.” MTC Report MTC 9708B,1999.
5 Salvat O., Marez P. and Belot G. (Peugeot): “Passenger Car Serial Application of aParticulate Filter System on a Common Rail Direct Injection diesel Engine.” SAEPaper 2001-01-0473, 2000.
6 Michelin J., Figueras B., Bouly C., and Maret D. (Faurecia): “Optimized Diesel Par-ticulate Filter System for Diesel Exhaust Aftertreatment.” SAE Paper 2000-01-0475,2000.
7 Seguelong T., und Naschke W.: “Serieneinsatz eines Dieselpartikelfilters in Kombi-nation mit einem im Kraftstoff gelösten Katalysator auf Ceriumbasis”, MTZ 63,2002/3.
8 VCA: “New Car Fuel Consumption & Emission Figures.” available at the Internetsite of VCA, www.vca.gov.uk, 2001.
9 Westerholm R., Almén J., Hang L., Rannug U., Egebäck K.-E. and Grägg K.: ”Che-mical and biological characterization of particulate, semi volatile phase associatedcompounds in diluted heavy duty diesel exhaust: A comparison of three differentsemi volatile phase samplers.” Environmental Science and Technology, Vol. 25,332-338, 1991.
10 De Serves C. (MTC) and Westerholm R. (Stockholm Uni.): “Emissions from a dieselpassenger car with particulate filter: Regulated emissions, particle size and number,PAH and nitro-PAH.” MTC Report, MTC 6026, 2001.
11 Almén J. (MTC), Ludykar D. (Stockholm Uni.), and Westerholm R. (StockholmUni.): “Unregulated emission factors for light duty vehicles at different driving pat-terns and temperatures.” MTC report MTC 9501, 1997.
12 Keskinen, J., Pietarinen, K. and Lehtimäki, M. (Tech. Uni. Of Tampere): “ElectricalLow Pressure Impactor” J. Aerosol Sci. 23, 353-360, 1992.
13 Heinrich U., Mangelsdorf I., Auferheide M., Boehncke A., Melber C., Rosner G.,Höpfner U., Borken J., Patyk A, Pott F., Roller M., Schneider K., Voss J.U.:“Durchführung eines Riskikovergleiches zwischen Dieselmotoremissionen undOttomotorenemissionen hinsichtlich iherer kanzerogenen und nicht-kanzerogenenWirkungen.” Berichte 2/99, UBA, Erich Schmidt Verlag, 1999.

Modern petrol and diesel cars
Ecotraffic ERD3 AB May 2002
85
14 Ahlvik P. and Brandberg Å. (Ecotraffic): “Relative Impact on Environment and
Health from the Introduction of Low Emission City Buses in Sweden.” SAE Paper2000-01-1882, 2000.
15 Johansson A, Brandberg Å, and Roth A. (Ecotraffic): “The Life of Fuels – Motorfuels from source to end use.” Ecotraffic, 1992.
16 Edited by the governmental investigation on environment and health: “Environmentfor a sustainable health development.” SOU 1996:124, ISBN 91-38-20359-6, ISSN0375-250X, 1996, in Swedish.
17 Bach C., Heeb N., Mattrel P., and Mohr C. (EMPA): “Wirkungsorientierte Bewer-tung von Automobilabgasen.”, MTZ 59, 1998.
18 Decker, G. et al (VW): “Das Ozonpotential unterschiedlicher Fahrzeug- und Kraft-stoffkonzepte.” ATZ 98/5, 1996.
19 Neumann K.-H. Schürmann D., Kohoutek P. Beyersdorf J. Hartung A., Nagel C. andSchulze J.: “Unregulated Exhaust Gas Components of Modern Diesel PassengerCars.” SAE Paper 1999-01-0514, 1999.
20 Grägg K. (MTC): ”Emission measurements on a prototype to a CRT-filter.” MTCReport MTC 9430B, 1994, in Swedish.
21 Hedbom A. (MTC): “ Assessments of Test Cycle Proposals – The Transient Cycleand the OICA/ACEA Steady State Cycle with Dynamic Load Response Test.” MTCReport MTC 9511A, 1995.
22 Edited by the governmental investigation on environment and health: “Environmentfor a sustainable health development.” SOU 1996:124, ISBN 91-38-20359-6, ISSN0375-250X, 1996, in Swedish.
23 Pope C., Schwartz J. and Ransom M.: “Daily Mortality and PM10 Pollution in UtahValley”, Arch. Environ Health 47, pp. 211-217, 1992.
24 Edited by Möller L.: “City Air – A book about the air quality in our cities.” SwedishEPA, ISBN 91-620-1089-1, 1990, in Swedish.
25 U.S. EPA: “Cancer Risk from Outdoor Exposure to Air Toxics, Volume 1, Final Re-port.”, EPA-450/1-90-004a, U.S. EPA, 1990.
26 Smith R., L., French C. L., Murphy D. L., and Thomson R. (U.S. EPA): “Rankingand Selection of Hazardous Air Pollutants for Listing under Section 112(k) of theClean Air Act Amendments of 1990 – Technical Support Document.” EPA, 1999.
27 CARB: “Proposed Regulations for Low-Emission Vehicles and Clean Fuels.” StaffReport and Technology Support Document, Aug. 13, 1990.
28 CAPCOA: “Air Toxics “Hot Spots” Program – Risk Assessment Guidelines.” AB2588 Risk Assessment Committee of the California Air Pollution Control OfficersAssociation (CAPCOA), Jan. 1992.
29 Edited by OEHHA of Cal. EPA: “Air Toxics Hot Spot Program Risk AssessmentGuidelines – Part II: Technical Support Document for Describing Available CancerPotency Factors.” OEHHA, 1999.
30 Edited by NCEA: “Health Assessment for Diesel Exhaust – SAB Review Draft.”EPA, available at www.epa.gov, 2000.

Modern petrol and diesel cars
Ecotraffic ERD3 AB May 2002
86
31 Törnqvist M., and Ehrenberg L.: “On Cancer Risk Estimation of Urban Air Pollu-
tion.”, Environmental Health Perspectives, vol. 102, Supplement 4, October 1994.32 Almén J. (MTC): “Analysis of Some Nitrogen Containing Compounds from Vehicle
Exhaust Emissions.” MTC Report MTC 9309, 1995.33 D.L. Albritton et al., "Trace Gas Radiative Forcing Indices," in J.T. Houghton et al.:
“Climate Change 1994” Cambridge, UK: Cambridge University Press, 1995, p. 222.34 Certification data from VCA are available on the Internet at: www.vca.gov.uk, 2001.35 Eriksson L. (MTC): “New engine and pollution control technology.” MTC Report
MTC 98/7, 1998.36 Lu Karlsson H. (MTC): “Ammonia, Nitrous Oxide and Hydrogen Cyanide Emis-
sions from Five Passenger Vehicles.” MTC Report MTC 6033, 2000.37 Demel H., Stock D, und Bauder R. (Audi): ”Audi Turbodieselmotor mit Direktein-
spritzung - schadstoffarm nach Anlage 23.“ MTZ 52, 1991/9.38 “25 Jahre Dieselmotoren von Volkswagen.“ MTZ Sonderausgabe MTZ 62, 2001/5.39 Egebäck K.-E., Ahlvik P., and Westerholm R.: ”Emission factors for vehicles fuelled
with fossil and alternative fuels.” Main report and appendix, KFB Report 1997:22and 1997:23, 1997.
40 Kokko J. (Fortum), Rantanen L. (Fortum), Pentikäinen J. (Fortum), Honkanen T.(Fortum), Aakko P. (VTT) and Lappi M. (VTT): ”Reduced Particulate Emissionswith Reformulated Gasoline.” SAE Paper 2000-01-2017, 2000.
41 Momique J.−C., PSA, personal communication, 2002.42 May H., Hattingen U., Klee P. Und Spiz M.: “Vergleichende Emissionsuntersuch-
ungen beim Betrieb verschiedener Dieselmotoren mit Dieselkraftstoff und Rapsöl-methylester.” MTZ 58:1, 1997.
43 Almén J. (MTC): “Unregulated emission factors from light-duty vehicles during highemitting conditions.” MTC report MTC 9603, 1996.
44 Ahlvik P. (MTC), Almén J. (MTC), Westerholm R. (Stockholm Uni.) and LudykarD. (Stockholm Uni.): “Impact of a Block Heater on Regulated and Some Unregu-lated Emissions from a Gasoline Fueled Car at Low Ambient Temperatures.” SAEPaper 972908, 1997.
45 Pressrelease from the Stockholm University, 2002-04-24. A publication of the workwill be made in the Journal of Agricultural and Food Chemistry.
46 The Internet site of Aftonbladet, www.aftonbladet.se, 2001.47 Färnlund J. (Rototest), Holman C. (Senco) and Kågesson P. (Nature Associates):
“Emissions of ultrafine particles from different types of light duty vehicles.” SwedishNational Road Administration (SNRA), available at the Internet site of SNRA:www.vv.se, 2001.
48 Edited by ACEA: “ACEA programme on emissions of fine particles from passengercars.” ACEA report, 1999.
49 Ahlvik P. (MTC) Ntziachristos L. (MTC), Keskinen J. (Tampere Uni.), and VirtanenA. (Tampere Uni.): “Real Time Measurements of Diesel Particle Size Distributionwith and electrical Low Pressure Impactor.” SAE Paper 980410, 1998.

781 87 Borlänge, Sweden. Telephone +46 243 750 00. Fax +46 243 758 25e-mail: [email protected] / Internet: www.vv.se