
Enterprise Systems Analysis · UNLIMITED DISTRIBUTION Contract Number: HQ0034-13-D-0004 Task Order:...
127
UNLIMITED DISTRIBUTION Contract Number: HQ0034-13-D-0004 Task Order: 010, RT138 Report No. SERC-2016-TR-103 Enterprise Systems Analysis Technical Report SERC-2016-TR-103 March 14 2016 Principal Investigator: Dr. Michael Pennock, Stevens Institute of Technology Co-PI: Dr. William Rouse, Stevens Institute of Technology Senior Researcher: Dr. Doug Bodner, Georgia Institute of Technology Research Team: Christopher Gaffney John Hinkle Christopher Klesges Mehrnoosh Oghbaie
Transcript of Enterprise Systems Analysis · UNLIMITED DISTRIBUTION Contract Number: HQ0034-13-D-0004 Task Order:...

UNLIMITED DISTRIBUTION
ContractNumber:HQ0034-13-D-0004 TaskOrder:010,RT138
ReportNo.SERC-2016-TR-103
EnterpriseSystemsAnalysisTechnicalReportSERC-2016-TR-103
March142016
PrincipalInvestigator:Dr.MichaelPennock,StevensInstituteofTechnology
Co-PI:Dr.WilliamRouse,StevensInstituteofTechnology
SeniorResearcher:Dr.DougBodner,GeorgiaInstituteofTechnology
ResearchTeam:
ChristopherGaffney
JohnHinkle
ChristopherKlesges
MehrnooshOghbaie

UNLIMITED DISTRIBUTION
ContractNumber:HQ0034-13-D-0004 TaskOrder:010,RT138
ReportNo.SERC-2016-TR-103
Copyright©2016StevensInstituteofTechnology
TheSystemsEngineeringResearchCenter(SERC)isafederallyfundedUniversity
AffiliatedResearchCentermanagedbyStevensInstituteofTechnology.
Thismaterialisbaseduponworksupported,inwholeorinpart,bytheU.S.Department
ofDefensethroughtheOfficeoftheAssistantSecretaryofDefenseforResearchand
Engineering(ASD(R&E))underContractH98230-08-D-0171andHQ0034-13-D-0004(TO
0110).
Anyviews,opinions,findingsandconclusionsorrecommendationsexpressedinthis
materialarethoseoftheauthor(s)anddonotnecessarilyreflecttheviewsoftheUnited
StatesDepartmentofDefensenorASD(R&E).
NoWarranty.
ThisStevensInstituteofTechnologyandSystemsEngineeringResearchCenterMaterial
isfurnishedonan“as-is”basis.StevensInstituteofTechnologymakesnowarrantiesof
anykind,eitherexpressedorimplied,astoanymatterincluding,butnotlimitedto,
warrantyoffitnessforpurposeormerchantability,exclusivity,orresultsobtainedfrom
useofthematerial.StevensInstituteofTechnologydoesnotmakeanywarrantyofany
kindwithrespecttofreedomfrompatent,trademark,orcopyrightinfringement.
Thismaterialhasbeenapprovedforpublicreleaseandunlimiteddistribution.

UNLIMITED DISTRIBUTION
ContractNumber:HQ0034-13-D-0004 TaskOrder:010,RT138
ReportNo.SERC-2016-TR-103
Table of Contents 1. Introduction ................................................................................ 72. Counterfeit Parts Simulation ..................................................... 10
Model Development Summary ................................................................. 11Model Architecture .................................................................................. 12Systems & Constituents Model ................................................................. 15Supply Chain Operations Model .............................................................. 15Enterprise Actor Model ........................................................................... 17Policy Model ............................................................................................ 17Exogenous Model .................................................................................... 19Implementation ....................................................................................... 19Challenges .............................................................................................. 20
Usage ....................................................................................................... 21Example Analysis .................................................................................... 22Academic Peer Review ............................................................................ 24MITRE Peer Review ................................................................................ 27DASD(SE) Review ................................................................................... 29Anti-Counterfeiting Roundtable Review/Workshop ............................... 30
Transition Plan Discussion ..................................................................... 30
3. Behavioral Economics Case Study .............................................. 32Behavioral Economics and Prospect Theory ........................................... 32Application to Enterprise Systems .......................................................... 34
Bifurcation Modeling ................................................................................................. 34Congestion Pricing ..................................................................................................... 34Prospect Theory Model .............................................................................................. 35Objections ................................................................................................................... 38
Conclusions ............................................................................................ 39
4. Phenomena and Canonical Models ............................................ 39
A Conceptual view of Model composition and reuse for enterprise modeling ................................................................................................ 40
Archetypal Problems .................................................................................................. 40Modeling Paradigms .................................................................................................. 43Phenomena And Paradigms ....................................................................................... 46Paradigms And Standard Problems ........................................................................... 48Reuse Of Solutions ..................................................................................................... 49
Mathematical Analysis of Phenomena, Reuse, and Composition ............ 50
Basic Setup ................................................................................................................. 51Defining a Model ........................................................................................................ 53Interpretation ............................................................................................................. 55Implications for Model Composition ......................................................................... 57Necessary Conditions for Model Composition .......................................................... 58Implications ................................................................................................................ 66
Conclusions ............................................................................................ 67
5. Review of Complexity Literature on Warning Signals ................ 68
Random Variable Moments - Skewness, Kurtosis ................................... 68Metric Based Correlation – Auto-correlation, Pearson Correlation ........ 69
UNLIMITED DISTRIBUTION
ContractNumber:HQ0034-13-D-0004 TaskOrder:010,RT138
ReportNo.SERC-2016-TR-103
State Space Estimator Analysis – AR(p) Model Metrics .......................... 69Residual Analysis – Conditional Heteroscedasticity ............................... 70
Global Stochastic Measures - Granger Causality ...................................... 71Alternate Exploratory Statistical Measures ............................................ 72Perturbation Experiments ...................................................................... 72Limitations ............................................................................................. 72Conclusions ............................................................................................ 73
6. Implications for Enterprise Modeling and the Strategy Framework ...................................................................................... 74
Background ............................................................................................ 74Existing Approaches to Assessing Model Risk ......................................... 76Revisiting Complexity ............................................................................. 78Models and Bifurcations ......................................................................... 79Expansion of Epistemic Uncertainty for Model Risk ............................... 82Exploratory Decision Problem: Crop Allocation ..................................... 83
Deterministic/Naive Model ....................................................................................... 85Model with Aleatory Uncertainty ............................................................................... 85Model with Epistemic Uncertainty ............................................................................ 86Alternate Methodologies ............................................................................................ 89
Epistemological Implications of the Crop Allocation Example ................ 90
Revisiting the Toll Road Example ............................................................ 91Discussion .............................................................................................. 95Conclusions ............................................................................................ 96
7. Visualization Experiment .......................................................... 98
Background ............................................................................................ 99Automobile Industry Application ......................................................... 100
Hypothesized Use Cases ....................................................................... 100
Experimental Design ............................................................................. 102Results and Analysis ............................................................................. 104
8. Revisiting the Enterprise Modeling Methodology .................... 106
9. Humanitarian Response Case Study ........................................ 108
Background .......................................................................................... 109Modeling Methodology .......................................................................... 112
Central Questions of Interest .................................................................................... 112Key Phenomena ......................................................................................................... 112Visualizations of Relationships among Phenomena ................................................ 114Key Tradeoffs That Appear to Warrant Deeper Exploration ................................... 115Alternative Representations of These Phenomena ................................................... 116Ability to Connect Alternative Representations ....................................................... 117
Core Model and Interacting Model Overview ......................................... 117Future Work .......................................................................................... 118
10. Conclusions and Future Work ............................................... 118
11. References ............................................................................. 119

UNLIMITED DISTRIBUTION
ContractNumber:HQ0034-13-D-0004 TaskOrder:010,RT138
ReportNo.SERC-2016-TR-103
Figures and Tables
Figure 1 - Relationships among research tasks ........................................................ 8Figure 2 - Visualization of counterfeit parts in an enterprise context .................. 13Figure 3 - Model architecture ................................................................................. 14Figure 4 - Systems & constituents structure and behavior ................................... 15Figure 5 - Supply chain operations model ............................................................. 16Figure 6 - Enterprise actor model decision logic example .................................... 17Figure 7 - Enterprise actor model decision logic example .................................... 18Figure 8 - Recycling market model ........................................................................ 19Figure 9 - Model interface ...................................................................................... 22Figure 10 – Difference in utility between the tolled and free lanes ...................... 38Figure 11 – Measuring a System over Time (Adapted from Rosen 1978) ............. 52Figure 12 – Necessary condition for !,#! to be a model of $/&', (' ................. 53Figure 13 - Subsystem Diagram ............................................................................. 59Figure 14 – Necessary condition for a composite model for unlinked observables
......................................................................................................................... 60Figure 15 – Necessary condition for a composite model with one way dynamic
linkage ............................................................................................................. 61Figure 16 – Necessary condition for a composite model with two way dynamic
linkage ............................................................................................................. 62Figure 17 – Necessary Conditions for a composite model with a two-way static
linkage ............................................................................................................. 63Figure 18 – Necessary condition for a composite model with a two-way static
linkage with minimal overlap ......................................................................... 66Figure 21 - Notional representation of models bifurcating from the true system 80Figure 22 - Taxonomy of model uncertainty for enterprise systems .................... 82Figure 23 - Abstractions relevant to the farmer's decision problem ..................... 84Figure 24 - Simulated demand curve generated using an assumed 20 minute
difference in travel time between the tolled and untolled roads ................... 93Figure 25 - Simulated demand curve generated using an assumed convex
relationship between the expected delay and the toll level ............................ 94Figure 26 – Reponses to increasing epistemic uncertainty ................................... 98Figure 27 - Introduction view from side bar ........................................................ 103Figure 28 - Article dialog from dashboard view .................................................. 104

UNLIMITED DISTRIBUTION
ContractNumber:HQ0034-13-D-0004 TaskOrder:010,RT138
ReportNo.SERC-2016-TR-103
Figure 29 - Aiding view ........................................................................................ 104Figure 30 – Interface Usage Trajectories for Different Subjects ........................ 105Figure 31- Preliminary Approach to Modeling Enterprise Systems ................... 106Figure 32 – Revised approach to modeling enterprise systems .......................... 108Figure 33 - Enterprise phenomena and relationships .......................................... 115 Table 1 - Example model analysis (notional data) ................................................. 23Table 2 - Characterizations of Archetypal Problems ............................................. 42Table 3 - Predictions, Paradigms, Representations and Assumption ................... 45Table 4 - Eight Classes of Phenomena ................................................................... 46Table 5 - Archetypal Phenomena and Modeling Paradigms ................................. 46Table 6 - Modeling Paradigms and Standard Problems ........................................ 48Table 7 - Problems and Solutions .......................................................................... 49Table 8 - Optimal ) for various values of *+,!-.-, !/./ .................................. 88Table 9 - Interface Action Coding ........................................................................ 105Table 10 - Key phenomena in littoral response situation ..................................... 113Table 11 - Representation alternatives .................................................................. 116
UNLIMITED DISTRIBUTION
ContractNumber:HQ0034-13-D-0004 TaskOrder:010,RT138
ReportNo.SERC-2016-TR-103
1. INTRODUCTION
Theoverarchinggoaloftheresearchinenterprisesystemsanalysishasbeentosupport
decision makers and policy makers through the development of new modeling and
decisionsupportapproaches.Enterprisesystemsaredefinedasthosewherethereare
multipleinteractingorganizations,butthereisnotcentral locusofcontrol.Asaresult,
changemustoftenbe the result of influence and incentives as opposed to command
and control. To understand the potential impact of a policy option, one needs to
capturethespreadofpotentialfuturescenariosthatmayresult.Inparticular,thelong-
termgoalsaretoallowdecisionmakersandpolicymakersto
• Identifythekeydriversofsystembehaviorandresultingoutcomes
• Perform“whatif”analyses
• Evaluatetheefficacyofpolicyoptionstoaltersystembehaviorandoutcomes
• “Testdrive”thefuture
• Allowkeystakeholdersexperiencethebehaviorofthe“tobe”system
Insupportoftheselong-termgoals,theobjectiveofRT-138wastoevaluateandevolve
theenterprisemodelingmethodologydevelopedduringRT-44andRT-110.Theprimary
mechanismtodosowasthecounterfeitpartscasestudy.Thefocusofthecasestudy
wastounderstandtheimpactofhypotheticalpolicyoptionstocombattheintrusionof
counterfeit parts into thedefense supply chain. It is ideal as a testing ground for the
modeling methodology because it involved all of the key features required of an
enterprise systems:multiple interacting organizations (multiple government agencies,
private corporations, and counterfeiters), no locus of control (the government can
promulgate policy but suppliers don’t have to supply, and counterfeiters can try to
bypass),andthesystemisinthemidstofamajorshiftinstate(counterfeitinghasrising
dramaticallyinrecentyears).
Beyond the counterfeit parts case study, therewerealso anumberofother subtasks
that explored various issues related to the application of the methodology. Figure 1
depictsthesubtasksofRT-138andrelationshipsamongthem.

UNLIMITED DISTRIBUTION
ContractNumber:HQ0034-13-D-0004 TaskOrder:010,RT138
ReportNo.SERC-2016-TR-103
Figure1-Relationshipsamongresearchtasks
Inshort,thechallengeofmodelingenterprisesystemsisthattheintrinsiccomplexityof
theunderlyingsocialsystemsfundamentallylimitstheabilitytomakeprecise
predictionsusingmodelsandsimulations.Theanalysisofhistoricaldataand
extrapolationfromthatdatamaybeviableduringperiodsofrelativestability.However,
socialsystemsarepronetoabruptshiftsbehavior(sometimesreferredtoas
bifurcationsinthedynamicalsystemsliterature).Thiscircumstancerequiresadifferent
approachtoemployingmodelsfordecisionmakingthanthattraditionallyappliedin
engineering,whichisessentiallytrendextrapolation.Tothatend,eachofthesubtasks
wereintendedtoexplorehowtoaddressadifferentproblembroughtaboutbythe
complexityoftheenterprisesystem.Tosummarize:
• Theclassicaldecisionmodelsusedinengineeringmodelingtreathumansas
perfectlyrationaledecisionmakers.However,itiswellknownthatthisnotan
accuraterepresentationofhumanbehavior.Given,thecentralroleofhumansin
enterprisesystems,thebehavioreconomicscasestudywasintendedtotheapplyresearchonmodelingactualhumanbehaviortoanenterpriseproblem.
Thequestionwaswhetherornotthiswouldenablethedetectionofbehavioral
changesoriftheeffectwouldgetlostinthe“noise.”Ultimately,thecasestudy
wasconductedbyexaminingtherealworldcaseofdynamicallytolledroadsfor
congestionmanagement.
• Modelingenterprisesystemsnecessarilyrequiresthesimultaneous
considerationofthesystemfrommultipleperspectives.Giventhenatureof
enterprisesystemsthisoftenrequiresmodelsfromdifferentscientificdisciplines
thatwerenotintendedtobeintegrated.Previoustasks(RT-44,RT-110)
1,2ValidateandFinalizeCFPSimulation
3Initiatefollow-oncasestudy
4 VisualizationExperiment
5Alignphenomenawithcanonical
models
6 Methodsformitigatingcomplexity
7RefineStrategyFramework
8 BehavioralEconomicsCase
Study
Need to challenge the core/peripheral approach
Focus on peripheral models
Look at sub-disciplines as the organizing construct
Strategy is driven by level of epistemic uncertainty that results from bifurcations
Assess warning signals for impending bifurcations
Use simulation to find bifurcation points
Assess impact of complexity on interpretation of enterprise visualizations

UNLIMITED DISTRIBUTION
ContractNumber:HQ0034-13-D-0004 TaskOrder:010,RT138
ReportNo.SERC-2016-TR-103
consideredsomeofthechallengesofcomposingsuchmodels.Itishasbeen
donesuccessfullyinsomeinstances,butoftentimesitprovesdifficult.Thus,the
questioniswhatallowsonetoreuseandcomposemodelsfromdifferent
disciplinessuccessfully.IntheAligningPhenomenawithCanonicalModelstask,weconsideredhowthenatureofthephenomenainquestionaffectedsuch
efforts.
• Assumingthatonecanbuildamodelofanenterprisesystemthatcanbeusedto
findabruptshiftsinthebehaviorofanenterprisesystem,thequestionremains
howtousethatinformationtosupportdecisionandpolicymaking.DuringRT-
110,weproposedanotionalstrategyframeworktomanagetheresultingrisks.
IntheRefineStrategyFrameworktaskweexaminedthenotionalframeworkand
linkedthestrategiestothesourceoftheuncertainty.
• Nomodeliscapableofforecastingallpossiblescenarios.Consequently,some
changesinenterprisebehaviorwillbeasurprise.Someresearchershave
investigatedthepossibilitiesofearlywarningsignalsofsuch“surprises”in
biologicalandfinancialsystems.IntheMethodsforMitigatingComplexitytask,wecriticallyreviewtheliteratureonthistopicandconsiderwhetherornotthese
techniquescanbeusedtomitigatetheimpactofasurprisechangeinenterprise
behavior.
• Onceonebuildsamodelofanenterprisesystem,thereremainstheconcernof
howtheinsightsderivedcanbeinternalizedbyanalysts,decisionmakers,and
policymakers.Manyhaveemployedinteractivevisualizationsinsuchsituations,
however,itisunclearhoweffectivetheyare.Giventhecomplexityofenterprise
systems,thereisaveryrealpossibilitythatthedecisionmakerswillperceive
spuriouscorrelationsascausal.Tostudythisconcerninmoredepth,the
VisualizationExperimenttaskinvolvedahumansubjectsresearchexperiment
wheresubjectswereaskedtouseaninteractiveinterfacetodiagnosethe
contributingfactorsthatledtoanenterprisefailure.
• Finally,asingledatapointisneversufficienttovalidateanapproach.
Consequently,whilethecounterfeitpartscasestudyprovidedasingletestcase
fortheenterprisemodelingmethodology,itisnotenoughtovalidateit.Itis
entirelypossiblethattheresultswereartifactsofuniquefeatureofthecase.
Consequently,theInitiateFollow-onCaseStudytaskwasintendedtoinvestigateanotherenterprisesystemthatcouldserveasasecondtestcaseforthe
enterprisemodelingmethodologyinanentirelydifferentcontext.
Theremainderofthisreportdiscussestheresultsoftheseresearchtasks.Firstare
thetwocasestudies.Section2describesthecounterfeitpartscasestudy,and
Section3describesthebehavioraleconomicscasestudy.Section4considershow
modelsofsuchcasesareaffectedbymodelcompositionandreuseissues.Section5
criticallyreviewstheearlywarningsignalsliteratureforapplicabilitytoenterprise

UNLIMITED DISTRIBUTION
ContractNumber:HQ0034-13-D-0004 TaskOrder:010,RT138
ReportNo.SERC-2016-TR-103
systems.Section6drawstogethertheimplicationoftheprevioussectionsand
considershowthataffectsenterprisemodelingandthestrategyframework.Section
7explainsthevisualizationexperiment.Section8revisitstheenterprisemodeling
methodologybasedoneverythingthathasbeenlearnedthroughRT-138.Section9
presentsthepreliminarydescriptionofthefollowontothecounterfeitpartscase
study.Finally,Section10concludesthereportanddiscussesfuturework.
2. COUNTERFEITPARTSSIMULATION
Foracasestudydemonstrationoftheenterprisemodelingmethodology,theproblem
chosen was that of counterfeit parts in the Department of Defense supply chain.
Counterfeiting, particularly of electronic components, has become amajor issue over
the last 10-15 years (ABA, 2012; AIA, 2011; Business Insider, 2012; DoC, 2012;
Economist,2012;McFadden&Arnold,2010;Pecht&Tiku,2006;SASC2012;Stradley&
Karraker,2006;Villasenor&Tehranipoor,2013). Anumberofcounter-measureshave
beenproposed(DAU,2013;DoD,2011;DoD,2012;DoD,2013;DoD,2014;GAO,2010;
GAO,2011;GAO,2012a;GAO,2012b;Guinetal.,2014;Livingston,2007a;Livingston,
2007b;Livingston,2014;SAE,2014). Manyrelatetoreviewingsuppliers todetermine
legitimacy, applying penalties to those who pass counterfeits, and developing new
methods to test counterfeits to keep up with the increasing quality of counterfeited
parts.
Counterfeitscomeinmanytypes. Fraudulentcounterfeitscanberecycledandpassed
as new, remarked and passed as new or different grade, defective and passed as
functional.Fraudulentcomponentsmaybefunctional,butnotcaredforappropriately
(e.g., not contained in static-proof containers), but have forged paperwork indicating
appropriate care. Components may be considered counterfeit if they were
overproducedbyalegitimatecontractmanufactureraboveandbeyondthelimitsetby
thetrademarkholder.Maliciouscounterfeitsareintendedbyanadversarytodoharm.
For example, a genuine componentmay be tampered to provide a back door or fail
undercertaincircumstances. Clonedcomponentsusereverse-engineereddesignsand
canbeeitherfraudulentormalicious.
While counterfeit parts are a real problem, we must ask why this is an enterprise
problem.Thereareanumberoffeaturesthatmakethisanenterpriseproblem.
• Thereisnolocusofcontrol.
o Multiple agency/industry stakeholders are addressing the problem,
ranging fromDoDand itsprograms, to suppliers, to theDepartmentof
Justice(DoJ)andCustomsandBorderPatrol(CBP).
o DoD can promulgate policy, but it must be cognizant of reaction from
industrybase(e.g.,diminishingsupplybase).

UNLIMITED DISTRIBUTION
ContractNumber:HQ0034-13-D-0004 TaskOrder:010,RT138
ReportNo.SERC-2016-TR-103
o Programshavemethodsofaddressingcounterfeitsontheirown.
o Legislationplaysarole.
• Thereissignificantadaptivebehavior.
o Counterfeitersadapttonewtechnologyandnewpolicies.
o Policy-makersmustanddoadapttothesenewstrategies.
o Legitimatesuppliersmayadapttonewpolicies.
• Thereissignificantcomplexity.
o Thereissubstantivesocio-technicalbehavior(humanbehaviorandsocial
behaviorinteractingwithtechnicalsystem).
o Therearemultiplesystemsinteractingwithunpredictableeffects.
Aninitialmodelwasdevelopedpreviously(Bodner,2014;Pennocketal.,2015).Here,
weoverview themodeland recentenhancementsanddiscuss itsuse (Bodner,2015).
Thenwesummarizeseveralreviewsofthemodel. Thesereviewswereundertakento
attainasenseofthemodel’svalidityandusefulness.Theyinvolveanumberofdifferent
stakeholder sets, ranging from academics affiliated with the SERC, to experts from
MITREwho transition research results, toDASD(Systems Engineering), to the broader
community of experts engaged in anti-counterfeiting. An underlying question is
whether such an enterprise model would be useful in a general sense. Based on
feedbackfromthesereviews,wethenpresentdiscussionontransitionplanning.
MODELDEVELOPMENTSUMMARY
This model was developed using an enterprise modeling methodology advocated by
PennockandRouse(2014).Whilethevariousstepsinthatmethodologywerefollowed
moreorless(Pennocketal.,2015),themodeldevelopmentprocessdidnotutilizethe
strictmulti-levelmodelingformalismenvisionedinthatmethodology.Rather,elements
from the multiple levels were combined into a core model, with other elements
structuredintoexogenousmodels.Policiesweremodeledsomewhatseparately,dueto
the need to engage users with an interface to explore and analyze the effects of
differentpolicies.
AsreportedinPennocketal.(2015),anumberofsubjectmatterexpertswereinvolved
indiscussions thathelped shapemodeldevelopment. Theseexperts represented the
followingorganizationsandagencies.
• DASD(SystemsEngineering)
• DASD(Logistics&MaterielReadiness)
• DefenseProcurementandAcquisitionPolicy(DPAP)
• Aprimecontractor
• Acomponentsupplier
• Obsoletepartsmanufacturersviagovernmenttrustedsourcing
• Anelectronicsindustryconsortiagroup
• Customs,lawenforcementandcounter-intelligence

UNLIMITED DISTRIBUTION
ContractNumber:HQ0034-13-D-0004 TaskOrder:010,RT138
ReportNo.SERC-2016-TR-103
• Subjectmatterexpertsoncounterfeitparts
MODELARCHITECTURE
Theoriginalmulti-levelmodelingmethodologyenvisionedfour levels thatconstitutea
conceptualmodelforanenterprise.Theselevelsarethefollowing.
• Eco-system
• Systemstructure
• Deliveryoperations
• Workpractice
Inthecounterfeitpartsdomain,theeco-systemisthenationalsecurityorganizationsof
the government, plus the defense industrial base, plus the electronics market and
counterfeiters.Thesystemstructureconstitutestherelationshipsbetweenthevarious
actors, such as government contractingwith primes, suppliers contractingwith other
suppliers,andpoliciesfromoneorganizationimpactingothers.Thedeliveryoperations
level consists of the flowanddeliveryof parts, sub-systemsand systems through the
supplychaintotheireventualdeploymentininventoriesandoperationsystems.Thisis
governedbythesystemstructure.Finally,theworkpracticelevelconsistsofindividual
operationswith the supply chain, suchasmanufactureof components, inspectionsof
componentlotsataCustomsstation,orretrievalofapartfrominventorytoperforma
repair.
These four levels served as the basis for visualizing various phenomena in the
counterfeitpartsproblem,aswellastheirinteractions,asshownbelowinFigure2.

UNLIMITED DISTRIBUTION
ContractNumber:HQ0034-13-D-0004 TaskOrder:010,RT138
ReportNo.SERC-2016-TR-103
Figure2-Visualizationofcounterfeitpartsinanenterprisecontext
However,whenthecounterfeitpartsenterprisemodelwasdeveloped,itdidnotutilize
four levels with interactions between them. Rather, it focused on a core model
consisting of elements from the system structure level, the delivery operations level,
andtheworkpracticelevel.Theselevelswerecontextualizedasasupplychainmodel,
withthefollowingcharacteristics.
• The system structure level represents the network of customers, suppliers,
manufacturersandwholesalersinalarge-scalesupplychain.
• The delivery operations level represents the flow of components, sub-systems
and systems in both acquisition and sustainment. Thus, new systems are
populatedwithpartsandcomponentsfromthissupplychaininacquisition,and
likewise, fielded systems are repaired and maintained with parts and
componentsinsustainment.
• The work practices level represents individual operations within the delivery
operationslevel.
Whenthemodelwasdesigned, itreflectsthesephenomenainamain,orcoremodel,
thatincludesthemilitarysystemssubjecttocounterfeitinfiltration(e.g.,fighterplanes,
submarines, tanks) and their constituents (sub-systems and components), the supply
chain operations that produce and deliver these systems and constituents, and the
DoDEnterprise
Firms
Economy
IPTs
IndustrialBase
SustainmentNetworks
Non-DoDGovernment
Programs
AcquisitionProcesses
Field-LevelM&R
Processes
SupplyNetworksCustomers
Depot-LevelM&R
ProcessesInventories Bases Depots
SupplierFacilities
GIDEP/PDREP
ProgramManagers
SystemsEngineers
(Govt)
SystemsEngineers
(Contractors)
SustainmentEngineers Logisticians Buyers
DHS
Counterfeiters
Ecosystem
SystemStructure
DeliveryOperations
WorkPractices
Enterprisecapability
incentives (e.g.,anti-counterfeiting
MPTs)
Contractstructures(cost-plus,
fixed-price)
Counterfeitparts rules
& penalties
Private-publicpartnershipmodels andrules (e.g.,50-50 rule)
Aggregatecapabilityas function
of time
Competitive/collaborative
position Industrialbase
health
Failureeffects fromcounterfeits
Fiscalpolicy
effect onfunding
ReportedcounterfeitdetectionsDesigns,
articles &products
Costsincurredby phase
Resourcesand processgovernance
Processcapability &investment
Progressapproval
Technicalperformance,
EVM, scheduleperformance,
quality Counterfeit-causedfailures
Trainingprograms
Informationand
decisionsupport
Decisionoutcomes
Workproduct
Individualincentives
DoD-levelcosts
Anti-counterfeitingcapabilityinvestment
Policyenforcement
Intra-Level Relationships
OrganizationalNetworks,
Governance,Contracts and
Cash Flows
Policyand
Influence
Work,Material andInformation
Flow
Performance
Mission-level performance- Effect of counterfeiting onmission achievementIndustrial base-level performance- Percentage of disqualified firmsper segment- Number of single-source firmsProgram portfolio-levelperformance- DoD-wide cost of counterfeitinterdiction/remediation
Firm-level performance- Extra costs associated withcounterfeitprevention/remediation- Lost contracts due tocounterfeiting problemsProgram-level performance- Extra cost of counterfeitprevention/remediation- Fleet availability cost dueto failures
Operation-level performance- Number of counterfeitsdetected via failues- Number of counterfeitsdetected via inspection- Inspection cost perfacility/process- Failure cost (downtime,repair, etc.)
Decisions,Work ProductExchange,
Communication
Individual-level performance- Decision quality- Work product quality- Counterfeitsdiscovered/undiscovered

UNLIMITED DISTRIBUTION
ContractNumber:HQ0034-13-D-0004 TaskOrder:010,RT138
ReportNo.SERC-2016-TR-103
enterprise actors that direct the supply chain operations (suppliers, government
agenciesthatorderfromthem,andcounterfeiters).
Anexogenousmodelrepresentsthosephenomenaintheeco-systemlevelthatimpact
elements of the core model, but are not directly part of the enterprise affected by
counterfeitparts.Inmanyinstances,thesephenomenaareeconomic,technologicalor
societalinnature.
Apolicymodelwasthendesignedtofocusonthevariouspoliciesthatthemodelwould
beusedtoevaluate.Thepolicymodelsreflectthevariouspolicy-makingagenciesthat
can influencetheenterprise inaddressingcounterfeitparts, thepolicies that theycan
enact,andthebasestateofpolicies(orlackofpolicy).Thepolicymodelinteractswith
the core model by enabling, preventing or influencing behavior of its elements. It
interactssimilarwiththeexogenousmodel.Atpresent,thepoliciesinthepolicymodel
are user-controlled, in that a user specifieswhich policies are enactedwhen, and for
certain policies atwhat level. Thus, a usermay react to certain behaviors or results
fromeitherthecoremodelorexogenousmodelandchangepolicies.Inthefuture,the
policymodelcouldberefinedtomakeitsimilarlyreactive.
Figure3illustratesthearchitectureofthecounterfeitpartsmodel.
Figure3-Modelarchitecture
Wenowbrieflydiscussthefivesub-models.
UNLIMITED DISTRIBUTION
ContractNumber:HQ0034-13-D-0004 TaskOrder:010,RT138
ReportNo.SERC-2016-TR-103
SYSTEMS&CONSTITUENTSMODEL
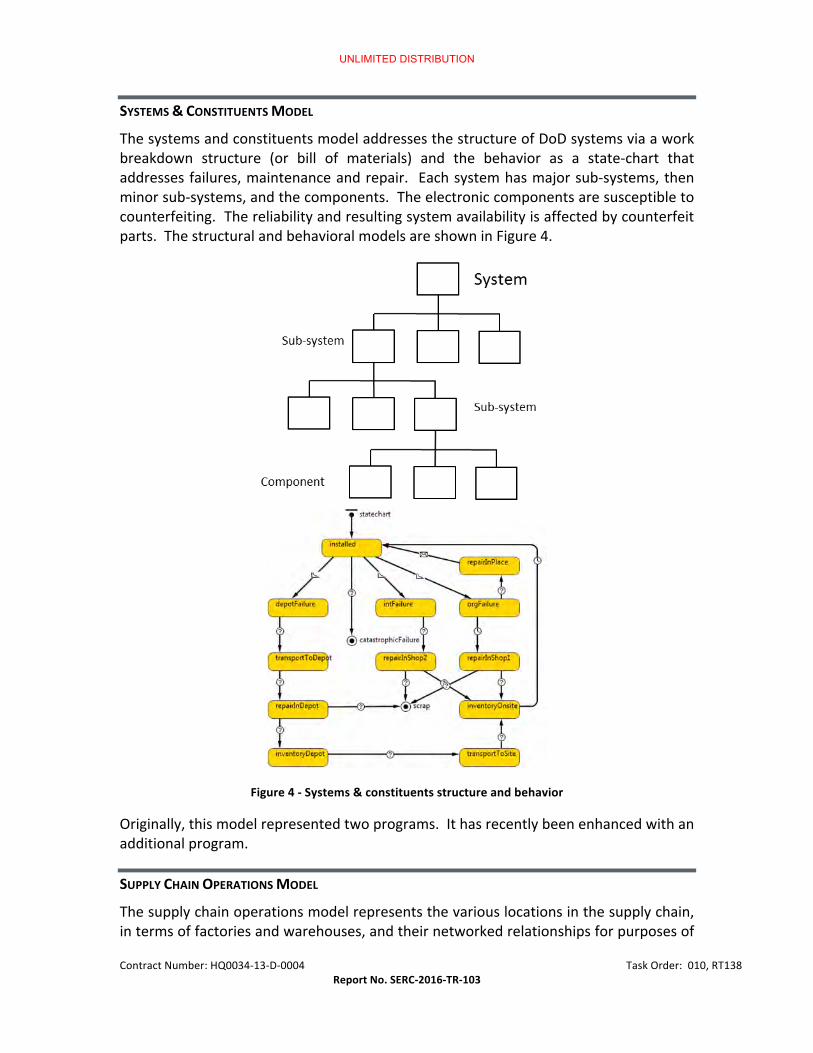
ThesystemsandconstituentsmodeladdressesthestructureofDoDsystemsviaawork
breakdown structure (or bill of materials) and the behavior as a state-chart that
addressesfailures,maintenanceandrepair. Eachsystemhasmajorsub-systems,then
minorsub-systems,andthecomponents.Theelectroniccomponentsaresusceptibleto
counterfeiting.Thereliabilityandresultingsystemavailabilityisaffectedbycounterfeit
parts.ThestructuralandbehavioralmodelsareshowninFigure4.
Figure4-Systems&constituentsstructureandbehavior
Originally,thismodelrepresentedtwoprograms.Ithasrecentlybeenenhancedwithan
additionalprogram.
SUPPLYCHAINOPERATIONSMODEL
Thesupplychainoperationsmodelrepresentsthevariouslocationsinthesupplychain,
intermsoffactoriesandwarehouses,andtheirnetworkedrelationshipsforpurposesof

UNLIMITED DISTRIBUTION
ContractNumber:HQ0034-13-D-0004 TaskOrder:010,RT138
ReportNo.SERC-2016-TR-103
part flow. Component manufacturers are the starting points. They fabricate
components and then feed then to sub-systems manufacturers, who assemble
componentsintosub-systems.Minorsub-systemsaresenttoothermanufacturersthat
assemblethemintomajorsub-systems.
Inacquisition,majorsub-systemsaresenttoleadsystemsintegratorsforassemblyinto
new systems. In sustainment, components and sub-systems are sent to depots for
maintenance and repair purposes. Note that components imported from abroad are
subject to inspection by Customs. DoDmay employ control points where items are
inspectedbeforeadmissionintotheDoDsupplychainfromcommercialsources.
Distributorsmayimportcomponentsand/orsourcethemfromotherdomesticsuppliers
incasetheoriginalcomponentmanufacturerhasexitedthemarket. Distributorsmay
alsoexistwhentheoriginalcomponentmanufacturersarestillproducing.
The supply chain operations model contains typical inventory and inventory reorder
models inthemultipletiersof thesupplychain. Figure5 illustratesthestructureand
behaviorofthismodel.
Figure5-Supplychainoperationsmodel

UNLIMITED DISTRIBUTION
ContractNumber:HQ0034-13-D-0004 TaskOrder:010,RT138
ReportNo.SERC-2016-TR-103
ENTERPRISEACTORMODEL
The enterprise actor model contains models of the various actors in the enterprise,
mainly suppliers (legitimate and counterfeiter), as well as government organizations
thatcontractwithsuppliersforpurchasing.Thismodeladdressesthebehaviorofthese
actors over time, including reactions to changing conditions. Original component
manufacturers(OCMs)andoriginalequipmentmanufacturers(OEMs)mayexitthemark
iftheirmarginsaretoolow.Counterfeitersmaybecomemoresophisticatedovertime
inthetypesofcounterfeitsthattheyproduce.Ifsupplyofelectronicwasteisreduced,
counterfeiters may transition from recycled counterfeits to more sophisticated
counterfeits such as clones. Figure 6 shows example decision logic associated with
enterpriseactors.
Figure6-Enterpriseactormodeldecisionlogicexample
POLICYMODEL
Thepolicymodelcontains thesetofactors thatcanpromulgatepolicy,aswellas the
effectsofpolicyenablementsintermsofstatechanges,newbusinessrulesanddelayed
effectsthatpropagatetotheothermodels.Forinstance,centralDoDpolicy-makingand
DoD program-level policy making are represented. In addition, other policy-making
agenciesoutsideDoDarerepresented,suchasDepartmentofJusticeandCustomsand
BorderPatrol.Figure7illustratestypicaldecisionlogicusedinthepolicymodel.

UNLIMITED DISTRIBUTION
ContractNumber:HQ0034-13-D-0004 TaskOrder:010,RT138
ReportNo.SERC-2016-TR-103
Figure7-Enterpriseactormodeldecisionlogicexample
Thefollowinganti-counterfeitingpoliciesareimplementedinthemodel.
• Supplierqualificationwithcriticalitylevels(DoDlevel)
• Acquisition
o Supplychaindesignviasourcingtolockdownreliablelong-termsuppliers
o Designrefreshplanningtopreventobsolescence(notimplementedfully)
• Obsolescencemanagementinsustainment
o Designrefreshesinsustainmenttopreventobsolescence
o Lifetimebuyofsoon-to-beobsoleteparts
• Customspolicies
o Inspectionsfrequency
o Cooperation with IP holders to determine legitimacy of suspect
counterfeits
• DoJpolicies
o Resourcesdevotedtocounterfeitingprosecutions
o PrioritiesinIPprosecution

UNLIMITED DISTRIBUTION
ContractNumber:HQ0034-13-D-0004 TaskOrder:010,RT138
ReportNo.SERC-2016-TR-103
• Electronicwasteexportlegislation
EXOGENOUSMODEL
The exogenousmodel primarily addresses technology change rates and the effect of
electronicsrecyclingexport.Theelectronicsrecyclingmarketwasaddedrecently.Itis
representedinsystemdynamicsasasupply-demandsystemwithpotentialrestrictions.
One of the major drivers of counterfeit parts is the importation of electronic
components that originally were exported as waste to non-OECD countries, then
“recycled”viaremarkingstopassasgenuinenewcomponents.
If Congress passes legislation aimed at restricting the export of U.S. electronics, the
modelcreatesalargerU.S.marketforresponsibleelectronicsrecycling,withdelays.It
should be noted that subsidies are not present in thismodel, but they would be an
additional policy level to quicken the process. Figure 8 shows the system dynamics
modeloftherecyclingmarket.
Figure8-Recyclingmarketmodel
IMPLEMENTATION
Themodel is implementedusingAnyLogic®7 simulation software. AnyLogic supports
discrete-event, agent-based and system dynamics simulation. Thus, it is useful for
potentialmodel composition. Inaddition, itprovidesanAPI for Java classextensions
andisthereforeusefulfordevelopmentofreusablemodelcomponentlibraries.

UNLIMITED DISTRIBUTION
ContractNumber:HQ0034-13-D-0004 TaskOrder:010,RT138
ReportNo.SERC-2016-TR-103
Themodelisimplementedprimarilyasanagent-basedmodel,withcomplexagentsfor
enterprise actors and policy actors, and simple agents for systems and components.
System dynamics models are used for external influence factors in the exogenous
model.
Thisapproachisreasonablywell-suitedsuitedtohandlemulti-scaleenterprisemodeling
and organizational decision-making. However, toomany agents could require excess
computationalresources,makingthemodelunsuitableforsmallcomputingplatforms.
CHALLENGES
Anenterprisemodelfacesanumberofchallengesinitsdesignanddevelopment.The
counterfeitpartsenterprisemodelfacedthefollowingchallenges.
• Multiple scales of resolution. This particularmodel includes phenomena from
macro level (agencies and organizations, economics) to the micro level
(electroniccircuits).Thereareimplicationsforcomputationalperformanceand
potentially for data and parameters (i.e., consistency acrossmultiple scales of
resolution). If the model is scaled up for transition, the computational
performancewillbeanimportantissue.Themodelmaynotrunwellonalaptop
due tomemory limitations. In this case, it could be reconfigured to run on a
server with browser client interface, for example. The consistency of data is
another issue thatwouldneed full exploration in transitionwitha stakeholder
dataset.
• Multiple stakeholder perspectives. It is typical to have a diverse set ofstakeholders for anyenterprisemodeling effort in termsof their interests and
perspectives.Insuchanenvironment,itischallengingtoascertainoverarching
importantissues,derivehowtheyinteract,andontheotherhandincludeissues
of importance to each stakeholder. The anti-counterfeiting roundtables
providedaneffectivewaytodeterminemanyimportantissuesandinteractions,
plusincludeissuesofimportancetothestakeholders.
• Multiple data sources/representations. Anyenterprisemodelwill requiredata
from multiple sources using multiple representations. This is one of the
motivations of the overall enterprise modeling and analysis research effort.
Clearly, data would come from different stakeholder organizations, and once
again consistency is an issue. This is mitigated by the agent-based
representation used for themodel. Each of the complex agents can use data
specialized to the organization that it represents. The overall enterprise
interactionmodelmustbegeneric,though,inthesenseofbeingindependentof
datarepresentationsusedbyparticularorganizations.Thishasbeenachievedat
leastasafirstorderresult.Detailedtransitionwilltestthisresult.Inadditionto
heterogeneousdatasetsfromdifferentorganizations,enterprisemodelstypically
include human/organizational decision-making, processes, and technical

UNLIMITED DISTRIBUTION
ContractNumber:HQ0034-13-D-0004 TaskOrder:010,RT138
ReportNo.SERC-2016-TR-103
behavior. The decomposition of the model into agents representing
organizations,supplychainprocessbehaviors,andagentsrepresentingtechnical
behaviorofsystemsandconstituentshaslargelyaddressedthisissue.
USAGE
The model is designed to be used by multiple stakeholders representing various
agenciesandorganizationsintheoverallenterprise.Inthissense,itwouldbeusedfor
scenario and what-if analysis. Since multiple stakeholder and policy options are
available, one of the important aspects to consider is the timing and order of policy
enablement.
In addition to scenario and what-if analysis, the model can also be used for purely
experimental purposes. For instance, what are the effects of individual policies on
system availability versus policy cost? What are the interaction effects between
differentpolicies? Thetimingandorderingofdifferentpolicyenablementscouldalso
be an experimental feature. This would create a complex response surface analysis
problem,butitmayproduceinterestingresults.
Another way to conceptualizemodel users is to consider producers of results versus
consumersofresults.
• Producersofresults
o Analystsinstakeholdercommunities(DoDsystemsengineering,logistics,
policy;otheragencies;industry)
o Performexperimentsandsensitivityanalysis
o Performanalysisforconsumers
o Primarilylookingforquantitativeresultsorrelativeeffects
• Consumersofresults
o Policymakersinstakeholdercommunities
o Testdifferentscenariosandpoliciestoseeeffectsandinteractions
o Primarilylookingforinsight
Figure 9 depicts the current model interface. The upper left contains the policy
dashboard. These items, inthegreybox,allowtheuseroruserstoenableorchange
the level of different policies among different stakeholders. Different stakeholders
include the DoD itself, individual DoD programs, the Department of Justice, Customs
andBorderPatrol,andCongress.Eachstakeholderhasvariouspolicyoptions.
Theupperrightfeaturesascenariodashboard.Thesearemodelfeaturesthatarenot
controllablebythestakeholders,butmaybeofinterestasexperimentalvariables(e.g.,
percentageofforeignsuppliersthatarecounterfeiters).
Thebottomtwolevelsconstitutethestatusdashboard(inblueboxes).Theupperoneis
theDoDstate,whiletheloweroneisthestateforenterpriseactorsoutsideofDoD.The

UNLIMITED DISTRIBUTION
ContractNumber:HQ0034-13-D-0004 TaskOrder:010,RT138
ReportNo.SERC-2016-TR-103
model assumes that DoD policy cost and system availability outcomes occur at the
programlevel. Inaddition, thestatusdashboardshowsthenumberofcounterfeit lot
suspects andescapes that eachprogramexperiences. For CPB, the status dashboard
showsthenumberofcounterfeitsuspectsandescapeexperienced,plusthepolicycosts
incurred.TheDoJstatusdashboardshowsthenumberofindictmentsofcounterfeiters,
plusthepolicycostsincurred.Theelectronicwastestatusdashboardshowsthenumber
oftomsofelectronicwastebeingexportedovertime.
Figure9-Modelinterface
EXAMPLEANALYSIS
InthesimulationrunreflectedinFigure9,theDoDandDoDprogrampolicyoptionsare
not enabled. Hence, there are no policy costs incurred. The number of escapes
(counterfeit component lots passing into the program) are shown over time for each
program.Sincequalification/testingarenotenabled,therearenosuspectsreportedat
theprogramlevel.Customsinspects20%ofincominglostrandomly,andthenumberof
suspectsandescapesareshownovertime.Itshouldbenotedthatmanyoftheescapes
from Customs are still in the supply chain and have not made it yet to a program.
Finally,DoJhasissuedseveralindictmentsduringthesimulatedtimeperiod.
Currently, themodel is populatedwith test data. The goal is to provide data that is
realisticforagivenscenariousingareasonablygenericdatastructure.Themotivation
here is that real data is difficult to verify formany aspects of themodel due to the
sensitivenatureoftheproblem,distributednatureofdataacrossmultipleagencies,and
lackofknowledgeaboutcounterfeitersandtheiroperations.Thus,ananalystwouldbe
responsibleforpopulatingthemodelwithdatafromtheirscenarioofinterest.

UNLIMITED DISTRIBUTION
ContractNumber:HQ0034-13-D-0004 TaskOrder:010,RT138
ReportNo.SERC-2016-TR-103
Asanexampleof theanalysis thatcanbeperformedby themodel, consider the four
scenarios.
• Scenario1–Baselinescenario
o Nosupplierqualification
o Noobsolescencemanagement
o Customsinspects20%ofincoming
o BaselineDoJenforcementresources
• Scenario2–Baselinescenarioplussupplierqualificationforallsub-systems
• Scenario3–Baselinescenarioplusincreasedresourcesforprosecution(50%)
• Scenario4–Scenarios2and3combined
Table1showsaverageresultsforthevariousmetricsoverthefourdifferentscenarios
for a ten year periodwith ten replications. It should be kept inmind that since the
model uses test data, no real inferences can be made on the results. This is only
illustrative of potential analysis that can be run, such as an analysis of variance to
determinepolicyeffectsandinteractioneffects.Itdoesillustratethatenablingsupplier
qualificationhasaneffectonreducingescapesintoprograms.
Table1-Examplemodelanalysis(notionaldata)
Modeloutputs(averagedovertenreplications)
Scenario1 Scenario2 Scenario3 Scenario4
Escapes–fighterjetprogram
(lots)
56.3 13.8 53.8 12.1
Suspects–fighterjetprogram
(lots)
0 72.3 0 70.3
Policycost–fighterjetprogram
($M)
0 30.4 0 30.7
Escapes–UAVprogram(lots) 51.7 11.6 48.9 11.4
Suspects–UAVprogram(lots) 0 69.7 0 65.2
Policycost–UAVprogram($M) 0 31.9 0 32.5
Escapes–Customs(lots) 640.2 636.0 635.2 632.1
Suspects–Customs(lots) 595.3 608.7 598.8 580.5
Policycost–Customs($M) 56.1 55.7 57.9 57.1

UNLIMITED DISTRIBUTION
ContractNumber:HQ0034-13-D-0004 TaskOrder:010,RT138
ReportNo.SERC-2016-TR-103
Indictments–DoJ(lots) 0 0 65.4 66.5
Policycost–DoJ($M) 0 0 53.6 52.1
ACADEMICPEERREVIEW
One of the tasks for this research project was to conduct a peer review of the
counterfeit parts enterprise model with representatives from SERC-affiliated
universities. This review was conducted on September 25, 2015, and it included
representatives from Massachusetts Institute of Technology, Purdue University and
StevensInstituteofTechnology.
The review consisted of a summary overview of the overall research task, then a
presentation on the counterfeit parts enterprise model and a demonstration of the
model’suse.Thenthereviewwasconductedalongthefollowingmainlines.
1. Validity—theextenttowhichthesimulationistechnicallycorrectrelativetothe
purposesforwhichitwasdeveloped.
2. Acceptability—theextenttowhichthesimulationaddressesproblemsinways
that are compatible with current preferred ways of decision-making and/or
potentiallyusefulnewwaysofmulti-stakeholderdecision-making.
3. Viability—theextenttowhichuseofthesimulationforthepurposesintended
wouldbeworththetimeandeffortrequired.
In addition, the questions belowwere posed as potential secondary topics on which
participantscouldcomment.
1. Isthisausefulwaytomodelanenterpriseproblem?
2. Aretherecorrectionsneededinthecurrentmodel?
3. Are there important aspects of the counterfeiting problems not currently
modeled?
4. Arethereadditionaldecisionsforwhichtheanalystshouldhavecontrols?
5. Towhatextentisthisreplicabletoanotherenterprisemodel?
6. Towhatextentdoes/canmethodologyfacilitatebuildingthesetypesofmodels?
Thediscussionfromthereviewissummarizedbelow.
Validity

UNLIMITED DISTRIBUTION
ContractNumber:HQ0034-13-D-0004 TaskOrder:010,RT138
ReportNo.SERC-2016-TR-103
• Savings from successfully reducing counterfeits should be incorporated, for
examplereducedrepairbills,finesfromsuccessfulprosecutions,etc.
• Howdoesthebehaviorofthecounterfeiterschangeovertime?
• Itseemslikethemajortradeisavailabilityvscost.
• How do the lags or interaction effects occur when a policy configuration is
changed?
• Theremightbecaseswhereonewouldwanttoorderpolicydecisionsovertime
intentionally. For example, it may make sense to change the Customs
interdictionpolicybeforechangingthesustainmentpolicy.
• It might be a good idea to have some human players in the loop to try to
representthecounterfeiters.Sometimestheinteractionismoreimportantthan
thenumbersthatcomeoutofthesimulation.
• Doesthemodelingmethodologyaddress thecreationofphenomena? It looks
likethatishappeningthroughtheentryofagents.
o Themethodologyisiterative,sonewphenomenathatarenoticedcanbe
included.
• Theapproach looks good, but asbackupplan to getting anoverall dataset for
validation,abackupwouldbetovalidatebehavioralmodelfortheactors.
• Whatisthenegativevalueofacounterfeitpart?
• Havecurrencycounterfeitersbeenexaminedtodeterminewhatparallelsthere
maybe?
Acceptability
• Itmaybeusefultotrydifferentapproacheswithstakeholdersandseehowthey
react.Somecouldbetoldverylittleabouthowthemodelworks;otherscouldbe
toldunderlyingmodeldetails;otherscouldbetoldtoexpectlimitedoutputs.
• What is the current state of the art that people are currently using in this
problemspace?DoDoDdecision-makershaveaccesstopolicytools?
o Wearemostlyawareoffocusedtoolsandmethodssuchasmethodsto
analyze the effectiveness of counterfeit suspect testing (Cohen & Lee,
2014).
• Thismodeldoesseemusefulforsupportingpolicyanalysts.
• Oneissueseemstobethestrugglebetweensnapshotsintimeversusdynamics
intermsofmodeloutput.Itcouldbeusefultohavethresholdsonthegraphsto
give some sense ofwhat is good and bad. Would a policy analyst be able to
understandwhatalevelofanoutputisgoodorbad?

UNLIMITED DISTRIBUTION
ContractNumber:HQ0034-13-D-0004 TaskOrder:010,RT138
ReportNo.SERC-2016-TR-103
• A past workshop addressed when you should make things very transparent
versus a high-level view (Rhodes & Ross, 2015). A high-level person may not
want to see the details but still needs to trust to the model. This report
discussestheideaofusecases,whichcouldbehelpful.Oneconclusionisthatit
is challenging to transition tools. The report also discussesmethods to trace
back causal connections from a terminal event (e.g., part failure) to a
spontaneousinitiatingevent(e.g.,apolicy).
• Itisagoodideatoidentify“hotspots”foruserinteraction.Theremaybenon-
policyfactorsthatareimportant.
• Itmightbeworthcreatingaclasstoletstudentsinvestigatethisproblem
Viability
• Howmucheffortwouldittaketoputthisonsomeone’sdesktop?
o There’salearningcurvewithinaparticulardomainsuchthatmodelstake
lesstimetodevelopasyoucreatemoreofthem.
o There’s a model maintenance cost, since the world changes, and the
modelmustbeupdatedtoreflectchanges.Thiswasanimportanttake-
away from the anti-counterfeiting roundtables, since the stakeholders
seenewthingsfrequently.
o There’salotofvalueinhavingatoolthatletsyougetridofbadideas.
• Wewanttotransitionknowledgeandinsight,notjusttools.
• This looks like a comprehensive effort, especially using the roundtables to get
differentperspectives
• Thegovernmentisdealingwithmanysimilarproblems.Itwouldbebeneficialto
holdarevieworroundtablewithotherpotentialusers.
• Howquickdoweneedtobeandinexpensivetomakethisviable?
• Videosofrecordedpresentationwouldbeusefulforclasses.
• One of the reasons that the Department of Defense is interested in
counterfeitingistheimpactonoperationalreadinesswhichishardtomonetize.
Isthereawaytoshowoperationalreadinessasanoutput?
o System availability is a proxy for operational readiness. Othermetrics
couldbedeveloped,includingtrustandresilience.
• Howcanthetragedyofthecommonsbeaddressed?Nooneownsthisproblem.
How much would it to cost to set this up in the future? That would help
decision-makers assess whether to make further investments in this type of
modeling.

UNLIMITED DISTRIBUTION
ContractNumber:HQ0034-13-D-0004 TaskOrder:010,RT138
ReportNo.SERC-2016-TR-103
MITREPEERREVIEW
The model was next presented to a set of subject matter experts from MITRE on
November 15, 2015. These experts work with an array of government agencies,
including the Army, the Air Force, the Department of Treasury and Internal Revenue
Service, and the Veterans Administration. In addition, representatives fromMITRE’s
SystemsEngineeringTechnologyCenterwerepresent.
This reviewuseda formatsimilar to thatof theacademicpeerreview. However, this
review focusedon theacceptabilityof themodel and its viability and transitionability
duetotheexpertiseoftheparticipantsinworkingwithvariousgovernmentcustomers
andtransitioningresults. Themodel’svalidityforthisgroupofsubjectmatterexperts
essentially served as a component of the acceptability, as the participants are not
expertsoncounterfeitparts.Thediscussionissummarizedbelow.
ValidityandAcceptability
• Itwouldbebeneficialtohaveatoolthatcaninformpolicy.Thiswouldbeuseful
to MITRE’s customers. For instance, is it better to pursue enforcement or
education?Adesignofexperimentsaroundthisquestionwouldbeinteresting.
• Theeffectofrandomnessinthevariousagentsshouldbeexplored,especiallyin
terms of agent interactions and bad actors. This is another area in which a
designofexperimentswouldbevaluable.
• IntheTreasurydomain,theyuseatensionscharttomodelcompetingtensions.
Itwouldbeinterestingtolookattrade-offsfromthatperspective.
• Thecostofapolicyiscriticalbothforvalidityandacceptability.Thisisnormally
determinedbyastandardcostmodelandaneconomicpolicymodel.
o It was noted that the current model does address policy costs. A
standardcostmodelisneededasinputdata.
• The Veterans Administration has complex business processes. These types of
processesshouldbeintegratedintothemodel.
o Similarly, a supply chain has complex business processes that are
captured in the current model. There is capability to model business
processesandrules.
• Howaremulti-scaleeffectsaddressed?Isthereacommontaxonomy?
o There is a common taxonomy largely centered on supply chain related
phenomena. This allowsmodeling at the enterprise level down to the
component(i.e.,integratedcircuit)level.
• Is there a formalmodel ofmetrics? The formalmodel ofmetrics focuses on
systemavailability.

UNLIMITED DISTRIBUTION
ContractNumber:HQ0034-13-D-0004 TaskOrder:010,RT138
ReportNo.SERC-2016-TR-103
o Costisincluded,butneedstobeenhancedviaastandardcostmodel.
• Looking through the lensof thepolicymaker, is themodel fidelity such that it
willhelpcraftabetterpolicythanonescanbefoundviacommonsense?How
wouldapolicy-makerknowthattheimplicationisbelievable?
• In a complex system/enterprise with interacting elements, availability versus
costaregoodmetrics.
• Validity is intheeyesofthebeholder. Itwouldalmostaninductiveprocessfor
eachgroupofstakeholderstoestablishitsownvalidity.Itisimportanttowork
closelywiththisgrouptoestablishvalidity.
• How could a policy go bad? One valuable use of the model is to find out
negative outcomes. Would a policy trigger the opposite ofwhat is intended?
Whatistherangeofpossibleoutcomespaces?
• Ifsomethingunexpectedhappens,howdoyoudiagnoseitinthemodel,interms
of being amistake in themodel or a real effect? If you have the underlying
frameworktodothiskindofanalysisasasandbox,thatisvaluable.
• Counterintuitive results are of great value, if they can be produced and
validated.
• Being able to incorporate business process models is important, since most
organizationshavethem.Thiswouldaidwithvalidityandacceptability.
• Manydecisionmakers ingovernmentarecurrentlyusingpointmodelsbutnot
thistypeofmodelthatencompassestieredlevelsandpolicyabstractions.
• Onemajor area of concern in government is bridging the gapbetween IT and
businessprocesses(CIOsandCOOs).Thisapproachhasalotofpotential.
• Sensitivityanalysisbothwithinandbetweenmodelsisimportant.Theexample
of enforcement versus education was again discussed in terms of sensitivity
analysis.
Viability/Transitionability
• Weneed to findoutwhat thebig stepsare tomakesomething like thiswork.
Thehugespreadofscalesisreallyinteresting.Productionizingtheabilitytodo
thisindifferentdomainsisimportant
• Visualizationishugeforgoingtoupperleadership.Youneedtoshowpictorially
thatpolicyrecommendationsmakesense.

UNLIMITED DISTRIBUTION
ContractNumber:HQ0034-13-D-0004 TaskOrder:010,RT138
ReportNo.SERC-2016-TR-103
DASD(SE)REVIEW
ThemodelwasthenpresentedonFebruary1,2016,torepresentativesfromtheOffice
oftheDeputyAssistantSecretaryofDefenseforSystemsEngineering.Aformatsimilar
tothetwopreviousreviewswasused.Thediscussionissummarizedbelow.
• Senator Tester had a study done thatwould be beneficial to themodel. DLA
wouldbethesourceforinformationonthatstudy.
• DPAP wants to use qualified suppliers, but it is not clear what the exact
definitionofaqualifiedsupplieris.Industryisdrivingthedefinitionofqualified
suppliers. Theproblemsareseveraltiersremovedfromprimecontractorsand
atleastonetierremovedfromDLAanddepots.
• Whatarethemajorinfluencersinthemodel?
• The EuropeanUnion and Asia also export their electronicwaste to nonOECD
countries.Thatshouldbeaddressedinthemodel.
• GIDEPhasasemi-automatedresponsesystem. Theenforcementof theGIDEP
monitoringandreportingsystemwouldbeofinterest.Whatistheinfluenceon
diminishingsuppliersandqualification?
• Itwould be of interest to see “under the hood” of themodel to see how the
majormodelelementsinteractwithoneanother.
• There are any number of “silver bullets” that are proposed to address
counterfeit parts. These may work, but may then cause unintended effects.
Usingthemodeltostudythoseeffectswouldbeofinterest.
• Thelimitationsondataareanissue.Duetothis,itwouldnotbeexpectedtouse
themodel forexactnumerical results,but rather toprovideuseful insights for
policyanalysis.
• The Office of the Assistant Secretary of Defense for Logistics & Materiel
Readiness(L&MR)maybeacustomerforthemodel.
• The model needs more direct, detailed and sustained involvement with a
communitytobeviable.
• Whatlevelofresourceswouldberequiredtomakethismodeloperational?
• Itwouldbeagoodideatofinddiscreteaspectswithinthemodelthathavedata
sourcesand fleshthemoutsothat themodelcanbetuned. Theoperationof
GIDEPmaybeoneexample,where theeffectsofmonitoringand reportingon
counterfeit suspects, supplier diminishment and supplier qualification can be
studied.

UNLIMITED DISTRIBUTION
ContractNumber:HQ0034-13-D-0004 TaskOrder:010,RT138
ReportNo.SERC-2016-TR-103
ANTI-COUNTERFEITINGROUNDTABLEREVIEW/WORKSHOP
Asanothertaskinthisresearch,themodelwaspresentedonFebruary5,2016,tothe
groupofsubjectmatterexpertswhocomprisedtheanti-counterfeitingroundtablethat
providedinputintothemodeldesignanddevelopment.Thereviewalsofocusedalong
thelinesofvalidity,acceptability,andviability.Thediscussionissummarizedbelow.
Validity
• TheDepartmentofDefensehascollecteddataonqualitycontrolovertheyears.
Thesedatamightprovide a reasonableproxy set. This is a follow-up item for
futuremodeltasks.
• Therearedirectandindirectpolicycosts. Policiescancausealargeamountof
“extra work” that is not reflected in the direct cost. How should that be
captured?Oneexampleistheextraworkcausedbyfalsepositives. Thisextra
work occurs both in the test process and also in the system-wide response to
GIDEPalertsfromfalsepositives.
• Somepartsarenottestable,soafeatureshouldbeaddedthatwouldallowyou
tomakecertainpartsun-testable.
• TheU.S. isnot theonlyexporterofelectronicwaste, soelectronicwaste from
AsiaandEuropeshouldalsobeconsideredinthemodel.
• Itwouldbeof interest tohaveaproductchoice lever inthesimulation,where
programs can leveragemore non-DoD unique parts. For instance, a program
maywant to align select partswith the automotive industry to ensure longer
termsupplyandreducetheobsolescenceissue.
Viability/Transitionability
• One participant indicated that the model and approach show promise, but
potential users need a better understanding of the dynamics in themodel, a
deeperunderstandingofthebusinessrulesinthemodel,andalsobetterdatato
getasenseofvalidityofthemodel.Overall,itcouldbeuseful.
• Onepotentialconclusionfromthisresearchisthatweneedtoidentifyefficient
ways to collect data in the future the address the data issue in complex
enterpriseproblems.
TRANSITIONPLANDISCUSSION
While the model has been developed primarily as a demonstration of the overall
enterprisemodelingmethodologydescribedinthisreport,itcouldpotentiallybeofuse
in policy analysis. The various reviews have provided a rich set of feedback for the
development of the following transition plan proposal for the counterfeit parts

UNLIMITED DISTRIBUTION
ContractNumber:HQ0034-13-D-0004 TaskOrder:010,RT138
ReportNo.SERC-2016-TR-103
enterprisemodel,andtherehasbeengenerallypositivereceptiontoitsusefulness.We
present the following points as the beginning of discussion and proposal for
transitioningthemodeltouse.
Owners and stakeholders. DoD agencieswould seem to be the logical home for the
counterfeitpartsenterprisemodel. The threemainagencieswouldbeDASD(Systems
Engineering), DASD(Logistics & Materiel Readiness) and Defense Procurement and
AcquisitionPolicy(DPAP).Onearrangementwouldbeforoneorganizationtobelead,
whilecoordinatingmodeluseandfocuswiththeothers.Thisconfigurationmostlikely
wouldhavethemodelhaveaparticularfocus,suchasacquisition,logisticsorpolicy.
Other owners and stakeholders are possible, such as electronics industry consortia,
primecontractorsorothergovernmentagenciesthataddresscounterfeiting.However,
the model may need substantial revision to meet the particular needs of those
organizations.
One of the key takeaways from the various reviews is that the owner and main
stakeholders need a deep understanding of themodel’s assumptions and underlying
dynamicsandinteractions.
Modelfocus.Themodelshouldbefocusedonaparticularconcretesetofphenomena
forwhich data is available. For instance, one comment from the Anti-Counterfeiting
Roundtable reviewmentionedmonitoringandreportingvia theGIDEPdatabase. This
phenomenasetlikelyhasavailabledataandcouldbeexploredinmoredetail.Thereare
otherphenomenasetssuchastheflow-downprocessfromleadsystemsintegratorsto
their suppliers of various DoD policies such as anti-counterfeiting and supplier
qualification. Clearly, the focusmust beon somethingof interest to theowners and
main stakeholders, and theremust be enough relevant data. This is in linewith the
notionofthe“coremodel”approachtoenterprisemodeling;however,theintentisto
focusonasmallersetofphenomenathan,forexample,thedeliveryoperationslevelof
amulti-levelenterprisemodel.
Model refinement and enhancement. While the interactionwith stakeholders during
model developmentwas useful,moredetailed interactionwith owner-stakeholders is
needed to elaborate and refine the model. The reviews have provided numerous
examples of potential refinements, ranging from modeling GIDEP monitoring and
reporting to modeling the effect of electronic waste exported to countries with
counterfeitingrecyclersbyAsianandEuropeannations.Inaddition,theremaybeother
phenomena that would be relevant to include, such as new policies (e.g., penalties,
programnotificationstoDoJoncounterfeitsuspects,testselectionfordifferenttypesof
inspectionstobedoneon incomingparts),behaviors(e.g.,supplychainadaptationby
counterfeitersinresponsetogovernmentactions),andalerts/indicatorsforphenomena
suchassupplierdiminishment.

UNLIMITED DISTRIBUTION
ContractNumber:HQ0034-13-D-0004 TaskOrder:010,RT138
ReportNo.SERC-2016-TR-103
Model validation. There is a strong need to validate the model with the owner-
stakeholders beyond what has initially been accomplished with the various reviews.
Thiswouldlikelyoccuracrossfourlines.
• Validationofdetailedmodelbehaviorusingavailabledata.
• Validationofaggregatemodelbehaviorunderavarietyofdifferentscenariosvia
comparisontosubjectmatterexpertexpectations.
• Detailedvalidationofindividualmodelcomponentsandagents.
• Identification and investigation of any counter-intuitive results to determine if
theymayberealeffectsofmodelerrorartifacts.
3. BEHAVIORALECONOMICSCASESTUDY
The use of behavioral models such as prospect theory may be helpful in describing
enterprisesystemsandperhaps in identifyingthebifurcationpointsthatexist inthese
systems. In particular, those bifurcations that stem from human decision making, as
opposedtophysicalormechanicalbifurcations,maybebetteridentifiedbybehavioral
modeling. In this section we discuss prospect theory and investigate its use in this
problem. As an example, we consider the problem of modeling driver response to
congestionpricing.Weconcludethatprospecttheorycanbeusedtoaccuratelymodel
thissituation,andalsodiscusshowasimpler,utility-based,modelcouldbeconstructed
soastocapturethesamephenomenon.Inlightofthis,wearguethatthetruebenefit
ofthebehavioralapproach isthat it lends itselfmorenaturallytothe identificationof
thebifurcationsthatoccurwithinthisproblem.
BEHAVIORALECONOMICSANDPROSPECTTHEORY
BehavioralEconomicsdescribesabroadsetofeconomicmodelingtoolsthatattemptto
describeeconomicphenomenafromtheperspectiveofthoseengagedinit,asopposed
to the perspective of the perfectly rational agent that is commonly assumed in the
classical economic literature. It serves as an explanatory methodology rather than a
prescriptiveoneinthesensethatitseekstomodeltheactualbehaviorofpeople,and
not the behavior that people should engage in to perfectly respond to a given set of
circumstances. For a synopsis of behavioral economics see Camerer and Loewenstein
(2004).
The inclusionof abehavioral element seemsnecessary for anydescriptively accurate
modelofasocially-basedphenomenon.Ashardastheymaytry,humansdonotactin
the purely rational way assumed by many models. From a computing perspective,
humansaresimplyincapableoftheinstantaneousprocessingandcalculationneededto

UNLIMITED DISTRIBUTION
ContractNumber:HQ0034-13-D-0004 TaskOrder:010,RT138
ReportNo.SERC-2016-TR-103
determine theoptimalaction foragivensituation,andeven if theyhad thiscapacity,
therearesometimesphysicalbarrierstoimplementingaperfectlyrationalstrategy.For
example,adrivermaybepreventedfromchoosingtheoptimalroutesimplybecausean
exitisunreachableduetoheavytrafficorspeed.
Intheirseminalworks,KahnemanandTversky(1979,1992)showcaseswhereexpected
utilityisfaultyandintroduceProspectTheoryasawayofsurmountingthesefaults.Itis
characterizedby risk aversionwith respect tohighprobability gains, risk seekingwith
respect to high probability losses, and for low probability events, risk seeking with
respect togainsand riskaversion for losses. The theorydefinesa twostagedecision
process. The first stage, editing, orders the different possible outcomes and selects a
referencepointwhichdefinesgainsandlosses.Evaluation,thesecondstage,providesa
value and probability for each outcome, and additionally, a probability weighting
function.Combiningthesevalues,onecandeterminetheexpectedprospectofachoice.
Cumulativeprospect theory ismuchthesame,withtheexceptionthat theprobability
weightingfunctionisappliedtothecumulativeprobabilitydistributioninsteadoftothe
probabilityofindividualevents.Asanexampleofprospecttheorybeingputtopractical
use, Rasiel, Weinfurt, and Schulman (2005) describe an example in which medical
decisionmakingdepartsfromexpectedutilitytheory,andshowhowthesituationmight
bemodeledbyprospecttheory.Barberis(2013)discussesthehistoryofprospecttheory
andthedifficultiesassociatedwithitsapplication.
More technically, prospect theory utilizes a concave value function for gains and a
convex function for losses,where the loss function is steeper than the gain function.
KahnemanandTverskysuggestthefollowingvaluefunction:
Equation1
Here 0 represents a particular outcome and 01 represents the reference point. Theprobability weighting function overweights small probabilities and underweights high
probabilityevents.
Theauthorsalsonamefivephenomenathatoccurregularly in therealworld,butare
not accounted for by expected utility theory: framing effects, nonlinear preferences,
source dependence, risk seeking behaviors, and loss averse behaviors. All of these
phenomenaaredescribedbyprospecttheory.
Prospecttheorycanthusbeviewedasaresponsetothefailuresofutility,i.e.,itarose
asamethodofcorrectingthepredictionsthatonewouldmakebasedautilitymodel.
Putinanotherway,therearesituationswhereabifurcationseparatingrealityandutility
predictions can arise. Prospect theory can bridge this gap providing predictions that

UNLIMITED DISTRIBUTION
ContractNumber:HQ0034-13-D-0004 TaskOrder:010,RT138
ReportNo.SERC-2016-TR-103
bettermatchreality.Thedifferencebetweenutilitytheoryandprospecttheoryisthus
theabilitytoaccuratelymodelthesebifurcations.
APPLICATIONTOENTERPRISESYSTEMS
BIFURCATIONMODELING
In Pennock and Gaffney (2016), the authors introduce the idea that certain types of
model inadequacy are caused by bifurcations or phase transitions. These can occur
either within reality or between reality and the model used for its description, and
usually involve a qualitative shift in some phenomena. The existence or possibility of
thesebifurcationsaddsanextraelementtobecapturedbyamodelandthusincreases
the likelihood ofmodel error. Although somebifurcations are physical in nature, and
canthusbemodeledbasedonknownfacts (e.g., thevariousphasesofwater),others
arisebecauseofsocialfactors,andassuch,aremuchmoredifficulttomodel.
Wearguethatabehavioralapproachtomodelingmayyieldinsightswithrespecttothe
existenceofphasetransitionsandbifurcations.Duetotheshapeofthevaluefunction
usedinprospecttheory,bifurcationsareactuallyquitenaturaltomodel.Indeed,abasic
feature of the value function is that gains and losses are evaluated by separate
functions. Hence, the point where we switch from one function to the other is the
referencepointatwhichthebifurcationoccurs.Prospecttheoryisthusanaturalchoice
forbifurcationmodeling.
CONGESTIONPRICING
As an example of a phenomena containing bifurcations, we consider the problem of
congestion pricing. Highway tolling has a long history, with tolled roads existing
throughout theworld.Dynamiccongestionpricing isa typical strategyused to reduce
demandon roads.The typicalequilibriumpricingpolicy isone that imposesupon the
driverthemarginalcosttosocietyoftheirtrip.AsXuetal.(2011)explain
The premise is that being charged the marginal external costs their trips impose to the society, users will voluntarily change their travel behaviors in such a way that traffic congestion is
minimized or social welfare is maximized. As the marginal external costs vary over time, space or vehicle type,
"theoretically-optimal" tolls will be highly differentiated and fully dynamic.
Fromtheperspectiveofthosewhoareactuallyinchargeofroadmanagementandtoll
implementation, themain assumption likely involves an assessment of road demand
underdifferent tollprices. Itwouldbequitenatural towritedemandasadecreasing
functionoftollprice,forexample,
Equation2

UNLIMITED DISTRIBUTION
ContractNumber:HQ0034-13-D-0004 TaskOrder:010,RT138
ReportNo.SERC-2016-TR-103
where2isthetollprice,3(2)isthedemandforthetolledroadatprice2,and6and7are constant parameters. Such an assessment could be based on stated preference
surveysorperhapseventhebasicintuitionthathigherpricesleadtolowerdemand.We
contend that, if the trafficmanager gives in to the temptation to immediately accept
suchamodelanduseitsresultsregardingtollroaddemandasaninputtosomelarger
scalemodel,seriousproblemsarelikelytoemerge.
Thesourceoftheproblemisthatitisunlikelythatdriverswillrespond“correctly”tothe
disincentiveof the toll. Recent studies, forexample,have shownevidence thatdriver
responsetotolledlanes isnotalwaysaccuratelydescribedbyclassicaleconomics, i.e.,
highertollsdonotalwaysresultinlowerdemand.Inparticular,thereisevidencefrom
bothMinneapolis(JansonandLevinson,2014)andSanDiego(Brownstoneetal.,2003)
thatshowcaseswherethedemandforthetolledlanesactuallyincreaseswhenthetoll
price is increased. A purely classical model such as (Equation 2), with demand
decreasingaspriceincreases,isthusinadequateforcapturingthefullcomplexityofthe
situation.
Themissing factor is the benefit felt by the driver with respect to time savings. If a
changeinthetollwasnotindicativeofachangeintrafficvolume,thentheeffectofthe
tollwouldbethestraightforwardlossofutilityduetopayingahighertollfornobenefit.
However, if a change in toll is accompaniedby (at least in themindof thedriver) an
increase in traffic in the non-tolled lanes, then the change in utility is not so clear; it
could increase or decrease depending on the results of a comparison between utility
lossduetotollandutilitygainduetotimesavings.
PROSPECTTHEORYMODEL
Traditional models of driver response to congestion pricing center around utility
maximizing individuals, although there is some recent work that takes a behavioral
approach to the problem. In a sense, the behavioral approach to congestion pricing
modeling is themost obvious and natural way to go, as we are trying tomodel the
response of drivers to a toll in reality, and not their behavior in an idealized world.
Furthermore,thechoiceofadriverislikelyasplitseconddecisionfortheinfrequenttoll
roaddriver,oraningrainedandnearlyautomaticresponsefortheeverydaydriver.The
decision of whether or not to utilize a toll road may therefore be divorced from
optimalityconsiderationsandhavemoretodowiththesepracticalconcerns.Thereare
several papers in the literature that apply prospect theory to congestion pricing, for
example,PanandZuo(2014)andXuetal.(2011).Thegoalofsuchmodelsisgenerally
toformulateanequilibriumprice,andnottomatchtheunexpecteddemandbehavior
thatoccurredinMinneapolisandSanDiego.

UNLIMITED DISTRIBUTION
ContractNumber:HQ0034-13-D-0004 TaskOrder:010,RT138
ReportNo.SERC-2016-TR-103
Ourpurposehereistoshowhowtheunexpecteddriverbehaviormightbeanticipated
or noticed a priori, i.e., by looking at a model of the situation instead of through
experimentalanalysis.Whilewecontendthatprospecttheoryiswellsuitedtofindthe
particulartypeofbifurcationinvolvedinthissituation,otherbehavioralmodelsmaybe
ofuseinfindingothertypesofbifurcations.Forinstance,paradigmssuchasinformation
economicsforsignalingorgametheoryfornon-cooperativebehaviormightbeusedto
identifyalternativetypesofbifurcations.
Inthissectionwediscusshowaprospecttheorybasedmodeloftollroaddemandcould
be formulated. We assume that driver utility is derived from a comparison of their
expectationsregardingtriplengthandcostandtheactualtriplengthandcostincurred
by the driver. This conforms to the idea that drivers view their driving experience
relativetotheirownparticularframeofreference.Toacertainextent,theseframesof
reference are likely similar fromperson to person. For instance, a driver crossing the
GeorgeWashingtonBridgeislikelytoexpectamorecostlyandslowertripthanatripof
the same length ina rural region.Theprospect theoryapproachalsoagreeswith the
thoughtthatsmalllossesareviewedmorenegativelythanacorrespondinglysmallgain
isviewedfavorably.Put inanotherway, thegoodwefeelbybeingslightlyearly is far
outweighedbythebadthatwefeelbybeingslightlylate.
Thedrivermustchoosebetweenanunreliable(withrespecttotrip length)non-tolled
laneandareliable(i.e.,constanttriplengthdistribution)tolllane.Wecanimagineasort
of indifference curve spanning different toll/time pairs which serves as a boundary
betweenpreferringthetolledandnon-tolledlanes.Weacknowledgethatmanydrivers
havetheirmindsmadeupregardingtollroadutilizationwellbeforethechoiceisgiven,
butassumethatthereisapopulationofdriverswhocanbeswayedtooneroadorthe
otherbasedonthepresentconditions.
Wealsoassumea rangeofpossibleoutcomesregarding trip length inboth the tolled
andnon-tolledlanes,andanassociatedprobabilitydistributiondescribingthelikelihood
oftheseoutcomes.Whenthetollisviewed,thevaluesoftriplengthareupdatedforthe
non-tolledlanes(increasingwithtollvalues),whileitisassumedthattriplengthranges
inthetolledlanesdonotdegradefurther.
Todevelopthemodel,let8=thetollvalue,where8 ≥ 0,;<=expectedtriplengthinthe non-tolled laneswhen the toll price is 8, and;= = the reference trip length fordriver>.;isdeterminedbythedriver,whileweassumethat;<islinearlydependentonandincreasingwith8,Wedefinetheutility(orprospect)fordriver>payingtoll8as
Equation3
where 2(8) is a penalty function for paying a toll of 8 dollars and ?(∙) is the valuefunctionofprospecttheory.
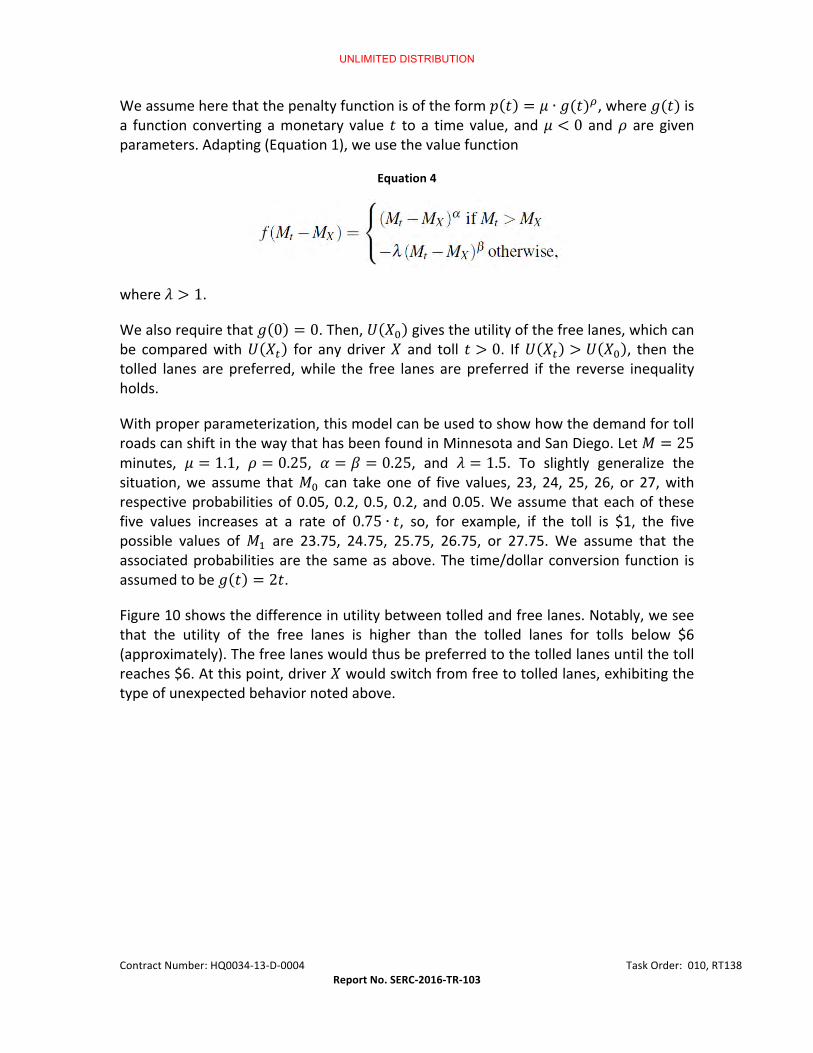
UNLIMITED DISTRIBUTION
ContractNumber:HQ0034-13-D-0004 TaskOrder:010,RT138
ReportNo.SERC-2016-TR-103
Weassumeherethatthepenaltyfunctionisoftheform2 8 = B ∙ C(8)D,whereC(8)isa function convertingamonetary value 8 to a timevalue, andB < 0 andF are givenparameters.Adapting(Equation1),weusethevaluefunction
Equation4
whereG > 1.
WealsorequirethatC 0 = 0.Then,J >1 givestheutilityofthefreelanes,whichcan
be comparedwithJ >< for any driver> and toll 8 > 0. IfJ >< > J >1 , then the
tolled lanes arepreferred,while the free lanes arepreferred if the reverse inequality
holds.
Withproperparameterization,thismodelcanbeusedtoshowhowthedemandfortoll
roadscanshiftinthewaythathasbeenfoundinMinnesotaandSanDiego.Let; = 25minutes, B = 1.1, F = 0.25, N = O = 0.25, and G = 1.5. To slightly generalize thesituation,we assume that;1 can take oneof five values, 23, 24, 25, 26, or 27,withrespectiveprobabilitiesof0.05,0.2,0.5,0.2,and0.05.Weassumethateachof these
five values increases at a rate of 0.75 ∙ 8, so, for example, if the toll is $1, the five
possible values of;Q are 23.75, 24.75, 25.75, 26.75, or 27.75. We assume that the
associatedprobabilitiesare thesameasabove.The time/dollarconversion function is
assumedtobeC 8 = 28.
Figure10showsthedifferenceinutilitybetweentolledandfreelanes.Notably,wesee
that the utility of the free lanes is higher than the tolled lanes for tolls below $6
(approximately).Thefreelaneswouldthusbepreferredtothetolledlanesuntilthetoll
reaches$6.Atthispoint,driver>wouldswitchfromfreetotolledlanes,exhibitingthe
typeofunexpectedbehaviornotedabove.

UNLIMITED DISTRIBUTION
ContractNumber:HQ0034-13-D-0004 TaskOrder:010,RT138
ReportNo.SERC-2016-TR-103
Figure10–Differenceinutilitybetweenthetolledandfreelanes
OBJECTIONS
We have shown how prospect theory can be used to model the decision making of
drivers facedwith congestion tolling.Thequestion is if this strategy isbetter than,or
preferableto,otherreasonablemodelssuchasutilitytheory.Tothisend,wedescribe
how utility theory could also be used to give a descriptively accuratemodel, andwe
concludewithadiscussionofwhy, ifbothmodels canadequately capture reality, the
behavioralmodelmaybepreferred.
Aswehavediscussed,payingatollwilldecreaseone'sutility,ceterisparibus.However,payingthetollwillresultinabenefittothedriver,asatimesavingswilloccurbytaking
the toll road as opposed to the non-tolled road. We can imagine a utility function
dependingontwoparameters,tollprice8andtriptimeR.IfRisfixed,wewouldhaveSS< T 8,R < 0,and if8 is fixedwehave SSU T 8,R < 0.However,wecontendthat8andR are not independent, at least in the behavioral reaction of the driver to new
information(thetollprice).Namely,itseemsreasonabletoassumethat,as8increasesRshoulddecrease.Thus,therewillbeagaininoneaspectoftheutilityfunctionanda
loss in theotheraspect.Themagnitudeof thesederivativeswill thereforegovern the
favorabilityofthetollornon-tolledroadforagiventollvalue.
Theentirequestionregardingthesuitabilityofautilitymodelcouldthusberestatedas
a question of how the developers could have anticipated that the monetary utility
functionandthetimeutilityfunctionhadderivativesthatwouldsometimesleadtothe
unexpected behavior.While functions can certainly bewritten that will generate the
desiredoutcome(theunexpectedbehavior),weseenoreasonwhyutilityfunctionswith
thesepropertieswouldbechosenapriori.

UNLIMITED DISTRIBUTION
ContractNumber:HQ0034-13-D-0004 TaskOrder:010,RT138
ReportNo.SERC-2016-TR-103
Behavioralmodels,ontheotherhand,areexplicitlymeanttocapturesituationswherea
clearchangeinbehaviortakesplace.Themainideaisthatwhatisneededto`forecast'a
bifurcation is exactly what prospect theory adds to utility theory. Even if there is a
simpler representation of a phenomenon (i.e., a simple utility model), that
representation may not be useful with respect to bifurcation identification, whereas
prospectmodelsareidealinrepresentingbifurcationsbasedonreferencepointswhich
differentiategainsfromlossesandriskaversionfromriskseeking.
Finally,manyofthebasicbenefitsofprospecttheory(e.g.,riskaversionandriskseeking
under different circumstances, framing effects, and losses being viewedmoreharshly
thangains) are all clearlypresent in traffic situations, and sowewouldexpect that a
modeling strategyexplicitly focusedon such issueswouldbe superior toonewithno
such focus.Althoughutility theorycouldbeusedtomodelsuchthingsonceweknow
thattheyarepresent,behavioralmodelsareuseful forshowingthepossibilityofsuchevents, and so are useful for the traffic engineer whomust, without empirical data,
determinethepossibleresponseofdriverstofluctuatingtolls.
CONCLUSIONS
Whiletheoriginalintentofthistasktoincreasethefidelityofagentdecisionmodelsin
enterprisemodels,theresultstookusinadifferentdirection.Ratherweconcludedthat
theissuewasnosomuchthefidelityofthemodelastheabilitytodetectbifurcationsin
system behavior. In enterprise systems, the uncertainty is often so high that only
substantialshiftsinmodelbehavioraremeaningful.Unlesstheincreaseinmodelfidelity
results insuchadetection,anyotherimprovementsinaccuracyarelikelytobelost in
the noise. This result has strongly influenced the whole enterprise systems analysis
effort.TheimplicationsarediscussedingreaterdetailinSections6and8.
4. PHENOMENAANDCANONICALMODELS
Modelingenterprisesystemsnecessarilyrequiresthesimultaneousconsiderationofthe
system frommultiple perspectives. Given the nature of enterprise systems this often
requires models from different scientific disciplines that were not intended to be
integrated. Previous tasks (RT-44, RT-110) considered some of the challenges of
composing suchmodels. It ishasbeendonesuccessfully in some instances,butoften
times it provesdifficult. Thus, thequestion iswhat allowsone to reuseand compose
models from different disciplines successfully. This section is divided into two parts.
First,wediscusstheproblemofphenomenaandreuseandaconceptuallevelanddraw
conclusions based on past approaches to model composition and reuse. Second, we
develop a mathematical approach to analyze the conceptual view and assess the
resulting necessary conditions for composition and reuse. Finally, we consider which
researchdirectionsshowthemostpromisetofacilitateenterprisemodeling.

UNLIMITED DISTRIBUTION
ContractNumber:HQ0034-13-D-0004 TaskOrder:010,RT138
ReportNo.SERC-2016-TR-103
ACONCEPTUALVIEWOFMODELCOMPOSITIONANDREUSEFORENTERPRISEMODELING
When we attempt to create models of complex systems and enterprises, we often
intendtoreuseexistingmodelsascomponentsoftheoverallformulation.Forexample,
anoverallmodelofhealthcaredelivery(e.g.,chronicdiseasemanagement)wouldneed
componentmodelsfortheincidenceandprogressionofhypertension,type2diabetes,
andheartdisease.Inthiscase,theacceptabilityoftheoverallmodelwoulddependon
thecomponentmodelshavingbeenvettedandpublishedinreputablemedicaljournals.
Such component models might be in the form of parameterized equations,
representations encoded in commercial software tools, or legacy software code
developed forpreviouspurposes. Integrating suchcomponentmodels intoanoverall
model presents several challenges at syntactic, sematic, and pragmatic levels (Tolk,
2003,2013;Pennock&Rouse,2014).Thesechallengesrangefromassuringcompatible
variabledefinitions,unitsofmeasureandcoordinatesystems,tobeingconsistentabout
assumptionconcerningindependence,conservation,andcontinuity.
This sectionaddresses such reuse in the contextof anoverall framework for creating
and assembling models. This framework starts with the nature of the problem of
interestandproceedsasfollows:
• The nature of the problem of interest and the questions associated with this
problemshoulddrivethedevelopmentofmodelsandsimulations.
• Thenatureoftheproblemandquestionsstronglyinfluencetheextenttowhich
reuseofcomponentmodelsandsimulationscanbejustified.
• Problems can be defined in terms of the phenomena (e.g., physical, human,
economic,andsocial)associatedwithaddressingthequestionsofinterest.
• The variable predictions needed to address the questions should inform the
choiceofmodelingparadigmsandrepresentations.
• Paradigmsandrepresentationshaveassociatedtypicalassumptionsthatmayor
maynotbewarrantedandshouldbeconsistentacrosscomponentmodels.
• Reuse canoccurat five levels:paradigms, representations, standardproblems,
solutionsoftwarepackages,orlegacysoftwarecode;risktypicallyincreaseswith
levelofreuse.
ARCHETYPALPROBLEMS
Rouse (2015)discusses sixarchetypalproblems thatprovide test cases for theoverall
modelingandvisualizationmethodologypresentedinthebook.
• DeterringorIdentifyingCounterfeitParts
• FinancialSystemsandBurstingBubbles
• HumanResponsesandUrbanResilience
• TrafficControlviaCongestionPricing
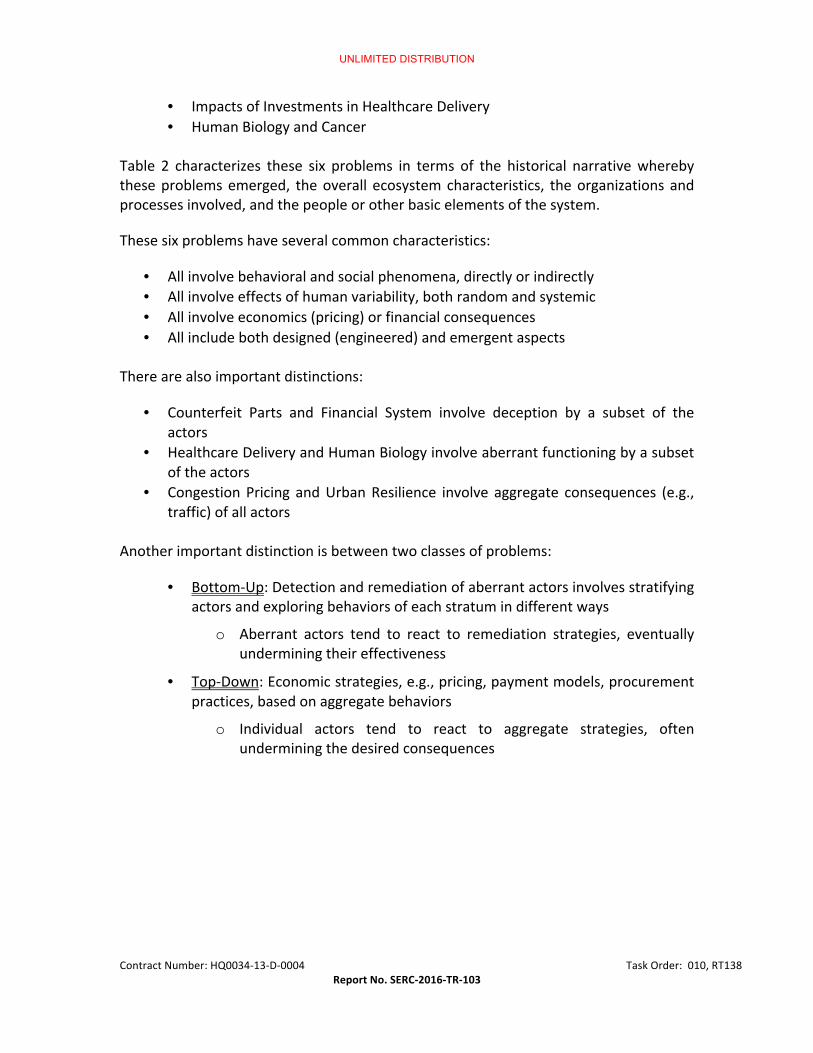
UNLIMITED DISTRIBUTION
ContractNumber:HQ0034-13-D-0004 TaskOrder:010,RT138
ReportNo.SERC-2016-TR-103
• ImpactsofInvestmentsinHealthcareDelivery
• HumanBiologyandCancer
Table 2 characterizes these six problems in terms of the historical narrativewhereby
theseproblemsemerged, theoverall ecosystemcharacteristics, theorganizations and
processesinvolved,andthepeopleorotherbasicelementsofthesystem.
Thesesixproblemshaveseveralcommoncharacteristics:
• Allinvolvebehavioralandsocialphenomena,directlyorindirectly
• Allinvolveeffectsofhumanvariability,bothrandomandsystemic
• Allinvolveeconomics(pricing)orfinancialconsequences
• Allincludebothdesigned(engineered)andemergentaspects
Therearealsoimportantdistinctions:
• Counterfeit Parts and Financial System involve deception by a subset of the
actors
• HealthcareDeliveryandHumanBiologyinvolveaberrantfunctioningbyasubset
oftheactors
• CongestionPricing andUrbanResilience involve aggregate consequences (e.g.,
traffic)ofallactors
Anotherimportantdistinctionisbetweentwoclassesofproblems:
• Bottom-Up:Detectionandremediationofaberrantactorsinvolvesstratifying
actorsandexploringbehaviorsofeachstratumindifferentways
o Aberrant actors tend to react to remediation strategies, eventually
underminingtheireffectiveness
• Top-Down:Economicstrategies,e.g.,pricing,paymentmodels,procurement
practices,basedonaggregatebehaviors
o Individual actors tend to react to aggregate strategies, often
underminingthedesiredconsequences

UNLIMITED DISTRIBUTION
ContractNumber:HQ0034-13-D-0004 TaskOrder:010,RT138
ReportNo.SERC-2016-TR-103
Table2-CharacterizationsofArchetypalProblems
LevelsofPhenomena
CounterfeitParts FinancialSystem UrbanResilience CongestionPricing
HealthcareDelivery
HumanBiology
HistoricalNarrative
Evolutionof
aerospace/defense
ecosystemintermsof
decisionprocesses
andincentives
Evolutionof
financial
ecosystemin
termsof
investment
instruments,
regulations,etc.
Evolutionofurban
ecosystemin
termsofsocial
development,
communitiesand
neighborhoods
Evolutionof
transportation
ecosystemin
termsof
technologies,
demographics&
expectations
Evolutionof
healthcare
ecosystemin
termsofends
supportedand
meansprovided
Evolutionof
humansinterms
ofgenes,proteins,
cells,tissues,
organs,systems
andsignaling
EcosystemCharacteristics
Aerospace/Defense
ecosystem–norms,
policies,valuesand
suppliereconomics
Financial
ecosystem–what
isassumed,
allowed,illegal,
andenforced
Urbanecosystem
–norms,values
andelementsof
socialresilience
Transportation
ecosystem–
norms,values&
expectationsof
convenience
Healthcare
ecosystem–
norms,valuesand
resource
competition
Humanbiological
ecosystem,
includingfactors
suchaslifestyle
andenvironment
Organizations&Processes
Systemassemblyand
deploymentnetworks
andcontrols;testand
evaluation
Commercialand
investmentbanks,
mortgage
companies,and
regulatory
agencies
Urban
infrastructure
networksand
flows--water,
food,energy,and
people
Transportation
infrastructure
networksand
flows,andcontrol
systems
Provider,payer
andsupplier
organizations–
investments,
capacities,flows,
outcomes
Cardiovascular,
pulmonary,
digestive,
nervous,
reproductive,et
al.systems
PeopleorBasicElements
Flowofpartsin
supplychainto
assemblyand
deployment
Investors,
financial
engineers,
traders,and
homeowners
Peoples’evolving
perceptions,
expectationsand
decisions,aswell
assharedbeliefs
Individualvehicles
anddriver
decisionmakingin
responsetoflows
andcontrols
People’shealth
anddisease
incidence,
progressionand
treatment
Cellularprocesses
andsignaling
mechanisms;
therapydecisions

UNLIMITED DISTRIBUTION
ContractNumber:HQ0034-13-D-0004 TaskOrder:010,RT138ReportNo.SERC-2016-TR-103
Consideringhowthephenomenaassociatedwiththeseproblemsmightberepresented,threecommonfeaturesshouldbenoted.First,thesetofphenomenaassociatedwithaproblemcanberepresentedatdifferentlevelsofabstraction,e.g.,individualinstancesofcounterfeitingversusmacroeconomicpoliciesthatmotivatecounterfeiting.Second,eachproblemhasphenomenaofinterestthatemergewithineachlayerofabstraction.This would suggest that a different representation of the complex system would berelevantforeachlayer.Third,eachproblemexhibitsfeedbackloopsthatcutacrosstwoor more layers. For example, the incentive to counterfeit increases with decliningsupplier profitmargins. High-level policies designed to combat counterfeiting couldraise costs at the lower levels. This could further erode profit margins and actuallyincrease the incentive to counterfeit. Thus, the counterfeiting problem cannot beaddressed without considering the relationships between the different layers of thecomplex system. The phenomena associated with these six problems are laterdiscussed.
MODELINGPARADIGMS
A scientific paradigm is a distinct set of theories, research methods, postulates, andstandards defining legitimate research. Examples include Newtonian mechanics,Einsteinian relativity, andquantummechanics. In contrast, amodeling paradigm is aclass of formalisms, typically mathematical or computational, for representing aphenomenon of interest. Examples include control theory, queuing theory, andnetworktheory.
Variable Predictions of Interest
Thechoiceofamodelingparadigmdependsonthevariablesoneneedstopredict,aswellastheassumptionsoneiswillingtoaccept.Listedbelowisarangeofvariablethatonemightneedtopredict.
• Responsemagnitude• Responsetime• Stabilityofresponse• Controlerrors• Observability• Controllability• Stateestimates• Estimationerrors• Numberandtimeinqueue• Numberandtimeinsystem• Probabilityofbalkorrenege• Shortestdistance• Shortesttime• Propagationofsentiment• Choiceselected

UNLIMITED DISTRIBUTION
ContractNumber:HQ0034-13-D-0004 TaskOrder:010,RT138ReportNo.SERC-2016-TR-103
• Gameequilibrium• Electionresults• Impactsofincentives• Timeuntilproblemsolved• Stepsuntilproblemsolved• Problemsolvingerrors• Netpresentvalue• Netoptionvalue• Netcapitalatrisk
Predictions, Paradigms, Representations, and Assumptions
Table 3 maps these predictions of interest to paradigms, representations, andassumptions. Eight different modeling paradigms are summarized in terms of thepredictionstheytypicallyprovide,themostcommonrepresentations,andassumptionsusuallyassociatedwitheachparadigm.
Thereare,ofcourse,manymoretypesofvariablesthatmightbeofinterest,aswellasquitefewothermodelingparadigmsthatmightbeemployed.Thus,Table2ismeanttoberepresentativeratherthanexhaustive.Inparticular,itsuggestsalineofreasoningtomap fromproblemsandquestions tocandidatecomponentmodels for inclusion isanoverallmodelofacomplexsystemorenterprise.
It is also useful to note that there are domain-specific versions of most of thesemodelingparadigms. Forexample, thereareavarietyofmodelsofdisease incidenceand progression available in the healthcare delivery literature. As another example,thereareseveraltrafficcongestionmodelsavailableinthetransportationliterature.
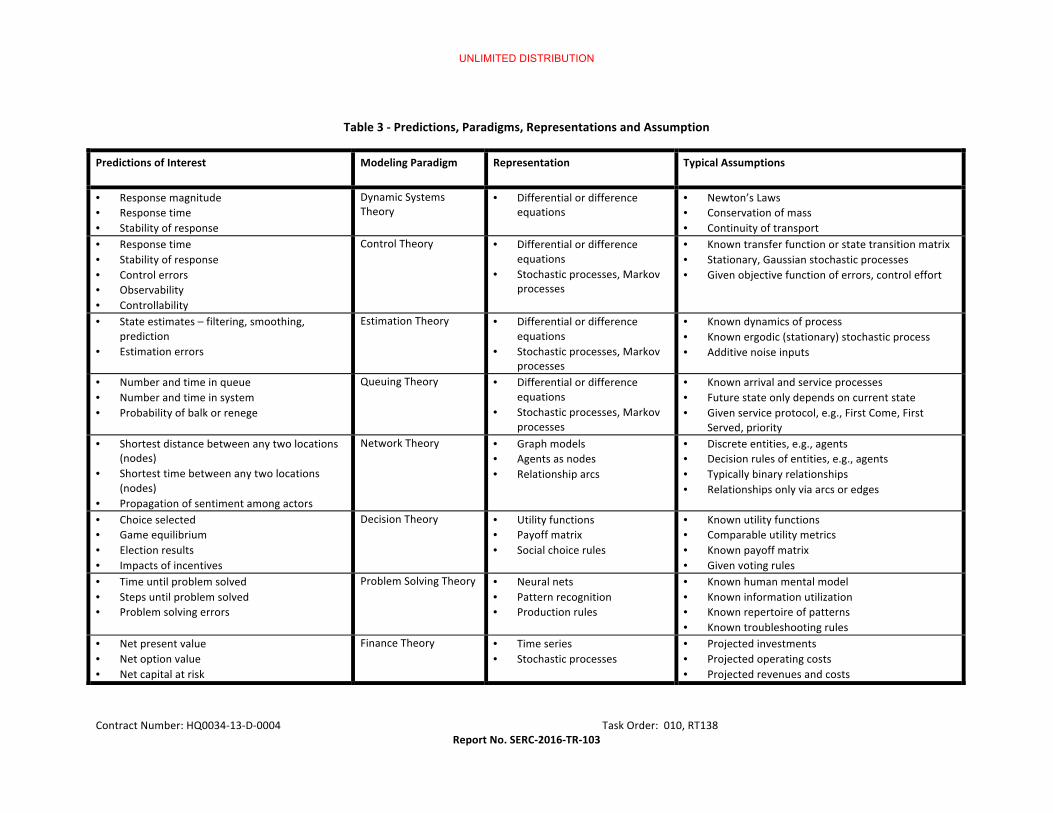
UNLIMITED DISTRIBUTION
ContractNumber:HQ0034-13-D-0004 TaskOrder:010,RT138ReportNo.SERC-2016-TR-103
Table3-Predictions,Paradigms,RepresentationsandAssumption
PredictionsofInterest ModelingParadigm Representation TypicalAssumptions
• Responsemagnitude• Responsetime• Stabilityofresponse
DynamicSystemsTheory
• Differentialordifferenceequations
• Newton’sLaws• Conservationofmass• Continuityoftransport
• Responsetime• Stabilityofresponse• Controlerrors• Observability• Controllability
ControlTheory • Differentialordifferenceequations
• Stochasticprocesses,Markovprocesses
• Knowntransferfunctionorstatetransitionmatrix• Stationary,Gaussianstochasticprocesses• Givenobjectivefunctionoferrors,controleffort
• Stateestimates–filtering,smoothing,prediction
• Estimationerrors
EstimationTheory • Differentialordifferenceequations
• Stochasticprocesses,Markovprocesses
• Knowndynamicsofprocess• Knownergodic(stationary)stochasticprocess• Additivenoiseinputs
• Numberandtimeinqueue• Numberandtimeinsystem• Probabilityofbalkorrenege
QueuingTheory • Differentialordifferenceequations
• Stochasticprocesses,Markovprocesses
• Knownarrivalandserviceprocesses• Futurestateonlydependsoncurrentstate• Givenserviceprotocol,e.g.,FirstCome,First
Served,priority• Shortestdistancebetweenanytwolocations
(nodes)• Shortesttimebetweenanytwolocations
(nodes)• Propagationofsentimentamongactors
NetworkTheory • Graphmodels• Agentsasnodes• Relationshiparcs
• Discreteentities,e.g.,agents• Decisionrulesofentities,e.g.,agents• Typicallybinaryrelationships• Relationshipsonlyviaarcsoredges
• Choiceselected• Gameequilibrium• Electionresults• Impactsofincentives
DecisionTheory • Utilityfunctions• Payoffmatrix• Socialchoicerules
• Knownutilityfunctions• Comparableutilitymetrics• Knownpayoffmatrix• Givenvotingrules
• Timeuntilproblemsolved• Stepsuntilproblemsolved• Problemsolvingerrors
ProblemSolvingTheory • Neuralnets• Patternrecognition• Productionrules
• Knownhumanmentalmodel• Knowninformationutilization• Knownrepertoireofpatterns• Knowntroubleshootingrules
• Netpresentvalue• Netoptionvalue• Netcapitalatrisk
FinanceTheory • Timeseries• Stochasticprocesses
• Projectedinvestments• Projectedoperatingcosts• Projectedrevenuesandcosts

46
PHENOMENAANDPARADIGMS
Table4summarizeseightsclassesofphenomenaemployedtocharacterizethesixarchetypalproblems at deeper levels. These characterizations can be used to map the phenomenaassociatedwitheachproblemtomodelingparadigmslikelyofuseforaddressingtheproblem.
Table4-EightClassesofPhenomena
ClassofPhenomena ExamplePhenomenaofInterest
Physical,natural Temporalandspatialrelationships&responses
Physical,designed Input-outputrelationships,responses,stability
Human,individuals Taskbehaviors&performance,mentalmodels
Human,teamsorgroups Teamandgroupbehavior&performance
Economic,micro Consumervalue,pricing,productioneconomics
Economic,macro Grossproduction,employment,inflation,taxation
Social,organizational Structures,roles,information,resources
Social,societal Castes,constituencies,coalitions,negotiations
Table 5 maps selected phenomena identified for the six archetypal problems to modelingparadigms.ThefulllistofphenomenaassociatedwiththesesixproblemsisdiscussedinRouse(2015).
Table5-ArchetypalPhenomenaandModelingParadigms
Category Phenomenon ModelingParadigm
Physical,Natural FlowofWater DynamicSystemsTheory
Physical,Natural DiseaseIncidence/Progression
StatisticalModels,MarkovProcesses
Physical,Natural CellGrowth&Death NetworkTheory,Biochemistry
Physical,Natural BiologicalSignaling NetworkTheory,Biochemistry
Physical,Designed FlowofParts NetworkTheory,QueuingTheory
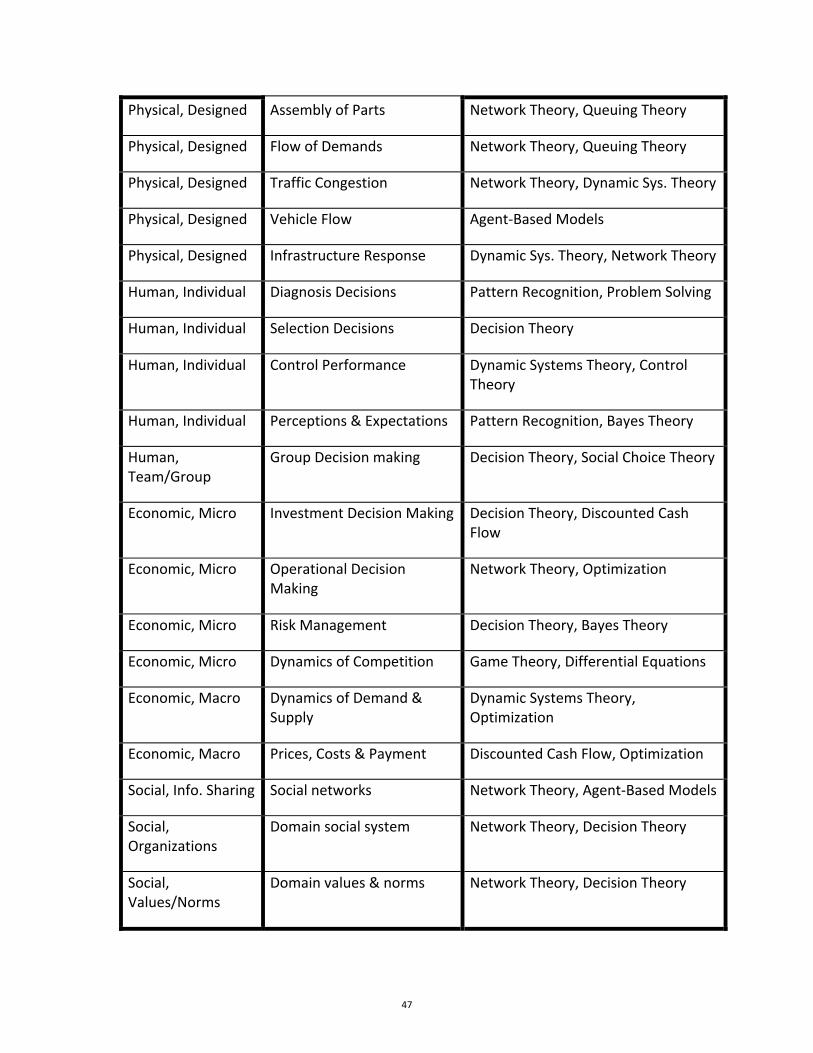
47
Physical,Designed AssemblyofParts NetworkTheory,QueuingTheory
Physical,Designed FlowofDemands NetworkTheory,QueuingTheory
Physical,Designed TrafficCongestion NetworkTheory,DynamicSys.Theory
Physical,Designed VehicleFlow Agent-BasedModels
Physical,Designed InfrastructureResponse DynamicSys.Theory,NetworkTheory
Human,Individual DiagnosisDecisions PatternRecognition,ProblemSolving
Human,Individual SelectionDecisions DecisionTheory
Human,Individual ControlPerformance DynamicSystemsTheory,ControlTheory
Human,Individual Perceptions&Expectations PatternRecognition,BayesTheory
Human,Team/Group
GroupDecisionmaking DecisionTheory,SocialChoiceTheory
Economic,Micro InvestmentDecisionMaking DecisionTheory,DiscountedCashFlow
Economic,Micro OperationalDecisionMaking
NetworkTheory,Optimization
Economic,Micro RiskManagement DecisionTheory,BayesTheory
Economic,Micro DynamicsofCompetition GameTheory,DifferentialEquations
Economic,Macro DynamicsofDemand&Supply
DynamicSystemsTheory,Optimization
Economic,Macro Prices,Costs&Payment DiscountedCashFlow,Optimization
Social,Info.Sharing Socialnetworks NetworkTheory,Agent-BasedModels
Social,Organizations
Domainsocialsystem NetworkTheory,DecisionTheory
Social,Values/Norms
Domainvalues&norms NetworkTheory,DecisionTheory

48
PARADIGMSANDSTANDARDPROBLEMS
Table 6 summarizes representative “standard problems” associated with the modelingparadigms.Iftheproblemofinterestcanberepresentedasastandardproblem,thenonecanpotentiallyadoptthestandardsolutiontothisproblem.Acentralconcernindecidingtodothisis the extent to which the standard assumptions associated with one of these solutions isacceptable.
Table6-ModelingParadigmsandStandardProblems
ModelingParadigm StandardProblems
DynamicSystemTheory ResponseTime&Stability
ControlTheory LQGOptimalControl
EstimationTheory KalmanFiltering
QueuingTheory (G/G/c):(FCFS/N/∞)
NetworkTheory SpanningTree,ShortestPath
DecisionTheory ROCModels,MAUT
ProblemSolvingTheory RecognitionPrimedDM
FinanceTheory DCF,CAPM,RealOptions
Table 7 lists representative software packages, equation solvers, and codes employed tocomputesolutionstothestandardproblemsinTable5.Thecommercialsoftwarepackagesandequationsolversareusuallyquitewell supportedandoftenhaveactiveusergroups thatcanhelpwithquestions.Aprimarydifficulty,however,istheextenttowhichtheoverallmodel,ofwhichthestandardproblemisjustonecomponent,canbeembodiedinthepackageorsolverthatprovidesthestandardsolutionofinterest.
Thisdifficulty is lessened ifonecanaccess legacycode,perhaps inC++, Java,orPython, thatcomputesthesolutiontothestandardproblemofinterest.Unfortunately,mostlegacycodeispoorly documented and supported, if at all. As a consequence, onemay be able to assuresyntacticcompatibility,butnotsemanticandpragmaticcompatibility.Inotherwords,youcangetthepiecestoexecutetogether,butyoureallyhavenoassurancethatthevariableflowisconsistentandthecomputedresultsaremeaningful.

49
REUSEOFSOLUTIONS
Thisleadstotheoverallissueofreusingsolutions.Theforegoingemphasizedtheuseandreuseofcomputationaland/orsolutionmethods,e.g.,forsystemdynamics,discreteevent,oragent-basedrepresentations.Theformalisms,computationalmethods,andtypicalvisualizationsarefairlywellunderstoodforthistypeofreuse,althoughnotwithoutchallenges.
Table7-ProblemsandSolutions
Problems Packages Solvers Code
ResponseTime&Stability
Stella,Vensim Matlab,Mathematica
C++,Java,Python
LQGOptimalControl
DIDO,GROPS-II Matlab,Mathematica
C++,Java,Python
KalmanFiltering R Matlab,Mathematica
C++,Java,Python
(G/G/c):(FCFS/N/∞) Simio,Arena,AnyLogic
C++,Java,Python
SpanningTree,ShortestPath
GraphTea C++,Java,Python
ROCModels,MAUT DMS,GRIP Excel C++,Java,Python
RecognitionPrimedDM
C++,Java,Python
DCF,CAPM,RealOptions
RealOptionsValuation
Excel C++,Java,Python
Anothertypeofreuseaddressesdomain/problemrepresentations.Goodexamplesaremilitaryoperations,supplychains,andhighwaytraffic.Someofthesetypesofsimulationsareavailablein, for example, AnyLogic and Vensim. People familiar with these software packages canusually readily “reverse engineer” legacy models to gain insights into assumptions andrepresentations.
Manyofthesetypesofsimulationsare legacysoftwarecodesthatweredevelopedyearsagoforparticularpurposes.Theoriginaldevelopersareoftenlonggone.Documentationisoftenlackingbecause reusewasnot anticipated –or budgeted. For those caseswhere reusewasanticipated,documentationisusuallymuchbetter,butthecodecantendtoberatheropaque.

50
Theapproach tomodel creationandassemblyoutlinedearlierhas the following implicationsforreuse:
• Paradigm:Reusableifparadigmmatchesphenomenaandquestionsofinterest• Representation:Reusableiftypicalassumptionsareacceptableforquestionsofinterest• Standard Problem: Reusable if typical assumptions are acceptable for questions of
interest• Software Package: Reusable if representation and assumptions can be instantiated in
package• Legacy Code: Reusable if variables of interest and key assumptions match problem
formulation• Principle: Variables and assumptions should be consistent and compatible across
componentmodels
Therearealsoimplicationsofreuse.Typicallytimeandmoneyaresavedifinconsistenciesandincompatibilities are minimal. Success stories include computational fluid mechanics,semiconductordesign,andsupplychainmanagement(Rouse,2015). Theseexamples involverepresentationsandsolutionapproachesthathavebeendeveloped,used,andrefinedbyactivecommunitiesofusers.
Formodelingendeavorsthatarecloserto“oneoff”projects,assumptionmanagementacrosslegacycomponentmodelscanbequitedifficult. Whentherearemanycomponentsoflegacycode, inconsistencies and incompatibilities can be difficult to identify and manage. Suchproblemscanleadto“model-induceddesignerrors.”
Rouse (2012) reportsonan interviewstudyofeightcompanies; twoeach in theautomobile,building systems, commercial aviation, and semiconductor industries. All intervieweeswerekeenly aware of the issues associated withmodel reuse. They reported great caution withregardtomodelreuseandtherisksofmodel-induceddesignerrors.
Their caution was also influenced by their intent to manufacture hundreds, thousands, ormillionsofunitsoftheirsystems,withthestarkunderstandingthattheircompanieswouldberesponsiblefortheconsequencesofanymodel-induceddesignerrors.Theywereunanimousintheimportanceoflearningfrompastmodelingefforts,butavoidedanyoff-the-shelfadoptionofpastmodels.
MATHEMATICALANALYSISOFPHENOMENA,REUSE,ANDCOMPOSITION
Inlightofthepreviousdiscussion,itshouldbefairlyobviousthateverymodelingeffortinvolvessomedegreeofreuse.Sowhenpractitionersandresearchersspeakofthechallengesofmodelcompositionandreuse,whatdotheymean?
Inthissectionwewillemployamathematicaltoolknownascommutativediagramstoexplorethenecessaryconditions foravalidmulti-modelunderdifferentcircumstances.Whatwewillfindisthatmostoftheemphasisonreuseandcompositionisnotintheareathatiscausingthe
51
problems.Theworkinontologyandconceptualinteroperabilityisontherighttrack,buttherearelikelyfundamentallimitations.
BASICSETUP
Beforeweconsidermodelreuse,weneedtoframethelanguageofthediscussion.Inordertodiscuss an arbitrary system of interest to us, we will leverage Rosen’s approach to viewingsystemsasdeveloped inthemonograph“FundamentalsofMeasurementandRepresentationofNaturalSystems.” (Rosen1978).Rosen’sconcernwashowwemeasureandmodelnaturalsystemsanditsassociatedimplicationsforphysicsandbiology.Hisapproachprovidesanaturalstartingpointforadiscussionofmodelingsystemsandmodelreuse.
First,wewillbrieflydescribeRosen’ssetup.Weframeitentirelyintermsofsettheoryasmostengineershaveaworkingknowledgeofsettheory,but it isextensibletocategorytheory. (Infact,Rosendoessoinhismonograph).Rosenframesthegeneralproblemasfollows:Wehaveasystemwith a set of states,!.However,wedonotdirectly interactwith the state space,!.Rather we measure observables such as position, temperature, voltage, and so on. Theseobservablesareessentially functions thatmap the state space,!, toanother set suchas therealnumbers.Agivensetofobservables,"generatesanequivalencerelation,#$,on!.
Let#$ = &, &′ :&, &+ ∈ ! ∧ ∀/0 ∈ "[/0 & = /0 &+ ] betheequivalencerelationinducedon!bythesetofobservables".Forexampleallstatesof! thathavethesametemperatureandpressurewouldbeviewedasequivalentforthatsetofobservables,temperatureandpressure.
The quotient set !/#$ is the reduced set of system states that result from the set ofobservables,".(i.e.,itisapartitionoftheset!.)Forexample,ifthesetofobservablesarethex and y coordinate in a Cartesian coordinate system, then the state space of the system isreducedtothexy-plane.
It is importanttonotethatthereducedstatespaceofthesystem,!/#$, isaconsequenceofwhichobservablesarecollected.Howwelookdetermineswhatwesee.Ofcourse,wedonotmeasure the observables directly. Rather,we use specially configured systems calledmetersthat are designed to dynamically interact with the system of interest and asymptoticallyapproach a valuewe take to be themeasurement of the observable. An examplewould beusingathermometertomeasuretemperature.
Whatwearegenerallyinterestedinarechangesinthestateofasystem.Wecancapturestatetransitionsin!throughanautomorphismon!.(i.e.,abijectivemappingfrom!ontoitself).Anexampleforafinitesetofstateswouldbeastatetransitionmatrix.
Let4beanautomorphismon!.If4iscompatiblewith#5then4inducesanautomorphismonthe reducedsetof states!/#$. Letuscall thisautomorphism4$.This isadescriptionof thestatetransitionsforstatesdefinedbythesetofobservables".Ifweintroducethecompositionoperator, we can generate a group of automorphisms from 4$ that can be used to definetrajectories inthestatespace.Forexample, ifwehaveadiscretestatetransitionmatrix, this

52
wouldbeequivalent to repeatedlyapplying thestate transitionmatrix to itself togenerateasequence of states that would result for each possible starting state. If we index resultingelementsofthegroupby6 ∈ ℤor6 ∈ ℝ,thenwecandescribechangesinsystemstateversustime.Wecallthisthesystem’sdynamics.
Of course,wedonotperceiveobservablesdirectly.Wemeasure themviameterswhich arespeciallyconfiguredsystemsthatinteractwiththesystemofinterestviatheobservables.Thesystemof interestandthemeter inducedynamicsoneachother.Themeter isconfiguredsothat its dynamics asymptotically approaches a value (typically a real number) thatweuse to“measure”theobservable.
Forexample,wedonotdirectlyperceivethetemperatureofaglassofwater.Weintroduceaspecially configured system called a thermometer that dynamically interactswith thewater.Thenetresultofthedynamicsoftheir interactionisatemperaturereadingonarealnumberscale.Thetemperaturereadingasymptoticallyapproachesthe“temperature”ofthewater.
Ifweare interested inmeasuring changes in the stateof the systemover time,weobtain adiagramliketheonebelow(Figure11).
Figure11–MeasuringaSystemoverTime(AdaptedfromRosen1978)
Afewcharacteristicstonote:If,asweassumedabove,4$ isabijection(onetooneandonto)then thedynamics isdeterministicandreversible.Ofcourse, thedynamics,4,on thesystemstates, !, does not have to be compatible with the reduced state space, !/#$. For manyrealisticproblems, itwillnotbe.Theresult isthat4$ willsplitequivalenceclassesof#$.Thishastheinterestingresultofenablingustodiscriminateamongmorestatesof!thenwecouldwith"alone,butitalsomakesthesystemappearstochasticand/orirreversible.
Forexample,if4$ isontobutnotone-to-one,thedynamicsisstochastic.If4$ isafunction,butnot onto, then the dynamics is irreversible. Repeated applications of 4$ generate a set oftrajectories.Ifweindexthesebyanintegerwehaveadiscretetimeviewofthesystemandifweindexthembyarealnumber,thenwehaveacontinuoustimeviewofthesystem.Finally,note that the reduced state set could be discrete or continuous or both depending on thespectrumof!inthefunctionsof".
NowweareinterestedmodelingthesystemdepictedinFigure11.Thismeansthatweneedtointroduceanothersetofstates,9,withacorrespondingsetofdynamics(orstatetransitions),:;.

53
Figure12–Necessaryconditionfor <,=< tobeamodelof >/?@, A@
If the diagram (Figure 12) commutes (i.e., startingwith any given element in the upper left,followingallpossiblepathswillleadtothesameelementintheterminalsetonthelowerright),9,:; couldbeviewedasamodel forthedynamicbehaviorofthesystemunderthesetofobservables".Note that 9,:; could representaphysicalanalog (e.g.,ascalemodelofanaircraftinawindtunnel)oramathematicalmodel(e.g.,acomputerprogramthatsimulatestheaerodynamicbehaviorofanaircraft). If thisdiagramcommutes, repeatedapplicationsof:;for a particular starting state yields thepredicted trajectory of the system through the statespace.
The readermaynote that if thedynamicsof the system is stochastic, (i.e.,4$, isnotone-to-one), thenthediagramwillnotcommute.Ofcourse, if thediagramdoesnotcommute, then9,:; isnotparticularlyusefulasamodel.Thisisaddressedinstochasticmodelsbymakingtheobservablesexhibitingstochasticbehaviorprobabilitydistributions.That istheobservableofinterestisconvertedfromapointvalueontherealnumberlinetoafunction.Thisrestoresofthecommutativityofthediagramandmakesthemodeldeterministicoverthisadjustedsetof observables. For example, if a weather model predicts temperature, we would want themodeltogeneratethesameprobabilitydistributionoftemperatureasisobservedintherealweather systemof interest. Another example is quantummechanics, the propagation of thewave function is completely deterministic. It is the specific point measurement that isprobabilistic(i.e.,collapsingthewavefunction).
Rosenspendsanentiremonographexploringtheimplicationsofthissetupforphysics,biology,andscienceingeneral.However,ourinteresthereisfarmoremodest.Aswewillsubsequentlysee,thissetupisalsoquiteusefulforconsideringthenatureofmodelcompositionandreuseforengineeringmodelsandsimulations.
DEFININGAMODEL
Asaterm,modelhasmanydifferentuses inmanydifferentcontexts.Consequently,wemustdefine what we mean by model in the context of this discussion acknowledging that thisdefinitionisnotuniversal.Inthediscussionthatfollows,wewilllimitthescopetomodelsthatweuseforpredictionasthatischieflythemotivationbehindthemodelcompositioneffortsinengineering.
In short, prediction is the ability to determine the state of a system of interest undercircumstancesnotexperienced(differenttime, location,context,etc.). Onewaywecoulddo
54
thisisifweknewallpossiblestatetransitionsforasystemofinterest.Intermsofthesetupwedevelopedintheprevioussection,wewouldwanttoknowthegroupofautomorphismsthatdescribethedynamicsofthesystem.Ifweknewthat,wecoulddeterminewhatthenextstatewouldbegiventhecurrentstate.Mathematically,wewouldknowthefunction:
!B!
Ofcourse,wehavetwoproblemshere.First,wedon’talwaysknowwhat!is,andweinteractwith it indirectlyviameters.Second,even ifweknewwhatSwas, foranynon-trivialsystem,determining all the state mappings is effectively impossible since we will not or cannotexperience all possible states &C!. So what are we left with? As discussed in the previoussection,wecanachieveareduceddescriptionofthestatespace!throughobservables.Sothenextbestthingisifwecouldidentifyanautomorphism(4$)overthereducedstatespaceforasetofobservables,",thatweareinterestedin.
!/#$BD !/#$
Sowe are trying to infer the dynamics of the reduced set of states of the systemby takingsuccessive readings with our meters. One way we might characterize the above diagramgenerically is asa setofphenomena. (e.g.,water flowing,heat flowing,objectsmovingetc.).Note that ourmost basicmeters areour five senses, but over timewehavebuilt additionalmeterstomeasure“new”phenomena.
Againweare facedwith theproblem thatpredicting the future stateofa systemof interestinvolves knowing all possible state transitions for the reduced state space, and for any non-trivial system this will be impossible. (As discussed above, we are also making a hugeassumption that a compatible 4$ exists. This is typically not true. Hence the probabilisticbehavior of most “real” systems. However, for many real world systems we can get closeenoughtobeuseful.)
One way we could address this problem is if we could find a relationship among theobservablesthatisinvariantoverthedynamics.Thisissometimesreferredtoasasymmetryorsimilarityrelationship.Asymmetryallowsustocompressthemappingbydroppingredundantrelationships.Theycanbereconstructedfromthesimilarityrelationshipwhenneeded.
Wecanuseasimilarityrelationshiptoconstructanequationofstateforasystem.Thus,wenolongerhaveto“know”everything.Ifwecanestablishtheequationofstate,wecaninstantiateitwithastateofinterestandextrapolatetheresultingtrajectorythroughthestatespace.
Symmetryrelationshipsarecriticaltothepracticeofscience.Weoftenrefertothesesymmetryrelationships as laws. E.g., Newton’s laws, Ohm’s law, Coulomb's law, and the laws ofthermodynamics. In fact,we could regard science as search for observables that allowus toconstruct symmetry relationships thatareuseful tous.Whenwecannotexplainphenomenathatareofinteresttous,wearehavingtroublefindingexploitablesymmetries.Bychangingor

55
introducing observables, we can sometimes find symmetry relationships and “explain”phenomena.
By selectively applying these symmetry relationships, we build a new system (physical ormathematical)thatcanserveasacompressedrepresentationofthetargetsystem’sbehavior.Wecallthisnewsystemamodelforthetargetsystem.Inotherwords,weusethesymmetryrelationships to reconstruct the target system’s dynamics on demand via the execution ofexperimentsforphysicalmodelsorcomputationformathematicalmodels.
INTERPRETATION
Nowinlightofourdiscussionontheintentofmodeling,letusrevisitournecessaryconditionformodeling(Figure12)andaddanotherlayerofinterpretation.Inparticular,wewillconsiderhowwecanfitthediscussionofphenomena,paradigms,representations,andsolutions.Asnotedabove,wecanregard
!/#$BD !/#$
as a phenomenon that we observe and we would like to model. (e.g., fluid flow, planetsorbiting, economic activity, etc.). The selection of observables in the set " is the chosenrepresentation of the system (e.g., flow rates, positions of point masses, prices and wages,etc.).Morepreciselytheselectedsetofobservablesconstituteofanabstractionofthesystem.
The question then becomes how do we build a model of a phenomenon given a chosenabstractionofthesystem?Weknowweneedtoexploitsymmetriesandthattheseareoftencaptured by scientific laws, but where do they come in here? For that we need one moreconcept,theconceptoflinkagerelationships.
Let us assume thatwehave twoobservables/(&) andG(&). Each generates an equivalencerelation,#5and#Hrespectively.Ifweapplybothatthesametime,weobtaintheequivalencerelation,#5H.Whatistherelationshipamongthesethreeequivalencesrelations?Ifeveryclassof#5intersectseveryclassof#H,andviceversa,thentheobservables/andGarecompletelyunlinked.Thatmeansthatknowingthevalueofoneobservableprovidesnoinformationonthevalue of the other. In other words, we describe the reduced state space of !/#5H as theCartesianproductofthereducedstatespacesgeneratedby/andG.(!/#5H → !/#5×!/#H)
Ontheotherhand,ifeveryclassof#5 intersectsexactlyoneclassof#H,andviceversa,thenthe observables / andG are completely linked. (This means that given any element s thatbelongstoanequivalenceclassof#5, itbelongstoexactlyoneequivalenceclassof#H) Thatmeans that knowing the value of one observable determines the value of the other. Thissubstantiallyreducesthepossiblestatespaceasnow!/#5H ⊂ !/#5×!/#H.Thisisasymmetryrelationshipthatallowsustocompressourrepresentationandperformprediction.Ofcourse,this concept is generalizable tomore than twoobservables.A real exampleof thiswouldbeOhm’slaw(L = M#)whichassumesacompletelinkageamongtheobservablesvoltage,current,

56
andresistanceinanelectricalcircuit.Knowingvaluesoftwooftheobservablesenablesustodeterminethethird.
Moregenerally,twoormoreobservablesmaybepartiallylinkedwhereknowledgeofthevalueof one observable provides incomplete information on the state of another. Perhapsmore,importantly, the strength of a linkage relation among observables may vary over differentsubsetsofthestatespace,!.Thistrueofmostifnotallofthescientificlawsobservedtodate.Thus,wemustalwayscircumscribewhenagivenlaworsymmetryrelationshipdoesanddoesnotapply.Thisinturnhasimplicationsfortheapplicationandreuseofmodels,whichwewilldiscussfurtherinsubsequentsections.
TheintroductionoflinkagerelationshipsallowsustocompleteourinterpretationofFigure12.Theset,9, istheencodingviathemappingNofasubsetofthestatespace !/#5O5O∈$ .Thisreduction isachievablebecauseofthe identified linkagerelationships (orsymmetries)amongthe variables. In the case of a mathematical model,9, captures the equation of state. Weshouldnotethatanyobservables intheoriginalset,", thatarecompletelyunlinkedwiththeobservables of interest are typically omitted.Mathematically, this is equivalent to replacingthesewithconstantobservables.Inthecasethatwealsorestrictthestatespace,!,suchthatitfalls entirely within a single equivalence class of each of the unlinked observables, theseobservablescanbeviewedasparametersofthemodel.
Inthecasethatasetofobservablesandassociatedassumedlinkagerelationshipsareawidelyacceptedexplanationforasetofphenomena,wemightview!/#$
P9asanapplicationofa
scientific paradigmor theory.Whenwe focus onmore specific systems,we can view it as amodelofthatsystemoraclassofsimilarsystems.
TheinterpretationofthefinalcomponentofFigure12,:;,dependsonwhether9isaphysicalanalogofthetargetsystemoramathematicalmodel.Ofcourse,itisintendedtoreproducearelevant subset of the dynamics,4, in the form of a state transition, but in the case of theformer,weinducesomephysicalanalogofthedynamics(e.g.,operatingawindtunnel).Inthecase,ofthelatter,:;takestheformofcomputation.Thus,when9isamathematicalmodel,:;isinterpretedastheapplicationofamodelingparadigmto9.
Forexample, letusassumethatallof theobservables (")of interestarecontinuousandthedynamics(4$)isindexedbyarealnumber(continuoustime),thenwewoulduseadifferentialequationbasedapproachtogeneratethemapping:;. (Notethatdifferentialequationbasedmodelswithanalytic solutionsstill requiresomecomputation, justa lot less). Ifotheron theother hand, the observables take discrete values and the dynamics is continuous time butstochastic,wemightemployadiscreteeventsimulation.
The leadsustotheconnectionwiththepreviousdiscussionsofphenomena,representations,andparadigms.Thephenomenaofinterestleadustoasubsetofscientificorrepresentationalparadigms.Thequestionsofinterestallowustofurtherrestrictthissubsetbyreducingthesetofobservablestoonlythosethatshare linkagerelationshipswiththosethatarenecessaryto

57
answer thequestionsof interest.Basedon characteristicsof the resulting setofobservablesand associated exhibited dynamics, we are led to certain modeling paradigms that fit withthosecharacteristics.Ofcourse,thisafairlyidealizedview,astherealprocessismoreiterative.For example, one may discretize continuous observables and dynamics to facilitatecomputational tractabilityat the costof losing theability todiscriminateamong somestates& ∈ !byenlargingtheequivalenceclasses.(i.e.,alossofaccuracy)
IMPLICATIONSFORMODELCOMPOSITION
Mostmodels of realworld systems are composites.Why? The scientific lawsweworkwith,whether Newton’s Laws or the law of one price, are only applicable under a specific set ofcircumstancesorassumptions.Forexample,Newton’slawofgravitationtellsofthestrengthofthe gravitational forcebetween twopointmasses.Whathappens ifwehavemore than twopointmasses?Thepresumption isthatwecanreducethesystemtopieceswherethe laworsymmetryrelationshipapplies,thenputthepiecesbacktogetheragaintothebehaviorofthewholesystem.(hence,reductionism)
Intermsofoursetup,thismeanswebreaktheobservablesupintogroupsandworkwiththegroups separately. Thisworkswhen the observables are completely unlinked. An example iswhenwecanbreakthedynamicsofamechanicalsystemupintotheQ,R,andScomponents,propagatethemseparatelyandthenputthembacktogetherandobtainthecorrectposition.Inthiscasethemodelistechnicallyacomposite,butthecompositionisfairlystraightforward.
Ofcourse,itiswellknownthatthisisnotgenerallythecase,whichiswhymostmodelingisalittlemore complicated than this. Tounderstandwhy, letus lookatwhathappenswhenwefractionateasystem.Asexplainedintheprevioussection,modelingasubsetoftheobservablesimpliesthattheomittedobservablesareconstant.Ifweleavetheminthemodel,theyfunctionasparameters.Iftheseomittedobservablesorparametersareunlinkedwiththoseretainedinthemodel,thenitisnotaproblem.
However,whenthedynamicsofasetofobservablesisnottotallyunlinked,thecompositionofthefractionalmodelsyieldsastatespacethatdoesnotcompletelycorrespondwiththestatespaceoftherealsystem.Mathematically,thestatespaceofthecomposedmodelwillbelargerthanthatoftherealsystem.Forexample,fortwosetsofobservables"andT,thestatespaceofthecomposedmodelisactually!/#$×!/#U ,ofwhich!/#$U isonlyasubset.(Rosen1978)Wehavenowaytoknowforsurewhichstatesofthisenlargedspacearerealandwhichareartifactsofthemodel.
Underthesecircumstances,weneedtobuildthelostlinkagerelationshipsbackintothemodel.Let’s consider a very simple example. Assume that we have a bank account that earnscompoundinterestcontinuously.Ifweassumethatinterestrateisfixed,wehaveaverysimpleequationfordeterminingtheaccruedvalueofthebankbalancewithtwoobservables:balance,Bandinterestrater
58
VWV6 = WX
W 6 = WYZ[\
The introduction of dynamics links the observables, but in this case, the interest rate is aparameter.Butasweknow, interestrateschangeovertime. Onewaywecoulddothis istocreateadynamicmodelX(6)andcomposethetwo.Thisresultsinthecomposition
VWV6 = WX(6)
Onecouldimaginemanyothervariationstoincreasetherealismofthemodelbyaddingbackinbroken linkage relationships (e.g., include withdrawals and deposits, make X(6) a stochasticprocess,etc.).However,forthisdiscussionweareinterestedinconsideringthecircumstancesunderwhichthiscompositionisacceptable.Ifyouwillrecallthediscussionoflinkage,wewerecarefultospecifythatcompletelinkagebetweenobservablesinvolveseachequivalenceofoneobservable intersecting the other and vice versa. It is also possible to have an observable flinkedtoanotherobservableg,butgisnotlinkedtof.Inthisexample,themodelassumesthatWisdynamicallylinkedtoX,butXisnotlinkedtoW.Inotherwords,weassumethatnomatterwhatamountofmoneywedeposit inourbankaccount, itwillhavenoeffectonthe interestrate.Thisisastandardassumptionforanindividualsmallinvestor,butwhathappenswhenthedepositor isa largegovernment,orwhat ifwescaleuptomodelalldeposits inthecountry?Thenthebalancewillhaveanimpactontheinterestrate.Inthiscase,theassumptionofaone-waylinkageisnolongervalid.
Thisexamplenaturallyleadsintoadiscussionofthestandardcasesofmodelcompositionandtheassociatedrequirements.
NECESSARYCONDITIONSFORMODELCOMPOSITION
IfwestartwiththeconditionthatthediagraminFigure12mustcommutefor 9,:; tobeamodel of the system !/#$, 4$ , then we can view model composition as decomposing!/#$, 4$ intopieces !/#UO, 4UO ,modelingpieces individually 90, :0 ,andthencomposingthose pieces to yield 9,:; while preserving the commutativity of the diagram. In otherwords,wemakethediagramincreasingmorecomplicatedasweaddstructuralrequirements.
To facilitate the discussion, let us define some notation. First, let us partition the set ofobservables" into]subsetsT0.Applyinganyonesetofobservablestothesystemyieldsthereducedstatespace!/#UO.Tocapturethedynamicsunderthissubsetofobservables,weneedtoprojectthedynamics4$ intothesubspace!/#UO.Wewillcallthisprojection,4UO.Thisresultsinthereduceddescriptionofthesystem !/#UO, 4UO .Ifwewanttomodelthesystem,weneedtobuildadiagramthatcommutesusingthemodel 90, :0 .

59
Figure13-SubsystemDiagram
Thechallengethenbecomes,canweassembleasetofdiagramslikethisoneandstillpreserve
commutativity over!/#$BD !/#$? Of course, this all depends on the nature of the linkage
relationshipsamongthesubsetsofobservables.Notethatwemakenoassumptionsaboutthenatureofthelinkagerelationshipswithinanygivensubsystem.Sinceweareinterestedinreuseandcomposition,weareconcernedwiththecasewherewealreadyhaveascientificparadigmormodel thataccounts for thebehaviorof!/#UO. Inotherwords, ifwetotally isolate!/#UO,thenwehaveamodelofitsbehavioralready 90, :0 .Thisisessentiallythewhatthescientificmethod does. But what happens if this subsystem is not totally isolated from othersubsystems?Wewillconsiderfourcasesthatdependonthenatureofthelinkagerelationshipsamongthesubsystems:
• Unlinked – there is no relationship among the subsets of observables of the varioussubsystems
• One-way dynamic linkage – Any combination of states among the subsystems isallowable,butthestateofoneofthesubsystemsaffectsthestatetransitionbehaviorofanother,butnotvice-versa
• Two-way dynamic linkage – Any combination of states among the subsystems isallowable,butthatcombinationaffectsthestatetransitionbehaviorofallsubsystems
• Two-way static linkage – Not all combinations of states among the subsystems isallowable.
Foreachofcases,wewillconsiderhowwewillhavetomodifythenecessaryconditionforamodel (Figure 12) to accommodate 9,:; resulting from the composition of multiple submodels.Forthesakeofillustrativesimplicity,wewillonlyconsidertwosubsetsofobservablesforeachcase,butitshouldbeobvioustothereaderhowtheycanbeextendedtomorethantwosubsets.Weshouldalsonotethatthesediagramsarenotintendedtoberepresentativeofhowonewouldactuallybuildthemodel.Rathertheyexpressthemathematicalconditionsthatmustbemetifonewantedtobuildamodel.
Unlinked Observables
The most straightforward case for model composition is the case where the subsets ofobservablesaretotallyunlinked.Thiseffectivelyallowsustomodeleachsubsetindependentlyandstillyieldcorrectanswer.Ifthisisthecasefortwosubsetsofobservables,thenthediagramshowinFigure14commutes.

60
Figure14–Necessaryconditionforacompositemodelforunlinkedobservables
Again,agoodexampleofthis iswhenwecandecomposethedynamicsofanobject intox,y,andzcomponents,propagatethemseparatelyandobtainthecorrectposition.Obviouslythisisthesimplestformofmodelcomposition.
One-way Dynamic Linkage
Now we will loosen the assumption that the observables are dynamically unlinked aandconsiderthecasewheresubsetT_isdynamicallylinkedtothesubsetT`butnottheotherwayaround.ThissituationrequiresthatthediagramshowninFigure15commutes.

61
Figure15–Necessaryconditionforacompositemodelwithonewaydynamiclinkage
At firstglance, itmightseemthat there isnogain fromdecompositionsincethewholestatespacegetsencodedinthemodelforT_.ThegaincomeswhenweobservethatwewereabletodecouplethedynamicpropagationofT`.Whatthisallowsustodoisgeneratethestatespacetrajectories for T` first, then compute the state space trajectories for T_, using theprecomputedtrajectoriesofT`asaninput.Inphysics-basedmodeling,thiscaseenableswhatiscalledserialmulti-scalemodeling.Anon-physicsbasedexamplewouldbethebankaccountbalance model described in the previous section where we could generate a time varyingtrajectoryof the interest rate thenuse that inourmodel of thebankbalance to generate atrajectoryofthebankbalanceovertime.
Two-way Dynamic Linkage
Nowwewill consider thecasewhereT` andT_ aremutuallydynamically linked.That is thecurrentstateofT`affects thedynamicsofT_,andvice-versa.ThisdiagramrequiresthatthediagramshowninFigure16commutes.

62
Figure16–Necessaryconditionforacompositemodelwithtwowaydynamiclinkage
Herethesituationisslightlymorecomplicated.Weneedtoknowthestatesofbothsubsetsinorder to know thedynamics.However, there is a still a computational advantage.What thissituationallowsus todo is tohaveseparatedynamicmodels foreachsubsetofobservables.Exampleswouldbeacellularautomatamodel thatallowsustoupdatethestateofeachcellsequentially,oramodeloftwobodiesunderNewtoniangravitationwherewecandeterminethepositionchangeforeachbody independently foran infinitesimallysmall time interval.Allelsebeingequal, this requiresmore computational coordination thanprevious case,but it isstilltractableinmanycircumstances.
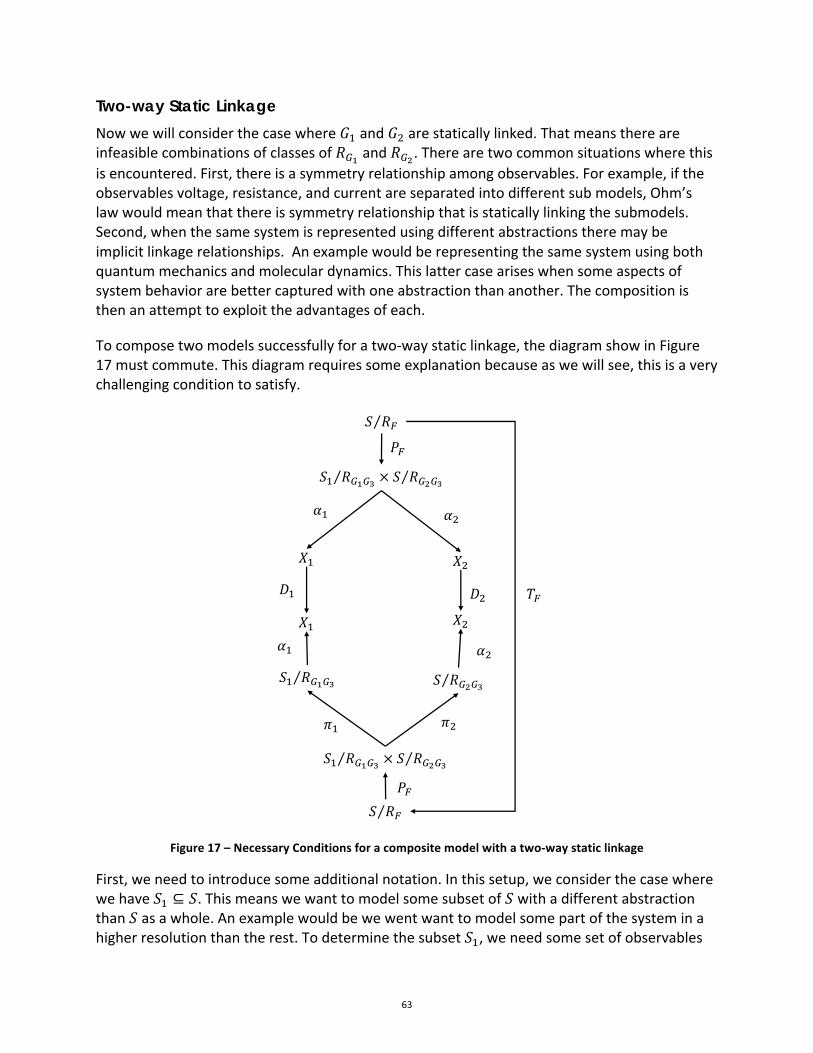
63
Two-way Static Linkage
NowwewillconsiderthecasewhereT`andT_arestaticallylinked.Thatmeansthereareinfeasiblecombinationsofclassesof#Ua and#Ub.Therearetwocommonsituationswherethisisencountered.First,thereisasymmetryrelationshipamongobservables.Forexample,iftheobservablesvoltage,resistance,andcurrentareseparatedintodifferentsubmodels,Ohm’slawwouldmeanthatthereissymmetryrelationshipthatisstaticallylinkingthesubmodels.Second,whenthesamesystemisrepresentedusingdifferentabstractionstheremaybeimplicitlinkagerelationships.Anexamplewouldberepresentingthesamesystemusingbothquantummechanicsandmoleculardynamics.Thislattercaseariseswhensomeaspectsofsystembehaviorarebettercapturedwithoneabstractionthananother.Thecompositionisthenanattempttoexploittheadvantagesofeach.
Tocomposetwomodelssuccessfullyforatwo-waystaticlinkage,thediagramshowinFigure17mustcommute.Thisdiagramrequiressomeexplanationbecauseaswewillsee,thisisaverychallengingconditiontosatisfy.
Figure17–NecessaryConditionsforacompositemodelwithatwo-waystaticlinkage
First,weneedtointroducesomeadditionalnotation.Inthissetup,weconsiderthecasewherewehave!` ⊆ !.Thismeanswewanttomodelsomesubsetof!withadifferentabstractionthan!asawhole.Anexamplewouldbewewentwanttomodelsomepartofthesysteminahigherresolutionthantherest.Todeterminethesubset!`,weneedsomesetofobservables

64
todefineit.Wewillcallthissubset,Td.AtypicalexampleofthissetwouldbetheCartesiancoordinates.Ifweweremodelingthebehaviorablockofmaterial,wemightmodelthewholeblockusingtheabstractionT_,butalsomodelapieceoftheblockusingabstractionT`.Sincewearetryingtomodeleachabstractionseparately,whatwearereallymodelingoverisathestatespace!` #UaUe× ! #UbUe.(NotethatTdisleftinasareminderthatitisthedeterminantof!`.Thisisaverydifferentspacethantheoriginal!/#$.Weintroducethemappingf$ togetusfrom!/#$ to!` #UaUe× ! #UbUe.Notethatf$ involvesasubstantiallossofinformation.If9`, :` and 9_, :_ arestandardrepresentationsfortheabstractionsT`andT_inisolation,thenthelinkageinformationiscompletelylost.Thus,onlywaythisdiagramcouldcommuteiseither1.Ifthereisnolinkagerelationship,whichviolatesourstartingassumption,or2.Ifwesomehowbuildthelinkagerelationshipsbackintothemodels 9`, :` and 9_, :d .Thiswouldmeanthatwewouldlikelyneedsomeorallofthestateinformationfromtheotherabstractionineachmodelaswellasknowledgeofthelinkagerelationships.Inotherwordswehavetoputthelostinformationbackinsomehow.Inthemostgeneralcase,thismeansthathavetobuildanewmodelthataccommodatesalloftheobservablesandlinkages.Thismeansweloseanycomputationalgainwemayhavegottenfrombreakingtherepresentationintosubmodels.Toputitanotherway,thiswouldbeanalogoustobreakingupOhm’slawintoseparatemodelsforVandIR.PropagatingthemseparatelyislikelytoviolatetherequiredrelationL = M#.SoweareforcedtoincludeOhm’slawineachmodelaswellastheomittedstates.Theresultisthatweendupbuildingthesamemodeltwice.Thereisreallynogainfromdecomposition.Therearesomecaseswherewecancomposemultiplemodelswithastaticlinkageamongobservablesets,buttheyrequiresomemodificationstothisgeneralcase.ThefirstiswhenthereisarefinementrelationshipbetweenT`andT_.IfT`refinesT_theneachequivalenceclassofT`intersectsexactlyoneequivalenceclassofT_,butanygivenequivalenceclassofT_mayintersectmorethanoneclassofT`.ThisisanaggregationrelationshipbetweenT`andT_whichisequivalenttoaone-waystaticlinkage.Sothetwoabstractionsarecompatible,andthelinkagerelationshipisknown,butT`allowsustoresolvemoresystemstatesthatT_.Thus,wecouldviewitisahigherresolutionmodel.Underthesecircumstances,wecanrunthemodel9`, :` first,thenuseittoparameterize 9_, :_ ,whichwerunsecond.Thisillustratescaseofmulti-fidelitymodelingwhereweconductlimitednumberofrunsofthehighfidelitymodeltocalibratealowerfidelitymodelthatweusedtoexplorealargerspace.Thesecondcasewherewecancomposemultiplemodelswithstaticlinkagesamongthemisexplainedbyparallelmulti-scalephysics-basedmodeling.TheexampledescribedbyWinsberg(2010)isonesuchinstance.ThisexampleisdiscussedingreaterdetailinSection6,buttosummarizebrieflyhere,itinvolvesthemodelingofcrackpropagationusingthesimultaneousapplicationthreedifferentabstractions:continuummechanics,moleculardynamics,andquantummechanics.Thereasonisthatdifferentaspectsofcrackpropagationarebestrepresentusingdifferentabstractions.However,unlikethepreviouscase,thereisatwo-waylinkage.Thismeansthattheabstractionseachaffecteachother.

65
Tomakethiswork,weneedtomodifyFigure17.Wedothisbydividingthestatespace!intomultiplesubsets,!`and!_byemployingthesubsetofobservablesTd.Againaspatialdivisionisagoodexample,butnotstrictlyrequired.TheideaisapplyabstractionT`to!`andabstractionT_to!_.Nowiftherewereabsolutelynooverlapbetween!`and!_thenthiswouldimplythatwecouldaccuratelymodelthesystemwithnointeractionamongthesubsets.Thisdevolvestotheunlinkedcaseandviolatestheassumptionthattheregionsaffecteachother.Consequently,theremustbeatleastsomeoverlapamongthetwosubsets,butwewouldliketokeepittoaminimum.Forinstance,itmightonlybeasharedboundary.Mathematically,!` ∪ !_ = !but!` ∩ !_ ≠ ∅.However,theoverlapintroducesaproblem.Wearenowtryingtorepresentasubsetofthespaceusingtwodifferentabstractions.ThiswouldseemtoputusinthesamesituationasFigure17.AsWinsbergnotes,thisishandledbyintroducingfictions.Inoursetup,thesewouldbeobservablesthatweinventbutcannotreallymeasure.AnexampleprovidedbyWinsbergistheintroductionoffictitious“Silogen”atomsontheboundarybetweentheregionmodeledusingmoleculardynamicsandtheregionmodeledusingquantummechanics.ThereisnosuchthingasaSilogenatom,butitservestolinkthetwodifferentabstractionsbycapturingtheeffecteachhasontheother.Inshort,wegetamoreaccuratemodelofthewholesystematthepriceoflostinformationaboutoverlapregion.Aslongaswekeeptheoverlapregionsmall,thiscanbeacceptablepricetopay.Whenweintroducethe“fictions”9dand9ktooursetup,wegetthediagraminFigure18.Ifthisdiagramcommutes,wecanuseaparallelmulti-scalemodel(orsomethinganalogous)tocapturethebehaviorofthesystem.

66
Figure18–Necessaryconditionforacompositemodelwithatwo-waystaticlinkagewithminimaloverlap
A few things to note. First, we still lose the linkage information among the two groups ofobservables when we instantiate the two fractionated models. The fictions, 9d and 9k areintroducedtocompensate,butthismeansthattheyneedtobedeterminedempiricallythroughtrialanderror.ThisisconsistentwithWinsberg’sobservations.Sothewaythiswouldtypicallybe employed is that the structure of the fiction is determined empirically, and then theparticularvalueisdeterminedbyacombinationofthestatesofeachoftheabstractions.Theimportant observation to make here is that if 9`, :` and 9_, :_ are two off the shelfrepresentationswe cannot compose them “on the fly” in the event that there is a two-waystaticlinkage.Rathersomeworkisnecessarytocreatetheproperlycalibratedfictions.
IMPLICATIONS
Whatwecandrawfromthisanalysis,isthatmulti-modelingisnotsostraightforwardasitissometimesportrayed.Inmanycases,itisnotasimplematteroflinkingupinputsandoutputs.Ifweconsiderwheremuchofemphasisforfederatingmodelshasgone(e.g.,DMMF,HLA,SPLASH,etc.),thefocusisoncoordinatingthecomputationalaspects.Thatisthe:0′&inourdiagrams.Whenwearerunningtwoormoremodelsinparallelwewouldneedthemtobesynchedintermsoftimestepsandobservablescales.(Otherwisethediagramwon’tcommute.)

67
Whenmodelsaredrawnfromofftheshelf,thereisnoguaranteethatthisisthecase.Thus,therehasbeenagreatdealofworkputintoachievingthissynchronization.However,whattheseframeworksimplicitlyassumeisthattheyareoperatingtheinthecaseoftwo-waydynamiclinkageinoursetup.Thatistherearenostaticlinkagesamongtheobservablesubsetsallocatedouttothedifferentmodels.Thisisaprettybigassumption,particularlywhenmodelsaredrawnfromofftheshelf.Itisnotclearjustwhatassumptionsweremadeduringtheirdevelopment.Iftherearestaticlinkagesamongtherepresentedobservablesubsetsintherealworld,thenacomposedmodelthatignoresthesemayverywellproduceincorrectresults.Forcomplicatedorcomplexsystems,therequiredlevelofdecompositionamongobservablesisunlikely,particularlywhenthesimulationisintentionallytryingtorepresentthesamesystematdifferentlevelsabstractionaswasthecaseforDMMF.Inthatcase,thestaticlinkagesareintrinsic.Eveninthecasewhereeachmodelrepresentsadifferent“subsystem”thereislikelysomeoverlapamongthemodelsbecauseeachmodelwillneedtoconsideritsenvironmentorbounds.Whenmultiplemodelseachattempttorepresentthesameenvironmentorboundsdifferently,thereisastatictwo-waylinkage.Aswesawinthefinalcase,itispossibletomanagethis,butitrequiresempiricalinvestigationandcalibrationtogetittowork.Thatisitcannotbeaccomplished“onthefly”Thus,weseethereasonswhyframeworkssuchasHLAhaverunintotrouble.Unlessthestaticlinkagesamongthemodelsarewellunderstood,thesimulationwillnotproduceaccurateresults.Syncingscales,timesanddataexchangeisnotenough.Thisalsoexplainswhymulti-modelingeffortsseemtorequirehumansubjectmatterexpertsintheloop.Sowhilecomputationalcoordinationisimportant,successfulmulti-modelingrequiresanunderstandingofhowthesimulatedentitiesactuallyrelatetoeachotherintherealworld.Thus,thosewhohavebeenworkingonreferentialontologiestosupportmodelingandsimulationseemtobemovingintherightdirection.Whiletheseontologieswillnotmakethemulti-modelingprocessautomatic,theywillcertainlyfacilitateeffortstobuildmulti-models.Inparticular,effortstocapturemulti-scaleormulti-abstractionontologieswouldbeparticularlyuseful.
CONCLUSIONS
Giventheaboveanalysis,whatareimplicationsfortheenterprisemodelingmethodology?Inthegeneralsense,buildingamulti-modelwithdifferentlayersofabstractionispossible,butitrequiressomework.Also,certainassumptionsmustbesatisfiedandoverlapamongthelayersshouldbeminimized.Moreimportantly,theinterconnectionsamongthelayersrequire“fictions”thatcanonlybedeterminedempiricallythroughtrialanderror.Itisthislatteraspectthatisthemostproblematicformodelingenterprisesystems.
68
Forapurephysicalsystem,thecircumstancesmaybestableenoughthatonecanconductexperimentsandcollectenoughdataanddetermineavalidimplementationofthe“fictions”tohandletheoverlapsamongthelayers.However,foranenterprisesystem,thisischallengingfortworeasons.First,isoftendifficultorimpossibletoruncontrolledexperimentsonenterprises.Second,enterprisesareconstantlyevolving.Soevenifonecouldconductexperimentsonanenterprise,itislikechasingamovingtarget.Sincethefictionsaren’t“real,”therightfictionmayverywellchangeastheenterpriseevolves.Thischangestheroleofmulti-modelingforenterprisesystemsversuswhenitisappliedtophysicalsystems.Wecanexperimentwithdifferenthypothesizedlinkagerelationshipstoestablishthepossibilityofrelevantbehaviors,butwecannotbecertainthattheyarereal.TheimplicationsofthissituationareexploredingreaterdepthinSection6.5. REVIEWOFCOMPLEXITYLITERATUREONWARNINGSIGNALS
Asdiscussedpreviously,nomodeliscapableofforecastingallpossiblescenarios.Consequently,somechangesinenterprisebehaviorwillbeasurprise.Someresearchershaveinvestigatedthepossibility that there are early warning signals of such “surprises” in biological and financialsystems.Inthissection,wecriticallyreviewtheliteratureonthistopicandconsiderwhetherornot these techniques can be used tomitigate the impact of a surprise change in enterprisebehavior.Much of the work in this area is based on the notion that surprises are bifurcations in thesystem of interest’s dynamic behavior. Consequently, researchers have leveraged work indynamical systems theoryandcomplexity science to identifywarningsignals thatoneshouldexpect to see prior to the actual bifurcation. To operationalize this concept, they proposestatisticalmeasures and experiments that should enable detection of thesewarning signals.Thehopeisthatthatthesesignalsaregenericinthesensethattheyshouldbepresentinanytype of complex systemwhether physical, ecological, or social. In this sectionwewill brieflyreviewtheliteraturewithregardtoseveralproposedstatisticaltechniques.
RANDOMVARIABLEMOMENTS-SKEWNESS,KURTOSIS
Themostgeneralof thewarning signalmeasures is theanalysisofhigherordermomentsofrandomvariables. Whilethefirsttwomomentsofthevariable(meanandvariance)areusedfor model estimation, the third and fourth moments, skewness and kurtosis respectfully,capturemore complexmeasureswithin the variables. It is then inferred that these capturemorecomplexdynamicsandthusdrivecriticaltransitions.
!6l]VlXVmnoZ]6 = pqrq , pqs&t6ℎonoZ]6lvnw66ℎZoZl]
t = 1 ∥ z{|{= 0 t = 2 ∥ z{
|{= LlXsl]�Z

69
t = 3 ∥ z{|{= !tZÅ]Z&& t = 4 ∥ z{
|{= ÉwX6n&s&
Whilethesemeasuresareeasytouse,theyarelimitedbytheirgranularity.Consequently,theirroleisoftenmoreofastartingpointforanalysisthanacompletesolution.
METRICBASEDCORRELATION–AUTO-CORRELATION,PEARSONCORRELATION
Movingfromasinglerandomvariabletothecomparisonofmultiplerandomvariables,wenextconsidercorrelationmetrics.Therationalebehindtheuseofcorrelationmetricsisthatcomplexsystems exhibit various forms of correlated behaviors when in a critical state prior to abifurcation.Differenttransformationsanalyzechangesincorrelationprofileswhichcorrespondtopotentialnon-lineareffectsdrivingthesystem.Theseareexploratorymeasuresthatanalyzecorrelationprofiles,andtwocommonmethodsaredescribedbelow.
Autocorrelationlooksatthecorrelationprofileamongvariablesovertimeperiods.Thisisdonebyanalyzingsinglecorrelationcoefficients(usuallythefirstcoefficient)fromaparticularmodel.Otherhigherfidelitymeasuresareavailablebutrequireprocessmodelassumptions(Scheffer,etal.2009).
Ñ` =Ö[S(6 − p)(S 6 + 1 − p)]
r(S)_ , Ñ` = "sX&6ànXXZâl6sn]ànZ//s�sZ]6
ThePearsoncorrelationcoefficientisdefinedastheratioofthecovarianceofthevariablestotheproductofthestandarddeviationsofthevariables.Inthecontextofcomplexsystems,itisusedtoshowgroupingbehavioramongstfunctionalelements.
Ñä,ã = ànå(Q, R)rärã
, Ñä,ãs&fZlX&n]ànZXXZâl6sn]ànZ//s�sZ]6
Thismetric has been shown to have a strong relationship to geometric changes (Kéfi, et al.2014),butitrequiresdataonmodelvectorsforconvergence.Itmaybeusefulfordetermininggeometricchangesindynamicsonnetwork.ForexampleChen,etal.(2011)usethismetricasanearlywarningsignalforabruptdeteriorationduringtheprogressionofacomplexdisease.
STATESPACEESTIMATORANALYSIS–AR(P)MODELMETRICS
Assumingthatthereisanacceptedstatespacemodel(s)ofasystem,onewouldliketoknowifthere is a change in model factor significance. Such changes may be a signal of non-lineardynamics.Thefactormodel(anditsassumptions)candeterminetheparticulartransformationsandmetrics(Ives&Dakos2012,Bartholomewetal.2011). However,asthesystemchanges,therelativefactoreigenvalueswillbegintodeviate.Metricsthattracechangesineigenvaluescanserveasameansfortransitionidentification.Theeigenvaluebehaviorscanindicatelossofindependence,changes instability, flickeringamongstates,etc. Ecosystemmodelsoftenuseauto-regressive models which vary over different time periods [AR(p)], and have found
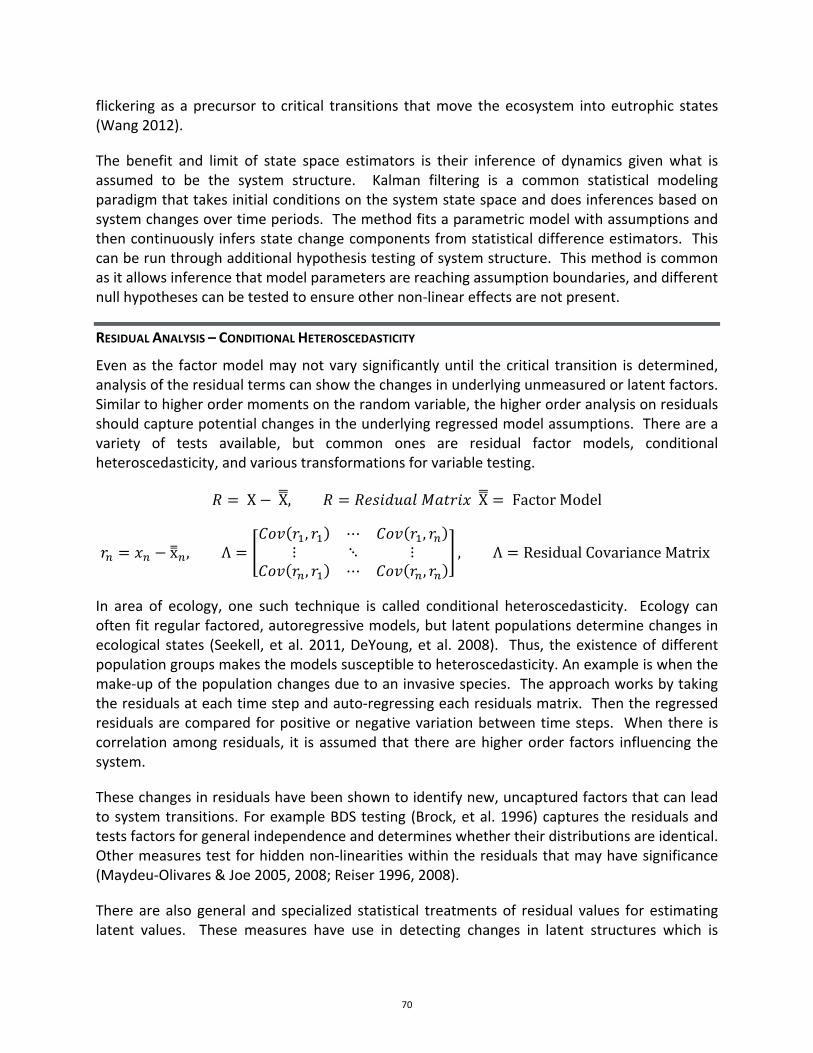
70
flickering as aprecursor to critical transitions thatmove theecosystem intoeutrophic states(Wang2012).
The benefit and limit of state space estimators is their inference of dynamics givenwhat isassumed to be the system structure. Kalman filtering is a common statistical modelingparadigmthattakesinitialconditionsonthesystemstatespaceanddoesinferencesbasedonsystemchangesovertimeperiods.Themethodfitsaparametricmodelwithassumptionsandthencontinuouslyinfersstatechangecomponentsfromstatisticaldifferenceestimators. Thiscanberunthroughadditionalhypothesistestingofsystemstructure.Thismethodiscommonasitallowsinferencethatmodelparametersarereachingassumptionboundaries,anddifferentnullhypothesescanbetestedtoensureothernon-lineareffectsarenotpresent.
RESIDUALANALYSIS–CONDITIONALHETEROSCEDASTICITY
Evenas the factormodelmaynotvarysignificantlyuntil thecritical transition isdetermined,analysisoftheresidualtermscanshowthechangesinunderlyingunmeasuredorlatentfactors.Similartohigherordermomentsontherandomvariable,thehigherorderanalysisonresidualsshouldcapturepotentialchangesintheunderlyingregressedmodelassumptions.Thereareavariety of tests available, but common ones are residual factor models, conditionalheteroscedasticity,andvarioustransformationsforvariabletesting.
# = X −X, # = #Z&sVwlâml6XsQX = FactorModel
Xò = Qò − xò, Λ =ànå X̀ , X̀ ⋯ ànå X̀ , Xò
⋮ ⋱ ⋮ànå Xò, X̀ ⋯ ànå Xò, Xò
, Λ = ResidualCovarianceMatrix
In area of ecology, one such technique is called conditional heteroscedasticity. Ecology canoftenfitregularfactored,autoregressivemodels,butlatentpopulationsdeterminechangesinecological states (Seekell,etal.2011,DeYoung,etal.2008). Thus, theexistenceofdifferentpopulationgroupsmakesthemodelssusceptibletoheteroscedasticity.Anexampleiswhenthemake-upofthepopulationchangesduetoaninvasivespecies.Theapproachworksbytakingtheresidualsateachtimestepandauto-regressingeachresidualsmatrix.Thentheregressedresidualsarecomparedforpositiveornegativevariationbetweentimesteps. Whenthere iscorrelationamong residuals, it isassumed that therearehigherorder factors influencing thesystem.
Thesechangesinresidualshavebeenshowntoidentifynew,uncapturedfactorsthatcanleadtosystemtransitions.ForexampleBDStesting(Brock,etal.1996)capturestheresidualsandtestsfactorsforgeneralindependenceanddetermineswhethertheirdistributionsareidentical.Othermeasurestestforhiddennon-linearitieswithintheresidualsthatmayhavesignificance(Maydeu-Olivares&Joe2005,2008;Reiser1996,2008).
There are also general and specialized statistical treatmentsof residual values for estimatinglatent values. These measures have use in detecting changes in latent structures which is

71
thoughttopresentthemselves incriticaltransitionswithinsocialsystems(Vallacher&Nowak1997,Geels2005).
GLOBALSTOCHASTICMEASURES-GRANGERCAUSALITY
AnothercommonapproachtoidentifyingcriticalphenomenaisGrangercausality.Thismeasureisbasedoninformationtheoryandthevariationininformationalentropy.ShannonandRenyientropywhichidentifytheconditionalmutualinformationshownbelowareoftenused.Theidea is that information conditionality corresponds to causality as defined within thisframework. This allows one to infer potential future behavioral from system signals(Bossomaier,etal.2013).
• 9 ≡ − ß(Q) log_ ß(Q)ä
M 9: © ≡ • 9 + • © − • 9, © = ß(Q, R) log_ß(Q, R)ß Q ß(R)
ä,ã
Information rates known as Kolmogorov-Sinai entropy can be computed within dynamicalsystems.Whatcanthenbeshownisthatforstationarystochasticprocesses,eachprocesshasa bijection to a “measure-preserving dynamical system” (Hlavackova-Schindler, et al. 2007).This allows a system to be sub-divided into separate stochastic processes. Through entropymeasures,onecantracethechangeconditionalityamongthem.Anydecomposablestochasticsystem canbe analyzed in this framework. Themeasure thenbecomesuseful in identifyingtransition pathways for the system, but then limits its detection of smaller scale changes astheseareassumedtobestochastic.
"™→; ≡ M 9\: ©\´`, ©\´_, … 9\´`, 9\´_, … ), "™→; =12≠ /™→; Æ VÆ
Ø
´Ø
9\ = ∞`9\´` + ∞_9\´_ + ⋯+ W`©\´` + W_©\´_ + ⋯+ ±\
TherearemultipleapplicationsforpartialGrangersystems(Guo,etal.2008).Hysteresiseffectscanbeestimatedbyanalyzingtheinformationmutualtoelementsthroughdataanalysismeanssuch as k-nearest neighbors (Kraskov, et al. 2004). Granger causality has been shown inmultiple instanceswheremeasured change inmutual information corresponds to impendingchanges within the system. This has thus been used as a critical transition metric withinmultiplecontextssuchassocio-economicsystems(Bossomaier,etal.2013), financialsystems(Barnett&Bossomaier2012),andneurology(Guo,etal.2008).
Sincediscretizedvariablesandspectraldecompositionareneededforconvergence,therearedifferentvariationsbasedon:thechoiceofvariableselements[multivariateGranger],thetypeofrelationships[linearvspartialGranger],andthepotentialchangesin latencyandordinality[conditionalGranger]. For this reason, thereareunderlyingstructuraldecisionsmadebeforerunning Granger typemeasures about the nature of stochastic variables (Bossomaier, et al.
72
2013) and about the informationmodel within the computational estimator (Kraskov, et al.2004).
ALTERNATEEXPLORATORYSTATISTICALMEASURES
TransferentropymeasuresareusedinconjunctionwithGrangercausalityandotherstochasticmeasures. The levelofmutual informationcanbeanalyzed itselfasameans forexploratoryanalysisofhysteresiseffects(Schreiber2000).ShannonandRenyientropyarecommonlyusedforthis.
Dimensional analysis is also used as a means to identify major latent changes in systemfunction. This has been applied in the financial domain to identify periods that violate theefficientmarkethypothesis. There is anexampleofusinga log-periodicmeasure to identifyhigherorderfluctuations(Yan,etal.2010)anddiscretescaleinvariance(Sornette1998).Thisisthought to show periods where second order dynamics (traders trading on trade decisionsratherthaninformation)occur.Thisaddsdimensionstomarketinformation.Theclaimisthatthesefindingspresageperiodsofmarketvolatilityandsubsequentcrashes. It isthoughtthatidentifying periodswheremarkets become heteroskedastic can identify critical transitions inthemarket.
PERTURBATIONEXPERIMENTS
As a system approaches a critical transition, the strength of the current attractor begins toweaken. Consequently, onewould expect a loss of responsiveness to disruptions. This is therationale behind perturbation experiments. The idea is that one intentionally perturbs thesystemandthenobservestheresult.Ifthesystemisnearabifurcationpoint,theresponsetotheperturbationshoulddisplayunique,complexphenomena.Thetimeseriesoftheresponseisanalyzedtolookforacriticalslowingdownbehavior. Theideaofintentionalperturbationsalsopresentsasapotentialmanagementpracticetoincreasesystemresilience(Walters1997,Wilson2002).
LIMITATIONS
Whiletheideaofusingwarningsignalstopredictanimpendingshiftinsystembehaviorhasanintuitiveappeal,therearesomepracticallimitations.
First,asystemapproachingaphasetransitionisexpectedtoshowmorecomplexbehavior.Themost obvious condition is that the systemdeviates frommodel predictions. This results in atrade-off between modeling and warning signal usage. The significance and reliability of awarningsignaldependonatradeoffsbetweenminimizingmodelontology,andhavingenoughnoisereductiontogivesignificantorconvergentresults(Ditlevsen&Johnsen2010,Perretti&Munch2012).
Second,withintheareaofstatisticalmeasures,thecentraldifficultiesencounteredwerethosearound inference. Most notably asmetrics seek to trace underlying structure that produceobservedstatisticalprofilestheBertrandParadoxpresentsitself.Oneexampleisanattemptto
73
identify epilepsy through neural signal processing. There is a study trying to identity thebifurcation within neural models that leads to seizures that can be seen using state spaceestimators (Rodrigues, et al. 2010). Yet the samedeviation seenby the estimator precededbenignneuralspikes,andthestatespacemodelhadtobeexpandedtofinddifferingprofilesfor these “false bifurcations”. This open inference problemmakes determining singular rootcauses to particular bifurcations difficult. This means for instance that although a criticalslowingdownmaybeobservedthisdoesnotguaranteeafoldbifurcationasitispossiblethatanother underlying system structure can produce this same dynamic. Although there iscontention in the area, there is still nomethod for resolving it other thanmixing structuralinformation.Inshorttheexistenceofawarningsignalisnotasufficientcondition.
Third, complexity can be driven by latent factors. This creates difficulty in responding to awarningsignal.Forexample,withinvasivespecies,metricscanidentifythesystemirregularitybut not identify the new species; it usually takesmatchingwith existing observations of theecosystem (Wang2012). Aparticularly challenging setof latent factors that are relevant forenterprise systems those associated with human behavior such as beliefs and culture thatsignificantly drive behavior. This presents additional challenges to responding to phasetransitions in enterprises as driving factors not only may be unidentified factors but alsohumansinventedfactors.
Fourth,warningsignalsareimpactedbyboundarydecisions.Dependingonhowtheboundaryis set, critical behaviors may be driven by exogenous rather than endogenous factors. Thismeans that the warning signals could bemissed and the transition perceived as exogenousshock. For instance, a primary goal of analyzing warning signals for market crashes isdetermining which of the market movements can be attributed to external shocks versusinternalmarketforcesthoughttobepartofthenaturalbusinesscycle(Fry2012).
CONCLUSIONS
Whiletheideastatisticalwarningsignalsofimpendingsystembehavioralorstructuralshiftsisappealing, it isnotclearfromtheliteraturethatthesecouldbeeffectivelyappliedtosupportdecisionmakingwithregardtoenterprisesystems.Moreresearchisrequired.
Therearenatural limits to informationthatcanbegatheredapriori. Parameterizedwarningsignals depend on known model structure or defined assumptions. Non-parameterizedapproachesaremoreflexiblebutarelesssensitive.Perhapsthebiggestissueisthatonehastoknowwheretolook.Whichmetricsshouldonebelookingattospotawarningsignal?Thismaybeeasytodetermineafterthefact,butnotsoeasybeforetheevent.Thisisespeciallytrueforsystems that can be viewed using many different abstractions such as enterprise systems.Whichabstractionshouldonebelookingat?
Inshort,statisticalwarningsignalsmaybeusefulforcaseswherewedon’thaveawell-definedcausalmechanismtoexplainthebifurcationpoint,butwehaveexperiencedtheeventandthewarning signal before enough times before to have some confidence. Of course, given theadaptivenatureofhumanbeings,eventhosecasescouldbeoflittlepredictivevalue.

74
6. IMPLICATIONSFORENTERPRISEMODELINGANDTHESTRATEGYFRAMEWORK
The previous sections of this report detailed efforts to evaluate different aspects of theenterprisemodelingmethodology via counterfeit parts case study, thebehavioral economicscasestudy,andareviewofthecomplexityliterature.Asaconsequenceoftheseefforts,itwasrecognizedthatthedevelopmentofenterprisemodelsandsubsequentstrategydecisionsaredrivenbythetypeofuncertaintythatadecisionmakerfaces.Inparticular,wedeterminedthatepistemicuncertaintyistypeofinterest,andmulti-modelingisameanstoexplorecertainsub-typesofepistemicuncertainty.
Thisrecognitionresultedinanexpandedtaxonomyofuncertaintythatinformsbothenterprisemodeling efforts and the resulting enterprise strategy. In this section, we will consider theliterature onmanaging uncertainty for multi-models, assess the limitations of the proposedmethodswithregardtoenterprisesystems,andfinallyconsidertheimplicationsforenterprisemodelingandthestrategyframeworkdevelopedduringRT-110.
BACKGROUND
Ithaslongbeenrecognizedwithinthesystemscommunitythattofullycapturemanyrealworldsystems, it is necessary to represent them usingmultiplemodels (Haimes 1981, Hall 1989).Dependingonthebentoftheresearcher,thisissometimescalledmulti-resolution,multi-scale,multi-method,multi-discipline,ormulti-levelmodeling.Inthispaper,wewillsimplyrefertoallsuchapproachesasmulti-modeling.Regardlessofthetermemployed,theintentisthesame.Differentmodels each lend different advantages and disadvantages in terms of phenomenacaptured,computationalburden,accuracy,etc.Theideabehindmulti-modelingistoleveragetheadvantagesofeachmodelbyanalyticallyorcomputationallycomposingthemintoasinglemodelthataddressesoneormorequestionsofinterest.Thecomposedmodelisthenusedtoperformtradestudiesorsupportdecisionmaking.
Such approaches are fairly common in engineering design, for instance in aerospaceengineering where it is called multi-disciplinary optimization (MDO). These approachescertainlyhavetheirchallenges,andthereisarichliteraturethataddressesthemanagementofuncertaintyinthisdomainthatfallsunderthetitleuncertaintyquantification(UQ).Ourconcernhere is the additional risk that results when we extend the multi-modeling paradigm toenterprise systems in an effort to capture the impact of behavioral and social issues onengineered systems (and vice-versa). While the natural approach would seem to be tocomputationally integrate behavioral and social models with engineering models and thenoptimize, we assert that fundamental epistemic limitations in the modeling of enterprisesystemslimittheefficacyofthisapproach.
Inparticular,wewill argue that thecomplexityofbehavioralandsocial systems increase theprominence of three additional sources of epistemic uncertainty above what is typicallyencounteredduringphysicsbasedmodeling:phase,structural,andontological.Inthispaperwe

75
characterizetheseuncertaintiesasbifurcationsthatcanbedifficultformodelstocapture.Theconsequence is that a componentmodel in amulti-model is inadvertently pushed out of itszoneofvalidity.Thisisnottosuggestthattheseuncertaintiesarenotpresentinphysics-basedmodels,butrather it isamatterofdegree. It is likelythatformanyenterprisesystemsthesesourcesofepistemicuncertaintybecomesooverwhelmingthatbuildingaverydetailedmulti-modelbecomescounterproductive.Ratheritismorelikelythatdecisionmakerswouldprefertousesimplemodels thatcapturetheessential featuresof theproblemandthenemployanadaptiveorhedgingstrategytoaddresstheepistemicuncertaintiesinbulk.
During RT-44 and RT-110, we considered a few examples of the use of multi-modeling toexplore enterprise systems. We would now like to reconsider these examples from anuncertaintyperspective.Tothatend,wewillbrieflysummarizeeachoftheseexamples.First,Park, et al. (2012) developed a multi-level simulation to examine policy alternatives for anemployer-based prevention and wellness program. Their model consists of four levels:ecosystem,organization,process,andpeople.Second,SPLASHisaneffortbyIBMResearchtodevelopa framework for looselycouplingmodels fromdifferentdomains tosupportdecisionmakingregardingcomplexsocio-technicalsystems(Barberisetal.2012).SPLASHmainlyfocuseson achieving a methodologically valid combination of different modeling formalisms bydeveloping methods to coordinate inputs and outputs, synchronize time, etc. Third, theDynamic Multilevel Modeling Framework (DMMF) was an effort by the US Department ofDefense to leverage its enormous investment in models and simulations across four levels:campaign,mission,engagement,andengineering(Mullen2013).Theobjectivewastocreateaframeworktoallowsimulationsfromeachoftheselevelstointeroperate,buttheDMMFeffortendedatthefeasibilitystudystage.
Generally speaking, themotivation behind suchmodeling efforts is to account for instanceswhere thedecisionvariableunder thecontrolof thedecisionmaker is far removed fromtheeffectofinterest,necessitatingachainofmodelstolinkthedecisionvariabletotheoutcome.
ToillustratethepointletusconsidertheDMMFexample.Whatifanairforceisinterestedinwhether or not it should perform an upgrade on its fighter engines to increase speed?Increasing speed is just a means to an end. The reason why they would consider such anupgrade is to improve their chances of winning a war or some other similarly high-levelobjective.Consequently,decisionmakerswouldwanttoknowwhattheimpactofthisupgradewould be on the probability of winning a war. So the thought is by linking the engineeringsimulations to themission simulations to the engagement simulations, and soon, one coulddeterminewhattheimpactofthislow-levelengineeringchangewouldbeontheabilitytowinawar.However,unlessthischangeisnearatippingpointtomagnifyitsimpact,theeffectwillbe effectively undetectable due to epistemic uncertainty inherent in models of enterprisesystems.Ifeverysmallchangeinthelow-levelmodelproducedanoteworthyeffectinthehigh-levelmodel,wewouldnothave thehigh-levelmodel. Itwouldbe toounstable tobeuseful.Therationalebehindtheseassertionswillbeexplainedinthesubsequentsections.

76
Historically, developing such multi-models of enterprise systems has proven extremelychallenging. To examinewhy thismight be, let us reconsider the dynamic toll road examplefrom Section 3. Explicitly or implicitly when a department of transportation creates adynamicallytolledroad, it issimultaneouslyconsideringtwodifferentsystemviewsfromtwodifferentdisciplineswithanexplicitfeedbackbetweenthetwo:physicaltrafficflowfromcivilengineering and economic decision making from economics. The presumption is that byadjustingthepriceintheeconomicviewthattrafficflowwillbeaffectedinthecivilengineeringview.Billionsofdollarshavealreadybeenspentonthispresumption.
Ifonewantedtomodelsuchasituation,theapproachseemsstraightforward.Trafficmodelingis well established using both differential equation based and agent based simulationapproaches.Tomodel theeffectofadynamic toll,oneneeds toadd theeconomic responsemodelbyadjustingeithertheentryfloworagententrydecisionbasedonprice.Unfortunately,asconsideredinSection3,anysuchcompositionmaynotbeacorrectashighertollsresultedinhigherusage.
Thepointhere isnotwhetherornot suchbehavior isexplainable throughexistingeconomictheory.Ratheritisthatthethinkingbehinddynamicallytolledroadsisperfectlyreasonable,butpotentiallyincorrect.Thereismorethanlikelyatolllevelatwhichdriverswouldbedissuadedfromenteringthetolledlanes.Forinstanceifthetollwere$1000,itseemsunlikelythatmanywould use the toll road. Thus, there is likely a zone in which the classical demand modelcomposedwithatrafficmodelwouldbethecorrectrepresentation.Unfortunately,atleastinthe caseofMinneapolis, theoperating toll rangedoesnot seem tobewithin that zone.Theissueishowwouldoneknowthatapriori?Thisexamplehighlightstheissueofmodelriskwhenrepresentingenterprisesystems.
EXISTINGAPPROACHESTOASSESSINGMODELRISK
There is certainly nothing new aboutmodel risk. Thus, the question is how themodel riskdescribed above would be handled using existing approaches. Consequently, we will brieflyreviewcontemporaryapproachestodoingso.Theseapproachestendtofocusonquantifyingmodeluncertainty to facilitate threshold-baseddecisionmakingandrobustoptimization.Theapproach to identifying uncertainty in physical multi-models is effectively described byOberkampf,etal. (2002). While thereare severaldifferent taxonomiesofuncertainty in theliterature, we will focus on a fairly common one that breaks uncertainty out into aleatoryuncertainty,epistemicuncertainty,anderror(Agarwaletal.2004).
Aleatoryuncertainty isconsideredtobe irreduciblevariation.Noamountofnew informationcan remove it. An example would be the outcome of a coin flip. Epistemic uncertainty isconsidered reducible through the acquisitionnew information. For example, uncertainty in ameasurable model parameter such as mass could presumably be reduced throughmeasurements. Finally, error relates to a deficiency in the modeling and simulationimplementation effort itself. An examplewould be applying inconsistent units ofmeasure inthesimulationcode.

77
While minimizing error is certainly important, the problem described in the motivationalexampleisnotnecessarilyanerrorinimplementation.Theremaybeazonewherethemodelis correct. Thus,dealingwitherror isoutsideof the scopeof thispaper. This leavesuswithaleatoryandepistemicuncertainty.
There has been a long-running philosophical discussion as to whether or not there is afundamental distinction between aleatory and epistemic uncertainty. From a modelingstandpoint, the distinction is purely a practical one. Once we treat an uncertain event asaleatory, we have essentially asserted that within this model framework, the uncertainty isirreducible andwewill represent it using a probability distribution. Consequently, the trafficmodeling issue we described does not fall under aleatory uncertainty because it is notsomethingwecaptureasaprobabilitydistributionwithinthemodel.Ratheritisanuncertaintyin the structure and/or parametrization of the model itself which can be reduced by thecollection of additional information. In this case, the Janson and Levinson study did exactlythat.Thus,itisepistemic.
Thereareanumberofapproachestoassessingepistemicuncertainty.Yao,etal.(2011)providean extensive survey of the literature in this area with regard to multi-disciplinary designoptimization.Typicalapproaches involveusingdouble loopapproachwheretheouter loop isused to vary the epistemically uncertainparameters.As far as characterizing theuncertaintyitself, approaches include but are not limited to Bayesian, Dempster-Schafer, and possibilitytheory(Agarwaletal.2004).RoyandOberkampf(2011)provideathoroughdiscussionofhowparametric,numeric,andmodelformuncertaintiescanbequantifiedinanintegratedfashion.
Agawal,etal.(2004)illustratetheseprinciplesusinganaircraftdesignprobleminvolvingthreecoupledmodels:oneforweight,oneforaerodynamics,andoneforperformance.Essentially,such approaches endogenize the epistemic uncertainty within the model in the sense thesecond loopprovidesasystematicwaytovarytheepistemicallyuncertainparameters. Oncethat is in place, optimization approaches can be used to find a Pareto optimal set of designoptionsthatbalanceuncertaintywithperformance. Ofcourse,actuallypropagatingalloftheuncertainties through themodels can be computationally challenging, andmany researchersaredevelopingapproachestoaddressthesechallenges.
Thesetypesofapproachesaresometimesreferredtoasuncertaintyquantification(UQ).SandiaNational Laboratory has been particularly active in this area via the Dakota Project (Sandia2015).Eldred,etal. (2011)provideadetaileddescriptionofSandia'sapproachtouncertaintyquantification.WhileeffortslikeDakotaarecertainlycriticaltorobustengineeringdesign,wewillarguethattheproblemhighlightedinthemotivatingexamplewouldnotbeaddressedbysuchapproaches.Inparticular,theiremphasisisonphysicalsystemswherethephenomenaarerelativelywellcharacterizedbutmeasurementerrorandassociatedissuescanbeproblematic.Ifwereturnto thedynamically tolledroadexample,varyingtheuncertainparameterswouldnothaverevealedthemorefundamentalstructural issue, that theassumedclassicaldemandmodelwasinappropriateforthesituation.

78
RoyandOberkampf(2011)notethatmodelformuncertaintyisoftenthedominantsourceofuncertainty for the test cases that theyhaveexamined,but theybase theirquantificationofthis error on extrapolation from experimental data. However, an extrapolation would notcaptureabifurcationinsystembehavior.(Wedonotbelievethatthisassertionisinconsistentwith Roy and Oberkampf's acknowledgment of the limitations of their method.) We willsubsequentlyarguethatweshouldexpectbifurcationstobemorecommonaswemoveawayfrompurelyphysicalsystemsandtowardenterprisesystems.Thereasonsarediscussedinthesubsequentsections.
REVISITINGCOMPLEXITY
IntheRT-110report,wediscussedhowcomplexityaffectsthemodelingofenterprisesystem.Tobrieflyreview,thereasonwhywecallsuchsystemscomplexisbecausetheyaredifficulttocapture with compact, accuratemodels. (See Alderson and Doyle 2010). Consequently, weoften need different models in different situations. This is in part due to the tendency ofbiologicalandsocialsystemstoadaptandchangestructuredependingonthecircumstances.Thedynamicallytolledroadisaperfectexample.Undersomecircumstances,thepriceservesasclassicalmechanismtoregulatesupplyanddemand.Underothercircumstances,thepriceservesasasignalfortheleveloftrafficcongestiononalternativeroadways.
Tomakemattersworse,organisms,humans,andorganizationsalladapt.Thismeansthattheyintroducenewanddifferentontologiesovertime. Forexample, ifwegofarenough intothepast, therewas a timewhen things like currency and gross domestic products did not exist.Theseareeffectivelynewontologiesthatwereintroducedovertimebyhumanbeings.Imaginethatwehad a particularly forward-thinkinghunter-gatherer frompre-historic times thatwasinterestedinmodelingandpredictingthefutureprogressionofhumanbeings.Howwouldthishunter-gathererknowto includethe impactofeconomicsonfuturehumanbehaviorwhen ithasnotbeeninventedyet?
Toprobethispointalittledeeper,letusconsidersomeworkfrombiologyandsocialscienceonthismatter.ProbablythemostcriticalworkthatconsidersthisissueisbiologistRobertRosen's“FundamentalsofMeasurementandRepresentationofNaturalSystems”(Rosen1978).Rosentook a very abstract view ofmodeling systems. He framed the problem as one of systemsinducingdynamicsonmetersandtheninvestigatedtheimplicationsofthatsetup.Akeynotionisthatdifferentmetersaregoingcapturedifferentfeaturesofasystem.Ifyoudonotknowtobuildaparticularmeter,youwouldnotmeasurethefeaturesofthesystemthatitreveals.Forexample, you need a voltmeter tomeasure voltage, but building a voltmeter requires theconceptofvoltage. Inasense,wecouldarguethatwemustcreatenewontologiestocreatenew useful meters (volt meter, gross domestic product). Two ideas that we can take fromRosen'sworkisthatacomplexsystemcanrarelybecapturedbyasinglemodelandthenotionofmodelbifurcation.
Bifurcationtheoryisaresultofaverylargebodyofworkknownasdynamicalsystemstheory.Anindepthdiscussionisnotnecessaryforourpurposes,andinsteaditissufficienttonotethatbifurcationtheorystudiesthecircumstanceswhenasmallchangeininputresultsinadramatic

79
changeinoutputforadynamicalsystem. Inotherwords,thereisaqualitativechangeinthesystem.
Ifwecould fully representasystemwithasinglemodel, thenthatmodelwouldcaptureanybifurcation that occurred in a system. However, if we need to employ multiple, differentmodelstocaptureasystem,itsuggeststhatwearemissingsomeofthebifurcations.Thus,themodelmaybifurcatefromthetruesystemovercertainspaces.Ifwecannot,asRosenasserts,seethetruesystem,thenwecanonlyseethemodels.Thus,whatweareseeingisonemodelofthesystembifurcatingrelativetoanothermodelofthesystem.
ThisviewpointwasexpandedbyCasti(1986)whoconsideredtheimportanceofbifurcationstolevels of abstraction and system complexity. In particular, Casti asserts that levels ofabstractionaretheresultofsystembifurcations,andcastscomplexityasthenumberofnon-equivalentdescriptionsrequiredtorepresentasystemforagivensetofobservables.ThelargerimplicationofCasti'sworkfromourperspectiveisthatifsocialsystemsarecomplex,therearemany possible bifurcations; hence there are many different models and theories in socialscience. Eachmodel or theory has an element of truth, but it is easy to over extrapolate,exceedthebifurcationpoint,andobtainbadpredictions.
In work that that takes a slightly different approach but achieves complementary results,Harvey and Reed (1996) wrote “Social Science as the Study of Complex Systems.” Theyproposed a fourteen level hierarchy of ontological complexity. Paraphrasing, their hierarchystartswithphysicsandthebottomandendswiththeevolutionofsocialsystemsonthetop.HarveyandReedarguethatthecomplexityofeachlayerisgreaterthantheonebelow,whichresults in fundamental epistemological differences as we move up the hierarchy. In short,complexitylimitswhatwecanknowaboutasystem.Asadirectconsequence,differentclassesofmodelsareappropriate fordifferent levelsof thehierarchy.What thismeans is thateventhoughsocialsystemsareeffectivelyphysicalsystemsatthebottom,asapracticalmatter,onecannot capture the behavior of a social system using a physical model. Multiple models atdifferentlevelsofabstractionareanecessityforunderstandingenterprisesystems.
What we can draw from this discussion is that a major challenge of modeling enterprisesystems is shifting and incompatible models. In other words, there are likely to be morebifurcationswhenrepresentinganenterprisesystemviceapurelytechnologicalsystem.Whenthese bifurcations are not specifically known and quantified, they constitute a source ofepistemicuncertainty. Whileuncertaintyquantificationmethodsaim toaddressmodel formuncertainty via extrapolation, it is not likely that such methods would address thesebifurcations.Aquestionnaturally follows:Howdoesoneunderstandandmanage the riskofbifurcationswhenmodelingandsimulatingenterprisesystems?
MODELSANDBIFURCATIONS
We initially discussed the concept of model bifurcation in RT-110. However, the workconductedaspartoftheRT-138hasallowedustoexpandontheconcept.Thechief issues iswhen does the behavior of a model start to substantially diverge from the behavior of the

80
system it is representing? Formally, Rosen defines a model bifurcation using ± and ≤neighborhoods,butforourpurposesitissufficienttosaythattwomodelsdiverge.
In theRT-110 reportwe included, theexampledepicted in Figure19. Suppose that the solidblack line is the “true” system thatweare trying tomodel. Supposealso thatwehave twomodelsofthesystemthatwecanuse,model1andmodel2. Model1 isrepresentedbythedashed lineandmodel2 is representedby thedotted line. Note thaton leftportionof thediagram, model 1 is the better representation of the system while on the right side of thediagram,model2isthebetterrepresentation.Thereisaregionofoverlapinthemiddlewhereneithermodel 1 normodel 2 is perfect, but together they bound the true system. The twoverticallinesindicatethemodelbifurcationpoints.Theleftbifurcationpointiswheremodel2divergesfromthetruesystemwhiletherightbifurcationpointiswheremodel1diverges.
Figure19-Notionalrepresentationofmodelsbifurcatingfromthetruesystem
Perhapsthemostimportantobservationwecanmakeaboutthisexampleisthatifweweretolookatonlymodel1aloneoronlymodel2alone,wewouldnotdetectthebifurcationpoints.Consequently, if tried to capture the model form error of model 1 (or model 2) viaextrapolationfromitsareaoffit,wewouldsubstantiallyunderestimateit.Ifweweretolookatbothmodels1and2simultaneouslywewouldseethatthemodelsbifurcaterelativetoeachother, butwewould not knowwhichmodel is the better representation of the true systemwithoutadditionalinformation.Thisistheessenceofthemodeluncertaintyproblem.Wedonotalwaysknowwhenourmodelisnolongervalidsincewecannotnotfindbifurcationpointsbysimplyrunningthemodelorperformingasensitivityanalysis.
Model1 Model2Overlap

81
Amoredescriptiveand intuitivetermforabifurcation is“phaseshift.” Abifurcationpoint iswhere the system of interest undergoes a phase shift, and the model we were using is nolongeraccurate.Thecanonical illustrativeexampleofthisprincipleseemstobethephasesofwater.Forinstance,wecanmodeliceasarigidsolid...untilthetemperaturegetsabove0°C.Atthattemperature(assumingstandardatmosphericpressure)waterundergoesaphaseshiftfromsolidtoliquid.Soourmodelofwaterasarigidsolidisnolongervalid.Thus,themeltingpointofwaterisabifurcationpoint.Infact,onecouldmaketheargumentthatmodelswitchingishowwedefinephases.
Solé(2011)discussesmodelingthephasesofwater ingreatdetail. Sinceweareusingphaseshiftsasametaphor,forourpurposes,itwillsufficetoproceedwithahighlysimplifiedversion.(Wewillnotconcernourselveswithsupercriticalfluids,etc.)Wecanextendourwaterexamplebycontinuingtoincreasetemperature.Oncewegetto100°C,waterundergoesanotherphaseshift fromliquidtogas. Thisnecessitatesanothermodelshift. Underascenarioofgraduallyincreasing temperature we have to use three different, incompatiblemodels of water: rigidsolid,liquid,andgas.Therearealsotwotransitionzoneswherethewaterisamixtureoftwophases,anditisnotclearwhatmodelweshoulduse.
Empirically, we know the bifurcation points of water, but these would not necessarily beevidentusingonlymodelsforasolid,aliquid,andagas.Forexample,astandardmodelofarigidsolidmaynotincludetemperatureasaparameteratall.Ifweweretomodelwatervaporusingtheidealgaslaw,reducingthetemperaturewouldcertainlynotrevealthecondensationpoint.Thus,theproblemisthatifthesethreemodelswereallwehad,wemaynoteverfindthebifurcationpoints.Thus,wewouldnotknowwhenthemodelsarewrong.Andthisdoesnotevenfactorinthetransitionzoneswherenoneofthethreemodelsareaccurate.
Sohowmightweaddress thisproblem? Thestandardapproach inscience is reduction. Weattempt todrill downa layer of abstraction and capture thebifurcationpoints.Of course, italmostgoeswithoutsayingthatthecomputationalanddatacollectionburdensincreaserapidlyas wemove toward quantummechanics. At that point, modeling a macroscopic system iscomputationally prohibitive. As a practical matter, all bifurcation points cannot be fullycapturedformostrealworldsystemswithasinglemodel.Thequestionthenbecomeswhetherornotonecrossesabifurcationpointforthesituationandmodelofinterest.
For enterprise systems, the phase change issue is much more challenging than the waterexample.Aswediscussedintheprevioussections,enterprisesystemsundergomultiplephaseshiftsatmultiplelayersofabstraction,anditiseffectivelyimpossibletorepresentthemwithasinglemodel.Consequently,ouronlycourseofactionistotrytoidentifytheexistenceofthephaseshiftsorbifurcationpointssothatwecandealwiththem.
Returningtothewaterexampleabove,knowingwherethebifurcationpointsareallowsustoknowwhentoswitchmodels. Theproblemisthatwedonotnecessarilyknowtheanalogofmeltingpointforasocialsystem.Infact,socialsystemscanbesocomplexthatwehavenoideawhichbifurcationpointstolookforwhenweposeaquestionofinterest.Sohowmightwegoaboutidentifyingphaseshiftsorbifurcationpoints?
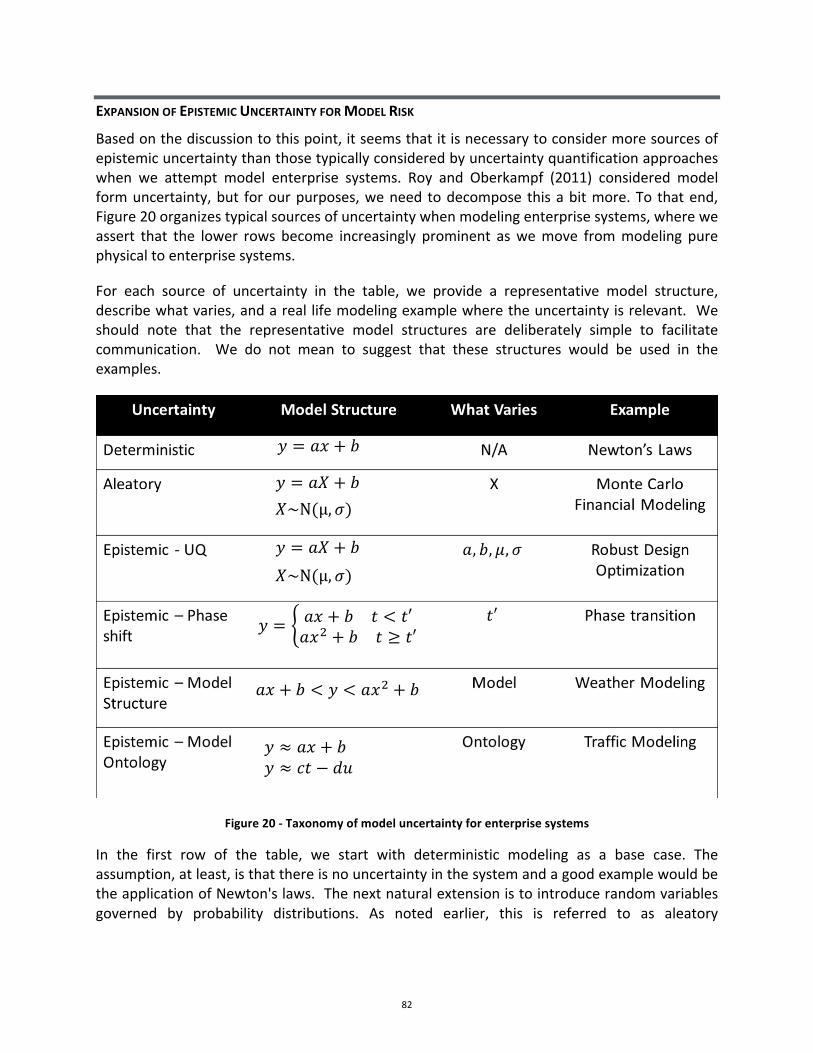
82
EXPANSIONOFEPISTEMICUNCERTAINTYFORMODELRISK
Basedonthediscussiontothispoint,itseemsthatitisnecessarytoconsidermoresourcesofepistemicuncertaintythanthosetypicallyconsideredbyuncertaintyquantificationapproacheswhen we attempt model enterprise systems. Roy and Oberkampf (2011) considered modelformuncertainty,but forourpurposes,weneed todecompose thisabitmore.To thatend,Figure20organizestypicalsourcesofuncertaintywhenmodelingenterprisesystems,whereweassert that the lower rows become increasingly prominent aswemove frommodeling purephysicaltoenterprisesystems.
For each source of uncertainty in the table, we provide a representative model structure,describewhatvaries,andareallifemodelingexamplewheretheuncertaintyisrelevant. Weshould note that the representative model structures are deliberately simple to facilitatecommunication. We do not mean to suggest that these structures would be used in theexamples.
Figure20-Taxonomyofmodeluncertaintyforenterprisesystems
In the first row of the table, we start with deterministic modeling as a base case. Theassumption,atleast,isthatthereisnouncertaintyinthesystemandagoodexamplewouldbetheapplicationofNewton'slaws.Thenextnaturalextensionistointroducerandomvariablesgoverned by probability distributions. As noted earlier, this is referred to as aleatory

83
uncertainty.AnexamplewouldbewhenbusinessesperformMonteCarlo simulationswherecashflowsareuncertainandgovernedbyprobabilitydistributions.
The deterministic and aleatory cases are the two “classical” cases, and there are manyoptimizationapproaches to findorat leastapproximate the“best” solutionwhenusing suchmodels. Butwhat ifweeitherdonothaveaprobabilitydistribution foranuncertainmodelparameter or we are not certain of that probability distribution? Then we move into thedomain typically called uncertainty quantification in the literature. Methods in this domainvarymodelparametersandprobabilitydistributions. Inthesimplest form,thiscanbeabasicsensitivityanalysis.However,asnotedintheliteraturereview,moresophisticatedtechniquesmaybeapplied.Searchingforoptimalsolutionsrelativetothislevelofuncertaintyiscertainlymorechallenging,but there ismuchongoingwork in theareasof robustdesignandMDOtoaddressthesechallenges.
Butwhathappensifweareuncertainregardingthestructureofthemodelitself?Thisbringsusintotheareaofbifurcation.Thefirstcasewewillconsideriswherethereareknownmodelsbutthebifurcationpointisuncertainasdefinedbyasetofcontrolparameters.Forexample,inourphasechangeexample,wemaybeuncertainaboutaparticularsubstance'smeltingpoint.Anexampleof this inanenterprise system iswhenanorganizationoperates indifferentmodes(forexampleemergencyresponsevsnormal),butit isnotentirelycertainwhenamodelshiftwillbetriggered.
If we increase the level of epistemic uncertainty further, wemay not be sure of themodelstructureatall.Inthefirstcase,wemaymoreorlessknowthemodelontology,butjustnotbesureabout the relationshipsbetween theentities. However,wemaybeable tocapture thespread of possibilities by comparing different possiblemodel structures. An example of thiswouldbeweathermodelingwhereitiscommontorunanensembleofmodels.Eachisbasedonthesamebasicphysicsofweather,buteachemphasizesdifferentaspects,employsdifferentlevelsofresolution,etc.Finally,wemaynotevenbesurewhatthebestontologyistoapplytothequestion. Anexampleof thiswouldbepredicting traffic jamdensityusingeither a flowbasedoranagent-basedmodelingapproach.(Daganzoetal.2011)
It is importanttonotethataswemovefromphysicalsystemstoenterprisesystemswetendmovedownthetablewithincreasingepistemicuncertainty. Forexample,thelawsofphysicsare relatively stable, and formost practical applicationswe have no uncertainty about theirapplicability (though thereareexceptions).However, ifwewere tobuildamodelof a socialorganization,wewouldnotbeveryconfidentinitsstructureovertime.(Membersmaycomeand go. The organization may reorganize, etc.). Unfortunately, such uncertainties (phase,structural,ontological)arechallengingtoquantifyoroptimizeoverforenterprisesystems.Toillustratethispoint,wewillconsideranexampleprobleminthenextsection.
EXPLORATORYDECISIONPROBLEM:CROPALLOCATION
As discussed previously, the general MDO/uncertainty quantification paradigm attempts tocapture the various sources of uncertainty within themodel so that an optimization/search

84
strategy may be employed to find an acceptable balance of performance and uncertainty.Consequently,ifweweretoapplythisapproachtoanenterprisedecisionproblem,wewouldhaveto identifyallofthepotentiallyrelevantsourcesofuncertaintyandcapturetheminthemodel(atminimumwithintheouterloop).Inthissectionwillconsideraverysimpledecisionfacedbyafarmer,andshowhowconsiderationoftheepistemicuncertaintiesthatresultfromthelargerenterprisesysteminwhichthefarmerisembeddedquicklyoverwhelmsone'sabilitytoaccountforandmanagethatepistemicuncertaintywithinthemodel.
Akeychoicemadebyfarmersacrosstheagriculturallandscapeistodeterminethemixofcropstoproduce inaparticulargrowingseason.Thereareanumberof risk factors involved in theprocessthatcouldhaveadetrimentaleffectoncropyieldandrevenue.Forexample,drought,productionmishaps,demandfluctuation,andcompetitorsupplylevelscanallaffecttheprofitthat may be made from a given crop. In essence, when the farmer makes an operationaldecision such as a crop mixture to plant, ideally, he or she should consider the impact ofeconomicfactors,marketfactors,andthephysicalenvironmentjusttonameafew.(SeeFigure21)Toaid indetermining thecropmixture foragivenyear, itwouldbehelpful todevelopamathematicalmodelofrevenueunderdifferentcropmixtures.
Figure21-Abstractionsrelevanttothefarmer'sdecisionproblem
Theobviousapproachistodevelopmodelsthatestimatetheyear'scropyieldandcropprice.These estimates can be used to determine revenues under different cropmixtures, and thefarmercancomparethesevaluestoarriveatapreferredcropmixture.Inthisexamplewewillstart with the farmer's core operational decision then attempt to apply increasinglysophisticatedmethods to captureuncertainties that result from the agriculturalmarket level
Economy
AgriculturalMarkets
FarmOperations
PhysicalEnvironment

85
andtheeconomiclevel.Wewillfindthatweveryquicklygetoverwhelmedbeforeweevengetto the uncertainties that result from the physical environment. In effect, following areductionistapproachinthisexamplethatincreasesmodelfidelityinanefforttobothmaintainconsistency among the views while simultaneously capturing the sources of uncertainty canopenupthepossibilityfordifferenttypesofmodeluncertainty,showingtheneedforabalancebetween the realismof themodel and themodel uncertaintymadepossible by themodel'sexactness.
For simplicity, we assume that there are only two crops that can be planted, and that theproportion of one has no effect on the growth of the other. To balance revenue and risk, asimplemean-variancemodeloftheform≥ 9 − ¥LlX[9]isusedastheobjectivefunction.
DETERMINISTIC/NAIVEMODEL
Atthemostbasiclevel,wecouldignorethemanyriskfactorsassociatedwiththeproblemandmodel revenue simply as the product of point estimates of crop yield and crop price. Oneapproachtoestimatingyieldistousethemeanyieldofthatcropoverthepastseveralyears.Thepricecanbeestimatedbyusing thecurrentprice in the futuresmarket (withsettlementdateclosesttoharvesttime).
Inparticular,letQ0 denotethepriceofcropsatharvestandR0 denotetheyieldofcrops.Let≤be the proportion of crop 1 planted,where0 ≤ ≤ ≤ 1 and#∂ be the farm's revenue underproportioning≤,i.e.,#∂ = ≤Q`R` + 1 − ≤ Q_R_.Becausetheestimatesforpriceandyieldarenon-stochastic, the variance is zero, and so the mean-variance formulation simplifies to arevenuemaximizationproblem:max
∂#∂ = ≤Q`R` + 1 − ≤ Q_R_.
Inthissimplecasethesolutionisimmediate:ifQ`R` > Q_R_,then≤ = 1,otherwise≤ = 0.Theobviousdrawbackofthisdeterministicapproachisthat itmakesnoattemptatmanagingthepotentialvariation inrevenue.Whilethismodel isexceedinglysimpletouseandunderstand,attempts to optimize with this model are quite likely to produce an incorrect result, anddecisionsmadeusingsucharesultwillbeproblematic.
MODELWITHALEATORYUNCERTAINTY
Tomakethemodelclosertoreality,wenowassumethatcroppricesarerandomvariables.Tothisend,supposethatthepriceofcropsisarandomvariable90 withrealizationsQ0,andthatthecropyieldR0 isgivenapointestimatebasedonpastyields,asabove.Themean-variancemodelisthenmL ≤ = ≥ #∂ − ¥LlX #∂ ,where

86
Differentiating with respect to ≤ and setting the derivative to 0, we obtain the first-orderoptimalitycondition
Equation5
Also, we observe that the second derivative, πb
πb∂mL ≤ = −2¥LlX R`9` − R_9_ < 0, and
therefore(Equation5)givesaglobalmaximum.1
Althoughthisapproachtotheproblemseemstobemorereasonablethanthenaiveapproach,we have introduced parametric uncertainty to the situation, aswe are now faced bothwithchoosingadistributionandparameterizingit.
MODELWITHEPISTEMICUNCERTAINTY
Amore detailedmodel maymake a more serious attempt at forecasting yield thanmerelyrelyingonpastaverages.Acommonmethodofmodelingcropyieldutilizesstatisticalmethodssuch as regression analysis or principle component analysis (Kantanantha et al. 2010). Suchmodels typically operate on the same or similar ontologies, largely agreeing on the type ofparametersusedandtheirrelationships.
We consider a simple method where linear regression analysis is used to parameterize thedistributionofyield.Forexample,iftheprobabilitydistributioncallsfortwoparameterspandr,pastdatacouldbeusedtodevelopmodels ª0Q0ò
0º` and Ω0R0ò0º` whichgiveestimatesfor
pandr, respectively.Wethus letbothpriceandyieldberandomvariables;pricedefinedasabove,andyieldforcropsmodeledbytherandomvariable©0 andparameterizedbytheaboveregressions.
Asafurthersimplification,weassumepairwiseindependenceamongallvariables.Thisallowsthemodelertoassigndistributionstoeachphenomenonwithoutconcernsofdescribinghowthevariablesrelatetoeachother.Themeanandvariancesimplifyto
Equation6
1 Secondorderderivativesarenotexplicitlygivenintheremainderofthisexample,butwenotethattheyarealloftheform� ∙ LlX[ø],where� < 0andøisarandomvariable.Consequently,allfirst-orderconditionsdescribemaximalsolutions.

87
Forming themean-variance, differentiating, and setting equal to 0,we obtain the first-ordercondition
Equation7
Using theseequations, theoptimal≤ caneasilybe calculated fromEquation7. Forexample,suppose that 90 and ©0 are lognormally distributed as follows:9`~â]¡ 2.5,0.5 , 9_~â]¡ 2,0.25 , ©̀ ~â]¡ 1,0.5 ,and©_~â]¡(1.5,1). Using Equation 7, wefindtheoptimalmixturetobe83.67%crop1and16.33%crop2.
Although this frameworkappears tobesuperior to thepreviousmodels, there is still agreatdeal of uncertainty in the model, and much of this uncertainty has been induced bycomplicating the models. The use of a regression model introduces both quantificationuncertainty and epistemic uncertainty of themodel structure type, as the regressionmodelfaces its own parameter uncertainty, and additionally, itwill never be clear that the chosenregression model (e.g., a simple linear regression model) is the “correct” model. Perhaps anonlinear regressionmodelwould bemore appropriate or perhaps amore abstractmethodsuchasprinciplecomponentsanalysiswouldbepreferable.
Additionally,we are nowmultiplying uncertainties. At the very least, at each decision point,thereexiststhepotentialforabinaryphasetransition,withsmallerrorspossiblypropagating.
Tomovethemodelclosertoreality,wemightdroptheassumptionofindependencebetween9`and9_andbetween©̀ and©_,whilemaintainingtheindependencebetweencroppriceandyield.Theexpectedrevenue≥ #∂ isstillgivenbyEquation6,butthevarianceisnow
Forming themean-variance, differentiating, and setting equal to 0,we obtain the first-ordercondition

88
While this is similar to the previous≤, it is complicated by the covariance term (which alsoappears in theexpansionof thevariancetermoutsideof theparentheses).Thecovariance isgivenby
Equation8
The second term inEquation8 iseasy to compute, since the individualexpectationsofpriceandyieldareassumedtobegiven,butthefirsttermisdifficult,andmustbeestimated.Weseethat,again,wehaveaddeduncertaintyintheprocessofprovidingamoredetailedmodel.
Continuingthenumericalexamplefromabove,Table8givesthevalueof≤fordifferentlevelsofcovariance(whichisuniquelydeterminedby≥ 9`©̀ 9_©_ ).
Table8-Optimal√forvariousvaluesofƒ≈∆ <«»«, <…»…
Dependingonthemagnitudeofthecovariance,theoptimalcropmixturecanbequitedifferentfromthemixturefoundbymakingtheindependenceassumption.Inparticular,thereisapointwherethedifferencebetweentheestimatedmixtureandtheoptimalmixtureissignificant,andthispointdefinesatypeofphasetransition,wherethesimplifiedmodelbreaksdownandgivesapoorprescription.
We now consider the implications of relaxing the assumption that crop price and yield areindependent, presumably making the model even more accurate. The first order optimalityconditionbecomes
Where

89
Asaconsequenceofincreasingthedetailofthemodel,weencounterasignificantincreaseinuncertainty.Indeed,wemustnowdeterminevaluesfor≥ 90©0 andànå 90_, ©0_ inadditionto≥ 9`©̀ 9_©_ from above. The potential for an incorrect estimate is thus quite high, and thelikelihoodoferrorisclearlygreaterinthiscase.Thisservestoamplifythepossibleimpactsoftheuncertaintytypesdiscussedabove.
ALTERNATEMETHODOLOGIES
Themodelsfromtheprevioussectionsgenerallysharedacommonontologyandwerecloselyrelated.However,thereareseveralalternatemethodologiesthatmightbeusedtomodelcroprevenue.
• Intheabovemethodologyweconsideredtheissuemoreorlessinavacuum,withthefarmerinquestionhavingnoimpactonthemarketandthemarkethavingnoimpactonthefarmer.Forexample,ifeveryfarmerintheareafollowsasimilarstrategybasedonthe same analysis, then the market may actually be different than anticipated, thusnegatingtheindividuallyfocusedmodelsthatwereusedinthefirstplace.
• Theabovemodeldidnotconsidertheemploymentofriskmanagementstrategies(e.g.,hedgingandcropinsurance).Theuseofsuchinstrumentcouldhaveamaterialeffectonrevenue,particularlywhengovernmentallysubsidizedinsuranceisavailable.
• Insteadofgivingseparatemodelsforpriceandyield,asinglemodelofrevenuemightbeusedwhichdoesnotexplicitlyconsiderthesefactors.
The existence of these alternatives shows how epistemic uncertainty of themodel ontologyvarietyentersintothecropmixtureproblem.
At this point, the natural question to ask iswhat should be done in light of the uncertaintypointed out here. This simple analysis showed how quickly the crop mixture problem canbecomeunwieldyifthemodelerattemptstocloselydeveloptheintricaciesoftheproblem.Inreality,itisdifficulttoimaginethatsuchananalysisisactuallyundertaken.Wearguethatthereis good reason for this, as we have shown that these models would be fraught withassumptionsandpotentialuncertainty,andoptimizingoversuchanunstablespaceseemsnottobeworththetrouble.Addingmodelsofweatherandcropgrowthtothepicturetoaccountforthatenvironmentalimpactsareunlikelytoimprovethesituation.
As noted byOberkampf, et al. (2002), “Amodel of limited, but known, applicability is oftenmoreuseful thanamorecompletemodel.Thisdictumofengineering seems tobe forgottentodaywiththeadventofrapidlyincreasingcomputingpower.”Consequently,thefarmermaydowelltoconsidersimplermodelsandsettingupadaptionorhedgingmechanismstoaddressthevariabilityinvolvedinthesituation.Suchmechanismshappentobeeasilyattainableintheagriculturalmarket.

90
EPISTEMOLOGICALIMPLICATIONSOFTHECROPALLOCATIONEXAMPLE
Thetakeawayfromthefarmerexampleisclear:theexcessiveamountofepistemicuncertaintymakes thedetaileddecompositionandanalysisof thatuncertainty counterproductive.A realfarmerwould probably just use a simple decision rule andhedge theposition in the futuresmarket.While it is unlikely that his or her hedging positionwill be “optimal”, the approachseemsreasonableconsidering theamountofeffort required to findanoptimalposition.Thisapproacheffectivelyhandlestheuncertainty inbulk inawaythat is likelytobegoodenoughfor practical purposes. This raises important epistemological questions regarding the use ofmulti-modelstosupportdecisionmakingforenterprisesystemsversusphysicalsystems.
Instinctively,wemightthinkthatamodelthatattemptstofaithfullyandfullyimplementeveryvalid scientific theory relevant to the question of interest is more justifiable than one thatmakes substantial omissions and/or false but useful assumptions. Yet, the farmer exampleseemstosuggesttheoppositeconclusion:wemaybeabletolearnmorefromacoarsemodelwherethemodelerknowinglyemploysinaccurateyetusefulassumptionsthanthetheoreticallycomprehensivebutunwieldymodel.Howcouldthisbethecase?
Tounderstandthis,weneedtoconsiderworkontheepistemologyofsimulation.Particularlyrelevant to our problem are works by Andreas Tolk (2015) and Eric Winsberg (2010). Bothconsiderhowwecanreachcorrectconclusionsfromsimulationsthatweknowareincorrectinsomeway.Tolknotesthatifwefollowtheevolutionofscience,weseeasimilarproblem.Overtime theories became increasingly abstract and removed fromeveryday observations. In theend, a scientific theory is designed to answer a specific set of questions over specific set ofconditions.Thereisnoguaranteethatitwillbecorrectinallsituations.Infact,weknowitisnot.
AlsorelevanttothisdiscussionisWinsberg'sexaminationofhowmulti-scalemodelingisusedtomodel crackpropagation inamaterial. The issue is thatdependingon the scale,differentmodelsarerequired.Forlargescales,linear-elastictheoryisused;formediumscales,moleculardynamicsisused;andforsmallscales,quantummechanicsisused.Theproblemisthatthesethreetheoriesareinconsistentandincompatible.Tomakethesimulationwork,``handshakingalgorithms'' thatrequiredeliberate fictionsmustbe introducedtotranslateparametervaluesbackandforthamongthethreeviews.
Forinstance,fictitious“silogen”atomsareintroducedontheboundarybetweenthemoleculardynamics view and the quantummechanical view.Despite these fictions, the simulation canproduceaccurateresults.Winsbergarguesthatthecredibilityofsuchapproachesisestablishedinverymuchthesamewaythatcredibility isestablishedforatraditionalexperimentalsetup,throughanevolutionarypaththathasbeensuccessfulovertime.
Inshort,considerationofsomeproblemsintrinsicallyrequiresmultiple incompatibletheories.These incompatibilities result from the fact that theories are themselves simplifications ofreality.Toaccommodatetheseincompatibilities,wemaybeforcedintroducefictitiousentitiesto mediate between them, particularly when they are modeled in parallel. Unfortunately,

91
developmentof“handshakingalgorithms”wouldseemtorequireagreatdealoftrialanderror.Whenweconsideressentiallyphysicalsystemssuchasanaircraftwherethelawsofphysicsaredominant, all else being equal, building a detailed multi-model and using uncertaintyquantification coupled with robust optimization and related techniques seems to be aworthwhileapproach.Thisisbecausethelawsofphysicsarestable(i.e.,theydonotbifurcateovermostquestionsofinterest).Forexample,Newton'slawsarestillusedformanypracticalengineeringproblemsbecausetheydonotbifurcateoverthespaceofinterest.Colloquially,therulesofthegamedon'tchangeinthemiddleofthegame.
Whenwe consider enterprise systems on the other hand, bifurcations are rampant. Humanbeings frequently switch modes of behavior depending on the circumstances and/or invententirelynewontologiestoaddressproblemsandadapttonewsituations.Inotherwords,theyintentionally alter the rules of the game as the game proceeds. One could argue that thiscapabilityhascontributedtooursuccessasaspecies.Ontheotherhand,itmakesitincrediblydifficulttomodelandpredictourbehavior.Consequently,constructingadetailedmulti-modelofanenterprisesystemandperforminganexpensiveuncertaintyanalysisonitdoesnotseemtopass the cost/benefit threshold.Themoredetailed themodel, themoreways for it tobewrong.
Sodoes thismean thatone shouldnotbotherbuildingmulti-models forenterprise systems?Not at all. Rather, consideration of the issues discussed has implications for both how oneconstructssuchandmodelsandhowoneusesthem.Weneedtocapturearethebifurcationpointssothatwecanmanagetheriskofcrossingthem.Ofcourse,ifthemodelsinusedonotcontain the structure thatwould reveal the bifurcation, then increasing the fidelity of thosemodels will not help. This shifts the emphasis of the multi-modeling effort from one ofmaximizing localpredictiveaccuracytooneofdetectingtheexistenceofbifurcationpoints inthesystem.Inotherwords,allelsebeingequal,wewouldratherhaveanimprecisemodelthatisviableovera largerangeofthedecisionspacebecauseitcapturesthebifurcationsthananextremely precise model that has limited applicability because it does not capture thebifurcationpoints.
From this perspective, the point of multi-models of enterprise systems is to identify theexistenceofbifurcationpointsthatthedecisionmakerwouldnototherwiseknowaboutifheorsheonlyfocusedonasinglemodel.Inessence,welookingfortheexistenceofcategoriesormodes of system behavior even if we cannot precisely and quantitatively demarcate thetransitionsbetweenthem.
REVISITINGTHETOLLROADEXAMPLE
With this perspective in mind, let us revisit the dynamically tolled road. How would thediscussedconceptsapplytothisdecisionproblem?Inessence,weareasking:wasthereawayforengineersanddecisionmakerstodetectthepotentialforabifurcationindriverbehaviorinthemodelingandanalysisphasepriortotheexpenditureofsubstantialfunds?Inthatspirit,wewant to perform the analysis using the same resources and expertise available to a typicalengineeroranalyst.Thismeansthatweneedtobeabletodetectthebifurcationpointwithout

92
assuming that the analyst has a PhD in economics aswell as every other relevant discipline.Following the approach advocated in this paper,we decided to develop a quick, low-fidelitymodelofthedynamicallytolledroaddecisionproblem.Becauseweonlyneedtoestablishthepossibility for a bifurcation, not prove its existence,we canbe a little loose in ourmodelingassumptions.
Forthisexample,letusviewitfromtheperspectiveofahypotheticalanalystwhoisfacedwithmakingarecommendationonwhetherornottoconstructadynamicallytolledroad.Simulatingtrafficflowitselfiswellestablished.Thus,thekeyissuehereisthedriver'sdecisionwhetherornottoenterthedynamicallytolledroad.Thewholepointofthetollistoinfluencethisdecision.Howshouldthisbemodeled?Aspreviouslydiscussed,themostnaturalapproachwouldbetoimplementaclassicaldemandfunctionwhereanincreaseinthetollwouldresultinadecreasein thenumberofdriverswilling toenter the toll road.Potentialdriverscouldbesurveyedtoassess their willingness to pay to save travel time, and the demand curve could beparameterized(Thisisessentiallyhowitisdoneinreallife,see(HNTB2010)).
Ofcourse,therewouldbeuncertaintyregardingthisdemandcurveasthesurveywouldnotbecompletely reliable. So one could perform a sensitivity analysis on the demand curve andobservetheimpactontrafficflowinthesimulation.Ifamoresophisticatedanalysisisdesired,onecoulduseoneofuncertaintyquantificationtechniquesdescribedpreviously.Theresultsofthisanalysiswouldconstitutea fairly conventionalapproach to supportdecisionmaking.Wewould have a nominal understanding of the toll road's impact on traffic flow plus someunderstanding of the robustness of that result. Butwould it be correct? From a theoreticalperspective,thisanalysiswouldseemtobesound.
As a first step to test this, we will intentionally alter the structure of decision problem (asopposedtojusttheparameters)toseehowstabletotheresultis.Ourfirstinstinctmightbetoincreasethefidelityofthedriverdecisionmodel.Onewaytodothiswouldbetoemploythefindingsofbehavioraleconomicsandseeifthatchangesdriverresponse.Classicaleconomicsisbasedondecisionmakersbeingrationalutilitymaximizers.However,realdecisionmakerstendtobemorefocusedongainsandlossesrelativetoareferencepointasopposedtotheabsolutevalue of a metric of interest. In particular, they tend to exhibit strong loss avoidance. Wehypothesizedthatperhapswhendriversaresurveyed,theyviewtheuseofthetoll roadasagainintime,butwhentheyareactuallydriving,theyviewuseofthetollroadastheavoidanceofaloss.Thus,thetollratessetbasedontheinitialsurveymightbetoolowtodeterentry.Thisbehavioriscapturedviaprospecttheory,whichreplacesaconventionalutilityfunctionwithavaluefunctioncenteredonareferencepoint(KahnemanandTversky1979).
Toconsiderthishypothesis,wedevelopedaMonteCarlosimulationofdriverdecisionmaking.Wegeneratedasyntheticpopulationof1000drivers,eachwithadifferenttimevalueofmoneysampledfromalognormaldistribution.Toparameterizethedistribution,weobtainednationalhourlywagedata fromtheUSBureauofLaborStatistics (NBLS2015)Weassumedthateachdriver's timevalueofmoneywasequivalent tohisorher randomly sampledwage.We thengeneratedaprospecttheorystylevaluefunctionformoneywithanintentionallyexaggerated

93
penaltyfor lostmoney.Forthesakeofsimplicity,weassumedthateachdriverhadthesamevaluefunctionandreliedoneachdriver'stimevalueofmoneyfordifferentiation.
To generate thedemand curve,weused the value function to assess eachdriver's value foreach option: enter the toll road or remain on the untolled road.We then computed thesevaluesoverdifferenttolllevelsanddifferentanticipateddelaysontheuntolledlanes.Inshort,if the valueof taking the toll roadexceeds the valueof remainingon theuntolled road, thedriverwillchoosetoenterthetollroad.Whenthesedecisionsareaggregatedovertheentiresimulated population, we obtain a demand curve for the toll road that can be recomputedbasedontheanticipateddifferenceintraveltimebetweenthetolledanduntolledroads.
We generated demand curves for two different reference points: first, when drivers viewedswitchingtothetollroadasagainintime,andsecondwhentheviewedtheswitchingtothetollroadasavoidingalossintime.Interestingly,thetwoscenariosresultedinidenticaldemandcurves, one of which is depicted in Figure 22. In retrospect, this should not have beensurprising.Whilethetwoscenariosproducedverydifferentvaluesforeachdriver,theorderofpreferencedidnotchangeforanygivendriver. Inessence,theincreaseinthefidelitydidnothaveanimpactontheoutcome.Unfortunately,thismeansthatthisapproachfailedfromthestandpointoffindinganomalousdriverbehavior.Inotherwords,ifthiswereallwehaddone,wewouldnothavefoundthebifurcationpoint.
Figure22-Simulateddemandcurvegeneratedusinganassumed20minutedifferenceintraveltimebetweenthetolledanduntolledroads
0
20
40
60
80
100
120
0 200 400 600 800 1000 1200
TollRa
te($
)
TollRoadDemand(#ofdriversentering)
SimulatedTollRoadDemandCurve(20minutetimedifferential)

94
Of course, the behavioral economic view is not the only way we could alter the classicaldemandmodel. Information economics is concernedwith incomplete information, signaling,and their impact onmarkets. In the case of the dynamically tolled roads, as was previouslysuggested,thecurrenttollcouldserveasignaltodrivers.Driversmightassumethatthehigherthetoll,themorecongestionthereisontheuntolledroad.Thiseffectivelycreatesatwo-waycoupling between the driver decisionmakingmodel and the trafficmodel.Meaning for anygiventolllevel,thedriverwouldmentallytranslatethatintoanexpectedincreaseintraveltimeifheorshedecidestoremainontheuntolledroad.Beforecreatingaverydetailedmodelofthiscoupling,wewanttodetermineisifitisevenrelevant(i.e.,isthereeventhepossibilityofrevealing a bifurcation point?). Consequently, we modified our simulation by replacing thedelay parameterwith a function thatmapped the current toll level to thedriver's perceiveddelay.Intuitively,weexpectedthisrelationshiptobeconvex.Sowepostulatedafunctionsuchthat the driver expects the toll to increase exponentially as the delay on the untolled roadincreases.TheresultwasthedemandcurvedshowninFigure23.
Figure23-Simulateddemandcurvegeneratedusinganassumedconvexrelationshipbetweentheexpecteddelayandthetolllevel
Notethatweimmediatelyseethebifurcationthatwewerelookingfor.Atthehightolllevels,thetollservesasadeterrenttoentryandweseeaclassicaldemandcurve. However,atthelowertolllevels,thedemandcurvereversesdirections,andweseethatmoredriversenterthetoll road as the toll increases. This non-classical demand response is qualitatively consistentwithwhatwasobservedintheJansonandLevinson(2014)studyinMinneapolis.
0
20
40
60
80
100
120
0 50 100 150 200 250 300 350
TollRa
te($
)
TollRoadDemand(#ofdriversentering)
SimulatedTollRoadDemandCurve(Convexpricesignal)

95
Actually, there is a secondbifurcationpoint, though it is harder to see.At very low,but notzero,toll levelsthedemanddropstozero. Inessence,driversconcludefromthelowtollthatcongestionmustbesolowontheuntolledroadthatnoonethinksitisworthpayingthetoll.
Fromhere, it ispossibletorunmanyadditionalexcursions, forexamplechangingthedriver'sbeliefintherelationshipbetweenthetolllevelandcongestiontobesaylinearorconcave.Theformer results in a vertical demand curve (i.e. fixed demand), and the latter results in theopposite response to theconvex relationship.Bothcases seem implausible in the realworld.Butreally,suchexcursionsareunnecessaryforthepurposesofthisexample.Ourobjectiveinthis exercisewas simply todetectpotential bifurcations in theassumeddriverbehavior, andthiswasaccomplishedwithanextremelyrough,low-fidelitysimulation.
Themostobviousapproachfromherewouldbetofullycouplethedriverdecisionmodelwiththetrafficmodel,wherethedriverviewsthetollasasignalforprice.Evenitifwerenotentirelyprecise,itwouldgivetheanalystafeelforhowthebifurcationpointsindriverbehavioraffectthe traffic flowon the roads. This couldallowexperimentationwithdifferent toll schedules,moretargetedsurveysofdriverstocapturetheeffect,etc.Ofcourse,weveryquicklyendupbackinourfidelitytrap.Thereareadditionalpossiblefeedbackloopsthatcouldcomeintoplaywiththissimulation.Driversmayadjusttheirperceptionofthedelayversusthetollovertime,commutingpatternsmay change, etc.How couldwe account for all of thepossibilities? Therealityisthatwecannot.
However, simply being aware of the existence of the bifurcation point opens up otherstrategiesbeyondjusttryingtofindtheoptimaldynamictollingapproach. For instance,tollscouldbesetonafixedschedulebasedontypicaldemandandonlyupdatedaquarterlybasis.Thisdefeatstheuseofthetollasasignalforcurrenttrafficconditions.Thisiswhatisdoneforatoll road inSingaporethathasbeenshowntobeeffective(OlszewskiandXie2005).Anotherapproachmightbetoprovideestimatedtraveltimeforthetollroadandnon-tolledalternativesalongwith the current toll information. Simulations could be used to explore these policies,too.Theremaybeotherpossibilitiesaswell,butnoneofthesewouldhavebeenconsideredifwehadsimplyproceededwithourinitialmodel.
DISCUSSION
Establishing the existence of a bifurcation point provides a great deal of value to a decisionmaker.Heorshecandecidewhetherornottoattempttoreducetheuncertaintysurroundingthe bifurcation by actions such as identifying early warning indicators, collecting additionaldata, conducting pilot tests, creating contingency plans, purchasing options, etc. If multi-modelingcanprovideameanstoidentifyrelevantbifurcationpoints,thenitprovidesvaluetothedecisionmaker.
PennockandRouse(2014,2016)arguedthatwhenrealdecisionmakersarefacedwiththesortofepistemicuncertaintieswehavediscussedinthispaper,theyemploysomecombinationoffourbasicstrategies:optimize,adapt,hedge,andaccept.Whenepistemicuncertaintyislow,itisreasonableforonetosearchforanoptimalsolution.Notethatthis includescircumstances

96
whereuncertaintiesarealeatoryanditissafetoaddsummaryriskmeasuressuchasvariancestotheobjectivefunctiontoachievethedesiredbalancebetweenuncertaintyandperformance.Additionally,epistemicuncertainty intheformofparametricuncertaintymaybemanageableusingUQandMDOtechniques. Finally,knownandwellunderstoodphaseshiftscanevenbehandledviacontrolledmodelswitchingorincreasingfidelity.
As the levelofepistemicuncertainty increases in the formofuncertainty inphase,structure,andontology,optimizationbecomesproblematicforallofthereasonsdiscussedinthispaper.Ifthedecisionmakerdoesnotknowtheoptimalsolution,thenheorshewouldprefereithertoplantoadapttochangingcircumstancesorhedgethedecision(i.e.,investresourcestoprovidesomeformofinsurance).Fromamodelingstandpoint,supportinganadaptorahedgestrategyunder substantial epistemic uncertainty can result in a very different approach than thatemployedforsupportinganoptimizationstrategy.
In short, theobjective shifts from finding the global optimal solution to finding a reasonablelocalsolutioncoupledwithknowledgeofthebifurcationpointsatwhichthissolutionbecomesinvalid.Inessence,thebifurcationpointsconstitutemodeshiftsinthesensethatthedecisionmaker would need to shift to a different mode of operation if the bifurcation point werecrossed. Under thesecircumstances, it isbeneficial to thedecisionmaker ifonecanat leastdetermine theexistenceofbifurcationpoints even if onedoesnot knowexactlywhere theyare.
Ifthedecisionmaker'ssituationissuchthatheorshecanrapidlychangepoliciesorsolutions,thenheor shemay choose towatch for impendingor actual bifurcations in the real systemduringoperationsandadaptasnecessary.Alternatively,ifthedecisionmakerdoesnotbelieveheorshecanrespondquicklyenough,heorshemaychoosetohedgethedecision.(Thisoccursin financialmarkets all of the time.) In either case, the decisionmaker needs to be at leastawareoftheexistenceofthebifurcationpointsinordertotaketheappropriateaction.
CONCLUSIONS
In this sectionweconsideredthechallengeofmanagingepistemicuncertaintywhenbuildingmulti-modelsofenterprisesystemsfordecisionsupport. Weconcludedthatdevelopingverydetailedmulti-modelsinordertofindoptimalsolutionsisnotlikelytobecosteffectivebecausesuch approaches are quickly overwhelmed by epistemic uncertainty in the form of phase,structural, and ontological uncertainty. These sources of epistemic uncertainty are moremanageable for physics-based systems, but the complexity of social systems makes themproblematic forenterprise systems. This is inpartbecausehumanbeings intentionally learnandaltertheirbehaviorinresponsetointerventions.
We characterized these sources of uncertainty as bifurcations, and defined the objective ofmulti-modeling of enterprise systems as the identification of the existence of thesebifurcations. Once they are identified, decision makers can develop strategies to adapt orhedgeinresponseeveniftheycannotbepreciselyquantified.Ofcourse,thisisnotapanacea,

97
andsometimestheonlychoiceistriedandtrueempiricalmethods(e.g.,experimentationandtesting).
This brings us back to ourmotivating example, the dynamically tolled road. How could thisdecisiondilemmahavebeenhandleddifferently?Acknowledgingsubstantialhindsightbias,asimplemulti-model thatcapturedthe largerdriverdecisioncontextmighthaverevealedthatotherfactorscouldoverwhelmthepriceasadeterrenttoentry.Theexamplerevealedthatthisdoes not require an in depth understanding of economics. A coarse implementation of theconceptmaybesufficient.Ofcourse,thisbegsthequestionofwhichstructuralandontologicalvariations a modeler should try. An intriguing possibility is that scientific sub-disciplinesthemselves could serve as a guide, since each likely evolved in response to encounteredbifurcations in thesystemof interest.Consequently, itmaybepossible toguidemodelers tothe appropriate structural variations based on the circumstances of their question. Furtherinvestigationofthispotentialapproachwillbethesubjectoffuturework.
So does where does this leave us with regard to analyzing enterprise systems? Figure 24summarizes the situationwith regard to increasing epistemic uncertainty.Obviously, if thereare no sudden structural changes in the system, then conventional engineeringmodeling issufficient. Evenwhen there are behavioral shifts, these are sometimeswell understood andpredictable.Thesetypesofshiftscanbecapturedinasinglemodel,andthisisthedomainofdynamical systems theory.Whathappenswhenweareawareof theexistenceofbehavioralshifts,but theyarenotexplainableorpredictablewitha singlemodel?This is thedomainofmulti-modeling.Thefactthattherearemultipleinconsistentmodelsofasystemisanindicatorof experienced behavioral shifts. That is why there are multiple models. In a sense, thesebehavioral shifts are captured in the scientific knowledge base. Given the complexity ofenterprise systems, we expect that we will often find ourselves in this circumstance whenanalyzingenterprisesystems.
Of course, we can’t expect multi-models to capture everything. There are still going to bebehavioralshiftsthathavebeenexperiencedbutnotcapturedinmodelsornotexperiencedatall.ThisbringsustotherightsideofFigure24.Inthecaseswhereweknowoftheexistenceofabehavioralshiftbutdonothaveagoodmodeltoexplainitsbehavior,wemaybeinterestedinearlywarning signals of impending shift. This is the domain of the statisticalwarning signalsdiscussed in Section 5. Finally, if an event is a true unknown unknown, there is noway topredictoranticipateit.Inthatcase,wehavenochoicebuttomonitorresultsandlearn.
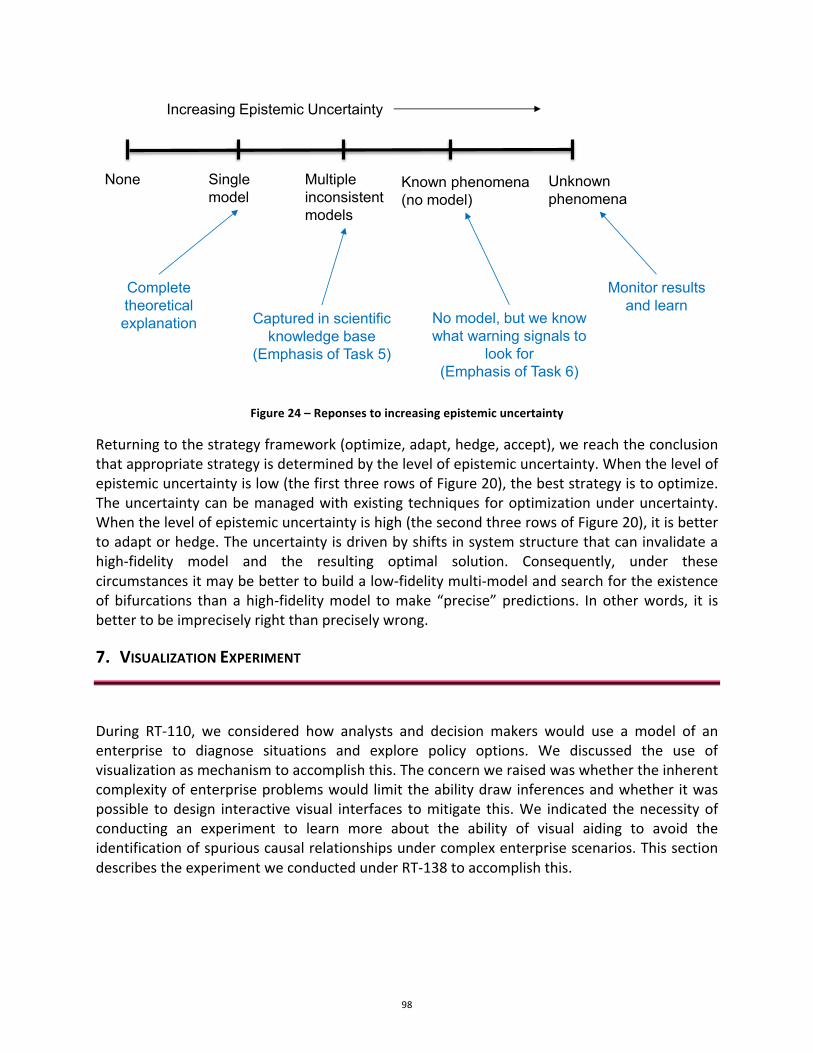
98
Figure24–Reponsestoincreasingepistemicuncertainty
Returningtothestrategyframework(optimize,adapt,hedge,accept),wereachtheconclusionthatappropriatestrategyisdeterminedbythelevelofepistemicuncertainty.Whenthelevelofepistemicuncertaintyislow(thefirstthreerowsofFigure20),thebeststrategyistooptimize.Theuncertaintycanbemanagedwithexistingtechniquesforoptimizationunderuncertainty.Whenthelevelofepistemicuncertaintyishigh(thesecondthreerowsofFigure20),itisbettertoadaptorhedge.Theuncertaintyisdrivenbyshiftsinsystemstructurethatcaninvalidateahigh-fidelity model and the resulting optimal solution. Consequently, under thesecircumstancesitmaybebettertobuildalow-fidelitymulti-modelandsearchfortheexistenceof bifurcations than ahigh-fidelitymodel tomake “precise”predictions. In otherwords, it isbettertobeimpreciselyrightthanpreciselywrong.
7. VISUALIZATIONEXPERIMENT
During RT-110, we considered how analysts and decision makers would use a model of anenterprise to diagnose situations and explore policy options. We discussed the use ofvisualizationasmechanismtoaccomplishthis.Theconcernweraisedwaswhethertheinherentcomplexityofenterpriseproblemswould limittheabilitydrawinferencesandwhether itwaspossible todesign interactivevisual interfaces tomitigate this.We indicated thenecessityofconducting an experiment to learn more about the ability of visual aiding to avoid theidentificationofspuriouscausalrelationshipsundercomplexenterprisescenarios.ThissectiondescribestheexperimentweconductedunderRT-138toaccomplishthis.
Increasing Epistemic Uncertainty
None Single model
Multiple inconsistent models
Known phenomena (no model)
Unknown phenomena
Complete theoretical explanation Captured in scientific
knowledge base(Emphasis of Task 5)
No model, but we know what warning signals to
look for (Emphasis of Task 6)
Monitor results and learn

99
BACKGROUND
Rouse, et al. (2016) conducted an enterprise diagnostic experiment in 2015 that appliedRasmussen’s abstraction-aggregation hierarchy to historical cases from the US automotiveindustry.Eachcasedealtwiththewithdrawalofabrandfromthemarket.Thesewithdrawalswere not attributable a single cause. Rather, they were the consequence of a complexinteractionoffactors.Theintentoftheexperimentwastounderstandhowsubjectswouldusedata and visualizations organized by level of abstraction to diagnose the factors thatcontributedtothecar'swithdrawalfromthemarket.TheexperimentconsistedoftensubjectsdrawnfromStevensstudentsandfaculty.Halfofthesubjectshadahigh-levelofexpertisewithregardtotheproblemandtheotherhalfhadalow-levelofexpertise.Thesubjectsweregivenhistoricalcasesrangingfromthe1930stothe2000sandaskedtoidentifyallofthefactorsthatcontributedtoeachwithdrawal.Wewillonlybrieflydescriberesultsoftheexperimenthere.
A number of metrics were collected during the experiment and analyzed via a MANOVAanalysis.Thekeyfinding(p<0.01)wasthatthe“experts”significantlyoutperformedthe“non-experts”inonlyoneera,the2000s.Thisalsohappenedtobeerawiththemostcomplexcausalrelationships. Interestingly, the experts were not faster than the non-experts. Analysis ofsubject interactionwith the interfacesuggests that theexpertssoughtmore informationandmadebetteruseoftheabstractionfiltertofacilitatesiftingthroughtheinformation.
Onepossibleexplanationisthatnon-expertshadpersonalexperiencewiththe2000sera.Theymayhaveevenownedoneofthecarsintheexperiment.Consequently,theymayhavefeltthatthey knewenough about the era such that theneed to search formore information via theinterfacewassuperfluous.Ofcourse,thisisjustspeculation,butitdoesleadtothequestionasto whether or not adding aiding that facilitates testing of hypotheses via the interactivevisualizationcanclosethegapbetweentheexpertsandnon-expertsbycounteractingthelackof information seeking behavior by the non-experts. This leads directly to the experimentperformedunderthistask.
This experiment still involves diagnosing why the car failed but the data is presented andanalyzed in a different way using a larger and more representative subject pool. First, theautomotivecasesarescoredbythecomplexityofthesituation(asdeterminedbythenumberofcontributingfactors)sothatitcanbecontrolledasanexperimentalvariable.Second,usersare able to “tag” available evidence as either suggesting or contradicting potential causalfactors.Anaidingvisualizationthensummarizestheresultsofthistaggingforthesubject.Thisenablesthemtoconsiderexplicitlytheweightoftheevidencebothforandagainstanygivenfactor. Third, engineers and managers in the automotive industry serve as the “expert”subjects. Stevens students continue to serve as the “non-experts.” This setup allows us toconsider three experimental variables: the complexity of the problem, the expertise of thesubject,andtheuseoftheaidinginterface.
Thecriticalquestion iswhetherornottheuseoftheaiding interfaceclosestheperformancegap between the experts and non-experts for the complex cases. A secondary question is

100
whetherthepresenceorabsenceoftheaidinginterfaceaffectsperformancewithintheexpertgroupitself.
AUTOMOBILEINDUSTRYAPPLICATION
As discussed above, the cases presented to the subjects are historical examples from theautomotiveindustry.Arecentlypublishedstudy(Liu,etal.,2015)addressedthewithdrawalof12carbrandsfromthemarketduringthe1930s,1960s,and2000sincludingthefollowingcars:
• 1930s:Cord,Duesenberg,LaSalle,PierceArrow
• 1960s:DeSoto,Packard,Rambler,Studebaker
• 2000s:Mercury,Oldsmobile,Plymouth,Pontiac
Thestudyfocusedonwhythesecarswereremoved.Explanationswerederivedatfourlevels:automobile,company, industry,andeconomy. Interestingly,onlyoneofthetwelvedecisionswasdrivenprimarilybythenatureofthecar.Otherforcesusuallydominated.
Data sources included quantitative data such as production levels for each car, marketsegment, and industry wide. Quantitative data also included financial information, e.g.,revenuesandprofits, forcompaniesandthe industryasawhole. Data includedtextsourcessuchastheNewYorkTimesarchive,whichcontributedalmost100articlespublishedoverthepast100yearsonthesevehicles.Avarietyofonlinesourceswerealsoaccessed.Therewerealso rich graphical components including, of course, picture of vehicles, but also pictures ofexecutives,andgraphicaltimelines.
HYPOTHESIZEDUSECASES
Thewholepointofprovidinganinteractivevisualizationforanenterpriseproblemistosupporttheuser’sforagingandsensemakingprocess.ThisprocesswasdiscussedextensivelyintheRT-110 final report (Pennock, et al. 2015). To support the development of the experimentalinterfaceandaiding,wedevelopedhypotheticalusecases thatallowedus toconsiderhowausermightmovethroughtheavailabledatatoduringthe foragingandsensemakingprocess.Weconsideredtheavailabledatafromfourlevelsofabstraction:Economy,Industry,CompanyandCar.
Problemstatement:BrandXwasremovedfromthemarket.Whydidthecompanymakethisdecision?Provideevidencetosupportyouranswer.
Therearemanywaystoapproachthisquestion.Userswithdifferent levelofexpertisemighthavedifferentapproachinsearchingfordata.AnexpertmightthinkoflookingattheCompanylevel (industry publications or the Wall Street Journal) to find direct answers. Such articlesmightattributetothewithdrawalofbrandXtodecreasingsales.

101
Liu(Liu,etal.,2015)hasshownthatthecausalchaincanbetracedbackfromthesymptoms(withdrawal) to earlier decisions (investments, acquisitions, etc.). Thus, deeper answers areneededthan“BrandXwaswithdrawnbecauseitwasnotselling.”Thegoalistosupportuserstoidentifythereasonsitwasnotselling.Theyalsoshouldbeabletodeterminethesource(s)ofthereasons.Howdidthecompanygetintothissituation?
To finddeeperanswers,onemightstartat thecar level. HowwasbrandXdoing relative tocompeting brands? Were sales in this market increasing, flat, or decreasing across allcompanies?CausesofbrandXsalesdecreasinginadecreasingmarketarelikelyverydifferentfromcausesofdecreasingsalesinanincreasingmarket.IsbrandXlosingandotherswinning,oriseverybodylosing?
Ifeverybody is losing,onemightthenmovefromcartocompanyto industrytoeconomy,todeterminewhy. If onlybrandX is losing,onewould likelyexplore the company level to seewhetherbrandX is really theproblemrather than the restof thecompany. Todetermine ifbrand X is the problem in itself, one might see how it competes with other brands in themarket.
IfbrandXisnotthesourceof itsownproblems,onewoulddigmoredeeply;onewouldlookinto company leadership and financial situations as potential reasons that brand X wassacrificed. Itcouldbethatproduct lineshadtobetrimmedandbrandXwasselectedastheleastpainfulalternative.
Anotherpathwouldarisefromdiscoveringthateveryoneislosing,butothercompaniesarenotwithdrawingbrands.Theymaybebettermanagedandhavedeeperpockets,ortheymayhaveastrategythatrequiressustainingallofitsbrands.
Basedontheresultsof theRouse,etal. (2016)experiment, theconcern is thatanon-expertwould only consider first order symptoms and jump to conclusions. Understanding theunderlyingrelationshipsandstructureofanenterpriserequirestheknowledgeand/orgenuineinterestinthatenterprise.Wouldanintuitiveinterfacemitigatethisissue?Howdifficultwoulditbetodesignanintuitiveinterfaceforaspecificenterprise?
We associatemeaning and functions to symbols that we see on daily basis. That’s howwebecame familiar and avid users of innovations and new technologies like social networking.These innovationsweredesigned forgeneralpurposes.Designingan interfacewith thesamefunctionalityinatechnologynicheareawouldbemuchmoredifficultthatthegeneralpurposeone. First, these innovations andpackages are accustomed for general purpose anddon’t fittechnicalcases.Second,it’sdifficulttodesignanintuitiveinterfaceforatechnicalpurposethatdoesn’trequiretraining.Experimentssuchthisonediscussedhereareintendedtoinvestigatetheseissues.

102
EXPERIMENTALDESIGN
The experiment is a three factor randomized design. The factors are the availability of theaiding interface, the expertise of the subject, and the complexity of the case. The responsevariableisthenumberofcorrectlyidentifiedcausalfactors.
Foraiding,therearetwolevels:aidingandnoaiding.Halfofthesubjectsreceiveaversionoftheinterfacethathasthecapabilitytotagarticlesandcollectthesetagsintosingledisplayasevidence that can be compared and contrasted. The other half subjects to not receive thiscapability.
Forexpertise,therearetwolevels:expertandnon-expert.Thiswilldeterminationismadeviathe recruitment process. Subjects were recruited from the automotive industry to serve asexperts.Non-expertswererecruitedfromtheSteven’sstudentpopulation.
Complexityisdeterminedbythenumberoffactorsthatcontributedtothewithdrawalineachcase. Thus, a “simple” case has only a few contributing factors, while a “complex” case hasseveral.
The experiment was web-based. Recruited subjects were invited to login to a website. Theinterface itself was developed using standard open source libraries. Data presented in theinterface consistedof newsarticles aswell asquantitativedata suchasproduction volumes,GDP, etc. presented in interactive graphs. User actions and responses were captured in abackend database. Each subject is randomly assigned to one era (1930, 1960, 2000) whenregistered.Aidingwasprovidedtoeveryothersubject.Eachsubjectispresentedwithfourcarsfromtheassignedera.Theyareaskedtoreviewtheavailableevidenceandidentifythefactorsthat contributed to the brand’s withdrawal for each case. The cases are sequential and thesubjectmustcompleteacasebeforemovingtothenext.
The interface itself has several components. There is an introduction for each case thatprovidesanoverviewofthebrandinquestionaswellasrepresentativephotos(Figure25)

103
Figure25-Introductionviewfromsidebar
Available data is organized into a tabbed interface. Each tab organizes data froma differentlevelofabstraction(Economy,Industry,CompanyandCar).Thesubjectmaybrowseandviewtheavailablearticlesandgraphsofquantitativedata.(Figure26)Subjectsassignedtotheaidinggroupcantagthearticleswithrelatedwordsandmarkchartsforfuturereference.

104
Figure26-Articledialogfromdashboardview
Subjects assigned to the aiding group may also access the aiding interface. (Figure 27) Theaiding interfaceconsistofchartsmarkedbythesubjectas relevantaswellasa timelinethatorganizes the tags that the subject assigned to relevant articles. The subject is able to openassociated the article and aswell as edit the tags. The intent is to support subjects as theyengageinthesensemakingprocessofposingandtestinghypotheses.
Figure27-Aidingview
RESULTSANDANALYSIS
At the time this report is waswritten, only a few subjects have completed the experiment.Consequently,weareunabletoprovidestatisticallysignificantresultsatthistime.However,wecan present analyses of the subject’s usage of the interface features. Figure 28 shows theinterfaceusagetrajectoriesforthreedifferentsubjects.

105
Figure28–InterfaceUsageTrajectoriesforDifferentSubjects
Theusagetrajectoriescanbeinterpretedinthefollowingmanner.Eachmarkerindicatesanactiontakenintheuserinterface.Foreachsubject,themarkersareorderedbythesequenceinwhichtheyoccurred.Thepositionofeachmarkeronthey-axisindicatestheactiontaken.Therelativedistancesbetweenthemarkersarenotmeaningful.Table9providesthecodingforthepositionofthemarkeronthey-axis.
Table9-InterfaceActionCoding
Code Action5 DecisionDialog4.5 Help4 Aiding3.75 Dashboard-Car3.5 Dashboard-Company3.25 Dashboard-Industry3 Dashboard-Economy2.5 Introduction-sidebar2 Description1 login
Again,whiletherearenotenoughsubjectsyettodrawstatisticallysignificantconclusions,wecanalreadyseedifferencesinusagebehavioramongthethreesubjectsshowninFigure28.Thefirstsubjectmadethemostuseoftheavailabledatabyfar,whiletheseconduseraccessedsomeofthedataforthefirstcase,andthenhardlyanyatallforthesubsequentcases.The

106
thirdsubjectfellsomewhereinbetween.Itisalsoworthnotingthatwhilethesecondsubjecthadaccesstoaiding,theyonlyaccesseditonce.So,atleastinthecaseofthissubject,thepresenceofaidingdidnotseemtoresultinstronginformationseekingbehavior.Asadditionalsubjectscompletetheexperiment,wewillbeabletodeterminewhetherornotthisisananomaly.8. REVISITINGTHEENTERPRISEMODELINGMETHODOLOGY
AstheenterprisemodelingefforthasprogressedoverseveralRTs(44,110,138),itisinstructivetorevisittheenterprisemodelingmethodologyasitwasoriginallyproposedandconsiderhowthe subsequent research has impacted it. In short, our viewhas evolved.During RT-44, theobjectivewastobuildanaccuratemulti-layermodeloftheenterpriseandthenuseitperform“what if” analyses of policy options to find the best alternative. At the time, we knew thatmodel composition was problematic (see the RT-44a Phase 2 discussion of DMMF and IBMSplash(RouseandPennock2013)),butwedidknowwhattoproposeinitsplace.
Essentially,theapproachweproposedisdepictedinFigure29.Relevantenterprisephenomenaareorganizedintolayersofabstraction.Identifythebestinbreedmodelforeachlayer.Thesemodelsarecoupledtogethertocreateasingleintegratedmodel.Thisintegratedmodesisthenusedtoperformanynecessaryanalysis.
Figure29-PreliminaryApproachtoModelingEnterpriseSystems
DomainEcosystem
SystemStructure
DeliveryOperations
WorkPractices
1. Identify the relevant layers of phenomena
2. Develop a model to represent each layer
3. Couple the models and integrate
0
0.05
0.1
0.15
0.2
0.25
0.3
0 0.2 0.4 0.6 0.8 1 1.2
Output
Input
4. Perform the analysis

107
Sincethattime,thecounterfeitpartssimulationandothercasestudiesallowedustoassessthefeasibilityofthisapproach.Weidentifiedthreeissues:
First, the nature of enterprise systemsmeans that simply adding layers to the problem cancauseasubstantial increase inepistemicuncertainty (Section6).Second,compositioncanbechallengingduetoontologicalinconsistencies(Section4).Finally,the“best”modeldependsonimpreciselyknownorunknowncircumstances(Sections3and6).
Whilecompositionof independentmodeling layersatdifferentscaleshasbeenaccomplishedfor physics based systems (with difficulty), it is not clear that this is feasible for enterprisesystems.Section4highlightsthetheoreticalrationalebehindthisdifficulty.
Consequently,modelinganenterprisesystemismoreanexerciseinmanaginguncertaintythanmaximizingpredictiveaccuracy.“Goodenough”relativetotheproblemathandshouldbethegoal, and this changes how we approach modeling enterprises. Here our experiences withdevelopingthecounterfeitpartssimulationareinstructive(Section2).
At the start of the development process for the counterfeit parts simulation, it wasconceptualized usingmultiple interacting layers of abstraction. However, it was not actuallybuilt this way. It turns out that building separate, independent layers for each model isimpractical inmanysituations.AsrevealedbytheanalysisinSection4,developingaseparatemodelforeachlayer:
• Generatesontologicalandlogicalinconsistencies
• Likelyincreasesepistemicuncertainty
• Requirestheintroductionof“fictions”tofacilitatehandshakes
• Fictionsaredeterminedviatrialanderrorandarelikelyquestionspecific
Inshort, thisapproachprobablyonlymakessense formodelingamulti-scalephysicalsystemwhere the need to repeatedly examine the same class of questions justifies the effort to“calibrate”thehandshakes.
Based on the lessons learned from the effort to develop the counterfeit parts simulation, amorepracticalapproachistoconstructafullyintegratedcoremodelthataddressesoneortwoof the layers of abstraction. In the case of the counterfeit parts simulation, the supplychain/system model forms the core. The other layers of abstractions are addressed bydeveloping peripheral models that are tailored to interact with the core. Examples in thecounterfeitpartssimulationincludethebrokerbehaviormodel,customsbehaviormodel,andtherecyclingmodel.
Thefunctionoftheperipheralmodelsto“perturb”thecoremodeltogenerateusefulinsights.For example, imposing supplier qualification policies causes “poor” programs to run out ofsuppliersmorequickly.Amajorrisktoimplementingapolicyoptioninanenterpriseiscrossinga tipping point that no one knew was there. The peripheral models can be used to trigger

108
bifurcations inthebehaviorofthecoremodel.Findingthebifurcationsdependsonexploringstructuralandontologicalvariationsontheperipheralmodel,andscientificsubdisciplinesmayserveasasourceofsuchvariations.
Whilethenaturaltendencyinenterprisemodelingseemstobetomaximizepredictiveaccuracybymaximizing the fidelity of themodel (i.e., add asmany relevant factors as possible), thisapproach has rapidly diminishing returns as this increases the degrees of freedom and risksover-fitwithsparsedata.Rather it ismoreproductivetobuildarelativelysimplecoremodelandthenselectivelyperturbitwithstructuralvariationsintheperipheralmodelstoseeifthistriggers anyunexpectedbehaviors (i.e., bifurcationsor tippingpoints). This idea is illustratedgraphicallyinFigure30.
Figure30–Revisedapproachtomodelingenterprisesystems
Thisrevisedapproachallowsonetoextractmeaningfulinsightstosupportpolicyanalysiswhilestill keeping the level of epistemic uncertaintymanageable. The conclusion thatwe reach isthat at a high-level, the multi-level approach advocated in the enterprise modelingmethodologyisvaluableforconceptualizingthemodel,butimplementingthemodelrequiresaless literal interpretation of the layers. In short, in many circumstances, the enterprisesimulationshouldnotbeaone-to-onemappingoflayertomodel.
9. HUMANITARIANRESPONSECASESTUDY
As a follow-on to the counterfeit parts case study, we sought another case study todemonstrate the effectiveness of the enterprise modeling methodology, as well as to help
DomainEcosystem
SystemStructure
DeliveryOperations
WorkPractices
1. Identify the relevant layers of phenomena
2. Identify the core and develop a model
3. Develop the peripheral models to be consistent with the core and integrate
4. Experiment with the structure of the peripheral models and look for bifurcation points
0
20
40
60
80
100
120
0 50 100 150 200 250 300 350
Output
Input

109
generaterecommendationsforitsimprovement.AvarietyofcandidateDoD-relatedenterpriseproblemswere considered, includinghumanitarian response to crises anddisasters, planningandprotectingcritical infrastructure,andevolvinganeco-systemfordesignanddevelopmentof modular systems to meet DoD needs in a cost-effective and time-critical manner. Thissectionaddressesafollow-oncasestudyinhumanitarianresponse.
BACKGROUND
Foravarietyofreasons,humanitariancriseshavebecomeincreasinglycommonandimportant.Weather may be becoming more extreme. Increased populations have inhabited areassusceptibletodisastersingreaternumbersthanbefore.Mediaisubiquitous,includingcitizenjournalists, and they broadcast the plights of imperiled populations to vast audiences,provokingpressuretorespond.
Inrecentyears,abodyofresearchhasemergedtostudyeffectivemethodsforhumanitariancrisis response (Celik et al., 2014). Some research has focused on the nature of responseproblems.Forinstance,disasterresponseisimpactedbycomplexity,whichisinturnaffectedby population density and response lead time (Christenson& Young, 2013). Most research,though, has focused on specific methods to solve types of problems in the humanitarianresponsecontext.
Humanitarian response can be considered in three phases. In the planning phase, pre-positioningof supplies is amajor concern. Duranet al. (2011) studymethods foreffectivelypre-positioningsupplies in thiscontext. In theresponsephase,agenciesdeliversuppliesandothergoodsandservicestoaffectedareas.Ekicietal.(2014)modeleffectivefooddistributionstrategiesduringpandemics. Finally, there is thepost-disasterrecoveryphase. Thisphase isoftenneglectedand can take long lead timesbefore any semblanceof normality is reached.Clearing debris after a disaster is one example. Celik et al. (to appear) develop efficientmethodsforclean-upofdebris.
Inanyhumanitariancrisis,anumberofdifferentorganizationsactandinteracttoresolvethesituation. These range from government agencies, to non-governmental organizations, toprivate-sector firms. Case studies of disaster responses by these types of organizations areusefulintermsofdevelopingeffectivepractices(Ergunetal.,2010).Inaddition,methodssuchascooperativegametheorycanbeappliedtoimproveeffectivenessofcollaboration(Ergunetal.,2014).
TheDepartmentofDefenseisakeyplayerinhumanitarianresponseintheU.S.andaroundtheworld. According to DoD Instruction 3000.05 (Stability Operations, September 16, 2009b),humanitarian relief is a “core U.S.militarymission that the Department of Defense shall bepreparedtoconductwithproficiencyequivalenttocombatoperations.”Inrecentyears,DoDhasengagedinnumeroushumanitarianmissions,rangingfromHurricaneKatrina,tothe2010Haiti earthquake, to2010monsoon floods inPakistan. DoDhasusedextensive resources insuchefforts.Dozensofships,forinstance,areusedinatypicalresponsetomanycrises(Apteetal.,2013).

110
Research has addressed a number of issues relating to DoD involvement in humanitarianresponse. Apte and Yoho (2013) study policy options for planning to determine preferredoptions for delivery of material under different conditions. Policy options include pre-positioning, proactive deployment, phased deployment and surge capacity. With a givenportfolioofsystemsandplatforms, it is importanttodeterminethebestsetofplatformsandsystemstouseinaresponsesituationintermsofeffectivenessandcost(Apte&Yoho,2014).Finally, coordination has been studied between the military and NGOs, with at least onerecommendationofbetter coordinationbetweenmilitaryandNGOefforts (Apte&Hudgens,2015).
In addition, research has looked at various DoD humanitarian response efforts to makerecommendationsonfuture improvements. Cecchineetal. (2013)reviewtheArmyresponseto the 2010 Haiti earthquake and recommend updated policies, a national framework forresponding to crises in foreign countries, improved familiarity of stakeholders withrecommendedpractices,andtheestablishmentofastandingorganizationforaddressingcrises.Moroneyetal.(2013)reviewanumberofcrisisresponseeffortsandmakerecommendationsinterms of improving DoD response efficiency, enhancing interagency coordination, improvingcoordinationwithforeigngovernmentandNGOs,andbuildinggoodwillthroughreliefefforts.PirnieandFrancisco(1998)reviewpastreliefandpeacekeepingefforts,characterizethem,andthenmakerecommendationsoneffectiveresponseprotocolsthatdonotjeopardizetheoverallDoDcapabilityforlarge-scalecombat.
Theexistingresearchhascertainlyrecognizedthemulti-stakeholdernatureofthehumanitarianresponseproblem.Clearly,itisanenterpriseprobleminnature.Majorhumanitariandisastersinvolveamultitudeofgovernmental jurisdictions. Those intheUnitedStates involvefederal,state and local authorities. At each level, there are numerous agencies that coordinateresponse,includingprovisions,watertreatment,accommodationsfordisplacedpersons,healthservices, rescue, and security, among others. In addition, non-profitNGOs and corporationstypically are involved in provisions, accommodations and health services. Those in foreigncountries similarly involve the relevantgovernmentalagenciesof theaffectedareas, theUN,U.S. federalgovernmentagenciesandNGOs. Asidefromthemultipleorganizations involved,thefollowingfeaturesmakethisanenterpriseprobleminthecontextoftheenterprisesystemsmodelingresearchforthisproject.
• Thereisnolocusofcontrol.
o Multipleagency/industrystakeholdersareaddressingtheproblem,rangingfromDoD and its services, to NGOs, to private firms. In the U.S., state and localauthorities are involved. In foreign countries, other governments and theiragenciesareinvolved,asistheDepartmentofState.
o Government agencies can promulgate policy, but must be careful of conflictsamongdifferentgovernmentsorlevelsofgovernments,aswellasthepotentialforpopulationsnottofollowdirectivesintimesofcrisis.
• Thereissignificantadaptivebehavior.

111
o Populations adapt to changing circumstances. Panicmay ensue. Populationsmayoverrunplannedevacuationroutes.Populationsmayhordesupplies.
o Lootingandothercriminalactivitymayoccur.
o Crisesmayoccurinregionswithconflicts,inwhichcasecombatantsmayadapttopoliciesandactionsaspartoftheirtacticsandstrategies.
o Policy-makersmustanticipateandadapttopotentialbehaviorsofpopulations.
• Thereissignificantcomplexity.
o There is substantive socio-technical behavior (human behavior and socialbehaviorinteractingwithtechnicalsystem).
o There are multiple organizations, processes and systems interacting withunpredictableeffects.
• Eachcrisishasuniquecharacteristics.
o While there are useful classifications, each crisis has unique characteristicsrelating tocause, scope, location,effectsonpopulations,population reactions.Inaddition,thereisaunique“enterprise”createdtoaddresseachcrisisintermsofthesetofrespondingorganizations.
Asnotedabove,eachhumanitariancrisisisunique.Thus,oneneedforenterprisemodelingistofacilitateeffectiveformationsof“pick-up”enterprisestoaddresscrises.Theissuehereistocreateamodelgenericenoughthat itwillsupply insightsuseful inavarietyofsituations,butrealistic enough that those insights are practical and useful. The model should address aparticulartypeofdisaster(e.g.,earthquake,tsunami,hurricane)andlocationtype(e.g.,majorcity, large rural or undeveloped area, foreign vs. U.S.). Data from previous similar disasterscould then be used. Then customizationwould be built in so that the user can select suchattributes as size of disaster, particular elements to include or not, and particular agenciesinvolved.
This is in line with the approach of Pirnie and Francisco (1998), who develop a series ofvignettes for different crisis types to support their recommendations. For purposes of thisinitialmodel,we select one of their vignettes to provide a concrete example for themodel,whilealsodiscussingmodelingfeaturesforhumanitarianresponseinamoregeneralcontext.Thisvignetteinvolvesmilitarysupporttoforeignauthoritiesfollowingadisastersuchasafloodor hurricane on a littoral. Major activities include search-and-rescue, evacuation, andreconstruction afterward. There is a dissident population that can hinder themission. Theparticular inspiration for this class of humanitarian responses is the Bangladesh cyclone of1991,duringwhichtheMarineswithsupportfromotherservicesprovidedreliefandsupporttoadevastatedareaofthatcountry.
112
MODELINGMETHODOLOGY
Here, we use the modified version of the enterprise modeling methodology describedpreviously. The next several sections guide development of the case study model throughthesesteps.
CENTRALQUESTIONSOFINTEREST
Heretherearetwoprimaryquestionsofinterest.Thefirstishowtoarrangeeffective“pick-up”enterprises to address crisis situations thatmay fall into broad classifications, but also haveunique characteristics. The second is given a crisis situation, what are effective enterprisepoliciesformanagingit.Potentialpolicieswouldaddressthefollowing,keepinginmindtrade-offsandanticipationofadaptivebehaviors.
• Pre-positioningofsuppliesandassets
• Pre-positioningoftrainedpersonnel
• Selection of coordination mechanisms among agencies and NGOs (including foreigngovernments)
• Reinforcement/replacement/redesignofinfrastructure
• Evacuationplanningandinter-agencycoordination
• Protocolsforcommunicatinginformationtopopulation
• Budgetingforhumanitarianefforts
• Addressingpost-crisisrecovery
KEYPHENOMENA
Forthisinitialmodel,weorganizationkeyphenomenaintothefollowinggenericcategories.
• Crisis– thenatureof thecrisis itselfand itsongoingeffectsareakeyelementofanymodel.
• Responseassets–responseassets includethreemajorelements:personnel,platformsandsystems,andsupplies.
• Supply chain flows – supply chain flows model the movement of response assetsthroughnetworksoffacilities. Indifferentlocations,assetsmaybetemporarilystored,may be consumed (in the case of supplies), or may provide services (in the case ofpersonnelandplatformsandsystems).
• Infrastructure – infrastructure consists of systems that deliver critical service such aswater or power, or that provide population-level functions such as transportationsystems.Italsoincludespermanentassetsalreadyinplacetomitigatecrisiseffects,as

113
opposed to temporary response assets. Example would be back-ups for normalinfrastructure,stormwaterbarricades,etc.
• Enterpriseactors–enterpriseactorsareorganizationsthatmaybepartofaresponsepick-upenterprise,butdonothavedirectpolicy-makingrolesinthemodel. ExamplesmaybeNGOs,privatefirmsorforeigngovernmentagencies.Itshouldbenotedthatnotallenterpriseactorsmaybeinvolvedinaresponse,aspartofthemodel’spurposeistodetermineeffectivemethodstoassemblearesponseenterprisefromasetofpotentialparticipants.
• Policy actors – policy actors, on the other hand, have policy-making roles that are ofinterest intermsofmodelingandassessingeffectiveness. Forpurposesofthismodel,welimitsuchpolicyactorstoDoDagenciesandotherU.S.governmentagencies.
• Exogenous effects – this category includes factors that are external to the directenterprise,butthathavesignificanteffectsonitsperformanceandbehavior. Fundinglevelsforinfrastructure,aggregatepopulationbehaviors,andculturalnormsandeffectsareexamples.
Thesearesimilartothecategoriesusedforthecounterfeitpartsmodel, inpartbecausebothmodelshaveasubstantiveroleforthesupplychain.However,thenatureofthecrisisproblem,asbeingcausedbyforcesexternaltotheenterprise,differs fromthecounterfeitingproblem,whichiscausedbysuppliersthatessentiallyarepartoftheenterprise.Thus,thenatureofthecrisis isaddressedasaseparatecategoryhere. Inaddition,thesupplychaindiffers inthat itfocuses on service and supply delivery rather than on manufacturing and assembly plusmaintenance and repair. Finally, infrastructure is represented since it is an importantcharacteristicofresponseeffectiveness.
The model of the specific littoral response to a hurricane crisis provides the followingphenomenatoberepresented,asshowninTable10.
Table10-Keyphenomenainlittoralresponsesituation
Category Phenomena
Crisis • Affectedareas,floodingeffects,destructionofpopulationcenters,homelessnessandpopulationdisplacement,ongoing,blockingoftrafficrouteswithdebris,effectoninfrastructure
Responseassets • Militarypersonnel–MarineExpeditionaryunit,Armyspecialforces,Armyengineercompany,helicoptersupportcompany
• Amphibiousships,docklandingships,helicopters,aircraftassetsforairliftandevacuation

114
• Potablewater,medicineandmedicalsupplies,rations
• Temporaryorconstructedsupportinginfrastructureforresponse(airport,seaport,storage)
Supplychain • Staginglocationsforresponseassetsfrominitialdeploymentlocationstolocationsofdeploymentduringcrisisandmodesoftransport
Infrastructure • Existinginfrastructureandrepairtodamage,ratherthanplanningupgradesbeforehand
• Roads,harbors,sanitationsystems,powersystems
Enterpriseactors • Civilauthorities,otherU.S.governmentagencies,NGOs,dissidents
Policyactors • DoD,Army,Marines,AirForce,Navy
Exogenouseffects • Culturalnormsdrivingdissidents,populationreactionstocrisisandaftermath
VISUALIZATIONSOFRELATIONSHIPSAMONGPHENOMENA
An initial visualizationof theenterprisephenomenawas createdusing themulti-levelmodelapproach(Rouse&Bodner,2013). This isshowninFigure31. Inthefuture,visualizationsofindividual elements within this framework would be useful. For instance, the dynamics ofpopulation movements and evacuations, or the progress of rebuilding infrastructure on theavailabilityofserviceswouldbeofinterest.

115
Figure31-Enterprisephenomenaandrelationships
KEYTRADEOFFSTHATAPPEARTOWARRANTDEEPEREXPLORATION
Here,we describe some key traded-offs for themodel to address, specifically posed for thelittoralresponsescenario.
• What is the trade-off between pre-positioning response assets versus just-in-timedeploymentintermsofcostandleadtimeresponse?
• Whataretrade-offsinvariouscommunicationmodes,frequenciesandcontenttiminginterms of desired population reaction (orderly evacuation) versus unintended effects(e.g.,panic,overcrowdingonevacuationroutes,etc.).
• Whatisthetrade-offbetweenspendingeffortnegotiatingwithdissidentsversusotheractivitiesintermsofresultsinreconstructionofinfrastructureanddeliveryofsupplies?

116
• Whataretrade-offs inmethodsforestablishingcooperationwith localcivilauthoritiesin terms of lead times and getting access to resources/locations needed for supplydeliveryandreconstruction?
• Whataretrade-offsinalternatepick-upenterprisearrangementsintermsofcost,leadtimesandresponseeffectiveness?
• Inwhatwaysshouldthepick-upenterpriseadaptunderdifferentcircumstancestobestmanagetrade-offs?
More generally, trade-offs could also focus on issues such as planned upgrades andstrengthening of infrastructure in advance of crises versus developing agile infrastructure intermsofcostandconstruction/set-up lead times,andeffectiveness. Thisparticular trade-offwouldnotapplyinthelittoralresponsescenariosincethelocationisaforeigncountrythatmaynothaveresourcestosupportsuchinvestments.
ALTERNATIVEREPRESENTATIONSOFTHESEPHENOMENA
Simulationmodeling provides three paradigms for representing phenomena. Discrete-eventmodels view the world as a series of discrete state changes and are often used to modelqueueingsystemswherecustomersorotherentitiestravelthroughaseriesofresourceswithtimedelaysforserviceattheresourcesanddelaystravellingbetweenthem.Systemdynamicsmodelsviewtheworldasasetofcontinuousflows,orcontinuousstatechanges,withfeedbackloopsandlagsmodeledintheflowsystem.Agentbasedsimulationsoperateusingadiscreteeventworldview,but the focus isonmodelingsystemelements individuallywith interactionsprovidedviamessage-passing.Table11discussesrepresentationsforthevariouscategoriesof
Table11-Representationalternatives
Category Representations
Crisis • Systemdynamicsmodelsrepresentthecontinuousimpactsofthecrisisintermsofstormprogressandgradualdegradationofpowerandwatersystems,anddisplacementofpopulationsindifferentareas.Discreteeffectsaremodeledbyvariablesthatare“triggered”byconditionsinthesystemdynamicsmodel.
Responseassets • Militaryunitsarerepresentedascomplexagentsthatperformspecializedtasks.
• Unitshaveplatformsandsystemsthatarerepresentedalsoasagents.Theseagentshavelocationandstate-basedbehaviorsforavailability.
• Supplies(potablewater,medicineandmedicalsupplies,rations)arerepresentedasvariablesindicatingcurrent

117
levelsatvariouslocations.Shipmentsofsuppliesarerepresentedassimpleagentsindicatingtheamountbeingshipped,expirationdates,etc.
• Temporaryorconstructedsupportinginfrastructureisrepresentedasagentsindicatingcurrentcapacityandstate-basedavailability.
Supplychain • Staginglocationsforresponseassetsarerepresentedasagentswithcollectionsofassetshipments.Assetsareshippedviamessage-passingwithdelaysfortransporttime.
• Alternatively,thesupplychaincouldberepresentedasadiscreteeventmodelusingtheprocess-interactionparadigm(i.e.,networkofqueues).
Infrastructure • Existinginfrastructureisrepresentedasrepresentedasagentsindicatingcurrentcapacityandcapabilityandstate-basedavailabilityanddegradation.
Enterpriseactors • Thevariousenterpriseactorsarerepresentedascomplexagentsthatinteractwithoneanother.
Policyactors • Thevariousenterpriseactorsarerepresentedascomplexagentsthatinteractwithoneanother.Theseagentshavepoliciesthatifenabledorsettocertainlevels,initiatechangesinothermodelelements.
Exogenouseffects • Culturalnormsarerepresentedasaseriesofvariables.Populationdynamicsandreactionstothecrisisarerepresentedbysystemdynamicsmodels.
ABILITYTOCONNECTALTERNATIVEREPRESENTATIONS
Similartothecounterfeitpartscasestudy,weuseAnyLogic®formodelcompositioninvolvingthese three simulation paradigms. AnyLogic is a commercially available simulation softwareused to model complex systems. It also provides a Java™ API so that domain-specificcustomizationcanbeusedtoenhancemodels.AnyLogichasprovenquitecapableformodelingthecounterfeitpartscasestudyandcomposingitsdifferentmodelelements.
COREMODELANDINTERACTINGMODELOVERVIEW
The core model consists of the response assets, the supply chain, the infrastructure, theenterprise actors and the policy actors insofar as their interactionwith the rest of the core

118
model. In terms of the littoral response scenario, the coremodel addresses the respondingunits and their systems/platforms, supplies, and temporary infrastructure items; plus thesupplychaindeliveringsupplies,systemsandplatforms,andpersonnel;andtheservices,NGOs,foreign government agencies and dissident groups. The interacting models consist of theexogenouseffectsmodelandpolicydecisionsthatausercanenablethroughthepolicyagents.
Similar to the counterfeit partsmodel, the humanitarian responsemodel is primarily agent-basedwithsomesystemsdynamics.Agent-basedrepresentationswereselectedoverdiscrete-eventrepresentationsduetotheoverallnatureofthemodelasasetofinteractingelements.In future versions of themodel, though, discrete-event representationsmay prove useful inrepresentingbusinessprocessesimportantintheoperationofmostenterprises.
FUTUREWORK
Thissectionhaspresentedaninitialmodelforhumanitarianresponse. Futureworkwill fleshout the initial model into a more fully functional model with the intent of identifyingstakeholders,developingafocusforthemodelonaparticularclassofcrisisresponsesituationsof interest,refiningandenhancingthemodel(particularlywithdatafrompastcrisisresponseefforts),andvalidatingthemodel.Inaddition,customizationswillbedevelopedthatwillallowananalysttoexperimentwithdifferentcrisis“settings”withintheparticularclassofcrisesforwhichthemodelisdesigned.Forinstance,suchcustomizationsmayrelatetothestrengthorpathofahurricaneorthedurationofflooding.
10. CONCLUSIONSANDFUTUREWORK
AspartoftheRT-44atask,weproposedaten-stepapproachtomodelingandunderstandingenterpriseswiththeendgoalofsupportingpolicymakers.RT-110andRT-138appliedandevaluatedthismethodologythroughaseriesofcasestudies,mostnotablythecounterfeitpartscasestudy.Whatwelearnedisthatwhilethesequenceofdeterminingquestionsofinterest,identifyingtheassociatedphenomena,andorganizingthemintolevelsofabstractionisusefulforconceptualizingthemodel,theimplementationrequiresalessthanliteralapplicationofthelayers.Instead,wefoundthatratherthantryingtocaptureeachlayerindetailasaseparatemodel,itisbettertoidentifythelayersthataremostrelevanttothequestionsofinterestanddevelopafullyintegratedbutrelativelysimple“core”modelofthoselayers.Theotherlayersarethenaddressedbydevelopingcompatibleperipheralmodelsthatareintendedtoperturbthebehaviorsofthecoremodel.Arelatedconclusion,isthatincorporatingadditionallayersdoesnotnecessarilyimprovethe“accuracy”ofthemodelintermsofquantitativeprediction.Rather,addingtheadditionallayersincreasesthedegreesoffreedomand,consequently,increasestheriskover-fitwhenlimiteddataisavailable(whichisthetypicalcase).Ratherthemotivationbehindaddingthelayersisto

119
uncoverthepossibilityofunexpectedorcounterintuitivebehaviors.Thisinsightwasreinforcedthroughaseriesofexpertreviewsofthecounterfeitpartssimulation.Whatweconcludefromtheresultsofthisresearchtaskisthatwhatisneededtosupportpolicymakersandanalystsconcernedwithenterprisesystemsisnotamodelthatproducesaccurateforecasts.Thisislikelyimpossible.Thesituationisthis:TheGovernmentandmanybusinessenterprisesarefairlyadeptatdevelopingfirstordermodelsofpolicyimpacts.Thisiseffectivelyanexerciseinextrapolatingthetrend.Aslongasthetrendcontinues,theseforecastsaresufficient.Thechallengeisthatsometimeshigherordereffectscanoverwhelmthefirstordereffectand/ortriggerunintended,negativesideeffects.Itisthesehigherordereffectsthatpolicymakerswouldliketoidentify.Giventheunderlyingcomplexityofenterprisesystems,itishighlyunlikelythatonewillbeabletoforecasttheseeffectswithanyprecision.However,itsometimespossibletoatleastestablishtheirpossibility.Thisiswhereenterprisemodelingapproachdevelopedthroughthecourseofthisresearcheffortcanhaveimpact.Consequently,infuturework,weintendtodevelopasystematicapproachtoidentifycounter-intuitiveresultsandpolicytippingpointswhilesimultaneouslyconsideringtheenterpriseatmultiplescalesofresolutionandmultipleperspectives.Webelievethethatcore-peripheralviewcoupledwiththemathematicalanalysisofmodelcompositionpresentedinthisreportprovideastartingpointtodevelopamoredirectedapproachtofindingthesehigherordereffectsthatwillbemoreeffectivethanrelyingonserendipity.11. REFERENCES
ABA(2012).AWhitePaperRegardingDepartmentofDefenseImplementationofSection818oftheNationalDefenseAuthorizationActforFiscalYear2012.ReportissuedbyTaskForceonCounterfeitPartsoftheCommitteeonAcquisitionReformandEmergingIssuesoftheAmericanBarAssociationSectionofPublicContractLaw,October5,2012.
Agarwal,H.,Renaud,J.E.,Preston,E.L.,&Padmanabhan,D.(2004).Uncertaintyquantificationusingevidencetheoryinmultidisciplinarydesignoptimization.ReliabilityEngineering&SystemSafety,85(1),281-294.
AIA(2011).CounterfeitParts:IncreasingAwarenessandDevelopingCountermeasures.Arlington,VA:Author.
Alderson,D.L.andJ.C.Doyle,(2010),ContrastingViewsofComplexityandTheirImplicationsforNetwork-CentricInfrastructures,IEEETransactionsonSystems,Man,andCybernetics-PartA:SystemsandHumans,40(2):839-852.
Apte,A.,&Hudgens,B.(2015).AnalysisofCapabilitiesofOrganizationsintheAreasofResponsibilityforU.S.CommandsoftheUnitedStatesNavytoHumanitarianAssistanceand

120
DisasterRelief.ReportNPS-LM-15-125.Monterrey,CA:GraduateSchoolofBusiness&PublicPolicy,NavalPostgraduateSchool.
Apte,A.,&Yoho,K.(2014).OptimizingResourcesofUnitedStatesNavyforHumanitarianOperations.ReportNPS-LM-14-180.Monterrey,CA:GraduateSchoolofBusiness&PublicPolicy,NavalPostgraduateSchool.
Apte,A.,&Yoho,K.(2013).StrategiesforLogisticsinCaseofaNaturalDisaster.ReportNPS-LM-11-188.Monterrey,CA:GraduateSchoolofBusiness&PublicPolicy,NavalPostgraduateSchool.
Apte,A.,Yoho,K.,Greenfield,C.,&Ingram,C.(2013).Selectingmaritimedisasterresponsecapabilities.JournalofSupplyChainManagement,6(2),40–58.
Barberis,N.C.(2012).Thirtyyearsofprospecttheoryineconomics:Areviewandassessment(No.w18621).NationalBureauofEconomicResearch.
Barberis,N.,P.J.Haas,C.Kieliszewski,Y.Li,P.Maglio,P.Phoungphol,P.Selinger,Y.Sismanis,W.Tan,I.Terrizzano,(2012),Splash:Acomputationalplatformforcollaboratingtosolvecomplexreal-worldproblems,IBMResearch-Almaden,http://researcher.watson.ibm.com/researcher/view_project.php?id=3931,accessed10/28/13.
Barnett,L.,Bossomaier,T.(2012)TransferEntropyasaLog-LikelihoodRatio.PhysicalReviewLetters109(13):138105.
Bartholomew,David.Knott,Martin.Moustaki,Irini.(2011)LatentVariableModelsandFactorAnalysis:AUnifiedApproach,3rdEdition.Wiley.
Bodner,D.A.(2014).Enterprisemodelingframeworkforcounterfeitpartsindefensesystems.InProceedingsofthe2014ComplexAdaptiveSystemsConference.
Bodner,D.A.(2015).Mitigatingcounterfeitpartintrusionswithenterprisesimulation.InProceedingsofthe2015ComplexAdaptiveSystemsConference.
Bossomaier,T.Barnett,L.Harre,M.(2013)InformationandPhaseTransitionsinSocio-economicSystems.ComplexAdaptiveSystemsModeling,v1,9.
Brownstone,D.,Ghosh,A.,Golob,T.F.,Kazimi,C.,&VanAmelsfort,D.(2003).Drivers’willingness-to-paytoreducetraveltime:evidencefromtheSanDiegoI-15congestionpricingproject.TransportationResearchPartA:PolicyandPractice,37(4),373-387.
BureauofLaborStatistics,(2015)“May2014nationaloccupationalemploymentandwageestimates,”http://www.bls.gov/oes/current/oesnat.htm(accessed10/12/15),UnitedStatesDepartmentofLabor.

121
BusinessInsider(2012).CounterfeitChinesemicrochipsaregettingsogoodtheycan'tbeidentified.http://www.businessinsider.com/counterfeit-parts-from-china-raise-grave-concerns-for-both-us-companies-and-national-security-2012-6.
Camerer,C.&Loewenstein,G.(2004).Behavioraleconomics:Past,present,future,inC.Camerer,C.,Loewenstein,G.&Rabin,M.AdvancesinBehavioralEconomics.NewYork,NY:PrincetonUniversityPress.
Casti,J.L.(1986).Onsystemcomplexity:Identification,measurement,andmanagement.InComplexity,language,andlife:Mathematicalapproaches(pp.146-173).SpringerBerlinHeidelberg.
Cecchine,G.,Morgan,F.E.,Wermuth,M.A.,Jackson,T.,GerebenSchaefer,A.,&Stafford,M.(2013).TheU.S.MilitaryResponsetothe2010HaitiEarthquakeConsiderationsforArmyLeaders.SantaMonica,CA:RANDCorporation.http://www.rand.org/pubs/research_reports/RR304.html
Celik,M.,Ergun,O.,Johnson,B.,Keskinocak,P.,Lorca,A.,Pekgün,P.,&Swann,J.(2014).Humanitarianlogistics.InNewDirectionsinInformatics,Optimization,Logistics,andProduction,TutORialsinOperationsResearch,(pp.18-49),P.Mirchandani(ed.)andC.Smith(seriesed.),Hanover:INFORMS.
Celik,M.,Ergun,O.,Keskinocak,P.(toappear).Thepost-disasterdebrisclearanceproblemunderincompleteinformation.OperationsResearch.
Christensen,J.K.,&Young,J.K.(2013).DriversofComplexityinHumanitarianOperations.Thesis.Monterrey,CA:GraduateSchoolofBusiness&PublicPolicy,NavalPostgraduateSchool.
Cohen,B.S.,&Lee,K.(2014).Onthelimitsoftestinestablishingproductsassurance.
CongressionalResearchService(CRS).(2005).HurricaneKatrina:DoDDisasterResponseReportRL33095.Washington,DC:Author.
Daganzo,C.F.,Gayah,V.V.,&Gonzales,E.J.(2011).Macroscopicrelationsofurbantrafficvariables:Bifurcations,multivaluednessandinstability.TransportationResearchPartB:Methodological,45(1),278-288.
DAU(2013).Anti-counterfeiting.DefenseAcquisitionGuidebook.https://acc.dau.mil/CommunityBrowser.aspx?id=638350&lang=en-US.
DeYoung,B.Barange,M.Beaugrand,G.etal(2008)RegimeShiftsinMarineEcosystems:Detection,PredictionandManagement.TrendsinEcologyandEvolution,v23,7.
Ditlevsen,P.Johnsen,S.(2010)TippingPoints:EarlyWarningandWishfulThinking.GeophysicalResearchLetters,v37,L19703.

122
DoC(2012).DefenseIndustrialBaseAssessment:CounterfeitElectronics.Report.Washington,DC:Author(Dept.ofCommerce).
DoD(2014).DefenseFederalAcquisitionRegulationSupplement:Detectionandavoidanceofcounterfeitelectronicparts(DFARSCase2012-D055).FederalRegister,79,26091-26108.
DoD(2013).DoDCounterfeitPreventionPolicy.DoDInstruction4140.67.Washington,DC:Author(Dept.ofDefense).
DoD(2011).DoDSupplyChainMaterielManagementPolicy.DoDInstruction4140.01.Washington,DC:Author(Dept.ofDefense).
DoD(2012).ProtectionofMissionCriticalFunctionstoAchieveTrustedSystemsandNetworks(TSN).DoDInstruction5200.44.Washington,DC:Author(Dept.ofDefense).
Duran,S.,Gutierrez,M.,&KeskinocakP.(2011).Pre-positioningofemergencyitemsworldwideforCAREInternational.Interfaces,41(3),223-237.
Economist(2012).Huawei:thecompanythatspookedtheworld.Author,August4,2012.
Ekici,A.,Keskinocak,P.,&Swann,J.(2014).Modelinginfluenzapandemicandplanningfooddistribution.ManufacturingandServiceOperationsManagement,16(1),11–27.
Eldred,M.S.,Swiler,L.P.,&Tang,G.(2011).Mixedaleatory-epistemicuncertaintyquantificationwithstochasticexpansionsandoptimization-basedintervalestimation.ReliabilityEngineering&SystemSafety,96(9),1092-1113.
Ergun,O.,Guyi,L.,Heier-Stamm,J.L.,Keskinocak,P.,&Swann,J.(2014).Improvinghumanitarianoperationsthroughcollaboration.ProductionandOperationsManagement,23(6),1002-1014.
Ergun,O.,Heier-Stamm,J.L.,Keskinocak,P.,&Swann,J.(2010).WaffleHouserestaurantshurricaneresponse:acasestudy.InternationalJournalofProductionEconomics,126(1),111-120.
Fry,J.(2012)Exogneousandengdogenousmarketcrashesasphasetransitionsincomplexfinancialsystems.TheEuropeanPhysicalJournalB,v85(405).
GAO(2012a).AdditionalEffortsNeededbyNationalSecurity-RelatedAgenciestoAddressRisks.ReportGAO-12-579T.Washington,DC:Author(GovernmentAccountabilityOffice).
GAO(2010).DoDshouldleverageongoinginitiativesindevelopingitsprogramtomitigateriskofcounterfeitparts.ReportGAO-10-389.Washington,DC:Author(GovernmentAccountabilityOffice).

123
GAO(2011).PeriodicAssessmentNeededtoCorrectPartsQualityProblemsinMajorPrograms.GAO-11-404.Washington,DC:Author(GovernmentAccountabilityOffice).
GAO(2012b).Suspectcounterfeitelectronicpartscanbefoundoninternetpurchasingplatforms.ReportGAO-12-375.Washington,DC:Author(GovernmentAccountabilityOffice).
Geels,FW.(2005)TheDynamicsofTransitioninSocio-technicalSystems:AMulti-LevelAnalysisoftheTransitionPathwayfromHorse-drawnCarriagesotAutomobiles1860-1930.TechnologyAnalysis&StrategicManagement,v17,4,445-476.
Guin,U.,DiMase,D.,&Tehranipoor,M.(2014).Counterfeitintegratedcircuits:detection,avoidance,andthechallengesahead.JournalofElectronicTest.
Guo,S.Seth,A.Kendrick,K.Zhou,C.Feng,J.(2008)PartialGrangercausality-EliminatingExogenousInputsandLatentVariables.JournalofNeuroscienceMethods,v172,79-93.
Haimes,Y.Y.(1981).Hierarchicalholographicmodeling.Systems,ManandCybernetics,IEEETransactionson,11(9),606-617.
Hall,A.D.(1989).Metasystemsmethodology:anewsynthesisandunification.Pergamon.
Harvey,D.L.andM.Reed,(1996),SocialScienceastheStudyofComplexSystems,inL.D.KielandE.Elliot(Eds.),ChaosTheoryintheSocialSciences:FoundationsandApplications,AnnArbor:TheUniversityofMichiganPress.
Hlavackova-Schindler,K.Palus,M.,Vejmelka,M.Bhattacharya,J.(2007)CausalityDetectionBasedonInformation-TheoreticApproachesinTimeSeriesAnalysis.PhysicsReport,v441,1-46.
HNTBCorporation,(2010).“Atlantaregionalmanagedlanesystemplanfinalreport,”http://www.dot.ga.gov/BuildSmart/Studies/ManagedLanesDocuments/FINALREPORT.pdf(accessed10/16/15).
Ives,A.R.&Dakos,V.(2012)Detectingdynamicalchangesinnonlineartimeseriesusinglocallylinearstate-spacemodels.Ecosphere,3,art58.
Janson,M.,&Levinson,D.(2014).HOTornot:DriverelasticitytopriceontheMnPASSHOTlanes.ResearchinTransportationEconomics,44,21-32.
Kahneman,D.,&Tversky,A.(1979).Prospecttheory:Ananalysisofdecisionunderrisk.Econometrica:JournaloftheEconometricSociety,263-291.
Kantanantha,N.,Serban,N.,&Griffin,P.(2010).Yieldandpriceforecastingforstochasticcropdecisionplanning.Journalofagricultural,biological,andenvironmentalstatistics,15(3),362-380.
124
KéfiS,etal.(2014)EarlyWarningSignalsofEcologicalTransitions:MethodsforSpatialPatterns.PLoSONE9(3)
Kraskov,A.Stogbauer,H.Grassberger,P.(2004)EstimatingMutualInformation.PhysicalReviewE,v69,0006138-1.
Liu,C.,Rouse,W.B.,&Yu,Z.(2015).WhenTransformationFails:TwelveCaseStudiesintheAmericanAutomobileIndustry.JournalofEnterpriseTransformation,5(2),71-112.
Livingston,H.(2014).Avoidingcounterfeitelectroniccomponents–mythsandunreliablefacts.Presentation.BAESystems.
LivingstonH.(2007a).Avoidingcounterfeitelectroniccomponents.IEEETransactionsonComponentPackagingTechnology,30,187-189.
Livingston,H.(2007b).Avoidingcounterfeitelectroniccomponents–Part2:Observationsfromrecentcounterfeitdetectionexperiences.Report.BAESystems.
Maydeu-Olivares,Albert.Joe,Harry(2005)Limited-andFull-InformationEstimationandGoodness-of-FitTestingin2nContingencyTables:AUnifiedFramework.JournaloftheAmericanStatisticalAssociation,v100,471.
Maydeu-Olivares,Alberto&Joe,Harry(2008)AnOverviewofLimitedInformationGoodness-of-FitTestinginMultidimensionalContingencyTables.InternationalMeetingofPsychometricsSociety,253-262.
McFadden,F.E.,&Arnold,R.D.(2010).SupplychainriskmitigationforITelectronics.ProceedingsoftheIEEEInternationalConferenceonTechnologiesforHomelandSecurity,49-55.
Moroney,J.D.P.,Pezard,S.,Miller,L.E.,Engstrom,J.,&Doll,A.(2013).LessonsfromDepartmentofDefenseDisasterReliefEffortsintheAsia-PacificRegion.SantaMonica,CA:RANDCorporation.http://www.rand.org/pubs/research_reports/RR146.html
Mullen,F.E.(2013).DynamicMultilevelModelingFrameworkPhase1--Feasibility.Washington,DC:DepartmentofDefense,ModelingandSimulationCoordination,Office.
Oberkampf,W.L.,DeLand,S.M.,Rutherford,B.M.,Diegert,K.V.,&Alvin,K.F.(2002).Erroranduncertaintyinmodelingandsimulation.ReliabilityEngineering&SystemSafety,75(3),333-357.
Olszewski,P.,&Xie,L.(2005).ModellingtheeffectsofroadpricingontrafficinSingapore.TransportationResearchPartA:PolicyandPractice,39(7),755-772.
Pan,X.,&Zuo,Z.(2014).AStochasticUserEquilibriumModelandOptimalCongestionPricingwithProspectTheory.Procedia-SocialandBehavioralSciences,138,127-136.

125
Park,H.,T.Clear,W.B.Rouse,R.C.Basole,M.L.Braunstein,K.L.Brigham,andL.Cunningham,(2012),MultilevelSimulationsofHealthDeliverySystems:AProspectiveToolforPolicy,Strategy,Planning,andManagement,ServiceScience,4(3):253-268.
Pecht,M.,&Tiku,S.(2006).Bogus:electronicmanufacturingandconsumersconfrontarisingtideofcounterfeitelectronics.IEEESpectrum,43,37-46.
Pennock,M.J.&Gaffney,C.(2016).ManagingEpistemicUncertaintyforMulti-modelsofSocio-technicalSystemsforDecisionSupport,underreview,IEEESystemsJournal.
Pennock,M.J.,&Rouse,W.B.(2016),Theepistemologyofenterprises,inpressSystemsEngineering.
Pennock,M.J.,&Rouse,W.B.(2014).TheChallengesofModelingEnterpriseSystems.InProceedingsofthe2014InternationalEngineeringSystemsSymposium.
Pennock,M.J.,&Rouse,W.B.(2014).Whyconnectingtheoriestogethermaynotwork:Howtoaddresscomplexparadigm-spanningquestions.InSystems,ManandCybernetics(SMC),2014IEEEInternationalConferenceon(pp.373-378).IEEE.
Pennock,M.J.,Rouse,W.B.Bodner,D.A.Gaffney,C.,Oghbaie,M.,&Prasad,P.(2015)EnterpriseSystemsAnalysisTechnicalReportSERC-2015-TR-020-4,SystemsEngineeringResearchCenter,StevensInstituteofTechnology,Hoboken,NJ.
Perretti,C.Munch,S.(2012)Regimeshiftindicatorsfailundernoiselevelscommonlyobservedinecologicalsystems.EcologicalApplication,v22(6),1772-1779.
Pirnie,B.R.,&Francisco,C.M.(1998).RequirementsforPeacekeeping,HumanitarianAssistance,andDisasterRelief.SantaMonica,CA:RANDCorporation.
Rasiel,E.B.,Weinfurt,K.P.,&Schulman,K.A.(2005).Canprospecttheoryexplainrisk-seekingbehaviorbyterminallyillpatients?.MedicalDecisionMaking,25(6),609-613.
Reiser,M(1996)AnalysisofResidualsfortheMultinomialItemResponseModel.Psychometrika,v61,3,509-528.
Reiser,M(2008)Goodness-of-fitTestingusingComponentsBasedonMarginalFrequenciesofMultinomialData.BritishJournalofMathematicalandStatisticalPsychology,61,331-360.
Rhodes,D.H.,&Ross,A.M.(2015).InteractiveModel-CentricSystemsEngineering(IMCSE):PathfinderWorkshopReport.Technicalreport,SystemsEngineeringResearchCenter,StevensInstituteofTechnology,Hoboken,NJ.
Rodrigues,S.Barton,D.Marten,F.(2010)Amethodfordetectingfalsebifurcationsindynamicalsystems:applicationtoneural-fieldmodels.BiologicalCybernetics,v102,145-154.

126
Rosen,R.(1978).Fundamentalsofmeasurementandrepresentationofnaturalsystems(p.221).NewYork:North-Holland.
Rouse.W.B.(2012).StateofModelingandSimulationinCommercialIndustries.Atlanta,GA:TennenbaumInstitute,GeorgiaInstituteofTechnology.
Rouse,W.B.(2015).ModelingandVisualizationofComplexSystemsandEnterprises:ExplorationsofPhysical,Human,Economic,andSocialPhenomena.Hoboken,NJ:Wiley.
Rouse,W.B.,&Bodner,D.A.(2013).Multi-LevelModelingofComplexSocio-TechnicalSystems.TechnicalReportCCSE-2013-01.Hoboken,NJ:CenterforComplexSystemsandEnterprises,StevensInstituteofTechnology.
Rouse,W.B.&Pennock,M.J.(2013).Multi-LevelModelingofComplexSocio-TechnicalSystems.TechnicalReportCCSE-2013-02.Hoboken,NJ:CenterforComplexSystemsandEnterprises,SevensInstituteofTechnology.
Rouse,W.B.,M.J.Pennock.,M.Oghbaie,andC.Liu.(2016)InteractiveVisualizationsForDecisionSupport:ApplicationOfRasmussen'sAbstraction-AggregationHierarchy,UnderReview,JournalofAppliedErgonomics.
Roy,C.J.,&Oberkampf,W.L.(2011).Acomprehensiveframeworkforverification,validation,anduncertaintyquantificationinscientificcomputing.ComputerMethodsinAppliedMechanicsandEngineering,200(25),2131-2144.
SAE(2014).ComplianceverificationcriterionstandardforSAEAS6081,fraudulent/counterfeitelectronicparts:avoidance,detection,mitigation,anddisposition–distributors.http://standards.sae.org/wip/as6301/.Retrieved6/4/2014.
SandiaNationalLaboratory(2015),Dakota,https://dakota.sandia.gov/(lastaccessed3/1/15).
SASC(2012).InquiryintocounterfeitelectronicpartsintheDepartmentofDefensesupplychain.Washington,DC:Author(SenateArmedServicesCommittee).
Scheffer,M.,etal(2009)Early-warningsignalsforcriticaltransitions.Nature,461,3.
Schreiber,T.(2000)MeasuringInformationTransfer.PhysicalReviewLetters,v85,2.
SeekellDA,CarpenterSR,PaceML(2011)Conditionalheteroscedasticityasaleadingindicatorofecologicalregimeshifts.AmericanNaturalist178:442-451.
Solé,R.V.(2011).PhaseTransitions.PrincetonUniversityPress.
Sornette,D.(1998)DiscreteScaleInvarianceandComplexDimension.PhysicsReports297,239-270.

127
Stradley,J.,&Karraker,D.(2006).Theelectronicpartsupplychainandrisksofcounterfeitpartsindefenseapplications.IEEETransactionsonComponentsPackagingTechnology,29,703-705.
Tolk,A.(2003).Thelevelsofconceptualinteroperabilitymodel.ProceedingsoftheFallSimulationInteroperabilityWorkshop.Orlando,Florida,September.
Tolk,A.(Ed.).(2013).Ontology,Epistemology,andTeleologyforModelingandSimulation.BerlinHeidelberg:Springer-Verlag.
Tolk,A.(2015).LearningSomethingRightfromModelsThatAreWrong:EpistemologyofSimulation.InConceptsandMethodologiesforModelingandSimulation(pp.87-106).SpringerInternationalPublishing.
Tversky,A.,&Kahneman,D.(1992).Advancesinprospecttheory:Cumulativerepresentationofuncertainty.JournalofRiskanduncertainty,5(4),297-323.
Vallacher,R.&Nowak,A.(1997)TheEmergenceofDynamicalSocialPsychology.PsychologicalInquiry,v8,2,73-99.
Villasenor,J.,&Tehranipoor,M.(2013).Chop-shopelectronics.IEEESpectrum,50,40-45.
Walters,C.J.(1997)Challengesinadaptivemanagementofriparianandcoastalecosystems.ConservEcol.1,1.
Wang,R.(2012)Flickeringgivesearlywarningsignalsofacriticaltransitiontoaeutrophiclakestate.Nature,v492,419-422.
Wilson,J.A.(2002)Matchingsocialandecologicalsystemincomplexoceanfisheries.EcologicalSociety,11,9.
Winsberg,E.(2010).Scienceintheageofcomputersimulation.UniversityofChicagoPress.
Xu,H.,Lou,Y.,Yin,Y.,&Zhou,J.(2011).Aprospect-baseduserequilibriummodelwithendogenousreferencepointsanditsapplicationincongestionpricing.TransportationResearchPartB:Methodological,45(2),311-328.
Yan,W.Woodard,R.Sornette,D.(2010)DiagnosisandPredictionofTippingPointsinFinancialMarkets:CrashesandRebounds.PhysicsProcediav3,1641-1657.
Yao,W.,Chen,X.,Luo,W.,vanTooren,M.,&Guo,J.(2011).Reviewofuncertainty-basedmultidisciplinarydesignoptimizationmethodsforaerospacevehicles.ProgressinAerospaceSciences,47(6),450-479.


![VTU – IISc Workshop (C)RG@SERC,IISc Compiler, Architecture and HPC Research in Heterogeneous Multi-Core Era R. Govindarajan CSA & SERC, IISc govind@[csa,serc].iisc.ernet.in.](https://static.fdocuments.us/doc/165x107/56649eeb5503460f94bfc78b/vtu-iisc-workshop-crgserciisc-compiler-architecture-and-hpc-research.jpg)


![SERC[1] Copy](https://static.fdocuments.us/doc/165x107/577d21281a28ab4e1e94a21a/serc1-copy.jpg)