Step-by-Step Guide to Using eZ-Audit For Not-for-profit Schools

7STEP SCHOOL WATER AUDIT
1
The 7‐Step School Water Audit has been developed to assist students and teachers to identify existing services, appliances, and infrastructure that consume water. After following the first six steps, a report can be created to provide recommendations on water and money savings.
STEP 1
Either by brainstorming or by doing a preliminary investigation, list all activities, classes, and fixtures that use water at your school on a chalkboard. Divide into groups, if applicable, and decide where and what to audit. A list of examples is provided below. Your school may or may not have all of the items listed or may have additional items not listed.
EXAMPLES OF CLASSES AND FIXTURES THAT USE WATER ACTIVITIES AND CLASSES THAT USE WATER Animal husbandry Art lab Athletics Auto shop Cafeteria Cooking class Fire protection Heating and cooling Janitor Kitchen Landscaped areas Locker room Metal shop Nurse’s office Photo lab Printing lab Restrooms School garden Science lab Swimming pool Teacher’s lounge Wood shop
WATER USING FIXTURES Aesthetic fountain Animal watering trough Air conditioner Bathroom faucet Boiler Compressor Cooling tower Dipper well Dishwasher Drinking fountain Drip hose Fire hydrant/sprinklers Fire suppressing sprinkler Food cookers Garbage disposal Hood scrubber Hose Ice machine Kitchen faucet Laundry Newspaper printing Outdoor spigot Photo printing equipment Photo processing Refrigerator Showers Soaker hose Spa Sprinkler Steamer Swimming pool Toilet Urinal Vacuum system Vehicle washing X‐ray equipment

7STEP SCHOOL WATER AUDIT
2
STEP 2
Request past water bills, for a year if possible, from your school district or water provider. Log the monthly charges and total consumption for water use and wastewater use for each bill. Graph your results. Discuss reasons for high fluctuations in the graph and potential ways to reduce those fluctuations.
SAMPLE WATER BILL
Notice that some utilities charge for other services besides water. For this exercise, use only the water service and wastewater service sections. Record the total gallons consumed and the total charges for water and wastewater service (boxed in red). Once you collect data from all of the water bills, graph your results. (See examples on page 3.)
Some water utilities bill in cubic feet (cf) or 100 cubic feet (Ccf). To convert from cubic feet to gallons, use the following conversion rate:
1 cubic foot = 7.48 gallons 100 cubic feet = 748 gallons

7STEP SCHOOL WATER AUDIT
3
SAMPLE GRAPH OF WATER BILL DATA
$0.00
$1,000.00
$2,000.00
$3,000.00
$4,000.00
$5,000.00
$6,000.00
$7,000.00
$8,000.00Jan
Feb
Mar
Apr
May Jun Jul
Aug Sep
Oct
Nov Dec
Cost
Total Price of Water
Current Water Used
Current Wastewater
0
200,000
400,000
600,000
800,000
1,000,000
1,200,000
1,400,000
1,600,000
1,800,000
Jan
Feb
Mar
Apr
May Jun Jul
Aug Sep
Oct
Nov Dec
Gallons
Total Water Used
Total Water Consumed
Total Wastewater Consumed

7STEP SCHOOL WATER AUDIT
4
STEP 3
Locate the school’s water meter or meters, there may be a meter for indoor use and a meter for outdoor use.
There are three kinds of meters that your school may have. The oldest one is called a Circular‐Reading Meter. To read this meter, start with the dial that has the highest volume. In this case you would start with the 100,000 dial. Then read the dials in descending order. If the hand on the dial is between two numbers, read the lowest number. If your water utility charges for water in units of one hundred cubic feet (Ccf), do not read the “10” dial or the “One Foot” dial.
In this example, the Circular‐Reading Meter reads as 3,047 Ccf, which is the same as 304,700 cubic feet.
Straight‐Reading Meters and Digital Meters are easier to read. Just read the number and record. Again, some water utilities bill in 100 cubic feet (Ccf), so the last two numbers are not recorded. In this example, the Straight‐Reading Meter reads as 24 Ccf, which is the same as 2,400 cubic feet.
STRAIGHT‐READING METER DIGITAL METER
Set up a schedule to read the water meter for at least two weeks. You may want to read the meter once a day or twice a day ‐ at the beginning of school and at the end of school. Subtract your first reading from your last reading to get the amount of water used for that day or time period. Log and graph your results. Discuss reasons for high

7STEP SCHOOL WATER AUDIT
5
fluctuations in the graph. If your water utility records the water usage in gallons, record whether the reading is in gallons, Kgal (1,000 gal), or Mgal (1,000,000 gal). To convert cubic feet to gallons follow the instruction in Step 2.
To view sample water meter log sheets online go to:
City of Contra Costa, California, Water District, Water Conservation, Read Your Water Meter ‐ http://www.ccwater.com/files/MeterReadingLog.pdf
City of Antioch, California, Public Works, Water Conservation, Self Audit ‐ http://www.ci.antioch.ca.us/Environment/Water/Water‐Meter‐Reading.pdf
7STEP SCHOOL WATER AUDIT
6
STEP 4
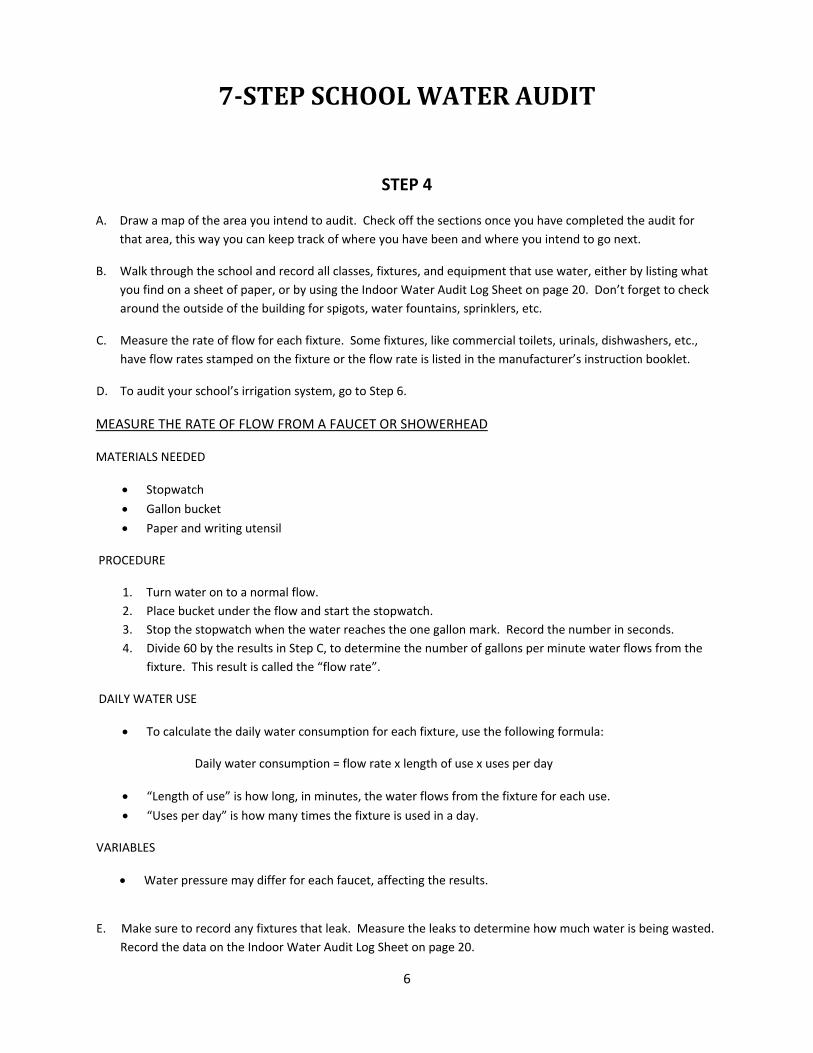
A. Draw a map of the area you intend to audit. Check off the sections once you have completed the audit for that area, this way you can keep track of where you have been and where you intend to go next.
B. Walk through the school and record all classes, fixtures, and equipment that use water, either by listing what you find on a sheet of paper, or by using the Indoor Water Audit Log Sheet on page 20. Don’t forget to check around the outside of the building for spigots, water fountains, sprinklers, etc.
C. Measure the rate of flow for each fixture. Some fixtures, like commercial toilets, urinals, dishwashers, etc., have flow rates stamped on the fixture or the flow rate is listed in the manufacturer’s instruction booklet.
D. To audit your school’s irrigation system, go to Step 6.
MEASURE THE RATE OF FLOW FROM A FAUCET OR SHOWERHEAD
MATERIALS NEEDED
• Stopwatch
• Gallon bucket
• Paper and writing utensil
PROCEDURE
1. Turn water on to a normal flow. 2. Place bucket under the flow and start the stopwatch. 3. Stop the stopwatch when the water reaches the one gallon mark. Record the number in seconds. 4. Divide 60 by the results in Step C, to determine the number of gallons per minute water flows from the
fixture. This result is called the “flow rate”.
DAILY WATER USE
• To calculate the daily water consumption for each fixture, use the following formula:
Daily water consumption = flow rate x length of use x uses per day
• “Length of use” is how long, in minutes, the water flows from the fixture for each use.
• “Uses per day” is how many times the fixture is used in a day.
VARIABLES
• Water pressure may differ for each faucet, affecting the results.
E. Make sure to record any fixtures that leak. Measure the leaks to determine how much water is being wasted.
Record the data on the Indoor Water Audit Log Sheet on page 20.

7STEP SCHOOL WATER AUDIT
7
MEASURE WATER LOST DUE TO LEAKS (FOR LEAKS CAUGHT IN A MEASURING CUP)
MATERIALS NEEDED
• Stopwatch
• Measuring cup that measures in fluid ounces
• Paper and writing utensil
PROCEDURE
1. Place the measuring cup under the leak and start the stopwatch. 2. Record how many seconds it takes to collect one ounce of water. 3. To calculate the water wasted per day from this leak, use the following formula:
1 ounce x 60 seconds x 1 gallon x 60 minutes x 24 hours = gallons of water wasted in a day # seconds 1 minute 128 fl oz 1 hour 1 day EXAMPLE: The bathroom faucet in my building has a leak. I measured the leak using the procedure above. It took three minutes and 50 seconds to measure one ounce. Three minutes and 50 seconds is equal to 230 seconds. I applied my results to the formula: 1 ounce x 60 seconds x 1 gallon x 60 minutes x 24 hours = gallons of water wasted in a day 230 sec 1 minute 128 fl oz 1 hour 1 day The result was 2.9 gallons wasted a day from this leak. If the leak is not fixed and continues for a year, the water wasted in a year from this leak is 1,058.50 gallons of water. VARIABLES
• Water pressure may differ for each faucet, affecting the results.
MEASURE WATER LOST DUE TO LEAKS (FOR LEAKS THAT FLOW OVER A SURFACE AND DO NOT HAVE A DISCERNABLE DRIP) MATERIALS NEEDED
• Stopwatch
• Dry sponge
• Ziploc plastic bag
• Towel
• Scale that measures in grams
• Paper and writing utensil
PROCEDURE
1. Measure the mass of a dry sponge inside a plastic bag. Record your results in grams.
7STEP SCHOOL WATER AUDIT
8
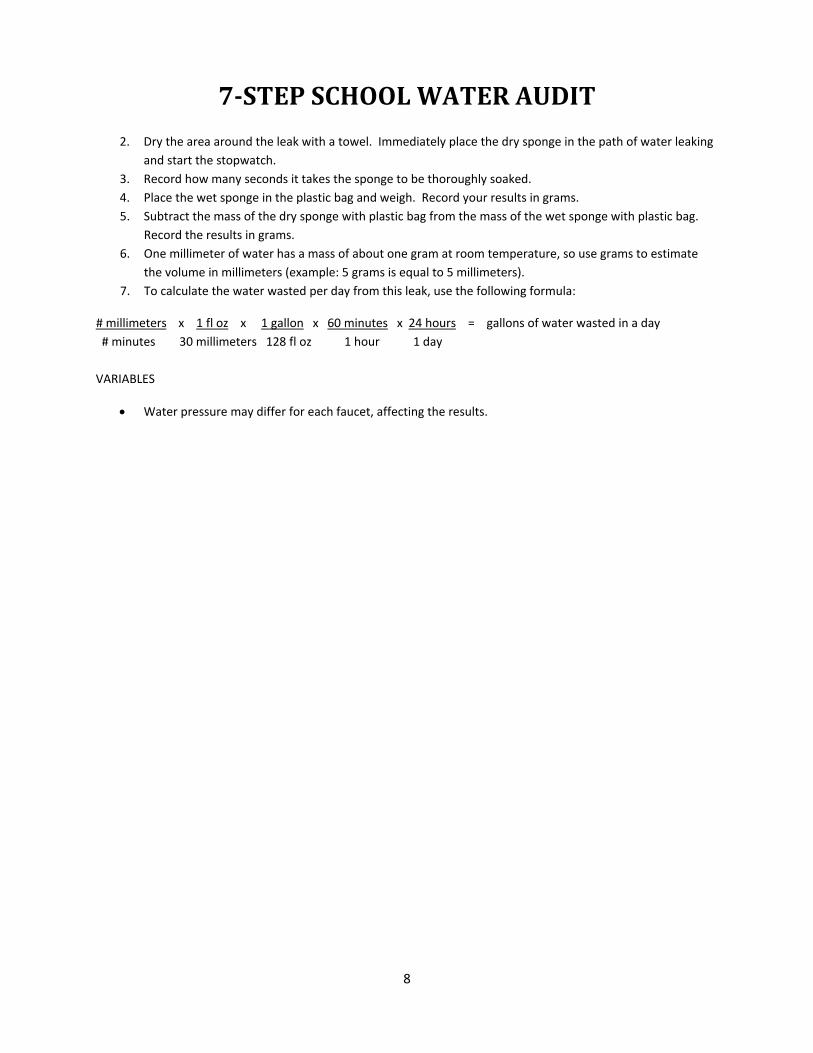
2. Dry the area around the leak with a towel. Immediately place the dry sponge in the path of water leaking and start the stopwatch.
3. Record how many seconds it takes the sponge to be thoroughly soaked. 4. Place the wet sponge in the plastic bag and weigh. Record your results in grams. 5. Subtract the mass of the dry sponge with plastic bag from the mass of the wet sponge with plastic bag.
Record the results in grams. 6. One millimeter of water has a mass of about one gram at room temperature, so use grams to estimate
the volume in millimeters (example: 5 grams is equal to 5 millimeters). 7. To calculate the water wasted per day from this leak, use the following formula:
# millimeters x 1 fl oz x 1 gallon x 60 minutes x 24 hours = gallons of water wasted in a day # minutes 30 millimeters 128 fl oz 1 hour 1 day VARIABLES
• Water pressure may differ for each faucet, affecting the results.

7STEP SCHOOL WATER AUDIT
9
STEP 5
A. Determine how long each fixture is used. You can do this by timing a random sample of students and staff on how long they use the fixture and average the results. Or you can estimate the usage, see below. For appliances or outside fixtures, such as dishwashers, laundries, sprinklers, etc., ask maintenance or school staff for the length of time each appliance or fixture is used.
WATER USE ESTIMATES (Length Of Use) Bathroom faucets – 1 minute per use
Showers – 8 minutes per use Kitchen faucets – 2 minutes per use
1999 AWWARF Study
B. Determine how many times a day each fixture is used. You can do this by surveying students and staff on how many times they use a fixture and average the results. Or you can estimate the usage, see below. For appliances or outside fixtures, such as dishwashers, laundries, sprinklers, etc., ask maintenance or school staff how many times the appliance or fixture is used in a day.
WATER USE ESTIMATES (Number Of Uses) Bathroom faucets – 4 times a day
Toilets – 4 times a day for women/girls and 1 time a day for men/boys Urinals – 3 times a day for men/boys
1999 AWWARF Study
C. Determine the school’s indoor daily water consumption and wasted water (leaks) by using data from Steps 4‐B, 5‐A, and 5‐B. Input data into the following formula:
Fixture flow rate x length of use x number of uses a day = daily water consumption
Record data on the Indoor Water Audit Log Sheet on page 20.
D. Determine the school’s indoor daily water use by adding totals from Steps 5‐C and 4‐E. Record data on the Indoor Water Audit Log Sheet on page 20.

7STEP SCHOOL WATER AUDIT
10
STEP 6 Perform an audit of your school’s irrigation system. If you are unable to perform an irrigation audit, check with your local water utility, they may provide free irrigation audits.
MATERIALS NEEDED
• 24 or more small containers of the same size, such as tuna cans or small plastic squares.
• Flag markers
• Anemometer
• Graduated cylinder (50‐100 ml)
• Soil probe
• Measuring wheel
• Pitot tube or pressure gauge
• Stopwatch/watch
• Irrigation Audit Data Sheet (Page 14)
• Writing utensil and paper
PROCEDURE
1. Inspect the site. Note the weather conditions. Measure the wind using the anemometer, if it is too windy (greater than 5 mph) you should perform the audit on another day. High wind speeds will greatly lower the irrigation distribution uniformity. If it is raining, make sure to set aside an extra catch device to measure rainfall and deduct the amount of rain collected from the catch device volume numbers.
2. Ask maintenance for permission to use the irrigation controller or have maintenance work the controller for you. You will need to run the system 3‐6 minutes for fixed spray heads and 8‐16 minutes for rotary heads (Examples of sprinkler types are on page 16). Turn the irrigation system on for a few minutes to determine if any sprinklers are broken or not operating properly. Flag each sprinkler head. Fix any minor sprinkler problems before performing the audit.
3. Check the pressure of at least one sprinkler in the area you want to audit. If the audit area has two different types of sprinkler heads, check the pressure of each type of head. Too much pressure can cause line breaks and over‐watering. Too little pressure can result in under‐watering. Optimal pressure for fixed spray heads range between 15‐30 psi. Optimal pressure for rotary heads range between 40‐45 psi.
4. Draw a map of the area to be audited. Measure the area using a measuring wheel or other type of measuring device. Record the area in square feet and mark the locations of the sprinkler heads on the map. Be sure to note any sprinkler problems and the pressure of each sprinkler type on the map. Also make note of dry or soggy areas, hardscapes, trees, or other structures that seem to block sprinkler spray.
5. Measure the plant root depth in inches using a soil probe. This is called the active root zone (RZ). The active root zone is the soil depth where the plant roots extract most of its water needs.
6. Determine the type of soil in the test area. It is necessary to know the soil type to determine the water holding capacity. An easy way to determine the type of soil is to fill a mason jar ½ full with the soil from your test site and ½ full with water. Close the lid and shake the jar. Let the jar sit for a few hours to a day, or until all of the soil has settled. Measure the percentage of each soil layer and apply to the Soil Texture Triangle on page 17. (An example of a Mason Jar Test is on page 16.)
7STEP SCHOOL WATER AUDIT
11
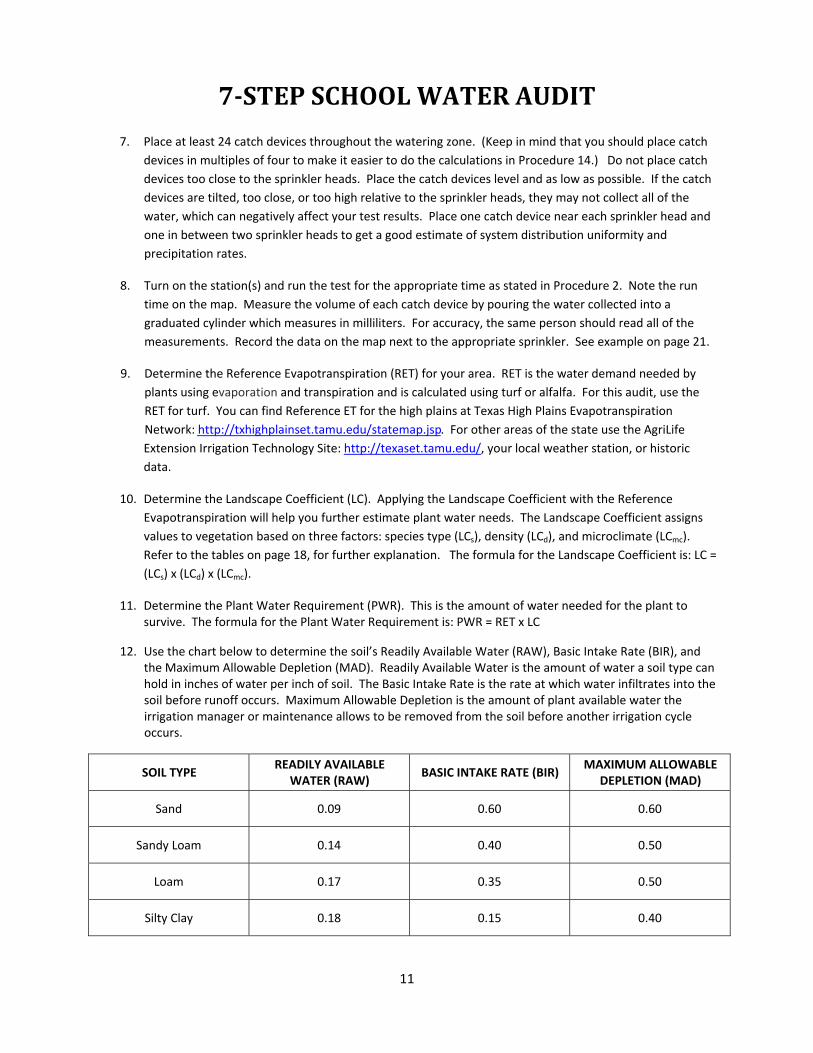
7. Place at least 24 catch devices throughout the watering zone. (Keep in mind that you should place catch devices in multiples of four to make it easier to do the calculations in Procedure 14.) Do not place catch devices too close to the sprinkler heads. Place the catch devices level and as low as possible. If the catch devices are tilted, too close, or too high relative to the sprinkler heads, they may not collect all of the water, which can negatively affect your test results. Place one catch device near each sprinkler head and one in between two sprinkler heads to get a good estimate of system distribution uniformity and precipitation rates.
8. Turn on the station(s) and run the test for the appropriate time as stated in Procedure 2. Note the run time on the map. Measure the volume of each catch device by pouring the water collected into a graduated cylinder which measures in milliliters. For accuracy, the same person should read all of the measurements. Record the data on the map next to the appropriate sprinkler. See example on page 21.
9. Determine the Reference Evapotranspiration (RET) for your area. RET is the water demand needed by plants using evaporation and transpiration and is calculated using turf or alfalfa. For this audit, use the RET for turf. You can find Reference ET for the high plains at Texas High Plains Evapotranspiration Network: http://txhighplainset.tamu.edu/statemap.jsp. For other areas of the state use the AgriLife Extension Irrigation Technology Site: http://texaset.tamu.edu/, your local weather station, or historic data.
10. Determine the Landscape Coefficient (LC). Applying the Landscape Coefficient with the Reference Evapotranspiration will help you further estimate plant water needs. The Landscape Coefficient assigns values to vegetation based on three factors: species type (LCs), density (LCd), and microclimate (LCmc). Refer to the tables on page 18, for further explanation. The formula for the Landscape Coefficient is: LC = (LCs) x (LCd) x (LCmc).
11. Determine the Plant Water Requirement (PWR). This is the amount of water needed for the plant to survive. The formula for the Plant Water Requirement is: PWR = RET x LC
12. Use the chart below to determine the soil’s Readily Available Water (RAW), Basic Intake Rate (BIR), and the Maximum Allowable Depletion (MAD). Readily Available Water is the amount of water a soil type can hold in inches of water per inch of soil. The Basic Intake Rate is the rate at which water infiltrates into the soil before runoff occurs. Maximum Allowable Depletion is the amount of plant available water the irrigation manager or maintenance allows to be removed from the soil before another irrigation cycle occurs.
SOIL TYPE READILY AVAILABLE
WATER (RAW) BASIC INTAKE RATE (BIR)
MAXIMUM ALLOWABLE DEPLETION (MAD)
Sand 0.09 0.60 0.60
Sandy Loam 0.14 0.40 0.50
Loam 0.17 0.35 0.50
Silty Clay 0.18 0.15 0.40

7STEP SCHOOL WATER AUDIT
12
Clay Loam 0.20 0.20 0.40
Clay 0.21 0.10 0.30
Irrigation Association
13. Determine the Plant Available Water (PAW) – this is the amount of water stored in the root zone to sustain plant life yet prevent runoff. Use the following formula to determine the Plant Available Water
(RZ x RAW) = PAW, in inches of water per inches of soil
For example: Turf roots in zone one measured, on average, 4 inches deep. The majority of the soil in zone one is clay loam. According to the list above, the readily available water of clay loam is 0.20 inches of water per inch of soil. To find out how much water should be applied to zone one, apply the numbers to the formula:
(4 in x .20 in) = 0.8, the Plant Available Water for zone one is 0.8 inches of water per inch of soil
14. Determine the Zone Precipitation Rate (PR) – this is the amount of water that reaches the landscape from the sprinkler, in inches per hour. Where CCavg is the average catch device volume in milliliters, multiplied by 3.66 (a constant) divided by the run time (RT) in minutes, multiplied by the catch device area (CCA) in square inches. Use the following formula:
(CCavg x 3.66) ÷ (RT x CCA) = PR, in inches an hour
For example: Data from my audit is as follows; the catch can volume average is 18.47 ml, the run time was 12 minutes, and the catch can area is 16.5 square inches. To find out what the Zone Precipitation Rate apply the numbers to the formula:
(18.47 x 3.66) ÷ (12 x 16.5) = 0.34 inches an hour
15. Determine the Distribution Uniformity (DU). Distribution Uniformity measures how evenly the sprinklers apply water to vegetation. To calculate the DU for the test area, average the lowest 25% of the catch device samples and divide it by the total sample average. For example; in my test area, I used 32 cans. The total volume of those cans was 591 ml. To get the average I divide 591 by the number of cans (32) to get 18.47 ml. To find out the lowest 25%, I multiplied 32 by 0.25 (25%) and my result was 8. So then I averaged the lowest 8 readings, and the result was 14.125 ml. To get the DU, divide the lowest 25% average catch device volume by the total catch device volume.
DU = Lowest 25% CCavg ÷ CCavg
To find out the Distribution Uniformity apply the numbers to the formula:
14.125 ÷ 18.47 =0.76.
So, the DU for my test area is 0.76 or 76%. No sprinkler system will put out 100% uniformity but if the sprinkler uniformity is less than 50%, the system should be re‐evaluated for design and/or performance. A poor DU means that the sprinkler system has to run longer and more frequently to apply the correct amount of water to the vegetation.

7STEP SCHOOL WATER AUDIT
13
16. Determine the Irrigation Water Requirement (IWR). This determines what the lowest amount of water the sprinkler system can apply to the plant before the plant gets to its permanent wilting point. The permanent wilting point is the point where the plant can no longer extract moisture from the soil and is considered dead. The formula for the Irrigation Water Requirement is: IWR = PWR ÷ DU
17. Determine the Run Time (RT) – this is the amount of time, in minutes, the irrigation system should run for efficient watering. The formula for Run Time is: RT = (IWR ÷ PR) x 60
18. Determine the Allowable Depletion (AD) for each zone. This is how long the irrigation system can go between watering in order to sustain quality plant life. To determine the Allowable Depletion for a particular soil type use the following formula: AD = PWR x MAD
19. Determine the Irrigation Days (ID). This is how many days in a particular month the irrigation system should run in order to maintain quality plant life. The formula for Irrigation Days is: ID = PWR ÷ AD
20. Determine the Suggested Run Time (SRT). This is the suggested time, in minutes, the irrigation should run to prevent runoff and still provide enough water for the plants to sustain quality life. The formula for Suggested Run Time is: SRT = RT ÷ ID
21. Determine Minutes Per Cycle (MC). This is the amount of time, in minutes, that each irrigation cycle should run to prevent runoff. The formula for Minutes Per Cycle is: MC = (BIR ÷ PR) x 60
22. Determine the Cycles Per Day (CD). This is the amount of cycles the irrigation system should run in a day to prevent runoff. The formula for Cycles Per Day is: CD = SRT ÷ MC
23. Record your results on the Irrigation Audit Sheet (page 14). After the calculations are figured, the numbers will explain the following: a) how many days the irrigation system should run in the month to provide adequate water to the plant, b) how many minutes the system should run to provide adequate water to the plant, and c) how many cycles the system should run to provide adequate water to the plant and prevent runoff.
For example: After transferring my data from the map to the Irrigation Audit Sheet (see sample on pages 21 – 23) and performing the necessary calculations, my results were as follows: In order to sustain healthy plant life and prevent runoff, I need to run my system 13 days in the month of May, at 2 cycles a day, for 24 minutes a cycle.
24. Repeat for each zone.
For online information on audits, check out these sites: Austin Water Utility Conservation Program, Irrigation Audit ‐ http://www.enewsbuilder.net/watercon/e_article000301231.cfm?x=b11,0,w Texas A & M University Agricultural Extension, Athletic Fields and Water Conservation ‐ http://itc.tamu.edu/documents/extensionpubs/B‐6088.pdf Texas A & M Cooperative Extension, Lawn Water Management – http://aggieturf.tamu.edu/files‐2005/lawn%20water%20mgmt_mcafee.pdf
7STEP SCHOOL WATER AUDIT
14
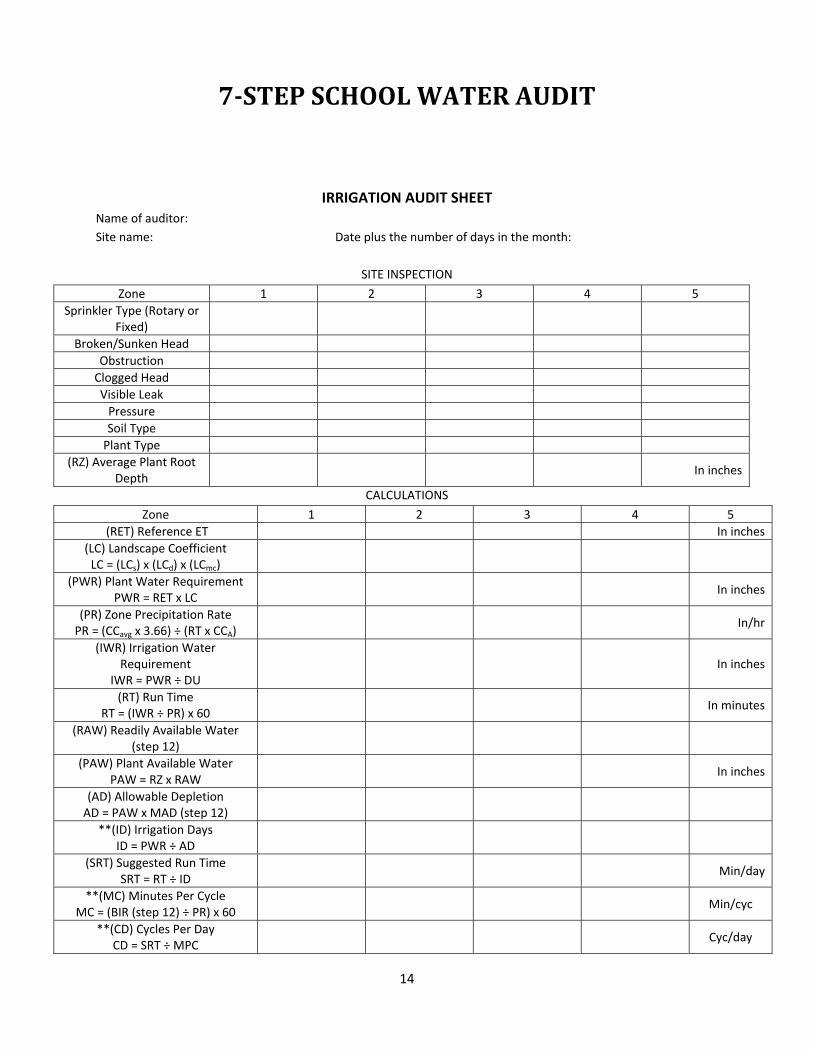
IRRIGATION AUDIT SHEET Name of auditor: Site name: Date plus the number of days in the month:
SITE INSPECTION
Zone 1 2 3 4 5Sprinkler Type (Rotary or
Fixed)
Broken/Sunken Head Obstruction Clogged Head Visible Leak Pressure Soil Type Plant Type
(RZ) Average Plant Root Depth
In inches
CALCULATIONS
Zone 1 2 3 4 5 (RET) Reference ET In inches
(LC) Landscape Coefficient LC = (LCs) x (LCd) x (LCmc)
(PWR) Plant Water Requirement PWR = RET x LC
In inches
(PR) Zone Precipitation Rate PR = (CCavg x 3.66) ÷ (RT x CCA)
In/hr
(IWR) Irrigation Water Requirement
IWR = PWR ÷ DU In inches
(RT) Run Time RT = (IWR ÷ PR) x 60
In minutes
(RAW) Readily Available Water (step 12)
(PAW) Plant Available Water PAW = RZ x RAW
In inches
(AD) Allowable Depletion AD = PAW x MAD (step 12)
**(ID) Irrigation Days ID = PWR ÷ AD
(SRT) Suggested Run Time SRT = RT ÷ ID
Min/day
**(MC) Minutes Per Cycle MC = (BIR (step 12) ÷ PR) x 60
Min/cyc
**(CD) Cycles Per Day CD = SRT ÷ MPC
Cyc/day
7STEP SCHOOL WATER AUDIT
15
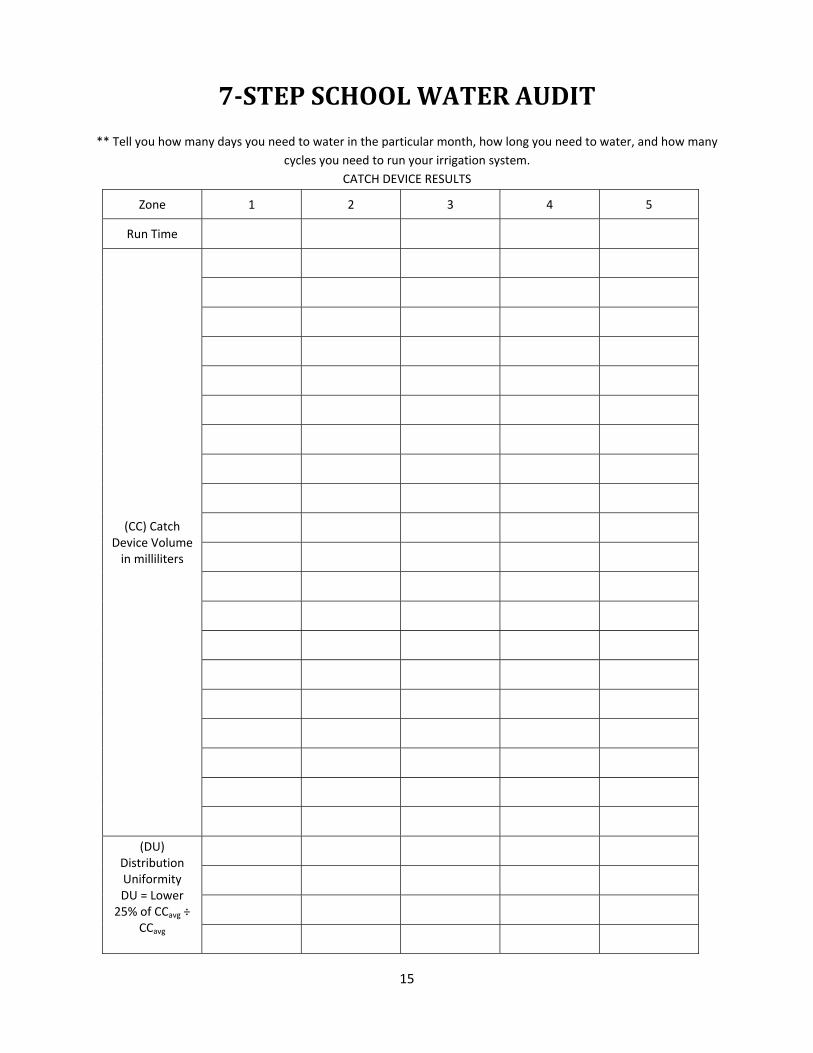
** Tell you how many days you need to water in the particular month, how long you need to water, and how many cycles you need to run your irrigation system.
CATCH DEVICE RESULTS
Zone 1 2 3 4 5
Run Time
(CC) Catch Device Volume in milliliters
(DU) Distribution Uniformity DU = Lower 25% of CCavg ÷
CCavg
7STEP SCHOOL WATER AUDIT
16
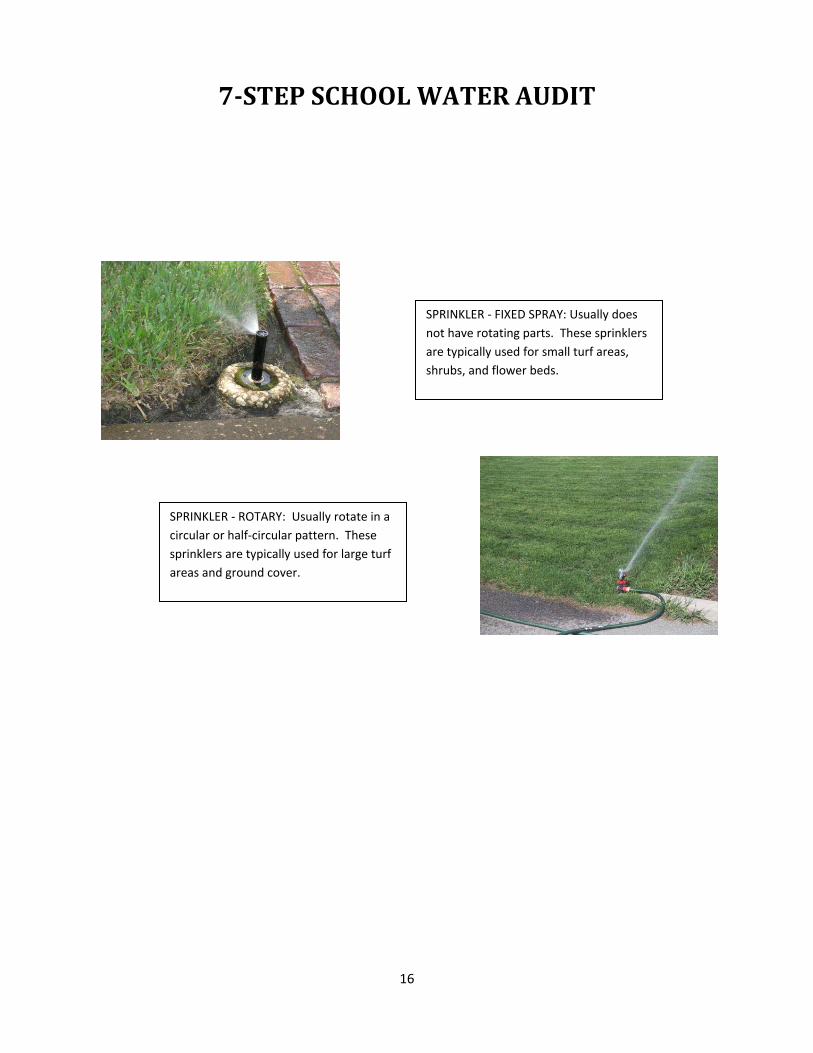
SPRINKLER ‐ FIXED SPRAY: Usually does not have rotating parts. These sprinklers are typically used for small turf areas, shrubs, and flower beds.
SPRINKLER ‐ ROTARY: Usually rotate in a circular or half‐circular pattern. These sprinklers are typically used for large turf areas and ground cover.

7STEP SCHOOL WATER AUDIT
17
MASON JAR TEST – Sand is heaviest and will settle to the bottom. Silt will settle next and then clay. Record the percentage of each three soils and then apply it to the Soil Texture Triangle (page 17). For this example assume that you have measured 10% sand, 70% silt, and 20% clay. After applying these numbers to the Soil Texture Triangle, we come up with a Silt Loam soil.
SOIL TEXTURE TRIANGLE

7STEP SCHOOL WATER AUDIT
18
Natural Resource Conservation Service
LANDSCAPE COEFFICIENT
7STEP SCHOOL WATER AUDIT
19
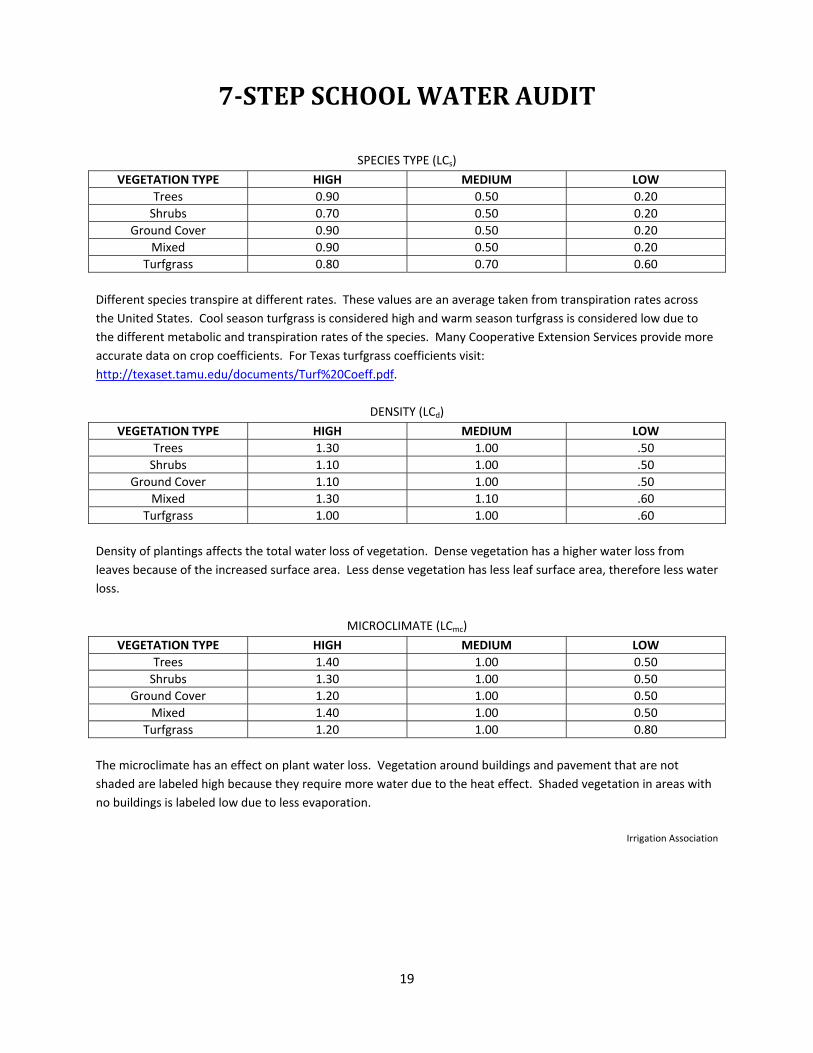
SPECIES TYPE (LCs)
VEGETATION TYPE HIGH MEDIUM LOWTrees 0.90 0.50 0.20Shrubs 0.70 0.50 0.20
Ground Cover 0.90 0.50 0.20Mixed 0.90 0.50 0.20
Turfgrass 0.80 0.70 0.60
Different species transpire at different rates. These values are an average taken from transpiration rates across the United States. Cool season turfgrass is considered high and warm season turfgrass is considered low due to the different metabolic and transpiration rates of the species. Many Cooperative Extension Services provide more accurate data on crop coefficients. For Texas turfgrass coefficients visit: http://texaset.tamu.edu/documents/Turf%20Coeff.pdf.
DENSITY (LCd)
VEGETATION TYPE HIGH MEDIUM LOWTrees 1.30 1.00 .50Shrubs 1.10 1.00 .50
Ground Cover 1.10 1.00 .50Mixed 1.30 1.10 .60
Turfgrass 1.00 1.00 .60 Density of plantings affects the total water loss of vegetation. Dense vegetation has a higher water loss from leaves because of the increased surface area. Less dense vegetation has less leaf surface area, therefore less water loss.
MICROCLIMATE (LCmc)
VEGETATION TYPE HIGH MEDIUM LOWTrees 1.40 1.00 0.50Shrubs 1.30 1.00 0.50
Ground Cover 1.20 1.00 0.50Mixed 1.40 1.00 0.50
Turfgrass 1.20 1.00 0.80
The microclimate has an effect on plant water loss. Vegetation around buildings and pavement that are not shaded are labeled high because they require more water due to the heat effect. Shaded vegetation in areas with no buildings is labeled low due to less evaporation.
Irrigation Association
7STEP SCHOOL WATER AUDIT
20
STEP 7
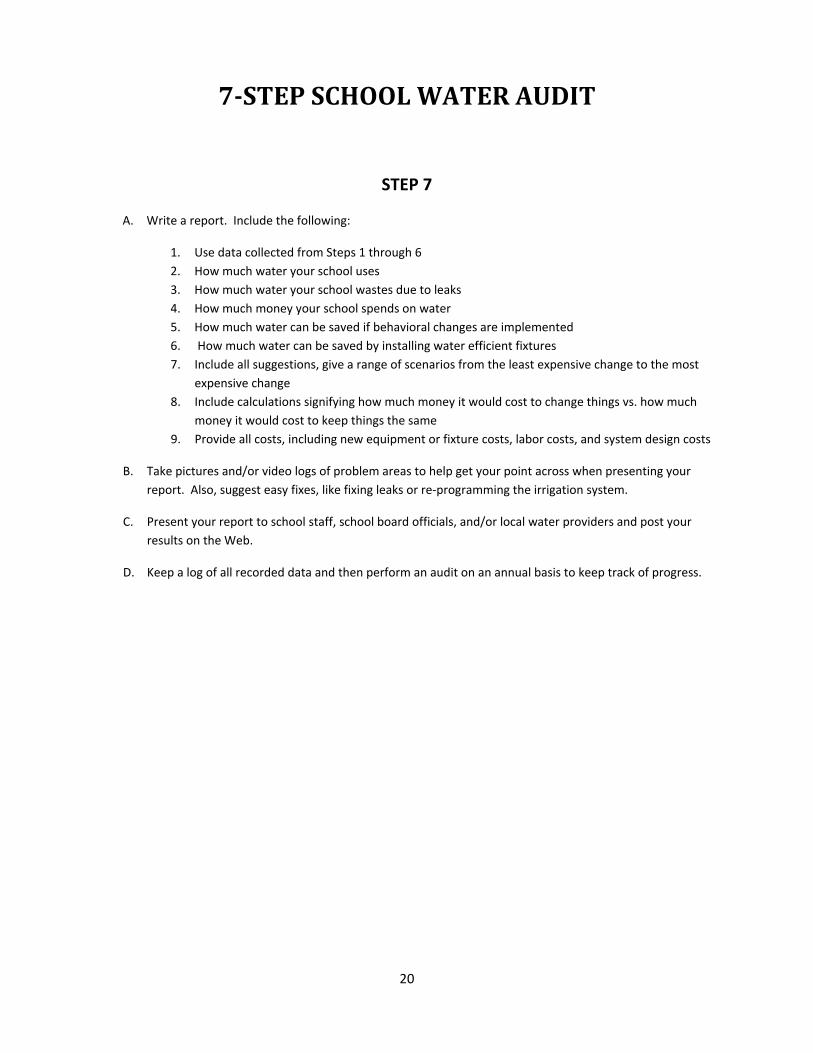
A. Write a report. Include the following:
1. Use data collected from Steps 1 through 6 2. How much water your school uses 3. How much water your school wastes due to leaks 4. How much money your school spends on water 5. How much water can be saved if behavioral changes are implemented 6. How much water can be saved by installing water efficient fixtures 7. Include all suggestions, give a range of scenarios from the least expensive change to the most
expensive change 8. Include calculations signifying how much money it would cost to change things vs. how much
money it would cost to keep things the same 9. Provide all costs, including new equipment or fixture costs, labor costs, and system design costs
B. Take pictures and/or video logs of problem areas to help get your point across when presenting your report. Also, suggest easy fixes, like fixing leaks or re‐programming the irrigation system.
C. Present your report to school staff, school board officials, and/or local water providers and post your results on the Web.
D. Keep a log of all recorded data and then perform an audit on an annual basis to keep track of progress.
7STEP SCHOOL WATER AUDIT
21
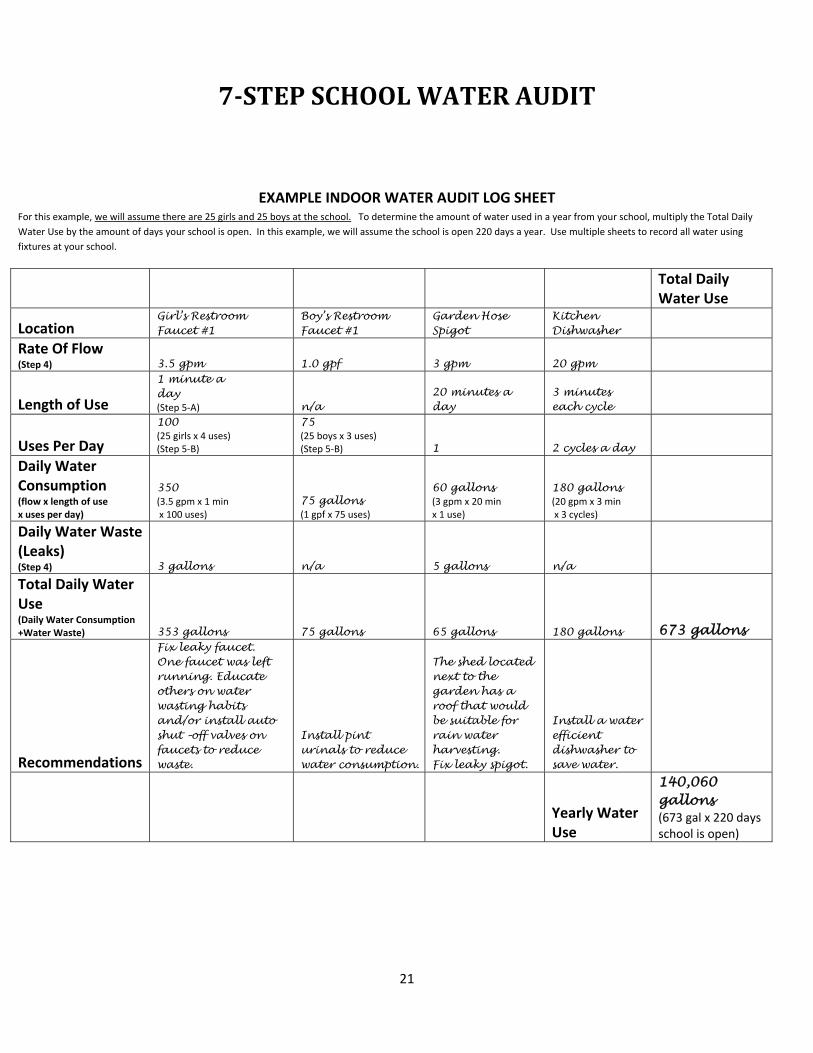
EXAMPLE INDOOR WATER AUDIT LOG SHEET For this example, we will assume there are 25 girls and 25 boys at the school. To determine the amount of water used in a year from your school, multiply the Total Daily Water Use by the amount of days your school is open. In this example, we will assume the school is open 220 days a year. Use multiple sheets to record all water using fixtures at your school.
Total Daily Water Use
Location Girl’s Restroom Faucet #1
Boy’s Restroom Faucet #1
Garden Hose Spigot
Kitchen Dishwasher
Rate Of Flow (Step 4)
3.5 gpm 1.0 gpf 3 gpm 20 gpm
Length of Use
1 minute a day (Step 5‐A) n/a
20 minutes a day
3 minutes each cycle
Uses Per Day
100 (25 girls x 4 uses) (Step 5‐B)
75 (25 boys x 3 uses) (Step 5‐B) 1 2 cycles a day
Daily Water Consumption (flow x length of use x uses per day)
350 (3.5 gpm x 1 min x 100 uses)
75 gallons (1 gpf x 75 uses)
60 gallons (3 gpm x 20 min x 1 use)
180 gallons (20 gpm x 3 min x 3 cycles)
Daily Water Waste (Leaks) (Step 4) 3 gallons n/a 5 gallons n/a
Total Daily Water Use (Daily Water Consumption +Water Waste) 353 gallons 75 gallons 65 gallons 180 gallons 673 gallons
Recommendations
Fix leaky faucet. One faucet was left running. Educate others on water wasting habits and/or install auto shut –off valves on faucets to reduce waste.
Install pint urinals to reduce water consumption.
The shed located next to the garden has a roof that would be suitable for rain water harvesting. Fix leaky spigot.
Install a water efficient dishwasher to save water.
Yearly Water Use
140,060 gallons (673 gal x 220 days school is open)

7STEP SCHOOL WATER AUDIT
22
7STEP SCHOOL WATER AUDIT
23
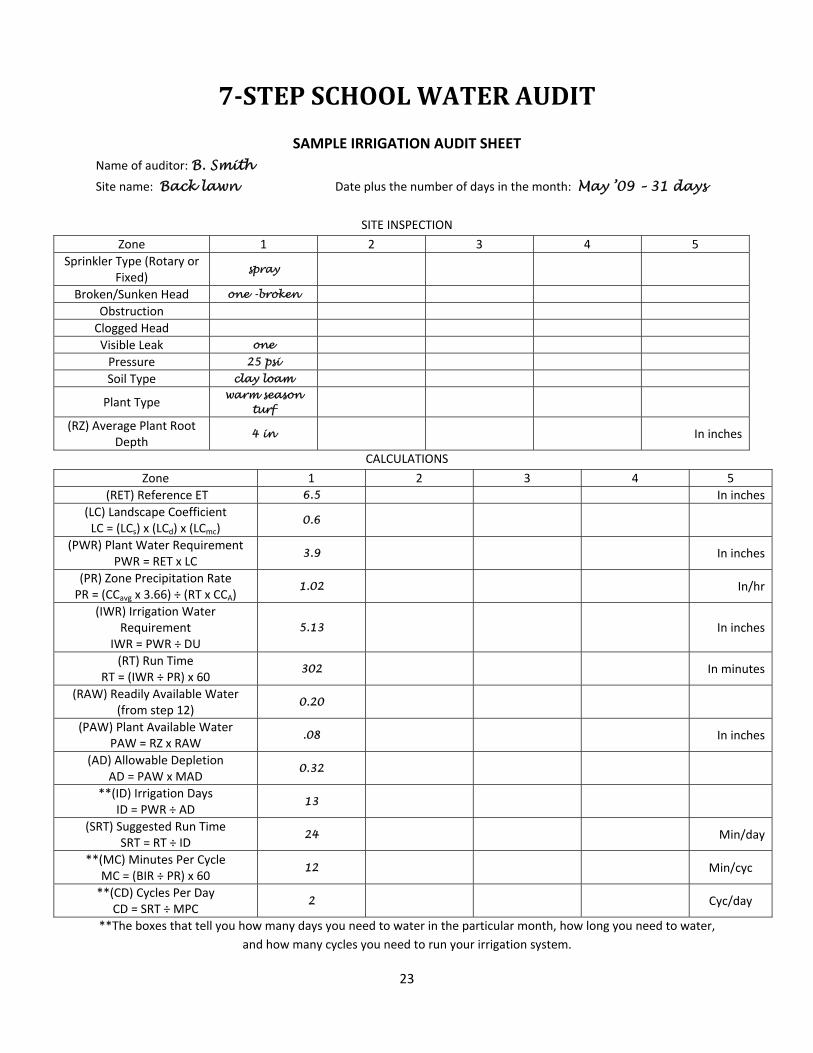
SAMPLE IRRIGATION AUDIT SHEET Name of auditor: B. Smith Site name: Back lawn Date plus the number of days in the month: May ’09 – 31 days
SITE INSPECTION
Zone 1 2 3 4 5Sprinkler Type (Rotary or
Fixed) spray
Broken/Sunken Head one -broken Obstruction Clogged Head Visible Leak one Pressure 25 psi Soil Type clay loam
Plant Type warm season
turf
(RZ) Average Plant Root Depth
4 in In inches
CALCULATIONS
Zone 1 2 3 4 5 (RET) Reference ET 6.5 In inches
(LC) Landscape Coefficient LC = (LCs) x (LCd) x (LCmc)
0.6
(PWR) Plant Water Requirement PWR = RET x LC
3.9 In inches
(PR) Zone Precipitation Rate PR = (CCavg x 3.66) ÷ (RT x CCA)
1.02 In/hr
(IWR) Irrigation Water Requirement
IWR = PWR ÷ DU 5.13 In inches
(RT) Run Time RT = (IWR ÷ PR) x 60
302 In minutes
(RAW) Readily Available Water (from step 12)
0.20
(PAW) Plant Available Water PAW = RZ x RAW
.08 In inches
(AD) Allowable Depletion AD = PAW x MAD
0.32
**(ID) Irrigation Days ID = PWR ÷ AD
13
(SRT) Suggested Run Time SRT = RT ÷ ID
24 Min/day
**(MC) Minutes Per Cycle MC = (BIR ÷ PR) x 60
12 Min/cyc
**(CD) Cycles Per Day CD = SRT ÷ MPC
2 Cyc/day
**The boxes that tell you how many days you need to water in the particular month, how long you need to water, and how many cycles you need to run your irrigation system.
7STEP SCHOOL WATER AUDIT
24
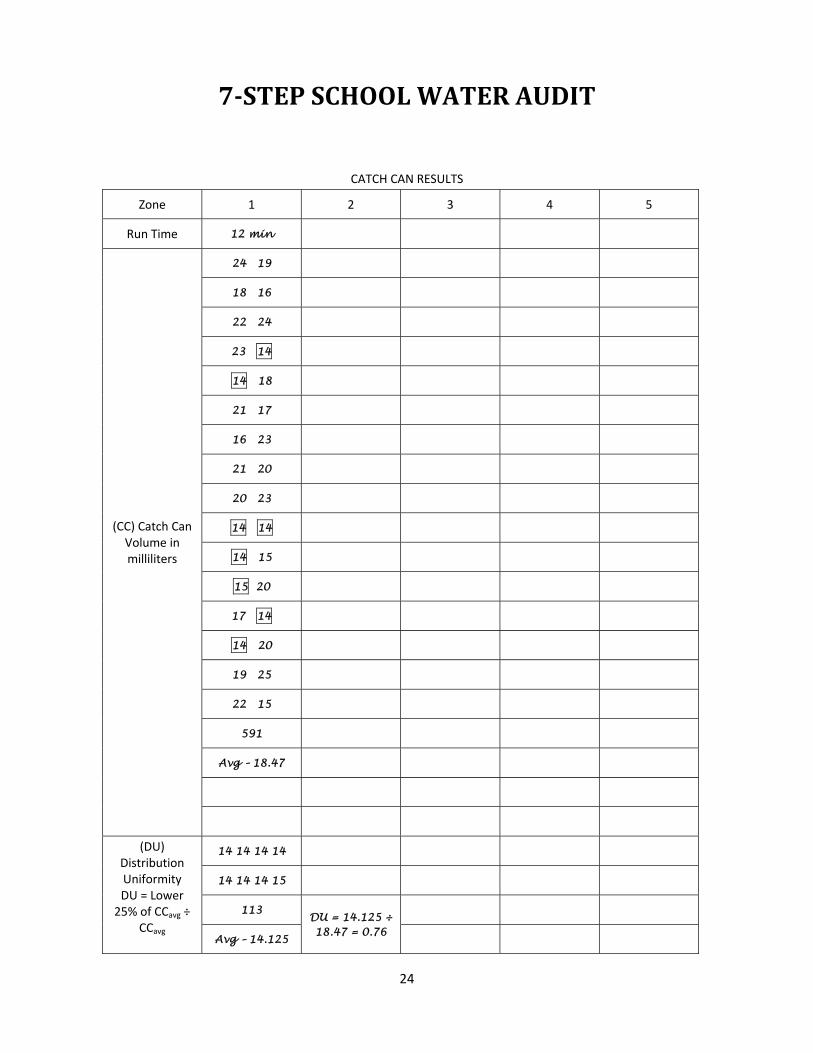
CATCH CAN RESULTS
Zone 1 2 3 4 5
Run Time 12 min
(CC) Catch Can Volume in milliliters
24 19
18 16
22 24
23 14
14 18
21 17
16 23
21 20
20 23
14 14
14 15
15 20
17 14
14 20
19 25
22 15
591
Avg – 18.47
(DU) Distribution Uniformity DU = Lower 25% of CCavg ÷
CCavg
14 14 14 14
14 14 14 15
113 DU = 14.125 ÷ 18.47 = 0.76
Avg – 14.125

7STEP SCHOOL WATER AUDIT
25
REFERENCES
1. 2005 and 1998 by the Council for Environmental Education. Reprinted with permission from the Water Watchers Conserving Water at Your School and Home. The complete Activity Guide can be obtained by attending a WET in the City workshop. For more information, please visit www.wetcity.org.
2. American Water Works Research Foundation. Commercial and Institution End Uses of Water Study. Denver, CO.: American Water Works Research Foundation, 1999.
3. Austin Water Utility Conservation Program. Do It Yourself Irrigation Audit. Austin, TX: Austin Water Utility, 2009.
4. Brown, Chris et al. Watersmart Guidebook – A Water‐use Efficiency Plan Review Guide for New Businesses. Oakland, CA: East Bay Municipal Utility District, 2008.
5. Green Plumbers. Inspection Report Services. Australia: The Master Plumbers and Mechanical Association, 2005.
6. National Environmental Education Foundation. Be Water Wise, School Water Audit. www.eeweek.org/pdf/school_water_audit.pdf, 2008.
7. Taylor, Gene R., et al. Texas A & M University. Texas Agricultural Extension Service. Athletic Fields and Water Conservation, 1999.
8. The Irrigation Association. Landscape Irrigation Auditor Handbook. July 2007. 9. United States Department of Agriculture. Natural Resource Conservation Service. Soil Survey Manual
Chapter 3. Soil Texture Chart. http://soils.usda.gov/technical/manual/print_version/chapter3.html, accessed Jan 2010.
10. Wetlands Environmental Education Centre. School Water Audit. In conjunction with Sydney Water. Sydney, Australia.


![VTU – IISc Workshop (C)RG@SERC,IISc Compiler, Architecture and HPC Research in Heterogeneous Multi-Core Era R. Govindarajan CSA & SERC, IISc govind@[csa,serc].iisc.ernet.in.](https://static.fdocuments.us/doc/165x107/56649eeb5503460f94bfc78b/vtu-iisc-workshop-crgserciisc-compiler-architecture-and-hpc-research.jpg)