Enterocolitis Biomarkers Across Gestational Ages Normative ...
15
Page 1/15 Normative Values for Potential Necrotizing Enterocolitis Biomarkers Across Gestational Ages Darla Shores ( [email protected] ) Johns Hopkins Medicine https://orcid.org/0000-0002-0551-7880 Jennifer Fundora Johns Hopkins University Mitzi Go Johns Hopkins University Fauzia Shakeel Johns Hopkins University Sandra Brooks Johns Hopkins University Samuel M. Alaish Johns Hopkins University Jun Yang Johns Hopkins University Chhinder P. Sodhi Johns Hopkins University David J. Hackam Johns Hopkins University Allen Everett Johns Hopkins University Research article Keywords: necrotizing enterocolitis, biomarker, intestinal fatty acid binding protein, calprotectin, neonate Posted Date: March 4th, 2020 DOI: https://doi.org/10.21203/rs.3.rs-15989/v1 License: This work is licensed under a Creative Commons Attribution 4.0 International License. Read Full License
Transcript of Enterocolitis Biomarkers Across Gestational Ages Normative ...

Page 1/15
Normative Values for Potential NecrotizingEnterocolitis Biomarkers Across Gestational AgesDarla Shores ( [email protected] )
Johns Hopkins Medicine https://orcid.org/0000-0002-0551-7880Jennifer Fundora
Johns Hopkins UniversityMitzi Go
Johns Hopkins UniversityFauzia Shakeel
Johns Hopkins UniversitySandra Brooks
Johns Hopkins UniversitySamuel M. Alaish
Johns Hopkins UniversityJun Yang
Johns Hopkins UniversityChhinder P. Sodhi
Johns Hopkins UniversityDavid J. Hackam
Johns Hopkins UniversityAllen Everett
Johns Hopkins University
Research article
Keywords: necrotizing enterocolitis, biomarker, intestinal fatty acid binding protein, calprotectin, neonate
Posted Date: March 4th, 2020
DOI: https://doi.org/10.21203/rs.3.rs-15989/v1
License: This work is licensed under a Creative Commons Attribution 4.0 International License. Read Full License

Page 2/15
Version of Record: A version of this preprint was published at BMC Pediatrics on May 26th, 2020. See thepublished version at https://doi.org/10.1186/s12887-020-02142-5.

Page 3/15
AbstractBackground: Necrotizing enterocolitis (NEC) is associated with signi�cant morbidity and mortality. Serumbiomarkers to aid diagnosis, such as intestinal fatty acid binding protein (IFABP) and calprotectin, areactively being investigated; however, the normative values of these markers among healthy prematureand term infants remains unknown.
Aims: We sought to identify normative values for the serum concentrations of IFABP and calprotectinacross gestational (GA) and post-menstrual age.
Methods: We collected serum from infants (24-40 weeks GA) in the �rst week of life and at multiple timepoints in a sub-cohort of premature infants (24-29 weeks GA), excluding sepsis or known intestinaldisease. IFABP and calprotectin were measured using ELISA. Groups were compared with descriptivestatistics and mixed effects linear regression.
Results: 112 infants had specimens in the �rst week of life, and 19 premature infants had longitudinalspecimens. IFABP concentration in the �rst week of life was low and did not differ across gestationalages. Longitudinally, IFABP increased 4% per day (P<0.001). Calprotectin concentration in the �rst weekof life was more variable. An inverse relationship between day of life and calprotectin level was found inthe longitudinal cohort (P <0.001).
Conclusions: Serum IFABP and calprotectin �uctuate over time. Infants had low levels of IFABP during the�rst week of life, independent of gestational age, and levels increased longitudinally in premature infants.Calprotectin levels generally declined over time. Normative data for infants is necessary to establishmeaningful cut-off levels for clinical use.
BackgroundNecrotizing enterocolitis (NEC) remains a signi�cant challenge for clinicians caring for infants in theneonatal intensive care unit (NICU). NEC occurs in up to 7% of premature infants and has a mortality rateup to 30%.[1, 2] Survivors are at risk of intestinal failure from extensive bowel resection, as well as othercomplications related to severe illness and prolonged hospitalization, including lung injury and neuro-developmental delay.[1, 3] The early signs and symptoms of NEC are vague and overlap with otherin�ammatory processes, making NEC di�cult to distinguish from more common problems in thepremature infant, such as sepsis or feeding intolerance due to dysmotility. Clinicians rely on clinical signsand tests, such as changes in abdominal distention, stool output, and radiography to con�rm thediagnosis of NEC.[1, 4] In many cases, the diagnosis is not made until the necrotic bowel perforates,resulting in a life-threatening surgical emergency. The development of a gold-standard diagnostic testthat is highly sensitive, speci�c, and detects disease prior to the late �ndings on diagnostic imaging hasbeen limited, in part due to the complex pathophysiology and variability in presentation of NEC.Therefore, there is great interest in identifying biomarkers that not only lead to early detection of NEC butalso distinguish NEC from other etiologies of feeding intolerance.

Page 4/15
One such promising biomarker for potential use in the diagnosis of NEC is Intestinal fatty acid bindingprotein (IFABP), a relatively small intestinal epithelial protein involved in the transport of fatty acids foundin the small intestine and colon.[5] IFABP is released into the blood after enterocyte damage. Elevationshave been detected in several clinical conditions with intestinal mucosal damage, including NEC andabdominal ischemia.[5–7] IFABP is not thought to be present in the serum at high levels under normalcircumstances;[5] however, normative data has not been fully established in preterm infants, as moststudies have small sample sizes (20–40 control infants).[8, 9] Recent systematic reviews have shownthat IFABP appears to be more speci�c than sensitive in detecting NEC; however, IFABP is likely stillvaluable when included as part of a panel of tests.[10–13] Furthermore, determining normative dataacross gestational and post-menstrual ages may improve clinical utility.
Another potential biomarker for NEC and intestinal injury is calprotectin, the heterodimer S100 A8/A9calcium-binding proteins released by neutrophils that signal activation of the innate immune system.[11]Stool calprotectin is used clinically to detect intestinal in�ammation. However, stool calprotectin studiesin NEC have been mixed due to highly variable normal levels in premature and term infants in the �rst 6months of life as the microbiome develops.[6, 14] Serum measurements may more accurately detect asystemic in�ammatory response in NEC, and the combination of calprotectin with IFABP may have valuein the early diagnosis of NEC.[11]
AimsThe objectives of this study were to 1) determine IFABP and calprotectin levels vary by gestational age inthe �rst week of life, and 2) to determine if IFABP and calprotectin levels change over time in prematureinfants who are most at risk of developing NEC.
MethodsWe utilized blood specimens and clinical data from subjects consented and enrolled in three prospectiveneonatal cohort studies approved by the Institutional Review Board.
SubjectsSubjects were recruited from 2015 to 2018 from two tertiary children’s hospitals within the same healthcare system. Inclusion criteria were infants admitted to the NICU with gestational ages ranging from 24–40 weeks, who had blood specimens available the �rst week of life. We also included a sub-cohort ofpremature subjects with gestational ages between 24–29 weeks with at least 4 longitudinal bloodspecimens over the course of the NICU hospitalization. We excluded infants with culture-positive sepsis inthe �rst week of life, acquired and congenital intestinal disease (such as NEC, spontaneous intestinalperforation, gastroschisis, etc.), intestinal surgery, congenital heart disease, or death prior to dischargefrom the NICU.
Data Collection

Page 5/15
Clinical and demographic data were collected from the various databases. Variables included gender,race, ethnicity, gestational age, birth weight, 5 minute Apgar scores, hematocrit, and chorioamnionitis(de�ned by clinical diagnosis or pathology �ndings). Type of feeding (breast milk vs. type of formula)associated with date of specimen collection was obtained.
BiospecimensSerum and plasma specimens were collected at various time points depending on the study in which thesubject was enrolled (most subjects had daily blood specimens for the �rst week of life and some studiescontinued with weekly specimens throughout the hospitalization). For the �rst week of life, specimenswere obtained from day of life 4–7. For longitudinal specimens, we utilized specimens obtained atapproximately two-week intervals. Specimens were kept at 4 °C in the clinical lab until they wereprocessed (typically within 48 hours) into aliquot tubes and immediately frozen. Specimens were keptfrozen at -80 °C until assays were performed.
AssaysCommercial assays were used according to manufacturer speci�cations for both IFABP (Hycult Biotech,#HK406-01), using a 10X dilution factor and specimen volume of 10 ∝l, and S100A8/S100A9heterodimer (R&D Systems, Cat# DS8900), using a 200X dilution factor specimen volume of 1 ∝l.
Statistical AnalysisAs this was an exploratory study, we estimated needing at least 10 subjects per two-week gestational ageperiod (i.e. 24–25, 26–27 weeks) to see at least a 20% difference between groups. We estimated needing15–20 preterm subjects with longitudinal specimens to see a difference over time. Our primary outcomewas the biomarker level during the �rst week of life per gestational age group, and our secondaryoutcome was the change in biomarker levels over time (by day of life). We explored other clinicalvariables for modifying and confounding effects (gender, race, ethnicity, birth weight, and Apgar score).Sub-analyses in the subjects with available data explored the effect of hematocrit, chorioamnionitis, anda feeding type on biomarker levels.
Descriptive statistics and mixed effects linear regression equations for repeated measures with 95%con�dence intervals (CI) were used to compare results between groups. Normality was determined usingthe Shapiro-Wilcoxin normality test. Values were log-transformed to better approximate a normaldistribution, and the geometric mean of the log-transformed values was explored. To compare mediansusing descriptive statistics in the �rst week of life, differences between two groups were measured withWilcoxin rank-sum tests, and differences between > 2 groups were compared with Kruskal-Wallis tests.Fisher’s exact tests were used to compare categorical variables. Two-tailed P values < 0.05 wereconsidered signi�cant. Statistical analyses were performed using Stata (StataCorp. 2015. StataStatistical Software: Release 14. College Station, TX: StataCorp LP).
Results

Page 6/15
We enrolled 112 subjects who had specimens available the �rst week of life, and 19 representativepremature subjects who had longitudinal specimens with 4-5 time points per subject beginning with the�rst week of life. See Table 1 for baseline demographics and Table 2 for birth characteristics. Thefollowing clinical variables had incomplete data: 89 subjects had hematocrit data, 62 subjects hadchorioamnionitis data, and 23 subjects had feeding data.
Intestinal Fatty Acid Binding Protein
IFABP levels during the �rst week of life, strati�ed by gestational age, are displayed (Figure 1) with meansand standard errors of the mean for easiest visualization. Given the small sample size, medians andinterquartile ranges were used for statistical analyses. The median IFABP level ranged from 0.01 ng/ml to0.86 ng/dl (P=0.039) per group. While there was a statistical difference, all levels were low, making aclinical difference by gestational age unlikely. There was no signi�cant difference in median valuesbetween male and female subjects (0.013 vs. 0.171 ng/ml, respectively; P=0.310). There was nosigni�cant difference in levels by race or Hispanic ethnicity (P=0.077, P=0.202, respectively) with mostraces having a median level of <0.03ng/ml; however, there were 5 Asian subjects in the cohort, with amedian of 1.23 ng/ml. The median IFABP level was the same (0.013) between those with (N=18) andwithout (N=44) chorioamnionitis (P=0.239). Only 23 subjects had feeding data (7-8 per group: nil per os,mother’s breast milk, donor breast milk), with medians ranging from 0.32-0.62 ng/ml (P=0.936).Regression models of log-transformed IFABP showed no difference in levels based on gestational age(P=0.664), Apgar score (P=0.170), or birthweight (P=0.923). There was an association with hematocrit,with a 10% rise in IFABP per gram rise in hematocrit (P<0.001); though the clinical signi�cance is unclearas the majority (>75%) of hematocrit levels were between 42-52%.
Among longitudinal subjects, increasing day of life was associated with higher IFABP levels. A scatterplotof the IFABP levels by day of life is displayed in Figure 2. The regression model comparing IFABP levelwith day or life showed a 4% rise in IFABP each day (P<0.001). The median IFABP levels by day of life aredisplayed in Table 3. In this smaller premature cohort, race, gestational age, birth weight, Apgar score,hematocrit, and chorioamnionitis were each collinear and could not be included in the regression model.There was not an association with gender (P=0.189). Nine subjects had feeding data, but most were fedmother’s or donor breast milk, and there was no difference in IFABP levels (P=0.461).
Calprotectin (S100 A8/A9)
The calprotectin level did vary by gestational age in the �rst week of life (P=0.004), with generally higherlevels in the highest gestational ages; however there were multiple outliers in the earlier gestational ages(Figure 1). There was no difference in levels among males and females (1460 vs 1680 ng/ml,respectively; P=0.803). There was no difference between ethnicities (P=0.795) nor among races (1324-2074 ng/ml; P=0.827). Interestingly, the highest levels were again among the 5 Asian subjects. There wasno difference in levels by feeding type (P=0.610). There was not a statistical difference between thosewith and without chorioamnionitis (2662 vs. 1298 ng/ml, P=0.062). Regression models of log-transformed calprotectin showed no difference in levels based on Apgar score (P=0.844) or hematocrit

Page 7/15
(P=0.856). Birthweight was associated with calprotectin levels (P=0.001) but was collinear withgestational age.
In the longitudinal cohort, there was an inverse relationship between day of live and calprotectin level,depicted as a scatterplot (Figure 3). The calprotectin level decreased by 2% per day of life (P<0.001).Gestational age was collinear and unable to be included in the model, as were race, chorioamnionitis,hematocrit, and Apgar scores. There was no association with gender (P=0.511) or feeding type (P=0.749).
ConclusionsThere is an urgent need for better diagnostic tests for early detection of necrotizing enterocolitis (NEC).While IFABP and calprotectin are promising biomarkers, understanding the normal variations acrossgestational ages and during the early post-natal period is paramount to accurately interpreting results in aclinical setting. In a study comparing IFABP levels among premature sheep, differences were seenbetween extremely and moderately premature sheep, with the lowest levels in the most premature sheep.[8] Similar �ndings occur in other intestinal biomarkers. For example, calprotectin, a fecal marker ofin�ammation in the intestine, is routinely used clinically in older children and adults, but has had mixedresults in the neonatal population. Very low calprotectin levels are seen in extremely premature infants,but the levels progressively increase and remain higher than normal childhood levels until after 3 monthsof age, even without any obvious gastrointestinal pathology.[6, 14, 15] This range of levels is in partexplained by the complex interactions between with evolving intestinal microbiota and the developmentof immune tolerance and/or in�ammation during the �rst few months of life.
In our study, most infants had minimally detectable IFABP levels during the �rst week of life, regardless ofgestational age. Over 75% of subjects had an IFABP level <1 ng/ml, with 50% having a level <0.03 ng/ml.There was a statistical difference between IFABP levels across the gestational ages, but this is unlikely tobe clinically signi�cant as the median values were <1 ng/ml for each gestational age group. Bycomparison, most proposed cut-offs for NEC have ranged from 2 to 9 ng/ml for Bell Stage 2 and 3 NEC,with even higher levels (>19 ng/ml) reported in one study of surgical infants with a high mortality.[10, 11,13, 16] In our cohort, there were two outliers with very high levels who did not have identi�ablegastrointestinal disease.
Among the cohort of premature infants, the population most at risk of developing NEC, there were 76repeat measures after the �rst week of life. Of the 76 measures, 31 (41%) were >2.5 ng/ml and 4 (5%)were >9 ng/ml, suggesting there would be a high rate of false-positives for the lower cut-off values. Onlysome of the variability in IFABP levels was explained by day of life. There was not an obvious associationwith demographic or birth factors, such as gender, race, birth weight, Apgar score, or chorioamnionitis. Wehave limited feeding data (only 50% of longitudinal subjects), with the vast majority being fed breastmilk. It is possible that feeding type, and therefore intestinal microbiome, impacts the IFABP level. Wealso were reliant on culture results to exclude sepsis, so it is possible that culture-negative infection couldhave affected the results.

Page 8/15
In contrast, calprotectin levels were more variable during the �rst week of life, partially explained bygestational age. The proposed cut-off level for NEC is 3,000 ng/ml.[11] Twenty-nine subjects (26%) wouldhave had false-positive results. Calprotectin is associated with sepsis.[17] While all of our subjects hadnegative cultures, it is possible that other etiologies of infection were contributing to the higher levelsseen during the �rst week. After the �rst week of life, only 5 (7%) of the levels were above the cut-off,suggesting a lower risk for false-positive results.
There were limitations to the study, including the relatively small sample size; however, subjects werefrom two centers and represent the spectrum of gestational ages seen in the NICU. Furthermore, ourlongitudinal subjects represent the population most likely to develop NEC. Our sub-analyses were limitedby missing data, particularly type of feeding. Future studies will be needed to more formally evaluatefeeding type and potential associations with the microbiome.
In summary, gestational age and day of life may in�uence biomarker levels in premature infants. IFABPwas relatively low during the �rst week of life across all gestational ages. However, among prematureinfants, a substantial proportion had detectable levels with repeat measures as day of life increased,which may ultimately affect the sensitivity and speci�city of IFABP for detecting NEC. Calprotectin levelswere quite variable during the �rst week of life, which was associated with gestational age. However,levels quickly fell during subsequent measures in the preterm infants. Understanding the timing of testingin relation to post-menstrual age will be critical in interpreting results for clinical management.
DeclarationsEthics approval and consent to participate: The study was approved by the Johns Hopkins InternalReview Board. Written informed consent was obtained from the parents or guardians of all individualparticipants included in the study.
Consent for publication: non-applicable
Availability of data and materials: The datasets used and/or analyzed during the current study areavailable from the corresponding author on reasonable request.
Competing interests: Potential con�icts of interest: DS has received a research grant from Fresenius-Kabi.AE is supported by NHLBI 1R01 HL135114 and NICHD R01 HD086058. DH is supported byRO1DK1117186 and 1R01GM078238. The other authors declare that they have no con�icts of interest.
Funding: This study was funded in part by the American Society of Parenteral and Enteral NutritionRhoads Research Foundation, Johns Hopkins Clinician Scientist Award, and All Children’s HospitalInstitutional Research Grant. The funding bodies played no role in the design of the study, data collection,analysis, interpretation of data, or writing of the manuscript.
Author’s contributions: DS, JF, MG, FS, SB, SA, DH, and AE contributed to the concept and design and datainterpretation; DS, JF, MG, SB, JY, and CS contributed to data acquisition; DS contributed to data analysis;

Page 9/15
DS and JF drafted the manuscript; All authors critically revised the manuscript. All authors read andapproved the �nal manuscript.
Acknowledgements
We would like to acknowledge the Biostatistics, Epidemiology, and Data Management (BEAD) Core forstatistical support and the Johns Hopkins Medicine All Children’s Hospital Biorepository and the JohnsHopkins Clinical Chemistry laboratory for specimen processing support.
AbbreviationsCI, con�dence intervals; GA, gestational age; IFABP, intestinal fatty acid binding protein; IQR, interquartilerange; NEC, necrotizing enterocolitis; NICU, neonatal intensive care unit
References1. Neu J, Walker WA. Necrotizing enterocolitis. The New England journal of medicine. 2011;364(3):255-
64.
2. Stoll BJ, Hansen NI, Bell EF, Walsh MC, Carlo WA, Shankaran S, et al. Trends in Care Practices,Morbidity, and Mortality of Extremely Preterm Neonates, 1993-2012. JAMA. 2015;314(10):1039-51.
3. Fitzgibbons SC, Ching Y, Yu D, Carpenter J, Kenny M, Weldon C, et al. Mortality of necrotizingenterocolitis expressed by birth weight categories. J Pediatr Surg. 2009;44(6):1072-5; discussion 5-6.
4. Gosselin KB, Duggan C. Enteral Nutrition in the Management of Pediatric Intestinal Failure. J Pediatr.2014.
5. Pelsers MM, Namiot Z, Kisielewski W, Namiot A, Januszkiewicz M, Hermens WT, et al. Intestinal-typeand liver-type fatty acid-binding protein in the intestine. Tissue distribution and clinical utility. ClinBiochem. 2003;36(7):529-35.
�. Thuijls G, Derikx JP, van Wijck K, Zimmermann LJ, Degraeuwe PL, Mulder TL, et al. Non-invasivemarkers for early diagnosis and determination of the severity of necrotizing enterocolitis. Annals ofsurgery. 2010;251(6):1174-80.
7. Cronk DR, Houseworth TP, Cuadrado DG, Herbert GS, McNutt PM, Azarow KS. Intestinal fatty acidbinding protein (I-FABP) for the detection of strangulated mechanical small bowel obstruction. CurrSurg. 2006;63(5):322-5.
�. Reisinger KW, Elst M, Derikx JP, Nikkels PG, de Vries B, Adriaanse MP, et al. Intestinal fatty acid-binding protein: a possible marker for gut maturation. Pediatric research. 2014;76(3):261-8.
9. Gregory KE, Winston AB, Yamamoto HS, Dawood HY, Fashemi T, Fichorova RN, et al. Urinaryintestinal fatty acid binding protein predicts necrotizing enterocolitis. J Pediatr. 2014;164(6):1486-8.
10. Yang G, Wang Y, Jiang X. Diagnostic Value of Intestinal Fatty-Acid-Binding Protein in NecrotizingEnterocolitis: A Systematic Review and Meta-Analysis. Indian J Pediatr. 2016;83(12-13):1410-9.

Page 10/15
11. Terrin G, Stronati L, Cucchiara S, De Curtis M. Serum Markers of Necrotizing Enterocolitis: ASystematic Review. Journal of pediatric gastroenterology and nutrition. 2017.
12. Cheng S, Yu J, Zhou M, Tu Y, Lu Q. Serologic Intestinal-Fatty Acid Binding Protein in NecrotizingEnterocolitis Diagnosis: A Meta-Analysis. BioMed research international. 2015;2015:156704.
13. Ho SSC, Keenan JI, Day AS. The Role of Gastrointestinal-Related Fatty Acid-Binding Proteins asBiomarkers in Gastrointestinal Diseases. Dig Dis Sci. 2019.
14. Zoppelli L, Guttel C, Bittrich HJ, Andree C, Wirth S, Jenke A. Fecal calprotectin concentrations inpremature infants have a lower limit and show postnatal and gestational age dependence.Neonatology. 2012;102(1):68-74.
15. Kapel N, Campeotto F, Kalach N, Baldassare M, Butel MJ, Dupont C. Faecal calprotectin in term andpreterm neonates. Journal of pediatric gastroenterology and nutrition. 2010;51(5):542-7.
1�. Schurink M, Kooi EM, Hulzebos CV, Kox RG, Groen H, Heineman E, et al. Intestinal fatty acid-bindingprotein as a diagnostic marker for complicated and uncomplicated necrotizing enterocolitis: aprospective cohort study. PLoS One. 2015;10(3):e0121336.
17. Terrin G, Passariello A, Manguso F, Salvia G, Rapacciuolo L, Messina F, et al. Serum calprotectin: anantimicrobial peptide as a new marker for the diagnosis of sepsis in very low birth weight newborns.Clin Dev Immunol. 2011;2011:291085.
Tables Table 1. Demographics
Total Cohort
(N=112)
Longitudinal Cohort
(N=19)
Race, N (%)
Asian
Black
White
Other
5 (4%)
44 (39%)
55 (49%)
9 (8%)
0
9 (47%)
7 (37%)
3 (16%)
Ethnicity, N(%)
Hispanic
8 (7%)
0
Gender, N(%)
Male
57 (51%)
11 (57%)

Page 11/15
Table 2. Birth Characteristics by Gestational Age
Total Cohort
Gestational
Age (weeks)
24-25
N=11
26-27
N=18
28-29
N=17
30-31
N=16
32-33
N=12
34-35
N=12
36-37
N=9
38-39
N=10
40-42
N=7
Birth weight,
g, median(IQR)
790
(600-
880)
952
(830-
1060)
1170
(1090-
1360)
1405
(1295-
1450)
1635
(1445-
2310)
2190
(2022-
2665)
3008
(2660-
3310)
2960
(2880-
3100)
2700
(3180-
3920)
5 min APGAR,
median (IQR)
6 (4-
8)
7 (4-
8)
7 (5-8) 6 (5-8) 8 (8-9) 6 (5-7) 6 (4-7) 4 (2-5) 5 (3-6)
Longitudinal
Cohort
Gestational
Age (weeks)
24-25
N=5
26-27
N=7
28-29
N=7
Birth weight,
g, median(IQR)
790
(770-
860)
940
(800-
1100)
1170
(880-
1300)
Apgar score (5
minute),
median (IQR)
6 (3-
8)
7 (4-
9)
6 (5-7)
Abbreviations: IQR=interquartile range
Table 3. Serum IFABP and calprotectin by day of life (DOL) among preterm infants (24-29weeks gestational age).

Page 12/15
FABP ng/ml
Median (IQR; max)
S100 A8/A9 ng/ml
Median (IQR; max)
DOL 1-7 (N=56) 0.03 (0.01-1.02; 8.11) 1,298 (730-2198; 10,056)
DOL 8-14 (N=8) 0.51 (0.02-2.0; 20.70) 748 (596-886, 1,367)
DOL 15-21 (N=9) 2.07 (1.22-3.95; 7.23) 1,021 (650-1329; 10,022)
DOL 22-28 (N=11) 1.20 (0.03-2.89; 6.57) 784 (552-1808; 3,592)
DOL 29-35 (N=7) 2.62 (2.06-3.71; 11.05) 428 (345-971; 2,043)
DOL 36-42 (N=8) 2.53 (0.59-3.79; 5.06) 765 (588-878; 1,009)
DOL 43-49 (N=8) 2.48 (2.07-3.31; 3.54) 1,023 (425-1639; 2,528)
DOL 50-60 (N=12) 2.07 (0.97-2.66; 3.19) 573 (353-917; 3,321)
DOL >60 (N=12) 1.54 (0.94-3.42; 15) 608 (390-847; 2,940)
Figures

Page 13/15
Figure 1
Intestinal fatty acid binding protein (IFABP, blue line) and Calprotectin (red line) levels by gestational ageduring the �rst week of life (N=112). For IFAFP, there was a statistical difference but unclear clinicaldifference between gestational ages (P=0.039) given overall low levels. For Calprotectin, there was asigni�cant difference between gestational ages (P=0.004), but not a clear pattern.
Page 14/15
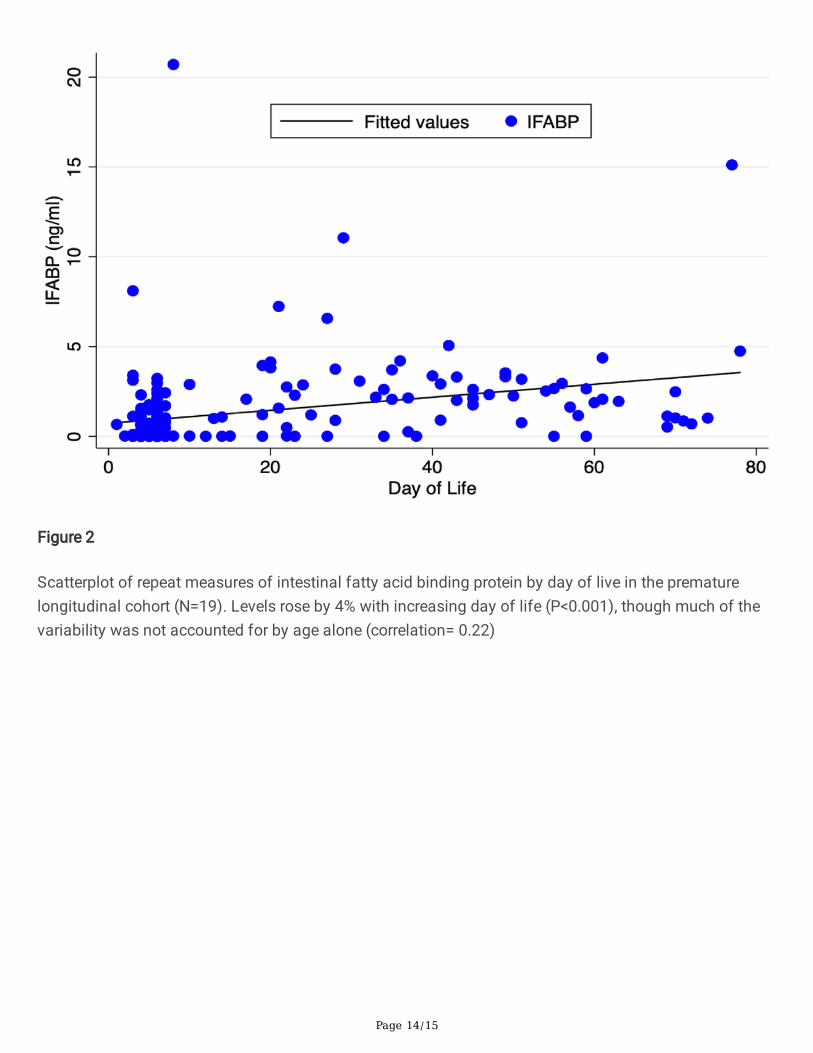
Figure 2
Scatterplot of repeat measures of intestinal fatty acid binding protein by day of live in the prematurelongitudinal cohort (N=19). Levels rose by 4% with increasing day of life (P<0.001), though much of thevariability was not accounted for by age alone (correlation= 0.22)

Page 15/15
Figure 3
Scatterplot of repeat measures of calprotectin by day of live in the premature longitudinal cohort (N=19).The calprotectin level decreased by 2% per day of life (P<0.001); however, the correlation was low(correlation=0.13).