ENSURING GREENER ECONOMIC GROWTH FOR BRAZIL · Negócios), Dino Antunes Dias Batista (MTPA),...
108
ENSURING GREENER ECONOMIC GROWTH FOR BRAZIL OPPORTUNITIES FOR MEETING BRAZIL’S NATIONALLY DETERMINED CONTRIBUTION AND STIMULATING GROWTH FOR A LOW-CARBON ECONOMY NOVEMBER 2018 LUIZA ANTONACCIO JULIANO ASSUNÇÃO MAÍNA CELIDONIO JOANA CHIAVARI CRISTINA LEME LOPES AMANDA SCHUTZE
Transcript of ENSURING GREENER ECONOMIC GROWTH FOR BRAZIL · Negócios), Dino Antunes Dias Batista (MTPA),...
ENSURING GREENER ECONOMIC GROWTH FOR BRAZILOPPORTUNITIES FOR MEETING BRAZIL’S NATIONALLY DETERMINED CONTRIBUTION AND STIMULATING GROWTH FOR A LOW-CARBON ECONOMY
NOVEMBER 2018
LUIZA ANTONACCIOJULIANO ASSUNÇÃOMAÍNA CELIDONIO JOANA CHIAVARICRISTINA LEME LOPESAMANDA SCHUTZE
Copyright © 2018 Climate Policy Initiative www.climatepolicyinitiative.org
All rights reserved. CPI welcomes the use of its material for noncommercial purposes, such as policy discussions or educational activities, under a Creative Commons Attribution-NonCommercial-ShareAlike 3.0 Unported License. For commercial use, please contact [email protected].
The texts in this publication may be reproduced in whole or in part provided that the source and the respective authors are cited.
AuthorsLuiza AntonaccioJuliano AssunçãoMaína CelidonioJoana ChiavariCristina Leme LopesAmanda Schutze
Editing and proofreadingNatalie Hoover El RashidyJennifer Roche
Graphic design and layoutMeyrele Nascimento Nicolas Motta
ACKNOWLEDGEMENTS
This report is based on economic and policy analysis by Climate Policy Initiative (CPI/PUC-Rio) in Brazil in cooperation with Inter-American Development Bank (IDB); Brazil’s Ministry of Planning, Development and Management (MP); and the World Wildlife Fund (WWF) through the technical cooperation project BR-T1377 Infra Invest: Sustainable Infrastructure for Brazil financed by the IDB. These organizations also helped to support this report, which presents new evidence for policymakers and stakeholders about how Brazil can strengthen its economy while meeting its (NDC commitments). The opinions expressed in this work are those of the authors and do not necessarily reflect the views of the IDB, its board of directors, or the countries they represent.
Climate Policy Initiative thanks the following individuals for their important contributions: Barbara Brakarz, Eduarda Zoghbi and Karisa Maia Ribeiro, from the Inter-American Development Bank; Carlos Lampert, Raquel Breda, and Renato Rosenberg from the Ministry of Planning, Developing and Management; and Leisa Cardoso de Souza, André Nahur and Mauricio Voivodic from the World Wildlife Fund.
The authors acknowledge the important contributions made by the Steering Committee participants: Allen Blackman (IDB), Carlos Klink (UNB), Claudio Frischtak (Inter. B-Consultoria Internacional de Negócios), Dino Antunes Dias Batista (MTPA), Francisco Gaetani (ENAP), Hugo Floréz Timorán (IADB), Jason Hobbs (IADB), José Rodrigues Dória (MAPA), Luis Fernando Badanhan (MME), Luis Corrêa Noronha (Banco Regional de Desenvolvimento do Extremo Sul), and Marco Aurélio Silva (PPI).
Climate Policy Initiative organized two workshops over the course of the project. The authors wish to acknowledge the valuable feedback and active participation by all of the attendees. The first workshop occurred on March 27, 2018 and focused on urban mobility and transportation. The participants included: André Ferreira (IEMA), Anie Gracie Noda (BNDES), Arthur Oliveira (IADB), Bernardo Serra (ITDP Brasil), Cristina Albuquerque (WRI Brasil), Diego Silva (ITDP Brasil), Fernando Araldi (MCid), Natália Moraes (EPE), Ricardo D. Zomer (MDIC), Simone Costa (Prefeitura do Rio de Janeiro), and Walter F. De Simoni (iCS).
The second workshop was held on April 11, 2018 and focused on energy. The participants included: Alessandra Mathyas (WWF), Alexandre Siciliano Esposito (BNDES), Alexandre Szklo (COPPE/UFRJ), Ana Paula Caporal (ENEL), Antonio Raad (Economiza Consultoria), Ary Vaz Pinto Junior (CEPEL), Carlos Eduardo Barreira Firmeza de Brito (ANEEL), Ceres Zenaide Cavalcanti (CGEE), Elizabeth Farina (UNICA), Frederico Rocha de Araujo (ABESCO), Gabriel Barja (ANEEL), Ivonice Campos (ABSOLAR), Jeferson B. Soares (EPE), Linda Murasawa (FRACTAL), Lisandro Sena Loiola (MDIC), Luís Fernando Badanhan (MME), Rodrigo Flora Calili (PUC-Rio), Rodrigo Sauaia (ABSOLAR), Roberto Kishinami (iCS), Siomara Gonzalez Gomes (MMA), Paul Procee (Banco Mundial), and Ubiratan Francisco Castellano (MME).
Finally, the authors would like to thank the following individuals from Climate Policy Initiative for their invaluable contributions to the report. Natalie Hoover El Rashidy served as an internal reviewer, provided critical coordination and kept the project moving. Our research assistants ably supported the project from start to finish: Daniela Marques, Maria Mittelbach, Isabela Salgado, and Lucas Souza. Graphic design services for this report were supplied by Meyrele Nascimento and Nicolas Motta, and Jennifer Roche provided editing and writing support.
DESCRIPTION TABLE OF CONTENTS
07 Abbreviations
09 List of Figures and Tables
EXECUTIVE SUMMARY
15 Executive Summary
OVERVIEW
28 1. Overview of Brazil’s Emissions and NDC
LAND USE
44 2. Economic Analysis: Transforming Brazil’s Land Use, Agriculture, and Forestry
Practices into Strategies for Economic Growth and Sustainability
64 3. Policy Analysis: Mapping the Policy and Institutional Landscape of Land Use in Brazil
94 4. Pathway to NDC: Land Use
ENERGY
96 5. Economic Analysis: Transforming Brazil’s Electricity Practices Into Strategies for
Economic Growth and Sustainability
120 6. Policy Analysis: Mapping the Policy and Institutional Landscape of Renewable Energy
and Energy Efficiency in Brazil
144 7. Pathway to NDC: Energy
TRANSPORTATION
146 8. Economic Analysis: Transforming Brazil’s Transportation Practices into Strategies for
Economic Growth and Sustainability
176 9. Policy Analysis: Mapping the Policy and Institutional Landscape of Brazil’s Cargo and
Urban Mobility Sectors
214 10. Pathway to NDC: Transportation
Sector
Region
Keywords
Related CPI Reports
Contact
Land Use, Energy, Transportation
Brazil
Climate change, Paris Agreement, Brazil, Nationally Determined Contribution, low-carbon economy, policy analysis, economic analysis, economic development, decarbonization strategy, land use, agriculture, forestry, energy, electricity, energy efficiency, renewable energy, transportation, urban mobility, cargo
Developing Brazil’s Market for Distributed Solar Generation (October, 2017), Challenges and Opportunities of Energy Efficiency: A Look at Brazilian Industry (September, 2018)
Juliano Assunçã[email protected]
Cristina Leme [email protected]
Maína [email protected]
Joana Chiavari [email protected]
Amanda [email protected]
Luiza [email protected]
ABOUT CPI
Climate Policy Initiative (CPI) works to improve the most important energy and land use policies around the world, with a particular focus on finance. We support decision makers through in-depth analysis on what works and what does not. CPI’s Brazil program partners with the Pontifical Catholic University of Rio de Janeiro (PUC-Rio).
7
ABBREVIATIONS
ABC Plan Low-Carbon Agriculture Plan ABC Program Low-Carbon Agriculture Program ABS Access and Benefit Sharing ANEEL Brazilian Electricity Regulatory AgencyANP Petroleum, Natural Gas and Biofuel National AgencyANTT Brazilian Land Transportation Regulatory AgencyAPP Permanent Preservation Areas ARPA Amazon Region Protected Areas ProgramBNDES Brazilian Development Bank CAR Rural Environmental RegistryCBD Convention on Biological DiversityCCEE Electric Energy Trading ChamberCMSE Power Sector Monitoring CommitteeCONABIO Biodiversity National Council CONAMA National Environmental Council CONIT National Integrating Transport Policies Council CONPET National Program of Rationalized Use of Oil By-Products and Natural Gas CLE Strategic Logistics Corridors Project CRA Environmental Reserve Quota CSLL Social Contribution on Net Income DETER Real-Time Detection of Deforestation DG Distributed Generation DNER National Department of Highways EE Energy Efficiency EEM Energy Efficiency Measures EFT Ecological Fiscal TransferENREDD+ National Strategy for Reducing Emissions from Deforestation and Forest Degradation, and the role of Conservation of Forest Carbon Stocks, Sustainable Management of Forests and Enhancement of Forest Carbon Stocks EPE Energy Research OfficeEPL Planning and Logistics Office S.A.FBN Biological Nitrogen Fixation FFV Flexible-Fueled Vehicles FLONAS National Forests FUNAI National Indian FoundationGDP Gross Domestic ProductGHG Greenhouse Gases IBAMA Brazilian Institute for the Environment and Renewable Natural ResourcesICLF Integrated Crops-Livestock-Forest Systems
ICMBIO Chico Mendes Institute for Biodiversity ConservationILOS Specialists in Logistics and Supply ChainILPF Integrated crops, Livestosck, and Forest INCRA National Institute of Colonization and Land ReformInovar-Auto Incentive Program for Technological Innovation and Strengthening of the Motorized Vehicles Chain of Production INPE Developed by the National Institute for Space ResearchIPI Tax on Industrialized Goods IRPJ Tax on Corporate Income ITR Rural Property Tax LULUCF Land use, Land use Change and Forestry MAPA Ministry of Agriculture, Livestock and Food Supply MDIC Ministry of Industry, Foreign Trade and Services MMA Ministry of the Environment MME Ministry of Mines and EnergyMTPA Ministry of Transports, Ports, and Civil Aviation MS Brazilian state of Mato Grosso do SulNDC Nationally Determined Contribution ONS National System OperatorONTL National Transports and Logistics ObservatoryPAC Growth Acceleration ProgramPAN-Bio National Biodiversity Action Plan PAF Forest Settlement Projects PEE Brazil’s Energy Efficiency programs PELT States’ Logistics and Transport Plan PES Payments for Environmental Services PBEV Brazil’s Vehicle Labelling Program PHE Strategic Waterway Plan PIL Program of Investment in LogisticsPLANAPO National Plan on Agroecology and Organic Agriculture PMCF - Family and Community Sustainable Forest Management ProgramPLANAVEG National Plan for the Recovery of Native VegetationPMABB Brazilian Biomes Environmental Monitoring Program
98
PMCF Family and Community Sustainable Forest Management Program PME Energy Mobilization Program PMU Local Urban Mobility Plan PNA National Adaptation Plan to Climate Change PNAD Brazilian National Household Sample SurveyPNAP National Strategic Plan of Protected Areas PNAPO National Policy on Agroecology and Organic Agriculture PNE National Energy Plan PNEf Energy Efficiency National PlanPNF National Forest ProgramPNGATI National Policy for Territorial and Environmental Management of Indigenous LandsPNIH Integrated Waterway National Plan PNL National Logistics Plan PNLI National Integrated Logistics Plan PNLP National Port’s Logistic Plan PNLT National Logistics and Transport Plan PNMC National Policy on Climate Change PNMU National Urban Mobility Policy Act PNPSB National Plan for the Promotion of Socio-biodiversity ProductsPNR National Road Plan PNT National Transport Policy PPCDAm Action Plan for the Prevention and Control of Deforestation in the Legal Amazon PPCerrado Action Plan for Prevention and Control of Deforestation and Forest Fires in the Cerrado Biome PPI Investments Partnership Program PRA Environmental Regularization Program Proalcool Brazil’s National Alcohol Program
PROCEL Electric Power Preservation National Program PROCONVE Control of Air Pollution from Motorized Vehicles Proinfa Incentive Program to Alternative Sources PRONABIO Biological Diversity National Program PRONAF National Program for Family Agriculture PROVEG National Policy for the Recovery of Native VegetationPSTM Transport and Urban Mobility Sector Plan for Mitigation of Climate Change REDD+ Reducing Emissions from Deforestation and Forest Degradation R&D Research and DevelopmentREIDI Fiscal Incentive for Infrastructure Investments RenovaBio National Biofuels Policy ActRPPN Private Reserves of the Natural Heritage SEAD Special Secretary for Family Agriculture and Agrarian Development SEEG System for Greenhouse Gas Emissions and Removals EstimatesSFB Brazilian Forest Service SICAR Rural Environmental Registry System SISNAMA National Environmental System SNUC National System of Protected Areas SPPI Special Secretary of Investments Partnership Program TKU Tons per Useful KilometerUNFCCC United Nations Framework Convention on Climate Change US United StatesWTO World Trade Organization
LIST OF FIGURES AND TABLES
1. OVERVIEW OF BRAZIL’S EMISSIONS AND NDC
Figure 1.1 Top 20 Global GHG Net Emitters, 2014Figure 1.2 Brazil’s Participation in the Global GHG Net Emissions by Sector, 2004-2014Figure 1.3 Evolution of Brazil’s Net Emissions, 2004-2016 Figure 1.4 Evolution of Brazil’s Gross Emissions, 2004-2016 Figure 1.5 Brazil’s Energy Sector GHG Emissions by Activity, 2004-2016Figure 1.6 Brazil’s Transport Emissions by Subsector, 2016
2. LAND USE: ECONOMIC ANALYSIS
Figure 2.1 Land Use in Brazil Table 2.1: Estimated Coefficients of Crop and Cattle Production in Brazil, 2000-2014, Using Stochastic Frontier Models Figure 2.2 The Potential for Productivity Gains from Different Land Use StrategiesFigure 2.3 Growth of Secondary Vegetation in Deforested Areas in the Brazilian Amazon
3. LAND USE: POLICY ANALYSIS
Figure 3.1 Brazil’s Land Use Policies TimelineFigure 3.2 Brazil’s Environmental Institutions and PoliciesFigure 3.3 Brazil’s Agricultural Institutions and PoliciesFigure 3.4 Land Tenure Regularization in Brazil - Institutions, Programs, and Categories
5. ENERGY: ECONOMIC ANALYSIS
Table 5.1 Brazil’s Renewable and Nonrenewable Power Supply – Units and Capacity by TypeFigure 5.1 Average Annual Solar Radiation and Consumer Units with Photovoltaic Generation per Municipality in BrazilFigure 5.2 Average Sale Price by Source of Energy, 2013-2018Table 5.2 Electricity Matrix (TWh), Estimated Costs (Billion R$) and Average Price (R$/MWh), 2030Table 5.3 Electricity Matrix (TWh), Estimated Costs (Billion R$) and Average Price (R$/MWh), 2040Table 5.4 Brazil Installed Capacity (GW) under Three Policy ScenariosTable 5.5 Brazil’s Electricity Generation (TWh) under Three Policy ScenariosTable 5.6 Additional Amount of Electricity Generation (TWh) in Brazil by Source and ScenarioTable 5.7 CAPEX and OPEX by SourceTable 5.8 Additional Installed Capacity (GW) by Source and ScenarioTable 5.9 Average Lifetime per Plant Type
10
6. ENERGY: POLICY ANALYSIS
Figure 6.1 Brazil’s Energy Policy TimelineFigure 6.2 Brazil’s Energy Institutions and Programs
8. TRANSPORTATION: ECONOMIC ANALYSIS
Figure 8.1 Cuiabá’s Road Routes to Santarém and Santos PortsFigure 8.2 Brazil’s Cargo Transportation by Mode Type, 2015Figure 8.3 Brazil’s Cargo Transport Mix Compared with Similar CountriesTable 8.1 Built Infrastructure and Geographic Area for Brazil, India, Canada, United States, China and RussiaFigure 8.4 Global Competitiveness Rankings, Road and Rail QualityFigure 8.5 Summary of Brazil’s New Infrastructure Projects Proposed under 2025 PNL ScenarioTable 8.2 Comparison of Projected Carbon Emissions under the Basic Scenario and PNL 2025 ScenarioTable 8.3 Projected Transport Modes under the Basic Scenario and PNL 2025 ScenarioFigure 8.6 Estimated Total Costs per Vehicle per YearFigure 8.7 Commuting Time by Length of Trip for Brazilian WorkersFigure 8.8 Average Commuting Time in Minutes for Brazilian WorkersFigure 8.9 Commuting Tax Rate for Brazilian WorkersFigure 8.10 Brazil’s Commuting Total Cost as a Percentage of GDPFigure 8.11 Commuting Tax Rate: Rio de Janeiro, Brasília, Curitiba, and Porto AlegreFigure 8.12 Growth in Mills and Sugarcane Crops in Mato Grosso do Sul, 2005-2012Table 8.4 Average Commuting Times by Municipality, 2002-2015
9. TRANSPORTATION: POLICY ANALYSIS
Figure 9.1 Brazil’s Cargo Policies TimelineFigure 9.2 Brazil’s Cargo Institutions and ProgramsFigure 9.3 Brazil’s Investment Plans Time-HorizonFigure 9.4 Brazil’s Sectoral Plans Time-HorizonFigure 9.5 Phases of Brazil’s Urban Mobility PoliciesFigure 9.6 Brazil’s Urban Mobility Institutions and ProgramsFigure 9.7 Brazil’s Urban Mobility Policies TimelineBox 9.1 Spotlight on Biofuels
1312
EXECUTIVESUMMARY
1514
To emerge from its deep recession, Brazil urgently needs to develop strategies and policies that promote growth and reduce poverty. At the same time, the nation’s Nationally Determined Contribution (NDC) within the Paris Agreement represents an ambitious commitment to reduce greenhouse gas (GHG) emissions by 2030.
This report is based on economic and policy analysis by Climate Policy Initiative (CPI/PUC-Rio) in Brazil in cooperation with the Inter-American Development Bank (IDB), Brazil’s Ministry of Planning, Development and Management (MP), and the World Wildlife Fund (WWF) by virtue of the technical cooperation project BR-T1377 InfraInvest: Sustainable Infrastructure for Brazil financed by the IDB. The report presents new evidence for policymakers and stakeholders. The analysts look at three sectors that are critical to creating a greener future for the nation: land use, energy, and transportation. For all three sectors, CPI delivers one message: promoting economic growth aligns with achieving Brazil’s climate commitments. The opinions expressed in this work are those of the authors and do not necessarily reflect the views of the IDB, its Board of Directors, or the countries they represent.
The report indicates that Brazil has the potential to drive green economic growth by using its lands more productively, scaling-up action in renewable energy and energy efficiency, and reducing the time cargo spends in transit and Brazilian commuters waste in traffic.
This report provides an economic analysis of the implementation of Brazil’s NDC, maps the institutional and policy arrangements for each sector, and outlines evidence-based strategies that will deliver low-carbon growth to the nation and its citizens. What is needed are significant investments and consistent policies. The opportunity cost of doing nothing will be higher than the cost of new investments. The returns from new climate-friendly investments and policies will outweigh their expense and effort: investing now will propel Brazil’s economy into a growing, more productive, and sustainable future.
THE CHALLENGE OF MEETING BRAZIL’S NDCIn the Paris Agreement, Brazil committed to lowering the nation’s greenhouse gas emissions levels by at least 37% by 2025 and by at least 43% by 2030. These mitigation goals, combined with those pursued by other nations, aim to keep global temperature change below 2oC relative to pre-industrial levels. Beyond the 2oC target, the specific actions, policies, and programs to be pursued are left open so that each country can choose how best to meet their commitments.
Although Brazil is a significant contributor to global emissions, the nation’s emissions patterns are different from those in other countries. Brazil must, therefore, develop mitigation strategies tailored to this unique situation. Three critical areas are responsible for the greatest share of Brazil’s emissions and should be the focus of actions to mitigate emissions and drive economic growth: land-use change and agriculture, energy, and transportation. These sectors have great potential to generate income and employment, but they must develop sustainably to build a climate resilient economy.
Economic analysis shows that the returns from new climate-friendly investments and policies will outweigh their expense and effort.
1716
STRUCTURE OF REPORT
For this project, the researchers identify new evidence and combines it with data from secondary sources to demonstrate how Brazil can ensure greener growth and meet its NDC targets. An institutional and policy mapping provides guidance for policymakers to identify gaps and areas for improvement.
The report is divided into three major areas of focus for creating a greener future for the nation: land use, energy, and transportation (including cargo and urban mobility). For all three sectors, CPI delivers one message: promoting economic growth aligns with achieving Brazil’s climate commitments.
After an introduction to Brazil’s emissions levels and a review of the NDC commitments Brazil made in Paris, each section presents the following topics in stand-alone chapters, which are marked for easy reference:
• Economic Analysis: Review of evidence and economic analysis;
• Policy Analysis: Analysis and mapping of the policy and institutional landscape;
• Pathway to NDC: Summary of the recommended economic and policy priorities.
17
BRAZIL’S NDC COMMITMENTS
Land-Use Change and Forestry
Because deforestation causes an increase in GHG emissions and protected forests serve as a carbon sink, Brazil’s climate goals focus on protecting Brazil’s natural lands from further deforestation. They also aim to restore forested areas that have been cleared. Deforestation, primarily driven by agriculture and cattle production, raises emissions. On this cleared land, pastures used for cattle contribute to GHG emissions at a higher level than those used for cropland. Restoring degraded pasturelands and using them for agricultural expansion reduces the need to clear additional forested land, creating a scenario in Brazil that allows for increased agricultural productivity without increased deforestation. The new Forest Code and the Low-Carbon Emission Agriculture Program (Plano ABC) help direct Brazil’s efforts to reduce deforestation and recover degraded areas in this core component of its agricultural target.
Energy (Electricity and Transportation)
Brazil’s energy matrix is one of the cleanest in the world, which makes the country’s emissions levels from energy consumed lower than in other countries. The challenge now is to maintain and expand these high shares of carbon-free energy sources for energy consumption and production.
With that in mind, Brazil’s commitments under the Paris Agreement for the energy sector (which includes transportation, industry, and electricity generation subsectors) focus on two major areas: increasing the use of renewables and improving energy efficiency.
The country has been heading in the direction of promoting the deployment of alternative renewable sources (wind, solar, biomass, etc.), an area where Brazil holds great physical and economic potential. In addition, increasing distributed generation and improving energy efficiency, especially for industry, will be crucial towards reducing electricity demand in the centralized system.
The transportation sector will also play a critical role in guaranteeing a clean expansion of the energy sector, mainly through the increase of biofuels consumption as a replacement for fossil fuels. Raising mandatory biofuels blending requirements can have a large impact towards meeting the NDC targets since 61.7% of light-duty vehicles are flex-fueled (SEEG 2017).
This report aims to identify economically productive measures in land use and energy Brazil can adopt that are also compatible with the nation’s emissions reduction goals.
1918
Evidence shows that increased enforcement to control deforestation does not undermine agricultural productivity or economic growth. The implementation of the Forest Code, in addition to protecting native vegetation within private lands, can help boost productivity. Since the Forest Code imposes a limit on area expansion, it emulates a market signal towards intensification and technology, incentivizing production expansions through yield gains rather than clearing new forest areas. The Forest Code is the primary instrument for forest protection, but its implementation remains a challenge and will need continued support. These findings reinforce that improving forest conservation while increasing agricultural productivity is within reach for Brazil.
Finally, this report maps the key policies and institutions governing land use in Brazil. This section serves as a resource for policymakers and stakeholders to understand the wide array of governmental and policy initiatives that are available as pathways or tools for progress.
Brazil has the potential to double agricultural production gains by promoting conversion of pasture to cropland and encouraging increased productivity through yield gains without deforestation.
In the Paris Agreement, Brazil committed to ambitious mitigation goals. This report analyzes three major sectors where the researchers found that Brazil’s economic goals align with its climate targets: land use, energy, and transportation. By following these recommendations, Brazil can secure its path to low-carbon, economic growth.
LAND USE
A central theme of this report is that Brazil can meet its NDC land use targets through promoting advances in agriculture productivity and by maximizing its forest protection and restoration.
Brazil has made significant investments in its land to become a leading world agricultural producer. The nation has transitioned from land-intensive farming practices that depend primarily on area expansion through deforestation to those that are more technologically efficient. This transition has helped slow deforestation by allowing producers to do more on their existing land. However, widespread inefficient agricultural production and cleared areas have created a situation where Brazil has much more potential to increase agricultural production, taking advantage of already cleared areas and avoiding further deforestation. As the analysis shows, by converting the already cleared lands to crop production and by improving cattle grazing efficiency on existing lands, Brazil can accelerate its growth without making additional environmental compromises. Cultivating already abandoned areas and lands for agricultural production will be an essential strategy for Brazil.
Brazil has a tremendous opportunity to increase agricultural production even with its currently available technology. More specifically, the analysis shows that if Brazil were to promote conversion of pasture to cropland and encourage increased productivity through yield gains without any further deforestation – the potential production gains would double. Evidence from separate studies supports this finding and demonstrates that Brazil has a long track record of successfully modernizing its agricultural practices and reducing deforestation pressures.
It is important to recognize that the existence of this enormous agricultural potential does not imply necessarily that farmers are not doing the best they can, given the conditions they face. The unrealized potential may be due to productivity obstacles, knowledge, and market failures that prevent farmers from cultivating their land efficiently.
This report analyzes three major sectors where the researchers found that Brazil’s economic goals align with its climate targets: land use, energy, and transportation.
THE ECONOMIC OPPORTUNITIES FOR MEETING BRAZIL’S NDC
2120
These factors, combined with Brazil’s NDC commitment under the Paris Agreement to expand the share of renewable energy sources in Brazil’s power matrix, led the Brazilian government to promote participation in alternative renewable sources (solar, wind, biomass, and small hydro plant).
This is an opportune time for Brazil’s energy sector. The potential for wind, solar, and biomass power generation in Brazil is large and becoming increasingly more competitive with most nonrenewable electricity on price, which will help Brazil achieve its NDC commitments.
The analysis demonstrates that decarbonization for Brazil’s energy supply is within reach. Meeting the NDC targets will require an estimated investment until 2030 that is almost 10% less than the non-NDC (business as usual) scenario. Furthermore, to surpass the NDC target policies and achieve decarbonization, Brazil will require an estimated investment until 2030 that is 18% less than the non-NDC scenario. The analysis shows that the deployment of all renewable sources in the energy matrix lowers overall costs because of the decreasing prices of these sources.
Critical to Brazil’s success in this transition will be expanding its physical capacity for renewable energy generation and introducing extensive improvements in energy efficiency. The two must occur together for Brazil to reap the most substantial economic and NDC gains. Improving energy efficiency across the country for firms and households will have an immediate, positive impact.
Finally, the report extensively maps key policies and institutions governing renewable energy in Brazil. Although renewable energy policy is relatively new, this section serves as a resource for policymakers and stakeholders to understand emerging governmental and policy initiatives on renewable energy. It introduces the electricity market and the current policy opportunities available for advancing renewable energy.
In energy efficiency, Brazilian policy is also in the early stages. Brazil introduced energy efficiency programs and regulations as a response to external and internal crises. As a result, the policies were not well-planned or well-structured and lacked long-term vision. Another salient feature of the Brazilian energy efficiency efforts is the focus on household energy consumption, with much less emphasis on industrial use. The international trend is the opposite. More will need to be done to promote energy efficiency among businesses and industries.
The policy section of this report can be used to identify the pathways and tools that are available for making progress in renewable energy and energy efficiency.
Increasing investments in renewables and energy efficiency will reduce the total expenditures needed to meet future energy demand and the environmental risks of the electricity sector.
ENERGY
As Brazil pursues its NDC goals to implement a cleaner energy matrix, it can also reap significant economic benefits. The analysis considers scenarios developed by the International Energy Agency to calculate the investment Brazil will need to expand the current electricity matrix. Increasing investments in renewables and energy efficiency will reduce the total expenditures needed to meet future energy demand and the environmental risks of the electricity sector.
While Brazil’s energy supply is already one of the least carbon-intensive in the world, the nation faces challenges in diversifying its matrix. Solar, wind, and biomass play a minor role in the Brazilian energy matrix, and the percentage of nonrenewable sources in the matrix increased from 2005 to 2015. This rise in carbon-based energy sources from 2005 to 2015 was caused in part by Brazil’s reliance on hydrothermal systems. Because the Brazilian power sector is a centralized hydrothermal system, in which thermoelectric plants are triggered when hydropower reservoir water levels are low, severe droughts over the past years reduced the generation capacity of hydroelectric plants. As a result, thermoelectric generation has been increasingly applied to compensate for the electricity supply gap, not only increasing emissions but also the electricity cost.
In the future, the current hydrothermal system will likely not be able to accommodate the projected increases in electricity needs without higher prices and more emissions by thermoelectric generation. Electricity consumption will also likely increase to respond to higher demand due to demographic and economic growth.
2322
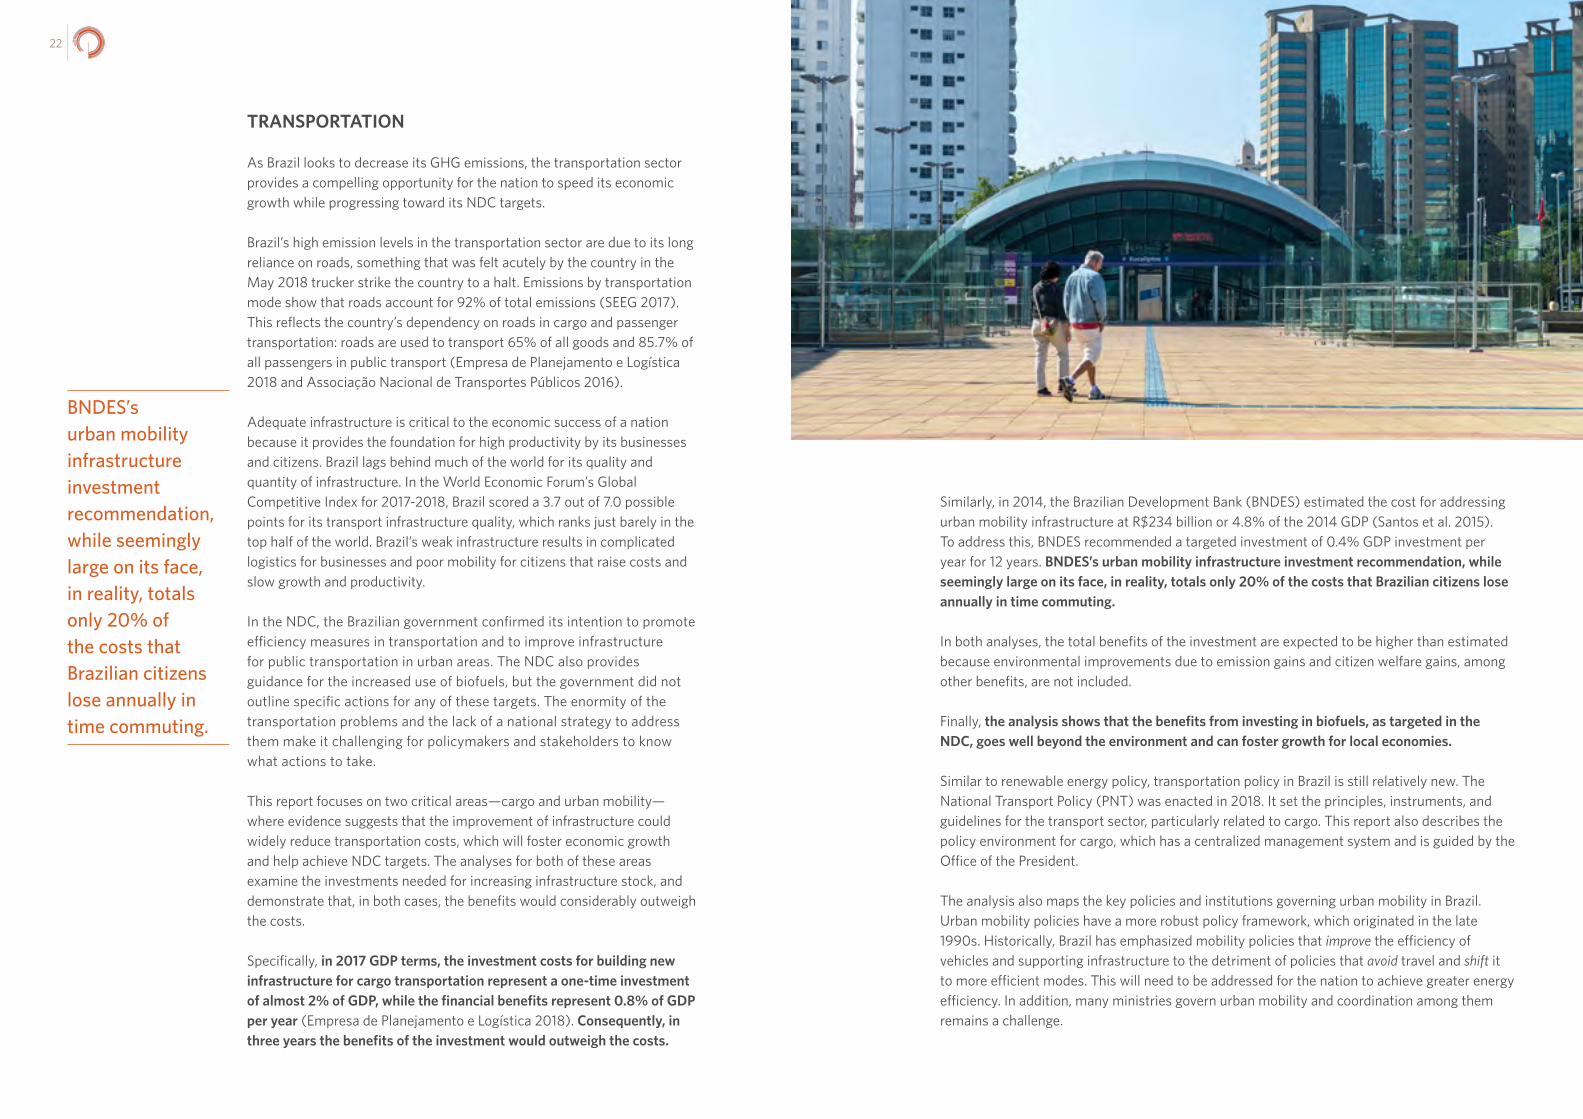
Similarly, in 2014, the Brazilian Development Bank (BNDES) estimated the cost for addressing urban mobility infrastructure at R$234 billion or 4.8% of the 2014 GDP (Santos et al. 2015). To address this, BNDES recommended a targeted investment of 0.4% GDP investment per year for 12 years. BNDES’s urban mobility infrastructure investment recommendation, while seemingly large on its face, in reality, totals only 20% of the costs that Brazilian citizens lose annually in time commuting.
In both analyses, the total benefits of the investment are expected to be higher than estimated because environmental improvements due to emission gains and citizen welfare gains, among other benefits, are not included.
Finally, the analysis shows that the benefits from investing in biofuels, as targeted in the NDC, goes well beyond the environment and can foster growth for local economies.
Similar to renewable energy policy, transportation policy in Brazil is still relatively new. The National Transport Policy (PNT) was enacted in 2018. It set the principles, instruments, and guidelines for the transport sector, particularly related to cargo. This report also describes the policy environment for cargo, which has a centralized management system and is guided by the Office of the President.
The analysis also maps the key policies and institutions governing urban mobility in Brazil. Urban mobility policies have a more robust policy framework, which originated in the late 1990s. Historically, Brazil has emphasized mobility policies that improve the efficiency of vehicles and supporting infrastructure to the detriment of policies that avoid travel and shift it to more efficient modes. This will need to be addressed for the nation to achieve greater energy efficiency. In addition, many ministries govern urban mobility and coordination among them remains a challenge.
TRANSPORTATION
As Brazil looks to decrease its GHG emissions, the transportation sector provides a compelling opportunity for the nation to speed its economic growth while progressing toward its NDC targets.
Brazil’s high emission levels in the transportation sector are due to its long reliance on roads, something that was felt acutely by the country in the May 2018 trucker strike the country to a halt. Emissions by transportation mode show that roads account for 92% of total emissions (SEEG 2017). This reflects the country’s dependency on roads in cargo and passenger transportation: roads are used to transport 65% of all goods and 85.7% of all passengers in public transport (Empresa de Planejamento e Logística 2018 and Associação Nacional de Transportes Públicos 2016).
Adequate infrastructure is critical to the economic success of a nation because it provides the foundation for high productivity by its businesses and citizens. Brazil lags behind much of the world for its quality and quantity of infrastructure. In the World Economic Forum’s Global Competitive Index for 2017-2018, Brazil scored a 3.7 out of 7.0 possible points for its transport infrastructure quality, which ranks just barely in the top half of the world. Brazil’s weak infrastructure results in complicated logistics for businesses and poor mobility for citizens that raise costs and slow growth and productivity.
In the NDC, the Brazilian government confirmed its intention to promote efficiency measures in transportation and to improve infrastructure for public transportation in urban areas. The NDC also provides guidance for the increased use of biofuels, but the government did not outline specific actions for any of these targets. The enormity of the transportation problems and the lack of a national strategy to address them make it challenging for policymakers and stakeholders to know what actions to take.
This report focuses on two critical areas—cargo and urban mobility—where evidence suggests that the improvement of infrastructure could widely reduce transportation costs, which will foster economic growth and help achieve NDC targets. The analyses for both of these areas examine the investments needed for increasing infrastructure stock, and demonstrate that, in both cases, the benefits would considerably outweigh the costs.
Specifically, in 2017 GDP terms, the investment costs for building new infrastructure for cargo transportation represent a one-time investment of almost 2% of GDP, while the financial benefits represent 0.8% of GDP per year (Empresa de Planejamento e Logística 2018). Consequently, in three years the benefits of the investment would outweigh the costs.
BNDES’s urban mobility infrastructure investment recommendation, while seemingly large on its face, in reality, totals only 20% of the costs that Brazilian citizens lose annually in time commuting.

2524
Land Use
• Extend the satellite-based monitoring system to secondary vegetation and biomes other than the Amazon.
• Accelerate implementation of the Forest Code.
• Improve financial services for agriculture and conservation.
Renewable Energy
• Align policies to increase deployment of alternative renewable energy .
• Improve incentives and policies to encourage the expansion of decentralized solar generation.
• Design incentives for the adoption of energy efficiency measures focused on industry.
• Strengthen long-term planning and governance of energy efficiency programs.
Transportation
CARGO
• Diversify transportation mode matrix to lower costs and reduce emissions. Approval of the National Logistics and Transport Plan will move Brazil in this direction.
• Implement an overarching transport policy with clear objectives for long-term cargo plans and programs and to attract private investment.
URBAN MOBILITY
• Prioritize investment in public and non-motorized transportation infrastructure. At the same time, design policies to discourage the use of individual transportation modes, especially cars.
• Increase coordination among the governmental institutions that hold responsibility for urban mobility.
The report identifies and elaborates on strategies that will help Brazil deliver economic gains and achieve the NDC climate goals in land use, renewable energy, and transportation.
PATHWAY TO NDC STRATEGIC PRIORITIES FOR BRAZIL
Land Use
• Extend the satellite-based monitoring system to secondary vegetation and biomes other than the Amazon.
• Accelerate the implementation of the Forest Code.
• Improve financial services for agriculture and conservation.
Energy
• Align policies to increase deployment of alternative renewable energy .
• Improve incentives and policies to encourage the expansion of decentralized solar generation.
• Design incentives for the adoption of energy efficiency measures focused on industry.
• Strengthen long-term planning and governance of energy efficiency programs.
Transportation
CARGO
• Diversify transportation mode matrix to lower costs and reduce emissions. Approval of the National Logistics and Transport Plan will move Brazil in this direction.
• Implement an overarching transport policy with clear objectives for long-term cargo plans and programs and to attract private investment.
URBAN MOBILITY
• Prioritize investment in public and non-motorized transportation infrastructure. At the same time, design policies to discourage the use of individual transportation modes, especially cars.
• Increase coordination among the governmental institutions that hold responsibility for urban mobility.
The report identifies and elaborates on strategies that will help Brazil deliver economic gains and achieve the NDC climate goals in land use, energy, and transportation.
2726
REFERENCES
Associação Nacional de Transportes Públicos. 2016. Sistemas de Informações de Mobilidade: Relatório Geral.
Empresa de Planejamento e Logística. 2018. Plano Nacional de Logística.
Santos R.T. et al. Demanda por investimentos em mobilidade urbana no Brasil. BNDES Setorial, Rio de Janeiro, n.41, p. 79-134, March 2015.
Secretaria de Transportes do Estado do Rio de Janeiro. 2011. Pesquisa de Origem-Destino da Região Metropolitana do Rio de Janeiro.
Sistema de Estimativas de Emissões e Remoções de Gases de Efeito Estufa (SEEG). 2017. Base de dados: emissões totais. [Accessed 19 January 2018]. http://plataforma.seeg.eco.br/total_emission

2928
OVERVIEW
3130
OV E RV I E WOF BRAZIL’S EMISSIONS AND NDC
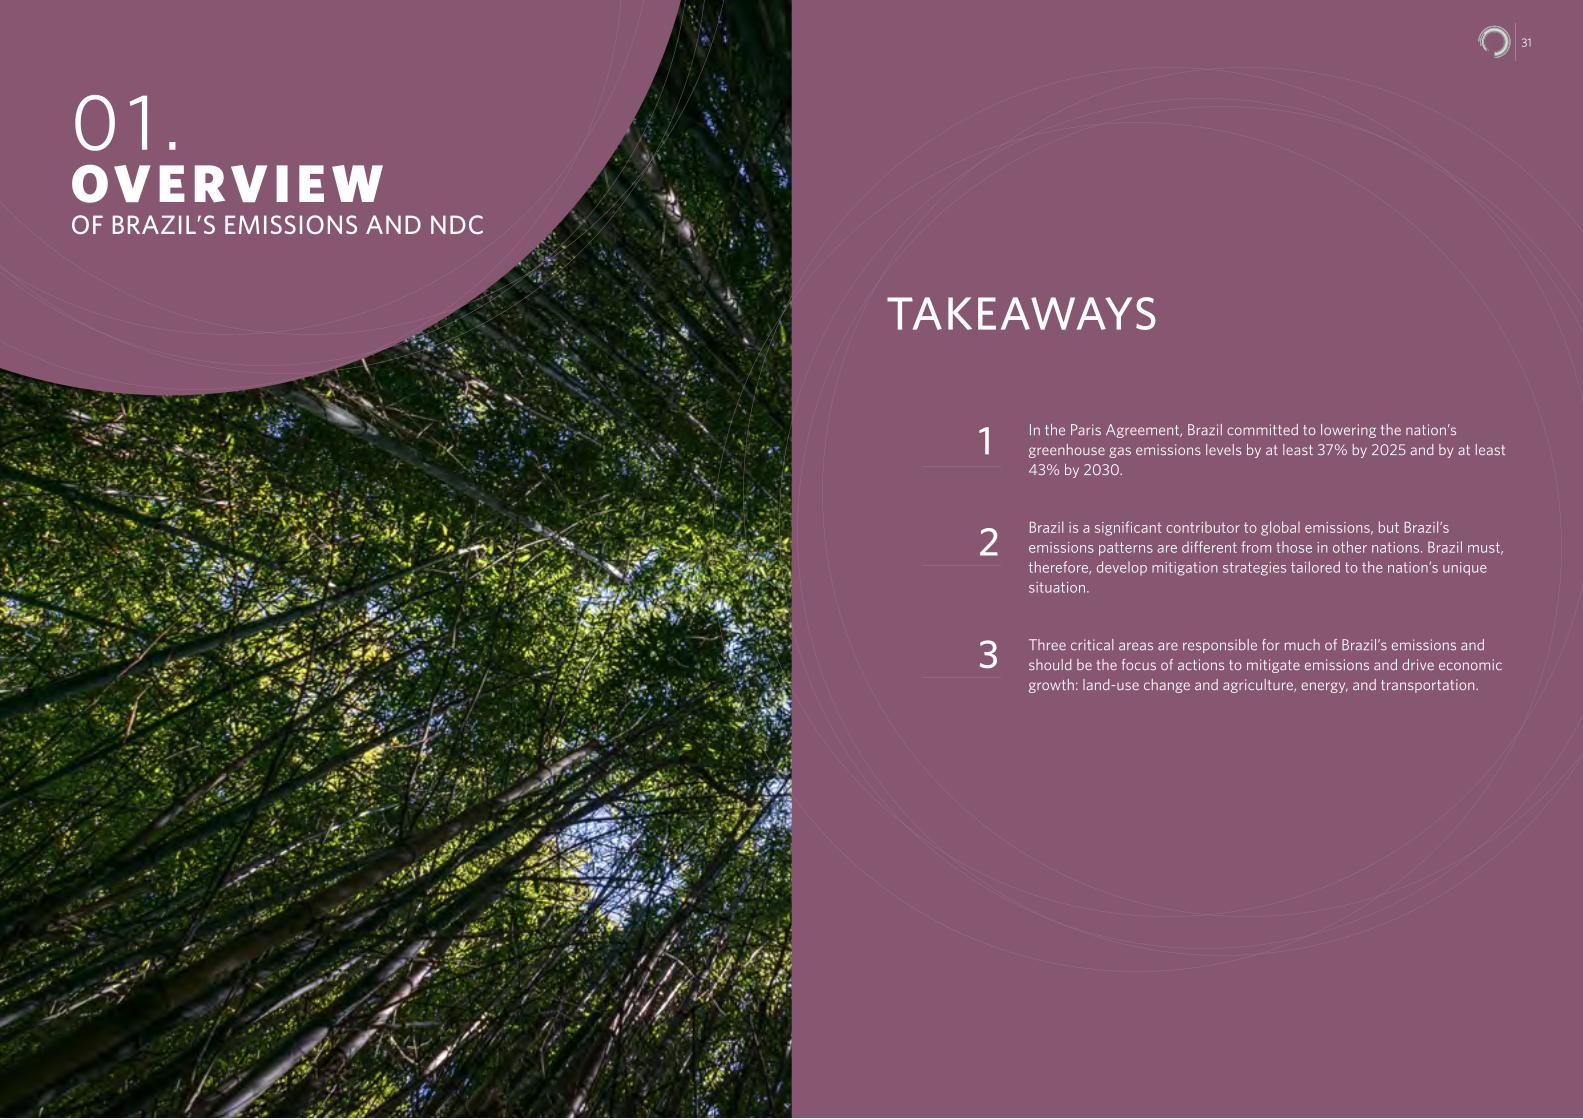
In the Paris Agreement, Brazil committed to lowering the nation’s greenhouse gas emissions levels by at least 37% by 2025 and by at least 43% by 2030.
Brazil is a significant contributor to global emissions, but Brazil’s emissions patterns are different from those in other nations. Brazil must, therefore, develop mitigation strategies tailored to the nation’s unique situation.
Three critical areas are responsible for much of Brazil’s emissions and should be the focus of actions to mitigate emissions and drive economic growth: land-use change and agriculture, energy, and transportation.
TAKEAWAYS
1
2
3
31
01 .
3332
At the 21st Conference of the Parties (COP 21) to the United Nations Framework Convention on Climate Change (UNFCCC) held in Paris in 2015, 174 countries signed the historical Paris Agreement, which signified each nation’s commitment to improving efforts to combat climate change. The agreement is legally binding and each country is responsible for creating domestic policies to implement the agreement.
Brazil and all other signing countries defined their own “Nationally Determined Contribution” (NDC) and charted the actions their nations would take to reduce greenhouse gas (GHG) emissions levels through 2030.
Specifically, Brazil committed to lowering the country’s 2005 GHG emissions levels by at least 37% by 2025 and by at least 43% by 2030. These mitigation goals, combined with those pursued by other nations, aim to keep global temperature change below 2oC relative to pre-industrial levels. Beyond the 2oC target, the specific actions, policies, and programs to be pursued are left open so that each country can choose how best to meet their targets.
Brazil identified actions within the climate agreement about how it would pursue these targets. To understand better how Brazil can meet its emissions targets, this chapter provides a background to Brazil’s NDC commitments and the changes and trends of GHG emissions in Brazil.
The section starts with a description of the role the country plays in the global emissions scenario. The following three sections then introduce the NDC targets and sector emissions for three critical areas: land-use change (which includes forests and deforestation), agriculture, and energy (with a focus on electricity generation and transportation).
Brazil committed to lowering the country’s 2005 GHG emissions levels by at least 37% by 2025 and by at least 43% by 2030.

3534
OVERVIEW OF GHG EMISSIONS
Brazil’s actions to pursue climate solutions will be meaningful on a national and global level because the country is a significant contributor to global GHG emissions.
In 2014, twenty countries (shown in Figure 1.1) accounted for more than 80% of global greenhouse emissions; Brazil ranked seventh among these. China and the United States together contributed almost 40% of GHG, while Brazil’s contribution represented 2.8% of global emissions.
Figure 1.1: Top 20 Global GHG Net Emitters, 20141
Note: Top Twenty anthropogenic greenhouse gas global emitters in 2014: all non-CO2 emissions in CAIT are expressed in CO2
equivalents using 100-year global warming potentials found in the IPCC Second Assessment Report (AR2). The data consider net
emissions, that is, gross emissions minus removals.
Source: Climate Policy Initiative with data from CAIT Climate Data Explorer, 2015.
It is important to notice, however, that Brazil’s emissions patterns are different from the rest of the world. The primary source of net GHG emissions throughout the world is the energy sector (73%), mainly because of electricity generation and heating, followed by agriculture (11%), industrial processes (7%), and land-use change and forestry (6%).
1 The newest standardized methodology available is the AR-5. Since the information in Figure 1.1 uses AR-2, this system is used throughout the report.
For Brazil, however, land-use change and forestry, and the agriculture sector contribute a larger percentage to total emissions. Figure 1.2 shows Brazil´s historically higher participation of land-use change and forestry than other sectors in its global GHG net emissions. This higher percentage is the reason why Brazil needs to develop mitigation strategies that may differ from those adopted in other nations.
Figure 1.2: Brazil’s Participation in the Global GHG Net Emissions by Sector, 2004-2014
Note: Brazil’s annual participation in global greenhouse gas (GHG) emissions for the 2004-2014 period, by sector. Non-CO2 emissions
are converted into CO2-equivalents based on 100-year Global Warming Potential (GWP100), taken from the IPCC Second Assessment
Report (AR2). The land-use change and forestry emission data include Removals.
Source: Climate Policy Initiative with data from CAIT Climate Data Explorer, 2015.
Since 2004, Brazil has played a successful role in reducing emissions due to the nation’s progress in curbing deforestation. Looking more closely at Brazil’s level of GHG emissions for the three sectors (land-use change and forestry, agriculture, and energy), Figure 1.3 shows that over the years, there have been significant changes to emissions in these areas.
GHG emissions from land-use change and forestry have reduced. However, after 2014, previous gains obtained in reducing deforestation lost some impact as land-use change and forestry’s emissions started trending back upward. Additionally, the energy and agriculture sectors’ emissions increased during the same period.
0
5
10
15
20
25
Euro
pean
Uni
on (2
8)
Indi
a
Indo
nesi
a
Russ
ian
Fede
ratio
n
Braz
il
Japa
n
Cana
da
Ger
man
y
Iran
Mex
ico
Sout
h Ko
rea
Saud
i Ara
bia
Sout
h A
fric
a
Aus
tral
ia
Uni
ted
King
dom
Nig
eria
Arg
entin
a
Zam
bia
Chin
a
Uni
ted
Stat
es
Perc
ent (
%)
Waste Land-Use Change and ForestryAgricultureIndustrial ProcessesEnergy
0
5
10
15
20
25
30
2004 2005 2006 2007 2008 2009 2010 2011 2012 2013 2014
Perc
ent (
%)
3736
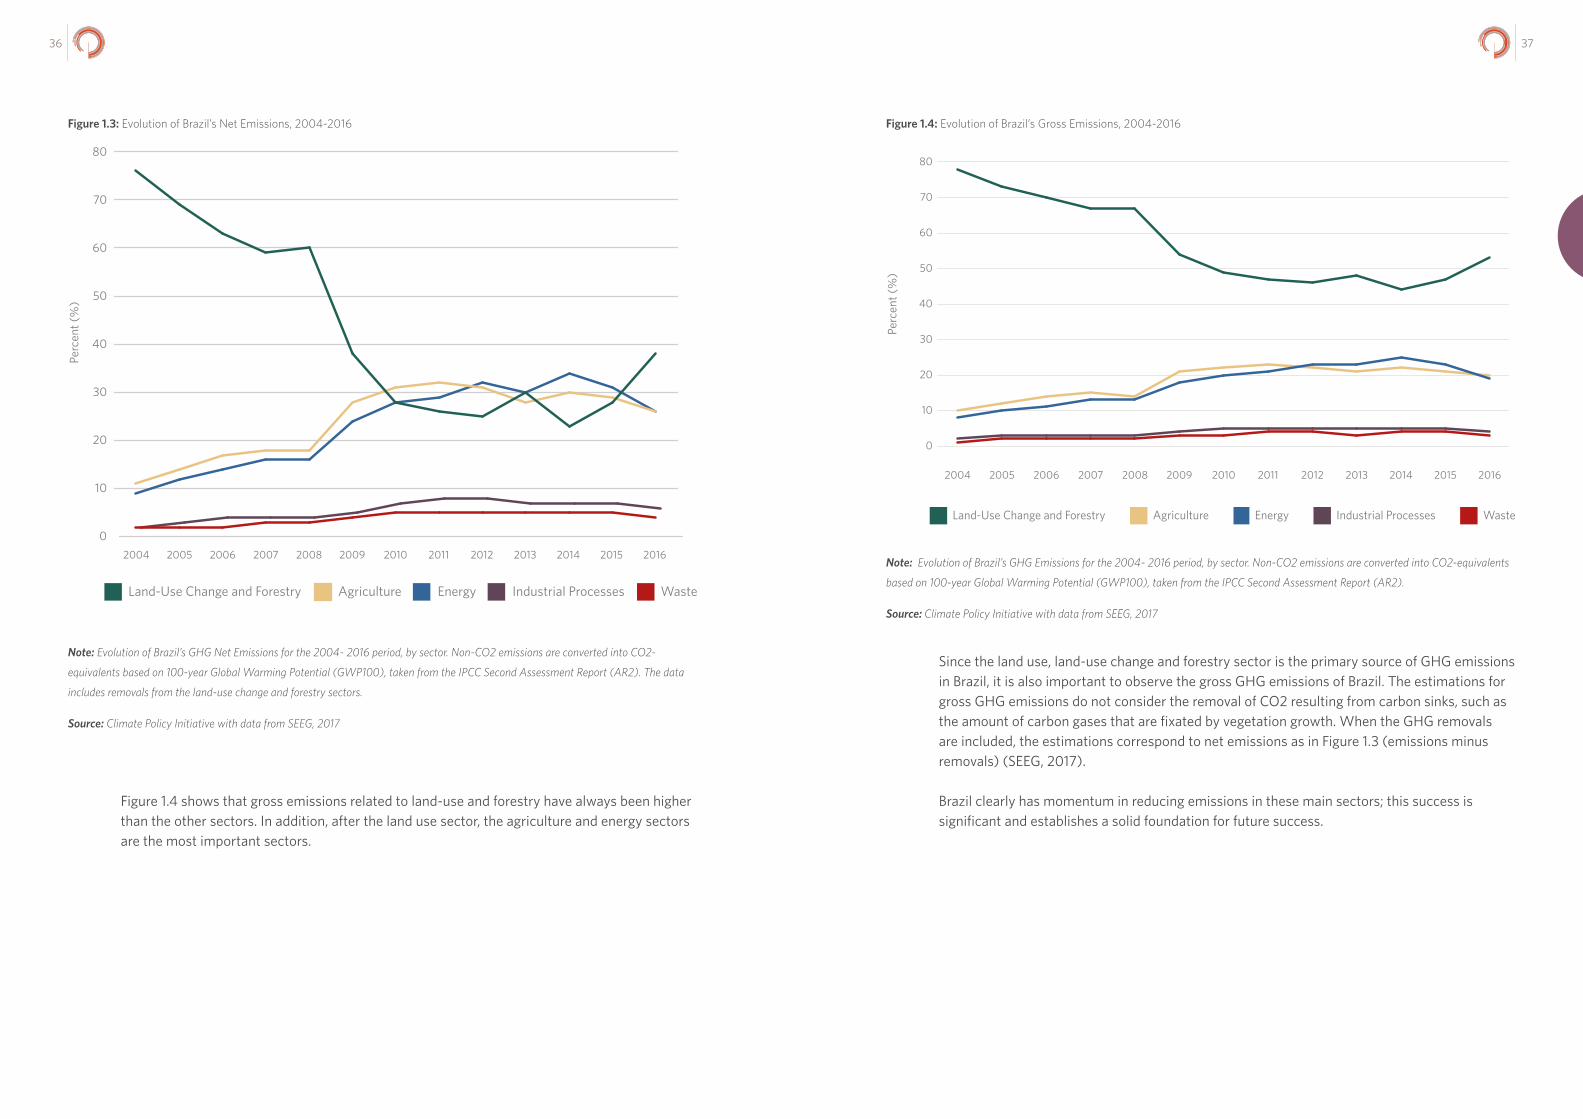
Figure 1.3: Evolution of Brazil’s Net Emissions, 2004-2016
Note: Evolution of Brazil’s GHG Net Emissions for the 2004- 2016 period, by sector. Non-CO2 emissions are converted into CO2-
equivalents based on 100-year Global Warming Potential (GWP100), taken from the IPCC Second Assessment Report (AR2). The data
includes removals from the land-use change and forestry sectors.
Source: Climate Policy Initiative with data from SEEG, 2017
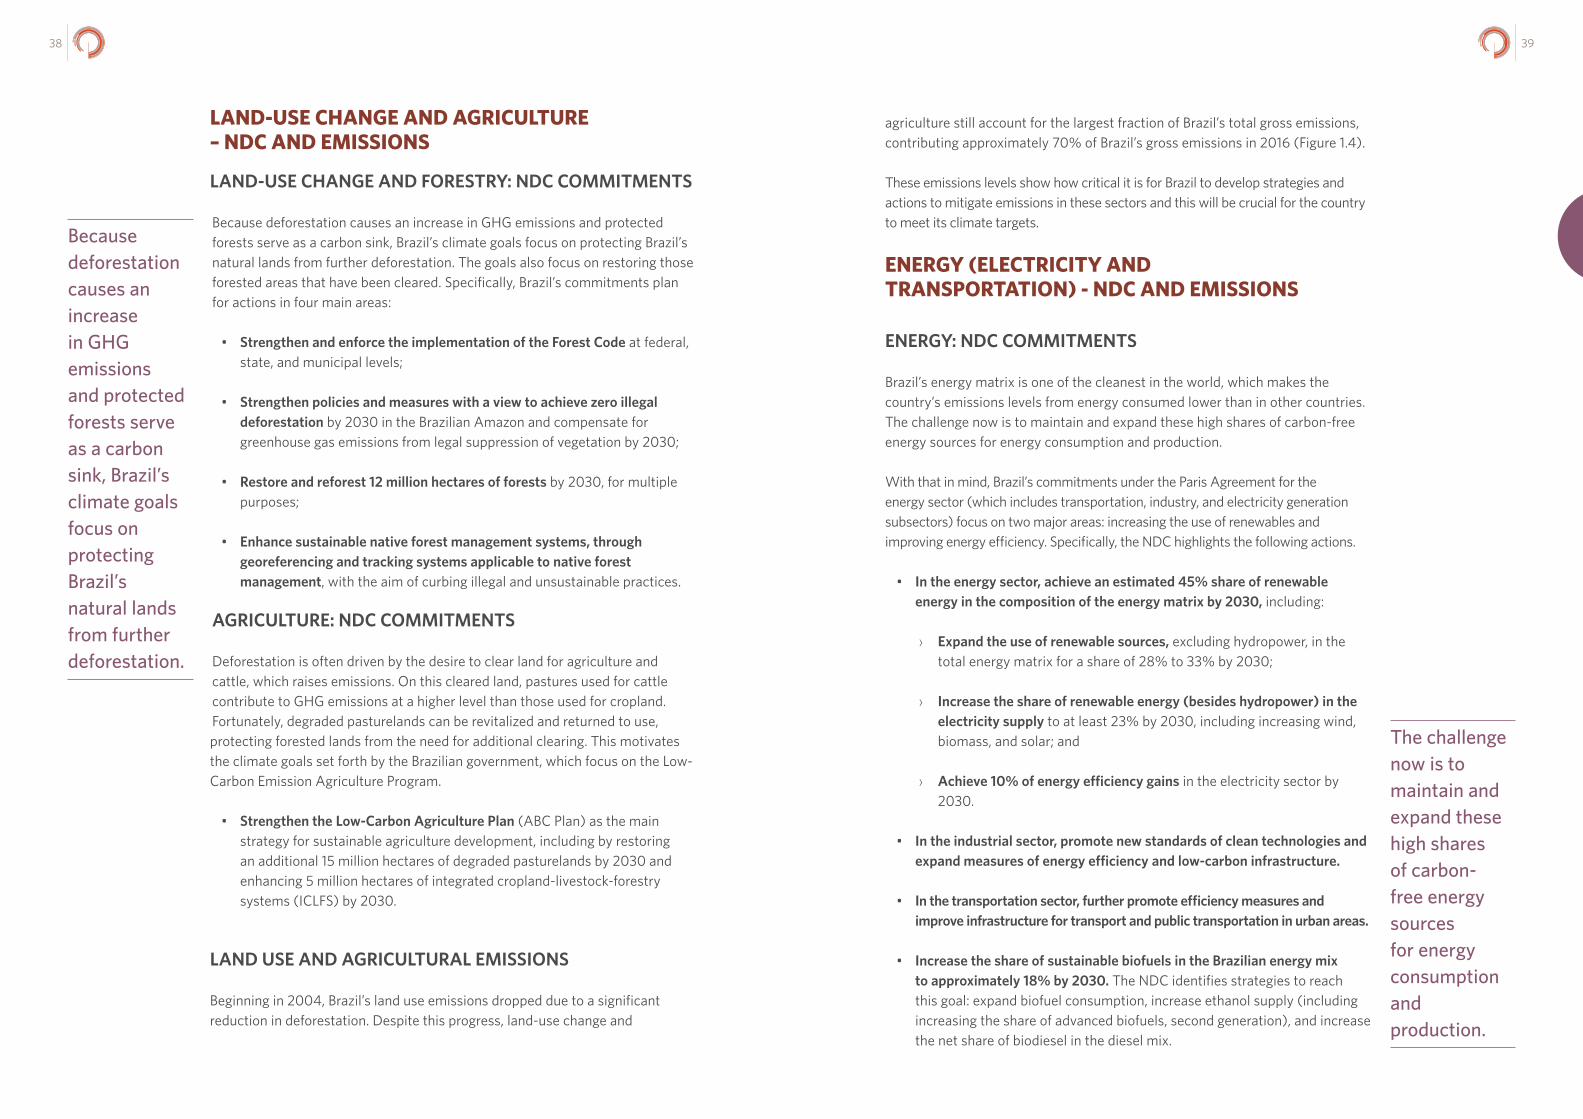
Figure 1.4 shows that gross emissions related to land-use and forestry have always been higher than the other sectors. In addition, after the land use sector, the agriculture and energy sectors are the most important sectors.
Figure 1.4: Evolution of Brazil’s Gross Emissions, 2004-2016
Note: Evolution of Brazil’s GHG Emissions for the 2004- 2016 period, by sector. Non-CO2 emissions are converted into CO2-equivalents
based on 100-year Global Warming Potential (GWP100), taken from the IPCC Second Assessment Report (AR2).
Source: Climate Policy Initiative with data from SEEG, 2017
Since the land use, land-use change and forestry sector is the primary source of GHG emissions in Brazil, it is also important to observe the gross GHG emissions of Brazil. The estimations for gross GHG emissions do not consider the removal of CO2 resulting from carbon sinks, such as the amount of carbon gases that are fixated by vegetation growth. When the GHG removals are included, the estimations correspond to net emissions as in Figure 1.3 (emissions minus removals) (SEEG, 2017).
Brazil clearly has momentum in reducing emissions in these main sectors; this success is significant and establishes a solid foundation for future success.
Land-Use Change and Forestry WasteIndustrial ProcessesEnergyAgriculture
0
10
20
30
40
50
60
70
80
2004 2005 2006 2007 2008 2009 2010 2011 2012 2013 2014 2015 2016
Perc
ent (
%)
0
10
20
30
40
50
60
70
80
WasteLand-Use Change and Forestry Agriculture Industrial ProcessesEnergy
2004 2005 2006 2007 2008 20102009 20122011 2013 2014 2015 2016
Perc
ent (
%)
3938
LAND-USE CHANGE AND AGRICULTURE – NDC AND EMISSIONS
LAND-USE CHANGE AND FORESTRY: NDC COMMITMENTS
Because deforestation causes an increase in GHG emissions and protected forests serve as a carbon sink, Brazil’s climate goals focus on protecting Brazil’s natural lands from further deforestation. The goals also focus on restoring those forested areas that have been cleared. Specifically, Brazil’s commitments plan for actions in four main areas:
• Strengthen and enforce the implementation of the Forest Code at federal, state, and municipal levels;
• Strengthen policies and measures with a view to achieve zero illegal deforestation by 2030 in the Brazilian Amazon and compensate for greenhouse gas emissions from legal suppression of vegetation by 2030;
• Restore and reforest 12 million hectares of forests by 2030, for multiple purposes;
• Enhance sustainable native forest management systems, through georeferencing and tracking systems applicable to native forest management, with the aim of curbing illegal and unsustainable practices.
AGRICULTURE: NDC COMMITMENTS
Deforestation is often driven by the desire to clear land for agriculture and cattle, which raises emissions. On this cleared land, pastures used for cattle contribute to GHG emissions at a higher level than those used for cropland. Fortunately, degraded pasturelands can be revitalized and returned to use, protecting forested lands from the need for additional clearing. This motivates the climate goals set forth by the Brazilian government, which focus on the Low-Carbon Emission Agriculture Program.
• Strengthen the Low-Carbon Agriculture Plan (ABC Plan) as the main strategy for sustainable agriculture development, including by restoring an additional 15 million hectares of degraded pasturelands by 2030 and enhancing 5 million hectares of integrated cropland-livestock-forestry systems (ICLFS) by 2030.
LAND USE AND AGRICULTURAL EMISSIONS
Beginning in 2004, Brazil’s land use emissions dropped due to a significant reduction in deforestation. Despite this progress, land-use change and
agriculture still account for the largest fraction of Brazil’s total gross emissions, contributing approximately 70% of Brazil’s gross emissions in 2016 (Figure 1.4).
These emissions levels show how critical it is for Brazil to develop strategies and actions to mitigate emissions in these sectors and this will be crucial for the country to meet its climate targets.
ENERGY (ELECTRICITY AND TRANSPORTATION) - NDC AND EMISSIONS
ENERGY: NDC COMMITMENTS
Brazil’s energy matrix is one of the cleanest in the world, which makes the country’s emissions levels from energy consumed lower than in other countries. The challenge now is to maintain and expand these high shares of carbon-free energy sources for energy consumption and production.
With that in mind, Brazil’s commitments under the Paris Agreement for the energy sector (which includes transportation, industry, and electricity generation subsectors) focus on two major areas: increasing the use of renewables and improving energy efficiency. Specifically, the NDC highlights the following actions.
• In the energy sector, achieve an estimated 45% share of renewable energy in the composition of the energy matrix by 2030, including:
› Expand the use of renewable sources, excluding hydropower, in the total energy matrix for a share of 28% to 33% by 2030;
› Increase the share of renewable energy (besides hydropower) in the electricity supply to at least 23% by 2030, including increasing wind, biomass, and solar; and
› Achieve 10% of energy efficiency gains in the electricity sector by 2030.
• In the industrial sector, promote new standards of clean technologies and expand measures of energy efficiency and low-carbon infrastructure.
• In the transportation sector, further promote efficiency measures and improve infrastructure for transport and public transportation in urban areas.
• Increase the share of sustainable biofuels in the Brazilian energy mix to approximately 18% by 2030. The NDC identifies strategies to reach this goal: expand biofuel consumption, increase ethanol supply (including increasing the share of advanced biofuels, second generation), and increase the net share of biodiesel in the diesel mix.
Because deforestation causes an increase in GHG emissions and protected forests serve as a carbon sink, Brazil’s climate goals focus on protecting Brazil’s natural lands from further deforestation.
The challenge now is to maintain and expand these high shares of carbon-free energy sources for energy consumption and production.
4140
Given the environmental and social constraints that limit the expansion of hydropower capacity, which has historically been the main energy source in the country, the targets presented above demonstrate that Brazil has decided not only to increase the share of renewable sources in its energy matrix but also to diversify it.
Regarding electricity generation, the country has been heading in the direction of promoting the deployment of alternative renewable sources (wind, solar, biomass, etc.), an area where Brazil holds great physical and economic potential. In addition, distributed generation and energy efficiency will be crucial towards reducing electricity demand in the centralized system.
The transportation sector will also play a critical role in guaranteeing a clean expansion of the energy sector, mainly through the increase of biofuels consumption as a replacement for fossil fuels. Raising mandatory biofuels blending requirements can have a large impact towards meeting the NDC targets since 61.7% of light-duty vehicles are flex-fueled (SEEG 2017).
ENERGY SECTOR EMISSIONS
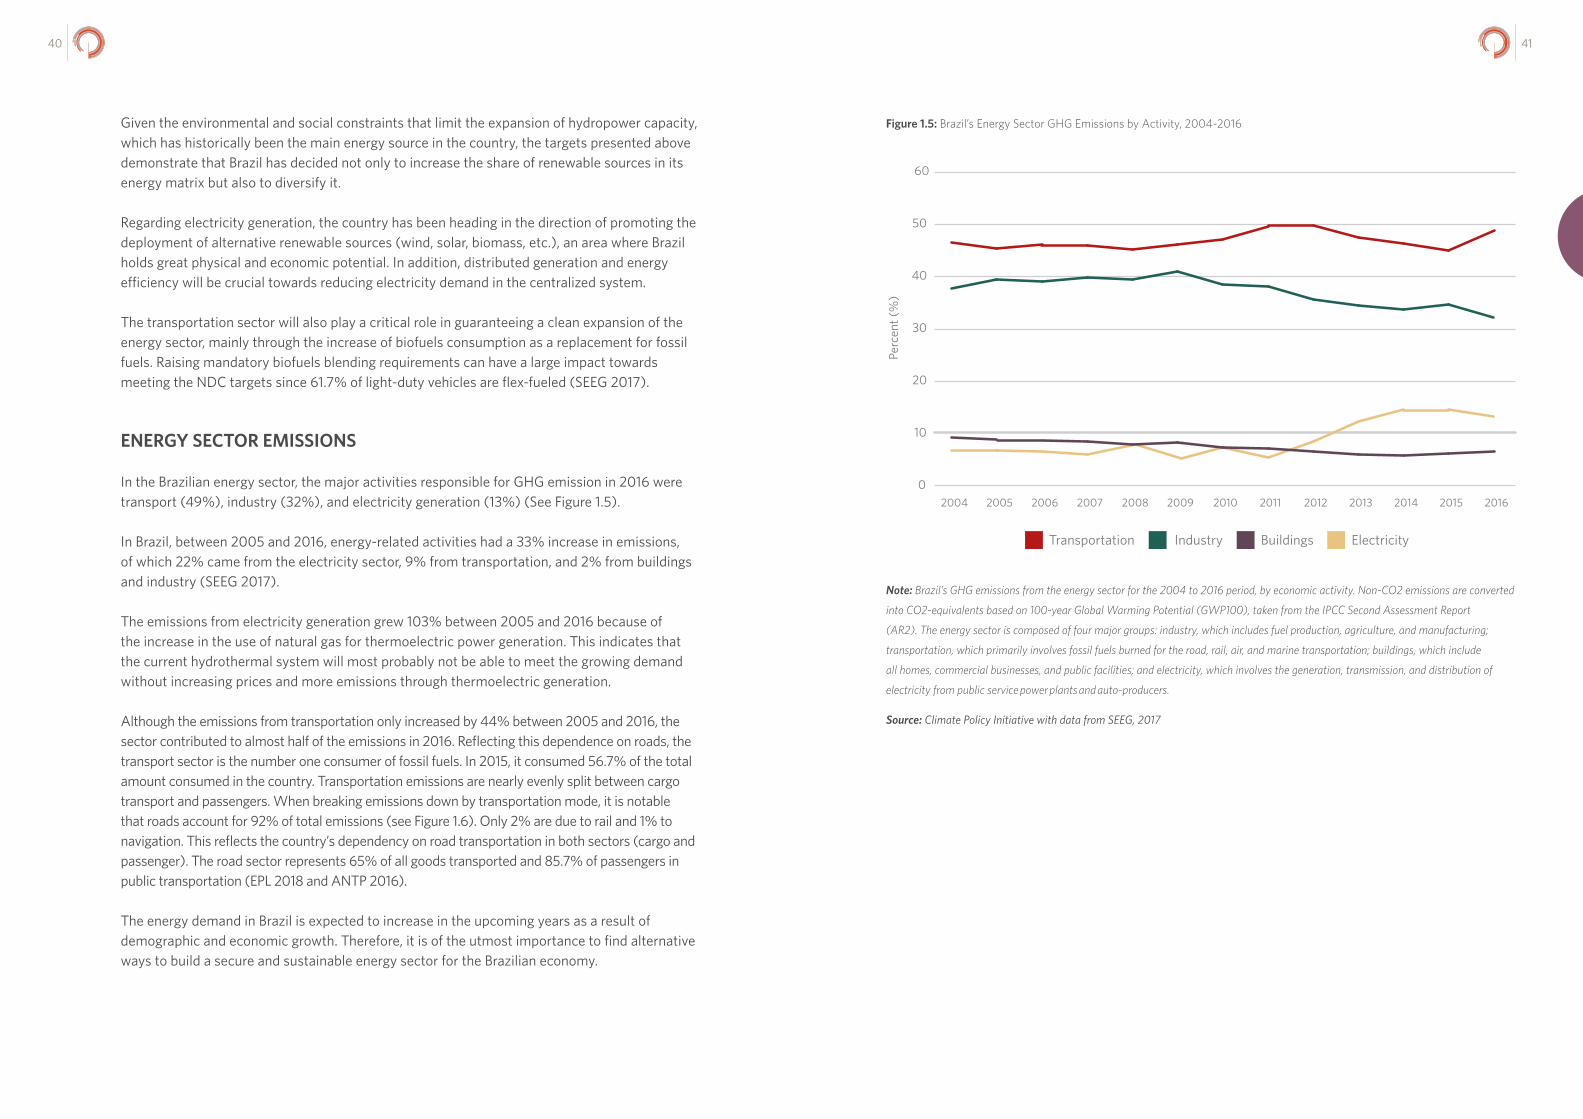
In the Brazilian energy sector, the major activities responsible for GHG emission in 2016 were transport (49%), industry (32%), and electricity generation (13%) (See Figure 1.5).
In Brazil, between 2005 and 2016, energy-related activities had a 33% increase in emissions, of which 22% came from the electricity sector, 9% from transportation, and 2% from buildings and industry (SEEG 2017).
The emissions from electricity generation grew 103% between 2005 and 2016 because of the increase in the use of natural gas for thermoelectric power generation. This indicates that the current hydrothermal system will most probably not be able to meet the growing demand without increasing prices and more emissions through thermoelectric generation.
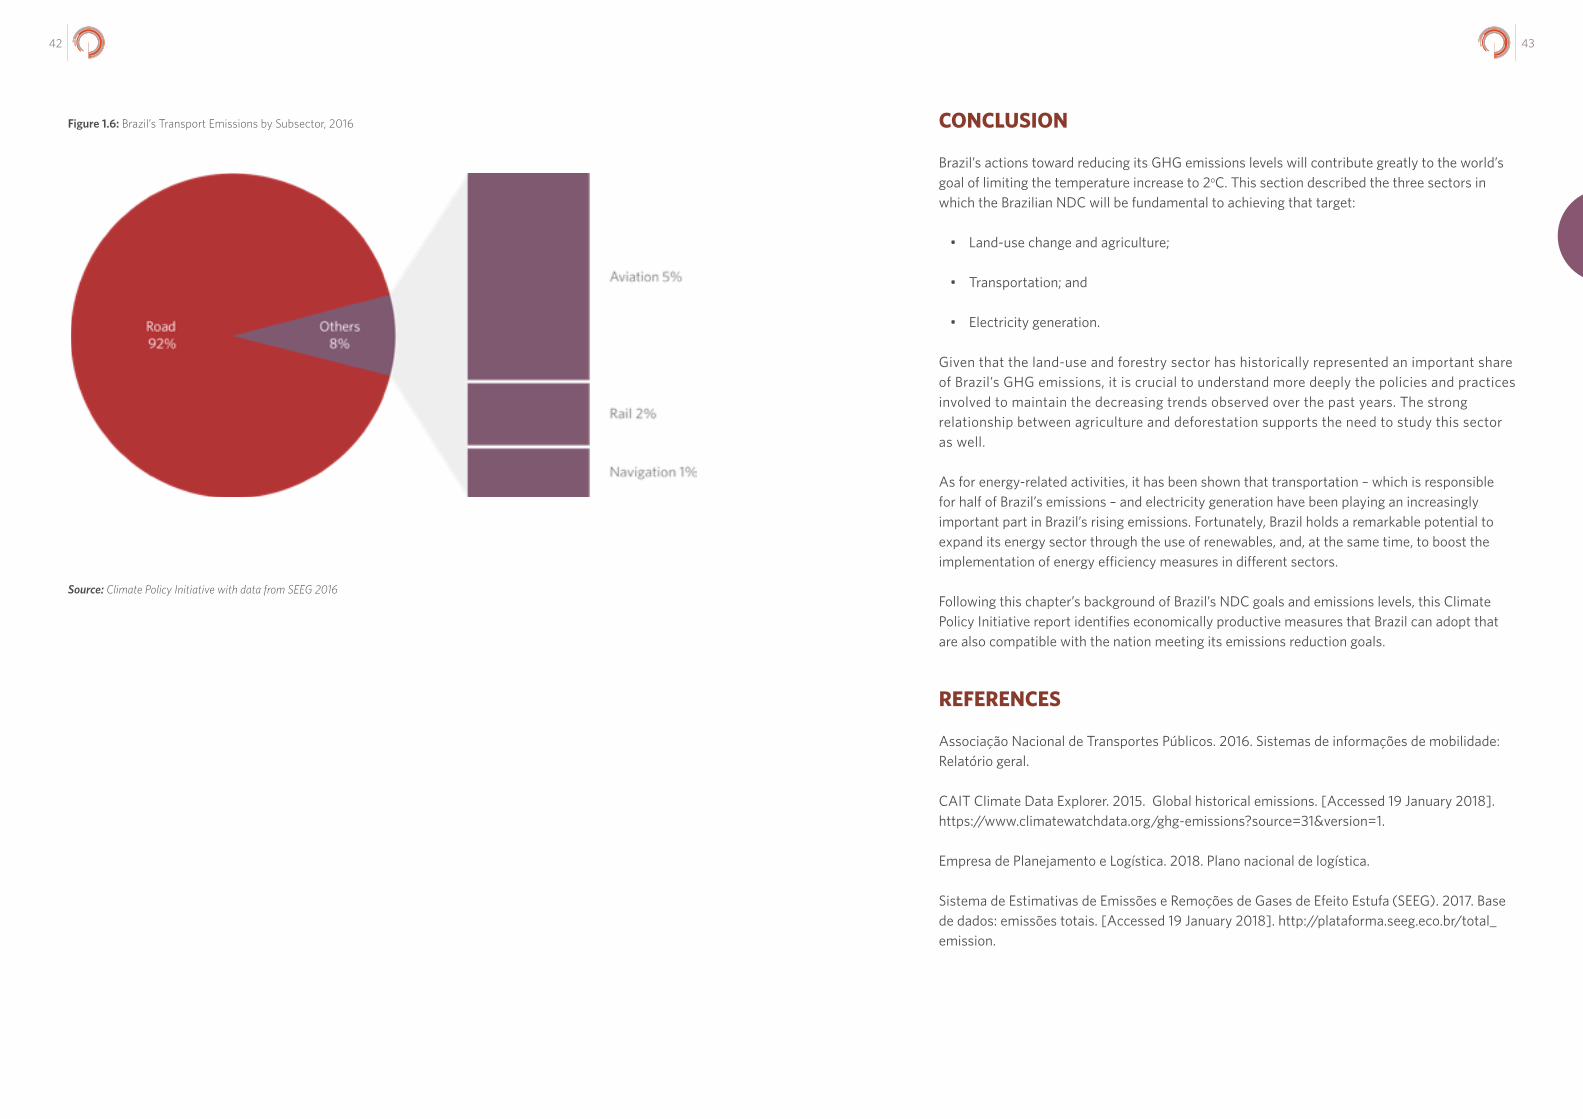
Although the emissions from transportation only increased by 44% between 2005 and 2016, the sector contributed to almost half of the emissions in 2016. Reflecting this dependence on roads, the transport sector is the number one consumer of fossil fuels. In 2015, it consumed 56.7% of the total amount consumed in the country. Transportation emissions are nearly evenly split between cargo transport and passengers. When breaking emissions down by transportation mode, it is notable that roads account for 92% of total emissions (see Figure 1.6). Only 2% are due to rail and 1% to navigation. This reflects the country’s dependency on road transportation in both sectors (cargo and passenger). The road sector represents 65% of all goods transported and 85.7% of passengers in public transportation (EPL 2018 and ANTP 2016).
The energy demand in Brazil is expected to increase in the upcoming years as a result of demographic and economic growth. Therefore, it is of the utmost importance to find alternative ways to build a secure and sustainable energy sector for the Brazilian economy.
Buildings ElectricityTransportation Industry
0
10
20
30
40
50
60
2004 2005 2006 2007 2008 2009 2010 2011 2012 2013 2014 2015 2016
Perc
ent (
%)
Figure 1.5: Brazil’s Energy Sector GHG Emissions by Activity, 2004-2016
Note: Brazil’s GHG emissions from the energy sector for the 2004 to 2016 period, by economic activity. Non-CO2 emissions are converted
into CO2-equivalents based on 100-year Global Warming Potential (GWP100), taken from the IPCC Second Assessment Report
(AR2). The energy sector is composed of four major groups: industry, which includes fuel production, agriculture, and manufacturing;
transportation, which primarily involves fossil fuels burned for the road, rail, air, and marine transportation; buildings, which include
all homes, commercial businesses, and public facilities; and electricity, which involves the generation, transmission, and distribution of
electricity from public service power plants and auto-producers.
Source: Climate Policy Initiative with data from SEEG, 2017
4342
CONCLUSION
Brazil’s actions toward reducing its GHG emissions levels will contribute greatly to the world’s goal of limiting the temperature increase to 2oC. This section described the three sectors in which the Brazilian NDC will be fundamental to achieving that target:
• Land-use change and agriculture;
• Transportation; and
• Electricity generation.
Given that the land-use and forestry sector has historically represented an important share of Brazil’s GHG emissions, it is crucial to understand more deeply the policies and practices involved to maintain the decreasing trends observed over the past years. The strong relationship between agriculture and deforestation supports the need to study this sector as well.
As for energy-related activities, it has been shown that transportation – which is responsible for half of Brazil’s emissions – and electricity generation have been playing an increasingly important part in Brazil’s rising emissions. Fortunately, Brazil holds a remarkable potential to expand its energy sector through the use of renewables, and, at the same time, to boost the implementation of energy efficiency measures in different sectors.
Following this chapter’s background of Brazil’s NDC goals and emissions levels, this Climate Policy Initiative report identifies economically productive measures that Brazil can adopt that are also compatible with the nation meeting its emissions reduction goals.
REFERENCES
Associação Nacional de Transportes Públicos. 2016. Sistemas de informações de mobilidade: Relatório geral.
CAIT Climate Data Explorer. 2015. Global historical emissions. [Accessed 19 January 2018]. https://www.climatewatchdata.org/ghg-emissions?source=31&version=1.
Empresa de Planejamento e Logística. 2018. Plano nacional de logística.
Sistema de Estimativas de Emissões e Remoções de Gases de Efeito Estufa (SEEG). 2017. Base de dados: emissões totais. [Accessed 19 January 2018]. http://plataforma.seeg.eco.br/total_emission.
Figure 1.6: Brazil’s Transport Emissions by Subsector, 2016
Source: Climate Policy Initiative with data from SEEG 2016
4544
LANDUSE
TRANSFORMING BRAZIL’S LAND USE, AGRICULTURE, AND FORESTRY PRACTICES INTO STRATEGIES FOR ECONOMIC GROWTH AND SUSTAINABILITY
LAND USEECONOMIC ANALYSIS
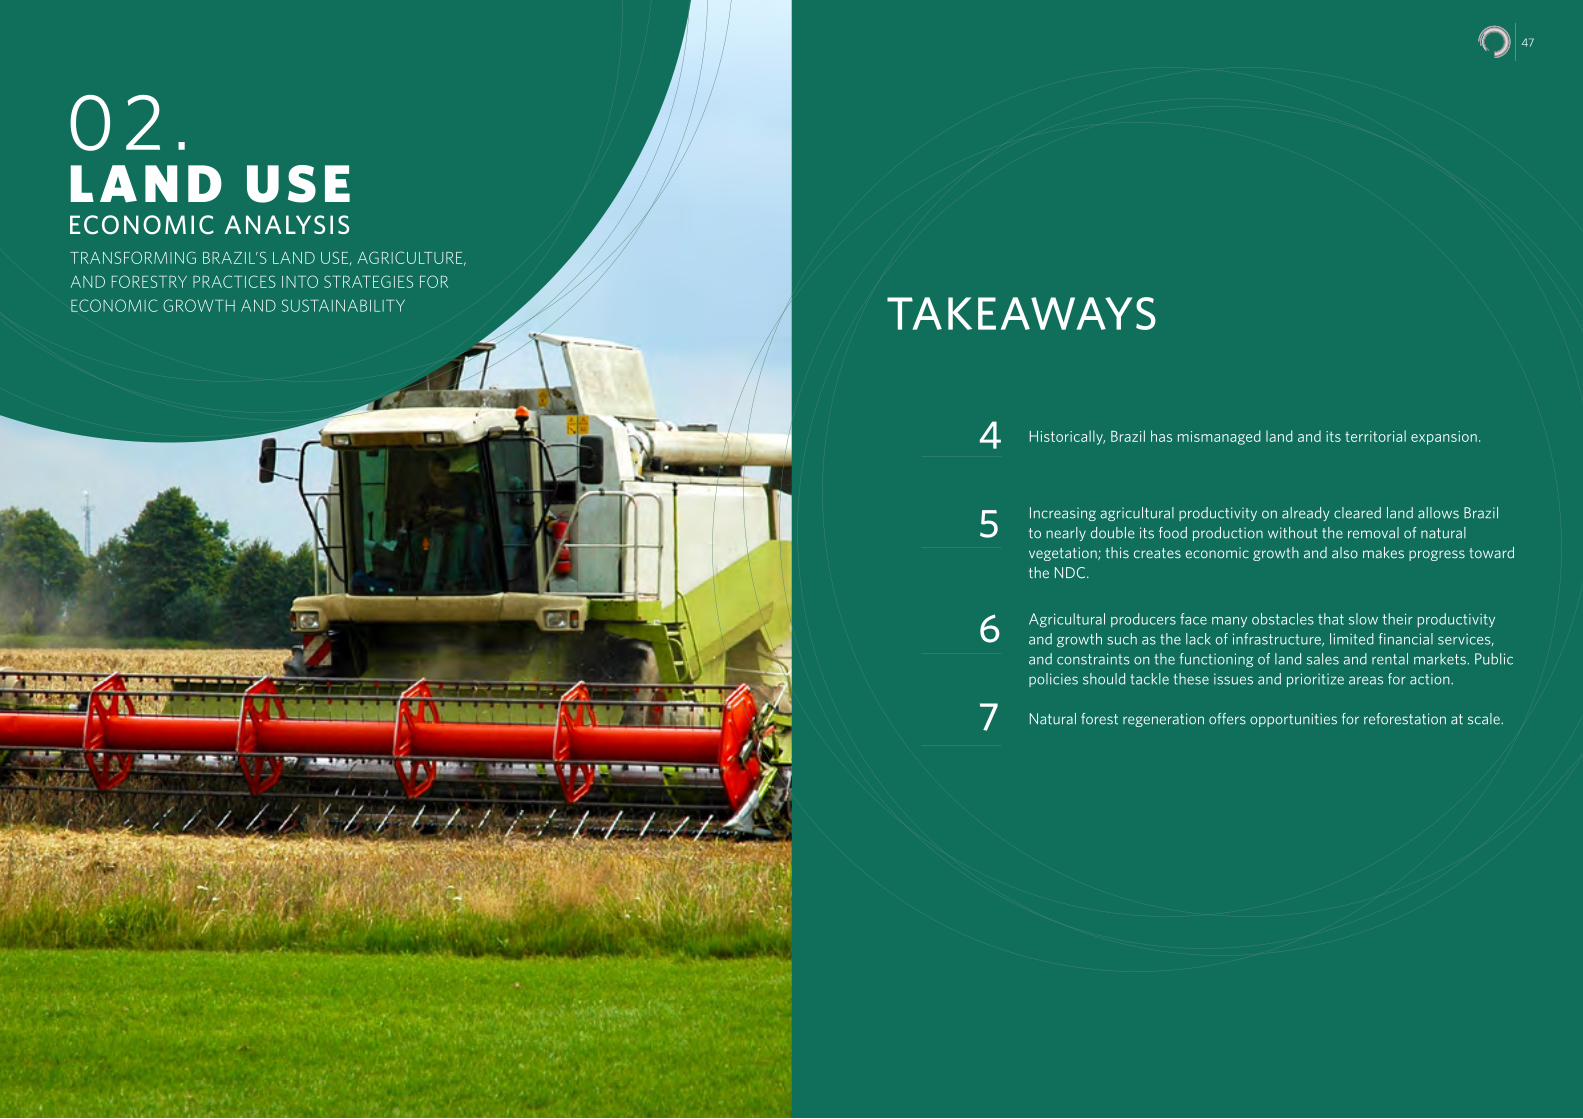
Historically, Brazil has mismanaged land and its territorial expansion.
Increasing agricultural productivity on already cleared land allows Brazil to nearly double its food production without the removal of natural vegetation; this creates economic growth and also makes progress toward the NDC.
Agricultural producers face many obstacles that slow their productivity and growth such as the lack of infrastructure, limited financial services, and constraints on the functioning of land sales and rental markets. Public policies should tackle these issues and prioritize areas for action.
Natural forest regeneration offers opportunities for reforestation at scale.
TAKEAWAYS
4
5
6
7
47
02 .
4948
Given its abundant biodiversity and the sweeping scale of the Amazon rainforest, Brazil plays a critical role as steward to vast natural resources. The nation’s success in slowing deforestation and emissions through stronger enforcement, as well as passing the 2012 Forest Code, bode well for its ability to meet its NDC. Indeed, a main theme of this report is that Brazil can meet its NDC targets through promoting advances in agriculture productivity and by maximizing its forest protection and restoration.
Brazil has made significant investments in its land to become a leading world agricultural producer. However, CPI researchers show that the inefficient use of agricultural and cleared areas has created a situation where Brazil does not necessarily face a trade-off between increasing agricultural production and slowing deforestation. The nation has transitioned from land-intensive farming practices that depended primarily on area expansion to those that are more technologically efficient. This transition has helped slow deforestation by allowing producers to do more on their existing land. By transitioning the already cleared lands to crop production and improving cattle grazing efficiency on existing lands, Brazil can accelerate its growth without making additional environmental compromises.
HOW BRAZIL USES ITS LAND TODAY
Brazil’s abundance of land has shaped its agricultural and natural resource policies, institutions, and technological choices since the colonial period. Policies that initially sought to strengthen border defense and occupy the nation’s territory had long-lasting impacts on land use, particularly in the agricultural sector. Outdated and misaligned policies, which are still widespread today, have left much of Brazil’s land unmatched to its most productive purposes and largely ignore natural resource protection.
In the early stages of Brazil’s agrarian economy, rentier landowners succeeded based mainly on their access to slave labor to farm large tracts of land. The availability of slaves expanded slash-and-burn agricultural practices, increasing the amount of land dedicated to farming, but without creating incentives for yield gains or increasing labor productivity. These practices considerably distorted the use of the land.
Cattle raising has also been an important component of the territorial occupation process. Besides food, cattle provide the means to overcome the lack of transport infrastructure needed to get crops to market and help to establish entitlement in cases where property rights depend upon effective use of land.
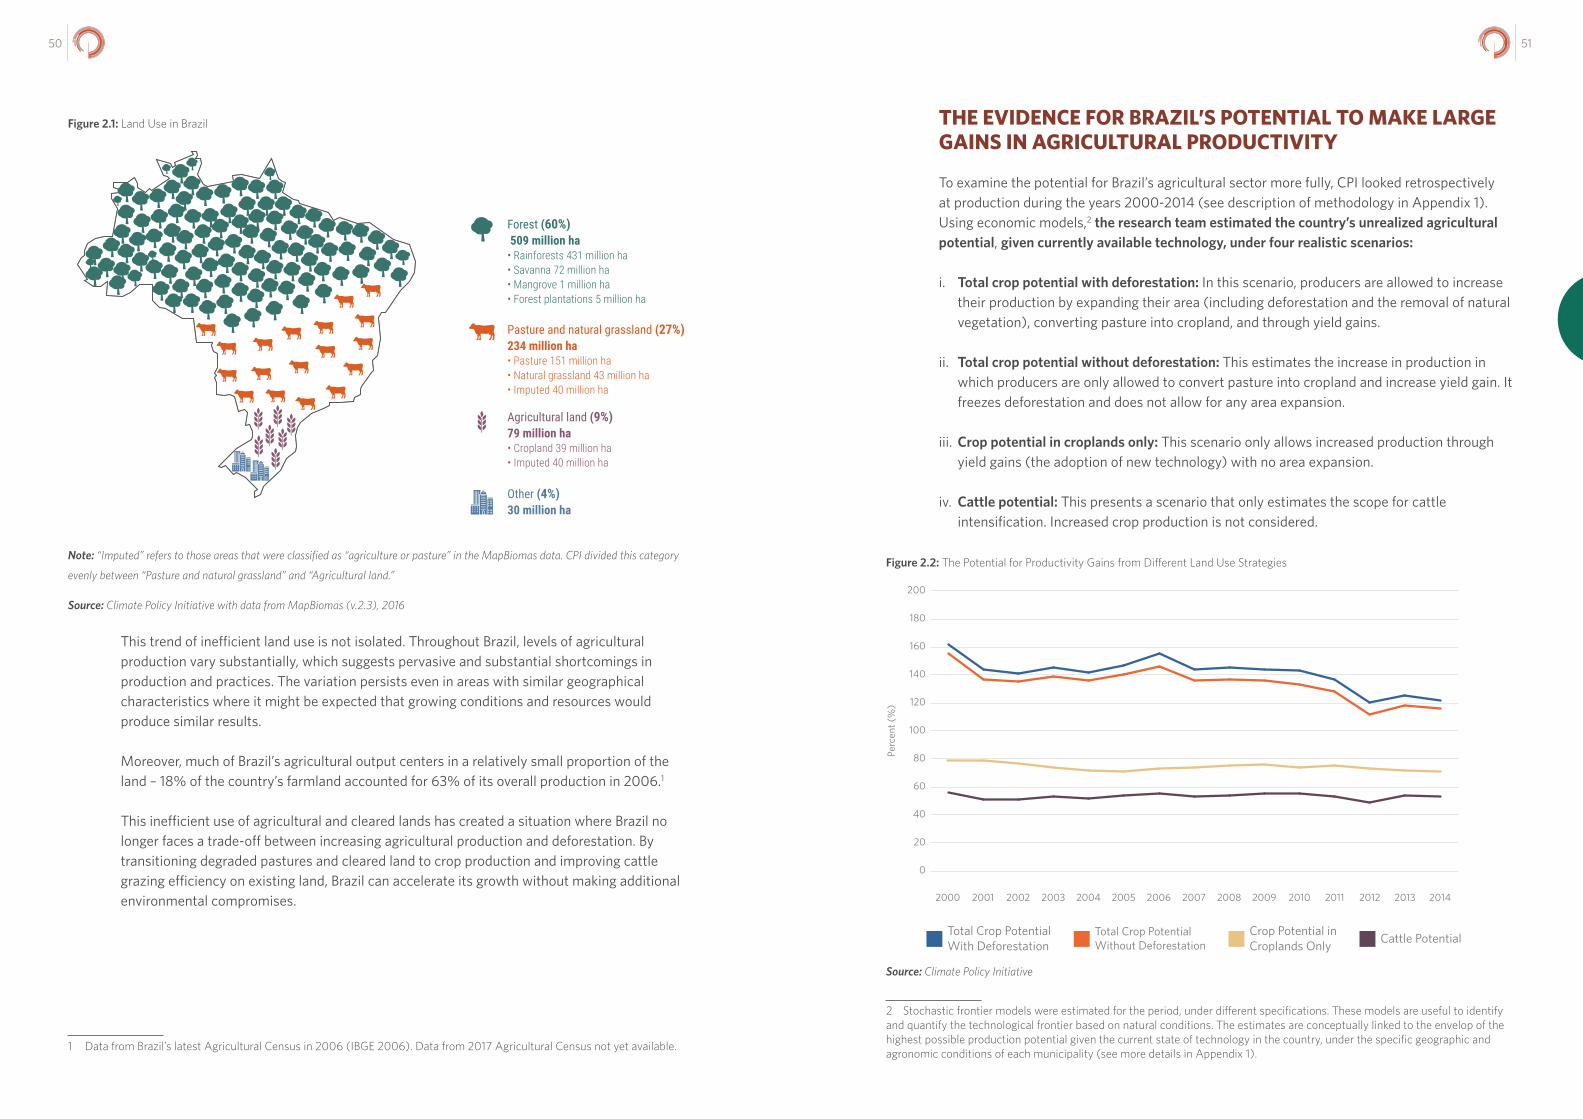
Today, the area occupied by native vegetation represents one half of the Brazilian territory. From the remaining area, more than 70% is covered by pastures, which are often cleared lands (Figure 2.1). Pastures, which are mainly used to raise cattle, yield as few as a single head per hectare on average, which makes cattle raising a relatively unproductive use of land.
Brazil can meet its NDC targets by promoting advances in agriculture productivity and maximizing its forest protection and restoration.
5150
Figure 2.1: Land Use in Brazil THE EVIDENCE FOR BRAZIL’S POTENTIAL TO MAKE LARGE GAINS IN AGRICULTURAL PRODUCTIVITY
To examine the potential for Brazil’s agricultural sector more fully, CPI looked retrospectively at production during the years 2000-2014 (see description of methodology in Appendix 1). Using economic models,2 the research team estimated the country’s unrealized agricultural potential, given currently available technology, under four realistic scenarios:
i. Total crop potential with deforestation: In this scenario, producers are allowed to increase their production by expanding their area (including deforestation and the removal of natural vegetation), converting pasture into cropland, and through yield gains.
ii. Total crop potential without deforestation: This estimates the increase in production in which producers are only allowed to convert pasture into cropland and increase yield gain. It freezes deforestation and does not allow for any area expansion.
iii. Crop potential in croplands only: This scenario only allows increased production through yield gains (the adoption of new technology) with no area expansion.
iv. Cattle potential: This presents a scenario that only estimates the scope for cattle intensification. Increased crop production is not considered.
Figure 2.2: The Potential for Productivity Gains from Different Land Use Strategies
Source: Climate Policy Initiative
2 Stochastic frontier models were estimated for the period, under different specifications. These models are useful to identify and quantify the technological frontier based on natural conditions. The estimates are conceptually linked to the envelop of the highest possible production potential given the current state of technology in the country, under the specific geographic and agronomic conditions of each municipality (see more details in Appendix 1).
Note: “Imputed” refers to those areas that were classified as “agriculture or pasture” in the MapBiomas data. CPI divided this category
evenly between “Pasture and natural grassland” and “Agricultural land.”
Source: Climate Policy Initiative with data from MapBiomas (v.2.3), 2016
This trend of inefficient land use is not isolated. Throughout Brazil, levels of agricultural production vary substantially, which suggests pervasive and substantial shortcomings in production and practices. The variation persists even in areas with similar geographical characteristics where it might be expected that growing conditions and resources would produce similar results.
Moreover, much of Brazil’s agricultural output centers in a relatively small proportion of the land – 18% of the country’s farmland accounted for 63% of its overall production in 2006.1
This inefficient use of agricultural and cleared lands has created a situation where Brazil no longer faces a trade-off between increasing agricultural production and deforestation. By transitioning degraded pastures and cleared land to crop production and improving cattle grazing efficiency on existing land, Brazil can accelerate its growth without making additional environmental compromises.
1 Data from Brazil’s latest Agricultural Census in 2006 (IBGE 2006). Data from 2017 Agricultural Census not yet available.
Other (4%)30 million ha
Forest (60%) 509 million ha• Rainforests 431 million ha• Savanna 72 million ha• Mangrove 1 million ha• Forest plantations 5 million ha
Agricultural land (9%)79 million ha• Cropland 39 million ha• Imputed 40 million ha
Pasture and natural grassland (27%)234 million ha• Pasture 151 million ha• Natural grassland 43 million ha• Imputed 40 million ha
Source: Mapbiomas 2017
Note: Imputed categories refer to 50% of the areas classified as agriculture or pasture. The allocation of 50% for each category makes the cropland figure compatible with other sources.
0
20
40
60
80
100
120
140
160
180
200
2000Pe
rcen
t (%
)2001 2002 2003 2004 2005 2006 2007 2008 2009 2010 2011 2012 2013 2014
Total Crop PotentialWithout Deforestation
Total Crop PotentialWith Deforestation
Crop Potential inCroplands Only Cattle Potential
5352
Figure 2.2 above summarizes the outcome of this analysis; there are four critical insights. First, Brazil has a huge opportunity to increase agricultural production through enhancing productivity strategies such as intensifying cattle production or by increasing yields on existing croplands. By pursuing these strategies alone, Brazil can more than double crop productivity and increase cattle herds by 70%.
The second insight from this exercise is even more impressive. The analysis shows that if Brazil were to pursue its crop potential on all available lands – promoting conversion of pasture to cropland and encouraging increased productivity through yield gains – the realized potential gain would still nearly double.
What is so striking about this finding? It means that Brazil does not need to deforest to realize almost all the agricultural production gap. Brazil can achieve enormous agricultural gains without the need for deforestation or the removal of natural vegetation.
Third, the evolution of the potential gains across the time period studied reveals the advances in crop production, primarily through pastureland conversions. Note the downward slope of the total crop potential in all lands is more pronounced than the slope of the crop potential in cropland only. This downward trend means the gap between the two is reducing over time, i.e., the country is improving and realizing its potential. However, the crop potential in current croplands is not decreasing as much. This difference suggests that most of the gains observed in the period, associated with the realization of the potential, resulted from the conversion of pastures into crops.
Finally, the crop potential in all available lands (without deforestation) during the 2000-2014 period is much higher than that of the cattle ranching, even when cattle production has been intensified.
In addition to this analysis, CPI identified evidence in separate studies that shows Brazil has a long track record of successfully modernizing its agricultural practices and reducing deforestation pressures. The researchers examined three separate drivers of Brazil’s agricultural productivity: access to electricity, uptake of more productive crops (soybeans), and an expansion of the sugarcane industry. They discovered, in each case, that improvements in technological innovation led to changes in land use patterns that increased productivity, without inducing deforestation. Box 2.1 features the evidence from these three studies.
It is important to recognize that the existence of this enormous agricultural potential does not imply necessarily that farmers are not doing the best they can, given the conditions they face. The unrealized potential may be associated with obstacles and market failures that prevent them from cultivating their land efficiently.
BOX 2.1: EVIDENCE FROM THREE CPI STUDIES: BRAZIL CAN IMPROVE AGRICULTURAL PRODUCTIVITY WHILE PROTECTING FORESTS
This box shares evidence from three separate studies that demonstrate how agricultural production is compatible with forest protection (Climate Policy Initiative, 2017). The findings illustrate that it is possible to shift Brazil’s land use at scale through technological innovation and dissemination, private investment, and improved policies. The findings also show that such changes in land use generate broader economic benefits. Brazil can meet its NDC targets through promoting advances in agriculture productivity.
1. After Introducing Electricity to Rural Areas, Productivity Improves and Deforestation Slows (Assunção et al. 2016)
Between 1960 and 2000, Brazil expanded access to electric power throughout large parts of its rural areas. CPI researchers used this expansion, which naturally brought improved technologies to farms, as a means for understanding how improved productivity affects land use decisions. They found that the arrival of electric power in a county induced farmers to shift away from cattle grazing toward crop cultivation. A ten percent increase in access to electric power led to a 3-percentage point decrease in land dedicated to cattle grazing. It seems this shift occurred because the electricity improved crop productivity but did not increase the productivity of raising cattle. Therefore, the more farmers shifted toward growing crops, the more they raised their productive activity.
These farmers who intensified their crop production were also more likely to retain native vegetation, the study showed. They also changed the types of crops they grew. They moved away from lower-yielding crops, such as cassava, and planted higher-yielding ones, such as grains. These findings emphasize how improved productivity in one agricultural area can shift activities and save lands from clearings.
2. Adapting Soybeans to the Brazilian Cerrado Raises Productivity, Shifts Investments away from Deforestation (Assunção and Bragança 2015)
A second CPI study investigated the impact of innovations that adapted soybeans and allowed their cultivation to thrive in Central Brazil. During the 1970s, research and development efforts introduced soybean cultivation throughout the Brazilian Cerrado. The adaptation of soy to suit Central Brazil’s growing conditions represented a major technological change, and it reshaped agriculture in the region. CPI researchers compared results for municipalities with high and low potential for soybean cultivation so they could distinguish the effect of this particular innovation from the agricultural expansion that was happening all over Central Brazil.
The results show that these technological innovations created not only economic but also environmental benefits. After the introduction of the adapted soybean, a major shift in land use toward soybean cultivation occurred. Total cropland expanded, too. However, this expansion happened mostly through substitution of native pastures. As the rise in cropland was smaller than the decline in native pastures, deforestation increased less in municipalities that were more suitable for soybean cultivation. Increases in fertilizer adoption and tractor use accompanied the changes in land use, suggesting that the new technological innovations led to a substitution from investments in forest clearing for investments in more modern methods of production. The economic benefits associated with the technological innovations were also relevant and were reflected in higher farm and land values.
53
Brazil can achieve enormous agricultural gains without the need for deforestation or the removal of natural vegetation.
5554
CPI has also documented several factors that slow productivity and keep farmers from realizing the full potential of their lands. Tackling these issues is a natural role of public policies and should be seen as priority areas for action. They include:
• Remove constraints on the functioning of land sales and land rental markets.
• Build infrastructure.
• Expand financial services.
• Provide information networks and technical assistance.
• Improve human capital.
Besides these areas, the implementation of the Forest Code can help boost productivity. Since it imposes a limit on area expansion, the code emulates a market signal towards intensification, incentivizing production expansions through yield gains rather than clearing new forest areas.
AGRICULTURAL PRODUCTIVITY AND ITS ROLE IN MEETING BRAZIL’S NDC
As the evidence in this section shows, Brazil can meet its NDC targets through promoting advances in agriculture productivity. The findings summarized in Figure 2.2 and Box 2.1 demonstrate that Brazil can double its productivity through converting pastures into croplands and increasing yield gains; and, Brazil can do this without further deforestation. Eliminating the need for clearing land for agriculture will reduce emissions and help protect the forests. Increasing yield gains results in economic growth.
Halting the encroachment of agricultural activities on forested areas and increasing productivity play an important role in reducing Brazil’s emissions from land use. However, without increasing the adoption of sustainable agricultural practices, such as rotational grazing, no-till farming, integrated systems (cattle-crop, cattle-crop-forestry) and agroforestry activities, Brazil will fall short of its NDC target. But the adoption of such practices is also profitable. Supporting technical and financial assistance to change agricultural practices is critical to ensuring that Brazil transforms its agricultural sector into a more sustainable business.
Furthermore, to meet its land use NDC, Brazil must ensure its forests are managed to maximize protection and restoration. The next section focuses on these two issues.
BRAZIL’S POTENTIAL FOR MEETING ITS NDC THROUGH MAXIMIZING THE PROTECTION AND RESTORATION OF ITS FORESTS
As highlighted in this report’s introduction, one of Brazil’s main drivers of emissions is land use change due largely to deforestation. In 2015, land use change accounted for 55% of Brazil’s emissions (Sistema de Registro Nacional de Emissões, n/d), which motivated Brazil to target forest protection and restoration as strategies for meeting its NDC. These strategies are summarized in Box 2.2.
3. Expanding Sugarcane Mills in Mato Grosso do Sul Leads to a Jump in Productivity, Reduction in Deforestation (Assunção, Pietracci, and Souza 2016)
Between 2005 and 2012, large private investors constructed 14 sugarcane mills in the Brazilian state of Mato Grosso do Sul (MS), a booming agricultural region the size of Germany. The mills increased the sugarcane cropland area by more than 300%, compared to an increase of almost 70% in Brazil over the same period. The bulk of sugarcane area expansion in MS occurred on pasturelands. The sugarcane expansion also created positive co-benefits for agriculture, particularly by increasing grain – soybean and
corn – productivity. The expansion also positively influenced other economic sectors. Three years after a mill was built, the findings show that a typical municipality had a 30% increase in GDP in addition to population increases of 10%, employment jumps of 40%, a wage hike of 44%, and a tax revenue increase of 31%.
The new mills also attracted suppliers of agricultural inputs and services, a more skilled labor force, and an increased provision of rural credit, which may have benefited all local agricultural producers. Moreover, there were positive environmental impacts. After three years, municipalities with new mills reduced deforestation by 6,300 hectares on average.
(CONT.) BOX 2.1: EVIDENCE FROM THREE CPI STUDIES: BRAZIL CAN IMPROVE AGRICULTURAL PRODUCTIVITY WHILE PROTECTING FORESTS
BOX 2.2: BRAZIL’S NDC STRATEGIES FOR FOREST PROTECTION UNDER THE PARIS AGREEMENT
Brazil committed to the following in its NDC:
• Strengthen and enforce the implementation of the Forest Code, at federal, state and municipal levels.
• Strengthen policies and measures with a view to achieve zero illegal deforestation by 2030 in the Brazilian Amazon and compensate for greenhouse gas emissions from legal suppression of vegetation by 2030.
• Restore and reforest 12 million hectares of forests by 2030, for multiple purposes.
• Enhance sustainable native forest management systems, through georeferencing and tracking systems applicable to native forest management, with the aim of curbing illegal and unsustainable practices.
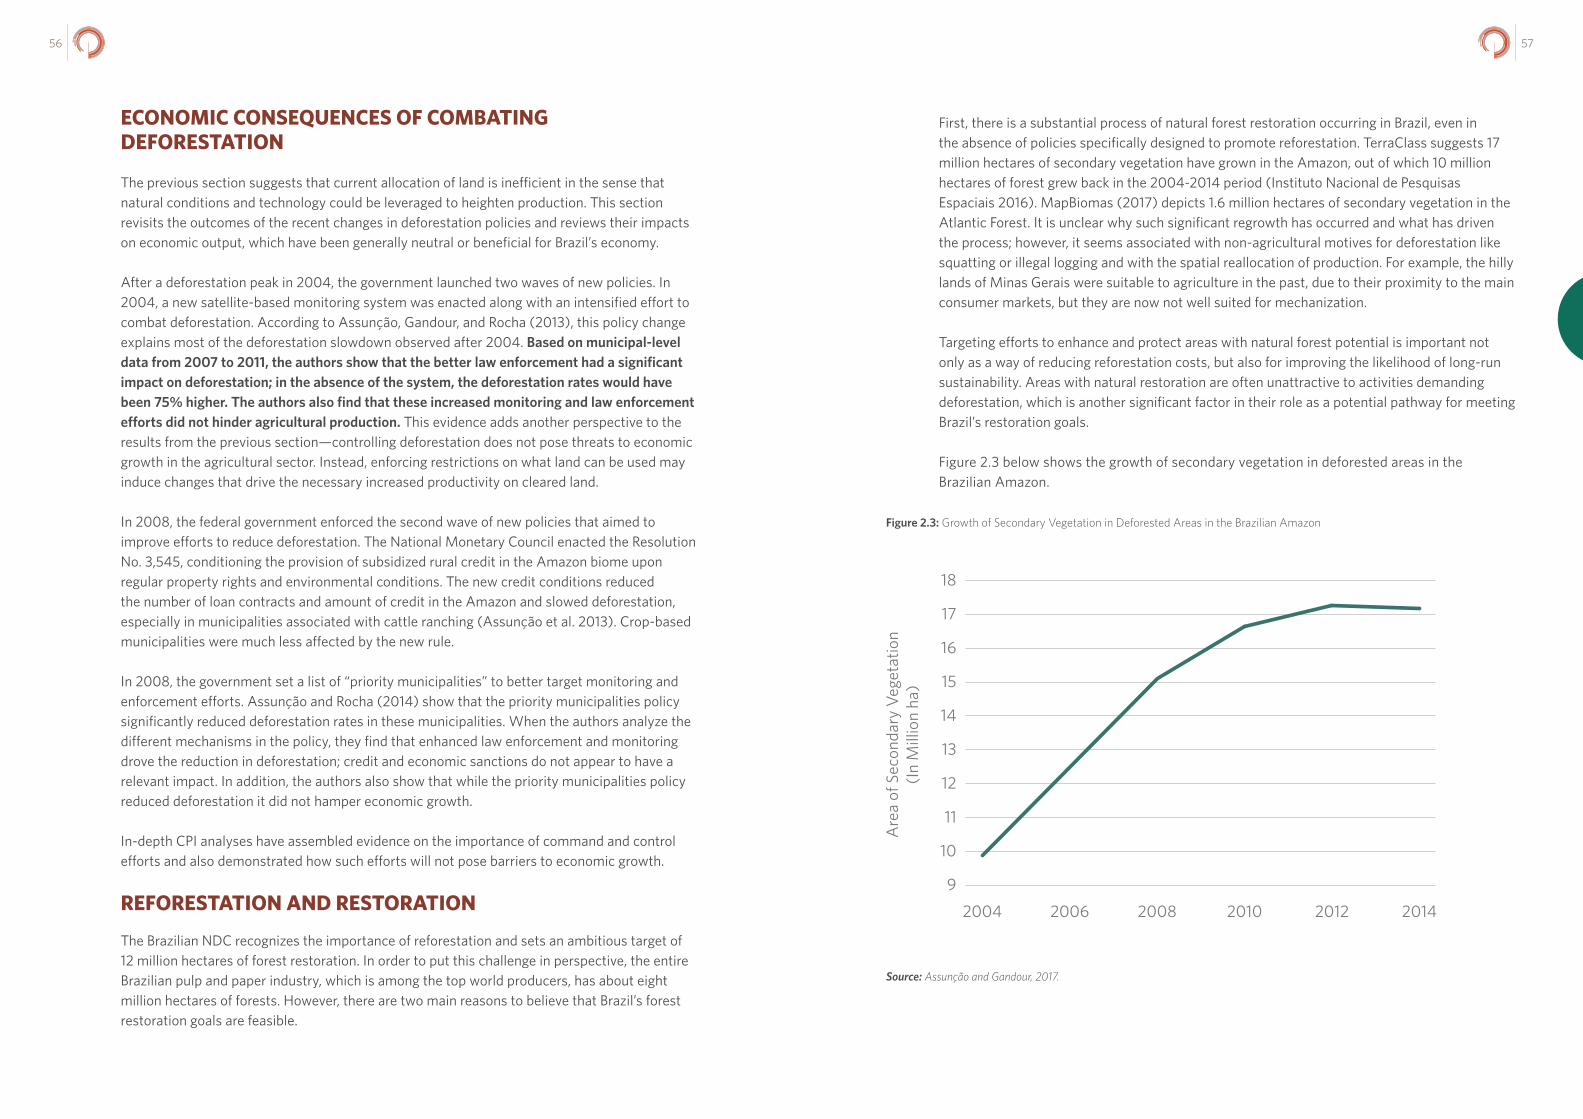
5756
ECONOMIC CONSEQUENCES OF COMBATING DEFORESTATION
The previous section suggests that current allocation of land is inefficient in the sense that natural conditions and technology could be leveraged to heighten production. This section revisits the outcomes of the recent changes in deforestation policies and reviews their impacts on economic output, which have been generally neutral or beneficial for Brazil’s economy.
After a deforestation peak in 2004, the government launched two waves of new policies. In 2004, a new satellite-based monitoring system was enacted along with an intensified effort to combat deforestation. According to Assunção, Gandour, and Rocha (2013), this policy change explains most of the deforestation slowdown observed after 2004. Based on municipal-level data from 2007 to 2011, the authors show that the better law enforcement had a significant impact on deforestation; in the absence of the system, the deforestation rates would have been 75% higher. The authors also find that these increased monitoring and law enforcement efforts did not hinder agricultural production. This evidence adds another perspective to the results from the previous section—controlling deforestation does not pose threats to economic growth in the agricultural sector. Instead, enforcing restrictions on what land can be used may induce changes that drive the necessary increased productivity on cleared land.
In 2008, the federal government enforced the second wave of new policies that aimed to improve efforts to reduce deforestation. The National Monetary Council enacted the Resolution No. 3,545, conditioning the provision of subsidized rural credit in the Amazon biome upon regular property rights and environmental conditions. The new credit conditions reduced the number of loan contracts and amount of credit in the Amazon and slowed deforestation, especially in municipalities associated with cattle ranching (Assunção et al. 2013). Crop-based municipalities were much less affected by the new rule.
In 2008, the government set a list of “priority municipalities” to better target monitoring and enforcement efforts. Assunção and Rocha (2014) show that the priority municipalities policy significantly reduced deforestation rates in these municipalities. When the authors analyze the different mechanisms in the policy, they find that enhanced law enforcement and monitoring drove the reduction in deforestation; credit and economic sanctions do not appear to have a relevant impact. In addition, the authors also show that while the priority municipalities policy reduced deforestation it did not hamper economic growth.
In-depth CPI analyses have assembled evidence on the importance of command and control efforts and also demonstrated how such efforts will not pose barriers to economic growth.
REFORESTATION AND RESTORATION
The Brazilian NDC recognizes the importance of reforestation and sets an ambitious target of 12 million hectares of forest restoration. In order to put this challenge in perspective, the entire Brazilian pulp and paper industry, which is among the top world producers, has about eight million hectares of forests. However, there are two main reasons to believe that Brazil’s forest restoration goals are feasible.
First, there is a substantial process of natural forest restoration occurring in Brazil, even in the absence of policies specifically designed to promote reforestation. TerraClass suggests 17 million hectares of secondary vegetation have grown in the Amazon, out of which 10 million hectares of forest grew back in the 2004-2014 period (Instituto Nacional de Pesquisas Espaciais 2016). MapBiomas (2017) depicts 1.6 million hectares of secondary vegetation in the Atlantic Forest. It is unclear why such significant regrowth has occurred and what has driven the process; however, it seems associated with non-agricultural motives for deforestation like squatting or illegal logging and with the spatial reallocation of production. For example, the hilly lands of Minas Gerais were suitable to agriculture in the past, due to their proximity to the main consumer markets, but they are now not well suited for mechanization.
Targeting efforts to enhance and protect areas with natural forest potential is important not only as a way of reducing reforestation costs, but also for improving the likelihood of long-run sustainability. Areas with natural restoration are often unattractive to activities demanding deforestation, which is another significant factor in their role as a potential pathway for meeting Brazil’s restoration goals.
Figure 2.3 below shows the growth of secondary vegetation in deforested areas in the Brazilian Amazon.
Figure 2.3: Growth of Secondary Vegetation in Deforested Areas in the Brazilian Amazon
10
9
11
12
13
15
14
18
17
16
201420122010200820062004
Source: Assunção and Gandour, 2017.
5958
The second reason the forest reforestation goals are feasible is that these goals are also a critical part of the implementation of the new Forest Code. Soares-Filho et al. (2014) estimate that full implementation of the code would require approximately 20 million hectares of forest restoration (4.7 in the Amazon; 6.1 in the Cerrado; and 6.8 in the Atlantic Forest). The new Forest Code law was approved by the Congress in 2012 and reinforced by the Supreme Court in 2018, with ongoing implementation.
The costs of active forest restoration are relatively high, reaching up to R$ 3,700 ($1,020) per hectare. Although these figures do not take into account the cost reductions that would be gained along the learning curve as reforestation at scale is implemented, the costs make the NDC commitments particularly challenging in a scenario of fiscal crisis. However, the scale of the natural forest restoration and the shadow budget for reforestation embedded in the Forest Code can make the difference in meeting the target of restoring 12 million hectares of forests.
CONCLUSION: LAND USE AND NDC
Evidence from this section can re-shape how Brazil views its economic and NDC strategies. First, the deforestation reduction goals are not expected to impose any significant limit on the nation’s ability to expand production. Second, the ambition to restore degraded pastures would drive the sector towards cattle intensification or conversion into crops, creating a low carbon path to production increases. Third, the implementation of the Forest Code can catalyze the pace in which those potential gains are realized because the Forest Code imposes a constraint on area expansion in many parts of the country. Thus, an implemented Forest Code could emulate price signals towards yield gains and more intensive production.
REFERENCES
Antoniazzi A, Sartorelli P, Costa K, Basso I. 2016. Restauração florestal em cadeias agropecuárias para adequação ao Código Florestal. Análise Econômica de Oito Estados Brasileiros: Executive Summary. Agroicone. [Accessed 13 April 2018]. http://www.inputbrasil.org/wp-content/uploads/2016/12/Sumário-Executivo-Restauração-florestal-em-cadeias-agropecuárias-para-adequação-ao-Código-Florestal_Agroicone_INPUT.pdf.
Assunção J, Bragança A. 2015. Technological change and deforestation: Evidence from the Brazilian soybean revolution. Climate Policy Initiative. [Accessed 13 April 2018]. http://www.inputbrasil.org/wp-content/uploads/2015/08/Technological_Change_and_Deforestation_Working_Paper_CPI.pdf.
Assunção, J, Rocha, R. 2014. Getting greener by going black: the priority municipalities in Brazil. Climate Policy Initiative, Rio de Janeiro, Brazil. [Accessed 13 April 2018]. https://climatepolicyinitiative.org/wp-content/uploads/2014/08/Getting-Greener-by-Going-Black-Technical-Paper.pdf.
Assunção J, Gandour C, Rocha, R. 2013. DETERring deforestation in the Amazon: environmental monitoring and law enforcement. Climate Policy Initiative. [Accessed 13 April 2018]. https://climatepolicyinitiative.org/wp-content/uploads/2013/05/DETERring-
Deforestation-in-the-Brazilian-Amazon-Environmental-Monitoring-and-Law-Enforcement-Technical-Paper_Feb2017.pdf.
Assunção J, Gandour C, Rocha R, Rocha R. 2013. Does credit affect deforestation? Evidence from a rural credit policy in the Brazilian Amazon. Climate Policy Initiative. [Accessed 13 April 2018]. https://climatepolicyinitiative.org/wp-content/uploads/2013/01/Does-Credit-Affect-Deforestation-Evidence-from-a-Rural-Credit-Policy-in-the-Brazilian-Amazon-Technical-Paper-English.pdf. https://climatepolicyinitiative.org/wp-content/uploads/2013/01/Does-Credit-Affect-Deforestation-Evidence-from-a-Rural-Credit-Policy-in-the-Brazilian-Amazon-Technical-Paper-English.pdf.
Assunção J, Lipscomb M, Ahmed M, Szerman, D. 2016. Agricultural productivity and deforestation in Brazil. Climate Policy Initiative. [Accessed 13 April 2018]. https://climatepolicyinitiative.org/wp-content/uploads/2017/06/Agricultural-Productivity-and-Deforestation-in-Brazil-CPI.pdf.
Assunção J, Pietracci B, Souza P. 2016. Fueling development: sugarcane expansion impacts in Brazil. Climate Policy Initiative. [Accessed 13 April 2018]. https://climatepolicyinitiative.org/wp-content/uploads/2016/07/Paper_Fueling_Development_Sugarcane_Expansion_Impacts_in_Brazil_Working_Paper_CPI.pdf.
Assunção J, Gandour C. 2017. What does the surge in Amazon regeneration mean for Brazil? CPI Insights Report. [Accessed 13 April 2018]. https://climatepolicyinitiative.org/wp-content/uploads/2017/07/CPI_What_does_the_surge_in_Amazon_regeneration_mean_for-Brazil_Final.pdf. https://climatepolicyinitiative.org/wp-content/uploads/2017/07/CPI_What_does_the_surge_in_Amazon_regeneration_mean_for-Brazil_Final.pdf.
Climate Policy Initiative. 2017. The next step towards climate change mitigation: improving productivity of Brazil’s agricultural lands. Land Use Initiative – INPUT. [Accessed 13 April 2018]. https://climatepolicyinitiative.org/wp-content/uploads/2017/06/PP-ING_-CPI_Digital.pdf
Instituto Brasileiro de Geografia e Estatística. 2006. Censo Agropecuário 2006. [Accessed 13th April 2018]. https://biblioteca.ibge.gov.br/visualizacao/periodicos/51/agro_2006.pdf.
Instituto Brasileiro de Geografia e Estatística. 2016. Mudanças na cobertura e uso da terra do Brasil. [Accessed 13 April 2018]. http://geoftp.ibge.gov.br/informacoes_ambientais/cobertura_e_uso_da_terra/mudancas/documentos/mudancas_de_cobertura_e_uso_da_terra_2000_2010_2012_2014.pdf.
Instituto Nacional de Pesquisas Espaciais. 2016. TerraClass. Levantamento de informações de uso e cobertura da terra na Amazônia. [Accessed 13 April 2018]. http://www.inpe.br/cra/projetos_pesquisas/dados_terraclass.php.
Mapbiomas. 2017. Projeto de mapeamento anual da cobertura e uso do solo do Brasil. [Accessed 13 April 2018]. http://mapbiomas.org/.

6160
Sistema de Registro Nacional de Emissões. n/d. Publicações. [Accessed 13 April 2018]. http://sirene.mctic.gov.br/. http://sirene.mctic.gov.br/.
Soares-Filho B, Rajão R, Macedo M, Carneiro A, Costa W, Coe M, Rodrigues H, Alencar A. 2014. Cracking Brazil’s Forest Code. Science. 344 (6182):363-364.
APPENDIX 1METHODOLOGY FOR ESTIMATING THE AGRICULTURAL POTENTIAL
CPI analysts use stochastic frontier analysis to characterize the agricultural potential for each municipality m and year t in the sample. This potential is computed under different scenarios, where the nature of activities allowed to occur in the modeling exercise varies.
The analysis starts with a basic model used to describe the agricultural production. Given a set of geographical variables Ωm,t (soil composition, agricultural physical suitability, temperature, and rainfall) the production is described as:
ln ym,t = αt + β’ Ωm,t + λ’Xm,t + vm,t- um,t
where ln ym,t is the logarithm of the value agricultural output (crop or cattle); αt is a time dummy capturing price variation and other aggregate shocks; β is the vector of parameters for the geographical variables; λ'Xm,t is a term capturing the total available area in the municipality and other possible constraints for production; vm,t is a normally distributed disturbance with zero mean and constant variance representing idiosyncratic shocks, measurement, and specification errors; and um,t is a (half-normal) one-side disturbance representing inefficiency. Notice that the inefficiency term is exactly the log production potential for the model above.
log-production potential: um,t = E[ln ym,t |αt , Ωm,t , Xm,t , um,t =0] - E[ln ym,t | αt , Ωm,t , Xm,t ]
Therefore, once the model is estimated, the inefficiency term captures the production potential for municipality m in year t.
For crops, three scenarios are run, each one defined by the activities allowed in the crop expansion. In the first scenario, farmers are allowed to increase crop production on all available land. In this case, the vector Xm,t contains only the total available area in the municipality, which is the municipal area excluding water bodies, rocks, and urban areas. This exercise simulates a situation where crop production can expand through three different channels: yield gains, area conversion from pastures, and deforestation. In the second scenario, the possibility of deforestation is dropped, allowing farmers to expand production only through yield gains or converting pastures into crops. In this scenario the total cattle herd is kept constant. Finally, in the third scenario, only yield gains are allowed.
For cattle production, only a scenario where farmers are allowed to intensify production, improving the indicator of cattle herd per hectare of pasture land, is considered.
Key estimated parameters are depicted in the first column of Table A1. The evolution of the estimated potentials under each scenario is presented in Figure 2.2.
DATA
The analysis combines data from different sources. The information was used to build a municipality panel for the 2000-2014 period. Data sources and information for the panel include:
Brazilian Census Bureau:
• Pesquisa Agrícola Municipal:
› Value of crop production, measured in BRL
› Crop (planted) area, measured in hectares
• Pesquisa Pecuária Municipal:
› Cattle herd
• Agriculture suitability: fraction of municipal area classified according to suitability for agriculture as ‘good’, ‘good to regular’, ‘regular to good’, ‘regular’, ‘regular to restricted’, ‘restricted’, ‘restricted to unfavorable’, ‘unfavorable’, ‘unfit’.
MapBiomas (v.2.3):
• Pasture area, measured in hectares;
• Available area, measured in hectares – municipal area minus water bodies, rocks, urban areas, etc.
World Grid:
• Rainfall – annual total precipitation in mm;
• Temperature – annual average temperature in Celsius degrees.
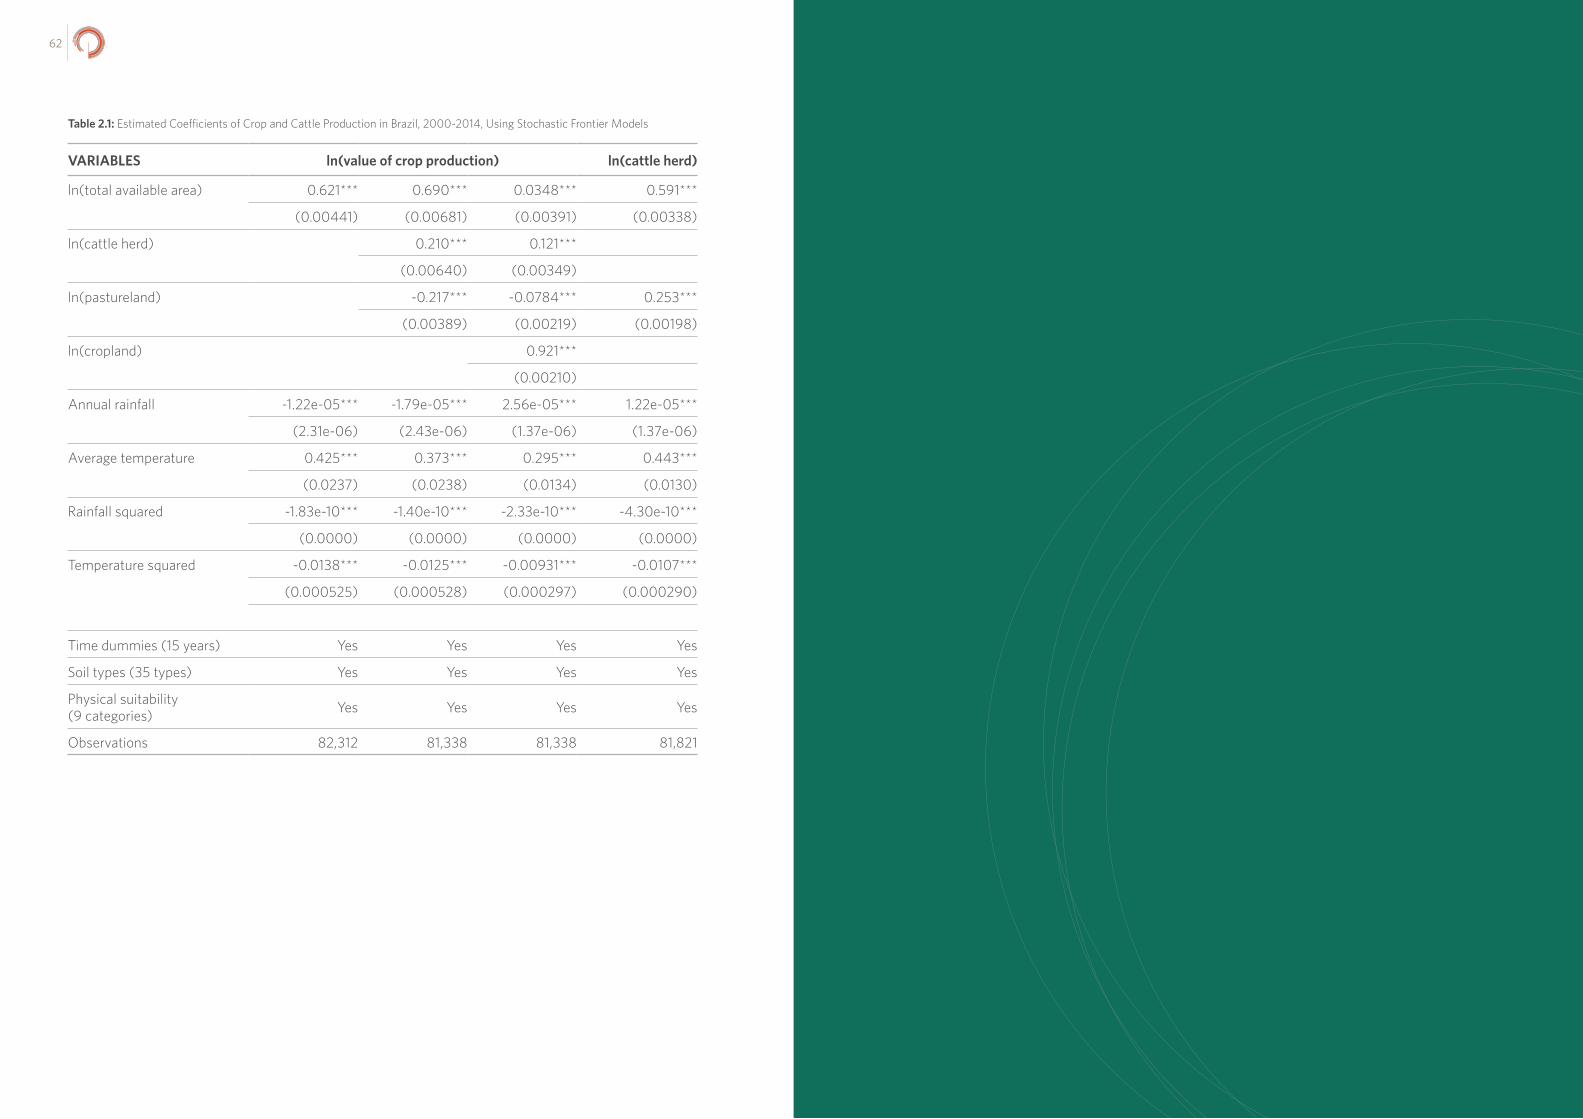
6362
Table 2.1: Estimated Coefficients of Crop and Cattle Production in Brazil, 2000-2014, Using Stochastic Frontier Models
VARIABLES ln(value of crop production) ln(cattle herd)
ln(total available area) 0.621*** 0.690*** 0.0348*** 0.591***
(0.00441) (0.00681) (0.00391) (0.00338)
ln(cattle herd) 0.210*** 0.121***
(0.00640) (0.00349)
ln(pastureland) -0.217*** -0.0784*** 0.253***
(0.00389) (0.00219) (0.00198)
ln(cropland) 0.921***
(0.00210)
Annual rainfall -1.22e-05*** -1.79e-05*** 2.56e-05*** 1.22e-05***
(2.31e-06) (2.43e-06) (1.37e-06) (1.37e-06)
Average temperature 0.425*** 0.373*** 0.295*** 0.443***
(0.0237) (0.0238) (0.0134) (0.0130)
Rainfall squared -1.83e-10*** -1.40e-10*** -2.33e-10*** -4.30e-10***
(0.0000) (0.0000) (0.0000) (0.0000)
Temperature squared -0.0138*** -0.0125*** -0.00931*** -0.0107***
(0.000525) (0.000528) (0.000297) (0.000290)
Time dummies (15 years) Yes Yes Yes Yes
Soil types (35 types) Yes Yes Yes Yes
Physical suitability (9 categories) Yes Yes Yes Yes
Observations 82,312 81,338 81,338 81,821

MAPPING THE POLICY AND INSTITUTIONAL LANDSCAPE OF LAND USE IN BRAZIL
LAND USEP O L I C Y A N A LY S I S
While Brazil has a comprehensive set of conservation policies, they have largely focused on the Amazon and on monitoring and controlling deforestation of primary vegetation.
In private lands, the new Forest Code is the key instrument for forest protection and its implementation remains a challenge.
Policies to promote low-carbon agricultural practices have been established more recently but only represent a small part of the agricultural financing landscape.
Secure property rights are a necessary condition for effective land management. Brazil’s land governance is highly complex and needs improvement.
TAKEAWAYS
8
9
10
11
65
03 .

6766
INTRODUCTION: BRAZIL’S LAND USE POLICIES AND INSTITUTIONAL LANDSCAPE
Brazil has a vast set of land use policies, organized by a comprehensive and rather refined conservation policy architecture. Conservation policies are implemented through a variety of instruments, including forest protection, establishment of protected areas, sustainable forest management, monitoring and control of deforestation, accountability for environmental crimes and infractions, reforestation and regeneration of degraded areas, and economic instruments to promote conservation.
Despite the common understanding that a mix of policy instruments is required for forest conservation, determining the effectiveness of each particular instrument is challenging for several reasons. First, a culture of policy evaluation using rigorous techniques is rather recent in the sector. Second, several innovative policies, which hold significant potential for forest conservation, are still in their very early stages in Brazil. This is the case, for instance, of efforts aimed at promoting economic instruments for natural resource protection and policies to incentivize restoration of degraded areas. Despite the challenges of assessing conservation policies, policies directed towards monitoring and controlling deforestation and establishing protected areas have a proven track record of success. They should be strengthened and expanded, including to areas outside the Amazon region.
Historically, conservation policies have focused largely on the Amazon biome, such as the Action Plan for the Prevention and Control of Deforestation in the Legal Amazon (PPCDAm) and the Amazon Region Protected Areas Program (ARPA). Policies targeting the Cerrado, which is a highly attractive area for agricultural producers and has already experienced a large extent of cleared native vegetation, have emerged more recently and are still in an early stage of implementation. These include the Action Plan for Prevention and Control of Deforestation and Forest Fires in the Cerrado Biome (PPCerrado) and others.
In the future, particular attention should be paid to conservation in other biomes, where challenges are different than the ones faced in the Amazon and require tailored-made policy solutions. For instance, monitoring and law enforcement, which were very effective contributors to the mid-2000 deforestation slowdown in the Brazilian Amazon, are unlikely to deter large amounts of deforestation in the Cerrado biome. A substantial share of clearings in the Cerrado is legal in light of the Forest Code’s regulations, which suggests the need for economic instruments to promote conservation of the native vegetation that is not legally protected (Chiavari and Lopes, forthcoming).
In addition to conservation policies, the land use policy framework is composed of policies to promote low carbon agricultural practices for small producers and traditional communities, as well as for medium and large farms. These policies have been established more recently and are not effectively aligned with conservation policies. While investments are being made in initiatives such as the Low-Carbon Agriculture Program (ABC Program) that promotes low-carbon agricultural practices, these programs still occupy a small role in the agricultural financing landscape. They also fall short of providing incentives for forest conservation. Coordination is needed to better integrate the agricultural policy agenda with the environmental one.
6968
Agriculture
• Brazil’s agricultural institutions related to sustainable agriculture.
• Brazil’s sustainable agricultural policies.
Property Rights
• Property rights and land tenure regularization in Brazil.
LAND USE POLICIES BACKGROUND
Historically, land occupation in Brazil had been disorderly without a clear land use policy. For long periods, agricultural production was given priority over preservation of the nation’s natural resources. However, Brazil’s approach to forest preservation evolved in response to emerging pressures for conservation.
In 1934 Brazil passed its first Forest Code, which was motivated more by the demand to regulate logging activities than by a desire to protect the forests’ environmental benefits. A more modern version of the code was enacted in 1965, which increased forest protection substantially; however, enforcement of these tougher rules languished.
Despite the Forest Code’s protection rules, producers had been encouraged since the 1960s to clear the forest as proof of productive activity under land-titling laws and to access credit. The government had encouraged the occupation of the north and center-west of the country through colonization projects, beginning with small farm settlements and later with an emphasis on large-scale farming.
In the early 1990s, the rate of deforestation in the Amazon was once again on the rise, peaking in 1995. This rapid rise pushed the Brazilian government into adopting stricter rules. They increased the protection of natural vegetation in rural properties in the Amazon, but this change generated strong reactions from the producers and ended up stimulating a movement for revising the legislation. After more than a decade of intense dispute and after concessions by both environmentalists and rural producers, the new Forest Code was enacted in 2012.
Today, the new Forest Code is the main land use policy on private lands; it established conservation instruments, limitations on the use of forests resources, and restrictions on the conversion of forestlands into other land uses. The new Forest Code also created an innovative land management instrument to monitor and control deforestation in private landholdings.
In public areas, land occupation takes on many forms and follows distinctive land use policies. The occupation ranges from settlements, indigenous lands and traditional communities’ possessions, protected areas to vacant lands, vast areas of public lands that have not been assigned to any particular use.
CHAPTER OVERVIEW
In this chapter, CPI analysts extensively map the key policies and institutions governing land use in Brazil. This section serves as a resource for policymakers and stakeholders to understand the wide array of governmental and policy initiatives that are available as pathways or tools for progress. Policies included in this analysis are of regional and national coverage and focus on environmental protection and sustainable agriculture.
The analysis of conservation policies is grouped into six categories based on their key objectives: native vegetation protection, protected areas, sustainable forest management, monitoring and law enforcement, reforestation and regeneration of degraded areas, and economic instruments for conservation.
The roles of property rights and land tenure regularization policies are also assessed for their relevance as an enabling condition to achieve forest conservation and sustainable agriculture.
This section highlights Brazil’s policy and institutional landscape on land use. It is organized in the following sub-sections:
Land Use
• Land use policies background.
• Land use policies timeline.
Environment
• Brazil’s environmental institutions related to land use.
• Brazil’s environmental macro-policies.
Conservation
• Native vegetation protection.
• Protected areas.
• Sustainable forest management.
• Monitoring and law enforcement.
• Reforestation and regeneration of degraded areas.
• Economic instruments for conservation.
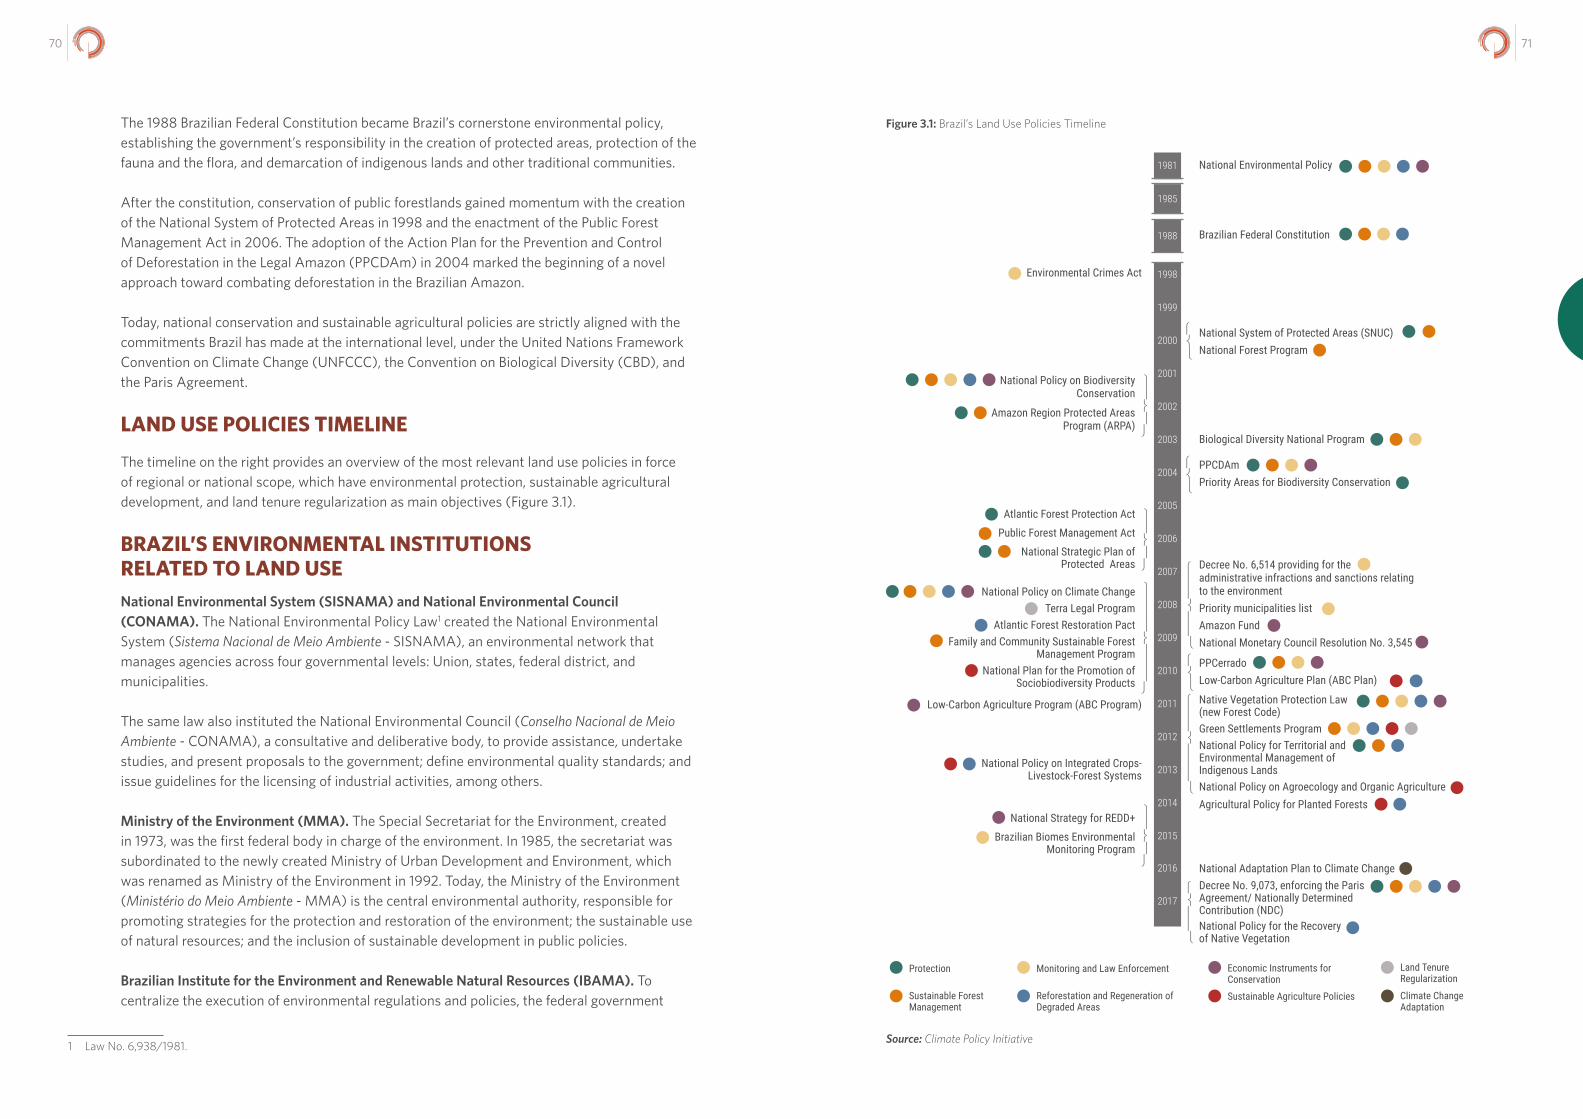
7170
The 1988 Brazilian Federal Constitution became Brazil’s cornerstone environmental policy, establishing the government’s responsibility in the creation of protected areas, protection of the fauna and the flora, and demarcation of indigenous lands and other traditional communities.
After the constitution, conservation of public forestlands gained momentum with the creation of the National System of Protected Areas in 1998 and the enactment of the Public Forest Management Act in 2006. The adoption of the Action Plan for the Prevention and Control of Deforestation in the Legal Amazon (PPCDAm) in 2004 marked the beginning of a novel approach toward combating deforestation in the Brazilian Amazon.
Today, national conservation and sustainable agricultural policies are strictly aligned with the commitments Brazil has made at the international level, under the United Nations Framework Convention on Climate Change (UNFCCC), the Convention on Biological Diversity (CBD), and the Paris Agreement.
LAND USE POLICIES TIMELINE
The timeline on the right provides an overview of the most relevant land use policies in force of regional or national scope, which have environmental protection, sustainable agricultural development, and land tenure regularization as main objectives (Figure 3.1).
BRAZIL’S ENVIRONMENTAL INSTITUTIONS RELATED TO LAND USENational Environmental System (SISNAMA) and National Environmental Council (CONAMA). The National Environmental Policy Law1 created the National Environmental System (Sistema Nacional de Meio Ambiente - SISNAMA), an environmental network that manages agencies across four governmental levels: Union, states, federal district, and municipalities.
The same law also instituted the National Environmental Council (Conselho Nacional de Meio Ambiente - CONAMA), a consultative and deliberative body, to provide assistance, undertake studies, and present proposals to the government; define environmental quality standards; and issue guidelines for the licensing of industrial activities, among others.
Ministry of the Environment (MMA). The Special Secretariat for the Environment, created in 1973, was the first federal body in charge of the environment. In 1985, the secretariat was subordinated to the newly created Ministry of Urban Development and Environment, which was renamed as Ministry of the Environment in 1992. Today, the Ministry of the Environment (Ministério do Meio Ambiente - MMA) is the central environmental authority, responsible for promoting strategies for the protection and restoration of the environment; the sustainable use of natural resources; and the inclusion of sustainable development in public policies.
Brazilian Institute for the Environment and Renewable Natural Resources (IBAMA). To centralize the execution of environmental regulations and policies, the federal government
1 Law No. 6,938/1981.
Figure 3.1: Brazil’s Land Use Policies Timeline
Source: Climate Policy Initiative
PPCDAmPriority Areas for Biodiversity Conservation
Biological Diversity National Program
Agricultural Policy for Planted Forests
National Adaptation Plan to Climate ChangeDecree No. 9,073, enforcing the Paris Agreement/ Nationally Determined Contribution (NDC)
Atlantic Forest Protection Act
Public Forest Management Act
National Strategic Plan of Protected Areas
National Policy on Climate Change Terra Legal Program
Atlantic Forest Restoration Pact Family and Community Sustainable Forest
Management ProgramNational Plan for the Promotion of
Sociobiodiversity Products
National Strategy for REDD+
Brazilian Biomes Environmental Monitoring Program
PPCerradoLow-Carbon Agriculture Plan (ABC Plan)
National System of Protected Areas (SNUC) National Forest Program
Decree No. 6,514 providing for the administrative infractions and sanctions relating to the environment Priority municipalities listAmazon FundNational Monetary Council Resolution No. 3,545
Native Vegetation Protection Law (new Forest Code) Green Settlements Program National Policy for Territorial and Environmental Management of Indigenous LandsNational Policy on Agroecology and Organic Agriculture
National Environmental Policy
Brazilian Federal Constitution
Environmental Crimes Act
Low-Carbon Agriculture Program (ABC Program)
National Policy for the Recovery of Native Vegetation
National Policy on Integrated Crops-Livestock-Forest Systems
National Policy on Biodiversity Conservation
Amazon Region Protected Areas Program (ARPA)
1998
1988
1985
2016
2015
2014
2013
2012
2011
2010
2009
2008
2007
2006
2005
2004
2003
2002
2001
2000
1999
2017
1981
Protection Monitoring and Law Enforcement Economic Instruments for Conservation
Land Tenure Regularization
Climate Change Adaptation
Sustainable Forest Management
Reforestation and Regeneration of Degraded Areas
Sustainable Agriculture Policies

7372
created the Brazilian Institute for the Environment and Renewable Natural Resources (Instituto Brasileiro do Meio Ambiente e dos Recursos Naturais Renováveis - IBAMA). Established in 1989,2 IBAMA became the country’s major executive environmental agency. It executes national environmental policies in the fields of preservation, conservation, regulation, and the promotion of the sustainable use of environmental resources in addition to monitoring and control. IBAMA also operates as the national police authority in the investigation of environmental infractions and the application of administrative sanctions.
Chico Mendes Institute for Biodiversity Conservation (ICMBIO). The Chico Mendes Institute for Biodiversity Conservation (Instituto Chico Mendes de Conservação da Biodiversidade - ICMBIO) established in 2007 is another executive branch of the Ministry of the Environment. The ICMBIO is responsible for proposing, implementing, managing, protecting, inspecting, and monitoring federally protected areas.
Brazilian Forest Service (SFB). The Brazilian Forest Service (Serviço Florestal Brasileiro – SFB) is a federal agency, linked to the Ministry of the Environment, that is responsible for the management of forest concessions, promotion of sustainable forestry activities, and implementation of the National Forestry Inventory. SFB also manages the Forest Development National Fund, National Registry of Public Forest, and Rural Environmental Registry System (Sistema Nacional de Cadastro Ambiental Rural - SICAR).
Figure 3.2 presents the environmental institutions described above.
BRAZIL’S ENVIRONMENTAL MACRO POLICIES
National Environmental Policy (1981). The adoption of the National Environmental Policy3 in 1981 is a landmark for environmental regulation in Brazil. This law was ambitious, as it aimed at making socioeconomic development compatible with environmental protection (Drummond and Barros-Platiau 2006). For the first time, a national policy addressed environmental protection in its multiple aspects and in an integrated way. Prior to the National Environmental Policy, laws and regulations focused on natural resources components, such as the Forest Code of 1934 and 1965, the Water Code of 1934, and the Wildlife Protection Act of 1967.
The National Environmental Policy provides land-use instruments such as environmental zoning and protected areas; monitoring and accountability instruments such as environmental licensing and environmental liability; instruments for the recovery of degraded areas; and economic instruments for conservation.
Brazilian Federal Constitution (1988). The 1988 Brazilian Federal Constitution established a chapter on environmental quality and protection and became Brazil’s cornerstone environmental policy. According to the constitution, the government is responsible for the preservation and restoration of the essential ecological processes, the creation of protected areas, and the protection of the fauna and the flora. The constitution also provides that procedures and activities considered as harmful to the environment shall subject the offender
2 Law No. 7,735/1989.3 Law No. 6,938/1981.
Office of the President
Ministry of the Environment
Secretariat of Climate Change and Forests
Brazilian Forest Service (SFB)
National Environmental Council (CONAMA)
Brazilian Institute for the Environment and Renewable Natural Resources (IBAMA)
States’ Environmental Agencies
Chico Mendes Institute for Biodiversity Conservation (ICMBIO)
• National Policy and Plan on Climate Change
• National Adaptation Plan to Climate Change
• Monitoring and law enforcement
• Forest Code and Atlantic Forest Protection Act in rural properties located within states’ boundaries
• Environmental Regularization Program (PRA)
• Creation, management, consolidation and monitoring of federal protected areas
Department of Climate Change Policies
Department of Forests and Combat
of Deforestation
National Council for the Legal Amazon
• PPCDAm/PPCerrado• National Strategy for
REDD+ • National Policy for the
Recovery of Native Vegetation
• Brazilian Biomes Environmental Monitoring Program
Public Forest Management Commission
• National System of Protected Areas
• National Strategic Plan of Protected Areas
• Amazon Region Protected Areas Program
• National Policy for Territorial and Environmental Management of Indigenous Lands
Department of Protected Areas
Department of Ecosystem Conservation
Forest National Commission
• National Policy on Biodiversity Conservation
• Biological Diversity National Program
• Priority Areas for Biodiversity Conservation
Secretariat of BiodiversitySecretariat of
Extrativism and Sustainable Rural
Development
Governmental institutions
Policies and plans/programs
STATE LEVEL
FEDERAL LEVEL
Affiliated Entities
Specific Bodies
Colegial Bodies
• Rural Environmental Registry System (SICAR)• Environmental Reserve Quota (CRA)• National Forest Program• Public Forest Management and Concessions• Family and Community Sustainable Forest Management
Program
Figure 3.2: Brazil’s Environmental Institutions and Policies
Source: Climate Policy Initiative

7574
to criminal and administrative sanctions, without prejudice to the obligation to repair the damages caused. The protection of the environment is not restricted to the environmental chapter. Throughout the constitution’s text, there are other articles related to the protection of the environment, such as those on economic activity, agriculture, and human health.
International Conventions. Brazil ratified the United Nations Framework Convention on Climate Change (UNFCCC) in 1994,4 the Convention on Biological Diversity (CBD) in 1994,5 and the Paris Agreement in 2016.6 As a party to these conventions, Brazil has agreed to adopt national policies and undertake corresponding measures to implement their provisions and to achieve their objectives. After Brazil ratified the Paris Agreement on climate change, the Brazilian Nationally Determined Contribution (NDC) became official commitments.
National Policy on Biodiversity Conservation (2002). The National Policy on Biodiversity Conservation was adopted in 20027 to promote the conservation of biological diversity and the sustainable use of its components. The national policy principles and objectives were later integrated into the Biological Diversity National Program (Programa Nacional da Diversidade Biológica - PRONABIO).8 The government also instituted the Biodiversity National Council (Comissão Nacional da Biodiversidade - CONABIO) to coordinate and implement the program. In 2006, the Conabio approved the National Biodiversity Action Plan (Plano de Implementação da Política Nacional da Biodiversidade - PAN-Bio), addressing the measures and actions to meet the objectives and directives of the Biodiversity National Policy.
The National Policy on Climate Change (Política Nacional sobre Mudança do Clima - PNMC),9 adopted in 2009, aims at the compatibility between the protection of the climatic system and the country’s sustainable development, through the mitigation of anthropic emissions, adaptation to climate change, preservation of environmental resources, consolidation of protected areas and incentive to reforestation. Following the general guidelines of the national policy, the government launched the National Plan on Climate Change, establishing mitigation actions by sector, including land use, land use change and forestry (LULUCF) and agriculture. Subsequently, the government issued a decree10 regulating the national policy and establishing Adaptation and Mitigation Sectoral Plans. Recently, a National Adaptation Plan to Climate Change (Plano Nacional de Adaptação à Mudança do Clima - PNA) was launched,11 establishing strategies and actions to reduce vulnerability to the impacts of climate change by building adaptive capacity and resilience.
4 Decree No. 2,652/1998.5 Decree No. 2,519/1998.6 Decree No. 9,073/2017.7 Decree No. 4,339/2002. 8 Decree No. 4,703/2003. 9 Law No. 12,187/2009 and Decree No. 7,390/2010.10 Decree No. 7,390/2010.11 Ordinance MMA No. 150/2016.
BRAZIL’S CONSERVATION POLICIES
NATIVE VEGETATION PROTECTION
Native Vegetation Protection Law (New Forest Code). The Brazilian Native Vegetation Protection Law,12 known as the new Forest Code, governs the use and protection of native vegetation in Brazil. The new Forest Code is one of the most important pieces of legislation with the potential to drive efficient land use in Brazil in private lands and become an effective tool against climate change. The new Forest Code relies on two types of protection instruments for conservation on private lands: Permanent Preservation Areas (Áreas de Preservação Permanente – APP) and the Legal Forest Reserve.
PERMANENT PRESERVATION AREAS (APP)
APP are areas of vegetation that have been designated for protection because they have been identified as critical to the preservation of essential ecosystem functions, such as ensuring a clean and steady water supply, regulating hydrological and weather cycles, protecting geological and soil stability, or conserving biodiversity. APP include banks of rivers, springs, and lakes (riparian zones), mangroves, veredas (a type of wetland), the top of mountains above 1,800 meters, hilltops and slopes with inclinations steeper than 45 degrees, and sandbanks. The code requires that the vegetation in APP be fully preserved as a no harvest zone, and, if destroyed for any reason, the lost vegetation must be recovered using only native species. Only sustainable family and community forest management are permitted in these areas. Landowners are not entitled to compensation, and they receive no governmental aid for the protection of the APP (Chiavari and Lopes 2015).
LEGAL FOREST RESERVE
The Forest Code requires that rural landowners designate and maintain a percentage of their property area under forest cover as Legal Forest Reserve (Reserva Legal). The goal is to preserve the remnants of native vegetation on rural lands and conserve biodiversity. This protected percentage varies from 20% to 80% depending on the type of vegetation present and the property’s geographical location in the country. In general, properties located within the Amazon must conserve a much higher percentage of land as Legal Forest Reserve than properties outside of the region. On every Legal Forest Reserve, clear-cutting is prohibited and only sustainable forest management is allowed. Landowners do not receive any type of compensation to preserve this set-aside land (Chiavari and Lopes 2015).
CONVERSION OF FOREST INTO OTHER LAND USES OUTSIDE OF APP AND LEGAL FOREST RESERVE
The law also establishes that the conversion of forest into other land uses in areas not designated as Permanent Preservation Areas (APP) or Legal Forest Reserve is subjected to previous authorization by the designated environmental authority. In this case, forest compensation is required based on the area and type of vegetation suppressed. This land use
12 Law No. 12,651/2012.
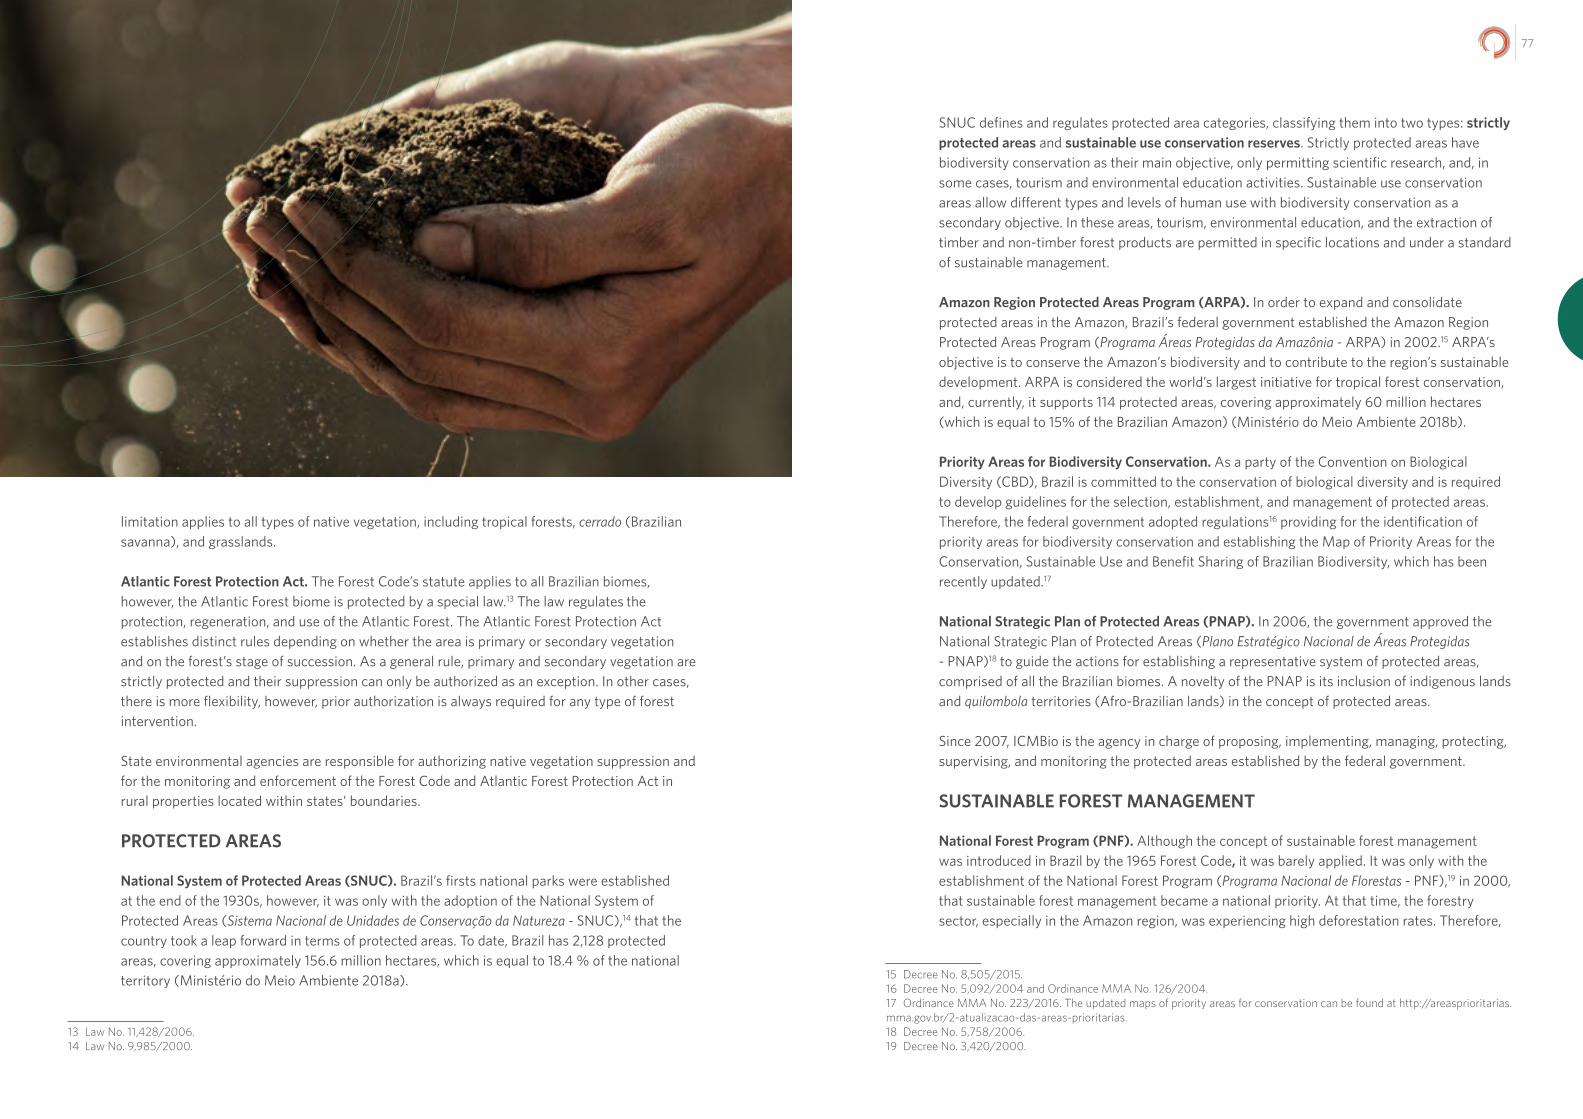
7776
limitation applies to all types of native vegetation, including tropical forests, cerrado (Brazilian savanna), and grasslands.
Atlantic Forest Protection Act. The Forest Code’s statute applies to all Brazilian biomes, however, the Atlantic Forest biome is protected by a special law.13 The law regulates the protection, regeneration, and use of the Atlantic Forest. The Atlantic Forest Protection Act establishes distinct rules depending on whether the area is primary or secondary vegetation and on the forest’s stage of succession. As a general rule, primary and secondary vegetation are strictly protected and their suppression can only be authorized as an exception. In other cases, there is more flexibility, however, prior authorization is always required for any type of forest intervention.
State environmental agencies are responsible for authorizing native vegetation suppression and for the monitoring and enforcement of the Forest Code and Atlantic Forest Protection Act in rural properties located within states’ boundaries.
PROTECTED AREAS
National System of Protected Areas (SNUC). Brazil’s firsts national parks were established at the end of the 1930s, however, it was only with the adoption of the National System of Protected Areas (Sistema Nacional de Unidades de Conservação da Natureza - SNUC),14 that the country took a leap forward in terms of protected areas. To date, Brazil has 2,128 protected areas, covering approximately 156.6 million hectares, which is equal to 18.4 % of the national territory (Ministério do Meio Ambiente 2018a).
13 Law No. 11,428/2006.14 Law No. 9,985/2000.
SNUC defines and regulates protected area categories, classifying them into two types: strictly protected areas and sustainable use conservation reserves. Strictly protected areas have biodiversity conservation as their main objective, only permitting scientific research, and, in some cases, tourism and environmental education activities. Sustainable use conservation areas allow different types and levels of human use with biodiversity conservation as a secondary objective. In these areas, tourism, environmental education, and the extraction of timber and non-timber forest products are permitted in specific locations and under a standard of sustainable management.
Amazon Region Protected Areas Program (ARPA). In order to expand and consolidate protected areas in the Amazon, Brazil’s federal government established the Amazon Region Protected Areas Program (Programa Áreas Protegidas da Amazônia - ARPA) in 2002.15 ARPA’s objective is to conserve the Amazon’s biodiversity and to contribute to the region’s sustainable development. ARPA is considered the world’s largest initiative for tropical forest conservation, and, currently, it supports 114 protected areas, covering approximately 60 million hectares (which is equal to 15% of the Brazilian Amazon) (Ministério do Meio Ambiente 2018b).
Priority Areas for Biodiversity Conservation. As a party of the Convention on Biological Diversity (CBD), Brazil is committed to the conservation of biological diversity and is required to develop guidelines for the selection, establishment, and management of protected areas. Therefore, the federal government adopted regulations16 providing for the identification of priority areas for biodiversity conservation and establishing the Map of Priority Areas for the Conservation, Sustainable Use and Benefit Sharing of Brazilian Biodiversity, which has been recently updated.17
National Strategic Plan of Protected Areas (PNAP). In 2006, the government approved the National Strategic Plan of Protected Areas (Plano Estratégico Nacional de Áreas Protegidas - PNAP)18 to guide the actions for establishing a representative system of protected areas, comprised of all the Brazilian biomes. A novelty of the PNAP is its inclusion of indigenous lands and quilombola territories (Afro-Brazilian lands) in the concept of protected areas.
Since 2007, ICMBio is the agency in charge of proposing, implementing, managing, protecting, supervising, and monitoring the protected areas established by the federal government.
SUSTAINABLE FOREST MANAGEMENT
National Forest Program (PNF). Although the concept of sustainable forest management was introduced in Brazil by the 1965 Forest Code, it was barely applied. It was only with the establishment of the National Forest Program (Programa Nacional de Florestas - PNF),19 in 2000, that sustainable forest management became a national priority. At that time, the forestry sector, especially in the Amazon region, was experiencing high deforestation rates. Therefore,
15 Decree No. 8,505/2015.16 Decree No. 5,092/2004 and Ordinance MMA No. 126/2004.17 Ordinance MMA No. 223/2016. The updated maps of priority areas for conservation can be found at http://areasprioritarias.mma.gov.br/2-atualizacao-das-areas-prioritarias.18 Decree No. 5,758/2006.19 Decree No. 3,420/2000.
7978
one of the objectives of PNF was to provide the expansion and consolidation of sustainable management practices in public forests, mainly through a network of National Forests (Florestas Nacionais - FLONAS), a federal category of Sustainable Use Protected Area that permits the sustainable use of forest resources.
Public Forest Management Act. The forest concession regime was considered the most appropriate pathway to promote the sustainable management of public forests (Barreto and Veríssimo 2002; Ferraz and Seroa 2002). As a result, Brazil passed legislation in 2006 that allowed forest concessions for timber harvest in public forests. The Public Forest Management Act20 establishes the public forest concession framework. According to the law, concessionaires can explore forest products and services but not water; mineral and genetic resources; wild animals; fishing resources; and carbon credits. The forest concession does not imply the transfer of ownership of the land; the forest remains a public asset. The law also protects the traditional communities’ right to explore traditionally used forest resources in a concession area. In addition, the law instituted the Brazilian Forest Service for the management of forest concessions and promotion of sustainable forestry activities, among other competencies as described above.
Forest Settlement Projects (PAF). Forest settlement projects (Projeto de Assentamento Florestal - PAF), a category of agrarian reform settlement adopted especially in the Amazon region, also employs sustainable forest management practices to promote the sustainable development of traditional communities.
Family and Community Sustainable Forest Management Program (PMCF). The government launched the Family and Community Sustainable Forest Management Program (Programa Federal de Manejo Florestal Comunitário e Familiar – PMCF)21 in 2009 to promote sustainable forest management practices among family and community farms that depend on forest resources for all or part of their livelihoods.
Native Vegetation Protection Law (New Forest Code). Although sustainable forest management was not widely applied in private lands, since the adoption of the new Forest Code all forestry activities must be guided by sustainable forest management principles. Therefore, to carry out forestry activities, private landholders must have a sustainable forest management plan, previously approved by the competent authority.
MONITORING AND LAW ENFORCEMENT
As this analysis displays, Brazil has a wide set of public policies designed to promote forest conservation in public and private lands. However, without monitoring, law enforcement, and accountability for environmental crimes and infractions, conservation policies and progress may languish. This sub-section highlights Brazil’s established monitoring and enforcement efforts.
20 Law No. 11,284/2006.21 Decree No. 6,874/2009.
Environmental Crimes Act. It is important to mention that under Brazilian law there are three different and independent forms of environmental liability: civil, administrative, and criminal. According to the Article 225 of the Federal Constitution, the acts and activities considered harmful to the environment shall subject the offenders, individuals, or legal entities to criminal and administrative sanctions, regardless of the obligation to repair the damage.
Concerning criminal and administrative environmental responsibility, the Environmental Crimes Act22 was a landmark in the protection of the environment. With the enactment of the law, Brazil gained much-needed regulatory stability for the investigation and prosecution of environmental violations. The law provides a clear definition of environmental infractions and crimes, and it set legal directives for the application of administrative and criminal sanctions.
Action Plan for the Prevention and Control of Deforestation in the Legal Amazon (PPCDAm). In 2004, the government launched the Action Plan for the Prevention and Control of Deforestation in the Legal Amazon (Plano de Prevenção e Controle do Desmatamento na Amazônia Legal - PPCDAm). This marked the beginning of a novel approach towards combating deforestation in the Brazilian Amazon. PPCDAm integrated actions across different government institutions and introduced innovative procedures for monitoring, environmental control, and territorial management. The operational structure for the PPCDAm consists of a large set of strategic conservation measures to be implemented and executed as part of a new collaborative effort between federal, state, and municipal governments, alongside specialized organizations and civil society. PPCDAm focuses on four main areas: (i) monitoring and law enforcement; (ii) territorial management and land use; (iii) promotion of sustainable practices, and (iv) economic and normative instruments. The goal is to reduce deforestation in the region by 80% by 2020.
Real-Time Detection of Deforestation (DETER). PPCDAm promoted a major change in monitoring policies with the adoption of the Real-Time Detection of Deforestation (Detecção de Desmatamento em Tempo Real - DETER), a satellite-based monitoring of forest clearing activity. Developed by the National Institute for Space Research (Instituto Nacional de Pesquisas Espaciais - INPE), DETER system captures and processes georeferenced imagery on Amazon forest cover in 15-day intervals year round. These images are used to identify deforestation hot spots and target law enforcement efforts. DETER significantly increased IBAMA’s capacity to quickly reach forest clearings, thereby also increasing their ability to punish illegal deforestation. DETER-based monitoring and law enforcement efforts prevented the clearing of over 110,500 km² of Amazon forest area from 2007 through 2011. Deforestation observed during this period totaled 41,500 km² – 60% less than in the absence of the policy change (Assunção, Gandour, and Rocha 2013a). However, it is important to note that Brazil’s monitoring policies exclusively targeted combating deforestation of primary vegetation (clearing in areas that have never before been cut down).
Additionally, IBAMA’s law enforcement efforts gained greater legal support with the new regulation23 providing for the administrative infractions and sanctions relating to the environment, and establishing the federal administrative procedures to investigate such
22 Law No. 9,605/1998.23 Decree No. 6,514/2008.
8180
infractions. The decree also regulates the use of both existing and new instruments for the punishment of environmental infractions, including fines, embargoes, and seizure and destruction of production goods, tools, and materials.
Several other policies to combat deforestation were implemented within the scope of the PPCDAm, such as the expansion and strategic allocation of protected areas and the creation of priority municipalities. The government created more than 25 million hectares of protected areas in strategic allocation, serving as shields to advancing deforestation. Moreover, approximately 10 million hectares of indigenous lands were allowed, improving the mosaic of protected areas.
The government also established in 2007 the legal basis24 for singling out municipalities with intense deforestation activity to take differentiated actions toward them. These municipalities, selected based on their recent deforestation history, were classified as in need of priority action to prevent, monitor, and combat illegal deforestation. Exiting the list of priority municipalities was conditioned upon significantly reducing deforestation. In addition, priority municipalities became subject to a series of other administrative measures, including harsher licensing and georeferencing requirements for private landholdings; revision of land titles; and economic sanctions applied by agents of the commodity industry, who restricted purchases of agricultural products originating from priority municipalities. The blacklist policy avoided the clearing of 11,369 km² of Amazon forest area between 2008 and 2011. Total deforestation observed between 2008 and 2011 was 20,689 km², 35% less than in the absence of the policy (Assunção and Rocha 2014).
Finally, the National Monetary Council passed the Resolution No. 3,545 in 2008 conditioning the concession of rural credit for use in the Amazon biome upon presentation of proof of borrowers’ compliance with environmental regulations. All official credit agents – public banks, private banks, and credit cooperatives – were obligated to abide by the new rules. This resolution helped contain deforestation in the Amazon biome. Counterfactual simulations indicate that over 2,700 km² of forest would have been cleared from 2009 through 2011, had the resolution not been implemented (Assunção, Gandour, and Rocha 2013b).
Action Plan for Prevention and Control of Deforestation and Forest Fires in the Cerrado Biome (PPCerrado). After the successful implementation of the PPCDAm, the government launched in 2010 the Action Plan for Prevention and Control of Deforestation and Forest Fires in the Cerrado biome (Plano de Ação para Prevenção e Controle do Desmatamento e das Queimadas no Cerrado - PPCerrado). PPCerrado goal is to reduce deforestation rates by at least 40%. The plan focused on four areas: (i) monitoring and law enforcement; (ii) protected areas and land use planning; (iii) promotion of sustainable practices; (iv) and, economic and normative instruments to control illegal deforestation.
The government also established a list of priority municipalities25 within the Cerrado biome to address the actions to prevent, monitor, and combat illegal deforestation, promote territorial
24 Decree No. 6,321/2007.25 Ordinance MMA No. 97/2012.
planning and sustainable economic development, conserve native vegetation, and restore degraded lands.
Today, PPCDAm and PPCerrado have a unified executive commission, which adopted common strategic objectives for both plans. The current phase of the plans (2016 to 2020) aims to address the goals of the National Policy on Climate Change and to prepare the country to meet its NDC, such as achieving zero illegal deforestation by 2030.
Brazilian Biomes Environmental Monitoring Program (PMABB). To broaden the monitoring of the vegetation cover throughout the Brazilian territory, the Ministry of the Environment established the Brazilian Biomes Environmental Monitoring Program (Programa de Monitoramento Ambiental dos Biomas Brasileiros - PMABB) in 2015.26 The program covers all Brazilian biomes and focuses on mapping and monitoring deforestation; vegetation cover and land use assessment; fire monitoring; and vegetation restoration and selective logging. The mapping and monitoring will be performed through real-time and periodic assessments, with data and satellite images that are suitable to the specific characteristics of the topics and biomes addressed.
Programs by land category. The federal government also created programs in 2012 to prevent and control illegal deforestation in specific land categories, such as settlements and indigenous lands. The Green Settlements Program27 aims to prevent and control illegal deforestation in agrarian settlements in the Legal Amazon. The National Policy for Territorial and Environmental Management of Indigenous Lands (Política Nacional de Gestão Territorial e Ambiental de Terras Indígenas - PNGATI)28 has the objective of ensuring and promoting the protection, recovery, conservation, and sustainable use of natural resources in indigenous territories and lands.
Rural Environmental Registry (CAR). The establishment of the Rural Environmental Registry (Cadastro Ambiental Rural – CAR) by the new Forest Code in 2012 represented a great leap forward in the monitoring and controlling of deforestation in private landholdings. CAR is a national, online public registry, that is mandatory for all rural properties. CAR integrates the environmental information of the rural properties for more effective management and planning in rural areas. Landholders must present a georeferenced map, to the competent environmental agency, identifying the remnants of native vegetation using satellite images. CAR makes it possible for environmental agencies to identify the perpetrators of deforestation and monitor whether individual landowners are complying with the Forest Code.
REFORESTATION AND REGENERATION OF DEGRADED AREAS
Since the adoption of the Brazilian National Environmental Policy in 1981, all the damage caused to the environment must be fully repaired, either as an obligation to restore and/or to compensate. The law implies that all illegal logging or clear-cutting must be restored. However, due to the lack of enforcement, Brazil has huge deforested and degraded areas that needs to be recovered. Furthermore, there was no public policy to incentivize restoration, and the obligation
26 Ordinance MMA No. 365/2015.27 Ordinance Incra No. 716/2012.28 Decree No. 7,747/2012.
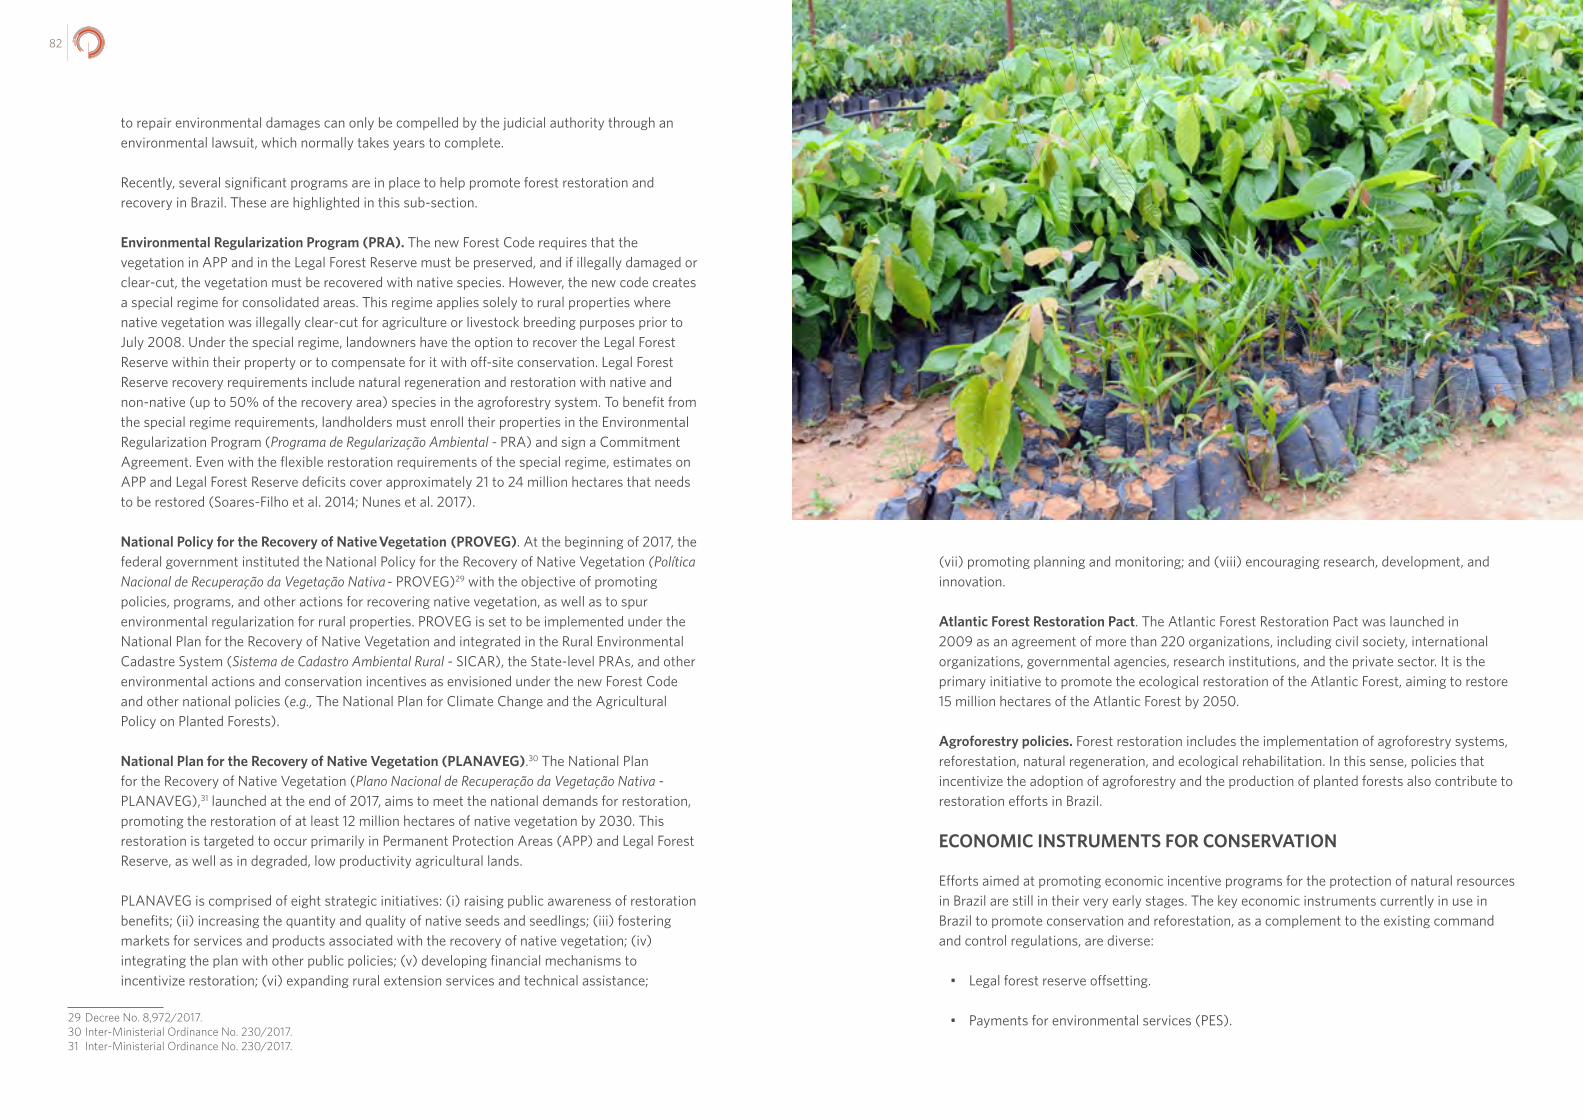
8382
to repair environmental damages can only be compelled by the judicial authority through an environmental lawsuit, which normally takes years to complete.
Recently, several significant programs are in place to help promote forest restoration and recovery in Brazil. These are highlighted in this sub-section.
Environmental Regularization Program (PRA). The new Forest Code requires that the vegetation in APP and in the Legal Forest Reserve must be preserved, and if illegally damaged or clear-cut, the vegetation must be recovered with native species. However, the new code creates a special regime for consolidated areas. This regime applies solely to rural properties where native vegetation was illegally clear-cut for agriculture or livestock breeding purposes prior to July 2008. Under the special regime, landowners have the option to recover the Legal Forest Reserve within their property or to compensate for it with off-site conservation. Legal Forest Reserve recovery requirements include natural regeneration and restoration with native and non-native (up to 50% of the recovery area) species in the agroforestry system. To benefit from the special regime requirements, landholders must enroll their properties in the Environmental Regularization Program (Programa de Regularização Ambiental - PRA) and sign a Commitment Agreement. Even with the flexible restoration requirements of the special regime, estimates on APP and Legal Forest Reserve deficits cover approximately 21 to 24 million hectares that needs to be restored (Soares-Filho et al. 2014; Nunes et al. 2017).
National Policy for the Recovery of Native Vegetation (PROVEG). At the beginning of 2017, the federal government instituted the National Policy for the Recovery of Native Vegetation (Política Nacional de Recuperação da Vegetação Nativa - PROVEG)29 with the objective of promoting policies, programs, and other actions for recovering native vegetation, as well as to spur environmental regularization for rural properties. PROVEG is set to be implemented under the National Plan for the Recovery of Native Vegetation and integrated in the Rural Environmental Cadastre System (Sistema de Cadastro Ambiental Rural - SICAR), the State-level PRAs, and other environmental actions and conservation incentives as envisioned under the new Forest Code and other national policies (e.g., The National Plan for Climate Change and the Agricultural Policy on Planted Forests).
National Plan for the Recovery of Native Vegetation (PLANAVEG).30 The National Plan for the Recovery of Native Vegetation (Plano Nacional de Recuperação da Vegetação Nativa - PLANAVEG),31 launched at the end of 2017, aims to meet the national demands for restoration, promoting the restoration of at least 12 million hectares of native vegetation by 2030. This restoration is targeted to occur primarily in Permanent Protection Areas (APP) and Legal Forest Reserve, as well as in degraded, low productivity agricultural lands.
PLANAVEG is comprised of eight strategic initiatives: (i) raising public awareness of restoration benefits; (ii) increasing the quantity and quality of native seeds and seedlings; (iii) fostering markets for services and products associated with the recovery of native vegetation; (iv) integrating the plan with other public policies; (v) developing financial mechanisms to incentivize restoration; (vi) expanding rural extension services and technical assistance;
29 Decree No. 8,972/2017.30 Inter-Ministerial Ordinance No. 230/2017.31 Inter-Ministerial Ordinance No. 230/2017.
(vii) promoting planning and monitoring; and (viii) encouraging research, development, and innovation.
Atlantic Forest Restoration Pact. The Atlantic Forest Restoration Pact was launched in 2009 as an agreement of more than 220 organizations, including civil society, international organizations, governmental agencies, research institutions, and the private sector. It is the primary initiative to promote the ecological restoration of the Atlantic Forest, aiming to restore 15 million hectares of the Atlantic Forest by 2050.
Agroforestry policies. Forest restoration includes the implementation of agroforestry systems, reforestation, natural regeneration, and ecological rehabilitation. In this sense, policies that incentivize the adoption of agroforestry and the production of planted forests also contribute to restoration efforts in Brazil.
ECONOMIC INSTRUMENTS FOR CONSERVATION
Efforts aimed at promoting economic incentive programs for the protection of natural resources in Brazil are still in their very early stages. The key economic instruments currently in use in Brazil to promote conservation and reforestation, as a complement to the existing command and control regulations, are diverse:
• Legal forest reserve offsetting.
• Payments for environmental services (PES).
8584
• Green lines of credit.
• Environmental and climate funds.
• Fiscal instruments.
• Access and benefit sharing (ABS).
• Reducing Emissions from Deforestation and Forest Degradation (REDD+).
Each of these is described in greater detail below.
Legal Forest Reserve Offsets. The new Forest Code requires that rural landowners set aside a percentage of their property area with native vegetation as Legal Forest Reserve. The code framework requires all landowners to restore illegally deforested Legal Forest Reserves on their properties.
However, landowners who fall under a special regime32 have the option to offset their Legal Forest Reserve requirements through four different mechanisms:
i. Designate surplus areas in their other properties as Legal Forest Reserve on a property that lacks sufficient restored area;
ii. Lease a conservation easement;
iii. Buy land from a private owner in a strictly protected area and donate it to the government; and
iv. Buy an Environmental Reserve Quota (CRA).
The Environmental Reserve Quota (CRA), a tradable title that can be used to offset the Forest Legal Reserve requirements, is considered one of the most important innovations of the Forest Code, with the potential to induce greater compliance. Landholders that maintained native vegetation in excess of the code’s requirements can issue CRAs and trade them with landowners with Legal Forest Reserve deficits. Despite its potential, the CRA market is not in operation due to a lack of regulation at the federal level (Chiavari and Lopes 2017).
Payments for Environmental Services (PES). In the last decade, there has been an increase in Payments for Environmental Services (PES) schemes in Brazil. Although PES refers to various instruments in the literature and in practice (Pirard 2012), it can be defined as a direct, conditional contract to achieve a negotiated environmental outcome between a provider and a user of environmental services (Ezzine-de-Blas et al. 2016). Although there is no national program in operation (there is a federal law project in discussion in Congress), some states
32 The Legal Forest Reserve special regime applies solely to rural properties where native vegetation was illegally clear-cut for agriculture or livestock breeding purposes prior to July 2008.
and municipalities have already implemented their own PES programs, and there are several initiatives being carried out by private companies and non-governmental organizations.
It is important to note that PES initiatives in Brazil are in their infancy and the area under conservation in PES schemes is still small, accounting for less than 50,000 hectares (Pagiola, Carrascosa, and Taffarello 2013).33 The majority of PES programs in Brazil focus on watershed services, and the area enrolled is more often under conservation rather than restoration contracts (Pagiola, Carrascosa, and Taffarello 2013). Most of the projects for payments for watershed services in Brazil reward landowners to conserve or restore riparian vegetation (APP).
Green lines of credit. Green lines of credit have been developed to promote low carbon agricultural practices, mitigate emissions from deforestation, and to assist landowners with complying with the Forest Code. The Brazilian Development Bank (Banco Nacional de Desenvolvimento Econômico e Social - BNDES), public banks, such as Banco do Brasil, and other financial agents offer special lines of credit and programs. The interest rates vary from 2.5% (small producers) to 8.5% a year34 for the reforestation of degraded lands, Legal Forest Reserves, and APP; the implementation of commercial forests; agroforestry systems; integrated crop-livestock-forest systems (ICLF); and sustainable forest management.
Environmental and climate funds. In 2008, the government created the Amazon Fund35 to raise donations earmarked for non-reimbursable investments in efforts to prevent, monitor, and combat deforestation, as well as to promote preservation and sustainable use in the Brazilian Amazon. Managed by BNDES, the Amazon Fund has been an essential instrument to ensure financial resources for the implementation of PPCDAm and aligned policies. Furthermore, up to 20% of the fund’s resources may be allocated to support the development of systems for monitoring and controlling deforestation in other Brazilian biomes.
Fiscal instruments. Brazil pioneered the introduction of the ecological fiscal transfer (EFT) mechanism through the adoption of the ICMS Ecológico, an ecological value-added tax. Adopted in a number of states, ICMS Ecológico compensates municipalities for land‐use restrictions and opportunity costs imposed by protected areas (May, Gebara, Conti, and Lima 2012). Brazil also uses another fiscal instrument for conservation: the exemption of the Rural Property Tax (Imposto Territorial Rural - ITR) in areas of high ecological interest, such as native forests, Legal Forest Reserves and APP, environmental easements, and Private Reserves of the Natural Heritage (Reserva Particular do Patrimônio Natural - RPPN).36
Access and Benefit Sharing (ABS). Another economic instrument that can enhance conservation and sustainable use of biodiversity in Brazil is the Access and Benefit Sharing mechanisms (ABS), which were established by the Convention on Biological Diversity. As part of the convention, Brazil has set requirements for access to its genetic heritage and associated
33 The figure for Brazil does not include the Bolsa Floresta program in Amazonas, as this program makes payments on a house-hold basis rather than an area basis.34 For a complete guide to all of the credit lines available, please refer to SFB financing guides: Ministério do Meio Ambiente. 2016; Guia de Financiamento Florestal 2016; and Serviço Florestal Brasileiro, Ministério do Meio Ambiente. Brasília: MMA. 35 Decree No. 6,527/2008.36 Law No. 9,393/1996.
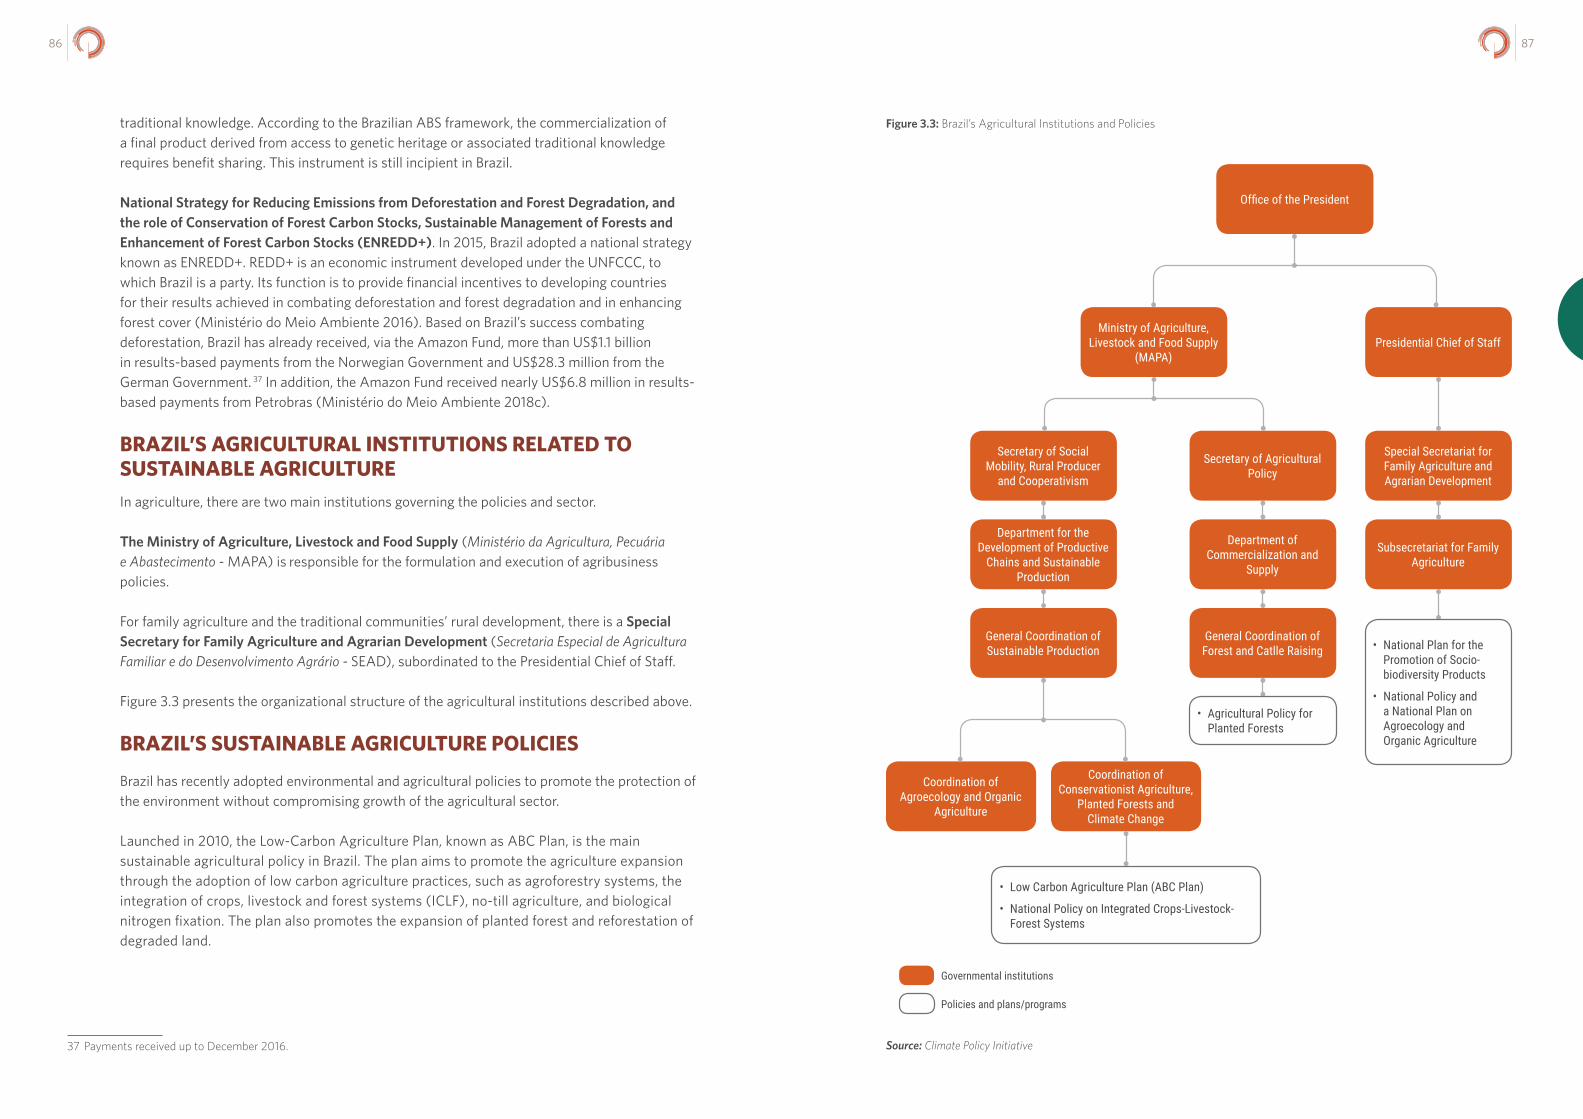
8786
traditional knowledge. According to the Brazilian ABS framework, the commercialization of a final product derived from access to genetic heritage or associated traditional knowledge requires benefit sharing. This instrument is still incipient in Brazil.
National Strategy for Reducing Emissions from Deforestation and Forest Degradation, and the role of Conservation of Forest Carbon Stocks, Sustainable Management of Forests and Enhancement of Forest Carbon Stocks (ENREDD+). In 2015, Brazil adopted a national strategy known as ENREDD+. REDD+ is an economic instrument developed under the UNFCCC, to which Brazil is a party. Its function is to provide financial incentives to developing countries for their results achieved in combating deforestation and forest degradation and in enhancing forest cover (Ministério do Meio Ambiente 2016). Based on Brazil’s success combating deforestation, Brazil has already received, via the Amazon Fund, more than US$1.1 billion in results-based payments from the Norwegian Government and US$28.3 million from the German Government. 37 In addition, the Amazon Fund received nearly US$6.8 million in results-based payments from Petrobras (Ministério do Meio Ambiente 2018c).
BRAZIL’S AGRICULTURAL INSTITUTIONS RELATED TO SUSTAINABLE AGRICULTUREIn agriculture, there are two main institutions governing the policies and sector.
The Ministry of Agriculture, Livestock and Food Supply (Ministério da Agricultura, Pecuária e Abastecimento - MAPA) is responsible for the formulation and execution of agribusiness policies.
For family agriculture and the traditional communities’ rural development, there is a Special Secretary for Family Agriculture and Agrarian Development (Secretaria Especial de Agricultura Familiar e do Desenvolvimento Agrário - SEAD), subordinated to the Presidential Chief of Staff.
Figure 3.3 presents the organizational structure of the agricultural institutions described above.
BRAZIL’S SUSTAINABLE AGRICULTURE POLICIES
Brazil has recently adopted environmental and agricultural policies to promote the protection of the environment without compromising growth of the agricultural sector.
Launched in 2010, the Low-Carbon Agriculture Plan, known as ABC Plan, is the main sustainable agricultural policy in Brazil. The plan aims to promote the agriculture expansion through the adoption of low carbon agriculture practices, such as agroforestry systems, the integration of crops, livestock and forest systems (ICLF), no-till agriculture, and biological nitrogen fixation. The plan also promotes the expansion of planted forest and reforestation of degraded land.
37 Payments received up to December 2016.
Office of the President
Presidential Chief of Staff
Special Secretariat for Family Agriculture and Agrarian Development
Subsecretariat for Family Agriculture
• National Plan for the Promotion of Socio-biodiversity Products
• National Policy and a National Plan on Agroecology and Organic Agriculture
Ministry of Agriculture, Livestock and Food Supply
(MAPA)
Secretary of Social Mobility, Rural Producer
and Cooperativism
Secretary of Agricultural Policy
Department of Commercialization and
Supply
General Coordination of Forest and Catlle Raising
Department for the Development of Productive
Chains and Sustainable Production
General Coordination of Sustainable Production
Coordination of Agroecology and Organic
Agriculture
Coordination of Conservationist Agriculture,
Planted Forests and Climate Change
• Low Carbon Agriculture Plan (ABC Plan)
• National Policy on Integrated Crops-Livestock-Forest Systems
• Agricultural Policy for Planted Forests
Governmental institutions
Policies and plans/programs
Figure 3.3: Brazil’s Agricultural Institutions and Policies
Source: Climate Policy Initiative

8988
Some of the practices included in the ABC Plan were converted into national policies, such as in the case of the National Policy on Integrated Crops-Livestock-Forest Systems and the Agricultural Policy for Planted Forest.
Finally, Brazil has also adopted some policies to promote sustainable rural development and the sustainable use of natural resources, such as agroecology and organic agriculture.
Low-Carbon Agriculture Plan (ABC Plan). The main climate policy for the agricultural sector in Brazil is the Low-Carbon Agriculture Plan (Plano Setorial de Mitigação e de Adaptação às Mudanças Climáticas para a Consolidação de uma Economia de Baixa Emissão de Carbono na Agricultura - ABC Plan), as laid out in the National Policy on Climate Change regulation.38
The ABC Plan strives to promote a reduction in greenhouse gas emissions in agriculture by adopting low carbon technologies, increasing efficiency in the use of natural resources, increasing the resilience of production systems and rural communities, and by promoting adaptation to climate change in the sector. The plan is national in scope and valid from 2010 to 2020.
The goals of the ABC Plan include restoring 15 million hectares of degraded pasture; implementing 5 million hectares of integrated crops, livestock, and forest and agroforesty systems (Sistemas Agroflorestais – SAFs); expanding the use of direct planting technology (no-till agriculture) by 8 million hectares; substituting nitrogen fertilizers for Biological Nitrogen Fixation (FBN) in 5.5 million hectors; adding 3 million hectares of planted forests; and increasing the use of technology to treat 4.4 million cubic meters of animal waste for biogas and organic compost.
Low-Carbon Agriculture Program (ABC Program). The federal government created the Low-Carbon Agriculture Program (Programa para Redução da Emissão de Gases de Efeito Estufa na Agricultura - ABC Program) as a funding source for agricultural companies to implement the actions outlined in the ABC Plan.
National Program for Family Agriculture (PRONAF). Family agricultural activities under the ABC plan are eligible for funding under credit lines in the National Program for Family Agriculture (Programa Nacional de Agricultura Familiar – PRONAF).
National Policy on Integrated Crops-Livestock-Forest Systems (ICLF). In addition to the ABC Plan, a National Policy on Integrated Crops-Livestock-Forest Systems (ICLF) was launched in 2013 to promote the expansion of ICLF systems, especially in degraded pastures and deforested areas.39
Agricultural Policy for Planted Forests. The federal government also established a legal framework to promote commercial forests and launched the Agricultural Policy for Planted Forests in 2014.40 The policy aims to increase the production and the productivity of planted forests, contribute to the expansion of the forest cover, and to reduce pressure over native forests.
38 Decree No. 7,390/2010.39 Law No. 12,805/2013.40 Decree No. 8,375/2014.
National Plan for the Promotion of Socio-biodiversity Products (PNPSB). Some public policies also promote sustainable agriculture but focus on specific social groups, such as family farmers or traditional communities, or specific products. Aiming to encourage sustainable economic alternatives to local people, the federal government instituted the National Plan for the Promotion of Socio-biodiversity Products (Plano Nacional para a Promoção dos Produtos da Sociobiodiversidade - PNPSB) in 2009.
Following PNPSB, the government launched a National Policy and a National Plan on Agroecology and Organic Agriculture (Política Nacional de Agroecologia e Produção Orgânica – PNAPO41 and Plano Nacional de Agroecologia e Produção Orgânica - PLANAPO42) aiming at widening and consolidating actions towards sustainable rural development and promoting the sustainable use of natural resources.
PROPERTY RIGHTS AND LAND TENURE REGULARIZATION IN BRAZIL Brazil lags behind much of the world in providing secure and well-defined property rights. Insecure land rights in Brazil cause land conflicts, deforestation, underdeveloped land rental markets, and inefficient land use decisions. Secure and well-defined rural property rights provide an essential tool for effective natural resource management; therefore, Brazil must improve its land rights system to promote forest conservation and sustainable agriculture (Damasceno, Chiavari, and Lopes 2017).
Land governance is needlessly complex. Multiple institutions at the federal, state and municipal levels share responsibilities for governing land property rights. Moreover, the absence of a unique and comprehensive rural land cadastre that is connected with the official land registry presents a major problem, making it impossible to accurately identify the owner for a large percentage of land parcels in Brazil. The lack of data is in itself an obstacle to better land organization and enforcement of existing rights.
The current land structure of the country has resulted in a mosaic of land categories, each governed by its own laws and administered by different governing bodies with unique characteristics. A particular characteristic of the Brazilian rural land structure is that nearly 50% of the lands in the country are estimated to be under public ownership. Public lands take on many forms: settlements, indigenous lands, protected areas, and vacant (or undesignated) public lands. This predominance of public land is particularly important in the Amazon region where property rights insecurity is acute and makes the lands highly susceptible to threats, invasions, conflicts, and deforestation (Damasceno, Chiavari, and Lopes 2017).
Brazil’s major initiative to promote land tenure regularization in the Amazon is the Terra Legal Program. 43 Launched in 2009, the program aims to legalize the use and possession of federal public lands within the Amazon region and grants secured land titles to small family-run farms. To receive titles, smallholders must have occupied the area peacefully, cultivated a portion of the land since 2004, be Brazilian citizens, and not own other rural properties or have previously
41 Decree No. 7,794/2012.42 Inter-Ministerial Ordinance No. 1/2016.43 Law No. 11,952/2009 and Decree No. 6,992/2009.
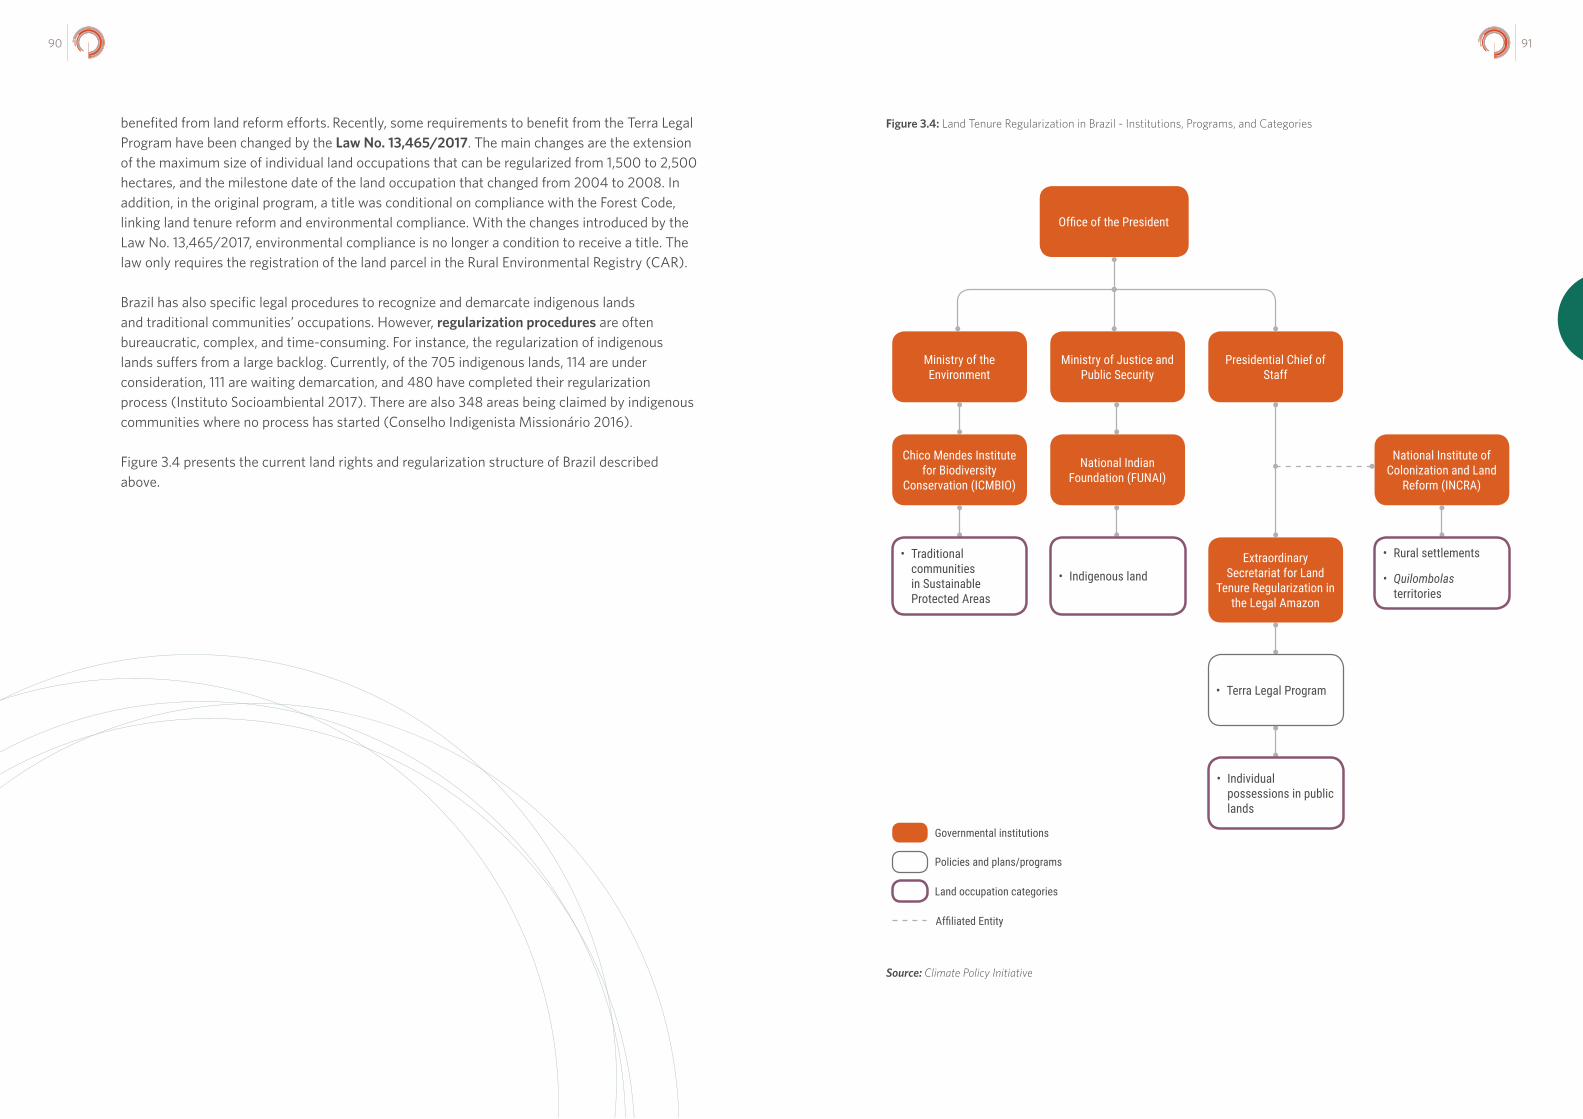
9190
benefited from land reform efforts. Recently, some requirements to benefit from the Terra Legal Program have been changed by the Law No. 13,465/2017. The main changes are the extension of the maximum size of individual land occupations that can be regularized from 1,500 to 2,500 hectares, and the milestone date of the land occupation that changed from 2004 to 2008. In addition, in the original program, a title was conditional on compliance with the Forest Code, linking land tenure reform and environmental compliance. With the changes introduced by the Law No. 13,465/2017, environmental compliance is no longer a condition to receive a title. The law only requires the registration of the land parcel in the Rural Environmental Registry (CAR).
Brazil has also specific legal procedures to recognize and demarcate indigenous lands and traditional communities’ occupations. However, regularization procedures are often bureaucratic, complex, and time-consuming. For instance, the regularization of indigenous lands suffers from a large backlog. Currently, of the 705 indigenous lands, 114 are under consideration, 111 are waiting demarcation, and 480 have completed their regularization process (Instituto Socioambiental 2017). There are also 348 areas being claimed by indigenous communities where no process has started (Conselho Indigenista Missionário 2016).
Figure 3.4 presents the current land rights and regularization structure of Brazil described above.
Office of the President
Presidential Chief of Staff
Extraordinary Secretariat for Land
Tenure Regularization in the Legal Amazon
National Institute of Colonization and Land
Reform (INCRA)
• Rural settlements
• Quilombolas territories
• Terra Legal Program
• Individual possessions in public lands
Ministry of the Environment
Chico Mendes Institute for Biodiversity
Conservation (ICMBIO)
• Traditional communities in Sustainable Protected Areas
Ministry of Justice and Public Security
National Indian Foundation (FUNAI)
• Indigenous land
Governmental institutions
Policies and plans/programs
Land occupation categories
Affiliated Entity
Figure 3.4: Land Tenure Regularization in Brazil - Institutions, Programs, and Categories
Source: Climate Policy Initiative
9392
REFERENCES
Assunção J, Gandour C, Rocha R. 2013a. DETERring deforestation in the Amazon: environmental monitoring and law enforcement. Climate Policy Initiative, [Accessed 13 April 2018]. https://climatepolicyinitiative.org/wp-content/uploads/2013/05/DETERring-Deforestation-in-the-Brazilian-Amazon-Environmental-Monitoring-and-Law-Enforcement-Technical-Paper_Feb2017.pdf.
Assunção J, Gandour C, Rocha R. 2013b. The effect of rural credit on deforestation: Evidence from the Brazilian Amazon. Climate Policy Initiative. [Accessed 13 April 2018]. https://climatepolicyinitiative.org/wp-content/uploads/2013/01/CPI_Technical_Paper_Does_Credit_Affect_Deforestation_UPDATE_set2016.pdf.
Assunção J, Rocha R. 2014. Getting greener by going black: The priority municipalities in Brazil. Climate Policy Initiative. [Accessed 13 April 2018]. https://climatepolicyinitiative.org/wp-content/uploads/2014/08/Getting-Greener-by-Going-Black-Technical-Paper.pdf.
Barreto P, Veríssimo A. 2002. Informações e sugestões para a criação e gestão de florestas públicas na Amazônia. Brasília: Ministério do Meio Ambiente.
Chiavari J, Lopes CL (forthcoming).
Chiavari J, Lopes C. 2015. Brazil’s new Forest Code: How to navigate the complexity. Climate Policy Initiative. [Accessed 19 April 2018]. https://climatepolicyinitiative.org/wp-content/uploads/2015/11/Policy-Brief-Part-I-How-to-Navigate-the-Complexity.pdf
Chiavari J, Lopes CL. 2017. Cota de reserva ambiental: melhor opção para compensar reserva legal? Análise para Política Pública. INPUT/CPI.
Conselho Indigenista Missionário. 2016. Violência contra os povos indígenas no Brasil - Dados de 2015. [Accessed 20 April 2018]. https://www.cimi.org.br/pub/relatorio/Relatorio-violencia-contra-povos-indigenas_2015-Cimi.pdf.
Damasceno R, Chiavari J, Lopes CL. 2017. Evolution of land rights in rural Brazil. Climate Policy Initiative.
Drummond J, Barros-Platiau AF. 2006. Brazilian environmental laws and policies, 1934- 2002: a critical overview. Law & Policy. 28(1):83-108.
Ezzine-de-Blas D, et al. 2016. Global patterns in the implementation of payments for environmental services. PLoS ONE. 11(3):e0149847.
Ferraz C, Seroa RM. 2002. Concessões Florestais e Exploração Madeireira no Brasil: Condicionantes para a Sustentabilidade. Brasília: Ministério do Meio Ambiente.
Instituto Socioambiental. 2017. Povos Indígenas no Brasil. Terras Indígenas. Demarcações. Situação jurídica das TIs no Brasil hoje. [Accessed March 7, 2017]. https://goo.gl/JMjLfz.
May PH, Gebara MF, Conti BR, Lima GR. 2012. The ‘ecological’ value added tax (ICMS-Ecológico) in Brazil and its effectiveness in state biodiversity conservation: a comparative analysis. In Proceedings of the 12th Biennial Conference of the International Society for Ecological Economics, Rio de Janeiro.
Ministério do Meio Ambiente. 2016. ENREDD+. National strategy for reducing emissions from deforestation and forest degradation, and the role of conservation of forest carbon stocks, sustainable management of forests and enhancement of forest carbon stocks. Brasília: MMA. [Accessed 20 April 2018]. http://redd.unfccc.int/files/brazil_national_redd__strategy.pdf.
Ministério do Meio Ambiente. 2018a. Cadastro Nacional de Unidades de Conservação. [Accessed 19 April 2018]. http://www.mma.gov.br/images/arquivo/80238/CNUC_FEV18 - C_Bio.pdf.
Ministério do Meio Ambiente. 2018b. Programa ARPA. [Accessed 19 April 2018]. http://mma.gov.br/mma-em-numeros/programa-arpa.
Ministério do Meio Ambiente. 2018c. REDD+Brasil. Finance. [Accessed 20 April 2018]. http://redd.mma.gov.br/en/finance.
Nunes FSM et al. 2017. Enabling large-scale forest restoration in Minas Gerais state, Brazil. Environmental Research Letters. 12(4):044022.
Pagiola S, Carrascosa GH, Taffarello D. 2013. Brazil’s experience with payments for environmental services. Washington DC: World Bank.
Pirard R. 2012. Market-based instruments for biodiversity and ecosystem services: A lexicon. Environmental Science & Policy. 19:59-68.
Soares-Filho B et al. 2014. Cracking Brazil’s Forest Code. Science. 344(6182):363-364.
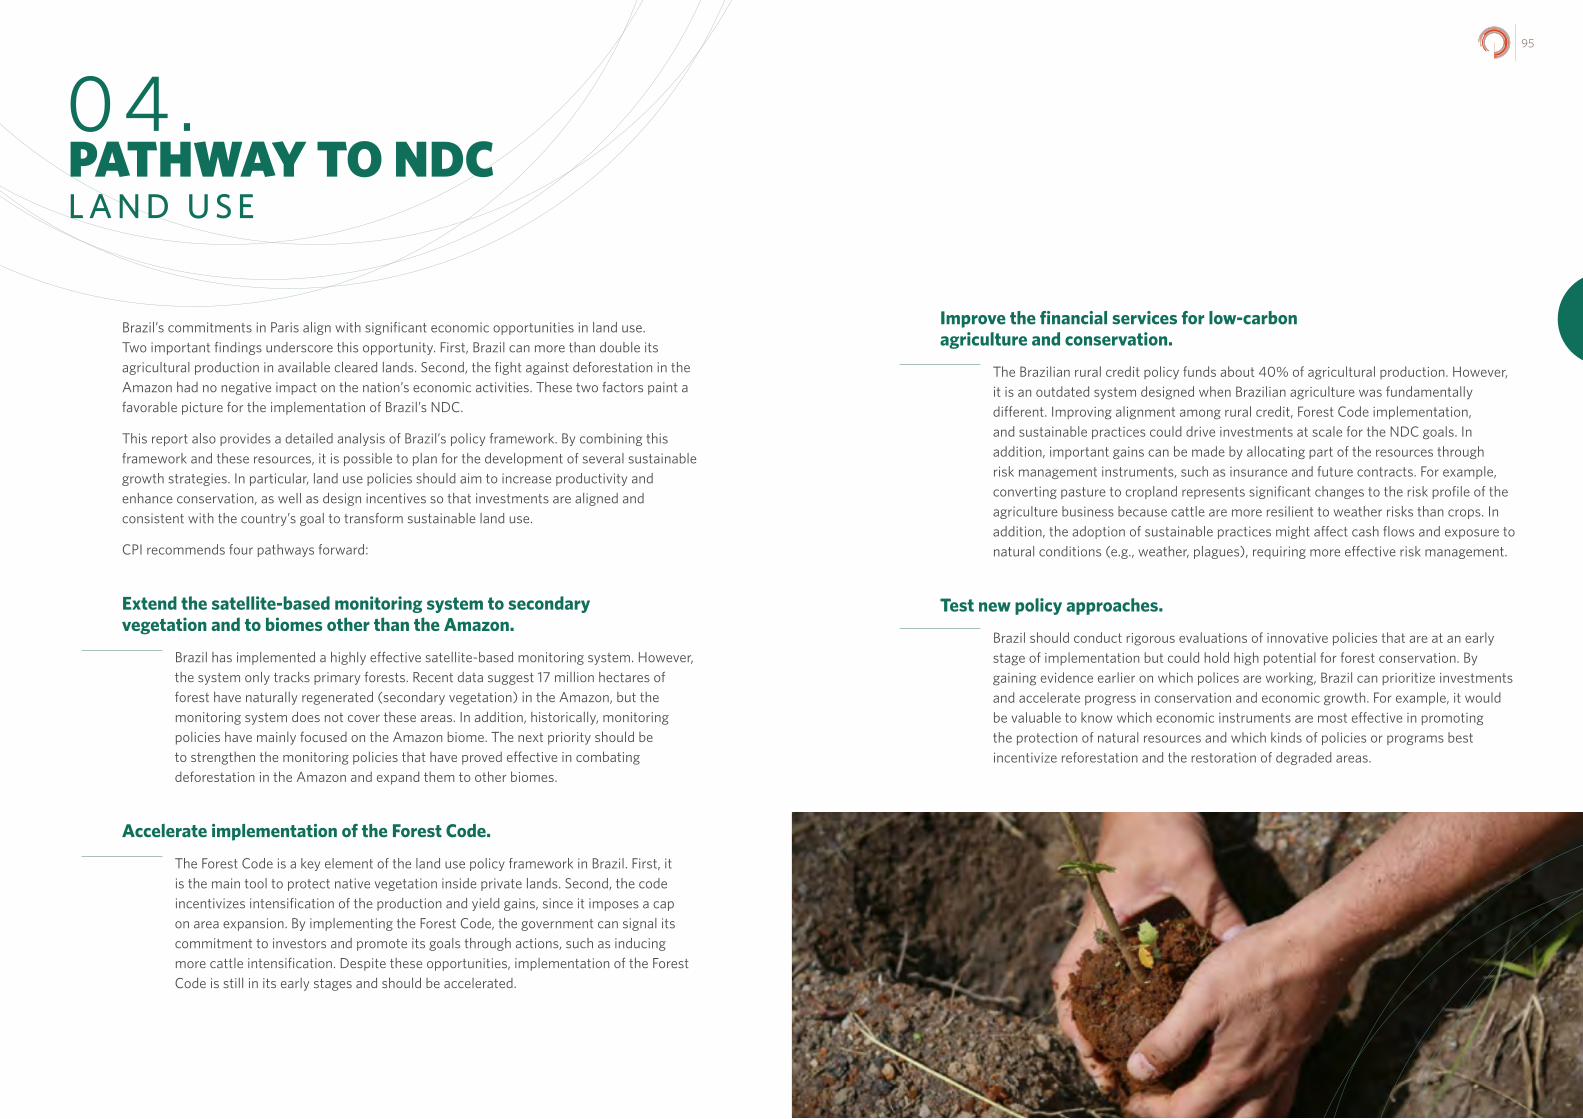
95
Brazil’s commitments in Paris align with significant economic opportunities in land use. Two important findings underscore this opportunity. First, Brazil can more than double its agricultural production in available cleared lands. Second, the fight against deforestation in the Amazon had no negative impact on the nation’s economic activities. These two factors paint a favorable picture for the implementation of Brazil’s NDC.
This report also provides a detailed analysis of Brazil’s policy framework. By combining this framework and these resources, it is possible to plan for the development of several sustainable growth strategies. In particular, land use policies should aim to increase productivity and enhance conservation, as well as design incentives so that investments are aligned and consistent with the country’s goal to transform sustainable land use.
CPI recommends four pathways forward:
Extend the satellite-based monitoring system to secondary vegetation and to biomes other than the Amazon.
Brazil has implemented a highly effective satellite-based monitoring system. However, the system only tracks primary forests. Recent data suggest 17 million hectares of forest have naturally regenerated (secondary vegetation) in the Amazon, but the monitoring system does not cover these areas. In addition, historically, monitoring policies have mainly focused on the Amazon biome. The next priority should be to strengthen the monitoring policies that have proved effective in combating deforestation in the Amazon and expand them to other biomes.
Accelerate implementation of the Forest Code.
The Forest Code is a key element of the land use policy framework in Brazil. First, it is the main tool to protect native vegetation inside private lands. Second, the code incentivizes intensification of the production and yield gains, since it imposes a cap on area expansion. By implementing the Forest Code, the government can signal its commitment to investors and promote its goals through actions, such as inducing more cattle intensification. Despite these opportunities, implementation of the Forest Code is still in its early stages and should be accelerated.
Improve the financial services for low-carbon agriculture and conservation.
The Brazilian rural credit policy funds about 40% of agricultural production. However, it is an outdated system designed when Brazilian agriculture was fundamentally different. Improving alignment among rural credit, Forest Code implementation, and sustainable practices could drive investments at scale for the NDC goals. In addition, important gains can be made by allocating part of the resources through risk management instruments, such as insurance and future contracts. For example, converting pasture to cropland represents significant changes to the risk profile of the agriculture business because cattle are more resilient to weather risks than crops. In addition, the adoption of sustainable practices might affect cash flows and exposure to natural conditions (e.g., weather, plagues), requiring more effective risk management.
Test new policy approaches.
Brazil should conduct rigorous evaluations of innovative policies that are at an early stage of implementation but could hold high potential for forest conservation. By gaining evidence earlier on which polices are working, Brazil can prioritize investments and accelerate progress in conservation and economic growth. For example, it would be valuable to know which economic instruments are most effective in promoting the protection of natural resources and which kinds of policies or programs best incentivize reforestation and the restoration of degraded areas.
PATHWAY TO NDC L A N D U S E
04.
9796
ENERGY
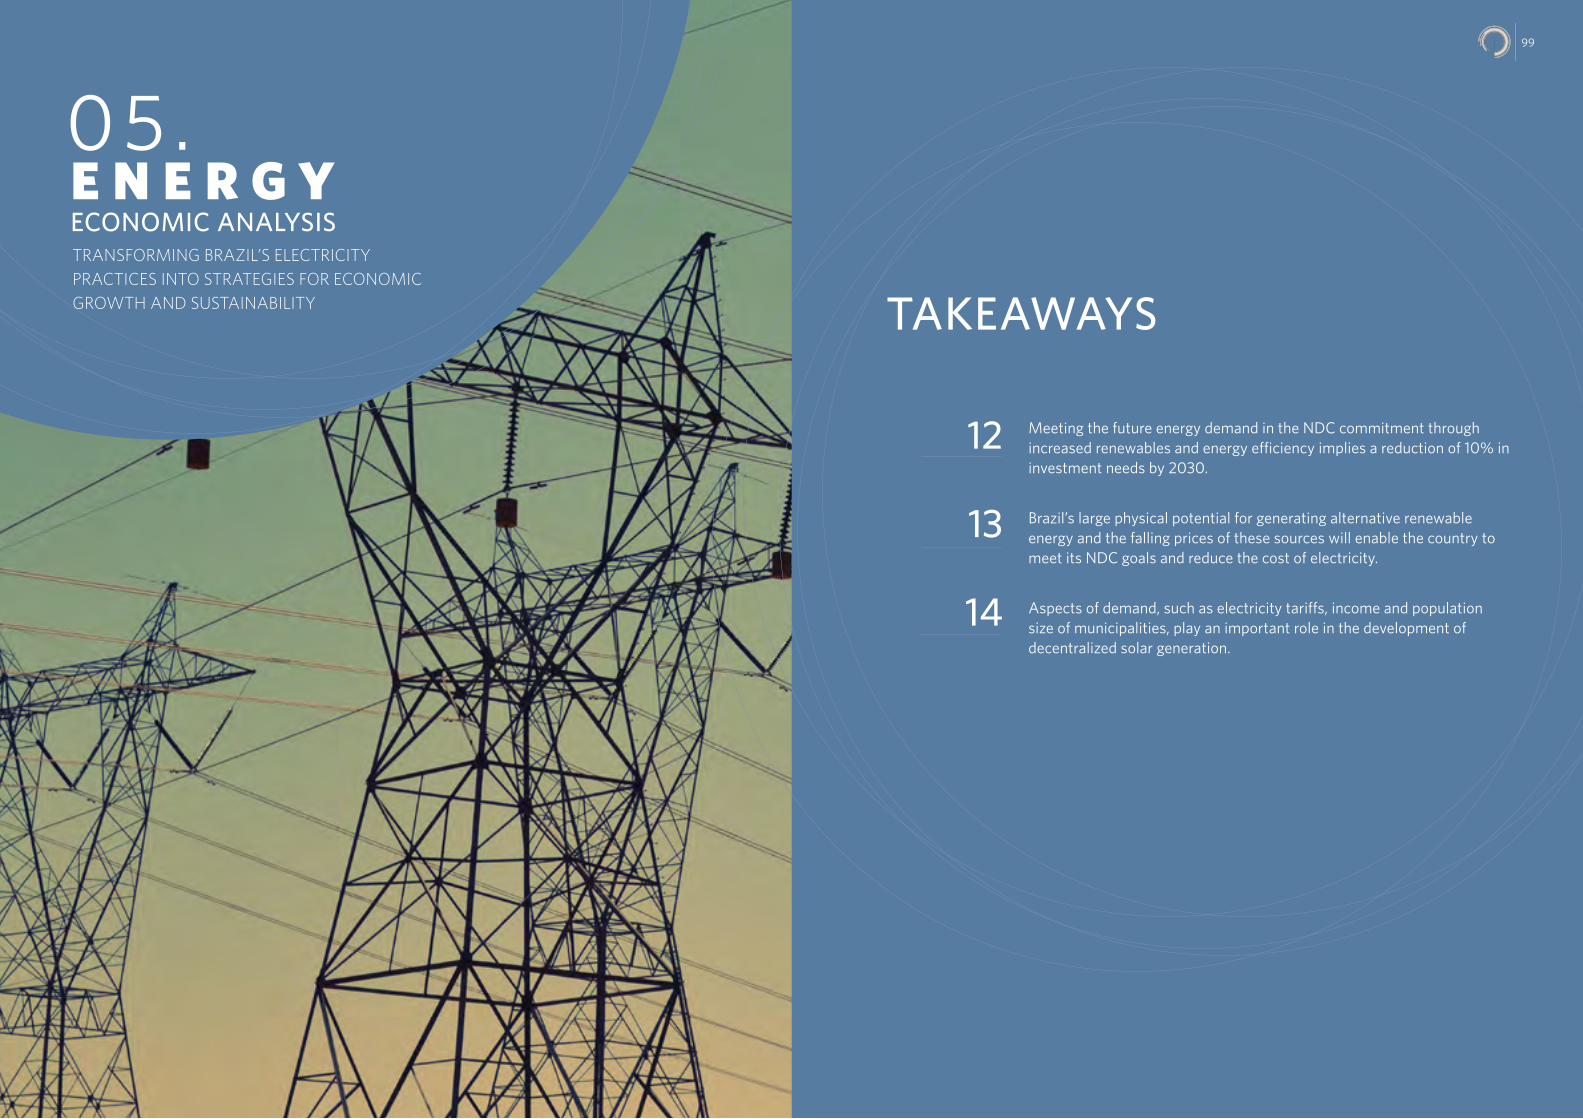
9998
TRANSFORMING BRAZIL’S ELECTRICITY PRACTICES INTO STRATEGIES FOR ECONOMIC GROWTH AND SUSTAINABILITY
E N E R G YECONOMIC ANALYSIS
Meeting the future energy demand in the NDC commitment through increased renewables and energy efficiency implies a reduction of 10% in investment needs by 2030.
Brazil’s large physical potential for generating alternative renewable energy and the falling prices of these sources will enable the country to meet its NDC goals and reduce the cost of electricity.
Aspects of demand, such as electricity tariffs, income and population size of municipalities, play an important role in the development of decentralized solar generation.
TAKEAWAYS
12
13
14
99
05 .
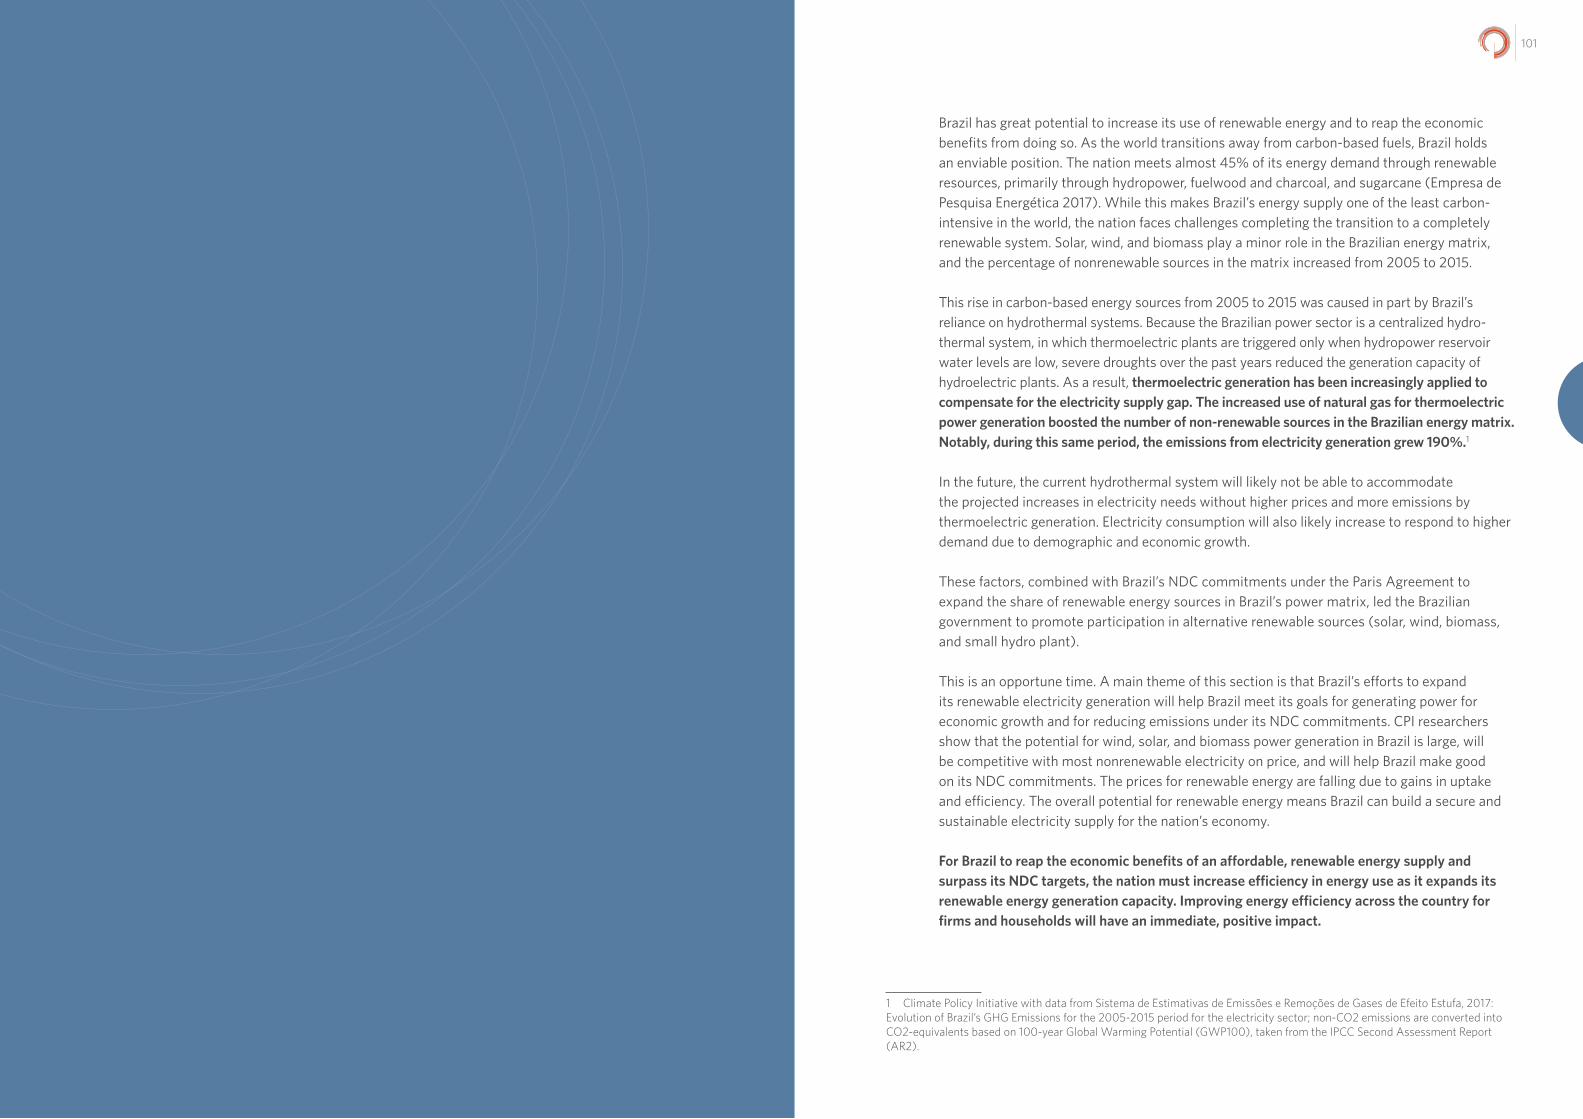
101100
Brazil has great potential to increase its use of renewable energy and to reap the economic benefits from doing so. As the world transitions away from carbon-based fuels, Brazil holds an enviable position. The nation meets almost 45% of its energy demand through renewable resources, primarily through hydropower, fuelwood and charcoal, and sugarcane (Empresa de Pesquisa Energética 2017). While this makes Brazil’s energy supply one of the least carbon-intensive in the world, the nation faces challenges completing the transition to a completely renewable system. Solar, wind, and biomass play a minor role in the Brazilian energy matrix, and the percentage of nonrenewable sources in the matrix increased from 2005 to 2015.
This rise in carbon-based energy sources from 2005 to 2015 was caused in part by Brazil’s reliance on hydrothermal systems. Because the Brazilian power sector is a centralized hydro-thermal system, in which thermoelectric plants are triggered only when hydropower reservoir water levels are low, severe droughts over the past years reduced the generation capacity of hydroelectric plants. As a result, thermoelectric generation has been increasingly applied to compensate for the electricity supply gap. The increased use of natural gas for thermoelectric power generation boosted the number of non-renewable sources in the Brazilian energy matrix. Notably, during this same period, the emissions from electricity generation grew 190%.1
In the future, the current hydrothermal system will likely not be able to accommodate the projected increases in electricity needs without higher prices and more emissions by thermoelectric generation. Electricity consumption will also likely increase to respond to higher demand due to demographic and economic growth.
These factors, combined with Brazil’s NDC commitments under the Paris Agreement to expand the share of renewable energy sources in Brazil’s power matrix, led the Brazilian government to promote participation in alternative renewable sources (solar, wind, biomass, and small hydro plant).
This is an opportune time. A main theme of this section is that Brazil’s efforts to expand its renewable electricity generation will help Brazil meet its goals for generating power for economic growth and for reducing emissions under its NDC commitments. CPI researchers show that the potential for wind, solar, and biomass power generation in Brazil is large, will be competitive with most nonrenewable electricity on price, and will help Brazil make good on its NDC commitments. The prices for renewable energy are falling due to gains in uptake and efficiency. The overall potential for renewable energy means Brazil can build a secure and sustainable electricity supply for the nation’s economy.
For Brazil to reap the economic benefits of an affordable, renewable energy supply and surpass its NDC targets, the nation must increase efficiency in energy use as it expands its renewable energy generation capacity. Improving energy efficiency across the country for firms and households will have an immediate, positive impact.
1 Climate Policy Initiative with data from Sistema de Estimativas de Emissões e Remoções de Gases de Efeito Estufa, 2017: Evolution of Brazil’s GHG Emissions for the 2005-2015 period for the electricity sector; non-CO2 emissions are converted into CO2-equivalents based on 100-year Global Warming Potential (GWP100), taken from the IPCC Second Assessment Report (AR2).
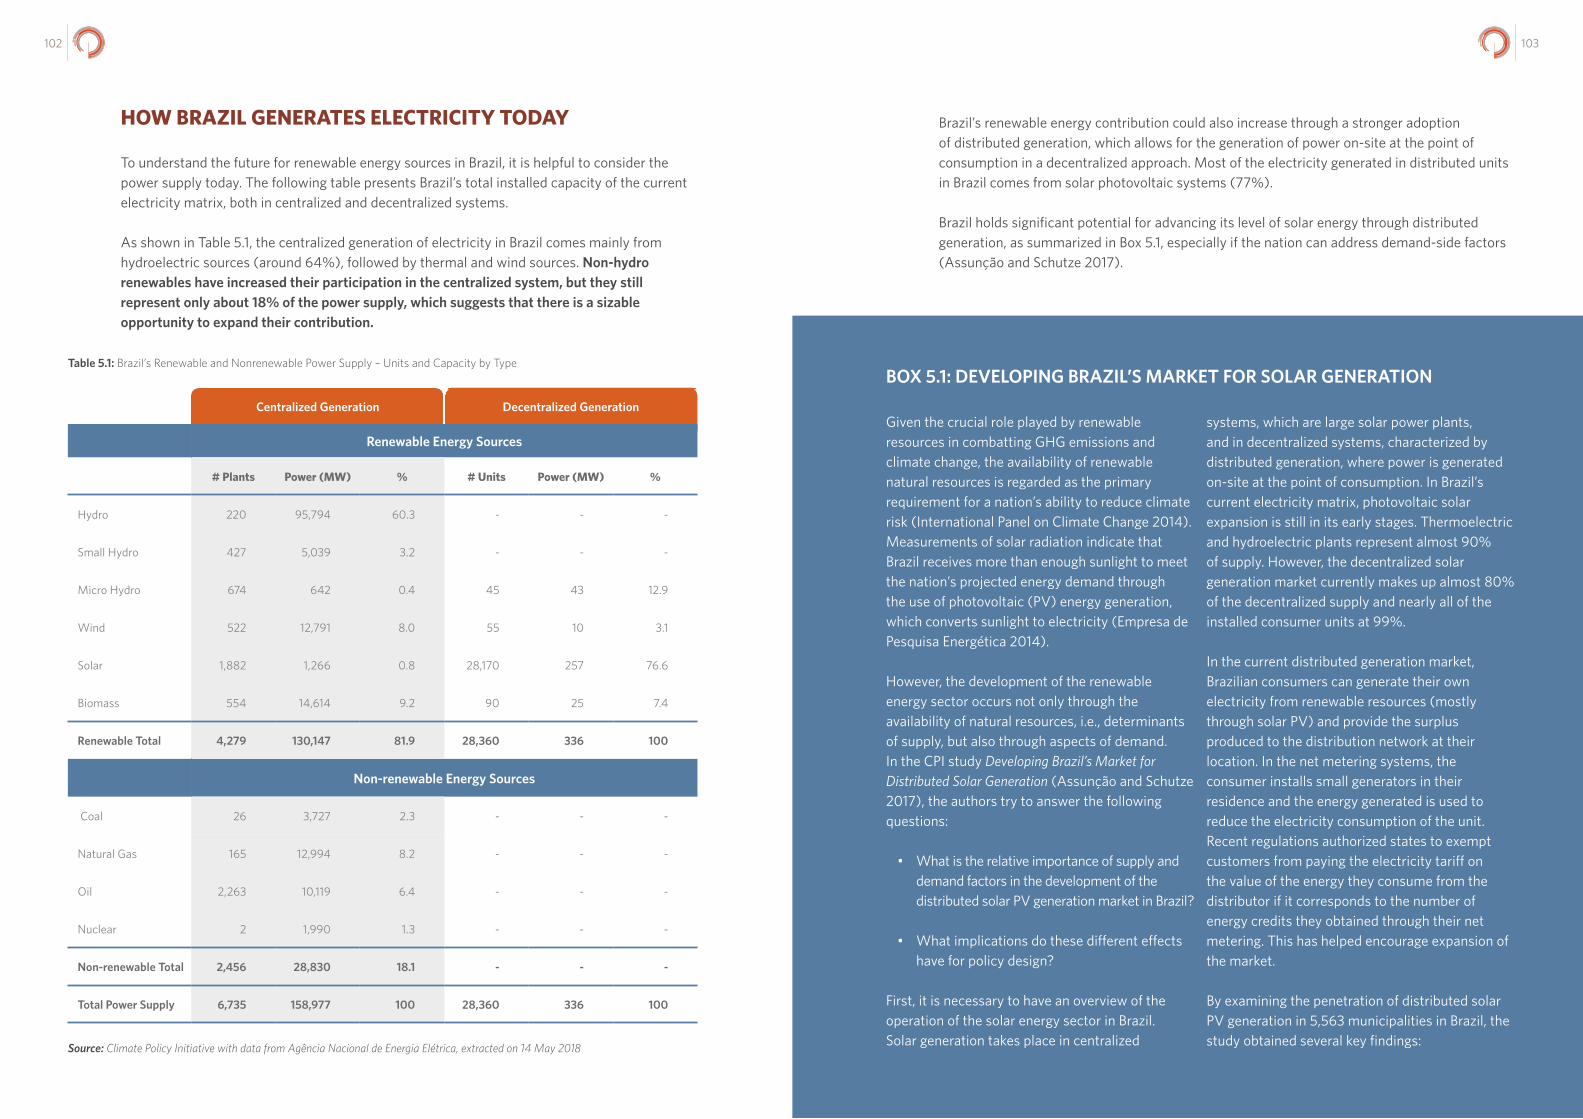
103102
Brazil’s renewable energy contribution could also increase through a stronger adoption of distributed generation, which allows for the generation of power on-site at the point of consumption in a decentralized approach. Most of the electricity generated in distributed units in Brazil comes from solar photovoltaic systems (77%).
Brazil holds significant potential for advancing its level of solar energy through distributed generation, as summarized in Box 5.1, especially if the nation can address demand-side factors (Assunção and Schutze 2017).
HOW BRAZIL GENERATES ELECTRICITY TODAY
To understand the future for renewable energy sources in Brazil, it is helpful to consider the power supply today. The following table presents Brazil’s total installed capacity of the current electricity matrix, both in centralized and decentralized systems.
As shown in Table 5.1, the centralized generation of electricity in Brazil comes mainly from hydroelectric sources (around 64%), followed by thermal and wind sources. Non-hydro renewables have increased their participation in the centralized system, but they still represent only about 18% of the power supply, which suggests that there is a sizable opportunity to expand their contribution.
Table 5.1: Brazil’s Renewable and Nonrenewable Power Supply – Units and Capacity by Type
Centralized Generation Decentralized Generation
Renewable Energy Sources
# Plants Power (MW) % # Units Power (MW) %
Hydro 220 95,794 60.3 - - -
Small Hydro 427 5,039 3.2 - - -
Micro Hydro 674 642 0.4 45 43 12.9
Wind 522 12,791 8.0 55 10 3.1
Solar 1,882 1,266 0.8 28,170 257 76.6
Biomass 554 14,614 9.2 90 25 7.4
Renewable Total 4,279 130,147 81.9 28,360 336 100
Non-renewable Energy Sources
Coal 26 3,727 2.3 - - -
Natural Gas 165 12,994 8.2 - - -
Oil 2,263 10,119 6.4 - - -
Nuclear 2 1,990 1.3 - - -
Non-renewable Total 2,456 28,830 18.1 - - -
Total Power Supply 6,735 158,977 100 28,360 336 100
Source: Climate Policy Initiative with data from Agência Nacional de Energia Elétrica, extracted on 14 May 2018
BOX 5.1: DEVELOPING BRAZIL’S MARKET FOR SOLAR GENERATION
Given the crucial role played by renewable resources in combatting GHG emissions and climate change, the availability of renewable natural resources is regarded as the primary requirement for a nation’s ability to reduce climate risk (International Panel on Climate Change 2014).
Measurements of solar radiation indicate that Brazil receives more than enough sunlight to meet the nation’s projected energy demand through the use of photovoltaic (PV) energy generation, which converts sunlight to electricity (Empresa de Pesquisa Energética 2014).
However, the development of the renewable energy sector occurs not only through the availability of natural resources, i.e., determinants of supply, but also through aspects of demand. In the CPI study Developing Brazil’s Market for Distributed Solar Generation (Assunção and Schutze 2017), the authors try to answer the following questions:
• What is the relative importance of supply and demand factors in the development of the distributed solar PV generation market in Brazil?
• What implications do these different effects have for policy design?
First, it is necessary to have an overview of the operation of the solar energy sector in Brazil. Solar generation takes place in centralized
systems, which are large solar power plants, and in decentralized systems, characterized by distributed generation, where power is generated on-site at the point of consumption. In Brazil’s current electricity matrix, photovoltaic solar expansion is still in its early stages. Thermoelectric and hydroelectric plants represent almost 90% of supply. However, the decentralized solar generation market currently makes up almost 80% of the decentralized supply and nearly all of the installed consumer units at 99%.
In the current distributed generation market, Brazilian consumers can generate their own electricity from renewable resources (mostly through solar PV) and provide the surplus produced to the distribution network at their location. In the net metering systems, the consumer installs small generators in their residence and the energy generated is used to reduce the electricity consumption of the unit. Recent regulations authorized states to exempt customers from paying the electricity tariff on the value of the energy they consume from the distributor if it corresponds to the number of energy credits they obtained through their net metering. This has helped encourage expansion of the market.
By examining the penetration of distributed solar PV generation in 5,563 municipalities in Brazil, the study obtained several key findings:
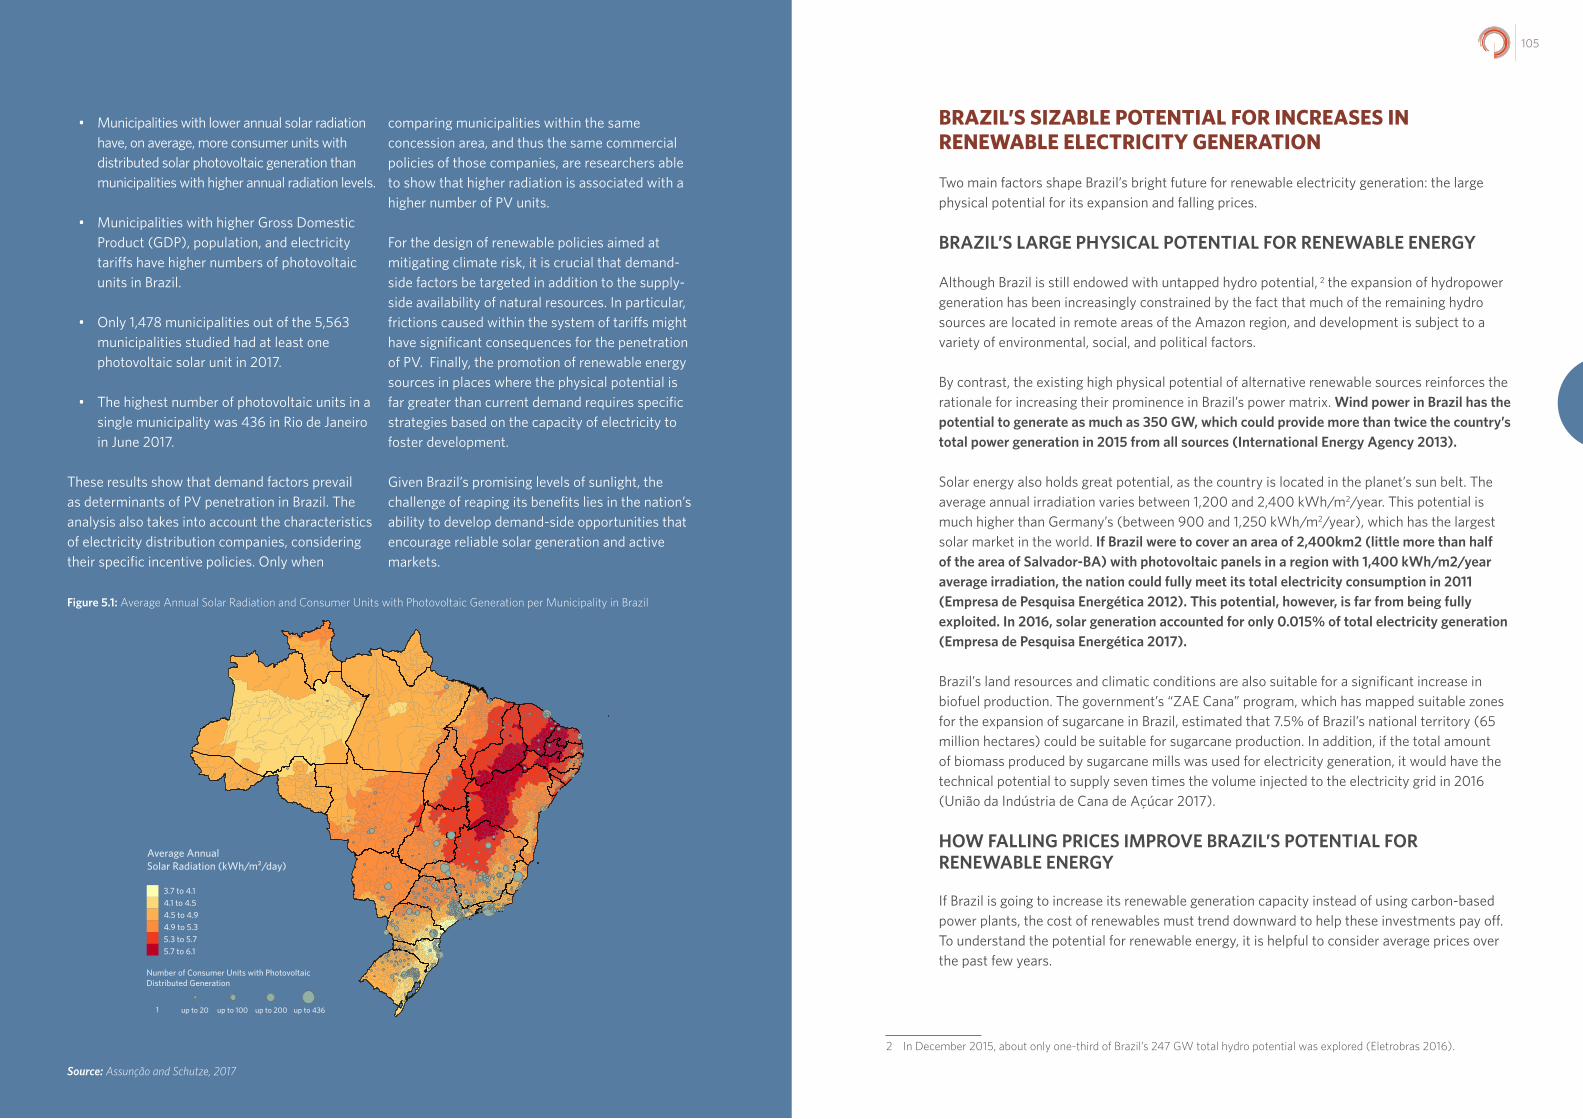
105104
BRAZIL’S SIZABLE POTENTIAL FOR INCREASES IN RENEWABLE ELECTRICITY GENERATION
Two main factors shape Brazil’s bright future for renewable electricity generation: the large physical potential for its expansion and falling prices.
BRAZIL’S LARGE PHYSICAL POTENTIAL FOR RENEWABLE ENERGY
Although Brazil is still endowed with untapped hydro potential, 2 the expansion of hydropower generation has been increasingly constrained by the fact that much of the remaining hydro sources are located in remote areas of the Amazon region, and development is subject to a variety of environmental, social, and political factors.
By contrast, the existing high physical potential of alternative renewable sources reinforces the rationale for increasing their prominence in Brazil’s power matrix. Wind power in Brazil has the potential to generate as much as 350 GW, which could provide more than twice the country’s total power generation in 2015 from all sources (International Energy Agency 2013).
Solar energy also holds great potential, as the country is located in the planet’s sun belt. The average annual irradiation varies between 1,200 and 2,400 kWh/m2/year. This potential is much higher than Germany’s (between 900 and 1,250 kWh/m2/year), which has the largest solar market in the world. If Brazil were to cover an area of 2,400km2 (little more than half of the area of Salvador-BA) with photovoltaic panels in a region with 1,400 kWh/m2/year average irradiation, the nation could fully meet its total electricity consumption in 2011 (Empresa de Pesquisa Energética 2012). This potential, however, is far from being fully exploited. In 2016, solar generation accounted for only 0.015% of total electricity generation (Empresa de Pesquisa Energética 2017).
Brazil’s land resources and climatic conditions are also suitable for a significant increase in biofuel production. The government’s “ZAE Cana” program, which has mapped suitable zones for the expansion of sugarcane in Brazil, estimated that 7.5% of Brazil’s national territory (65 million hectares) could be suitable for sugarcane production. In addition, if the total amount of biomass produced by sugarcane mills was used for electricity generation, it would have the technical potential to supply seven times the volume injected to the electricity grid in 2016 (União da Indústria de Cana de Açúcar 2017).
HOW FALLING PRICES IMPROVE BRAZIL’S POTENTIAL FOR RENEWABLE ENERGY
If Brazil is going to increase its renewable generation capacity instead of using carbon-based power plants, the cost of renewables must trend downward to help these investments pay off. To understand the potential for renewable energy, it is helpful to consider average prices over the past few years.
2 In December 2015, about only one-third of Brazil’s 247 GW total hydro potential was explored (Eletrobras 2016).
• Municipalities with lower annual solar radiation have, on average, more consumer units with distributed solar photovoltaic generation than municipalities with higher annual radiation levels.
• Municipalities with higher Gross Domestic Product (GDP), population, and electricity tariffs have higher numbers of photovoltaic units in Brazil.
• Only 1,478 municipalities out of the 5,563 municipalities studied had at least one photovoltaic solar unit in 2017.
• The highest number of photovoltaic units in a single municipality was 436 in Rio de Janeiro in June 2017.
These results show that demand factors prevail as determinants of PV penetration in Brazil. The analysis also takes into account the characteristics of electricity distribution companies, considering their specific incentive policies. Only when
comparing municipalities within the same concession area, and thus the same commercial policies of those companies, are researchers able to show that higher radiation is associated with a higher number of PV units.
For the design of renewable policies aimed at mitigating climate risk, it is crucial that demand-side factors be targeted in addition to the supply-side availability of natural resources. In particular, frictions caused within the system of tariffs might have significant consequences for the penetration of PV. Finally, the promotion of renewable energy sources in places where the physical potential is far greater than current demand requires specific strategies based on the capacity of electricity to foster development.
Given Brazil’s promising levels of sunlight, the challenge of reaping its benefits lies in the nation’s ability to develop demand-side opportunities that encourage reliable solar generation and active markets.
Figure 5.1: Average Annual Solar Radiation and Consumer Units with Photovoltaic Generation per Municipality in Brazil
Source: Assunção and Schutze, 2017
Average Annual Solar Radiation (kWh/m2/day)
Number of Consumer Units with Photovoltaic Distributed Generation
1 up to 20 up to 100 up to 200 up to 436
3.7 to 4.14.1 to 4.54.5 to 4.94.9 to 5.35.3 to 5.75.7 to 6.1
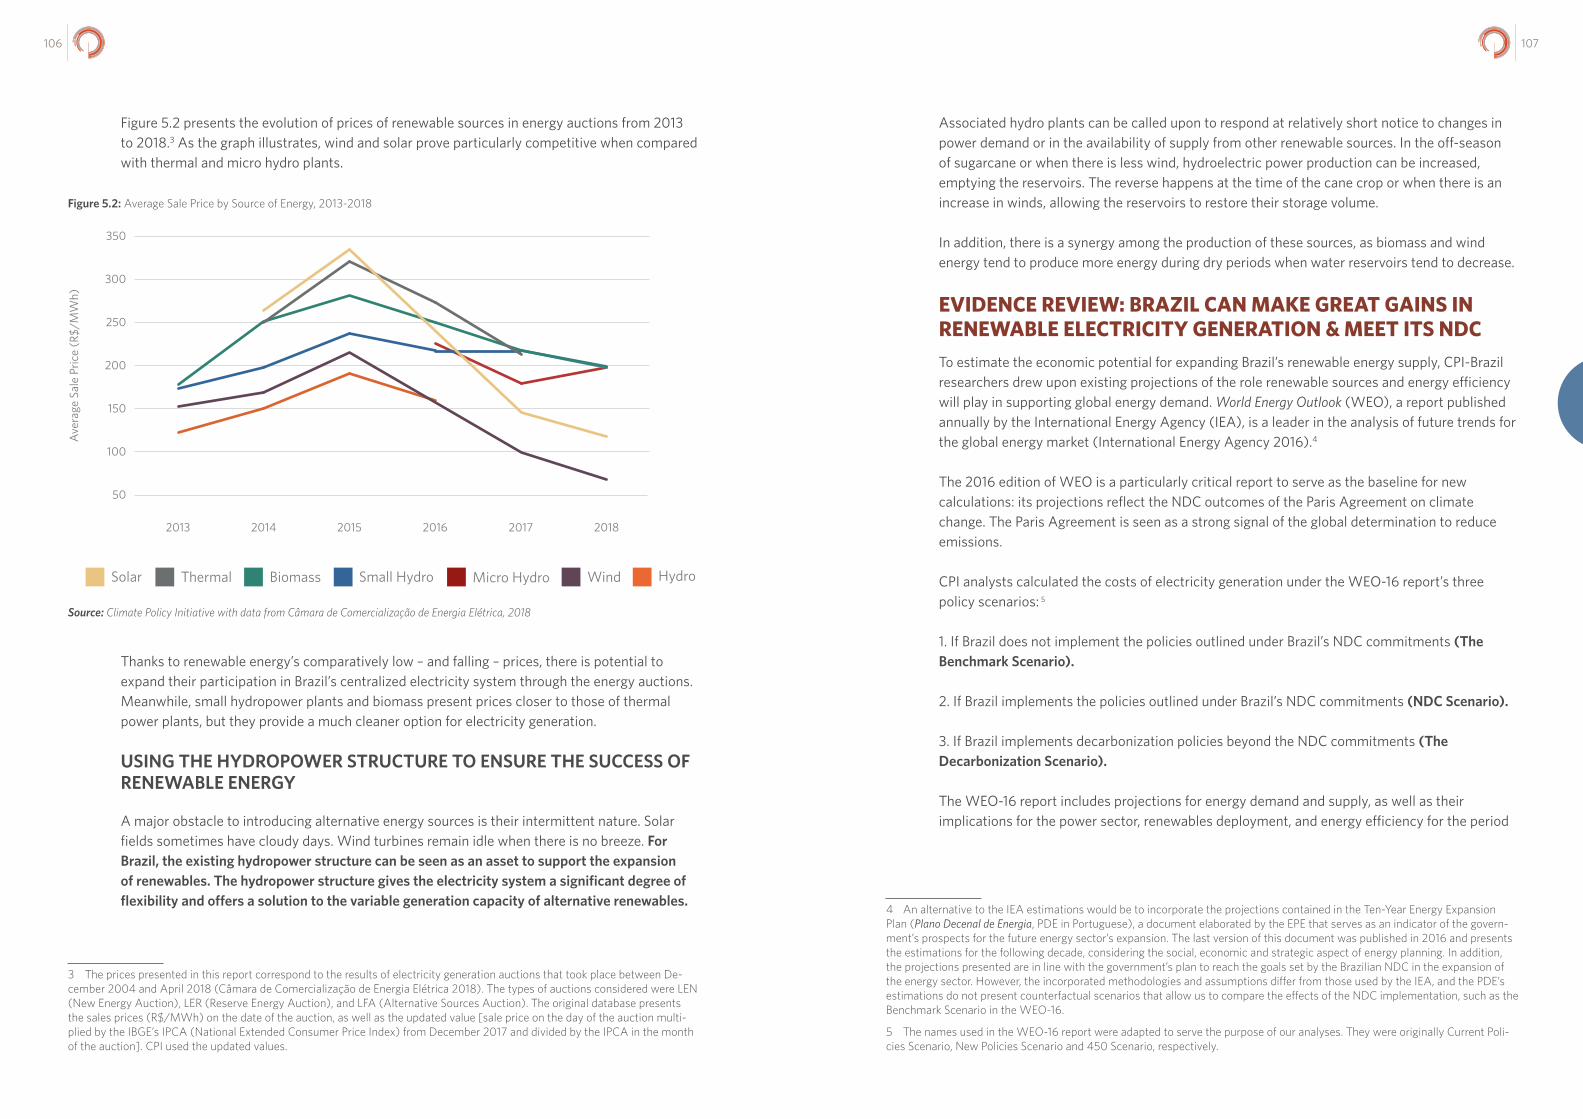
107106
Figure 5.2 presents the evolution of prices of renewable sources in energy auctions from 2013 to 2018.3 As the graph illustrates, wind and solar prove particularly competitive when compared with thermal and micro hydro plants.
Figure 5.2: Average Sale Price by Source of Energy, 2013-2018
Source: Climate Policy Initiative with data from Câmara de Comercialização de Energia Elétrica, 2018
Thanks to renewable energy’s comparatively low – and falling – prices, there is potential to expand their participation in Brazil’s centralized electricity system through the energy auctions. Meanwhile, small hydropower plants and biomass present prices closer to those of thermal power plants, but they provide a much cleaner option for electricity generation.
USING THE HYDROPOWER STRUCTURE TO ENSURE THE SUCCESS OF RENEWABLE ENERGY
A major obstacle to introducing alternative energy sources is their intermittent nature. Solar fields sometimes have cloudy days. Wind turbines remain idle when there is no breeze. For Brazil, the existing hydropower structure can be seen as an asset to support the expansion of renewables. The hydropower structure gives the electricity system a significant degree of flexibility and offers a solution to the variable generation capacity of alternative renewables.
3 The prices presented in this report correspond to the results of electricity generation auctions that took place between De-cember 2004 and April 2018 (Câmara de Comercialização de Energia Elétrica 2018). The types of auctions considered were LEN (New Energy Auction), LER (Reserve Energy Auction), and LFA (Alternative Sources Auction). The original database presents the sales prices (R$/MWh) on the date of the auction, as well as the updated value [sale price on the day of the auction multi-plied by the IBGE’s IPCA (National Extended Consumer Price Index) from December 2017 and divided by the IPCA in the month of the auction]. CPI used the updated values.
Associated hydro plants can be called upon to respond at relatively short notice to changes in power demand or in the availability of supply from other renewable sources. In the off-season of sugarcane or when there is less wind, hydroelectric power production can be increased, emptying the reservoirs. The reverse happens at the time of the cane crop or when there is an increase in winds, allowing the reservoirs to restore their storage volume.
In addition, there is a synergy among the production of these sources, as biomass and wind energy tend to produce more energy during dry periods when water reservoirs tend to decrease.
EVIDENCE REVIEW: BRAZIL CAN MAKE GREAT GAINS IN RENEWABLE ELECTRICITY GENERATION & MEET ITS NDC To estimate the economic potential for expanding Brazil’s renewable energy supply, CPI-Brazil researchers drew upon existing projections of the role renewable sources and energy efficiency will play in supporting global energy demand. World Energy Outlook (WEO), a report published annually by the International Energy Agency (IEA), is a leader in the analysis of future trends for the global energy market (International Energy Agency 2016).4
The 2016 edition of WEO is a particularly critical report to serve as the baseline for new calculations: its projections reflect the NDC outcomes of the Paris Agreement on climate change. The Paris Agreement is seen as a strong signal of the global determination to reduce emissions.
CPI analysts calculated the costs of electricity generation under the WEO-16 report’s three policy scenarios: 5
1. If Brazil does not implement the policies outlined under Brazil’s NDC commitments (The Benchmark Scenario).
2. If Brazil implements the policies outlined under Brazil’s NDC commitments (NDC Scenario).
3. If Brazil implements decarbonization policies beyond the NDC commitments (The Decarbonization Scenario).
The WEO-16 report includes projections for energy demand and supply, as well as their implications for the power sector, renewables deployment, and energy efficiency for the period
4 An alternative to the IEA estimations would be to incorporate the projections contained in the Ten-Year Energy Expansion Plan (Plano Decenal de Energia, PDE in Portuguese), a document elaborated by the EPE that serves as an indicator of the govern-ment’s prospects for the future energy sector’s expansion. The last version of this document was published in 2016 and presents the estimations for the following decade, considering the social, economic and strategic aspect of energy planning. In addition, the projections presented are in line with the government’s plan to reach the goals set by the Brazilian NDC in the expansion of the energy sector. However, the incorporated methodologies and assumptions differ from those used by the IEA, and the PDE’s estimations do not present counterfactual scenarios that allow us to compare the effects of the NDC implementation, such as the Benchmark Scenario in the WEO-16.
5 The names used in the WEO-16 report were adapted to serve the purpose of our analyses. They were originally Current Poli-cies Scenario, New Policies Scenario and 450 Scenario, respectively.
Ave
rage
Sal
e Pr
ice
(R$/
MW
h)
50
2013 2014 2015 2016 2017 2018
100
150
200
250
300
350
Solar Thermal Biomass Small Hydro Micro Hydro Wind Hydro
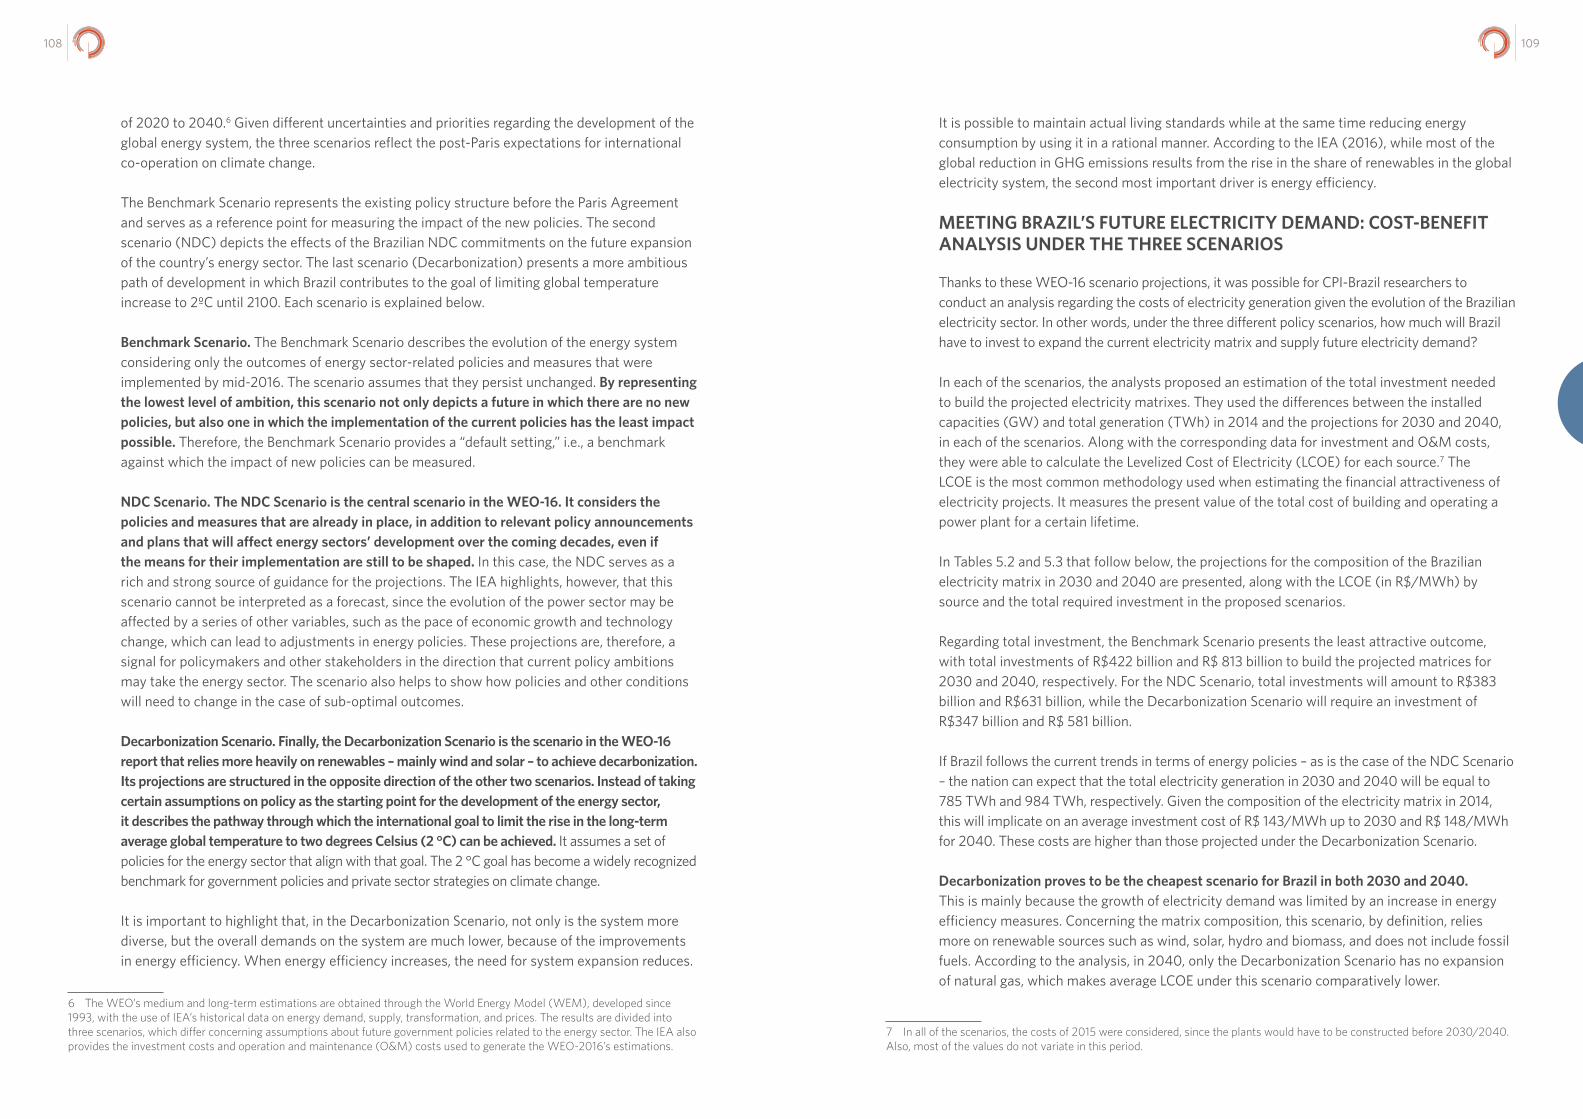
109108
of 2020 to 2040.6 Given different uncertainties and priorities regarding the development of the global energy system, the three scenarios reflect the post-Paris expectations for international co-operation on climate change.
The Benchmark Scenario represents the existing policy structure before the Paris Agreement and serves as a reference point for measuring the impact of the new policies. The second scenario (NDC) depicts the effects of the Brazilian NDC commitments on the future expansion of the country’s energy sector. The last scenario (Decarbonization) presents a more ambitious path of development in which Brazil contributes to the goal of limiting global temperature increase to 2ºC until 2100. Each scenario is explained below.
Benchmark Scenario. The Benchmark Scenario describes the evolution of the energy system considering only the outcomes of energy sector-related policies and measures that were implemented by mid-2016. The scenario assumes that they persist unchanged. By representing the lowest level of ambition, this scenario not only depicts a future in which there are no new policies, but also one in which the implementation of the current policies has the least impact possible. Therefore, the Benchmark Scenario provides a “default setting,” i.e., a benchmark against which the impact of new policies can be measured.
NDC Scenario. The NDC Scenario is the central scenario in the WEO-16. It considers the policies and measures that are already in place, in addition to relevant policy announcements and plans that will affect energy sectors’ development over the coming decades, even if the means for their implementation are still to be shaped. In this case, the NDC serves as a rich and strong source of guidance for the projections. The IEA highlights, however, that this scenario cannot be interpreted as a forecast, since the evolution of the power sector may be affected by a series of other variables, such as the pace of economic growth and technology change, which can lead to adjustments in energy policies. These projections are, therefore, a signal for policymakers and other stakeholders in the direction that current policy ambitions may take the energy sector. The scenario also helps to show how policies and other conditions will need to change in the case of sub-optimal outcomes.
Decarbonization Scenario. Finally, the Decarbonization Scenario is the scenario in the WEO-16 report that relies more heavily on renewables – mainly wind and solar – to achieve decarbonization. Its projections are structured in the opposite direction of the other two scenarios. Instead of taking certain assumptions on policy as the starting point for the development of the energy sector, it describes the pathway through which the international goal to limit the rise in the long-term average global temperature to two degrees Celsius (2 °C) can be achieved. It assumes a set of policies for the energy sector that align with that goal. The 2 °C goal has become a widely recognized benchmark for government policies and private sector strategies on climate change.
It is important to highlight that, in the Decarbonization Scenario, not only is the system more diverse, but the overall demands on the system are much lower, because of the improvements in energy efficiency. When energy efficiency increases, the need for system expansion reduces.
6 The WEO’s medium and long-term estimations are obtained through the World Energy Model (WEM), developed since 1993, with the use of IEA’s historical data on energy demand, supply, transformation, and prices. The results are divided into three scenarios, which differ concerning assumptions about future government policies related to the energy sector. The IEA also provides the investment costs and operation and maintenance (O&M) costs used to generate the WEO-2016’s estimations.
It is possible to maintain actual living standards while at the same time reducing energy consumption by using it in a rational manner. According to the IEA (2016), while most of the global reduction in GHG emissions results from the rise in the share of renewables in the global electricity system, the second most important driver is energy efficiency.
MEETING BRAZIL’S FUTURE ELECTRICITY DEMAND: COST-BENEFIT ANALYSIS UNDER THE THREE SCENARIOS
Thanks to these WEO-16 scenario projections, it was possible for CPI-Brazil researchers to conduct an analysis regarding the costs of electricity generation given the evolution of the Brazilian electricity sector. In other words, under the three different policy scenarios, how much will Brazil have to invest to expand the current electricity matrix and supply future electricity demand?
In each of the scenarios, the analysts proposed an estimation of the total investment needed to build the projected electricity matrixes. They used the differences between the installed capacities (GW) and total generation (TWh) in 2014 and the projections for 2030 and 2040, in each of the scenarios. Along with the corresponding data for investment and O&M costs, they were able to calculate the Levelized Cost of Electricity (LCOE) for each source.7 The LCOE is the most common methodology used when estimating the financial attractiveness of electricity projects. It measures the present value of the total cost of building and operating a power plant for a certain lifetime.
In Tables 5.2 and 5.3 that follow below, the projections for the composition of the Brazilian electricity matrix in 2030 and 2040 are presented, along with the LCOE (in R$/MWh) by source and the total required investment in the proposed scenarios.
Regarding total investment, the Benchmark Scenario presents the least attractive outcome, with total investments of R$422 billion and R$ 813 billion to build the projected matrices for 2030 and 2040, respectively. For the NDC Scenario, total investments will amount to R$383 billion and R$631 billion, while the Decarbonization Scenario will require an investment of R$347 billion and R$ 581 billion.
If Brazil follows the current trends in terms of energy policies – as is the case of the NDC Scenario – the nation can expect that the total electricity generation in 2030 and 2040 will be equal to 785 TWh and 984 TWh, respectively. Given the composition of the electricity matrix in 2014, this will implicate on an average investment cost of R$ 143/MWh up to 2030 and R$ 148/MWh for 2040. These costs are higher than those projected under the Decarbonization Scenario.
Decarbonization proves to be the cheapest scenario for Brazil in both 2030 and 2040. This is mainly because the growth of electricity demand was limited by an increase in energy efficiency measures. Concerning the matrix composition, this scenario, by definition, relies more on renewable sources such as wind, solar, hydro and biomass, and does not include fossil fuels. According to the analysis, in 2040, only the Decarbonization Scenario has no expansion of natural gas, which makes average LCOE under this scenario comparatively lower.
7 In all of the scenarios, the costs of 2015 were considered, since the plants would have to be constructed before 2030/2040. Also, most of the values do not variate in this period.
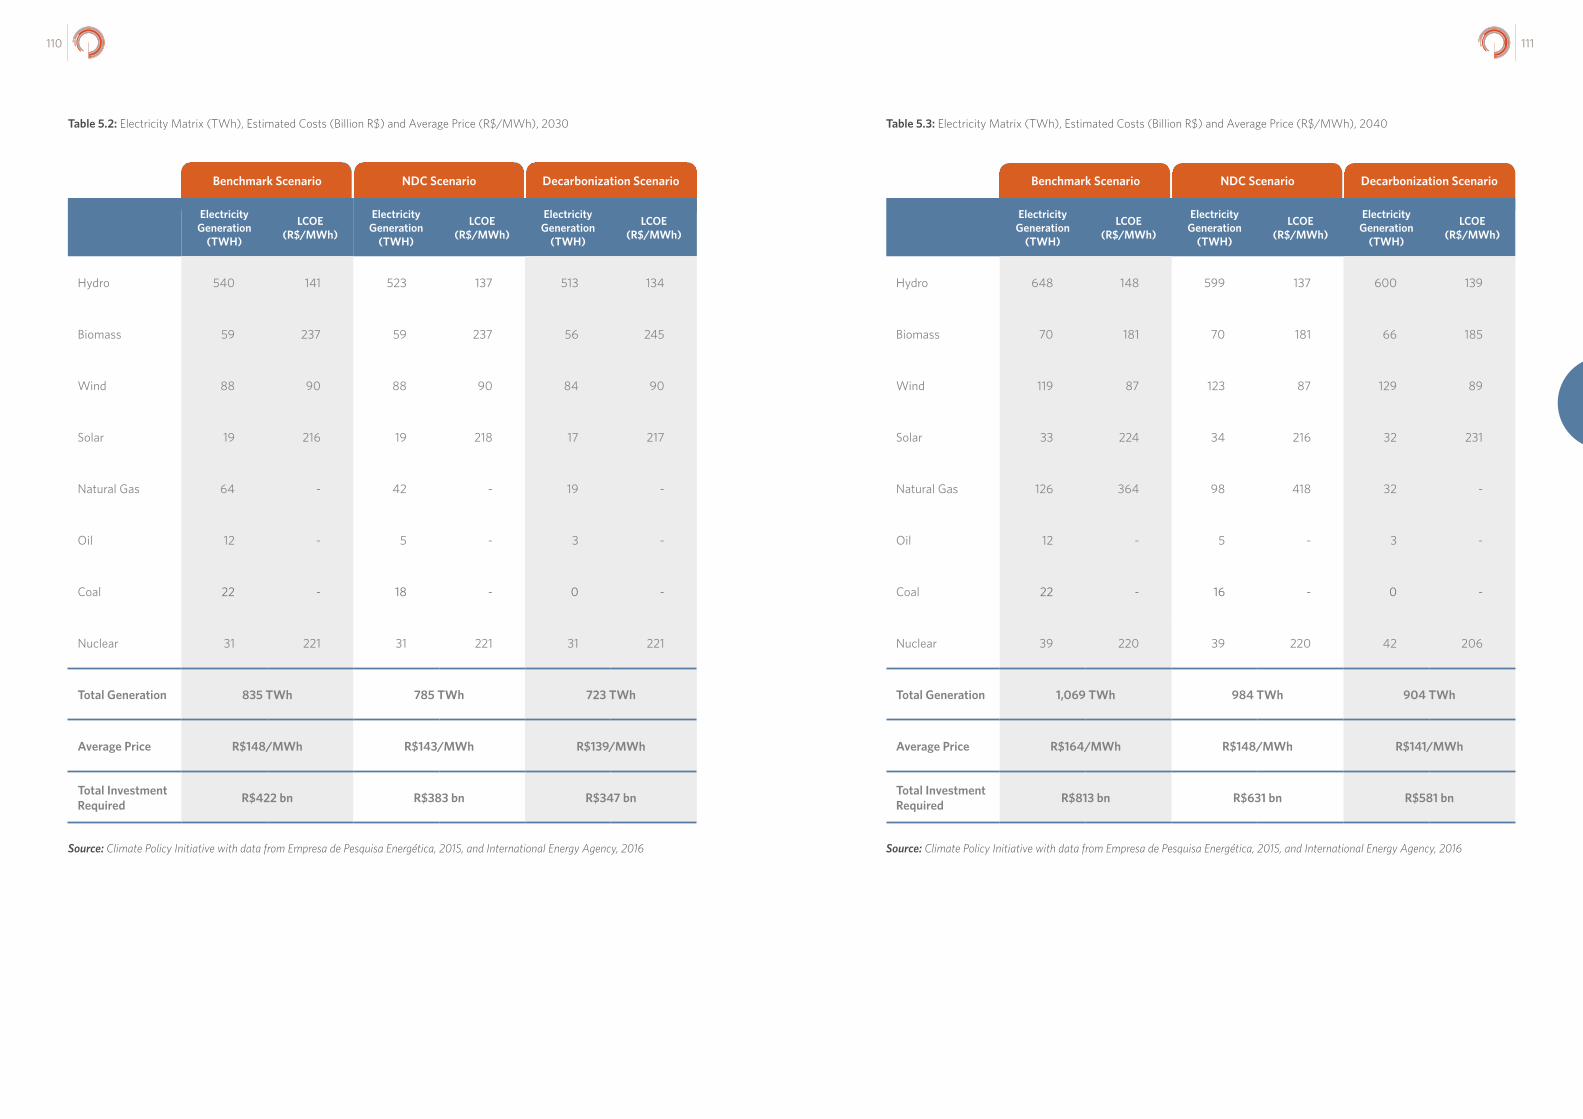
111110
Source: Climate Policy Initiative with data from Empresa de Pesquisa Energética, 2015, and International Energy Agency, 2016 Source: Climate Policy Initiative with data from Empresa de Pesquisa Energética, 2015, and International Energy Agency, 2016
Benchmark Scenario NDC Scenario Decarbonization Scenario
Electricity Generation
(TWH)
LCOE (R$/MWh)
Electricity Generation
(TWH)
LCOE (R$/MWh)
Electricity Generation
(TWH)
LCOE (R$/MWh)
Hydro 540 141 523 137 513 134
Biomass 59 237 59 237 56 245
Wind 88 90 88 90 84 90
Solar 19 216 19 218 17 217
Natural Gas 64 - 42 - 19 -
Oil 12 - 5 - 3 -
Coal 22 - 18 - 0 -
Nuclear 31 221 31 221 31 221
Total Generation 835 TWh 785 TWh 723 TWh
Average Price R$148/MWh R$143/MWh R$139/MWh
Total Investment Required R$422 bn R$383 bn R$347 bn
Table 5.2: Electricity Matrix (TWh), Estimated Costs (Billion R$) and Average Price (R$/MWh), 2030 Table 5.3: Electricity Matrix (TWh), Estimated Costs (Billion R$) and Average Price (R$/MWh), 2040
Benchmark Scenario NDC Scenario Decarbonization Scenario
Electricity Generation
(TWH)
LCOE (R$/MWh)
Electricity Generation
(TWH)
LCOE (R$/MWh)
Electricity Generation
(TWH)
LCOE (R$/MWh)
Hydro 648 148 599 137 600 139
Biomass 70 181 70 181 66 185
Wind 119 87 123 87 129 89
Solar 33 224 34 216 32 231
Natural Gas 126 364 98 418 32 -
Oil 12 - 5 - 3 -
Coal 22 - 16 - 0 -
Nuclear 39 220 39 220 42 206
Total Generation 1,069 TWh 984 TWh 904 TWh
Average Price R$164/MWh R$148/MWh R$141/MWh
Total Investment Required R$813 bn R$631 bn R$581 bn
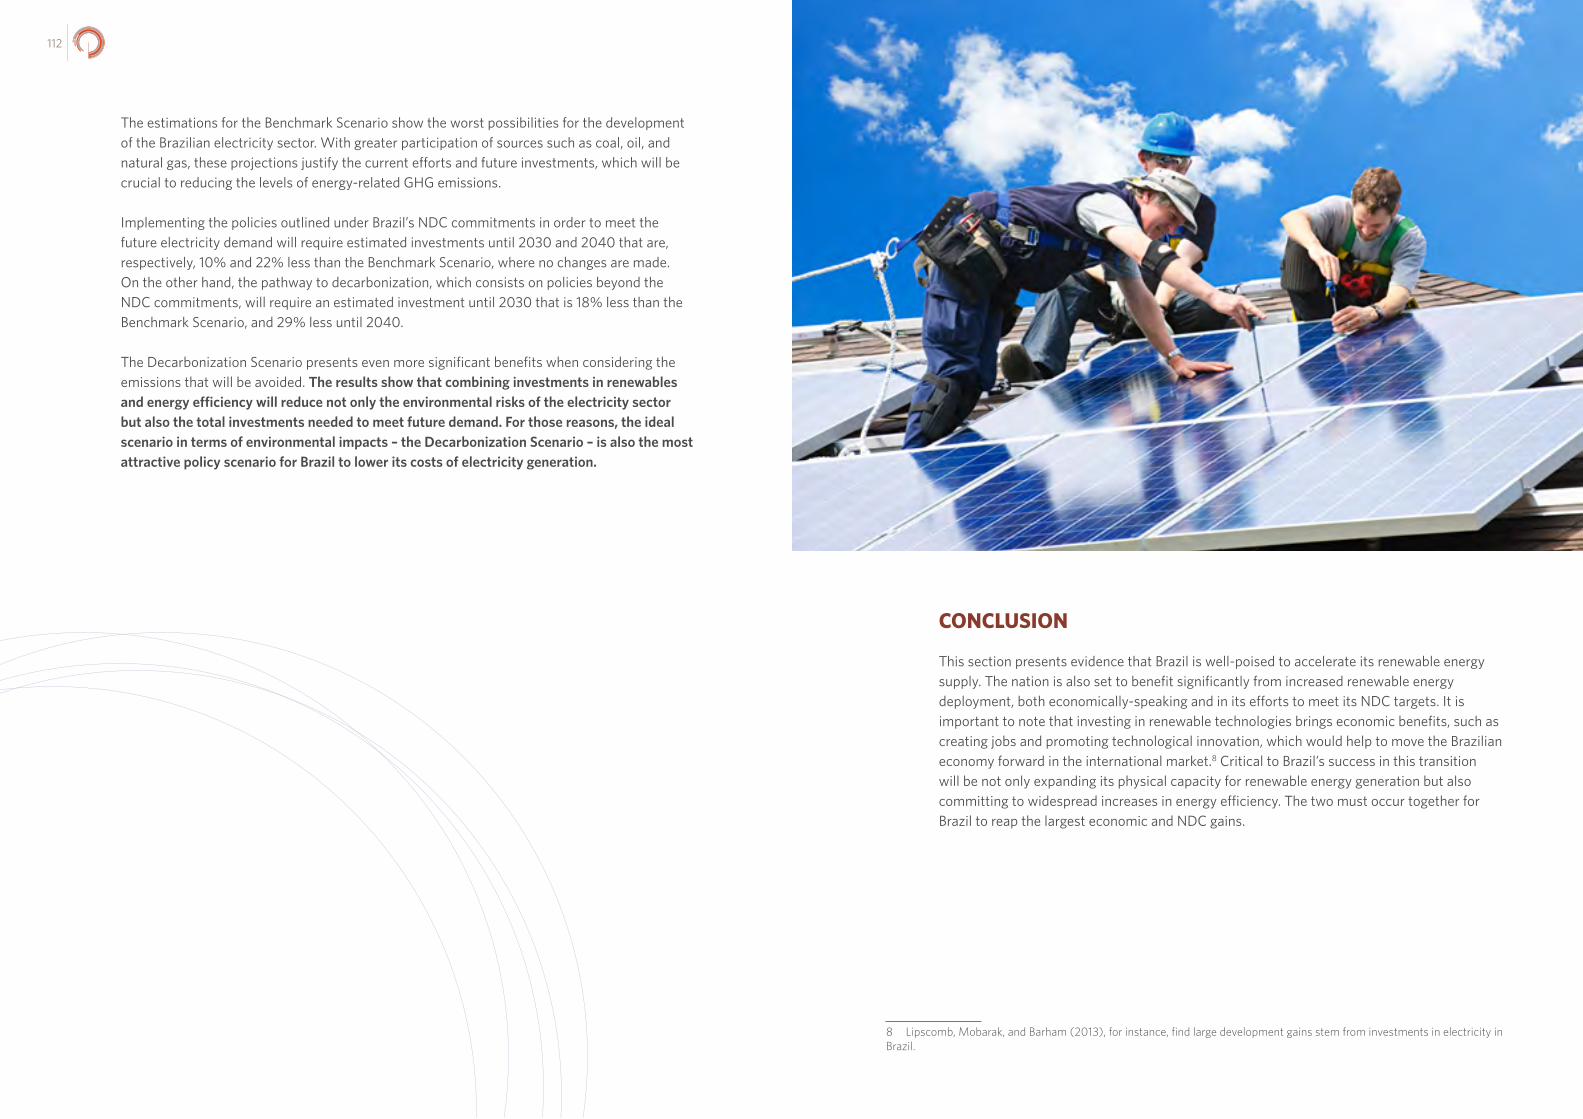
113112
The estimations for the Benchmark Scenario show the worst possibilities for the development of the Brazilian electricity sector. With greater participation of sources such as coal, oil, and natural gas, these projections justify the current efforts and future investments, which will be crucial to reducing the levels of energy-related GHG emissions.
Implementing the policies outlined under Brazil’s NDC commitments in order to meet the future electricity demand will require estimated investments until 2030 and 2040 that are, respectively, 10% and 22% less than the Benchmark Scenario, where no changes are made. On the other hand, the pathway to decarbonization, which consists on policies beyond the NDC commitments, will require an estimated investment until 2030 that is 18% less than the Benchmark Scenario, and 29% less until 2040.
The Decarbonization Scenario presents even more significant benefits when considering the emissions that will be avoided. The results show that combining investments in renewables and energy efficiency will reduce not only the environmental risks of the electricity sector but also the total investments needed to meet future demand. For those reasons, the ideal scenario in terms of environmental impacts – the Decarbonization Scenario – is also the most attractive policy scenario for Brazil to lower its costs of electricity generation.
CONCLUSION
This section presents evidence that Brazil is well-poised to accelerate its renewable energy supply. The nation is also set to benefit significantly from increased renewable energy deployment, both economically-speaking and in its efforts to meet its NDC targets. It is important to note that investing in renewable technologies brings economic benefits, such as creating jobs and promoting technological innovation, which would help to move the Brazilian economy forward in the international market.8 Critical to Brazil’s success in this transition will be not only expanding its physical capacity for renewable energy generation but also committing to widespread increases in energy efficiency. The two must occur together for Brazil to reap the largest economic and NDC gains.
8 Lipscomb, Mobarak, and Barham (2013), for instance, find large development gains stem from investments in electricity in Brazil.
115114
REFERENCES
Agência Nacional de Energia Elétrica. Banco de informações de geração. [Accessed 14 May 2018]. http://www2.aneel.gov.br/aplicacoes/capacidadebrasil/capacidadebrasil.cfm.
Agência Nacional de Energia Elétrica. Informações técnicas. Geração distribuída. Unidades consumidoras com geração distribuída. Resumo por tipo de geração. [Accessed 14 May 2018]. http://www2.aneel.gov.br/scg/gd/GD_Fonte.asp
Assunção J, Schutze A. 2017. Developing Brazil’s market for distributed solar generation. Climate Policy Initiative. [Accessed 18 April 2018]. https://climatepolicyinitiative.org/wp-content/uploads/2017/10/Working_Paper_-_Distributed_Solar_Photovoltaic_Generation_in_Brazil.pdf.
Câmara de Comercialização de Energia Elétrica. 2018. Biblioteca Virtual. Resultados consolidados –janeiro 2018 combined with results from Leilão A-4. [Accessed 10 April 2018]. https://goo.gl/GKFLB5
Eletrobrás. 2016. Sistema de informações do potencial hidrelétrico brasileiro. Mapa Sipot – dezembro 2015. [Accessed 7 March 2017]. http://eletrobras.com/pt/AreasdeAtuacao/geracao/sipot/Mapa%20Sipot%202016_novo27.pdf
Empresa de Pesquisa Energética. 2012. Nota Técnica EPE - Análise da inserção da geração solar na matriz elétrica brasileira. Rio de Janeiro: EPE. [Accessed 18 April 2018]. http://www.provedor.nuca.ie.ufrj.br/eletrobras/estudos/epe27.pdf.
Empresa de Pesquisa Energética. 2014. Inserção da geração fotovoltaica distribuída no Brasil – condicionantes e impactos. Rio de Janeiro: EPE. [Accessed 18 April 2018]. http://www.ecovolts.net.br/downloads/DEA%2019.pdf
Empresa de Pesquisa Energética. 2015. Balanço energético nacional 2015 – ano base 2014. Rio de Janeiro: EPE. [Accessed 9 February 2018]. https://ben.epe.gov.br/downloads/Relatorio_Final_BEN_2015.pdf
Empresa de Pesquisa Energética. 2017. Balanço energético nacional 2017 – ano base 2016. Rio de Janeiro: EPE. [Accessed 9 February 2018]. https://ben.epe.gov.br/downloads/Relatorio_Final_BEN_2016.pdf
International Energy Agency. 2013. World Energy Outlook 2013. Paris: OECD/IEA. [Accessed 23 February 2018]. https://webstore.iea.org/world-energy-outlook-2013.
International Energy Agency. 2016. World Energy Outlook 2016. Paris: OECD/IEA.
International Panel on Climate Change. 2014. Climate change 2014: synthesis report. Contribution of working groups I, II and III to the fifth assessment report of the Intergovernmental Panel on Climate Change [Core Writing Team, R.K. Pachauri and L.A. Meyer
(eds.)]. Geneva: IPCC. [Accessed 11 August 2017]. http://epic.awi.de/37530/1/IPCC_AR5_SYR_Final.pdf.
Lipscomb M, Mobararak AM, Barham T. 2013. Development effects of electrification: evidence from the topographic placement of hydropower plants in Brazil. American Economic Journal: Applied Economics. 5(2):200-231. [Accessed 14 August 2017]. https://www.aeaweb.org/articles?id=10.1257/app.5.2.200.
Ministério de Minas e Energia. Empresa de Pesquisa Energética. 2017. Plano decenal de expansão de energia 2026. Brasília: MME/EPE. [Accessed 30 May 2018]. http://www.mme.gov.br/documents/10584/0/PDE2026.pdf/474c63d5-a6ae-451c-8155-ce2938fbf896.
Sistema de Estimativas de Emissões e Remoções de Gases de Efeito Estufa. 2017. Base de dados: emissões totais. [Accessed 19 January 2018]. http://plataforma.seeg.eco.br/total_emission.
Tolmasquim MT. 2016. Energia termelétrica: gás natural, biomassa, carvão, nuclear. Rio de Janeiro: EPE. [Accessed 15 March 2018]. http://www.epe.gov.br/sites-pt/publicacoes-dados-abertos/publicacoes/PublicacoesArquivos/publicacao-173/Energia Termelétrica - Online 13maio2016.pdf.
União da Indústria de Cana de Açúcar. 2017. BOLETIM/UNICA: A bioeletricidade da cana em números – dezembro de 2017. São Paulo: UNICA.

117116
APPENDIX
The estimations for the future of the Brazilian electricity matrix in each scenario, elaborated in the WEO-2016 (International Energy Agency 2016), are presented below. Table 5.4 presents the installed capacity and Table 5.5 presents the electricity generation for Brazil under each scenario.
Table 5.4: Brazil Installed Capacity (GW) under Three Policy Scenarios
To determine the amount of electricity that would be generated under each scenario, the analysis considers the difference between the current value of electricity generation (corresponding to 2014) and the projected value. In other words, the additional generation (TWh) is calculated by source for each scenario. The year 2014 is used for comparison because it is the base year for all of the scenarios in the WEO-2016. The results are presented in Table 5.6.
Table 5.6: Additional Amount of Electricity Generation (TWh) in Brazil by Source and Scenario
Benchmark Scenario NDC Scenario Decarbonization Scenario
2030 2040 2030 2040 2030 2040
Hydro 128 156 123 140 120 141
Biomass 17 19 17 19 16 18
Wind 24 31 24 32 23 34
Solar 10 18 10 18 9 18
Natural Gas 23 33 19 27 17 18
Oil 7 7 7 7 7 7
Coal 5 4 4 4 0 0
Nuclear 4 5 4 5 4 5
Total (GW) 218 273 208 252 196 241
Source: International Energy Agency, 2016
Table 5.5: Brazil’s Electricity Generation (TWh) under Three Policy Scenarios
Benchmark Scenario NDC Scenario Decarbonization Scenario
2030 2040 2030 2040 2030 2040
Hydro 540 648 523 599 513 600
Biomass 59 70 59 70 56 66
Wind 88 119 88 123 84 129
Solar 19 33 19 34 17 32
Natural Gas 64 126 42 98 19 32
Oil 12 12 5 5 3 3
Coal 22 22 18 16 0 0
Nuclear 31 39 31 39 31 42
Total (TWh) 835 1,069 785 984 723 904
Source: International Energy Agency, 2016
Benchmark Scenario NDC Scenario Decarbonization Scenario
2030 2040 2030 2040 2030 2040
Hydro 167 275 150 226 140 227
Biomass 13 24 13 24 10 20
Wind 76 107 76 111 72 117
Solar 19 33 19 34 17 32
Natural Gas 0 45 0 17 0 0
Oil 0 0 0 0 0 0
Coal 0 0 0 0 0 0
Nuclear 16 24 16 24 16 27
Total (TWh) 290 507 272 435 254 422
Source: Climate Policy Initiative with data from Empresa de Pesquisa Energética, 2015, and International Energy Agency, 2016
In the analysis, the methodology of the Levelized Cost of Energy (LCOE) is used to estimate the necessary investment required to build the electricity matrices projected by the WEO-16, considering the installed capacities and the electricity generated. The LCOE measures the lifetime costs of a power plant divided by the electricity produced. It is obtained using the following formula:
where is the capital expenditure (CAPEX) for year t, Mt is the annual O&M cost (OPEX), Ft is the fuel expenditures, Et is the electricity generated annually, and r is the annual discount rate.
For the CAPEX and OPEX, the investments and O&M costs provided by the IEA are used, which are the same values used to generate the WEO-2016’s estimations (Table 5.7).
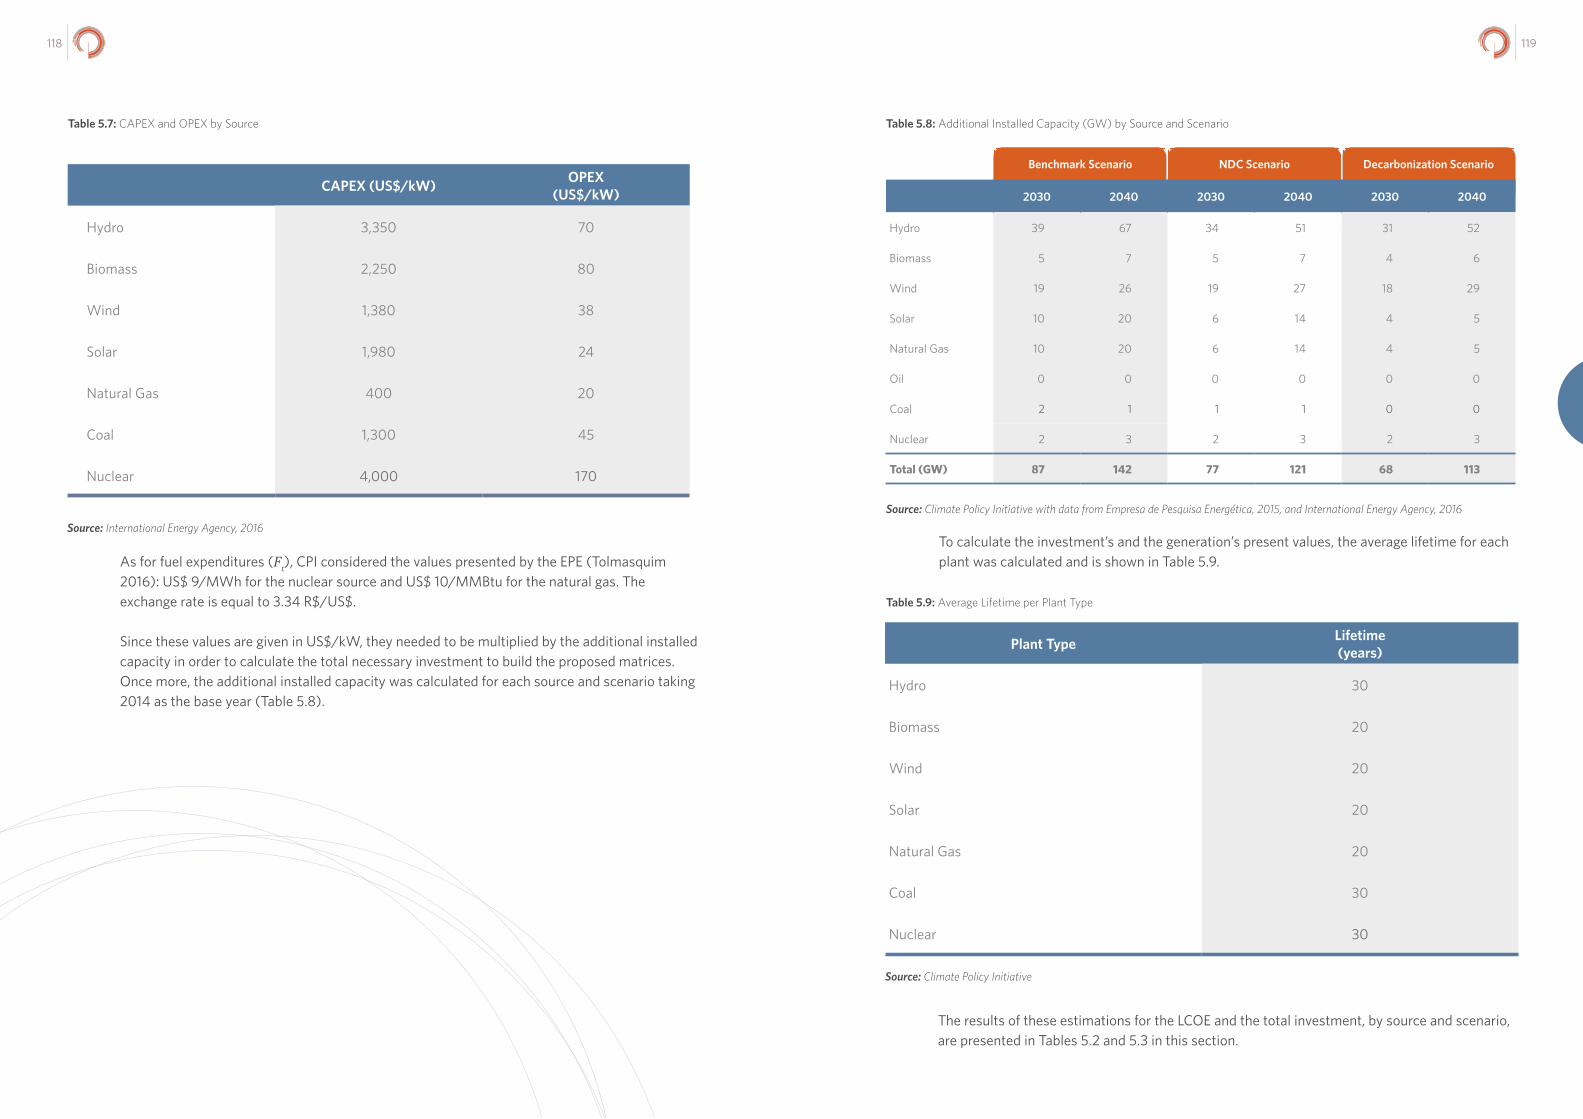
119118
Table 5.7: CAPEX and OPEX by Source Table 5.8: Additional Installed Capacity (GW) by Source and Scenario
CAPEX (US$/kW) OPEX (US$/kW)
Hydro 3,350 70
Biomass 2,250 80
Wind 1,380 38
Solar 1,980 24
Natural Gas 400 20
Coal 1,300 45
Nuclear 4,000 170
Source: International Energy Agency, 2016
As for fuel expenditures (Ft), CPI considered the values presented by the EPE (Tolmasquim 2016): US$ 9/MWh for the nuclear source and US$ 10/MMBtu for the natural gas. The exchange rate is equal to 3.34 R$/US$.
Since these values are given in US$/kW, they needed to be multiplied by the additional installed capacity in order to calculate the total necessary investment to build the proposed matrices. Once more, the additional installed capacity was calculated for each source and scenario taking 2014 as the base year (Table 5.8).
Benchmark Scenario NDC Scenario Decarbonization Scenario
2030 2040 2030 2040 2030 2040
Hydro 39 67 34 51 31 52
Biomass 5 7 5 7 4 6
Wind 19 26 19 27 18 29
Solar 10 20 6 14 4 5
Natural Gas 10 20 6 14 4 5
Oil 0 0 0 0 0 0
Coal 2 1 1 1 0 0
Nuclear 2 3 2 3 2 3
Total (GW) 87 142 77 121 68 113
Source: Climate Policy Initiative with data from Empresa de Pesquisa Energética, 2015, and International Energy Agency, 2016
To calculate the investment’s and the generation’s present values, the average lifetime for each plant was calculated and is shown in Table 5.9.
Table 5.9: Average Lifetime per Plant Type
Plant Type Lifetime (years)
Hydro 30
Biomass 20
Wind 20
Solar 20
Natural Gas 20
Coal 30
Nuclear 30
Source: Climate Policy Initiative
The results of these estimations for the LCOE and the total investment, by source and scenario, are presented in Tables 5.2 and 5.3 in this section.

121120
Renewable energy policies have been introduced only recently, starting with the Incentive Program to Alternative Sources (Proinfa) in 2002.
Brazil introduced energy efficiency programs and regulations as a response to external and internal crises. As a result, the policies were not well-planned or well-structured and lack long-term vision.
Unlike other countries, Brazil has focused its energy efficiency efforts and policies on residential use, rather than on industrial, which makes up the largest consumer of electricity in Brazil.
MAPPING THE POLICY AND INSTITUTIONAL LANDSCAPE OF RENEWABLE ENERGY AND ENERGY EFFICIENCY IN BRAZIL
E N E R G YP O L I C Y A N A LY S I S
TAKEAWAYS
15
16
17
06.

123122
INTRODUCTION: BRAZIL’S ENERGY EFFICIENCY AND RENEWABLE ENERGY POLICIES AND INSTITUTIONAL LANDSCAPE Since the mid-1990s, Brazil’s electricity sector has been through two institutional reforms. First, the sector transitioned from a state-owned model towards a competitive sector, which introduced many challenges. The sector then made remarkable progress and refined a model where state-controlled and private companies co-exist. Currently, a third reform is under consideration by the National Congress, which is the electric sector modernization bill. Implementing this reform could play a crucial role in meeting Brazil’s future expansion of energy demand in a sustainable way. Political factors, however, have been delaying its implementation.
Brazil has a great potential to increase the deployment of renewable energy, both in decentralized and centralized systems and to reap the economic and environmental benefits they provide.
Deployment of renewable energy in centralized systems has been achieved mainly through the Brazilian auction scheme, which includes technology-specific auctions (starting with the one held in 2007 for biomass and small hydro, and the one in 2009 for wind); alternative energy auctions (such as the ones for wind, small hydro, and biomass in 2007 and 2010); and technology-neutral auctions (which have been carried out regularly since 2005, although renewables have been participating since 2011). The auction system has promoted a significant increase in renewable contracted capacity and a drop in prices, particularly in the case of wind.
Recent regulations have encouraged expansion of renewable energy in decentralized systems by providing incentives to consumers. However, these transformations pose new challenges to the whole sector. The bill under evaluation by Congress introduces the binomial tariff for consumers with distributed generation, which can encourage distributors towards promoting the expansion of this source in the decentralized system.
Increasing energy efficiency is also a critical priority for Brazil for many reasons: it would increase industry competitiveness, reduce energy demand in the short-term, allow for better planning in new generation capacity, and it would reduce emissions of local and global pollutants. Despite the potential for energy efficiency, Brazil has been slow to improve it.
Brazil has a great potential to increase the deployment of renewable energy, both in decentralized and centralized systems and to reap the economic and environmental benefits they provide.
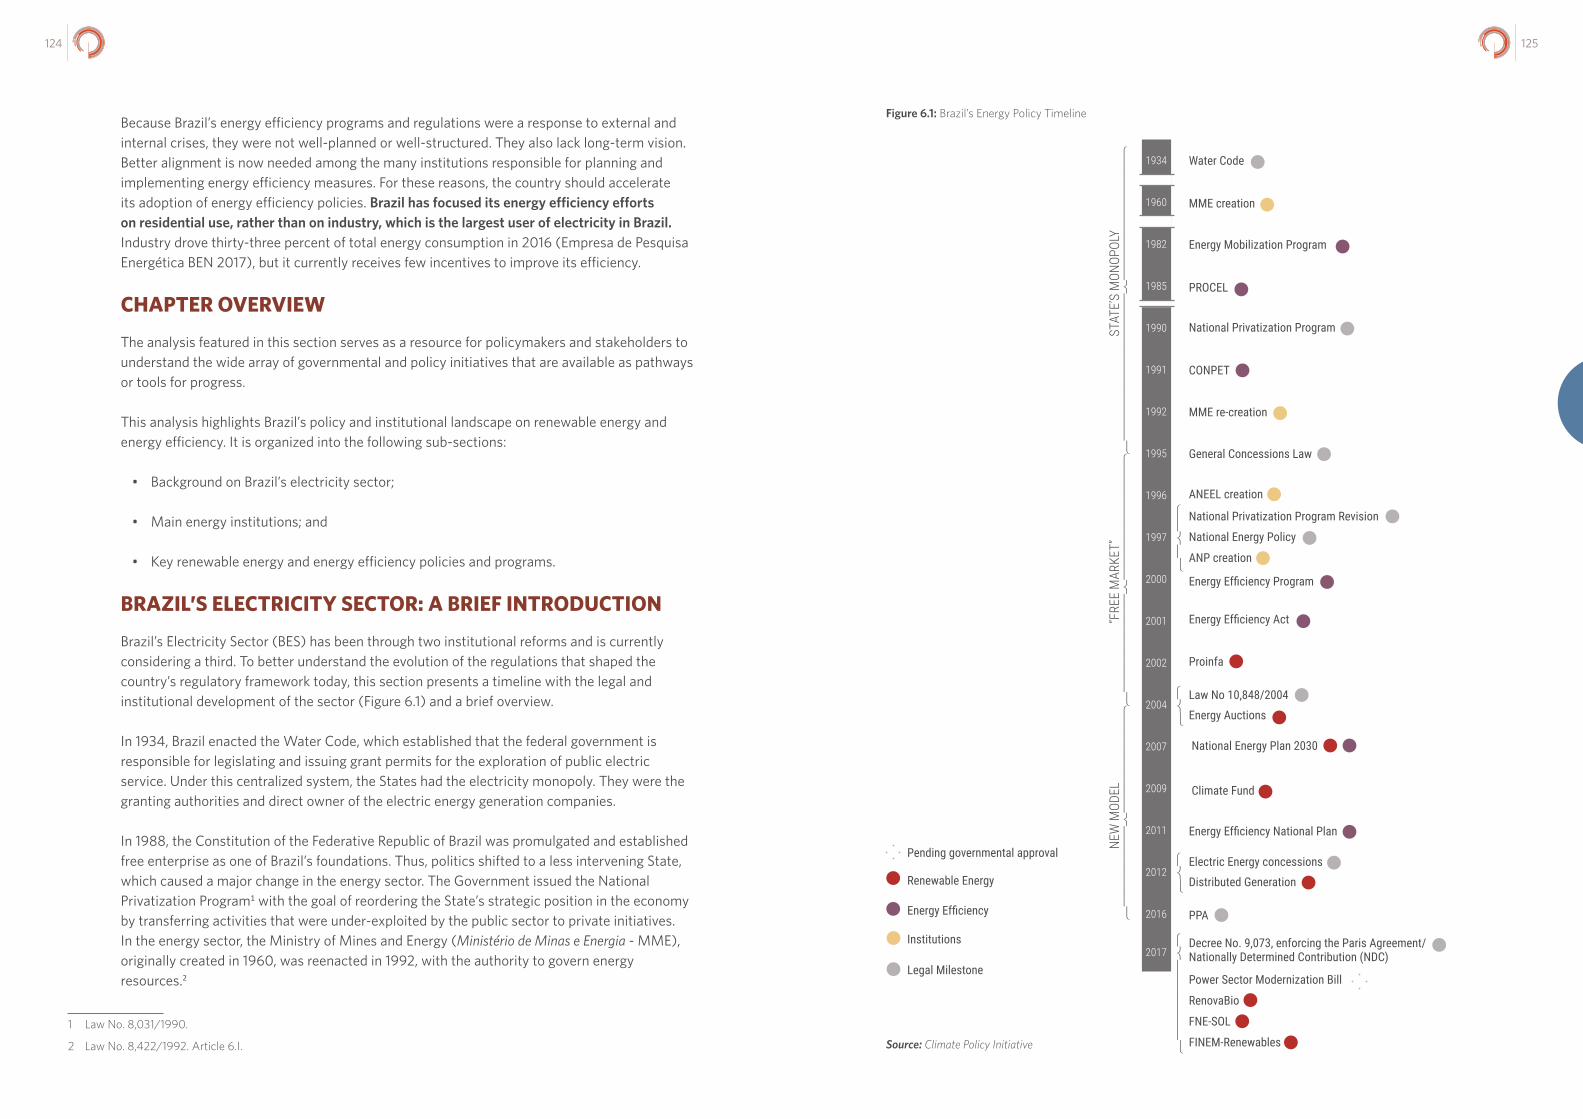
125124
Because Brazil’s energy efficiency programs and regulations were a response to external and internal crises, they were not well-planned or well-structured. They also lack long-term vision. Better alignment is now needed among the many institutions responsible for planning and implementing energy efficiency measures. For these reasons, the country should accelerate its adoption of energy efficiency policies. Brazil has focused its energy efficiency efforts on residential use, rather than on industry, which is the largest user of electricity in Brazil. Industry drove thirty-three percent of total energy consumption in 2016 (Empresa de Pesquisa Energética BEN 2017), but it currently receives few incentives to improve its efficiency.
CHAPTER OVERVIEW
The analysis featured in this section serves as a resource for policymakers and stakeholders to understand the wide array of governmental and policy initiatives that are available as pathways or tools for progress.
This analysis highlights Brazil’s policy and institutional landscape on renewable energy and energy efficiency. It is organized into the following sub-sections:
• Background on Brazil’s electricity sector;
• Main energy institutions; and
• Key renewable energy and energy efficiency policies and programs.
BRAZIL’S ELECTRICITY SECTOR: A BRIEF INTRODUCTION
Brazil’s Electricity Sector (BES) has been through two institutional reforms and is currently considering a third. To better understand the evolution of the regulations that shaped the country’s regulatory framework today, this section presents a timeline with the legal and institutional development of the sector (Figure 6.1) and a brief overview.
In 1934, Brazil enacted the Water Code, which established that the federal government is responsible for legislating and issuing grant permits for the exploration of public electric service. Under this centralized system, the States had the electricity monopoly. They were the granting authorities and direct owner of the electric energy generation companies.
In 1988, the Constitution of the Federative Republic of Brazil was promulgated and established free enterprise as one of Brazil’s foundations. Thus, politics shifted to a less intervening State, which caused a major change in the energy sector. The Government issued the National Privatization Program1 with the goal of reordering the State’s strategic position in the economy by transferring activities that were under-exploited by the public sector to private initiatives. In the energy sector, the Ministry of Mines and Energy (Ministério de Minas e Energia - MME), originally created in 1960, was reenacted in 1992, with the authority to govern energy resources.2
1 Law No. 8,031/1990.
2 Law No. 8,422/1992. Article 6.I.
Figure 6.1: Brazil’s Energy Policy Timeline
Source: Climate Policy Initiative
1934
1960
1982
1985
1990
1991
1992
1995
1996
1997
2000
2001
2002
2007
2009
2011
2004
2012
2016
2017
STAT
E’S
MON
OPOL
Y“F
REE
MAR
KET”
NEW
MOD
EL
Pending governmental approval
Water Code
MME creation
National Privatization Program
CONPET
Energy Mobilization Program
PROCEL
MME re-creation
General Concessions Law
ANEEL creation
National Privatization Program Revision
National Energy Policy
ANP creation
Climate Fund
PPA
National Energy Plan 2030
Energy Efficiency National Plan
Law No 10,848/2004
Energy Auctions
Energy Efficiency Program
Energy Efficiency Act
Proinfa
Electric Energy concessions
Distributed Generation
Decree No. 9,073, enforcing the Paris Agreement/ Nationally Determined Contribution (NDC)
Power Sector Modernization Bill
RenovaBio
FNE-SOL
FINEM-Renewables
Institutions
Renewable Energy
Energy Efficiency
Legal Milestone
127126
The Federal Constitution also specifies that: “it is incumbent upon the Government, as set forth by law, to provide public utility services, either directly or by concession or permission, which will always be through public bidding.” In 1995, the General Concessions Law3 was enacted to regulate this matter. Since energy is considered a public utility service, it is subjected to the concession or permission regime. In addition, to be granted a concession or permit, interested parties must participate in the public bidding, which in the energy sector occurs through auctions.
Also in 1995, the MME enacted the first power sector restructure. The main change was the de-verticalization of the generation, distribution, transmission, and commercialization sectors. The goal was to deregulate the generation and commercialization sectors to enable a more competitive market. The other goal was to maintain transmission and distribution as public services, given their nature as natural monopolies. In this new scenario, the Brazilian Electricity Regulatory Agency (Agência Nacional de Energia Elétrica - ANEEL) was created in 1996 with the power to regulate and monitor the activities concerning electric energy.4 ANEEL became responsible for regulating prices of companies responsible for transmission and distribution. Other institutions, such as the National System Operator (Operador Nacional do Sistema - ONS), responsible for managing the interconnected system, and the Petroleum, Natural Gas and Biofuel National Agency (Agência Nacional do Petróleo, Gás Natural e Biocombustíveis - ANP) were also created to give life to this new structure.
In 2001, the power sector suffered a serious supply crisis due to the lack of investments and a prolonged drought. The government implemented an electricity rationing plan and enacted the Energy Efficiency Act.5 Due to the system breakdown, in 2004 the Government issued the second power sector restructure – also known as New Model for Brazil’s Power Sector - that made fundamental changes in the electricity sector structure. The Energy Research Office (Empresa de Pesquisa Energética - EPE) was created with the responsibility to research energy matters and to develop the energy sector planning in the long term. The Power Sector Monitoring Committee (Comitê de Monitoramento do Setor Elétrico - CMSE) and the Electric Energy Trading Chamber (Câmara de Comercialização de Energia Elétrica - CCEE) were also created under the New Model.
The New Model for Brazil’s Power Sector had the following goals:
(i) Build a solid regulatory framework;
(ii) Supply reliability;
(iii) Create tariff affordability;
(iv) Give a clear definition of roles and responsibilities by the electricity sector actors;
(v) Planning;
3 Law No. 8,987/1995.
4 Law No. 9,427/1996.
5 Law No. 10.295/2001 and Decree No 4,059/2001.
(vi) Promote competitiveness in the generation sector;
(vii) Encourage hiring in advance and by long-term contracts; and
(viii) Aid social integration, especially of electric universal service program.
This new model opened a new season for investments, and the system was expanded, covering the demand growth.
The system expansion increased the power sector’s complexity. For a continental country, a centralized electricity system presents challenges, such as high transmission and distribution costs. In addition, the expansion of hydropower energy, the core of the Brazilian energy matrix, is facing an unknown future, given its high social and environmental impacts. Alternatively, investments in renewables have increased, but they also face challenges such as their intermittent nature.
In 2018, the President of Brazil submitted a bill to the National Congress for a possible third power sector restructure. The bill, currently under discussion, would introduce a series of important and beneficial reforms to the electricity sector. Among the changes discussed are: expanding distributed generation, which could lower the costs for renewables, and privatization of generation companies. Changes in the sector are expected, although the timing is yet unknown.
BRAZIL’S MAIN ENERGY INSTITUTIONS
Brazil’s energy sector has a well-structured management system. The Ministry of Mines and Energy (MME) serves as the policymaker for the programs and policies, and the regulatory agencies and Eletrobras serves as their operator. This system is mapped for the first time in Figure 6.2 and explained in detail below.
Federal Government. According to the Federal Constitution, Brazil’s hydropower potential is the Union’s asset. 6 It is a federal responsibility to explore – directly or by granting authorization, permission, or concession – electric energy services and installations, and watercourse power utilization in accordance with the states where the hydropower potential is located. 7 It is also a federal responsibility to legislate about water and energy. 8 Given these responsibilities, the Presidency of the Republic, represented by the Office of the President, is the top official of the institutional energy structure. The following actors are the ones that formulate and execute the national energy policy.
Ministry of Mines and Energy (MME). Created for the first time in 1960, the Ministry of Mines and Energy (MME) had a rocky start. In 1990, it was eliminated and its responsibilities were transferred to the Ministry of Infrastructure. After two years, in 1992, the MME was created
6 Federal Constitution. Article 20.
7 Idem. Article 21.
8 Idem. Article 22.
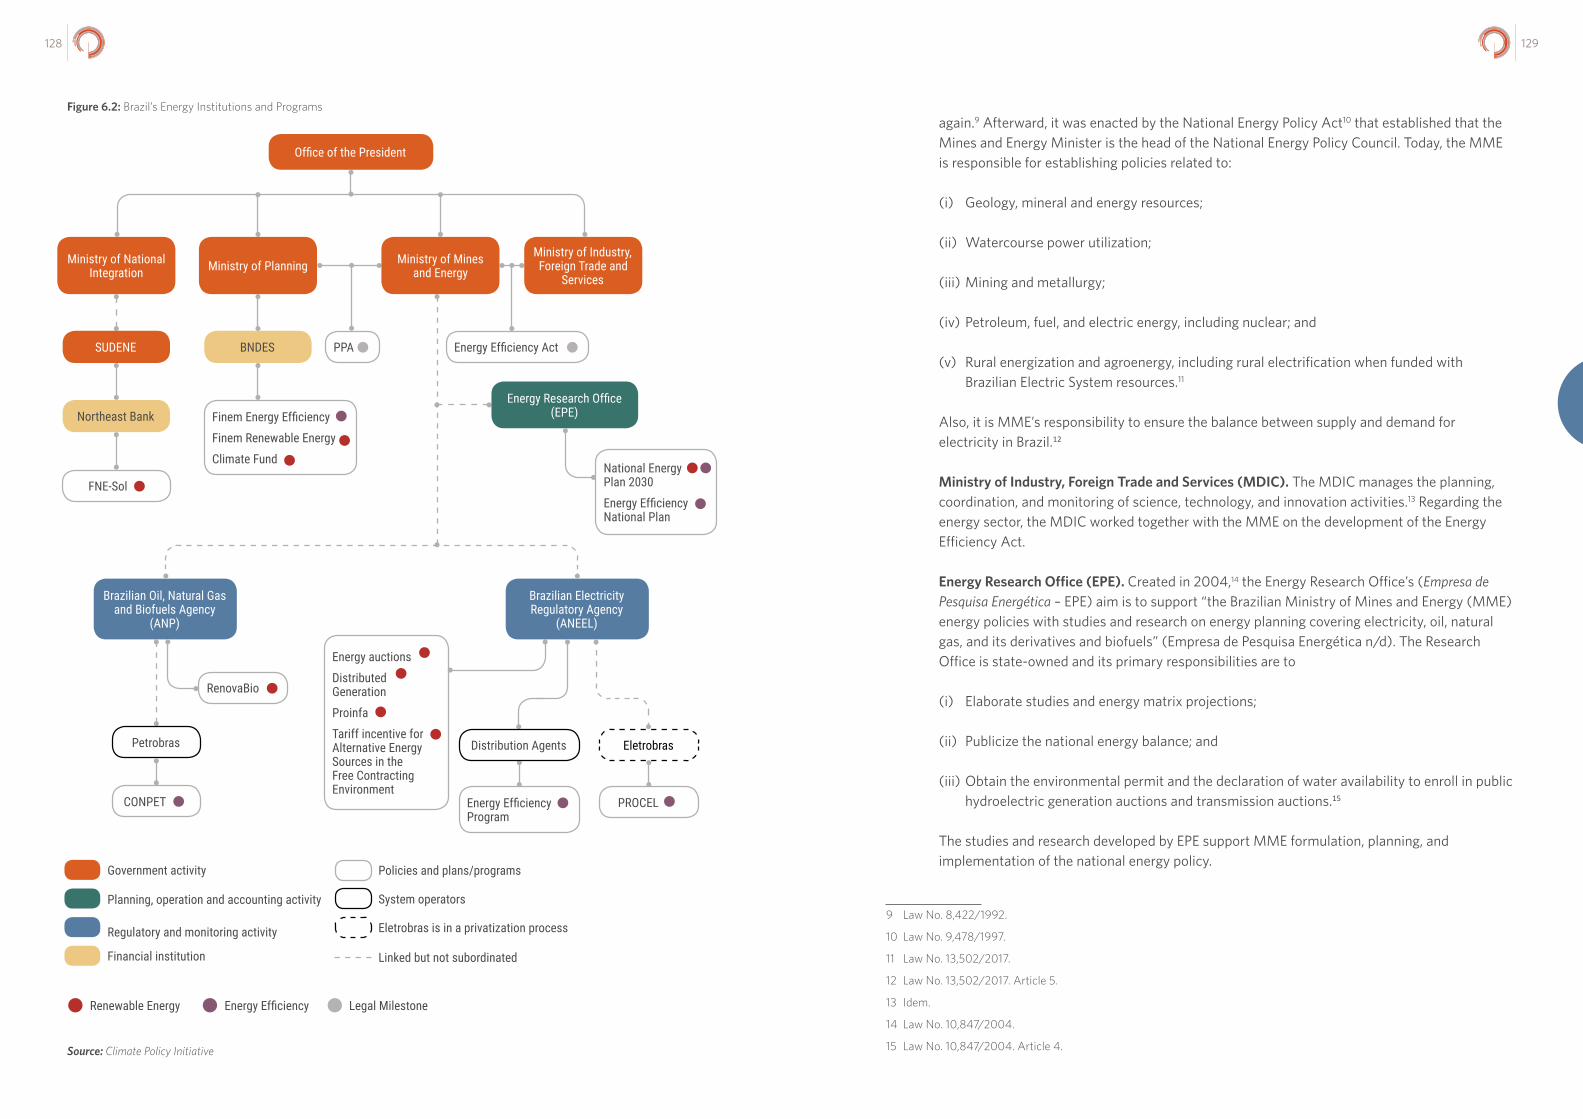
129128
again.9 Afterward, it was enacted by the National Energy Policy Act10 that established that the Mines and Energy Minister is the head of the National Energy Policy Council. Today, the MME is responsible for establishing policies related to:
(i) Geology, mineral and energy resources;
(ii) Watercourse power utilization;
(iii) Mining and metallurgy;
(iv) Petroleum, fuel, and electric energy, including nuclear; and
(v) Rural energization and agroenergy, including rural electrification when funded with Brazilian Electric System resources.11
Also, it is MME’s responsibility to ensure the balance between supply and demand for electricity in Brazil.12
Ministry of Industry, Foreign Trade and Services (MDIC). The MDIC manages the planning, coordination, and monitoring of science, technology, and innovation activities.13 Regarding the energy sector, the MDIC worked together with the MME on the development of the Energy Efficiency Act.
Energy Research Office (EPE). Created in 2004,14 the Energy Research Office’s (Empresa de Pesquisa Energética – EPE) aim is to support “the Brazilian Ministry of Mines and Energy (MME) energy policies with studies and research on energy planning covering electricity, oil, natural gas, and its derivatives and biofuels” (Empresa de Pesquisa Energética n/d). The Research Office is state-owned and its primary responsibilities are to
(i) Elaborate studies and energy matrix projections;
(ii) Publicize the national energy balance; and
(iii) Obtain the environmental permit and the declaration of water availability to enroll in public hydroelectric generation auctions and transmission auctions.15
The studies and research developed by EPE support MME formulation, planning, and implementation of the national energy policy.
9 Law No. 8,422/1992.
10 Law No. 9,478/1997.
11 Law No. 13,502/2017.
12 Law No. 13,502/2017. Article 5.
13 Idem.
14 Law No. 10,847/2004.
15 Law No. 10,847/2004. Article 4.
Figure 6.2: Brazil’s Energy Institutions and Programs
Source: Climate Policy Initiative
Office of the President
Ministry of National Integration
SUDENE
Northeast Bank
FNE-Sol
Ministry of Planning
BNDES
Finem Energy Efficiency
Finem Renewable Energy
Climate Fund
Energy auctions
Distributed Generation
Proinfa
Tariff incentive for Alternative Energy Sources in the Free Contracting Environment
RenovaBio
Petrobras
CONPET
Ministry of Mines and Energy
Ministry of Industry, Foreign Trade and
Services
Energy Efficiency ActPPA
Energy Research Office (EPE)
Brazilian Electricity Regulatory Agency
(ANEEL)
Brazilian Oil, Natural Gas and Biofuels Agency
(ANP)
National Energy Plan 2030
Energy Efficiency National Plan
Energy Efficiency Program
Distribution Agents
PROCEL
Eletrobras
Government activity
Financial institution
Planning, operation and accounting activity
Regulatory and monitoring activity
System operators
Policies and plans/programs
Eletrobras is in a privatization process
Linked but not subordinated
Renewable Energy Energy Efficiency Legal Milestone
131130
Brazilian Electricity Regulatory Agency (ANEEL). Responsible for the electricity sector regulation, the Brazilian Electricity Regulatory Agency (Agência Nacional de Energia Elétrica –ANEEL) was created in 1996.16 Its role is to regulate the electric energy sector and to manage the following responsibilities (Agência Nacional de Energia Elétrica n/d):
(i) Monitor the regularity of all the electric energy permissions and concessions;
(ii) Implement federal policy concerning electric energy and watercourse power utilization;
(iii) Set electric energy tariffs;
(iv) Serve as the administrative court for legal and technical disputes; and
(v) Grant concessions, permissions, and authorization to electric energy services.
Brazilian Oil, Natural Gas and Biofuels Agency (ANP). Created in 1997, by the National Energy Policy, 17 the Brazilian Oil, Natural Gas and Biofuels Agency (Agência Nacional do Petróleo, Gás Natural e Biocombustíveis – ANP) is the Brazilian oil, natural gas, and biofuel regulatory agency. The ANP promotes regulation, establishes the rules for contracting, and supervises the economic activities that are part of the oil, natural gas, and biofuels industry. It is linked to the MME, but as a regulatory agency, it is independent and has autonomy.
Brazilian Development Bank (BNDES). The Brazilian Development Bank is a state-owned development bank. It offers credit lines to encourage different types of business. The power sector is the second biggest funded by BNDES, behind the agriculture sector (Banco Nacional do Desenvolvimento 2018). Three credit lines are described in the following sections: FINEM – Renewable Energy, FINEM – Energy Efficiency, and Climate Fund.
Northeast Bank. The Northeast region of Brazil has a different social, environmental and economic development scenario if compared with other regions of the country. The Northeast passes through periods of drought, and most of its Municipalities has lower Human Development Index (United Nations Development Program 2010), and Growth Domestic Product than Brazil’s average (Instituto Brasileiro de Geografia e Estatística 2015). In order to promote region’s equality throughout the country, the Federal Constitution of 1988 foresaw that the Federal Government should set aside part of its tax revenues to be distributed among the North, Northeast, and Centre-West Regions, through their regional development banks. The Northeast Bank, thus, has a special credit line fed by Federal resources, with the goal to promote regional development. One of the credit lines is the FNE-Sol that is described in the following section.
Eletrobras. One of the biggest players in the electricity sector, Eletrobras is a state-owned electric energy company that operates in energy generation and transmission. Created in 1961,18 Eletrobras does not only build and operate energy facilities, but it also elaborates studies
16 Law No. 9,427/1996.
17 Law No. 9,478/1997.
18 Law No. 3,890-A.
concerning energy expansion. In 1990, the company also started operating in the electric energy distribution sector. Today, Eletrobras is undergoing a privatization process that is still pending government decree to set its terms (Eletrobras c2017).
Petrobras. Petrobras is one of the biggest players in the fuel sector. As with Eletrobras, Petrobras is a state-owned energy company that operates in petroleum extraction and refining, petroleum transportation, and commerce, and in biofuels generation. It was created in 194219 as a state oil monopolist company. In 1997, the Energy Policy Act enactment20 opened the oil market and allowed other companies to explore oil activities through concessions. Petrobras remained state-owned, but not as a monopolist. It was required to transfer all of its data about the oil fields it had discovered to ANP and began receiving a government grant to install and operate in new oil fields. Petrobras is also responsible for the energy efficiency program “National Program of Rationalized Use of Oil By-Products and Natural Gas – CONPET”. Currently, Petrobras has been in the middle of a political crisis. Former board members have been indicted for corruption and money laundering (Albuquerque 2018).
Brazil’s generation, transmission, and distribution agents. These agents are the companies responsible for executing the operation of Brazil’s electricity system. The market is open for national and foreign players who can bid in energy auctions for the right to build and operate energy generation facilities. Meanwhile, the services of transmission and distribution are regulated through concession contracts between the companies and ANEEL, who also sets the prices the operators can charge.
RENEWABLE ENERGY POLICIES
Despite a significant role in the electric energy matrix, alternative renewable energy sources only began receiving incentives in 2002, with the introduction of the Incentive Program to Alternative Sources (Proinfa). Afterward, the government established technology-specific auctions as the contracting mechanism for electricity in Brazil and implemented several policies to encourage renewable power generation.
This section is divided into two parts:
(i) Renewable Energy Policies; and
(ii) Renewable Energy Financing Incentives.
I. Renewable Energy Policies
Incentive Program to Alternative Sources (Proinfa). Proinfa represents the first major attempt in Brazil to deploy electricity generation from renewable sources other than hydro plants. It was enacted in 2002,21 one year after major power outages due to a combination of low rainfall and over-reliance on hydro sources. It also focuses on lowering Greenhouse Gases (GHG)
19 Law No. 2,004/1953.
20 Law No. 9,478/1997.
21 Law No. 10,438/2002.

133132
emissions in accordance with the United Nations Framework Convention on Climate Change (UNFCCC).
The MME is the coordinator of the program and Eletrobras plays an executive role by holding responsibility for the energy purchase and selling agreements. The program works with a feed-in tariff system, which is a long-term purchase agreement for the sale of electricity to the grid at prices typically set above market prices.
Proinfa was established as a two-phase program. The first phase had the goal to install 3,300 MW capacity, split evenly among wind, small hydro, and biomass, and scheduled to be operative by December 2008. Low take-up from biomass developers led the government to contract extra capacity from wind. After the installation of 3,300 MW, the second phase was planned to supply 10% of Brazil’s annual electricity consumption from renewable sources within 20 years. However, Proinfa’s second phase was never implemented. Several factors accounted for the program’s disruption, including its poor performance in terms of deployability, and a major reform in the power sector that came into force in 2004, making auctions the contracting mechanism for electricity in Brazil (Assunção, Chiavari, and Szerman 2014).
Currently, there are 131 energy plants that are part of the program: 60 small hydropower plants, 52 wind power plants, and 19 biomass plants. Together they are expected to generate 11.2 million MWh (Agência Nacional de Energia Elétrica 2017).
Energy Auctions. The same law that created Proinfa22 established that concessionaires, licensees, and authorized companies of the electric energy sector that are willing to participate in the Regulated Contracting Environment, should bid for their grant to generate, transmit, or distribute electric energy in an energy auction. The auctions are regulated and promoted by ANEEL. There are four main auctions type: New Energy, Existent Energy, Reserve Energy, and Alternative Sources. Each auction may establish which energy source can bid in the auction. For instance, ANEEL can promote a Reserve Energy Auction exclusively for wind power. It can also promote a Reserve Energy Auction for all energy sources. It depends on the government’s demand or will to encourage some type of energy source. Auctions are also classified by their time horizon. If the government is contracting for the next 4 or 6 years, that is, if the energy generation is expected to start in 4 or 6 years from the energy contract signature, the auction is called “A-4” or “A-6”.
The first alternative source auction was promoted in 2007.23 Biomass-fired, small hydropower, and wind power were the only sources that could participate. The auction registered 143 projects with 4,570 MW installed power, but it contracted 638.64 MW installed power from hydro and biomass projects.
In 2009, as a way to encourage wind power, ANEEL held an exclusive energy reserve auction. It contracted 71 wind power plants with 1,805.7 MW installed power for an average selling price of R$ 148.39/MWh (Empresa de Pesquisa Energética 2009). Since then, wind power
22 Idem.
23 Decree No. 6,048/2007.
has become more competitive, and today it competes in equal standards with regular energy sources. For instance, in the new energy auction A-6/2017, wind power competed against small hydropower, hydropower, biomass-fired, and coal natural gas; wind power won 49 projects against them with a total of 1,386.63MW. Natural gas won two projects with a total of 2,138.91MW; biomass-fired won 6 projects with a total of 177.06MW; and, small hydropower won 6 projects for a total of 139.03MW (Empresa de Pesquisa Energética 2017).
In 2013, ANEEL held the first auction open to photovoltaic (PV) energy generation projects (but not exclusively) in a New Energy auction (Empresa de Pesquisa Energética 2013). However, no PV project was contracted. On the other hand, in 2014 (Energy Reserve auction 2014), resulted in 890MW AC capacity for an average price of USD 87/MWh, one of the lowest prices in the world, according to Bloomberg New Energy Finance (Bloomberg New Energy Finance 2014). In the most recent energy auction – new energy auction A-4/2018 – PV successfully won 29 projects with a total of 240.5MW. Wind power was the second largest winner, but far behind PV, with 4 projects and a total of 57.7MW. It is worth noting that biomass-fired projects, small hydropower, and hydroelectric power generation were also bidders and won 2 projects each, with 34.5MW,17.56MW, and 5.93MW, respectively (idem 2018). Despite these positive results, Brazil does not yet have a robust photovoltaic supply chain (Associação Brasileira de Energia Solar Fotovoltaica 2014). The PV source was not able to participate in the 2015 auctions (idem 2015), and in 2016 it participated but was not contracted (idem 2016), which seems to have delayed the pace of development of solar technologies.
Tariff incentive for Alternative Energy Sources in the Free Contracting Environment. Consumers with loads greater than or equal to 500 kW, known as “special consumers,” can freely contract renewables with up to a 50% discount on transmission and distribution tariffs.24 The subsidy shared among all consumers totaled €2 billion in 2016 (Barroso 2017). The Electric Sector Modernization Bill proposes changes in this kind of incentive. It argues that the discount results in cross subsidies, which adversely affect the allocation of costs in the power sector. The bill intends to replace the discount for an incentive award associated with the physical energy generated for each encouraged energy source. The bill also suggests that this award should be applied until 2030. After that, it is supposed that this award would not be needed any longer, given that these encouraged energy sources would be in equal standard to compete with the regular ones (Ministério de Minas e Energia 2017).
Distributed Generation (DG). In 2012, ANEEL enacted rules25 about mini- and micro- distributed generation from renewable sources. In 2015, ANEEL made a revision26 to broaden27 the required installed power for mini- or micro- generation to encourage distributed generation implementation. Currently, there are 335.648 kW total installed power (Agência Nacional de Energia Elétrica, Estados n/d), with 257,170 kW coming from solar power (Agência Nacional de Energia Elétrica, Geração n/d).
24 Law No. 9,427/1996.
25 Res. 428/2012.
26 Res. 687/2015.
27 Res. 482/2012 established that microgeneration was up to 100kW and minigeneration was 75kW ≥ x ≤ 3MW.
135134
Pluriannual Plan (PPA) The Federal Constitution28 established the PPA as an instrument to organize actions under the federal government over periods of four years (Ministério do Planejamento Desenvolvimento e Gestão 2015). The current PPA sets actions from 2016 to 2019. Regarding renewable energy, the PPA sets two initiatives:
(i) Support for the implementation and promotion of photovoltaic energy production policy; and
(ii) Implementation and promotion of policies for the installation of energy matrices for solid waste.29
It is worth noting that while the PPA bill originally included a number of goals, targets, and initiatives to encourage, and promote renewables expansion, nearly all these initiatives were vetoed when the bill went through Congress.30
RenovaBio. The National Biofuels Policy Act, known as RenovaBio, was enacted in 2017. 31 The main goals of the law are as follows (Ministério de Minas e Energia n/d):
(i) Contribute to Brazil’s NDC compliance;
(ii) Promote biofuels expansion; and
(iii) Contribute with predictability for a competitive biofuel participation in the national energy market.
A key instrument of Renovabio is the Decarbonization Credit, which is a new type of trading asset created by the law, but it is still pending regulation to be operable.32 Although it is a recent policy, enacted in December 2017, RenovaBio indicates the government’s willingness to expand and encourage biofuels production (Brasil n/d).
I. Renewable Energy Financing Incentives
Brazilian Development Bank (BNDES). From 2003 to 2017, the Brazilian Development Bank invested R$ 212 billion for energy generation, including R$ 47 billion invested in solar power, wind power, small hydropower, and biomass-fired projects. This value corresponds to 16,001 MW power capacity (Espósito 2018).
Climate Fund. The climate fund is an instrument of the Brazilian Climate Change Policy Act. The Fund is linked to the Ministry of the Environment (MMA) and provides resources in two modalities, reimbursable and non-refundable. The BNDES is responsible for managing the
28 Federal Constitution. Article 165.
29 Law No. 13,249/2016.
30 Idem.
31 Law No. 13,576/2017.
32 Idem. Articles 1 and 4.
latter. Recently, BNDES suspended this credit line, probably due to the lack of resources.33 However, in June 2018, the line was reopened, offering credit to, among others, renewable energy projects (Banco Nacional do Desenvolvimento Econômico e Social Clima 2018). A credit line to natural persons who wish to install photovoltaic panels in their houses was announced (Neder 2018).
FINEM – Renewable energy. As an alternative to the Climate Fund (Fundo Clima), BNDES developed a new credit line to fund renewable energy. In 2017, with the goal to encourage solar power generation and distributed generation, the bank established fees and a time horizon that are more attractive to the solar sector. For the solar sector, BNDES’ payback is from 0.9% per year, while for other types of renewable energy sources, it is 1.3% per year (Banco Nacional de Desenvolvimento Econômico e Social n/d). Regardless of the energy source, though, BNDES offers credit up to 80% of a project’s value that can be increased to 100% if the project is developed by small companies (Espósito 2018). Since small companies usually develop photovoltaic power projects, this rule widely benefits the solar sector (Banco Nacional de Desenvolvimento Econômico e Social 2017).
Northeast Bank: FNE-Sol. In 2017, the Northeast Bank developed a credit line to promote mini- and micro-distributed generation from photovoltaic, wind power, biomass-fired, or small hydropower projects. With resources from the Northeast Constitutional Fund, FNE-Sol can offer attractive fees (e.g., from 6.65% to 9% annual charges with 15% compliance bonus). The credit line is available for industries, agro-industries, commercial and service companies, rural producers and rural companies, cooperatives, and legally-constituted associations.
KEY ENERGY EFFICIENCY POLICIES AND PROGRAMS
For Brazil, energy efficiency (EE) emerged first as a concern in the 1970s due to the Oil Shock, recurred during the international financial crises in the 1980s, and again during the energy blackout in 2001. In the same year as the energy blackout, the Government enacted the Energy Efficiency Act. 34 Ten years later, the Ministry of Mines and Energy elaborated the Energy Efficiency National Plan.35
Because Brazil’s energy efficiency programs and regulations were a response to external and internal crises, they were not well-planned or well-structured and lacked long-term vision. Better alignment is needed between the many institutions responsible for planning and implementing energy efficiency measures (Assunção and Schutze 2017).
The first energy efficiency program to be implemented in the energy sector was the Energy Mobilization Program (Programa de Mobilização Energética - PME) in 1981.36 Its purpose was to
33 According to the last Climate Fund Management Report (2016), the National Treasury was retaining the fund resources. By 2016, BNDES was still expecting the fund revenue from 2013, 2014, 2015, and 2016 (Ministério do Meio Ambiente 2016). BNDES suspended this specific credit line on December 28, 2017.
34 Law No. 10,295/2001 and Decree No. 4,059/2001.
35 MME’s Ordinance No. 594/2011.
36 Decree No. 87,079/1981.
137136
encourage fuel energy replacement by renewables energy source. However, the program was revoked in 1991.37
The main policies and programs of EE that remain in force and their associated management institutions are described below.
Electric Power Preservation National Program (PROCEL). Coordinated by the Ministry of Mines and Energy (MME) and executed by Eletrobras, the Electric Power Preservation National Program (Programa Nacional de Conservação de Energia Elétrica - PROCEL) was created in 1985.38 The program’s purpose is to promote rational and efficient energy use and to avoid its waste. From PROCEL’s creation until 2016, the program resulted in an economy of 107 billion kWh (Centro Brasileiro de Informação de Eficiência Energética c2006). PROCEL acts in the following areas:
(i) Equipment - identifying product efficiency;
(ii) Edifications - offering advice and recommendations on construction efficiency;
(iii) Public lighting - supporting the municipalities in planning and implementing energy efficiency projects;
(iv) Industry and commerce - by providing training, manuals, and technical tools for reducing and avoiding energy waste;
(v) Public authority - providing tools, training, and support in projects that reduce energy consumption in municipalities and the efficient use of water and electricity; and
(vi) Knowledge - elaborating and disseminating qualified information about energy efficiency in schools and books, technical manuals, and software.
Since 2016, 20% of the resources required by law to be applied by distribution companies on energy efficiency are transferred to PROCEL, ensuring a reliable source of funding.39 However, since PROCEL is executed by Eletrobras, which is currently undergoing a privatization process, the future of the program is yet unknown.
National Program of Rationalized Use of Oil By-Products and Natural Gas (CONPET). Created in 1991,40 the National Program of Rationalized Use of Oil By-Products and Natural Gas (Programa Nacional da Racionalização do Uso dos Derivados de Petróleo e do Gás Natural - CONPET) are coordinated by the Ministry of Mines and Energy and executed by Petrobras. The main goals of the program are as follows:
(i) Decrease oil by-product and natural gas consumption;
37 Decree of February 15 of 1991.
38 Interministerial Ordinance MME/MDIC No. 1,877.
39 Law No. 13,280/2016.
40 Decree of 18 of July of 1991.
(ii) Decrease GHG emissions;
(iii) Promote research and development (R&D); and
(iv) Provide technical support for an increase in EE in the energy final use.
CONPET also seeks to address consumer choices by labelling products with energy efficiency ratings or by teaching how to reduce energy waste through schools. In addition, there is an initiative called CONPET-auto, aimed at the transportation sector to promote better efficiency in diesel use. Since Petrobras is in the middle of a political and financial crisis – and is responsible for executing the program – CONPET is less active today.
Brazil’s Energy Efficiency programs (PEE). Since 1998, the Brazilian Electricity Regulatory Agency (ANEEL) has encouraged energy efficiency by establishing that distribution companies apply at least 0.1% of their net operating revenue to EE measures.41
The percentage of investments in EE changed over the subsequent years,42 and, currently,43 the minimum amount for both R&D and EE investment is 1% of the net operating revenue (0.5% each). The investment, after December 2022, should be 0.25% for EE and 0.75% for R&D. The concessionaries and licensees themselves invest 88% of the EE resources and 20% are delivered to PROCEL. 44 PEE is the main source of resources for energy efficiency in Brazil; investments totaled R$ 5 billion during the 2008-2016 period (Agência Nacional de Energia Elétrica 2016).
Of the 1,704 new EE projects proposed in the scope of the PEE between 2008 and March 2016, the majority were designated to low-income households and to the public authority. Notably, only 65 projects targeted industry efficiency. This sum corresponds to only 2% of the total EE investment, even though industry is the largest consumer of electricity in Brazil.
BNDES Energy Efficiency (formerly PROESCO). Since 2006, the Brazilian Development Bank (Banco Nacional do Desenvolvimento Econômico e Social - BNDES) has offered a credit line for energy efficiency projects. In 2016, the Program was reformulated to become more attractive to investors. The reformulation made the following changes: set a lower minimum operation value – R$ 5 million instead of R$ 20 million; established that the minimum amount may be distributed in more than one project; and, extending the payment deadline, which was previously settled in 72 months, according to the project.
The credit line can fund projects related to energy efficiency in buildings, public lighting, smart grids, energy efficiency in production processes, and the repowering of existing plants.
From 2003 to 2016, less the 0.5% of the total credit line was related to energy efficiency.
41 Resolution No. 242/1998.
42 Law No. 9,991/2000.
43 Law No. 13,280/2016.
44 Idem.
139138
National Energy Plan (PNE 2030) The National Energy Plan (Plano Nacional de Energia - PNE 2030) is the first integrated planning study of energy resources made by EPE and MME on behalf of the federal government. The study provides subsidies for the formulation of a strategy to expand the supply of economic and sustainable energy to meet the evolution of demand, from a long-term perspective. EPE is currently working in the National Energy Plan for 2050 (Plano Nacional de Energia - PNE 2050).
PNE 2030 dedicated a specific chapter to energy efficiency. The chapter presents energy efficiency measures (EEM) that could be implemented in Brazil’s economic activity. In the study of energy conservation potential, three scenarios for the EEM were conceived: technical, economic, and market. The first aims to establish a limit for the implementation of EEM by replacing equivalent equipment with the most efficient technology available. The economic scenario considers the subset of the technical scenario where measures are economically feasible to implement. The third, market scenario, analyzes EEM that could bring cost reductions to consumers. The study is divided by EEM that could be implemented by the industry sector; public and private commercial sector and residential sector (Ministério de Minas e Energia and Empresa de Pesquisa Energética 2007). Concerning the electricity sector, the PNE 2030 foresees that 5% of the demand could be reduced voluntarily, by replacing equipment through more cost-efficient technology, and the implementation of public policy could also reduce it by 5%. The PNE leaves to the Energy Efficiency National Plan (PNEf) in charge of planning how to achieve energy efficiency goals.
Energy Efficiency National Plan (PNEf) With the responsibility for establishing how to achieve the PNE’s goals, the Ministry of Mines and Energy enacted the Energy Efficiency National Plan (Plano Nacional de Eficiência Energética - PNEf). 45 The PNEf aims to include energy efficiency in the planning of the energy sector, promotes the reduction of energy waste, and encourages an energy-efficient economy. The main goal is to reach an annual energy conservation target of 10% of the national energy consumption by 2030. For the electricity sector, the basic plans are the following:
(i) Creation of a steering committee presided by the Minister of Mines and Energy that would be responsible for the PNEf implementation, monitoring, and publicity;
(ii) Creation of a database program with information about energy consumption, energy baseline for processes and technology, and GHG emissions;
(iii) Set mechanisms that promote exchanges among governmental institutions, such as PROCEL, CONPET, ANEEL, and Petrobras; and
(iv) Elaboration of studies and research aiming methodology improvement for data and energy efficiency measurements.
PNEf also sets guidelines to improve EE laws and regulations. They recommend many actions, including enacting specific legislation to forbid non-efficient equipment commercialization,
45 MME’s Ordinance No. 594/2011.
promoting fiscal incentives for the material used to encourage EE and energy-efficient equipment, and setting energy efficiency clauses in energy auctions.
Pluriannual Plan (PPA) Regarding energy efficiency, the PPA aims to promote the rational use of energy through energy efficiency and enhancement of generation, transmission, distribution and consumption. The target is to avoid 30,000GW of power consumption. With this in mind, the PPA sets four initiatives under the Ministry of Mines and Energy:
(i) Encourage the replacement of low efficiency equipment’s;
(ii) Promote awareness about the efficient use of electric power;
(iii) Promote synergy between CONPET and PROCEL; and
(iv) Encourage studies about the regulation of the Energy Efficiency Law, expanding the list of equipment’s and improving the energy efficiency index.46
46 Law No. 13,249/2016.
141140
REFERENCES
Agência Nacional de Energia Elétrica. n.d. Bem-vindo à ANEEL [Accessed: 12 March 2018.] http://www.aneel.gov.br/a-aneel.
Agência Nacional de Energia Elétrica. 2016. Eficiência energética gera economia de 4,6 TWh Brasília: ANEEL. 11 October 2016. [Accessed: 08 May 2018.] http://www.aneel.gov.br/sala-de-imprensa-exibicao/-/asset_publisher/XGPXSqdMFHrE/content/eficiencia-energetica-gera-economia-de-4-6-gwh/656877?inheritRedirect=false.
Agência Nacional de Energia Elétrica. 2017. Aprovado valor das cotas do Proinfa para 2018 [Accessed: 14 April 2018.] http://www.aneel.gov.br/sala-de-imprensa-exibicao-2/-/asset_publisher/zXQREz8EVlZ6/content/aprovado-valor-das-cotas-do-proinfa-para-2018/656877?inheritRedirect=false.
Agência Nacional de Energia Elétrica. n.d. Geração Distribuída[Accessed: 13 April 2018.] http://www2.aneel.gov.br/scg/gd/GD_Estadual.asp.
Agência Nacional de Energia Elétrica. n.d. Geração Distribuída: estados [Accessed:13 April 2018.] http://www2.aneel.gov.br/scg/gd/GD_Estadual.asp.
Albuquerque AL. 2018. Moro condena ex-gerentes da Petrobras por corrupção e lavagem. Curitiba: Folha de São Paulo, 5 fevereiro 2018. [Accessed: 8 May 2018.] https://www1.folha.uol.com.br/poder/2018/02/moro-condena-ex-gerentes-da-petrobras-por-corrupcao-e-lavagem.shtml.
Associação Brasileira de Energia Solar Fotovoltaica. 2014. Marco histórico para o setor fotovoltaico brasileiro. [Accessed: 12 April 2018.] http://www.absolar.org.br/noticia/artigos-da-absolar/marco-historico-para-o-setor-fotovoltaico-brasileiro.html.
Assunção J, Chiavari J, Szerman D. 2014. Misreporting in wind power contracts: Evidence from a feed-in tariff in Brazil. Rio de Janeiro: CPI Brazil. [Accessed 14 April 2018.] https://climatepolicyinitiative.org/publication/misreporting-in-wind-power-contracts-evidence-from-a-feed-in-tariff-in-brazil/.
Assunção J, Schutze A. 2017. Panorama da Eficiência Energética no Brasil. Rio de Janeiro: CPI Brazil.
Banco Nacional do Desenvolvimento Econômico e Social. n.d. BNDES Finem - Geração de energia [Accessed: 16 April 2018.] https://www.bndes.gov.br/wps/portal/site/home/financiamento/produto/bndes-finem-energia.
Banco Nacional do Desenvolvimento Econômico e Social. 2017. BNDES aprimora metodologia de credenciamento de equipamentos para energia solar fotovoltaica [Accessed 16 April 2018.] https://www.bndes.gov.br/wps/portal/site/home/imprensa/noticias/conteudo/bndes-aprimora-metodologia-de-credenciamento-de-equipamentos-para-energia-solar-fotovoltaica.
Banco Nacional do Desenvolvimento Econômico e Social. 2018. Estatísticas por setor e porte de empresa [Accessed 8 June 2018.] https://www.bndes.gov.br/wps/portal/site/home/relacoes-com-investidores.
Banco Nacional do Desenvolvimento Econômico e Social. 2018. Fundo Clima - Subprograma Energias Renováveis [Accessed 8 June 2018.] https://www.bndes.gov.br/wps/portal/site/home/financiamento/produto/fundo-clima/fundo-clima.
Barroso LA. 2017. Novas propostas para o aprimoramento do marco legal do setor elétrico [PowerPoint slides]. Universidade Federal do Rio de Janeiro: 10 October 2017.
Barroso LA. 2017. Expansion of power sector in Brazil & perspectives for private investors in generation [Accessed:15 May 2018.] http://www.epe.gov.br/sites-pt/sala-de-imprensa/noticias/Documents/Notícias-2017-11-14/Luiz Barroso - Statkraft - Inv in G in Brazil.pdf.
Bloomberg New Energy Finance. 2014. Solar energy makes landfall in Brazil at record-setting low price [Accessed 13 March 2018.]. https://about.bnef.com/blog/solar-energy-makes-landfall-brazil-record-setting-low-price/.
Brasil. n.d. Entenda o que é e como funciona o RenovaBio [Accessed 16 April 2018.] http://www.brasil.gov.br/economia-e-emprego/2017/12/entenda-o-que-e-e-como-funciona-o-renovabio.
Centro Brasileiro de Informação de Eficiência Energética. 2006. O programa [Accessed 15 March 2018.]. http://www.procelinfo.com.br/main.asp?Team=%7B505FF883-A273-4C47-A14E-0055586F97FC%7D.
Eletrobras. 2017. História [Accessed 14 April 2018.]. http://eletrobras.com/pt/Paginas/Historia.aspx.
Empresa de Pesquisa Energética. n.d. Who we are [Accessed 09 April 2018.] http://www.epe.gov.br/en/about-epe/who-we-are.
Empresa de Pesquisa Energética. 2009. Primeiro leilão de energia eólica do país viabiliza a construção de 1.805,7 MW [Accessed: 18 May 2018.] http://www.epe.gov.br/sites-pt/publicacoes-dados-abertos/publicacoes/PublicacoesArquivos/publicacao-90/20091214_1.pdf.
Empresa de Pesquisa Energética. 2013. Fontes eólica e solar lideram inscrições no leilão de energia para o ano de 2016 [Accessed 08 June 2018.] http://www.epe.gov.br/sites-pt/publicacoes-dados-abertos/publicacoes/PublicacoesArquivos/publicacao-107/20130905_1.pdf.
Empresa de Pesquisa Energética. 2015. Leilões [Accessed 08 June 2018.] http://www.epe.gov.br/pt/leiloes-de-energia/leiloes.
Empresa de Pesquisa Energética. 2016. EPE habilita 64 projetos para o 1º LER 2016 [Accessed 08 June 2018.] http://www.epe.gov.br/sites-pt/publicacoes-dados-abertos/publicacoes/PublicacoesArquivos/publicacao-74/1º LER 2016.pdf.
143142
Empresa de Pesquisa Energética. 2017. Leilões de Energia Nova de 2017: Apresentando os resultados e como isso afeta os estudos de planejamento energético [Accessed: 08 May 2018.] http://www.epe.gov.br/sites-pt/publicacoes-dados-abertos/publicacoes/PublicacoesArquivos/publicacao-268/Informe Leilões 2017 - Portugues.pdf.
Empresa de Pesquisa Energética. 2018. Leilão de energia nova [Accessed 12 April 2018.]. http://www.epe.gov.br/pt/leiloes-de-energia/leiloes/leilao-de-energia-nova-a-4-2018.
Empresa de Pesquisa Energética, BEN. 2017. Balanço Energético Nacional 2017 [Accessed 23 May 2018.] https://ben.epe.gov.br/downloads/Síntese do Relatório Final_2017_Web.pdf.
Espósito AS. BNDES e Renováveis [PowerPoint slides]. CPI Brazil: Energy Workshop. Royal Tulip Brasília: 11 April 2018. Instituto Brasileiro de Geografia e Estatística (2015). Sistema de Contas Regionais: Brasil 2015. [Accessed 19 June 2018]. https://biblioteca.ibge.gov.br/visualizacao/livros/liv101307_informativo.pdf.
Ministério do Meio Ambiente. 2016. Fundo Nacional de Mudança do Clima: Relatório [Accessed 17 April 2018.]. http://www.mma.gov.br/images/arquivo/80382/relatorio Fundo Clima 2016_final.pdf.
Ministério de Minas e Energia. n.d. RenovaBio [Accessed 16 April 2018.]. http://www.mme.gov.br/web/guest/secretarias/petroleo-gas-natural-e-combustiveis-renovaveis/programas/renovabio/principal.
Ministério de Minas e Energia. 2017. Nota Técnica Nº 3/2017/AEREG/SE: Fechamento da Consulta Pública nº 21/2016 [Accessed 15 May 2018.] http://www.mme.gov.br/web/guest/consultas-publicas;jsessionid=502F5114882377C9ED77107E5D8B2AA6.srv155.
Ministério de Minas e Energia and Empresa de Pesquisa Energética. 2007. Plano Nacional de Energia 2030 [Accessed 18 April 2018.] http://www.epe.gov.br/sites-pt/publicacoes-dados-abertos/publicacoes/PublicacoesArquivos/publicacao-165/topico-173/PNE 2030 - Eficiência Energética.pdf.
Neder V. 2018. BNDES oferecerá empréstimos para instalação de placas de energia solar em casa [Accessed 08 June 2016.] O Estado de São Paulo: Rio de Janeiro. 5 June 2018. https://economia.estadao.com.br/noticias/geral,bndes-oferecera-emprestimos-para-instalacao-de-placas-de-energia-solar-em-casa,70002338858.
United Nations Development Program. 2010. Ranking IDHM Municípios 2010. [Accessed 19 June 2018]. http://www.br.undp.org/content/brazil/pt/home/idh0/rankings/idhm-municipios-2010.html.
145
The analyses performed by CPI reveal that the country’s commitments in Paris align with important economic opportunities in the energy sector. Researchers show that meeting the future energy demand through increased renewables and energy efficiency implies a reduction of 10% in investment needs by 2030 than in the case where no measures are taken to achieve the NDC goals.
The current regulatory context which lacks a well-structured and long-term vision, however, presents some limitations to the full exploitation of the country’s potential. This section presents policy suggestions for meeting the NDC that would enable Brazil to align the expansion of its energy sector to its sustainable development goals.
CPI recommends four pathways forward:
Align policies to increase deployment of alternative renewable energy.
Brazil has a great physical potential for renewable electricity generation in wind, solar, and biomass, which is enhanced by these sources’ falling prices. Implementing policies outlined in the NDC that encourage the growth of alternative renewable energy will guarantee a secure and sustainable electricity supply for the Brazilian economy.
Improve incentives and policies to encourage the expansion of decentralized solar generation.
There is also great potential for the expansion of alternative renewable sources in the decentralized system. Given Brazil’s promising physical potential, the challenge to reaping the benefits lies in the nation’s ability to develop demand-side opportunities that encourage reliable generation and active markets. The bill under evaluation by Congress, which introduces the binomial tariff for consumers with distributed generation, can encourage distributors to promote the expansion of this source in the decentralized system. Political factors, however, have been delaying its implementation.
Design incentives for the adoption of energy efficiency measures focused on industry.
As Brazil expands its use of renewable energy, the nation must simultaneously increase energy efficiency for consumers and firms. It is crucial to build policies aimed at maximizing energy efficiency in the industry, since it is the sector with the highest potential for energy conservation, but currently receives few incentives. Brazil should implement measures to encourage economic growth from investing in energy efficiency, showing how new business models, technological innovations, and energy-saving measures can increase business competitiveness.
Strengthen long-term planning and governance of energy efficiency programs.
Brazil has historically implemented energy efficiency policies as a response to periods of crises and not as the outcome of long-term planning. As a result, there are many institutions responsible for designing and implementing energy efficiency policies. Better alignment is needed among these players to guarantee the adoption of energy conservation measures as part of long-term economic growth.
PATHWAY TO NDC ENERGY
07.
147146
TRANSPORTATION

149148
TRANSFORMING BRAZIL’S TRANSPORTATION PRACTICES INTO STRATEGIES FOR ECONOMIC GROWTH AND SUSTAINABILITY
TRANSPORTATIONE C O N O M I C A N A L Y S I S
Brazil relies too heavily on roads and motorized vehicles, which contributes significantly to the transport sector’s high emissions levels and raises transportation costs for cargo and passengers.
CARGO
Due to historical underinvestment, Brazil has a low stock of infrastructure, poor quality, and an inefficient transportation mode matrix, which leads to high cargo transportation costs.
The National Logistics Plan (PNL), currently under public consultation, addresses the shortcomings in infrastructure. CPI estimates this would require an investment of R$133 billion, which would have a payback of three years.
MOBILITY
Brazil’s commuting costs are sizable: workers spend 14% of their work day commuting, amounting to 2.5% of 2015 Metropolitan GDP.
To address the shortcomings in urban mobility infrastructure, Brazil needs to invest 0.4% of the GDP per year. A reduction of 20% in commuting time alone would be enough to pay for the needed investment. Plus, the benefits of improving urban mobility infrastructure are much broader than just gains in commuting; benefits also include reductions in pollution, GHG emissions, and congestion. The investment would also improve urban design and the efficiency of cities.
BIOFUELS
Three years after sugarcane mills are built, investment in biofuels can foster growth for local economies by 30% GDP.
TAKEAWAYS
18
19
20
21
22
23
149
08.
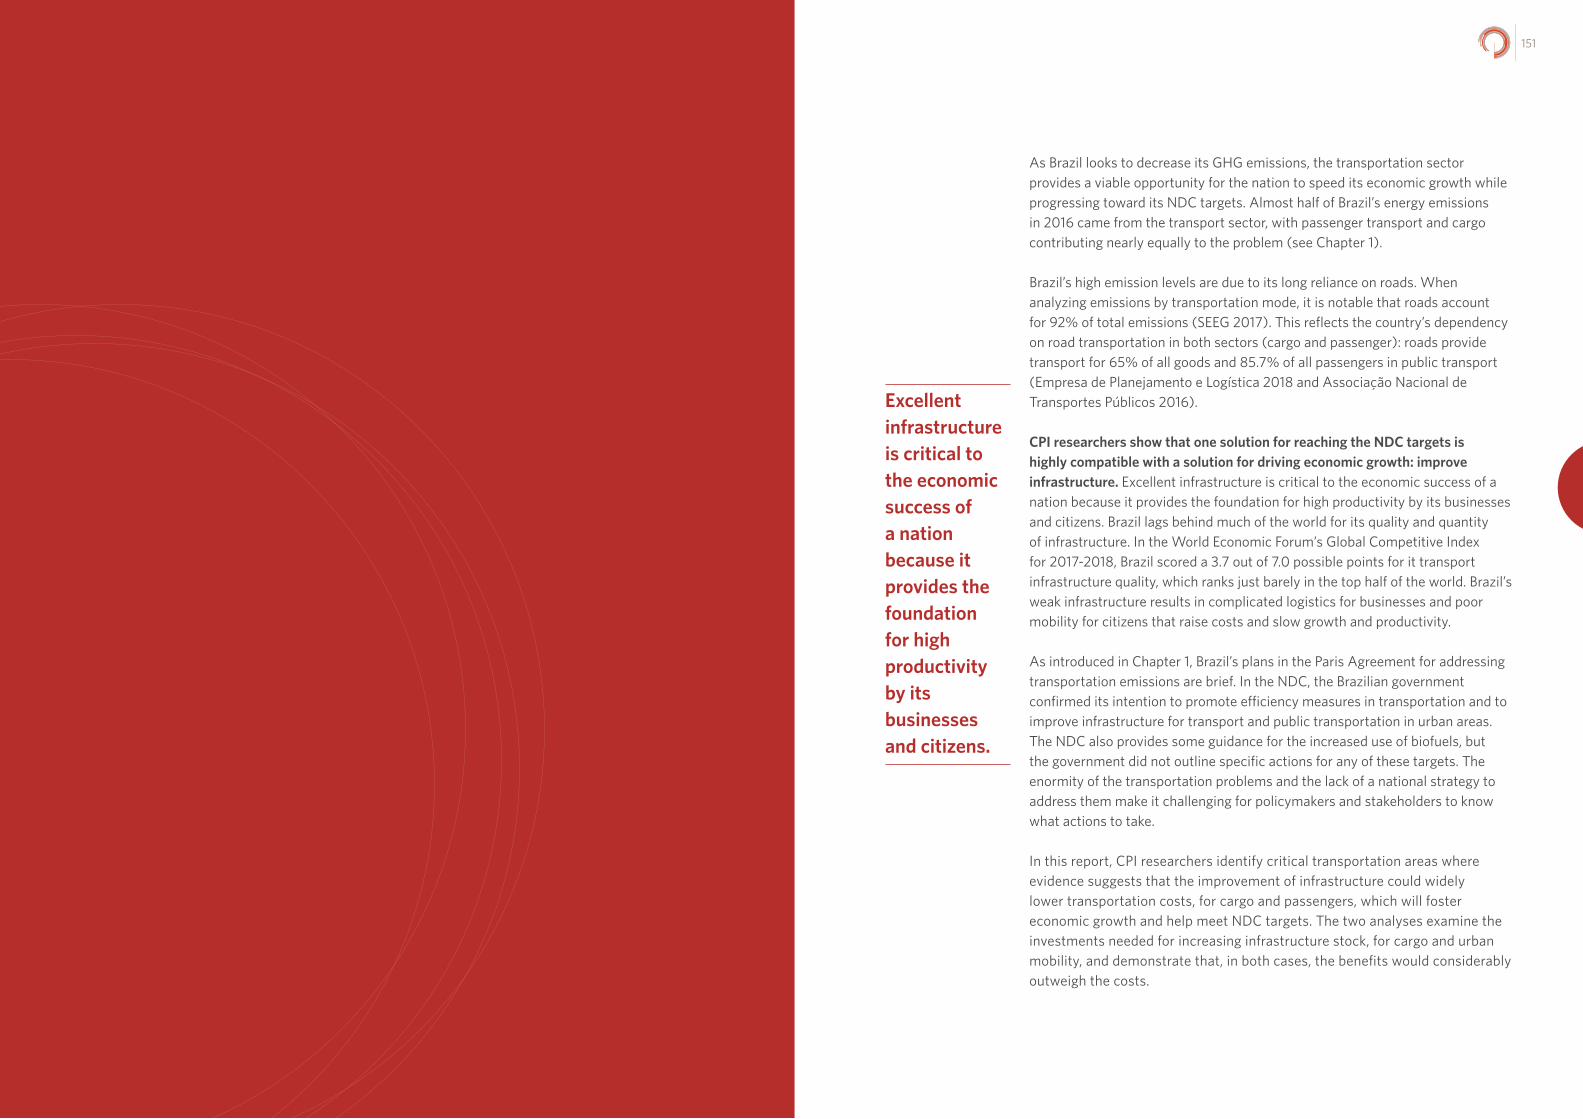
151150
As Brazil looks to decrease its GHG emissions, the transportation sector provides a viable opportunity for the nation to speed its economic growth while progressing toward its NDC targets. Almost half of Brazil’s energy emissions in 2016 came from the transport sector, with passenger transport and cargo contributing nearly equally to the problem (see Chapter 1).
Brazil’s high emission levels are due to its long reliance on roads. When analyzing emissions by transportation mode, it is notable that roads account for 92% of total emissions (SEEG 2017). This reflects the country’s dependency on road transportation in both sectors (cargo and passenger): roads provide transport for 65% of all goods and 85.7% of all passengers in public transport (Empresa de Planejamento e Logística 2018 and Associação Nacional de Transportes Públicos 2016).
CPI researchers show that one solution for reaching the NDC targets is highly compatible with a solution for driving economic growth: improve infrastructure. Excellent infrastructure is critical to the economic success of a nation because it provides the foundation for high productivity by its businesses and citizens. Brazil lags behind much of the world for its quality and quantity of infrastructure. In the World Economic Forum’s Global Competitive Index for 2017-2018, Brazil scored a 3.7 out of 7.0 possible points for it transport infrastructure quality, which ranks just barely in the top half of the world. Brazil’s weak infrastructure results in complicated logistics for businesses and poor mobility for citizens that raise costs and slow growth and productivity.
As introduced in Chapter 1, Brazil’s plans in the Paris Agreement for addressing transportation emissions are brief. In the NDC, the Brazilian government confirmed its intention to promote efficiency measures in transportation and to improve infrastructure for transport and public transportation in urban areas. The NDC also provides some guidance for the increased use of biofuels, but the government did not outline specific actions for any of these targets. The enormity of the transportation problems and the lack of a national strategy to address them make it challenging for policymakers and stakeholders to know what actions to take.
In this report, CPI researchers identify critical transportation areas where evidence suggests that the improvement of infrastructure could widely lower transportation costs, for cargo and passengers, which will foster economic growth and help meet NDC targets. The two analyses examine the investments needed for increasing infrastructure stock, for cargo and urban mobility, and demonstrate that, in both cases, the benefits would considerably outweigh the costs.
Excellent infrastructure is critical to the economic success of a nation because it provides the foundation for high productivity by its businesses and citizens.

153152
Specifically, CPI researchers found that, in 2017 GDP terms, the investment costs for building new infrastructure for cargo transportation represent a one-time investment of 1.93%, while the financial benefits represent 0.8% of GDP per year (Empresa de Planejamento e Logística 2018). Consequently, in three years the benefits of the investment will outweigh the costs. Similarly, in 2014, the Brazilian Development Bank (BNDES) estimated the cost for addressing urban mobility infrastructure needs to be R$234 billion or 4.8% of the 2014 GDP (Santos et al. 2015).1 To address this, BNDES recommended a targeted investment of 0.4% GDP investment per year for 12 years. BNDES’s urban mobility infrastructure investment recommendation, while seemingly large on its face, in reality totals only 20% of the costs that Brazilian citizens lose annually in time commuting.
In both analyses, total benefits of the investment are expected to be higher than estimated because environmental improvements due to emission gains and citizen welfare gains, among other benefits, are not included.
BRAZIL’S INFRASTRUCTURE TODAY
The Global Competitiveness Index 2017-2018 shows that, among 137 countries, Brazil ranks 65th in transportation infrastructure and 108th in the quality of overall transportation infrastructure2. Brazil’s poor competitiveness is due, among other factors, to the country’s underinvestment in overall infrastructure. During the period 2008 to 2013, Brazil invested only 2.5% of its GDP in infrastructure, which is below the world’s average. Since the investment needed to compensate the depreciation rate is 3% (Frischtak and Davies 2014), the stock and quality of the infrastructure are expected to deteriorate. More importantly, according to the McKinsey Global Institute Analysis (2016), when compared with countries with similar GDP per capita, Brazil stands out as an underperformer. China and India outperform relative to their income levels while Brazil’s infrastructure falls into the “worse-than-expected” ranking.
Raiser et al. (2017) estimated a 1.91% GDP transport infrastructure investment gap for the 2015-2025 period. Brazil has invested less than a third of what is required in this area in recent years, with investment dropping to just 0.54% of GDP in 2015. Between 2006 and 2015, the investment in transport was close to US$118 billion at 2015 prices. The requirements for the next ten years add to US$352 billion implying an increase of US$235 billion over historical levels.
This transportation investment gap translates into an overdependence on roads, high transportation costs, and high emissions level. In cargo, the insufficient provision of the transportation infrastructure results in lower quantities of goods shipped, poor quality of logistics, and an inefficient transportation mode matrix. In urban mobility, the insufficient provision of public transportation services results in more congestion, higher pollution, and longer commuting times. In the face of these costs, CPI’s analyses show that improving infrastructure can have profound positive impacts on Brazil’s economy and the environment.
1 The applied methodology can be summarized in three stages. First, the need for urban mobility infrastructure was estimated for a group of 15 metropolitan regions. The necessary infrastructure was determined according to two principles: the adequate mode (e.g. subway, BRT, VLT) was determined according to the population density and the necessary infrastructure to secure a 1.2 Km distance between stations was estimated. Second, the existing infrastructure and ongoing investments were subtracted, reaching the infrastructure deficit, estimated in kilometers and distributed through transportation modes and by metropolitan region. Finally, a cost matrix was applied to the deficit found, making it possible to estimate the demand for investments in mo-bility infrastructure.
2 The index includes transportation, power, and telecom infrastructure.
HOW REDUCING BRAZIL’S HIGH LOGISTICS COSTS FOR CARGO CAN PROMOTE ECONOMIC GROWTH
Due to Brazil’s vast geographical area, cargo transport plays a critical role as an economic engine for the nation. A well-developed infrastructure allows businesses to move cargo efficiently and at the lowest costs possible. Excellent logistics are vital for increasing the competitiveness of companies and enhancing the well-being of the population through more affordable access to goods. Despite the essential role that logistics play in Brazil’s development, Brazil has remarkably high logistic costs. The nation’s costs for cargo transport, warehousing, inventories, and administration run much higher than those of other countries. Brazilian firms spend 11.7% of revenue on logistics costs while United States firms spend just 8% (Empresa de Planejamento e Logística 2018).
Transportation bottlenecks impose a very high cost on agricultural production, competitiveness, and exports generally. A previous CPI analysis3 shows that transporting a ton of soybeans from one of Brazil’s leading soybean production municipalities to its point of export is almost three times as expensive as it is to transport the same amount of soybeans over a similar distance in the United States.
Figure 8.1 illustrates how poor transport infrastructure drives logistics costs higher for Brazil’s businesses and agricultural producers. The map portrays the actual and optimal routes for grain transported from Cuiabá, one of Brazil’s leading soybean production municipalities, to Santarém, the optimal point of export.
3 Climate Policy Initiative. 2013. Production and protection: A First Look at Key Challenges in Brazil. CPI Report.

155154
Due to the poorly paved Cuiabá-Santarém Highway, producers must seek alternative routes to get their soybeans to market. They have two less-than-ideal choices. First, they can take a much longer route – almost double in length – to reach the Santarém port in the north. This port is attractive because it is cheaper and closer to foreign consumer markets. Or, they can take a shorter (and good quality route) to reach the eighteen times more expensive Santos port in the south. Either way, as already mentioned, to carry the same amount of soybeans over a similar distance is almost three times more expensive in Brazil than in the United States.
Figure 8.1: Cuiabá’s Road Routes to Santarém and Santos Ports
THREE DRIVERS OF BRAZIL’S HIGH LOGISTICS COSTS
There are three significant problems with Brazil’s transport infrastructure that drive up cargo and transportation costs: an overdependence on roadways, a comparatively low quantity of built infrastructure, and poor overall quality of infrastructure.
OVERDEPENDENCE ON ROADWAYS
Brazil’s cargo transportation matrix is unevenly structured; roads account for 65% of all transport (Figure 8.2). This dependency on road transport has two detrimental effects on the country: higher environmental costs and higher monetary costs. This over-reliance on roads – while railways are comparatively underutilized at 15%– means there is an opportunity for Brazil to benefit from transitioning more of its cargo transport to rail. Road CO2 emissions per TKU (tons per kilometer) are seven times higher than rail,4 and, according to ILOS estimates for Brazil 2016, road costs are more than five times those of rail.5
When comparing Brazil’s transport matrix with other countries with similar characteristics, this pattern of over-reliance on roads versus railways is evident. Brazil has the highest share of cargo transportation by roads and the lowest by rail (Figure 8.3).
Figure 8.2: Brazil’s Cargo Transportation by Mode Type, 2015
Source: Empresa de Planejamento e Logística S.A., 2015
4 Calculations based on Sistema de Estimativas de Emissões de Gases de Efeito Estufa 2016 and Empresa de Planejamento e logística S.A. 2015.
5 Road: R$353/thousand TKU. Rail: R$62/thousand TKU. (http://www.ilos.com.br/web/custos-logisticos-no-brasil/).
Santos Port
Cuiabá x Santos
Vessel berthing rate
18 times greater than Santarém
Santarém Port
Main destination for grain export, but more expensive
Closer to foreign consumer markets such as the United States and Europe
Good road infrastructureCuiabá x Santarém Highway (BR-163)
Poorly paved
Cuiabá x Santarém
Adequate road infrastructure would reduce transportation costs by
54%
But forces trucks to travel
3,000 km
Cuiabá
Santos
Santarém
1,600 km
1,700 km3,000 km
Available route generally used
Source: Climate Policy Initiative, 2013
This figure reveals the type of logistical challenges Brazilian businesses face daily and illustrates the three elements that explain Brazil’s high transport costs, which are discussed in the next section.
65%15%
11%
5%4%
Airway
Pipeline
Waterway
Coastal Navigation
Rail
Road
65%15%
11%
5%4%
Airway
Pipeline
Waterway
Coastal Navigation
Rail
Road
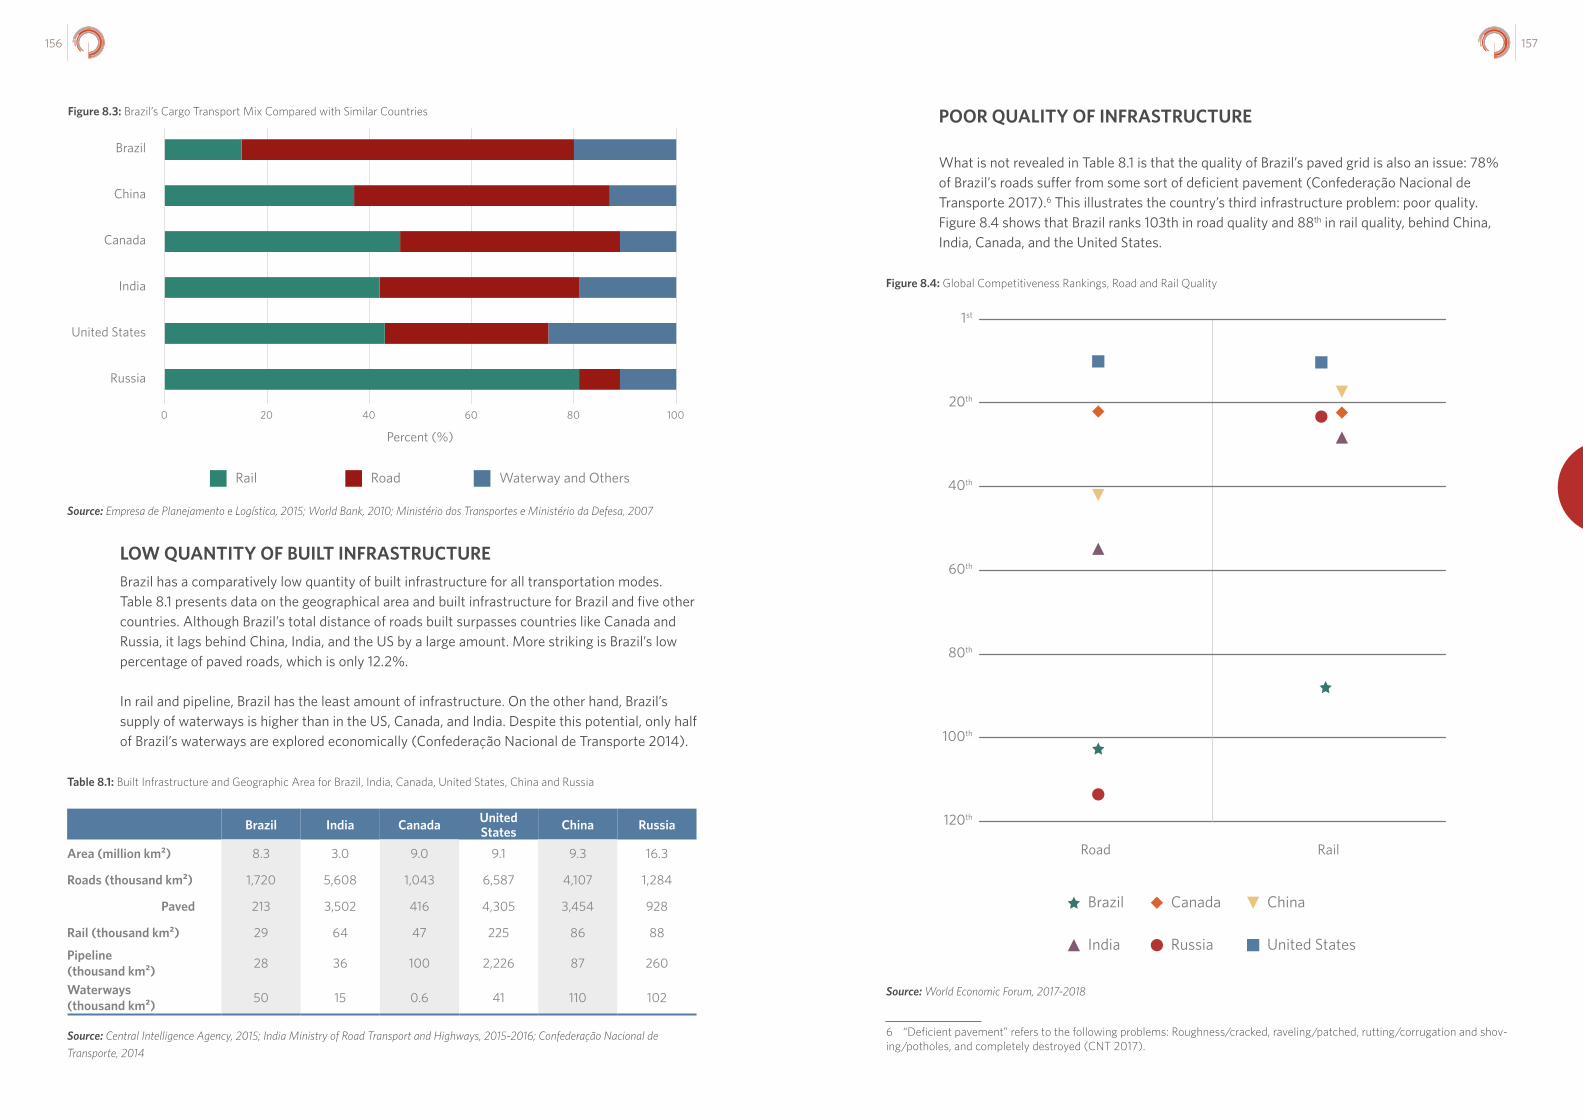
157156
Figure 8.3: Brazil’s Cargo Transport Mix Compared with Similar Countries POOR QUALITY OF INFRASTRUCTURE
What is not revealed in Table 8.1 is that the quality of Brazil’s paved grid is also an issue: 78% of Brazil’s roads suffer from some sort of deficient pavement (Confederação Nacional de Transporte 2017).6 This illustrates the country’s third infrastructure problem: poor quality. Figure 8.4 shows that Brazil ranks 103th in road quality and 88th in rail quality, behind China, India, Canada, and the United States.
Figure 8.4: Global Competitiveness Rankings, Road and Rail Quality
Source: World Economic Forum, 2017-2018
6 “Deficient pavement” refers to the following problems: Roughness/cracked, raveling/patched, rutting/corrugation and shov-ing/potholes, and completely destroyed (CNT 2017).
Source: Empresa de Planejamento e Logística, 2015; World Bank, 2010; Ministério dos Transportes e Ministério da Defesa, 2007
LOW QUANTITY OF BUILT INFRASTRUCTUREBrazil has a comparatively low quantity of built infrastructure for all transportation modes. Table 8.1 presents data on the geographical area and built infrastructure for Brazil and five other countries. Although Brazil’s total distance of roads built surpasses countries like Canada and Russia, it lags behind China, India, and the US by a large amount. More striking is Brazil’s low percentage of paved roads, which is only 12.2%.
In rail and pipeline, Brazil has the least amount of infrastructure. On the other hand, Brazil’s supply of waterways is higher than in the US, Canada, and India. Despite this potential, only half of Brazil’s waterways are explored economically (Confederação Nacional de Transporte 2014).
Table 8.1: Built Infrastructure and Geographic Area for Brazil, India, Canada, United States, China and Russia
Brazil India Canada United States China Russia
Area (million km²) 8.3 3.0 9.0 9.1 9.3 16.3
Roads (thousand km²) 1,720 5,608 1,043 6,587 4,107 1,284
Paved 213 3,502 416 4,305 3,454 928
Rail (thousand km²) 29 64 47 225 86 88
Pipeline (thousand km²) 28 36 100 2,226 87 260
Waterways (thousand km²) 50 15 0.6 41 110 102
Source: Central Intelligence Agency, 2015; India Ministry of Road Transport and Highways, 2015-2016; Confederação Nacional de Transporte, 2014
RoadRail Waterway and Others
0 20 40 60 80 100
Russia
Percent (%)
United States
India
Canada
China
Brazil
Rail
120th
100th
80th
60th
40th
20th
1st
Road
China
India
Brazil
Russia
Canada
United States
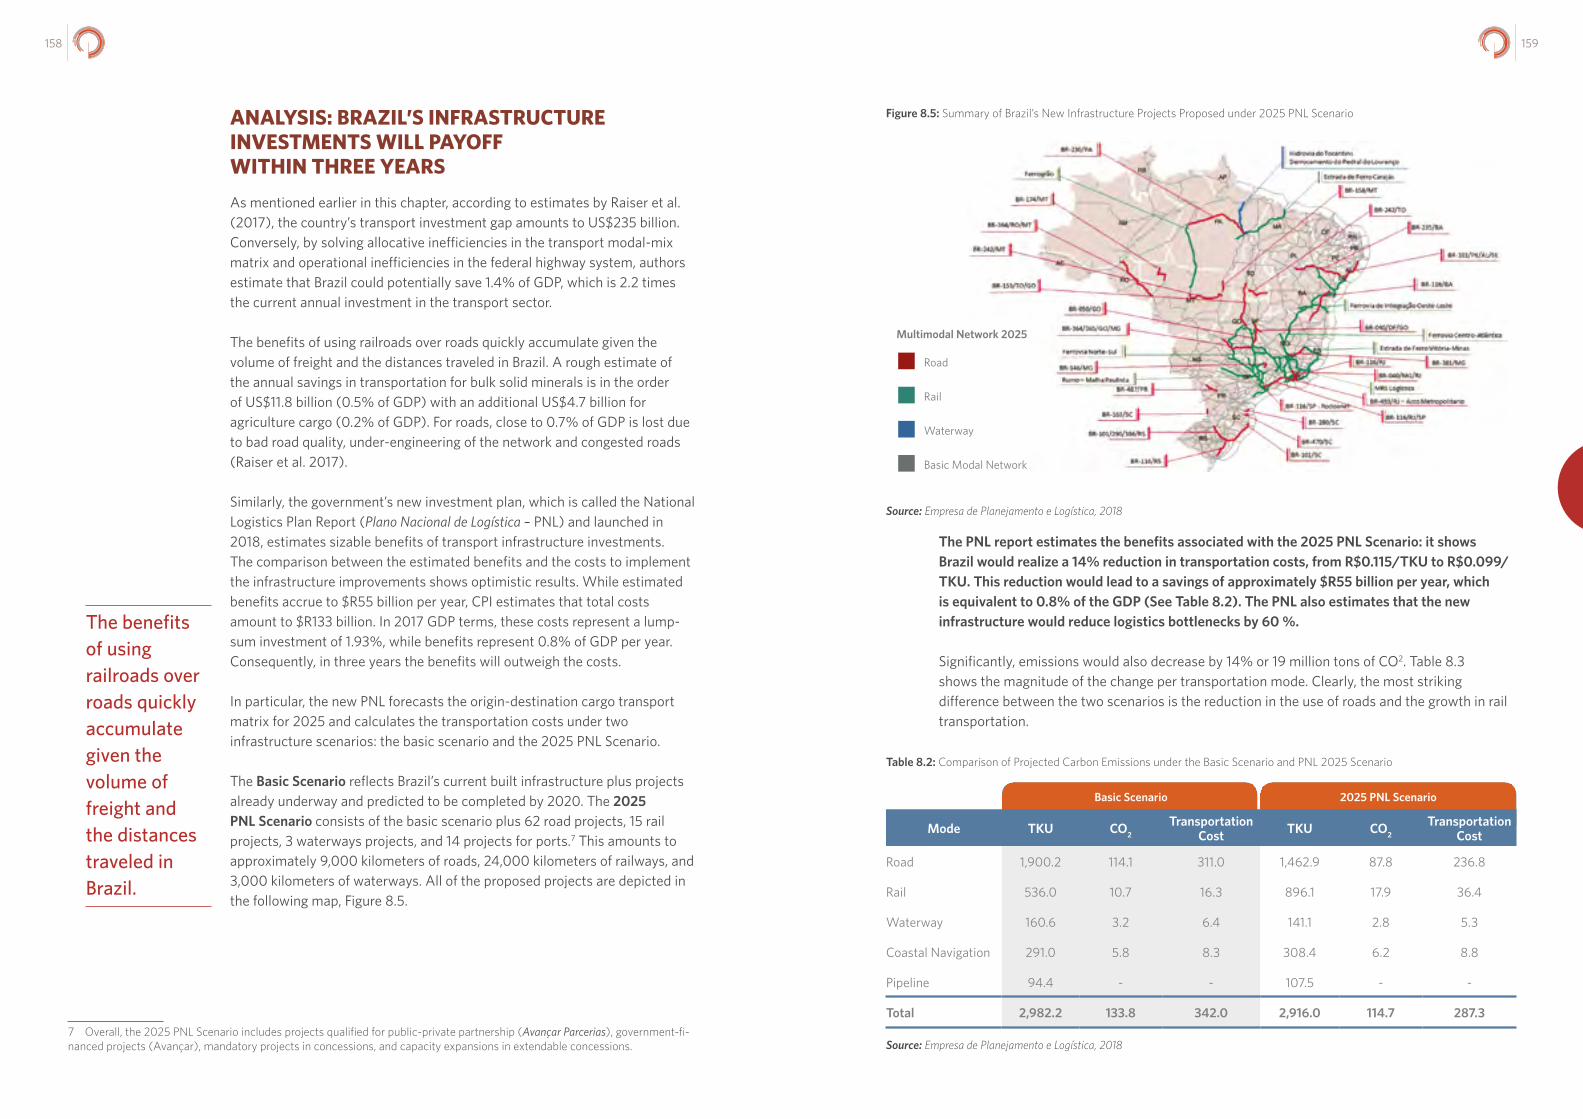
159158
ANALYSIS: BRAZIL’S INFRASTRUCTURE INVESTMENTS WILL PAYOFF WITHIN THREE YEARSAs mentioned earlier in this chapter, according to estimates by Raiser et al. (2017), the country’s transport investment gap amounts to US$235 billion. Conversely, by solving allocative inefficiencies in the transport modal-mix matrix and operational inefficiencies in the federal highway system, authors estimate that Brazil could potentially save 1.4% of GDP, which is 2.2 times the current annual investment in the transport sector.
The benefits of using railroads over roads quickly accumulate given the volume of freight and the distances traveled in Brazil. A rough estimate of the annual savings in transportation for bulk solid minerals is in the order of US$11.8 billion (0.5% of GDP) with an additional US$4.7 billion for agriculture cargo (0.2% of GDP). For roads, close to 0.7% of GDP is lost due to bad road quality, under-engineering of the network and congested roads (Raiser et al. 2017).
Similarly, the government’s new investment plan, which is called the National Logistics Plan Report (Plano Nacional de Logística – PNL) and launched in 2018, estimates sizable benefits of transport infrastructure investments. The comparison between the estimated benefits and the costs to implement the infrastructure improvements shows optimistic results. While estimated benefits accrue to $R55 billion per year, CPI estimates that total costs amount to $R133 billion. In 2017 GDP terms, these costs represent a lump-sum investment of 1.93%, while benefits represent 0.8% of GDP per year. Consequently, in three years the benefits will outweigh the costs.
In particular, the new PNL forecasts the origin-destination cargo transport matrix for 2025 and calculates the transportation costs under two infrastructure scenarios: the basic scenario and the 2025 PNL Scenario.
The Basic Scenario reflects Brazil’s current built infrastructure plus projects already underway and predicted to be completed by 2020. The 2025 PNL Scenario consists of the basic scenario plus 62 road projects, 15 rail projects, 3 waterways projects, and 14 projects for ports.7 This amounts to approximately 9,000 kilometers of roads, 24,000 kilometers of railways, and 3,000 kilometers of waterways. All of the proposed projects are depicted in the following map, Figure 8.5.
7 Overall, the 2025 PNL Scenario includes projects qualified for public-private partnership (Avançar Parcerias), government-fi-nanced projects (Avançar), mandatory projects in concessions, and capacity expansions in extendable concessions.
Figure 8.5: Summary of Brazil’s New Infrastructure Projects Proposed under 2025 PNL Scenario
The benefits of using railroads over roads quickly accumulate given the volume of freight and the distances traveled in Brazil.
Basic Modal Network
Waterway
Rail
Road
Multimodal Network 2025
Source: Empresa de Planejamento e Logística, 2018
The PNL report estimates the benefits associated with the 2025 PNL Scenario: it shows Brazil would realize a 14% reduction in transportation costs, from R$0.115/TKU to R$0.099/TKU. This reduction would lead to a savings of approximately $R55 billion per year, which is equivalent to 0.8% of the GDP (See Table 8.2). The PNL also estimates that the new infrastructure would reduce logistics bottlenecks by 60 %.
Significantly, emissions would also decrease by 14% or 19 million tons of CO2. Table 8.3 shows the magnitude of the change per transportation mode. Clearly, the most striking difference between the two scenarios is the reduction in the use of roads and the growth in rail transportation.
Table 8.2: Comparison of Projected Carbon Emissions under the Basic Scenario and PNL 2025 Scenario
Basic Scenario 2025 PNL Scenario
Mode TKU CO2Transportation
Cost TKU CO2Transportation
Cost
Road 1,900.2 114.1 311.0 1,462.9 87.8 236.8
Rail 536.0 10.7 16.3 896.1 17.9 36.4
Waterway 160.6 3.2 6.4 141.1 2.8 5.3
Coastal Navigation 291.0 5.8 8.3 308.4 6.2 8.8
Pipeline 94.4 - - 107.5 - -
Total 2,982.2 133.8 342.0 2,916.0 114.7 287.3
Source: Empresa de Planejamento e Logística, 2018
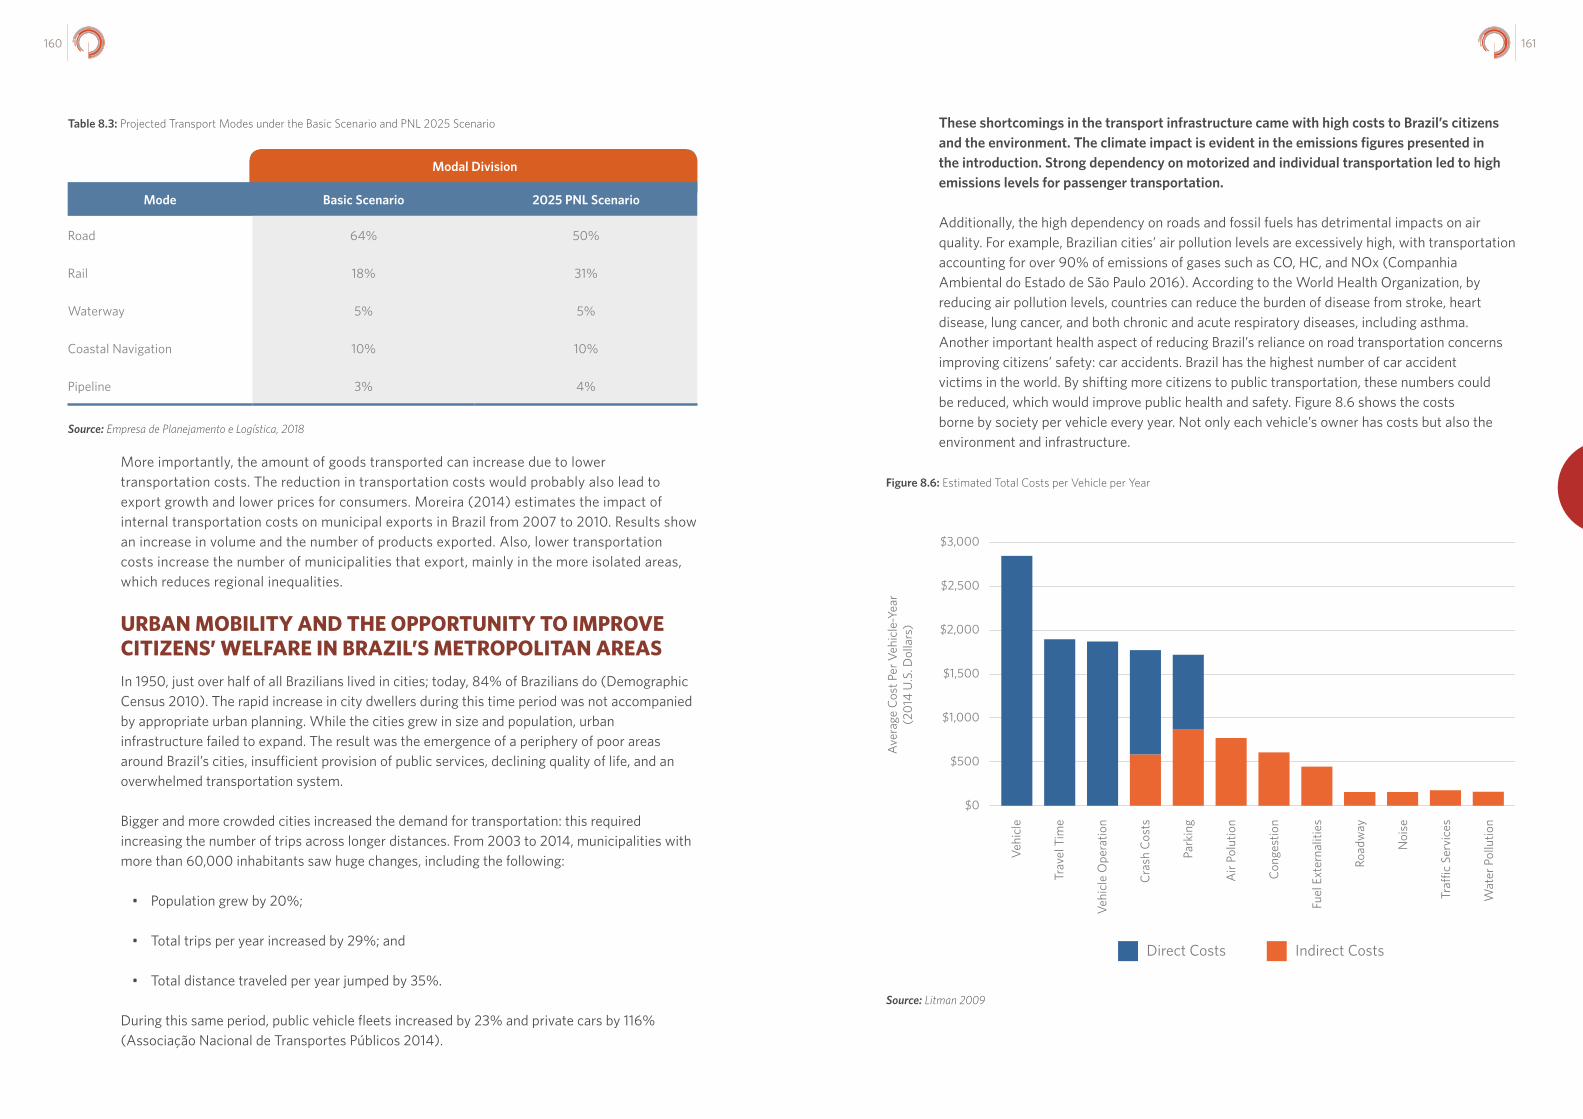
161160
Table 8.3: Projected Transport Modes under the Basic Scenario and PNL 2025 Scenario These shortcomings in the transport infrastructure came with high costs to Brazil’s citizens and the environment. The climate impact is evident in the emissions figures presented in the introduction. Strong dependency on motorized and individual transportation led to high emissions levels for passenger transportation.
Additionally, the high dependency on roads and fossil fuels has detrimental impacts on air quality. For example, Brazilian cities’ air pollution levels are excessively high, with transportation accounting for over 90% of emissions of gases such as CO, HC, and NOx (Companhia Ambiental do Estado de São Paulo 2016). According to the World Health Organization, by reducing air pollution levels, countries can reduce the burden of disease from stroke, heart disease, lung cancer, and both chronic and acute respiratory diseases, including asthma. Another important health aspect of reducing Brazil’s reliance on road transportation concerns improving citizens’ safety: car accidents. Brazil has the highest number of car accident victims in the world. By shifting more citizens to public transportation, these numbers could be reduced, which would improve public health and safety. Figure 8.6 shows the costs borne by society per vehicle every year. Not only each vehicle’s owner has costs but also the environment and infrastructure.
Figure 8.6: Estimated Total Costs per Vehicle per Year
Modal Division
Mode Basic Scenario 2025 PNL Scenario
Road 64% 50%
Rail 18% 31%
Waterway 5% 5%
Coastal Navigation 10% 10%
Pipeline 3% 4%
Source: Empresa de Planejamento e Logística, 2018
More importantly, the amount of goods transported can increase due to lower transportation costs. The reduction in transportation costs would probably also lead to export growth and lower prices for consumers. Moreira (2014) estimates the impact of internal transportation costs on municipal exports in Brazil from 2007 to 2010. Results show an increase in volume and the number of products exported. Also, lower transportation costs increase the number of municipalities that export, mainly in the more isolated areas, which reduces regional inequalities.
URBAN MOBILITY AND THE OPPORTUNITY TO IMPROVE CITIZENS’ WELFARE IN BRAZIL’S METROPOLITAN AREASIn 1950, just over half of all Brazilians lived in cities; today, 84% of Brazilians do (Demographic Census 2010). The rapid increase in city dwellers during this time period was not accompanied by appropriate urban planning. While the cities grew in size and population, urban infrastructure failed to expand. The result was the emergence of a periphery of poor areas around Brazil’s cities, insufficient provision of public services, declining quality of life, and an overwhelmed transportation system.
Bigger and more crowded cities increased the demand for transportation: this required increasing the number of trips across longer distances. From 2003 to 2014, municipalities with more than 60,000 inhabitants saw huge changes, including the following:
• Population grew by 20%;
• Total trips per year increased by 29%; and
• Total distance traveled per year jumped by 35%.
During this same period, public vehicle fleets increased by 23% and private cars by 116% (Associação Nacional de Transportes Públicos 2014).
Vehi
cle
Ope
ratio
n
Cras
h Co
sts
Park
ing
Air
Polu
tion
Cong
estio
n
Fuel
Ext
erna
litie
s
Road
way
Noi
se
Tra�
c Se
rvic
es
Wat
er P
ollu
tion
Vehi
cle
Trav
el T
ime
$3,000
$2,500
$2,000
$1,500
$1,000
$500
$0
Ave
rage
Cos
t Per
Veh
icle
-Yea
r(2
014
U.S
. Dol
lars
)
Direct Costs Indirect Costs
Source: Litman 2009
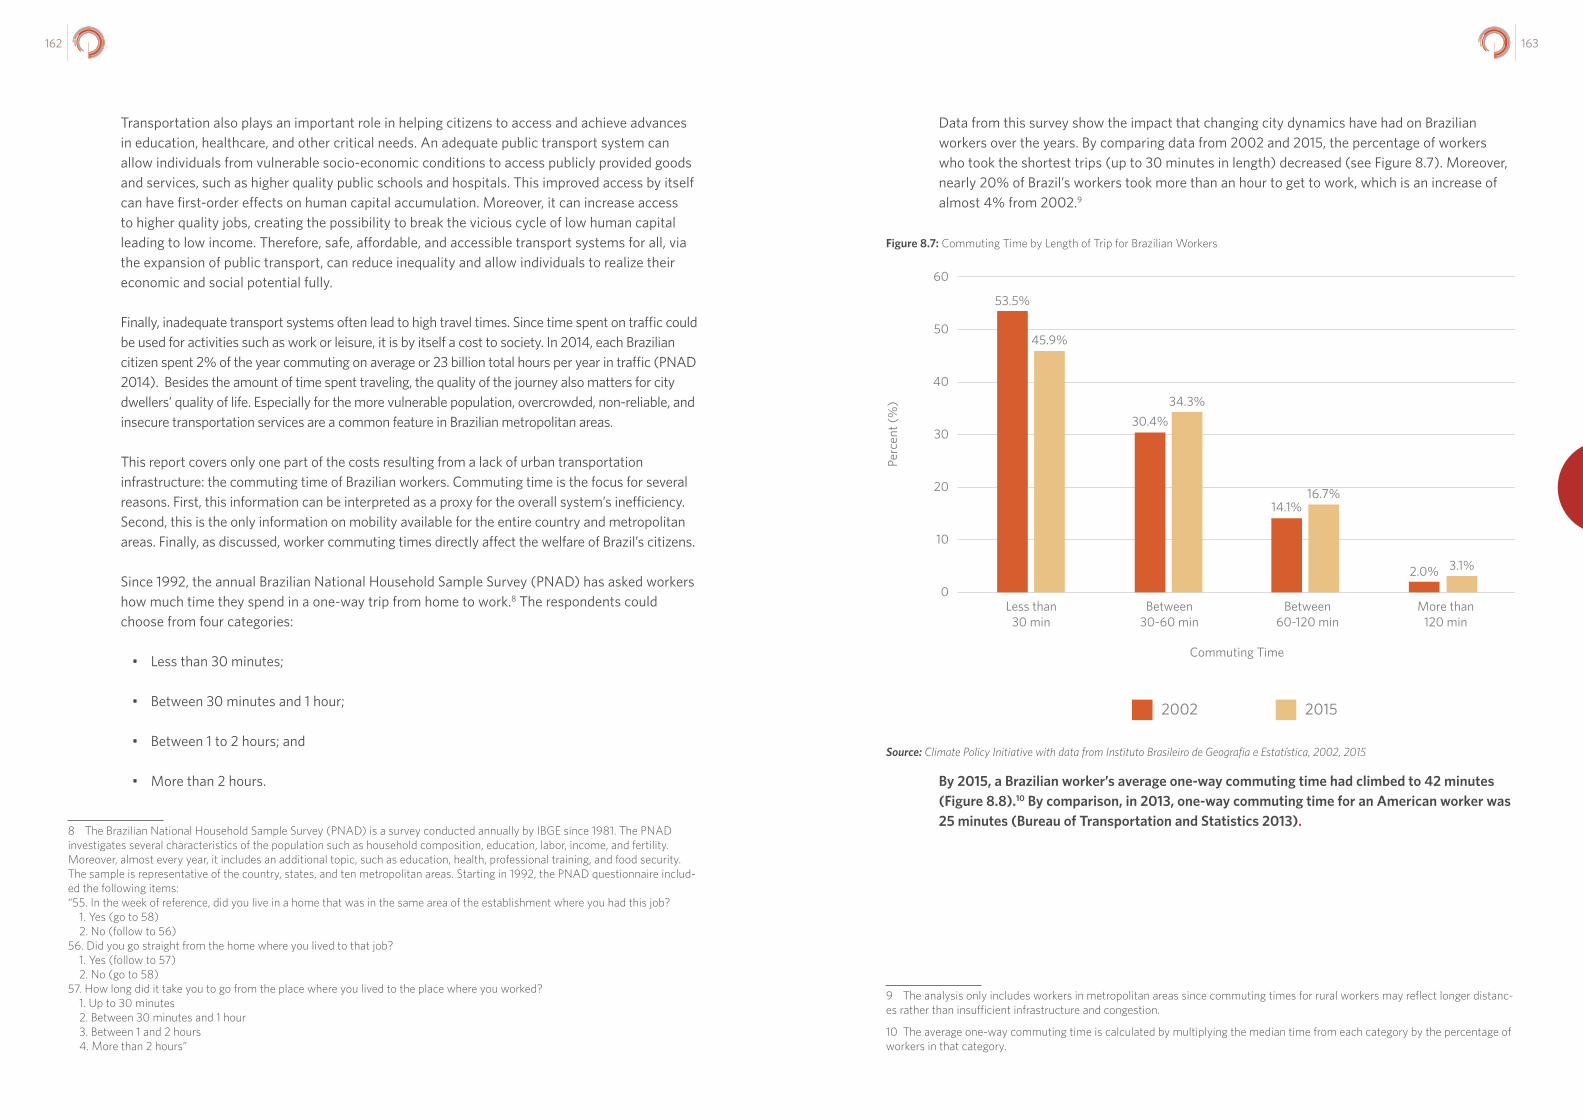
163162
Transportation also plays an important role in helping citizens to access and achieve advances in education, healthcare, and other critical needs. An adequate public transport system can allow individuals from vulnerable socio-economic conditions to access publicly provided goods and services, such as higher quality public schools and hospitals. This improved access by itself can have first-order effects on human capital accumulation. Moreover, it can increase access to higher quality jobs, creating the possibility to break the vicious cycle of low human capital leading to low income. Therefore, safe, affordable, and accessible transport systems for all, via the expansion of public transport, can reduce inequality and allow individuals to realize their economic and social potential fully.
Finally, inadequate transport systems often lead to high travel times. Since time spent on traffic could be used for activities such as work or leisure, it is by itself a cost to society. In 2014, each Brazilian citizen spent 2% of the year commuting on average or 23 billion total hours per year in traffic (PNAD 2014). Besides the amount of time spent traveling, the quality of the journey also matters for city dwellers’ quality of life. Especially for the more vulnerable population, overcrowded, non-reliable, and insecure transportation services are a common feature in Brazilian metropolitan areas.
This report covers only one part of the costs resulting from a lack of urban transportation infrastructure: the commuting time of Brazilian workers. Commuting time is the focus for several reasons. First, this information can be interpreted as a proxy for the overall system’s inefficiency. Second, this is the only information on mobility available for the entire country and metropolitan areas. Finally, as discussed, worker commuting times directly affect the welfare of Brazil’s citizens.
Since 1992, the annual Brazilian National Household Sample Survey (PNAD) has asked workers how much time they spend in a one-way trip from home to work.8 The respondents could choose from four categories:
• Less than 30 minutes;
• Between 30 minutes and 1 hour;
• Between 1 to 2 hours; and
• More than 2 hours.
8 The Brazilian National Household Sample Survey (PNAD) is a survey conducted annually by IBGE since 1981. The PNAD investigates several characteristics of the population such as household composition, education, labor, income, and fertility. Moreover, almost every year, it includes an additional topic, such as education, health, professional training, and food security. The sample is representative of the country, states, and ten metropolitan areas. Starting in 1992, the PNAD questionnaire includ-ed the following items:“55. In the week of reference, did you live in a home that was in the same area of the establishment where you had this job?
1. Yes (go to 58) 2. No (follow to 56)
56. Did you go straight from the home where you lived to that job?1. Yes (follow to 57) 2. No (go to 58)
57. How long did it take you to go from the place where you lived to the place where you worked?1. Up to 30 minutes2. Between 30 minutes and 1 hour3. Between 1 and 2 hours4. More than 2 hours”
Data from this survey show the impact that changing city dynamics have had on Brazilian workers over the years. By comparing data from 2002 and 2015, the percentage of workers who took the shortest trips (up to 30 minutes in length) decreased (see Figure 8.7). Moreover, nearly 20% of Brazil’s workers took more than an hour to get to work, which is an increase of almost 4% from 2002.9
Figure 8.7: Commuting Time by Length of Trip for Brazilian Workers
Source: Climate Policy Initiative with data from Instituto Brasileiro de Geografia e Estatística, 2002, 2015
By 2015, a Brazilian worker’s average one-way commuting time had climbed to 42 minutes (Figure 8.8).10 By comparison, in 2013, one-way commuting time for an American worker was 25 minutes (Bureau of Transportation and Statistics 2013).
9 The analysis only includes workers in metropolitan areas since commuting times for rural workers may reflect longer distanc-es rather than insufficient infrastructure and congestion.
10 The average one-way commuting time is calculated by multiplying the median time from each category by the percentage of workers in that category.
0
10
20
30
40
50
60
Perc
ent (
%)
Commuting Time
2002 2015
53.5%
45.9%
30.4%34.3%
14.1%16.7%
2.0% 3.1%
Less than30 min
Between30-60 min
Between60-120 min
More than120 min
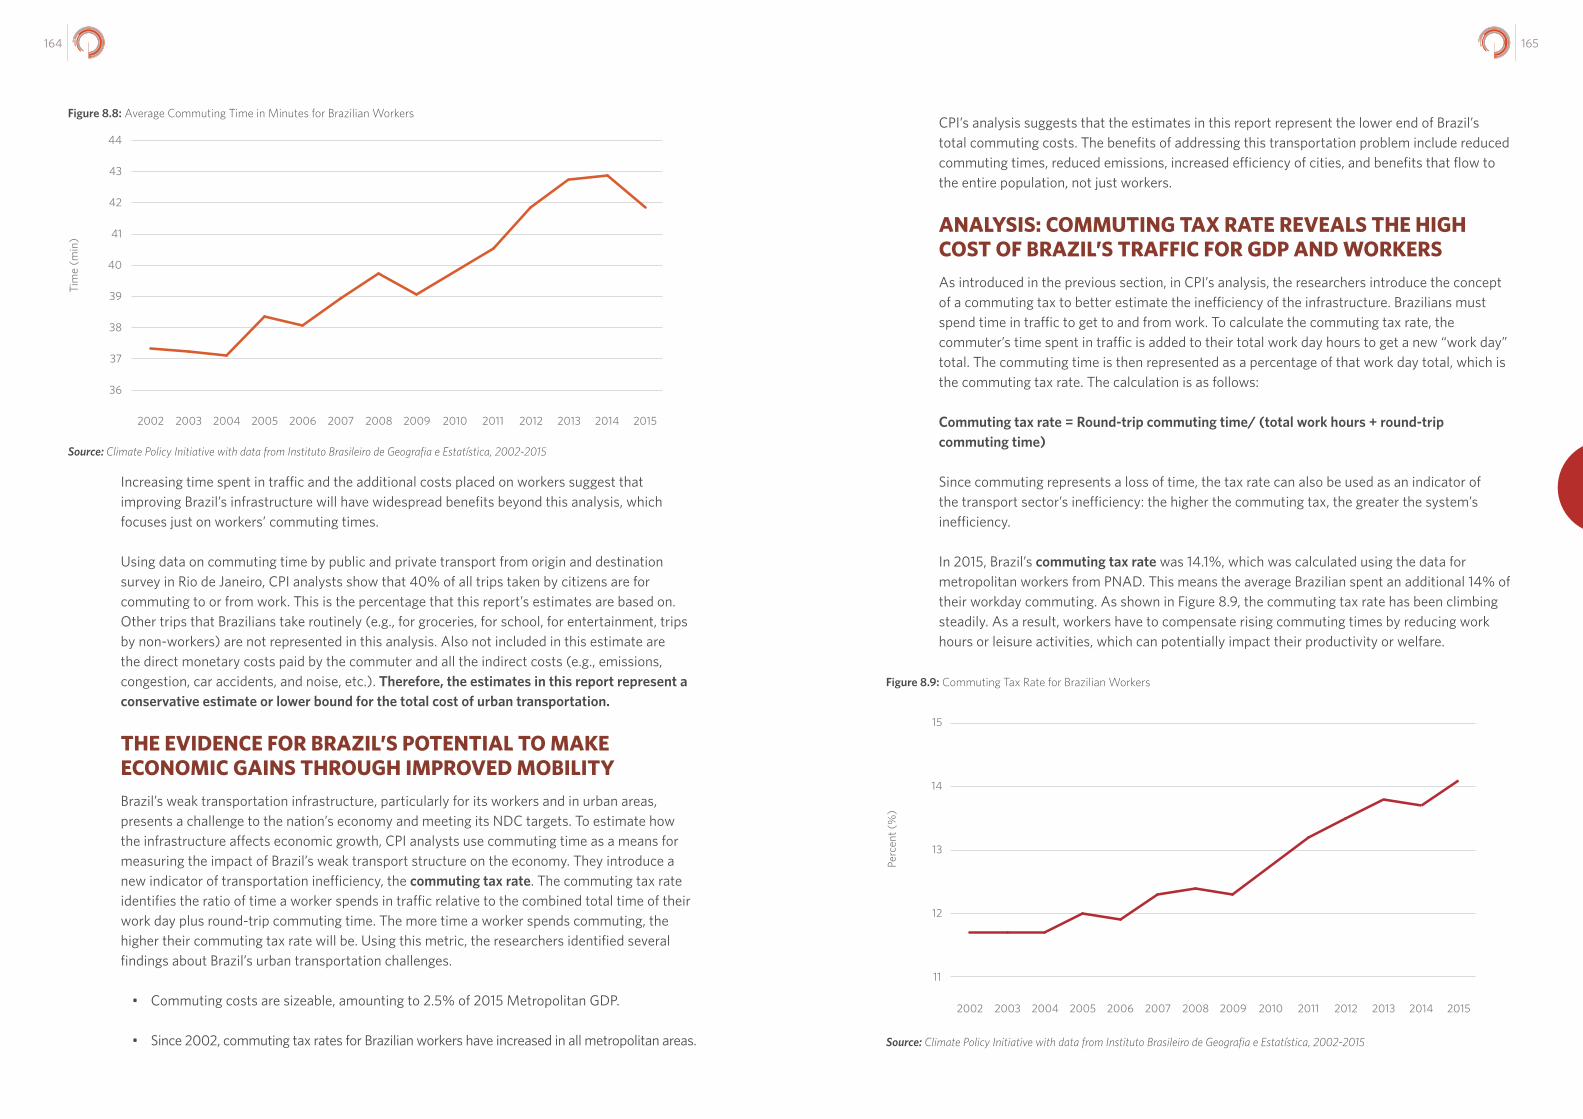
165164
Figure 8.8: Average Commuting Time in Minutes for Brazilian WorkersCPI’s analysis suggests that the estimates in this report represent the lower end of Brazil’s total commuting costs. The benefits of addressing this transportation problem include reduced commuting times, reduced emissions, increased efficiency of cities, and benefits that flow to the entire population, not just workers.
ANALYSIS: COMMUTING TAX RATE REVEALS THE HIGH COST OF BRAZIL’S TRAFFIC FOR GDP AND WORKERS As introduced in the previous section, in CPI’s analysis, the researchers introduce the concept of a commuting tax to better estimate the inefficiency of the infrastructure. Brazilians must spend time in traffic to get to and from work. To calculate the commuting tax rate, the commuter’s time spent in traffic is added to their total work day hours to get a new “work day” total. The commuting time is then represented as a percentage of that work day total, which is the commuting tax rate. The calculation is as follows:
Commuting tax rate = Round-trip commuting time/ (total work hours + round-trip commuting time)
Since commuting represents a loss of time, the tax rate can also be used as an indicator of the transport sector’s inefficiency: the higher the commuting tax, the greater the system’s inefficiency.
In 2015, Brazil’s commuting tax rate was 14.1%, which was calculated using the data for metropolitan workers from PNAD. This means the average Brazilian spent an additional 14% of their workday commuting. As shown in Figure 8.9, the commuting tax rate has been climbing steadily. As a result, workers have to compensate rising commuting times by reducing work hours or leisure activities, which can potentially impact their productivity or welfare.
Figure 8.9: Commuting Tax Rate for Brazilian Workers
2002 2003 2004 2005 2006 2007 2008 2009 2010 2011 2012 2013 2014 2015
36
37
38
39
40
41
42
43
44
Tim
e (m
in)
Source: Climate Policy Initiative with data from Instituto Brasileiro de Geografia e Estatística, 2002-2015
Increasing time spent in traffic and the additional costs placed on workers suggest that improving Brazil’s infrastructure will have widespread benefits beyond this analysis, which focuses just on workers’ commuting times.
Using data on commuting time by public and private transport from origin and destination survey in Rio de Janeiro, CPI analysts show that 40% of all trips taken by citizens are for commuting to or from work. This is the percentage that this report’s estimates are based on. Other trips that Brazilians take routinely (e.g., for groceries, for school, for entertainment, trips by non-workers) are not represented in this analysis. Also not included in this estimate are the direct monetary costs paid by the commuter and all the indirect costs (e.g., emissions, congestion, car accidents, and noise, etc.). Therefore, the estimates in this report represent a conservative estimate or lower bound for the total cost of urban transportation.
THE EVIDENCE FOR BRAZIL’S POTENTIAL TO MAKE ECONOMIC GAINS THROUGH IMPROVED MOBILITYBrazil’s weak transportation infrastructure, particularly for its workers and in urban areas, presents a challenge to the nation’s economy and meeting its NDC targets. To estimate how the infrastructure affects economic growth, CPI analysts use commuting time as a means for measuring the impact of Brazil’s weak transport structure on the economy. They introduce a new indicator of transportation inefficiency, the commuting tax rate. The commuting tax rate identifies the ratio of time a worker spends in traffic relative to the combined total time of their work day plus round-trip commuting time. The more time a worker spends commuting, the higher their commuting tax rate will be. Using this metric, the researchers identified several findings about Brazil’s urban transportation challenges.
• Commuting costs are sizeable, amounting to 2.5% of 2015 Metropolitan GDP.
• Since 2002, commuting tax rates for Brazilian workers have increased in all metropolitan areas.
12
11
15
14
13
Perc
ent (
%)
2002 2003 2004 2005 2006 2007 2008 2009 2010 2011 2012 2013 2014 2015
Source: Climate Policy Initiative with data from Instituto Brasileiro de Geografia e Estatística, 2002-2015
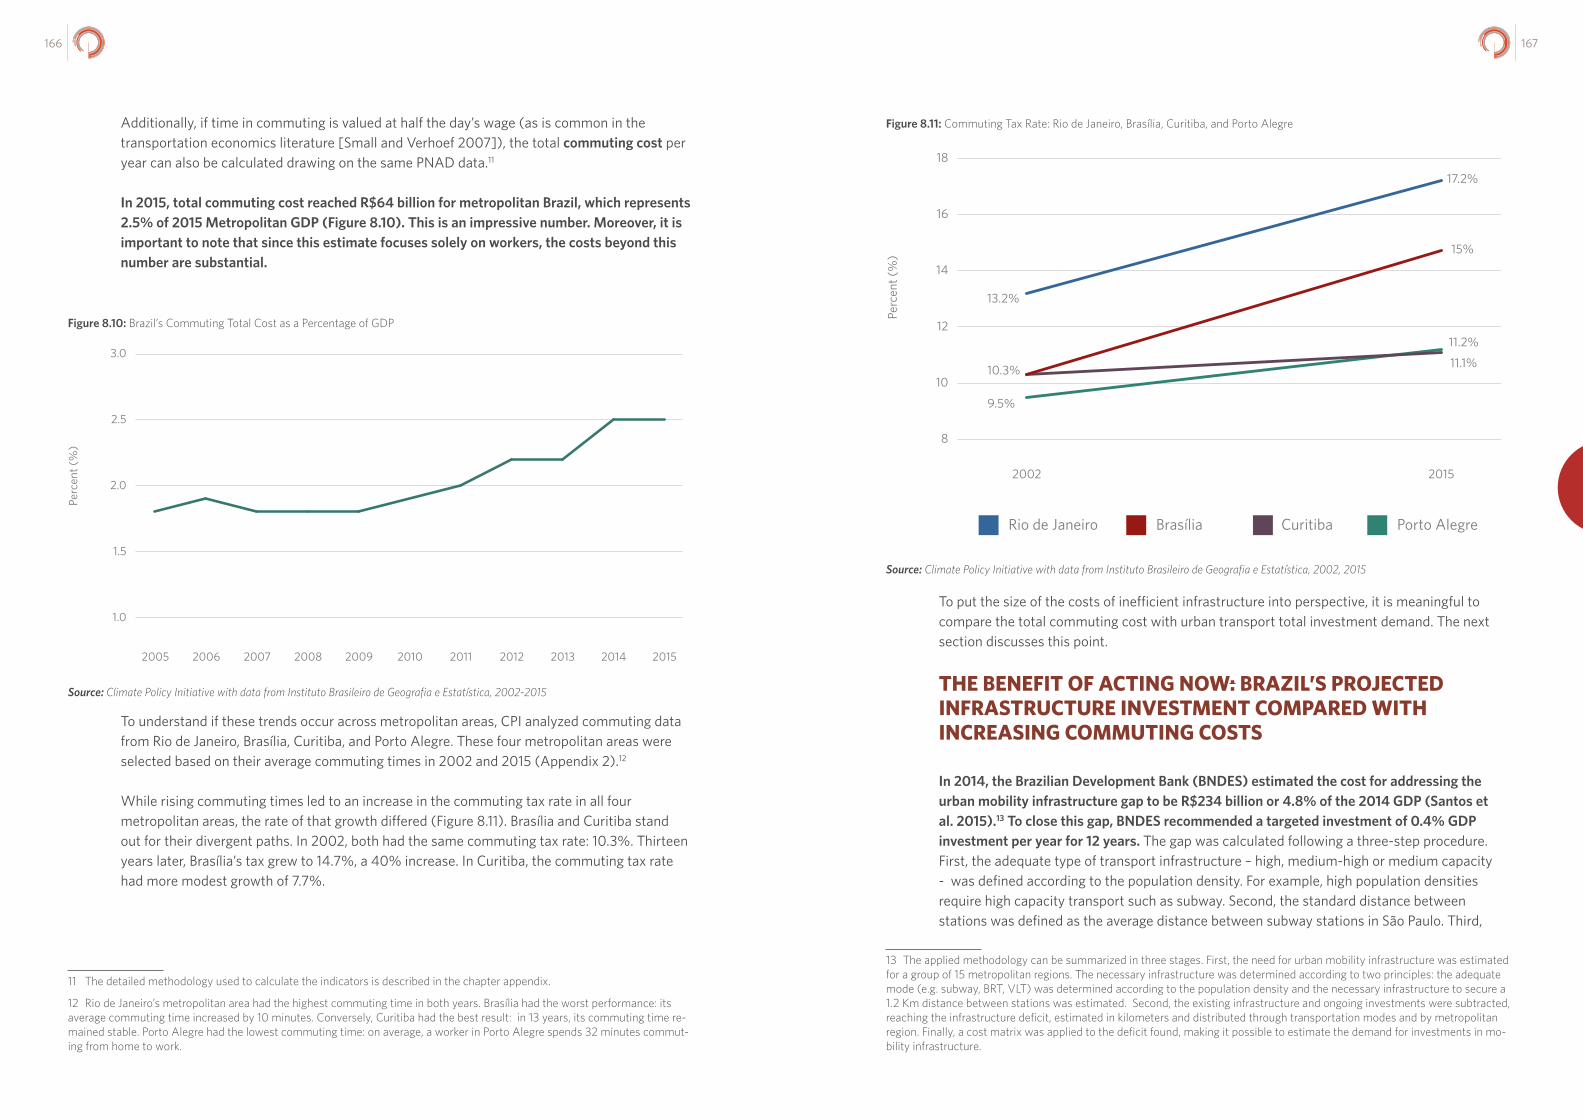
167166
Additionally, if time in commuting is valued at half the day’s wage (as is common in the transportation economics literature [Small and Verhoef 2007]), the total commuting cost per year can also be calculated drawing on the same PNAD data.11
In 2015, total commuting cost reached R$64 billion for metropolitan Brazil, which represents 2.5% of 2015 Metropolitan GDP (Figure 8.10). This is an impressive number. Moreover, it is important to note that since this estimate focuses solely on workers, the costs beyond this number are substantial.
Figure 8.10: Brazil’s Commuting Total Cost as a Percentage of GDP
Source: Climate Policy Initiative with data from Instituto Brasileiro de Geografia e Estatística, 2002-2015
To understand if these trends occur across metropolitan areas, CPI analyzed commuting data from Rio de Janeiro, Brasília, Curitiba, and Porto Alegre. These four metropolitan areas were selected based on their average commuting times in 2002 and 2015 (Appendix 2).12
While rising commuting times led to an increase in the commuting tax rate in all four metropolitan areas, the rate of that growth differed (Figure 8.11). Brasília and Curitiba stand out for their divergent paths. In 2002, both had the same commuting tax rate: 10.3%. Thirteen years later, Brasília’s tax grew to 14.7%, a 40% increase. In Curitiba, the commuting tax rate had more modest growth of 7.7%.
11 The detailed methodology used to calculate the indicators is described in the chapter appendix.
12 Rio de Janeiro’s metropolitan area had the highest commuting time in both years. Brasília had the worst performance: its average commuting time increased by 10 minutes. Conversely, Curitiba had the best result: in 13 years, its commuting time re-mained stable. Porto Alegre had the lowest commuting time: on average, a worker in Porto Alegre spends 32 minutes commut-ing from home to work.
Figure 8.11: Commuting Tax Rate: Rio de Janeiro, Brasília, Curitiba, and Porto Alegre
2.0
1.0
1.5
3.0
2.5
Perc
ent (
%)
2005 2006 2007 2008 2009 2010 2011 2012 2013 2014 2015
Curitiba Porto AlegreRio de Janeiro Brasília
2002 2015
10
8
14
12
16
18
Perc
ent (
%)
13.2%
17.2%
15%
11.2%
11.1%10.3%
9.5%
Source: Climate Policy Initiative with data from Instituto Brasileiro de Geografia e Estatística, 2002, 2015
To put the size of the costs of inefficient infrastructure into perspective, it is meaningful to compare the total commuting cost with urban transport total investment demand. The next section discusses this point.
THE BENEFIT OF ACTING NOW: BRAZIL’S PROJECTED INFRASTRUCTURE INVESTMENT COMPARED WITH INCREASING COMMUTING COSTS
In 2014, the Brazilian Development Bank (BNDES) estimated the cost for addressing the urban mobility infrastructure gap to be R$234 billion or 4.8% of the 2014 GDP (Santos et al. 2015).13 To close this gap, BNDES recommended a targeted investment of 0.4% GDP investment per year for 12 years. The gap was calculated following a three-step procedure. First, the adequate type of transport infrastructure – high, medium-high or medium capacity - was defined according to the population density. For example, high population densities require high capacity transport such as subway. Second, the standard distance between stations was defined as the average distance between subway stations in São Paulo. Third,
13 The applied methodology can be summarized in three stages. First, the need for urban mobility infrastructure was estimated for a group of 15 metropolitan regions. The necessary infrastructure was determined according to two principles: the adequate mode (e.g. subway, BRT, VLT) was determined according to the population density and the necessary infrastructure to secure a 1.2 Km distance between stations was estimated. Second, the existing infrastructure and ongoing investments were subtracted, reaching the infrastructure deficit, estimated in kilometers and distributed through transportation modes and by metropolitan region. Finally, a cost matrix was applied to the deficit found, making it possible to estimate the demand for investments in mo-bility infrastructure.
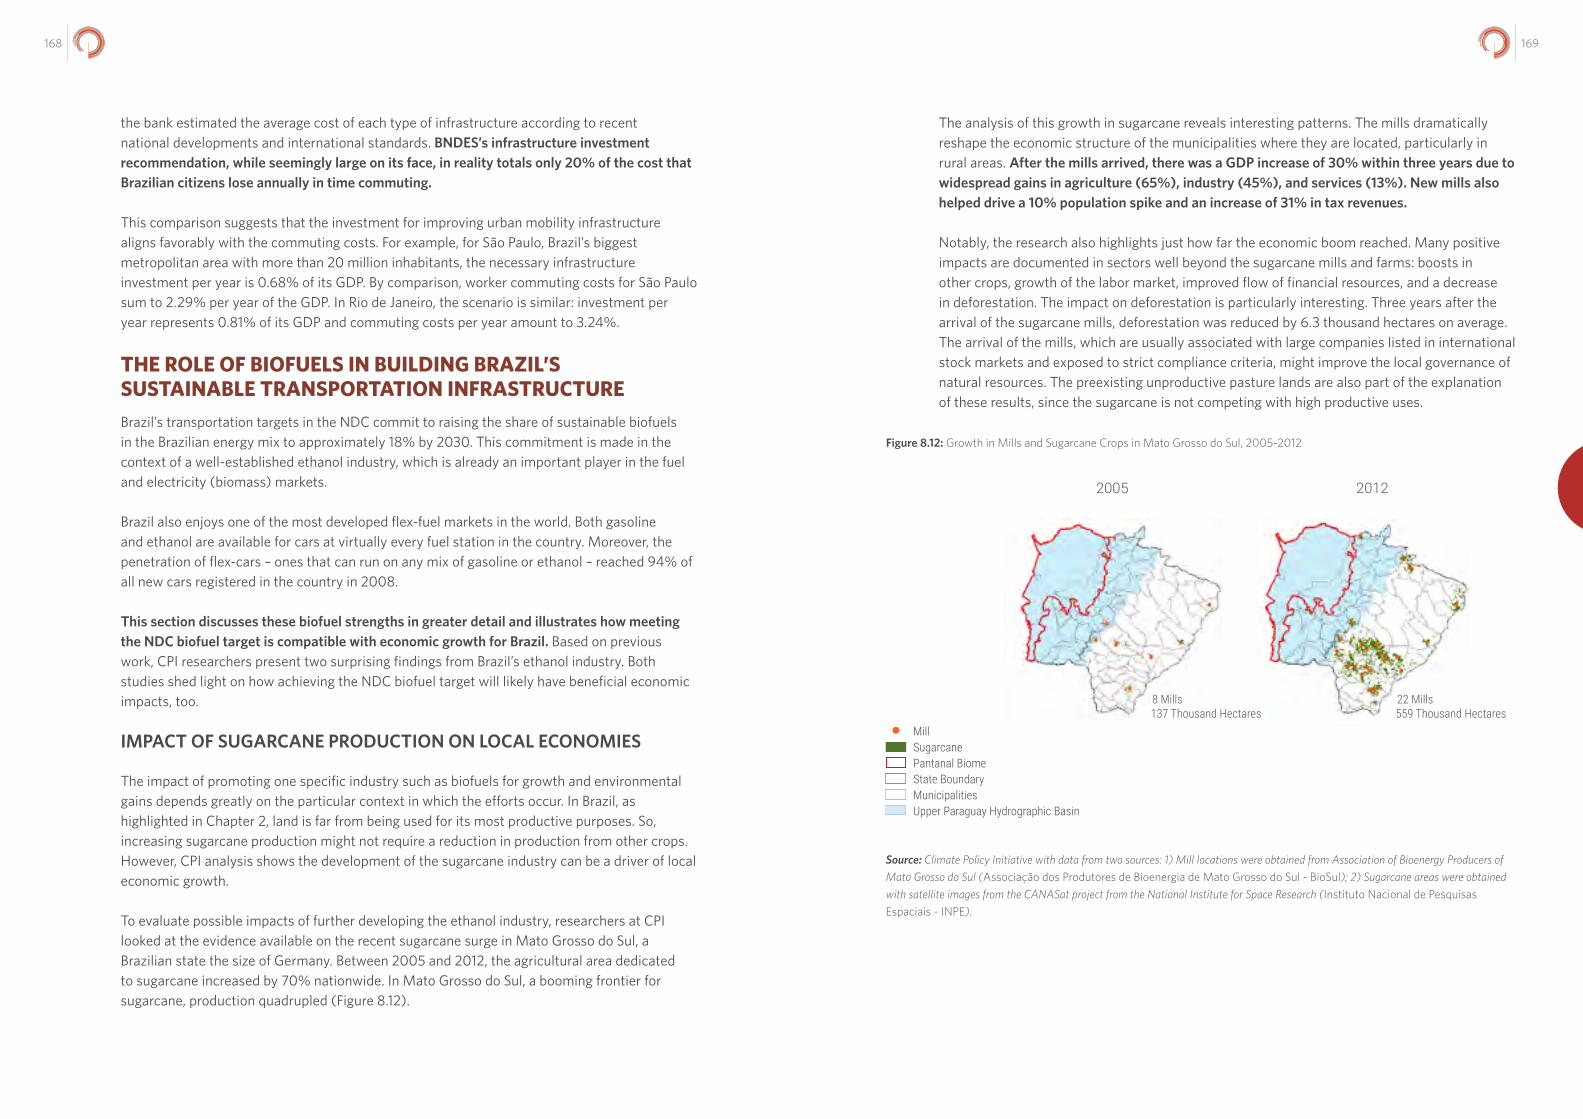
169168
the bank estimated the average cost of each type of infrastructure according to recent national developments and international standards. BNDES’s infrastructure investment recommendation, while seemingly large on its face, in reality totals only 20% of the cost that Brazilian citizens lose annually in time commuting.
This comparison suggests that the investment for improving urban mobility infrastructure aligns favorably with the commuting costs. For example, for São Paulo, Brazil’s biggest metropolitan area with more than 20 million inhabitants, the necessary infrastructure investment per year is 0.68% of its GDP. By comparison, worker commuting costs for São Paulo sum to 2.29% per year of the GDP. In Rio de Janeiro, the scenario is similar: investment per year represents 0.81% of its GDP and commuting costs per year amount to 3.24%.
THE ROLE OF BIOFUELS IN BUILDING BRAZIL’S SUSTAINABLE TRANSPORTATION INFRASTRUCTUREBrazil’s transportation targets in the NDC commit to raising the share of sustainable biofuels in the Brazilian energy mix to approximately 18% by 2030. This commitment is made in the context of a well-established ethanol industry, which is already an important player in the fuel and electricity (biomass) markets.
Brazil also enjoys one of the most developed flex-fuel markets in the world. Both gasoline and ethanol are available for cars at virtually every fuel station in the country. Moreover, the penetration of flex-cars – ones that can run on any mix of gasoline or ethanol – reached 94% of all new cars registered in the country in 2008.
This section discusses these biofuel strengths in greater detail and illustrates how meeting the NDC biofuel target is compatible with economic growth for Brazil. Based on previous work, CPI researchers present two surprising findings from Brazil’s ethanol industry. Both studies shed light on how achieving the NDC biofuel target will likely have beneficial economic impacts, too.
IMPACT OF SUGARCANE PRODUCTION ON LOCAL ECONOMIES
The impact of promoting one specific industry such as biofuels for growth and environmental gains depends greatly on the particular context in which the efforts occur. In Brazil, as highlighted in Chapter 2, land is far from being used for its most productive purposes. So, increasing sugarcane production might not require a reduction in production from other crops. However, CPI analysis shows the development of the sugarcane industry can be a driver of local economic growth.
To evaluate possible impacts of further developing the ethanol industry, researchers at CPI looked at the evidence available on the recent sugarcane surge in Mato Grosso do Sul, a Brazilian state the size of Germany. Between 2005 and 2012, the agricultural area dedicated to sugarcane increased by 70% nationwide. In Mato Grosso do Sul, a booming frontier for sugarcane, production quadrupled (Figure 8.12).
The analysis of this growth in sugarcane reveals interesting patterns. The mills dramatically reshape the economic structure of the municipalities where they are located, particularly in rural areas. After the mills arrived, there was a GDP increase of 30% within three years due to widespread gains in agriculture (65%), industry (45%), and services (13%). New mills also helped drive a 10% population spike and an increase of 31% in tax revenues.
Notably, the research also highlights just how far the economic boom reached. Many positive impacts are documented in sectors well beyond the sugarcane mills and farms: boosts in other crops, growth of the labor market, improved flow of financial resources, and a decrease in deforestation. The impact on deforestation is particularly interesting. Three years after the arrival of the sugarcane mills, deforestation was reduced by 6.3 thousand hectares on average. The arrival of the mills, which are usually associated with large companies listed in international stock markets and exposed to strict compliance criteria, might improve the local governance of natural resources. The preexisting unproductive pasture lands are also part of the explanation of these results, since the sugarcane is not competing with high productive uses.
Figure 8.12: Growth in Mills and Sugarcane Crops in Mato Grosso do Sul, 2005-2012
2005 2012
8 Mills 22 Mills137 Thousand Hectares 559 Thousand Hectares
MillSugarcanePantanal BiomeState BoundaryMunicipalitiesUpper Paraguay Hydrographic Basin
Source: Climate Policy Initiative with data from two sources: 1) Mill locations were obtained from Association of Bioenergy Producers of Mato Grosso do Sul (Associação dos Produtores de Bioenergia de Mato Grosso do Sul - BioSul); 2) Sugarcane areas were obtained with satellite images from the CANASat project from the National Institute for Space Research (Instituto Nacional de Pesquisas Espaciais - INPE).
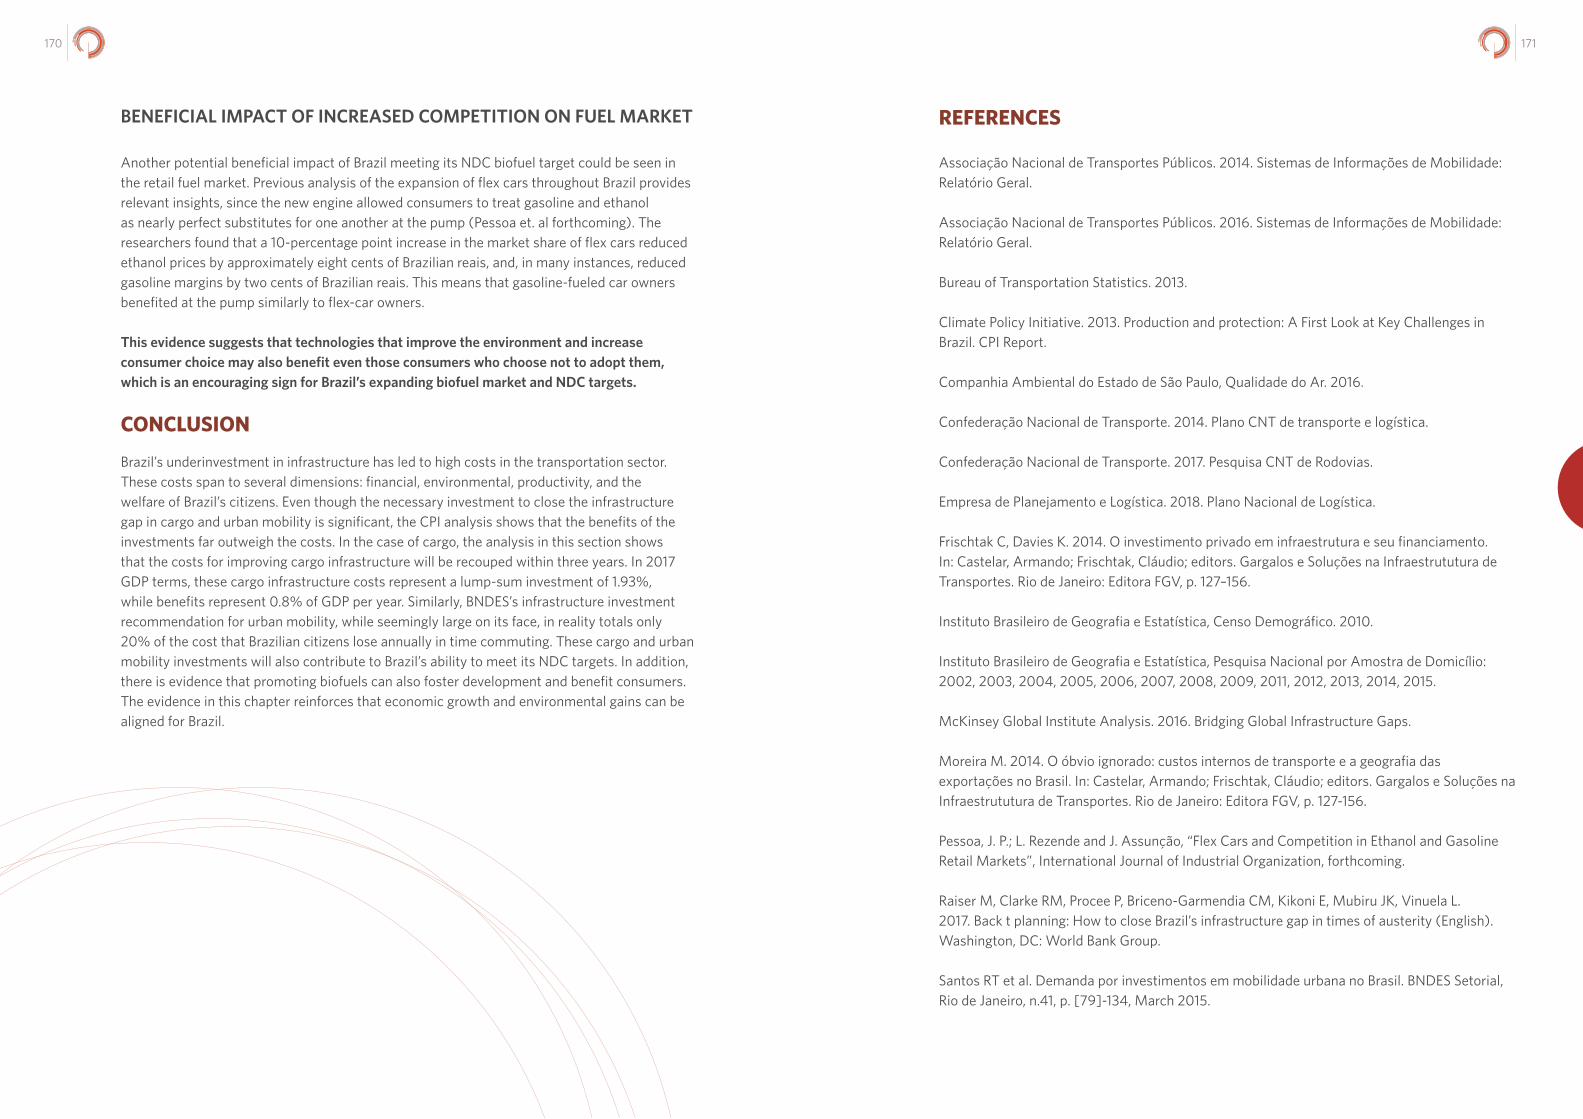
171170
BENEFICIAL IMPACT OF INCREASED COMPETITION ON FUEL MARKET
Another potential beneficial impact of Brazil meeting its NDC biofuel target could be seen in the retail fuel market. Previous analysis of the expansion of flex cars throughout Brazil provides relevant insights, since the new engine allowed consumers to treat gasoline and ethanol as nearly perfect substitutes for one another at the pump (Pessoa et. al forthcoming). The researchers found that a 10-percentage point increase in the market share of flex cars reduced ethanol prices by approximately eight cents of Brazilian reais, and, in many instances, reduced gasoline margins by two cents of Brazilian reais. This means that gasoline-fueled car owners benefited at the pump similarly to flex-car owners.
This evidence suggests that technologies that improve the environment and increase consumer choice may also benefit even those consumers who choose not to adopt them, which is an encouraging sign for Brazil’s expanding biofuel market and NDC targets.
CONCLUSION
Brazil’s underinvestment in infrastructure has led to high costs in the transportation sector. These costs span to several dimensions: financial, environmental, productivity, and the welfare of Brazil’s citizens. Even though the necessary investment to close the infrastructure gap in cargo and urban mobility is significant, the CPI analysis shows that the benefits of the investments far outweigh the costs. In the case of cargo, the analysis in this section shows that the costs for improving cargo infrastructure will be recouped within three years. In 2017 GDP terms, these cargo infrastructure costs represent a lump-sum investment of 1.93%, while benefits represent 0.8% of GDP per year. Similarly, BNDES’s infrastructure investment recommendation for urban mobility, while seemingly large on its face, in reality totals only 20% of the cost that Brazilian citizens lose annually in time commuting. These cargo and urban mobility investments will also contribute to Brazil’s ability to meet its NDC targets. In addition, there is evidence that promoting biofuels can also foster development and benefit consumers. The evidence in this chapter reinforces that economic growth and environmental gains can be aligned for Brazil.
REFERENCES
Associação Nacional de Transportes Públicos. 2014. Sistemas de Informações de Mobilidade: Relatório Geral.
Associação Nacional de Transportes Públicos. 2016. Sistemas de Informações de Mobilidade: Relatório Geral.
Bureau of Transportation Statistics. 2013.
Climate Policy Initiative. 2013. Production and protection: A First Look at Key Challenges in Brazil. CPI Report.
Companhia Ambiental do Estado de São Paulo, Qualidade do Ar. 2016.
Confederação Nacional de Transporte. 2014. Plano CNT de transporte e logística.
Confederação Nacional de Transporte. 2017. Pesquisa CNT de Rodovias.
Empresa de Planejamento e Logística. 2018. Plano Nacional de Logística.
Frischtak C, Davies K. 2014. O investimento privado em infraestrutura e seu financiamento. In: Castelar, Armando; Frischtak, Cláudio; editors. Gargalos e Soluções na Infraestrututura de Transportes. Rio de Janeiro: Editora FGV, p. 127–156.
Instituto Brasileiro de Geografia e Estatística, Censo Demográfico. 2010.
Instituto Brasileiro de Geografia e Estatística, Pesquisa Nacional por Amostra de Domicílio: 2002, 2003, 2004, 2005, 2006, 2007, 2008, 2009, 2011, 2012, 2013, 2014, 2015.
McKinsey Global Institute Analysis. 2016. Bridging Global Infrastructure Gaps.
Moreira M. 2014. O óbvio ignorado: custos internos de transporte e a geografia das exportações no Brasil. In: Castelar, Armando; Frischtak, Cláudio; editors. Gargalos e Soluções na Infraestrututura de Transportes. Rio de Janeiro: Editora FGV, p. 127-156.
Pessoa, J. P.; L. Rezende and J. Assunção, “Flex Cars and Competition in Ethanol and Gasoline Retail Markets”, International Journal of Industrial Organization, forthcoming.
Raiser M, Clarke RM, Procee P, Briceno-Garmendia CM, Kikoni E, Mubiru JK, Vinuela L. 2017. Back t planning: How to close Brazil’s infrastructure gap in times of austerity (English). Washington, DC: World Bank Group.
Santos RT et al. Demanda por investimentos em mobilidade urbana no Brasil. BNDES Setorial, Rio de Janeiro, n.41, p. [79]-134, March 2015.
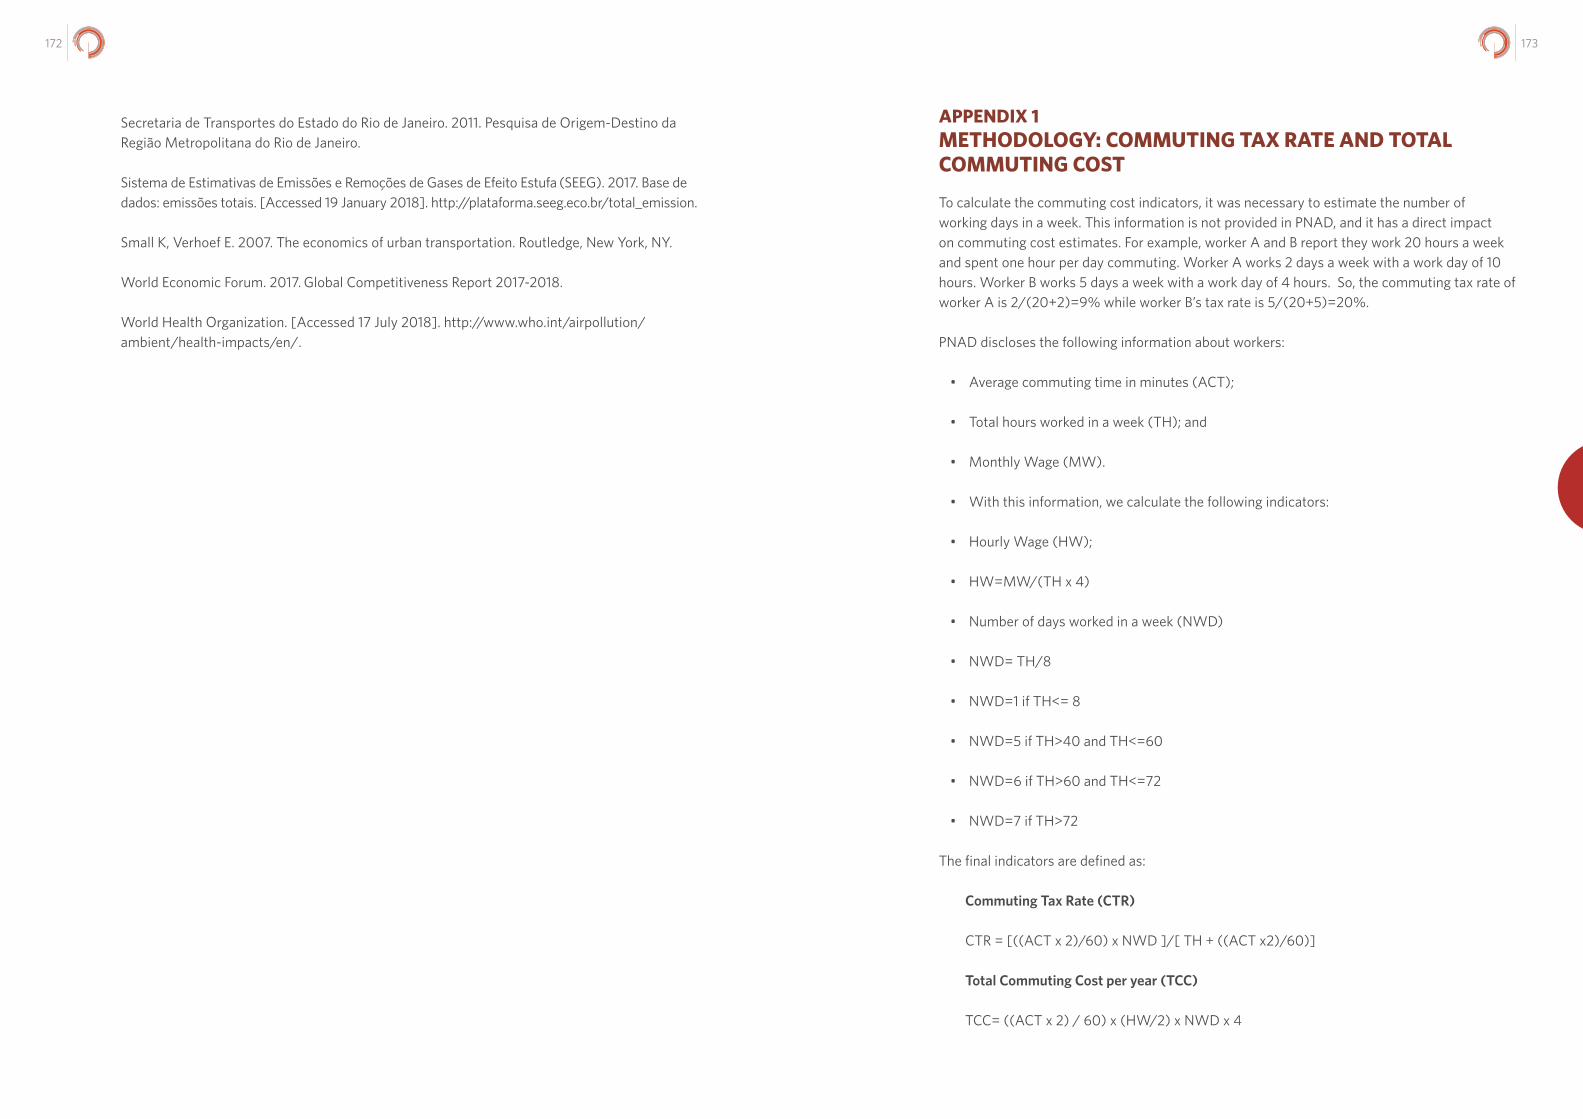
173172
Secretaria de Transportes do Estado do Rio de Janeiro. 2011. Pesquisa de Origem-Destino da Região Metropolitana do Rio de Janeiro.
Sistema de Estimativas de Emissões e Remoções de Gases de Efeito Estufa (SEEG). 2017. Base de dados: emissões totais. [Accessed 19 January 2018]. http://plataforma.seeg.eco.br/total_emission.
Small K, Verhoef E. 2007. The economics of urban transportation. Routledge, New York, NY.
World Economic Forum. 2017. Global Competitiveness Report 2017-2018.
World Health Organization. [Accessed 17 July 2018]. http://www.who.int/airpollution/ambient/health-impacts/en/.
APPENDIX 1 METHODOLOGY: COMMUTING TAX RATE AND TOTAL COMMUTING COST
To calculate the commuting cost indicators, it was necessary to estimate the number of working days in a week. This information is not provided in PNAD, and it has a direct impact on commuting cost estimates. For example, worker A and B report they work 20 hours a week and spent one hour per day commuting. Worker A works 2 days a week with a work day of 10 hours. Worker B works 5 days a week with a work day of 4 hours. So, the commuting tax rate of worker A is 2/(20+2)=9% while worker B’s tax rate is 5/(20+5)=20%.
PNAD discloses the following information about workers:
• Average commuting time in minutes (ACT);
• Total hours worked in a week (TH); and
• Monthly Wage (MW).
• With this information, we calculate the following indicators:
• Hourly Wage (HW);
• HW=MW/(TH x 4)
• Number of days worked in a week (NWD)
• NWD= TH/8
• NWD=1 if TH<= 8
• NWD=5 if TH>40 and TH<=60
• NWD=6 if TH>60 and TH<=72
• NWD=7 if TH>72
The final indicators are defined as:
Commuting Tax Rate (CTR)
CTR = [((ACT x 2)/60) x NWD ]/[ TH + ((ACT x2)/60)]
Total Commuting Cost per year (TCC)
TCC= ((ACT x 2) / 60) x (HW/2) x NWD x 4
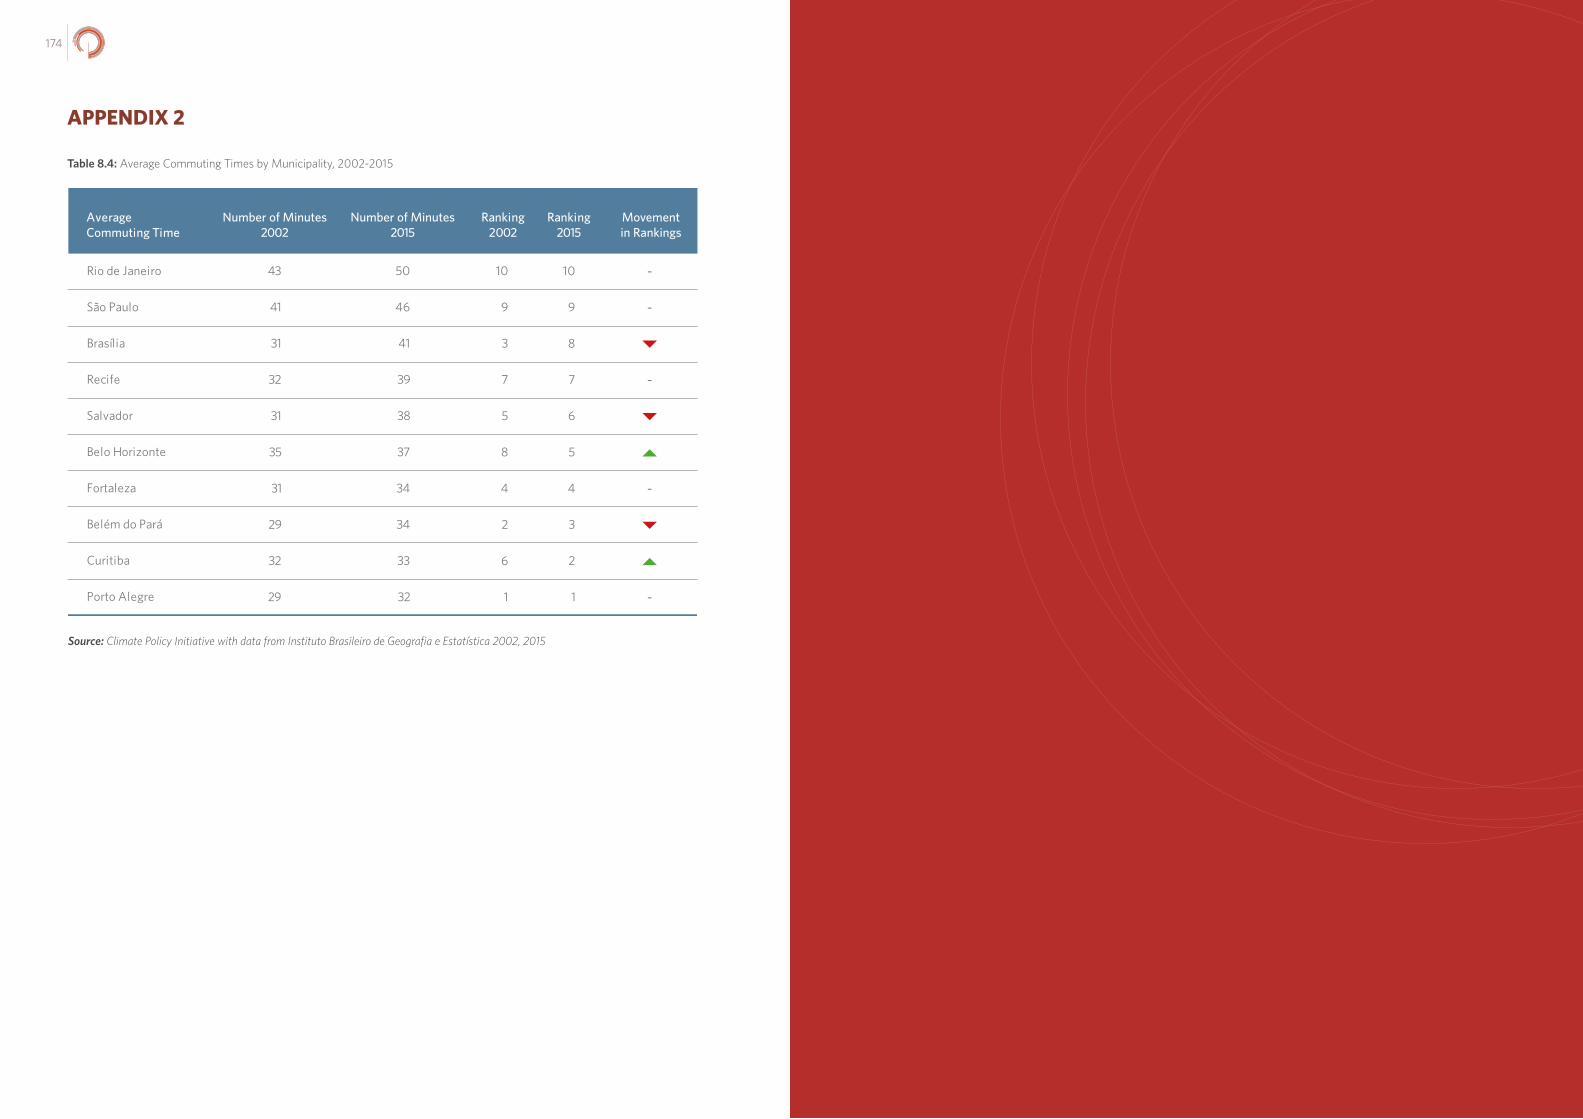
175174
Rio de Janeiro
São Paulo
Brasília
Recife
Salvador
Belo Horizonte
Fortaleza
Belém do Pará
Curitiba
Porto Alegre
AverageCommuting Time
43
41
31
32
31
35
31
29
32
29
Number of Minutes2002
50
46
41
39
38
37
34
34
33
32
Number of Minutes2015
10
9
3
7
5
8
4
2
6
1
Ranking2002
10
9
8
7
6
5
4
3
2
1
Ranking2015
Movementin Rankings
-
-
-
-
-
APPENDIX 2
Table 8.4: Average Commuting Times by Municipality, 2002-2015
Source: Climate Policy Initiative with data from Instituto Brasileiro de Geografia e Estatística 2002, 2015
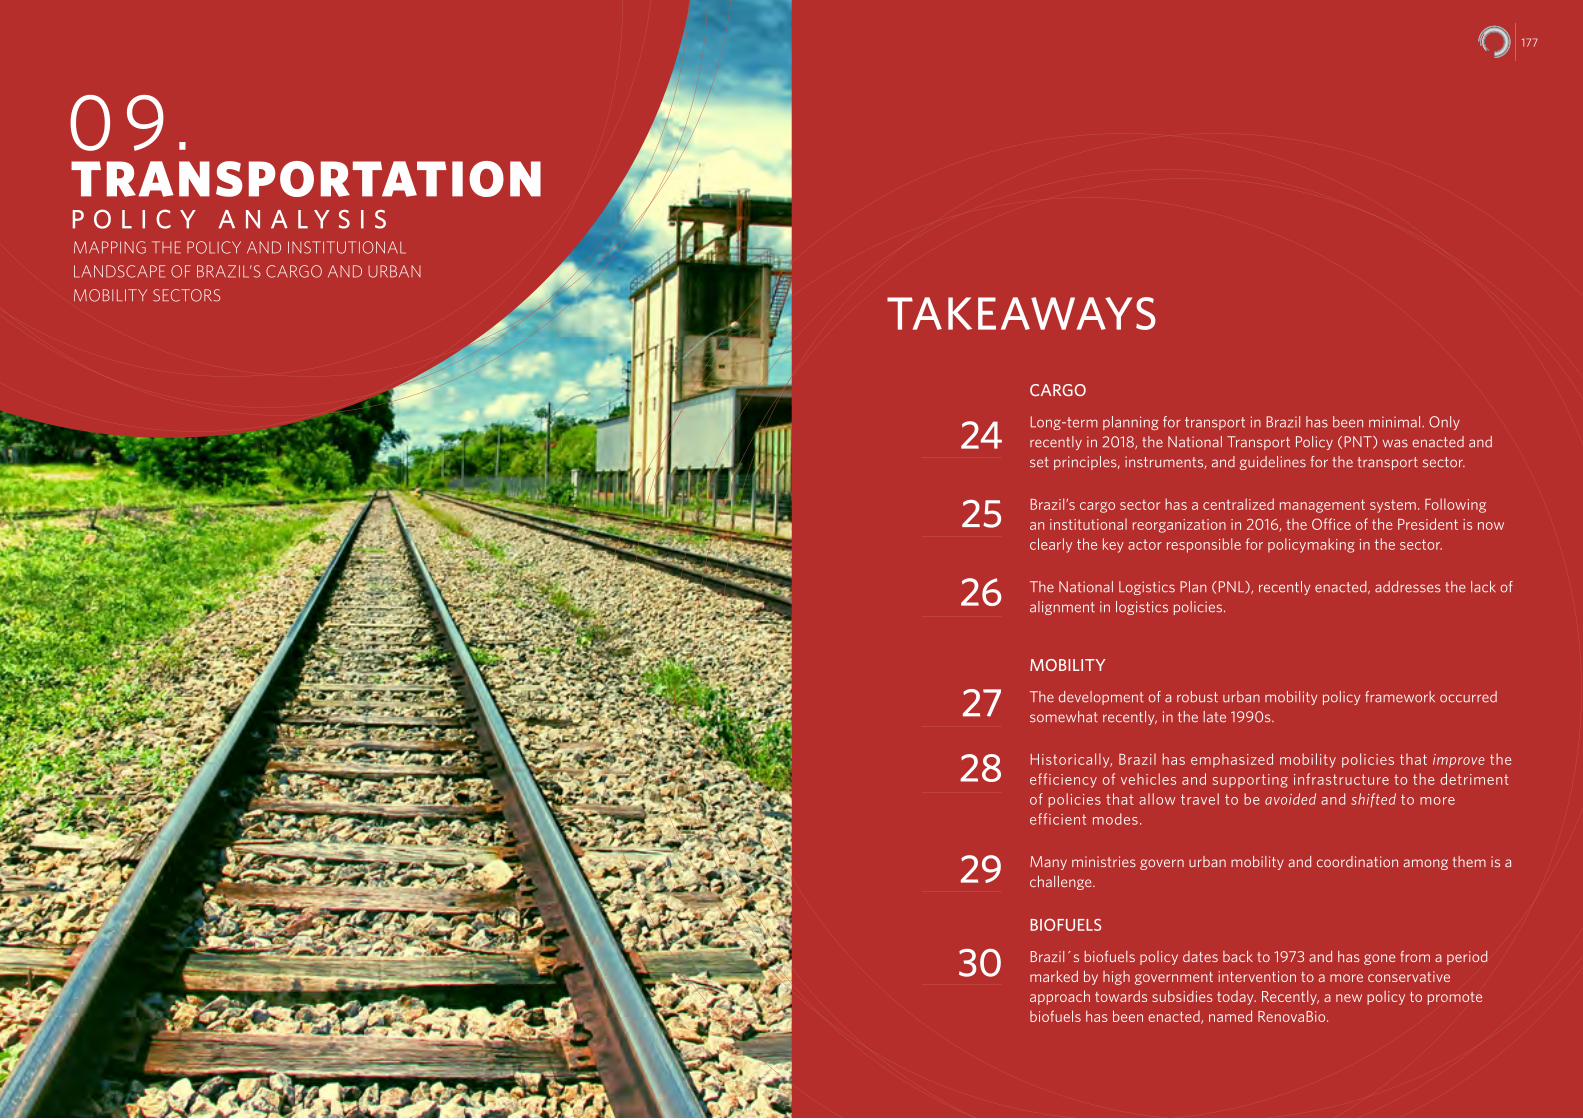
177176
MAPPING THE POLICY AND INSTITUTIONAL LANDSCAPE OF BRAZIL’S CARGO AND URBAN MOBILITY SECTORS
TRANSPORTATIONP O L I C Y A N A L Y S I S
CARGO
Long-term planning for transport in Brazil has been minimal. Only recently in 2018, the National Transport Policy (PNT) was enacted and set principles, instruments, and guidelines for the transport sector.
Brazil’s cargo sector has a centralized management system. Following an institutional reorganization in 2016, the Office of the President is now clearly the key actor responsible for policymaking in the sector.
The National Logistics Plan (PNL), recently enacted, addresses the lack of alignment in logistics policies.
MOBILITY
The development of a robust urban mobility policy framework occurred somewhat recently, in the late 1990s.
Historically, Brazil has emphasized mobility policies that improve the efficiency of vehicles and supporting infrastructure to the detriment of policies that allow travel to be avoided and shifted to more efficient modes.
Many ministries govern urban mobility and coordination among them is a challenge.
BIOFUELS
Brazil´s biofuels policy dates back to 1973 and has gone from a period marked by high government intervention to a more conservative approach towards subsidies today. Recently, a new policy to promote biofuels has been enacted, named RenovaBio.
24
25
26
27
28
29
30
TAKEAWAYS
177
09.

179178
CHAPTER OVERVIEW
The analysis featured in this section serves as a resource for policymakers and stakeholders to understand the wide array of governmental and policy initiatives that are available as pathways or tools for progress.
This section highlights Brazil’s policy and institutional landscape on cargo and urban mobility. Because Brazil’s transportation NDC specifically addresses biofuels, too, biofuel programs and policies are highlighted briefly in the chapter.
The chapter is organized in the following sections:
• Introduction: Brazil’s Cargo Policies and Institutional Landscape;
• Transportation and Cargo Policies Background;
• Key Institutions for Brazil’s Cargo Sector;
• Main Cargo Policies and Programs;
• Introduction: Brazil’s Urban Mobility Policies and Institutional Landscape;
• Transportation and Urban Mobility Policies Background;
• Key Institutions for Urban Mobility; and
• Main Urban Mobility Policies and Programs.
CARGO
INTRODUCTION: BRAZIL’S CARGO POLICIES AND INSTITUTIONAL LANDSCAPE
Improving cargo transportation and logistics can have significant positive impacts on freight costs, economic development, and the reduction of local and global emissions. However, Brazil faces significant challenges to improve and expand its cargo and logistics systems so that they are sustainable.
The emergence of cargo and logistics policies is rather recent, beginning in 2007. However, a national policy with clear objectives is still lacking. Instead, there is a framework made of overlapping short-term policies without sufficient alignment among them or an overarching policy objective. This causes legal uncertainty about what is currently in force and what has been revoked, and it hinders private investment.
A positive change in this scenario happened in 2018, when the Ministry of Transports, Ports, and Civil Aviation (Ministério dos Transportes, Portos e Aviação Civil - MTPA) enacted the National Transport Policy (Política Nacional de Transportes – PNT). The PNT is described as a

181180
long-term State policy, not a policy enacted by a specific government to favor its short-term interests. PNT sets fundamental principles, instruments, and guidelines for the development of the transport sector that go beyond the selection of a list of infrastructure projects.
In 2016, after a political crisis that culminated with the impeachment of the president at the time, an institutional reorganization took place in government. In the cargo and logistics sectors, the changes were particularly significant. The Planning and Logistics Office S.A. (Empresa de Planejamento e Logística – EPL), which is responsible for logistics planning, was transferred from the MTPA to the Presidency’s General-Secretariat. This means that EPL was placed under the direct influence of the Office of the President, instead of being linked, but not subordinated, to MTPA, as in the past.
Despite this chaotic policy background, EPL has put forward the National Logistics Plan (Plano Nacional de Logística - PNL), which was recently enacted. The Plan appears to signal better coherence in logistics policies and provides greater alignment with the NDC. However, the PNL is still a short-term policy, as its time horizon only lasts until 2025.
TRANSPORTATION AND CARGO POLICIES BACKGROUND
To better understand Brazil’s cargo sector, it is helpful to explore how the nation ended up with its current transport matrix, which relies heavily on roads as the main mode for transporting goods. This section presents a timeline and brief overview of the legal and institutional evolution of the sector (Figure 9.1).
From 1820 until the 1930’s, Brazil connected people and goods throughout the country through its rail and waterway systems. However, Brazil’s weak economy was not able to support the railroads financially. Even with this foreseeable railroad system failure, it was only in 1944 that the government approved a road plan, called National Road Plan (Plano Rodoviário Nacional – PNR). The Plan aimed to link the country from North to South and cut it in other directions, which would extend a network of efficient means of transportation over the national territory (Ministério dos Transportes 2016). At the time, the major concern of officials was to avoid modal competition; the primary purpose of the roads was to feed into the railroads (Galvão 1996).
In 1946, the National Department of Highways (Departamento Nacional de Estradas de Rodagens - DNER) and the National Road Fund were created to encourage the implementation of roads (Ministério dos Transportes, Portos e Aviação Civil 2016). After studying the current road implementation, DNER determined that to integrate the various geographic spaces of the nation effectively it was necessary to invest in a multimodal transport system. In fact, they concluded that the strategy to avoid modal competition was a mistake because it meant that some regions or areas of the national territory had to be provided with a single means of transport. This prevented the country from gaining a genuine and efficient national transportation network (Galvão 1996).
Even though railways were the main transport mode in 1950, roads handled 38% of cargo transportation already by then (Banco Nacional do Desenvolvimento Econômico e Social 2008). In 1951, the DNER’s aforementioned report led to the creation of the National Road Map, which elevated the roads as the new priority modal (Galvão 1996).
Figure 9.1: Brazil’s Cargo Policies Timeline
Source: Climate Policy Initiative
1944
1946
1951
1988
1993
2001
2004
2007
2011
2012
2015
2016
2017
2018
National Road Plan*
National Department of Highways*
Investments Partnership Program
National Transport Policy
Infrastructure Debentures
National Road Fund*
Strategic Logistics Corridors ProjectPPA
National Logistics Plan
Decree No. 9,073, enforcing the Paris Agreement/ Nationally Determined Contribution (NDC)
Planning and Logistics Office
National Road Map*
Federal Constitution
Federal Highway Concession Program
Brazilian Land Transportation Regulatory Agency
Investment Program in Logistics
Energy Efficiency National Plan
CONPET
National Integrated Logistics Plan
Public-Private Partnership Law
National Logistics and Transport Plan
National Energy Plan 2030
Growth Acceleration ProgramFiscal Incentive for Infrastructure Investments
Sectoral plans Legal milestone
Investment plans Not in force (expired)*
Institutions
Fiscal incentives
183182
In the second half of the 1950’s, the Brazilian government had a development goal called “50 years in 5.” That is, the goal was to achieve in five years what it would take 50 years in the “business as usual” scenario. Two measures to achieve this plan boosted Brazil’s road development significantly: the transfer of the capital city from Rio de Janeiro to Brasília and the creation of a national automobilist industry (Ministério dos Transportes, Portos e Aviação Civil 2016).
Brazil is a continental-sized country. With the goal to integrate the country, the president at the time1 strategically allocated the capital in the center of Brazil. It is worth noting that Brasília was built from scratch. Hence, roads were necessary to connect workers from across Brazil to build Brasília. The national automobilist industry in its turn encouraged the creation of industrial parks, the formation of factories, a network of suppliers, and peripheral infrastructure services. All of these needed roads to traffic their goods and workers. Also, more cars in the streets meant more roads to be built. By the 1960’s, roads comprised 60% of Brazil’s transportation system. By then, fiscal resources to fund new roads or their expansion were divided among municipalities, states, and the federal government. The federal government retained responsibility for maintaining and conserving the highways.
After the current Federal Constitution promulgation in 1988, it became illegal to bind tax revenues to an agency, fund, or expense.2 This prohibition withdrew state and municipality tax revenues for funding roads and passed the responsibility to transfer these resources to the federal government. This new resource allocation system, combined with the federal responsibility for road maintenance and conservation, made the road infrastructure reliant on federal government initiatives. As a way to ease this burden, the Constitution allowed private initiative investments in the sector through concessions3 or public-private partnerships.4
In 1993, the Ministry of Transports launched the Federal Highway Concession Program (Programa de Concessões de Rodovias Federais), but it wasn’t until 1996 that the first concession started its activities. It was also in 1996 that the federal government was authorized to delegate road management and operations to the states and municipalities.5 Currently, 10,000 km of highways are under concession to private operators, which represents approximately 12% of the total highway system6 (Empresa de Planejamento e Logística and Ministério dos Transportes, Portos e Aviação Civil 2017).
After almost ten years without any policy related to cargo, in 2001 the Brazilian Land Transportation Regulatory Agency (Agência Nacional de Transportes Terrestres – ANTT) was created. ANTT initiated a new regulatory model for the transport sector. In 2004, the Public-Private Partnership Law7 was enacted and also opened new opportunities for public concessions, including highways, ports, railways, and waterways. In 2007, the National
1 The President at the time was Juscelino Kubitschek.
2 Federal Constitution. Article 167, IV.
3 Law No. 8,987/1995.
4 Law No. 11,079/2004.
5 Law No. 9,277/1996 and Ordinance No. 368/1996 from the Ministry of Transports, Ports and Civil Aviation.
6 Brazil has 76,400 km of highways of which 64,800 km are paved, and 11,600 km are unpaved (Empresa de Planejamento e Logística, 2018).
7 Law No. 11,079/2011.
Logistics and Transport Plan (Plano Nacional de Logística e Transportes – PNLT) was launched, which was a milestone for the sector. The Plan represented the resumption of the transport sector’s mid- and long-term planning.
After the PNLT, several federal plans and programs for transport and logistics were published by the federal government:
(i) Growth Acceleration Program;
(ii) Investment Program in Logistics;
(iii) National Integrated Logistic Plan;
(iv) Investment Partnership Program.
(v) National Transport Policy; and the
(vi) National Logistics Plan.
The last one – National Logistcs Plan – was recently enacted.8 Should Brazil implement the plans and programs identified in this new plan, the nation would significantly improve its infrastructure and secure a stronger position compared to similar countries (see Figure 8.4 and discussion from Chapter 8).
Today, cargo transportation mainly occurs by road, which is responsible for 65% of all the transportation of goods. Railroads account for 15%, waterways for 16%, pipelines for 4%, and airways for almost none (Empresa de Planejamento e Logística 2018).
KEY INSTITUTIONS FOR THE CARGO SECTOR
Brazil’s cargo sector has a centralized management system. The Office of the President holds responsibility for policymaking, and for launching investment plans and programs to promote the country’s development. This management system is mapped for the first time in Figure 9.2 and explained in detail below.
The organization chart featured in Figure 9.2 uses different colors to distinguish the institution from programs or policies and to identify the institution’s role in the cargo sector: governmental (orange) or regulatory (blue) activity. Policies and programs are located below the institution that manages and/or operates them.
The Ministry of Transports participates modestly in cargo policies. However, it was the National Logistics and Transport Plan (PNLT), created by the Ministry of Transports together with the Ministry of Defense, that resumed mid- and long-term planning for the transport sector.
8 Enacted on July 2, 2018.
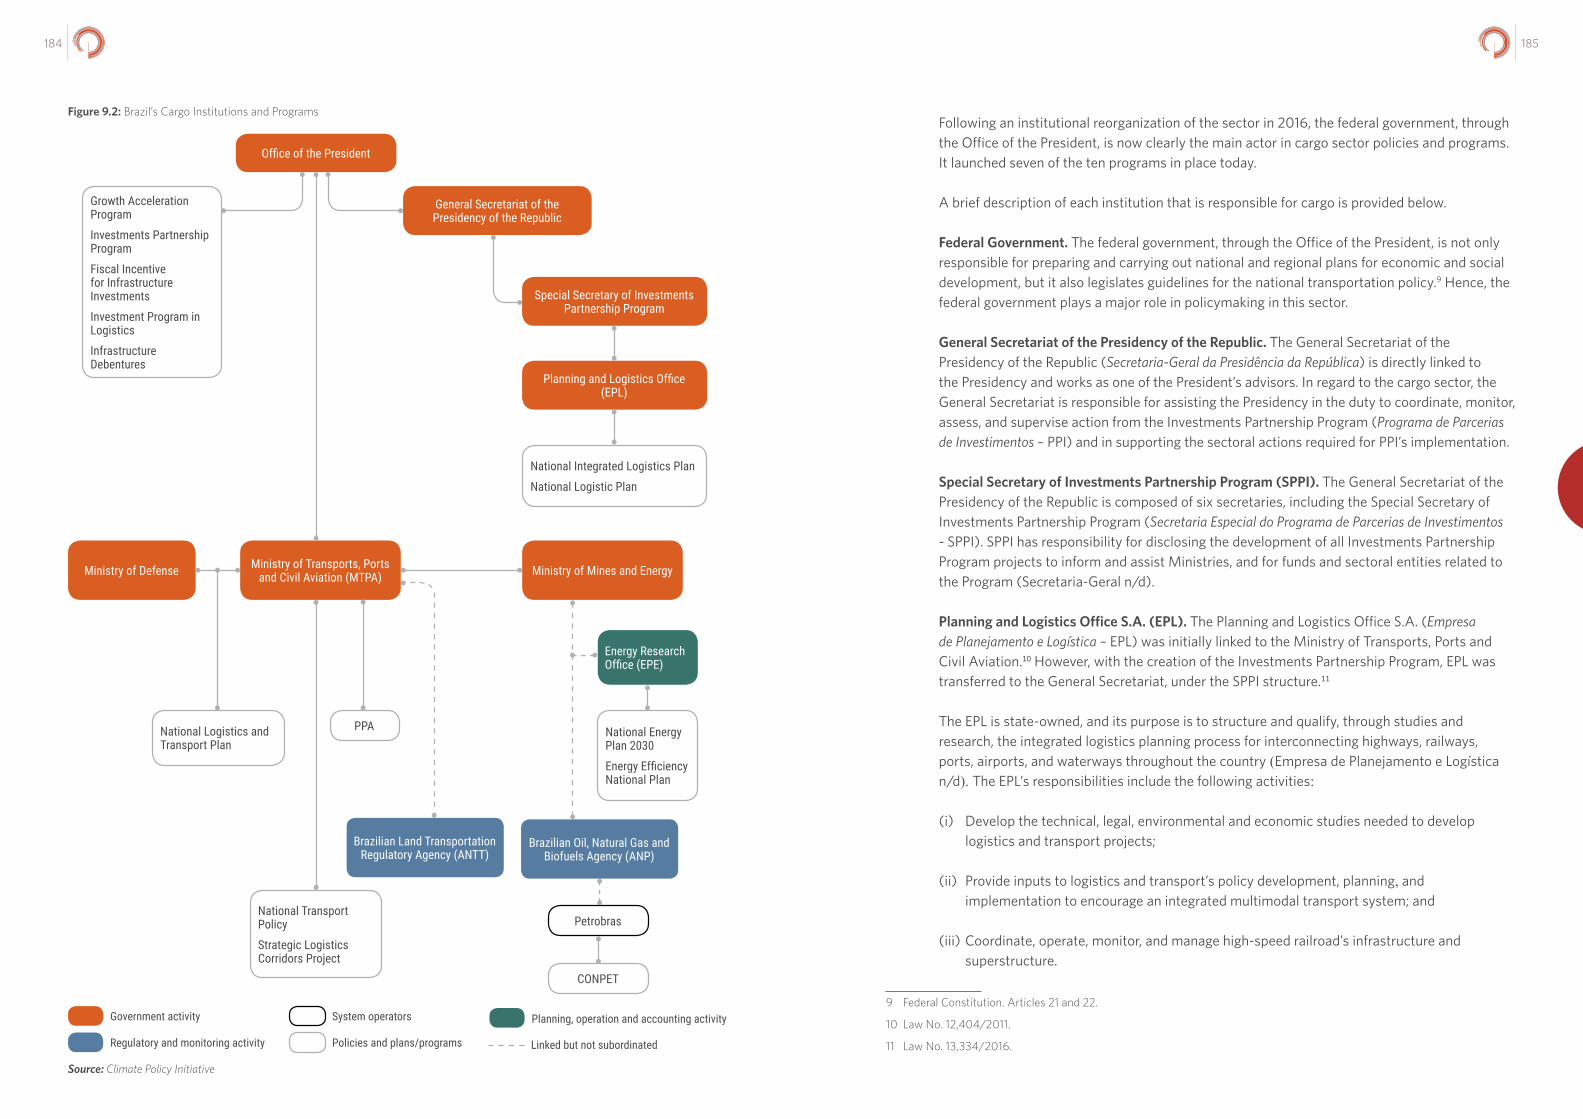
185184
Following an institutional reorganization of the sector in 2016, the federal government, through the Office of the President, is now clearly the main actor in cargo sector policies and programs. It launched seven of the ten programs in place today.
A brief description of each institution that is responsible for cargo is provided below.
Federal Government. The federal government, through the Office of the President, is not only responsible for preparing and carrying out national and regional plans for economic and social development, but it also legislates guidelines for the national transportation policy.9 Hence, the federal government plays a major role in policymaking in this sector.
General Secretariat of the Presidency of the Republic. The General Secretariat of the Presidency of the Republic (Secretaria-Geral da Presidência da República) is directly linked to the Presidency and works as one of the President’s advisors. In regard to the cargo sector, the General Secretariat is responsible for assisting the Presidency in the duty to coordinate, monitor, assess, and supervise action from the Investments Partnership Program (Programa de Parcerias de Investimentos – PPI) and in supporting the sectoral actions required for PPI’s implementation.
Special Secretary of Investments Partnership Program (SPPI). The General Secretariat of the Presidency of the Republic is composed of six secretaries, including the Special Secretary of Investments Partnership Program (Secretaria Especial do Programa de Parcerias de Investimentos - SPPI). SPPI has responsibility for disclosing the development of all Investments Partnership Program projects to inform and assist Ministries, and for funds and sectoral entities related to the Program (Secretaria-Geral n/d).
Planning and Logistics Office S.A. (EPL). The Planning and Logistics Office S.A. (Empresa de Planejamento e Logística – EPL) was initially linked to the Ministry of Transports, Ports and Civil Aviation.10 However, with the creation of the Investments Partnership Program, EPL was transferred to the General Secretariat, under the SPPI structure.11
The EPL is state-owned, and its purpose is to structure and qualify, through studies and research, the integrated logistics planning process for interconnecting highways, railways, ports, airports, and waterways throughout the country (Empresa de Planejamento e Logística n/d). The EPL’s responsibilities include the following activities:
(i) Develop the technical, legal, environmental and economic studies needed to develop logistics and transport projects;
(ii) Provide inputs to logistics and transport’s policy development, planning, and implementation to encourage an integrated multimodal transport system; and
(iii) Coordinate, operate, monitor, and manage high-speed railroad’s infrastructure and superstructure.
9 Federal Constitution. Articles 21 and 22.
10 Law No. 12,404/2011.
11 Law No. 13,334/2016.
Office of the President
Ministry of Transports, Ports and Civil Aviation (MTPA) Ministry of Mines and EnergyMinistry of Defense
Brazilian Land Transportation Regulatory Agency (ANTT)
Brazilian Oil, Natural Gas and Biofuels Agency (ANP)
General Secretariat of the Presidency of the Republic
Special Secretary of Investments Partnership Program
Planning and Logistics Office (EPL)
Linked but not subordinated
Government activity
Regulatory and monitoring activity Policies and plans/programs
Growth Acceleration Program
Investments Partnership Program
Fiscal Incentive for Infrastructure Investments
Investment Program in Logistics
Infrastructure Debentures
National Integrated Logistics Plan
National Logistic Plan
National Logistics and Transport Plan
National Transport Policy
Strategic Logistics Corridors Project
National Energy Plan 2030
Energy Efficiency National Plan
Energy Research Office (EPE)
Petrobras
CONPET
PPA
Planning, operation and accounting activitySystem operators
Source: Climate Policy Initiative
Figure 9.2: Brazil’s Cargo Institutions and Programs
187186
The EPL was responsible for the development of the National Logistic Plan (Plano Nacional de Logística – PNL) and the National Integrated Logistics Plan (Plano Nacional de Logística Integrada –PNLI). Both plans are described in the Main Policies and Programs section of this chapter.
Recently, EPL launched the National Transports and Logistics Observatory (Observatório Nacional de Transporte e Logísitica - ONTL), with the goal of building a transport and logistics information system to be used by the government, non-governmental institutions and civil society (Empresa de Planejamento e Logística, ONTL 2018).
Ministry of Transports, Ports, and Civil Aviation (MTPA). Transportation has been a government concern since Brazil’s Imperial Regime. The current institutional structure, however, is more similar with the one established in the 1960’s, when it started as Ministry of Transports and its jurisdiction was over railroads, highways, waterways, ports, airway, and the merchant navy. Over the years, the Ministry of Transports changed its jurisdiction by merging with other ministries and separating from them. Currently, the Secretary of Ports and the Secretary of Civil Aviation merged with the Ministry of Transports, hence nowadays it is called Ministry of Transports, Ports, and Civil Aviation (Ministério dos Transportes, Portos e Aviação Civil, Evolução n/d).
The MTPA is responsible for seven areas of activities:
(i) National railway, highway, waterway, and airway policies;
(ii) The merchant navy;
(iii) Policies and guideline development to support the port sector;
(iv) Port policymaking, coordination, and supervision;
(v) Participation in strategic planning, the establishment of guidelines for strategy implementation, and the definition of priorities over transport’s investment programs;
(vi) Infra- and superstructure development for ports and waterways, with the goal to promote safety and efficiency in the waterway transport for people and goods; and
(vii) Civil aviation and airport infrastructure.12
Brazilian Land Transportation Regulatory Agency (ANTT). The Brazilian Land Transportation Regulatory Agency (Agência Nacional de Transportes Terrestres – ANTT) was created in 2001 to regulate and monitor transport activities, including infrastructure exploration. It aims to ensure the movement of people and goods, harmonize the interests of users and concessionaires, and authorize entities and lessees. For delegated entities, its role is to protect the public’s interest, arbitrate conflicts of interests, and prevent market failure situations (Agência Nacional de Transportes Terrestres, Institucional n/d.). The ANTT is linked, but not subordinated to the MTPA.
12 Law No. 13,502/2017.
MAIN CARGO POLICIES AND PROGRAMS
Brazil does not have specific policies or programs for cargo. Notwithstanding, given that cargo is directly linked with transports and logistics, policies and programs related to these matters cover cargo. These are summarized here for the first time.
Cargo Institutions and Programs
This section is divided into three parts:
(i) Investment plans;
(ii) Sectoral plans; and
(iii) Fiscal incentives.
The PPA is a legal milestone for the cargo sector, but it also covers other matters. Thus, it does not fit in the classification above mentioned, hence it is described first and separately.
Pluriannual Plan (PPA) The Federal Constitution13 established the PPA as an instrument to organize actions under the federal government over four-year periods (Ministério do Planejamento Desenvolvimento e Gestão 2015). The current PPA sets actions from 2016 to 2019. The PPA establish four main goals for land transportation:
(i) Promote the expansion of the federal railway network through the construction of new railroads, rail connections and accesses;
(ii) Promote the construction and paving of the federal highway network including bridges, viaducts and tunnels; and
(iii) To promote the flow, quality and safety of transportation of persons and cargo, through the concession of federal highways and the efficient supervision of regulated road transport services.
I. Investment plans
Investment plans identify what the government plans to build and the accompanying financing required. These plans aim to attract infrastructure investments and contribute to economic and social development. Plans may or may not have a specific time horizon. Figure 9.3 identifies the investment plans currently in force and shows that they have overlapping periods, which may indicate a governmental lack of planning.
Growth Acceleration Program (PAC). Created in 2007, the Growth Acceleration Program (Programa de Aceleração do Crescimento - PAC) is a federal government initiative to boost infrastructure planning and investments. The purpose is to regain the country’s economic
13 Federal Constitution. Article 165.
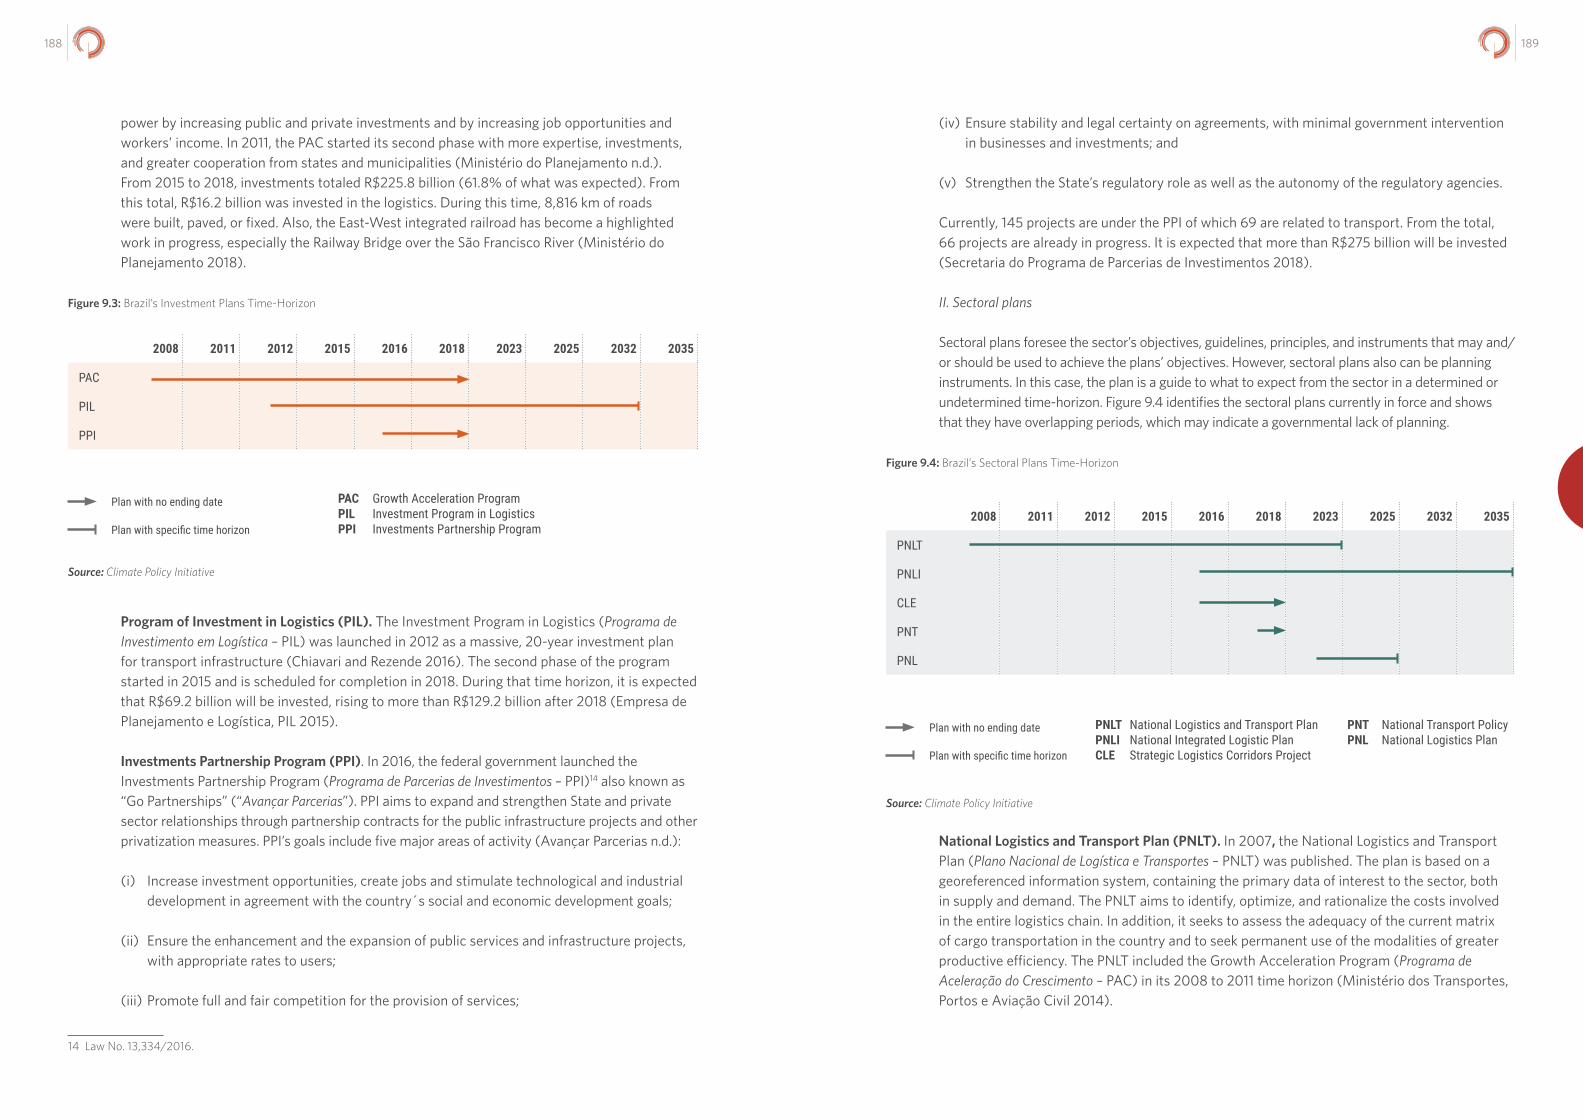
189188
power by increasing public and private investments and by increasing job opportunities and workers’ income. In 2011, the PAC started its second phase with more expertise, investments, and greater cooperation from states and municipalities (Ministério do Planejamento n.d.). From 2015 to 2018, investments totaled R$225.8 billion (61.8% of what was expected). From this total, R$16.2 billion was invested in the logistics. During this time, 8,816 km of roads were built, paved, or fixed. Also, the East-West integrated railroad has become a highlighted work in progress, especially the Railway Bridge over the São Francisco River (Ministério do Planejamento 2018).
(iv) Ensure stability and legal certainty on agreements, with minimal government intervention in businesses and investments; and
(v) Strengthen the State’s regulatory role as well as the autonomy of the regulatory agencies.
Currently, 145 projects are under the PPI of which 69 are related to transport. From the total, 66 projects are already in progress. It is expected that more than R$275 billion will be invested (Secretaria do Programa de Parcerias de Investimentos 2018).
II. Sectoral plans
Sectoral plans foresee the sector’s objectives, guidelines, principles, and instruments that may and/or should be used to achieve the plans’ objectives. However, sectoral plans also can be planning instruments. In this case, the plan is a guide to what to expect from the sector in a determined or undetermined time-horizon. Figure 9.4 identifies the sectoral plans currently in force and shows that they have overlapping periods, which may indicate a governmental lack of planning.
Figure 9.4: Brazil’s Sectoral Plans Time-Horizon
2008 2011 2012 2015 2016 2018 2023 2025 2032 2035
PAC
PIL
PPI
PAC Growth Acceleration ProgramPIL Investment Program in LogisticsPPI Investments Partnership Program
Plan with no ending date
Plan with specific time horizon
Source: Climate Policy Initiative
Figure 9.3: Brazil’s Investment Plans Time-Horizon
2008 2011 2012 2015 2016 2018 2023 2025 2032 2035
PNLT
PNLI
CLE
PNT
PNL
PNLT National Logistics and Transport PlanPNLI National Integrated Logistic PlanCLE Strategic Logistics Corridors Project
PNT National Transport Policy PNL National Logistics Plan
Plan with no ending date
Plan with specific time horizon
Source: Climate Policy Initiative
National Logistics and Transport Plan (PNLT). In 2007, the National Logistics and Transport Plan (Plano Nacional de Logística e Transportes – PNLT) was published. The plan is based on a georeferenced information system, containing the primary data of interest to the sector, both in supply and demand. The PNLT aims to identify, optimize, and rationalize the costs involved in the entire logistics chain. In addition, it seeks to assess the adequacy of the current matrix of cargo transportation in the country and to seek permanent use of the modalities of greater productive efficiency. The PNLT included the Growth Acceleration Program (Programa de Aceleração do Crescimento – PAC) in its 2008 to 2011 time horizon (Ministério dos Transportes, Portos e Aviação Civil 2014).
Program of Investment in Logistics (PIL). The Investment Program in Logistics (Programa de Investimento em Logística – PIL) was launched in 2012 as a massive, 20-year investment plan for transport infrastructure (Chiavari and Rezende 2016). The second phase of the program started in 2015 and is scheduled for completion in 2018. During that time horizon, it is expected that R$69.2 billion will be invested, rising to more than R$129.2 billion after 2018 (Empresa de Planejamento e Logística, PIL 2015).
Investments Partnership Program (PPI). In 2016, the federal government launched the Investments Partnership Program (Programa de Parcerias de Investimentos – PPI)14 also known as “Go Partnerships” (“Avançar Parcerias”). PPI aims to expand and strengthen State and private sector relationships through partnership contracts for the public infrastructure projects and other privatization measures. PPI’s goals include five major areas of activity (Avançar Parcerias n.d.):
(i) Increase investment opportunities, create jobs and stimulate technological and industrial development in agreement with the country´s social and economic development goals;
(ii) Ensure the enhancement and the expansion of public services and infrastructure projects, with appropriate rates to users;
(iii) Promote full and fair competition for the provision of services;
14 Law No. 13,334/2016.
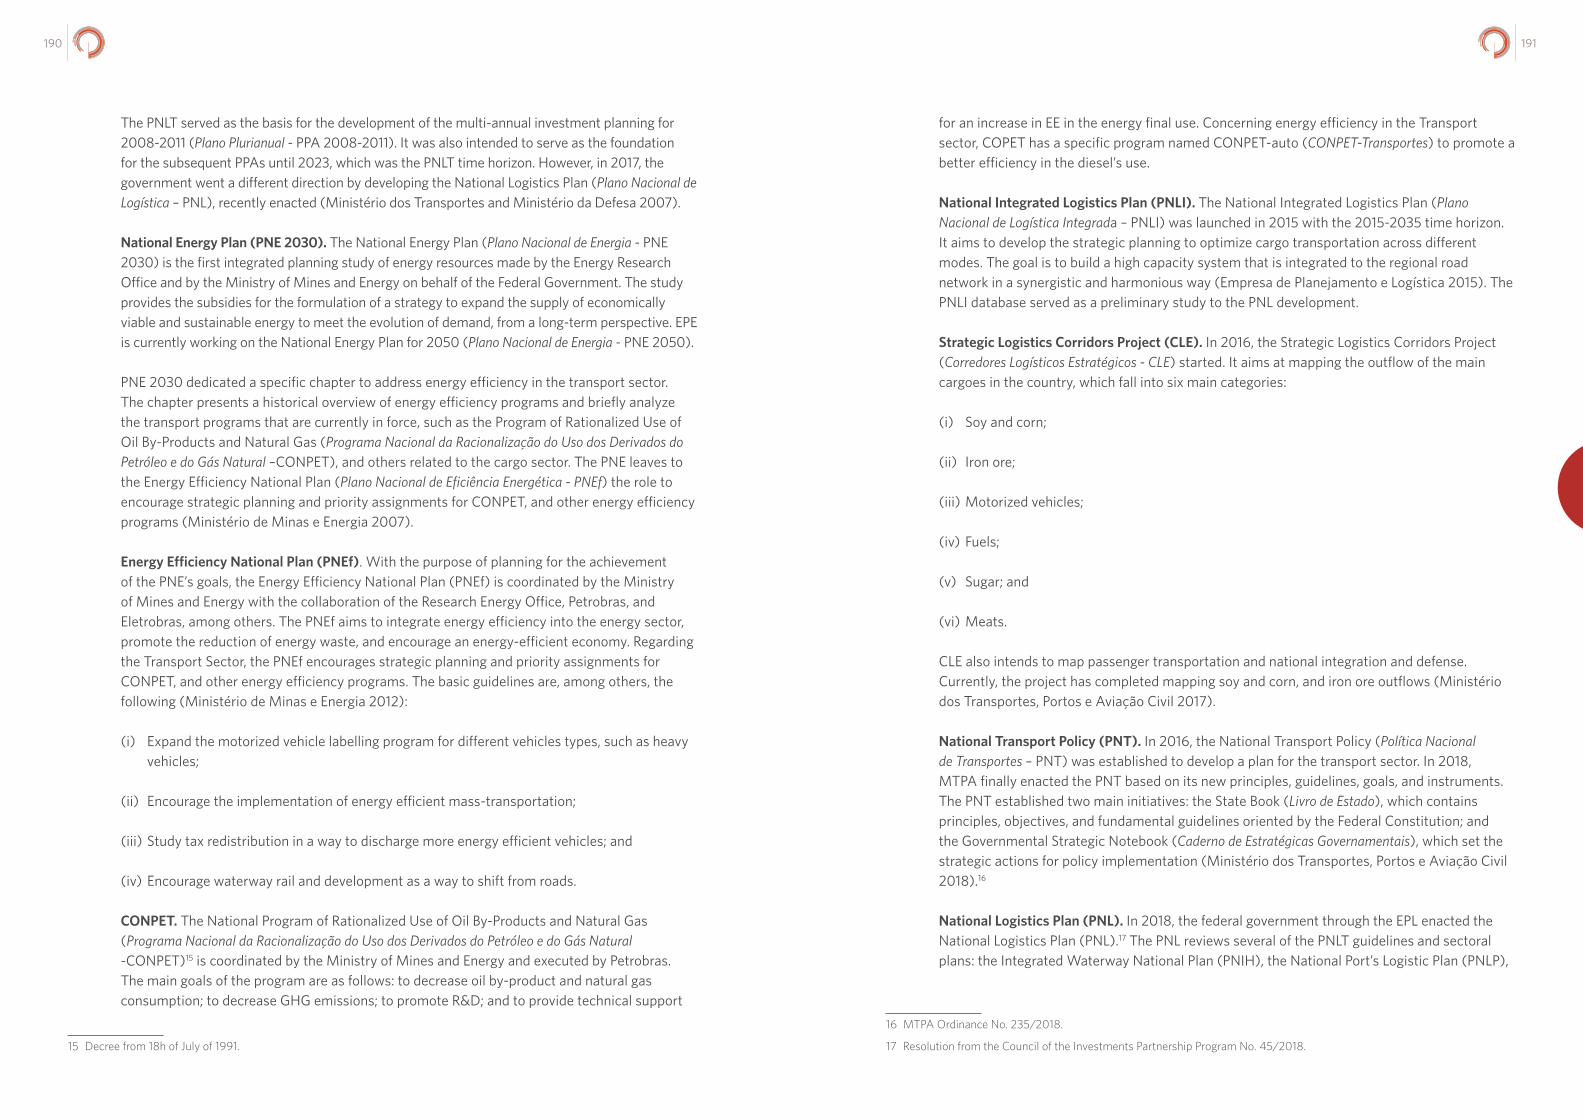
191190
The PNLT served as the basis for the development of the multi-annual investment planning for 2008-2011 (Plano Plurianual - PPA 2008-2011). It was also intended to serve as the foundation for the subsequent PPAs until 2023, which was the PNLT time horizon. However, in 2017, the government went a different direction by developing the National Logistics Plan (Plano Nacional de Logística – PNL), recently enacted (Ministério dos Transportes and Ministério da Defesa 2007).
National Energy Plan (PNE 2030). The National Energy Plan (Plano Nacional de Energia - PNE 2030) is the first integrated planning study of energy resources made by the Energy Research Office and by the Ministry of Mines and Energy on behalf of the Federal Government. The study provides the subsidies for the formulation of a strategy to expand the supply of economically viable and sustainable energy to meet the evolution of demand, from a long-term perspective. EPE is currently working on the National Energy Plan for 2050 (Plano Nacional de Energia - PNE 2050).
PNE 2030 dedicated a specific chapter to address energy efficiency in the transport sector. The chapter presents a historical overview of energy efficiency programs and briefly analyze the transport programs that are currently in force, such as the Program of Rationalized Use of Oil By-Products and Natural Gas (Programa Nacional da Racionalização do Uso dos Derivados do Petróleo e do Gás Natural –CONPET), and others related to the cargo sector. The PNE leaves to the Energy Efficiency National Plan (Plano Nacional de Eficiência Energética - PNEf) the role to encourage strategic planning and priority assignments for CONPET, and other energy efficiency programs (Ministério de Minas e Energia 2007).
Energy Efficiency National Plan (PNEf). With the purpose of planning for the achievement of the PNE’s goals, the Energy Efficiency National Plan (PNEf) is coordinated by the Ministry of Mines and Energy with the collaboration of the Research Energy Office, Petrobras, and Eletrobras, among others. The PNEf aims to integrate energy efficiency into the energy sector, promote the reduction of energy waste, and encourage an energy-efficient economy. Regarding the Transport Sector, the PNEf encourages strategic planning and priority assignments for CONPET, and other energy efficiency programs. The basic guidelines are, among others, the following (Ministério de Minas e Energia 2012):
(i) Expand the motorized vehicle labelling program for different vehicles types, such as heavy vehicles;
(ii) Encourage the implementation of energy efficient mass-transportation;
(iii) Study tax redistribution in a way to discharge more energy efficient vehicles; and
(iv) Encourage waterway rail and development as a way to shift from roads.
CONPET. The National Program of Rationalized Use of Oil By-Products and Natural Gas (Programa Nacional da Racionalização do Uso dos Derivados do Petróleo e do Gás Natural -CONPET)15 is coordinated by the Ministry of Mines and Energy and executed by Petrobras. The main goals of the program are as follows: to decrease oil by-product and natural gas consumption; to decrease GHG emissions; to promote R&D; and to provide technical support
15 Decree from 18h of July of 1991.
for an increase in EE in the energy final use. Concerning energy efficiency in the Transport sector, COPET has a specific program named CONPET-auto (CONPET-Transportes) to promote a better efficiency in the diesel’s use.
National Integrated Logistics Plan (PNLI). The National Integrated Logistics Plan (Plano Nacional de Logística Integrada – PNLI) was launched in 2015 with the 2015-2035 time horizon. It aims to develop the strategic planning to optimize cargo transportation across different modes. The goal is to build a high capacity system that is integrated to the regional road network in a synergistic and harmonious way (Empresa de Planejamento e Logística 2015). The PNLI database served as a preliminary study to the PNL development.
Strategic Logistics Corridors Project (CLE). In 2016, the Strategic Logistics Corridors Project (Corredores Logísticos Estratégicos - CLE) started. It aims at mapping the outflow of the main cargoes in the country, which fall into six main categories:
(i) Soy and corn;
(ii) Iron ore;
(iii) Motorized vehicles;
(iv) Fuels;
(v) Sugar; and
(vi) Meats.
CLE also intends to map passenger transportation and national integration and defense. Currently, the project has completed mapping soy and corn, and iron ore outflows (Ministério dos Transportes, Portos e Aviação Civil 2017).
National Transport Policy (PNT). In 2016, the National Transport Policy (Política Nacional de Transportes – PNT) was established to develop a plan for the transport sector. In 2018, MTPA finally enacted the PNT based on its new principles, guidelines, goals, and instruments. The PNT established two main initiatives: the State Book (Livro de Estado), which contains principles, objectives, and fundamental guidelines oriented by the Federal Constitution; and the Governmental Strategic Notebook (Caderno de Estratégicas Governamentais), which set the strategic actions for policy implementation (Ministério dos Transportes, Portos e Aviação Civil 2018).16
National Logistics Plan (PNL). In 2018, the federal government through the EPL enacted the National Logistics Plan (PNL).17 The PNL reviews several of the PNLT guidelines and sectoral plans: the Integrated Waterway National Plan (PNIH), the National Port’s Logistic Plan (PNLP),
16 MTPA Ordinance No. 235/2018.
17 Resolution from the Council of the Investments Partnership Program No. 45/2018.
193192
the Strategic Waterway Plan (PHE), and the States’ logistics and transport’s Plan (PELT).18 The PNL also considers the preliminary studies from the National Integrated Logistics Plan (PNLI).
The PNL’s purpose is to achieve a more balanced division among the different transport modes, given each modal’s efficiency for cargo transportation in the country. Secondary goals for the PNL include carbon dioxide (CO2) emissions reduction and cost reductions in cargo transportation.
The Plan’s time horizon runs up to 2025, which is almost the same as the National Logistics and Transport Plan’s (PNLT), which was supposed to run until 2023. It is worth mentioning, however, that the PNL is supposed to be periodically revised to keep its database up to date and to reduce information asymmetry, which may change the scenarios foreseen for the following years (Empresa de Planejamento e Logística 2018).
Finally, the creation of a Governance Committee to oversee PNL’s projects is anticipated. According to the President’s assistants, the new committee may avoid political interference in logistics planning, given that projects that are not under the PNL may only be included with justification and the Governance Committee’s approval (Wiziack and Boldrini 2018).
III. Fiscal Incentives
Fiscal incentives grant tax exemption or tax incentives to those who invest in the sector’s development.
Fiscal Incentive for Infrastructure Investments (REIDI). The Fiscal Incentive for Infrastructure Investments (Regime Especial de Incentivos para o Desenvolvimento da Infraestrutura – REIDI) was created in 2007. It exempts tax payments on the acquisition of new machines, appliances, new instruments and equipment, services and construction materials destined to property, and plant and equipment of authorized legal entity. The incentive applies to legal entities that have an approved project for infrastructure works implementation in the transport, ports, energy, basic sanitation, and irrigation sectors.19
In 2017, five REIDI’s projects related to highways were approved: The total private investment was R$2.1 billion and R$113 million was exempted (Ministério dos Transportes, Portos e Aviação Civil 2017).
Infrastructure Debentures. In 2011, the federal government created a fiscal incentive for financing infrastructure private investments in priority matters, such as transport and logistics. The incentive consists of exempting the income tax over earned income from infrastructure investment debenture (Ministério dos Transportes, Portos e Aviação Civil, Transportes 2016).
18 Given that road and railway infrastructure represent the main cargo transportation modes, this paper does not describe the waterways plans: Integrated Waterway National Plan (PNIH), the National Port’s Logistic Plan (PNLP), and the Strategic Water-way Plan (PHE). In addition, since this paper is focused on national programs and policies, each State’s logistics and transport plans (PELT) are not described.
19 Law No. 11,488/2007.
URBAN MOBILITY
INTRODUCTION: BRAZIL’S URBAN MOBILITY POLICIES AND INSTITUTIONAL LANDSCAPE
Improving urban mobility can have significant impacts on energy consumption, economic development, and the reduction of local and global emissions. However, Brazil faces significant challenges to improve and expand its urban mobility systems sustainably.
Brazil’s history features four phases of urban mobility:
(i) Decentralized urban policy, and encouragement for motorized vehicles;
(ii) Centralized urban policy, and the beginning of a national system of urban transportation;
(iii) International economic crisis, and a pause in the development of national urban mobility policies; and
(iv) The beginning of economic stability, and the recovery of the development of national urban mobility policies.
Today’s urban mobility policy framework is somewhat recent, concentrated in the last phase, which started in the second half of the 1990s.
Historically, Brazil has emphasized mobility policies that improve the efficiency of vehicles and supporting infrastructure. Brazil’s targets from the transportation sector, as stated in its NDC, replicate this historical prevalence. Policies that allow travel to be avoided and policies that shift travel to more efficient modes have only recently been contemplated in the Brazilian policy framework through the National Urban Mobility Policy Act (Política Nacional de Mobilidade Urbana - PNMU).
The PNMU, approved in 2012, had the role of reshaping the direction of Brazil’s urban mobility by prioritizing non-motorized over motorized transport and collective over individual modes of transport. It also requires that cities with more than 20,000 inhabitants develop mobility plans. However, six years after the approval of this policy, only 9% of cities have completed their plans (Ministério das Cidades 2018), indicating that additional efforts should be made to assist municipalities to complete this task.
Further emphasis should also be placed on measures related to transport demand management and on public transport improvements.
TRANSPORTATION AND URBAN MOBILITY POLICIES BACKGROUND
Transport and urban mobility policies are highly connected to the way the country and its cities have developed. As explained in the introduction, throughout Brazil’s history, four phases of urban mobility can be identified. Each phase is associated with a different economic and political context. Figure 9.5 below illustrates each of these phases.
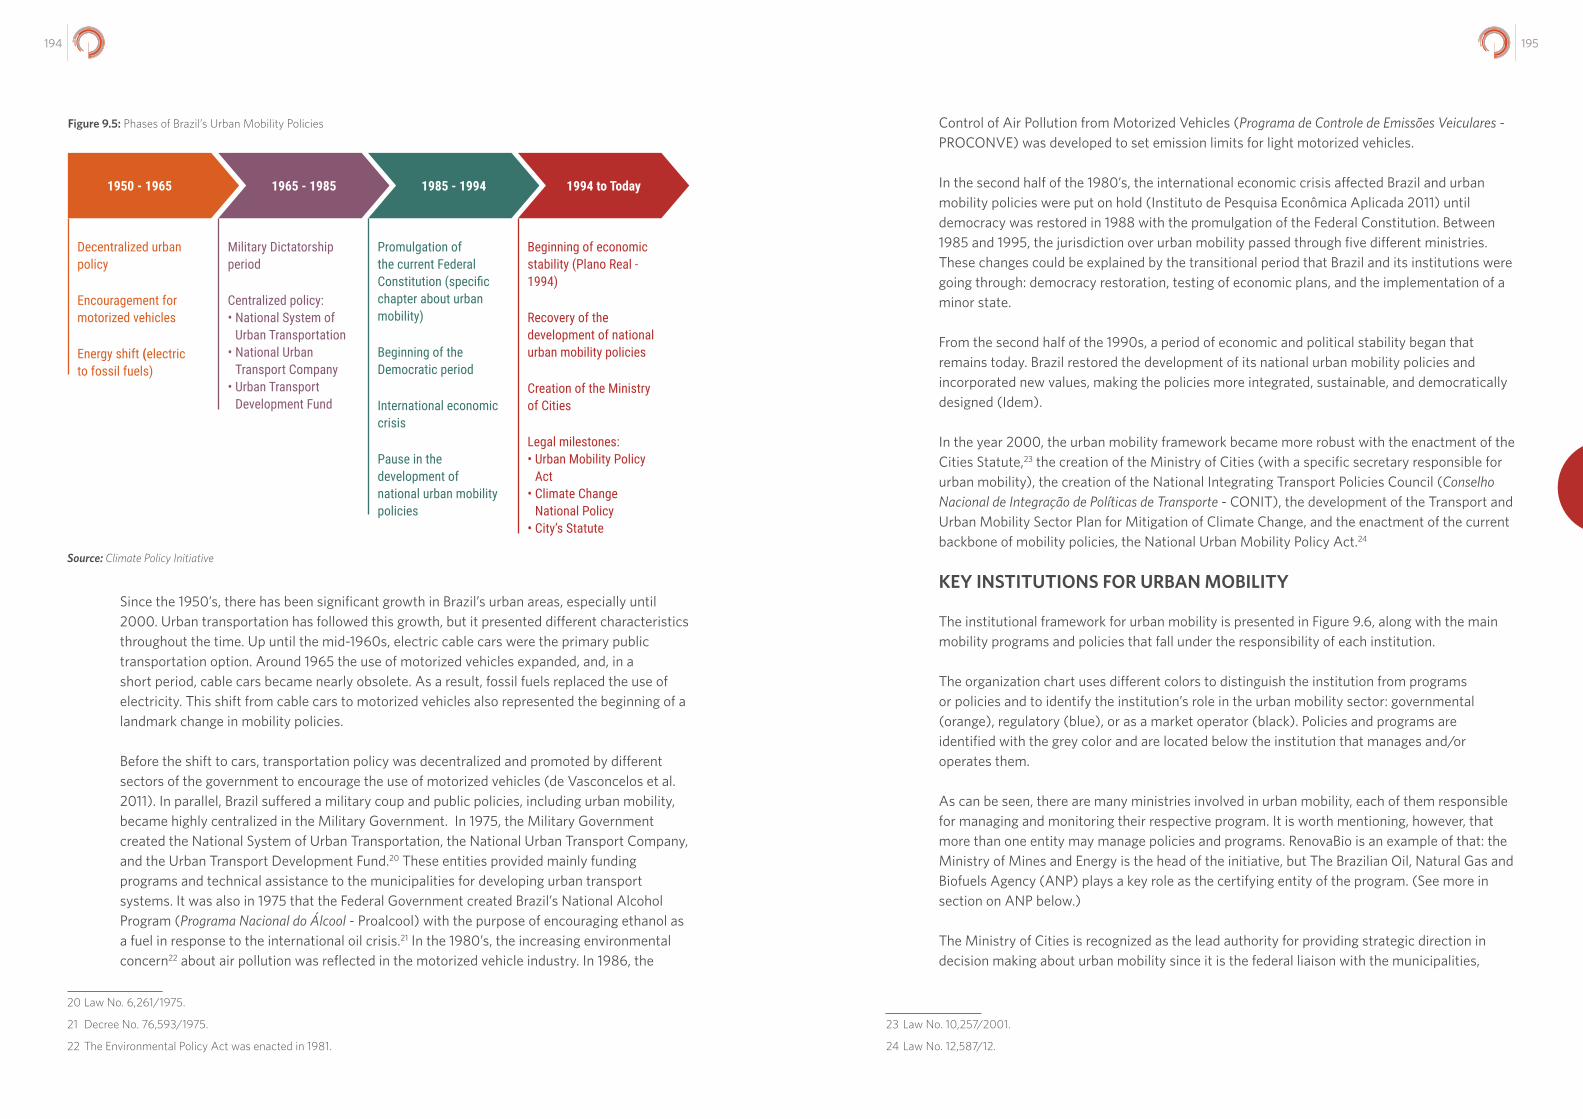
195194
Figure 9.5: Phases of Brazil’s Urban Mobility Policies Control of Air Pollution from Motorized Vehicles (Programa de Controle de Emissões Veiculares - PROCONVE) was developed to set emission limits for light motorized vehicles.
In the second half of the 1980’s, the international economic crisis affected Brazil and urban mobility policies were put on hold (Instituto de Pesquisa Econômica Aplicada 2011) until democracy was restored in 1988 with the promulgation of the Federal Constitution. Between 1985 and 1995, the jurisdiction over urban mobility passed through five different ministries. These changes could be explained by the transitional period that Brazil and its institutions were going through: democracy restoration, testing of economic plans, and the implementation of a minor state.
From the second half of the 1990s, a period of economic and political stability began that remains today. Brazil restored the development of its national urban mobility policies and incorporated new values, making the policies more integrated, sustainable, and democratically designed (Idem).
In the year 2000, the urban mobility framework became more robust with the enactment of the Cities Statute,23 the creation of the Ministry of Cities (with a specific secretary responsible for urban mobility), the creation of the National Integrating Transport Policies Council (Conselho Nacional de Integração de Políticas de Transporte - CONIT), the development of the Transport and Urban Mobility Sector Plan for Mitigation of Climate Change, and the enactment of the current backbone of mobility policies, the National Urban Mobility Policy Act.24
KEY INSTITUTIONS FOR URBAN MOBILITY
The institutional framework for urban mobility is presented in Figure 9.6, along with the main mobility programs and policies that fall under the responsibility of each institution.
The organization chart uses different colors to distinguish the institution from programs or policies and to identify the institution’s role in the urban mobility sector: governmental (orange), regulatory (blue), or as a market operator (black). Policies and programs are identified with the grey color and are located below the institution that manages and/or operates them.
As can be seen, there are many ministries involved in urban mobility, each of them responsible for managing and monitoring their respective program. It is worth mentioning, however, that more than one entity may manage policies and programs. RenovaBio is an example of that: the Ministry of Mines and Energy is the head of the initiative, but The Brazilian Oil, Natural Gas and Biofuels Agency (ANP) plays a key role as the certifying entity of the program. (See more in section on ANP below.)
The Ministry of Cities is recognized as the lead authority for providing strategic direction in decision making about urban mobility since it is the federal liaison with the municipalities,
23 Law No. 10,257/2001.
24 Law No. 12,587/12.
1994 to Today1965 - 1985 1985 - 1994
Decentralized urban policy
Encouragement for motorized vehicles
Energy shift (electric to fossil fuels)
Military Dictatorship period
Centralized policy: • National System of
Urban Transportation• National Urban
Transport Company• Urban Transport
Development Fund
Promulgation of the current Federal Constitution (specific chapter about urban mobility)
Beginning of the Democratic period
International economic crisis
Pause in the development of national urban mobility policies
Beginning of economic stability (Plano Real - 1994)
Recovery of the development of national urban mobility policies
Creation of the Ministry of Cities
Legal milestones:• Urban Mobility Policy
Act • Climate Change
National Policy• City’s Statute
1950 - 1965
Source: Climate Policy Initiative
Since the 1950’s, there has been significant growth in Brazil’s urban areas, especially until 2000. Urban transportation has followed this growth, but it presented different characteristics throughout the time. Up until the mid-1960s, electric cable cars were the primary public transportation option. Around 1965 the use of motorized vehicles expanded, and, in a short period, cable cars became nearly obsolete. As a result, fossil fuels replaced the use of electricity. This shift from cable cars to motorized vehicles also represented the beginning of a landmark change in mobility policies.
Before the shift to cars, transportation policy was decentralized and promoted by different sectors of the government to encourage the use of motorized vehicles (de Vasconcelos et al. 2011). In parallel, Brazil suffered a military coup and public policies, including urban mobility, became highly centralized in the Military Government. In 1975, the Military Government created the National System of Urban Transportation, the National Urban Transport Company, and the Urban Transport Development Fund.20 These entities provided mainly funding programs and technical assistance to the municipalities for developing urban transport systems. It was also in 1975 that the Federal Government created Brazil’s National Alcohol Program (Programa Nacional do Álcool - Proalcool) with the purpose of encouraging ethanol as a fuel in response to the international oil crisis.21 In the 1980’s, the increasing environmental concern22 about air pollution was reflected in the motorized vehicle industry. In 1986, the
20 Law No. 6,261/1975.
21 Decree No. 76,593/1975.
22 The Environmental Policy Act was enacted in 1981.
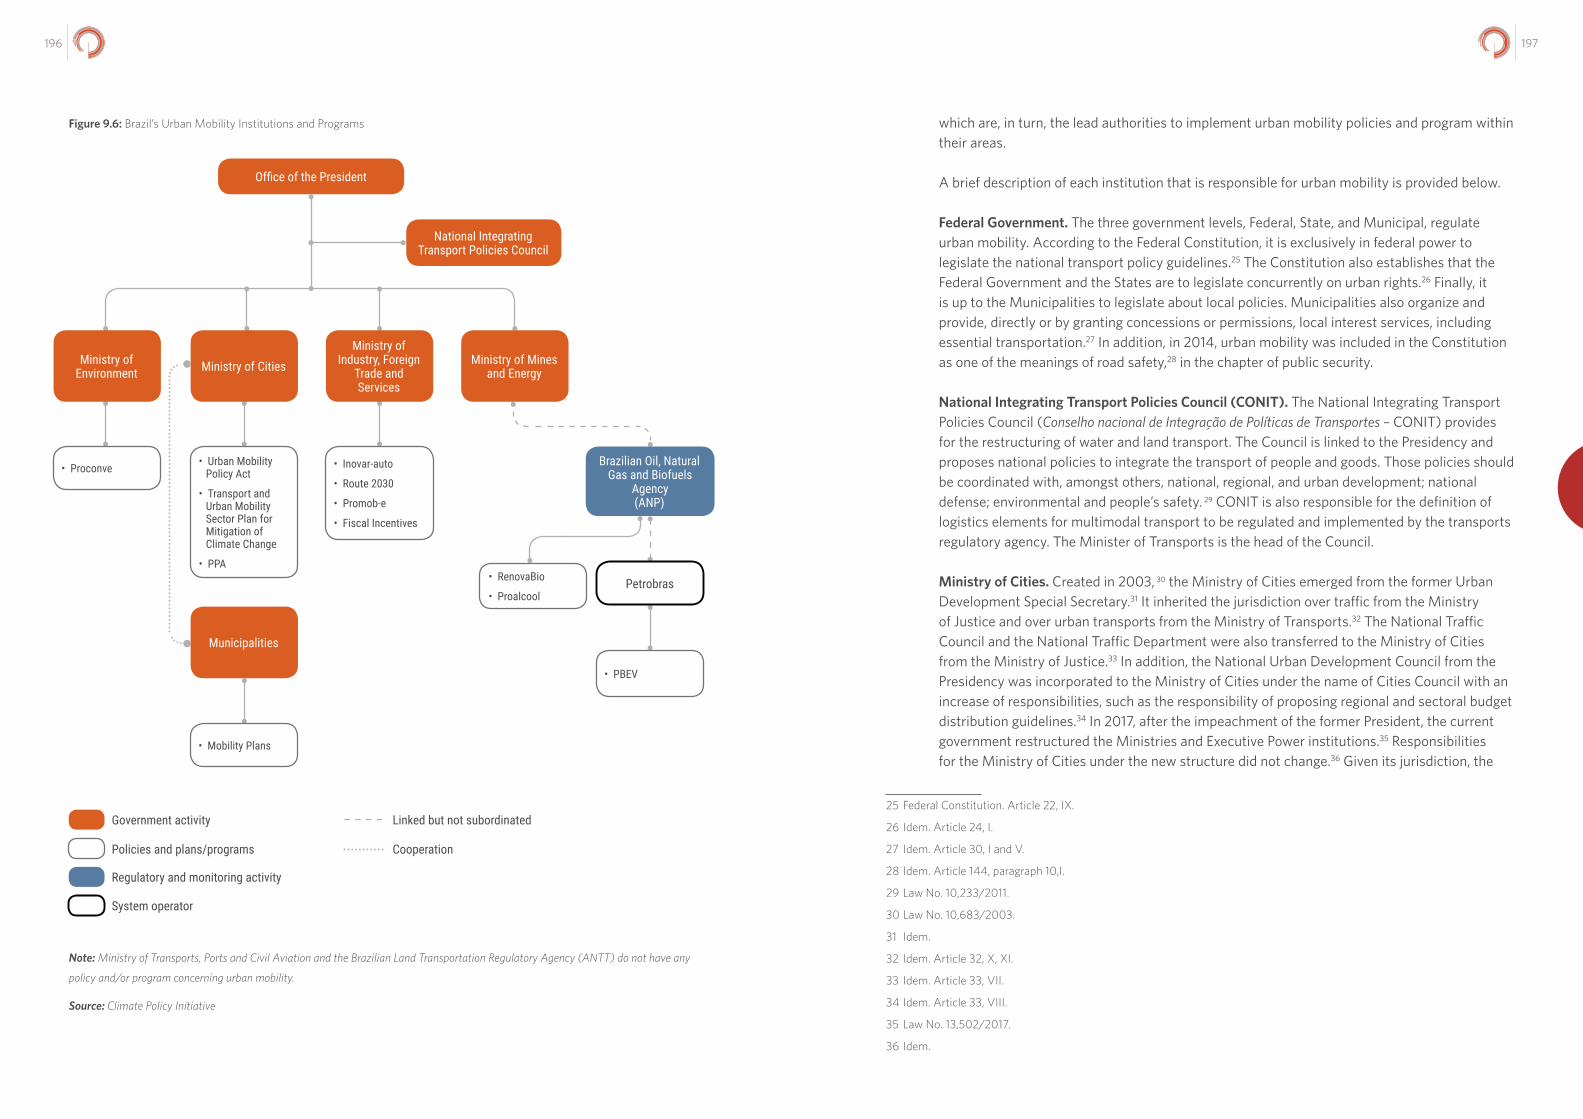
197196
which are, in turn, the lead authorities to implement urban mobility policies and program within their areas.
A brief description of each institution that is responsible for urban mobility is provided below.
Federal Government. The three government levels, Federal, State, and Municipal, regulate urban mobility. According to the Federal Constitution, it is exclusively in federal power to legislate the national transport policy guidelines.25 The Constitution also establishes that the Federal Government and the States are to legislate concurrently on urban rights.26 Finally, it is up to the Municipalities to legislate about local policies. Municipalities also organize and provide, directly or by granting concessions or permissions, local interest services, including essential transportation.27 In addition, in 2014, urban mobility was included in the Constitution as one of the meanings of road safety,28 in the chapter of public security.
National Integrating Transport Policies Council (CONIT). The National Integrating Transport Policies Council (Conselho nacional de Integração de Políticas de Transportes – CONIT) provides for the restructuring of water and land transport. The Council is linked to the Presidency and proposes national policies to integrate the transport of people and goods. Those policies should be coordinated with, amongst others, national, regional, and urban development; national defense; environmental and people’s safety. 29 CONIT is also responsible for the definition of logistics elements for multimodal transport to be regulated and implemented by the transports regulatory agency. The Minister of Transports is the head of the Council.
Ministry of Cities. Created in 2003, 30 the Ministry of Cities emerged from the former Urban Development Special Secretary.31 It inherited the jurisdiction over traffic from the Ministry of Justice and over urban transports from the Ministry of Transports.32 The National Traffic Council and the National Traffic Department were also transferred to the Ministry of Cities from the Ministry of Justice.33 In addition, the National Urban Development Council from the Presidency was incorporated to the Ministry of Cities under the name of Cities Council with an increase of responsibilities, such as the responsibility of proposing regional and sectoral budget distribution guidelines.34 In 2017, after the impeachment of the former President, the current government restructured the Ministries and Executive Power institutions.35 Responsibilities for the Ministry of Cities under the new structure did not change.36 Given its jurisdiction, the
25 Federal Constitution. Article 22, IX.
26 Idem. Article 24, I.
27 Idem. Article 30, I and V.
28 Idem. Article 144, paragraph 10,I.
29 Law No. 10,233/2011.
30 Law No. 10,683/2003.
31 Idem.
32 Idem. Article 32, X, XI.
33 Idem. Article 33, VII.
34 Idem. Article 33, VIII.
35 Law No. 13,502/2017.
36 Idem.
Office of the President
National Integrating Transport Policies Council
Ministry of Environment
• Proconve
Ministry of Industry, Foreign
Trade and Services
• Inovar-auto
• Route 2030
• Promob-e
• Fiscal Incentives
Ministry of Cities
• Urban Mobility Policy Act
• Transport and Urban Mobility Sector Plan for Mitigation of Climate Change
• PPA
• Mobility Plans
Brazilian Oil, NaturalGas and Biofuels
Agency(ANP)
Petrobras
• PBEV
Ministry of Mines and Energy
• RenovaBio
• Proalcool
Municipalities
Note: Ministry of Transports, Ports and Civil Aviation and the Brazilian Land Transportation Regulatory Agency (ANTT) do not have any
policy and/or program concerning urban mobility.
Figure 9.6: Brazil’s Urban Mobility Institutions and Programs
Source: Climate Policy Initiative
Government activity Linked but not subordinated
Policies and plans/programs Cooperation
Regulatory and monitoring activity
System operator
199198
Ministry of the Cities plays a key role in promoting the implementation of the National Urban Mobility Policy Act (Política Nacional de Mobilidade Urbana - PNMU) by cooperating with Municipalities to elaborate their Urban Mobility Plan, to improve professional capacity, and by granting funding (Araldi 2018). Recently, the Ministry of the Cities made a cooperation agreement with the Planning and Logistics Office S.A. (EPL) to obtain full access to transport and logistics data developed by EPL (Empresa de Planejamento e Logística 2018).
Ministry of Industry, Foreign Trade, and Services (MDIC). Ministry of Industry, Foreign Trade, and Services (MDIC) had an increase in its responsibilities in the 2017 Ministries and Presidency’s institutional restructuring.37 All of the new responsibilities concern giving support to micro and small business development and to registry and regularization of existing companies. MDIC is now responsible for the planning, coordination, and monitoring of science, technology, and innovation activities.38 Regarding the mobility sector, the MDIC works on four programs that are discussed in the biofuels section:
(i) Inovar-Auto;
(ii) PROMOB-e;
(iii) Rout 2030; and
(iv) Import tax reduction on hybrid and electric cars.
Ministry of Mines and Energy (MME). Created in 1960, the Ministry of Mines and Energy (MME) had a rocky start. In 1990 it was terminated and its responsibilities were transferred to the Ministry of Infrastructure. After two years, in 1992, the MME was created again. 39 Since then, its responsibilities stayed the same, even after two ministerial reforms. 40 Besides other responsibilities, 41 MME has jurisdiction over oil, fuel, and electric energy. Concerning motorized transportation, the Ministry mainly works on energy efficiency matters and fuel offers. In the Energy Efficiency National Plan (Plano Nacional de Eficiência Energética – PNEf), elaborated by MME, there is a section dedicated exclusively to passenger transportation and cargo.
Ministry of Environment (MMA). The Special Secretariat for the Environment, created in 1973, was the first federal body in charge of the environment. In 1985, the secretariat was subordinated to the newly created Ministry of Urban Development and Environment, which was renamed as Ministry of the Environment in 1992. Today, the Ministry of the Environment (Ministério de Meio Ambiente - MMA) is the central environmental authority, responsible for promoting strategies for the protection and restoration of the environment; for the sustainable use of natural resources; for the valuing of environmental services; and for the inclusion of sustainable development in public policies. Regarding the transport and urban mobility sector,
37 Idem.
38 Idem.
39 Law No. 8,422/1992.
40 The ministerial reforms were made by Law No. 10,683/2003 and by Law No. 13,502/2017.
41 MME has jurisdiction over: geology; mineral and energy resources; hydropower; mining and metallurgy; energy expansion in rural areas and agroenergy; and oil, fuel, and electric energy.
the MMA is responsible for the Vehicles Emissions Control Program (Programa de Controle de Poluição do Ar por Veículos. Automotores - PROCONVE).
Energy Research Office (EPE). The Energy Research Office (Empresa de Pesquisa Energética – EPE)42 “aims at supporting the Brazilian Ministry of Mines and Energy (MME) energy policies with studies and research on energy planning covering electricity, oil, natural gas and its derivatives and biofuels”(Empresa de Pesquisa Energética n/d). The Research Office is state-owned, and its responsibility is to, among others:
(i) Elaborate studies and energy matrix projections;
(ii) Give publicity to the national energy balance; and
(iii) Obtain the environmental permit and the declaration of water availability to enroll in public hydroelectric generation auctions and also in transmission auctions.43
The studies and research developed by EPE support MME development, planning, and implementation of the national energy policy. EPE took part in the elaboration of the Energy Efficiency National Plan and follows the MME in its approach to energy efficiency. EPE also helped in the elaboration of transport energy efficiency programs.
Municipalities. Municipalities have a significant role in the National Urban Mobility Policy Act (PNMU) because they have the Constitutional responsibility to legislate on matters of local interest and to organize and offer, directly or by concession or permission, public services of local interest, including essential mass-transportation. According to the PNMU, municipalities with more than 20,000 citizens have until 2019 to elaborate their Urban Mobility Plan.44 After this deadline, they are not eligible for federal funds for urban mobility until they present their Plan.45 Municipalities that do not have a public transportation system should focus their Urban Mobility Plans on non-motorized vehicles and in urban infrastructure to promote walking or bicycle use. The Ministry of Cities may cooperate with Municipalities to pursue Urban Mobility Plan elaboration and implementation.
Brazilian Oil, Natural Gas and Biofuels Agency (ANP). Created in 1997, by what is known as the petroleum law, 46 the Brazilian Oil, Natural Gas and Biofuels Agency (Agência Nacional do Petróleo, Gás Natural e Biocumbustíveis – ANP) regulates the Brazilian oil, natural gas, and biofuel industries. The ANP promotes regulation, establishes the rules for contracting, and supervises the economic activities that are part of the oil, natural gas, and biofuels industry. It is linked to the MME, but as a regulatory agency, it is independent and has autonomy. Concerning the transport sector, ANP is the certifying entity of RenovaBio, the current biofuels national policy.47
42 Law No. 10,847/2004.
43 Idem.
44 Law No. 12,587/2012. Article 24, paragraph 4°.
45 Idem. Article 24, paragraph 6°.
46 Law No. 9,478/1997.
47 Law No. 13,576/2017.
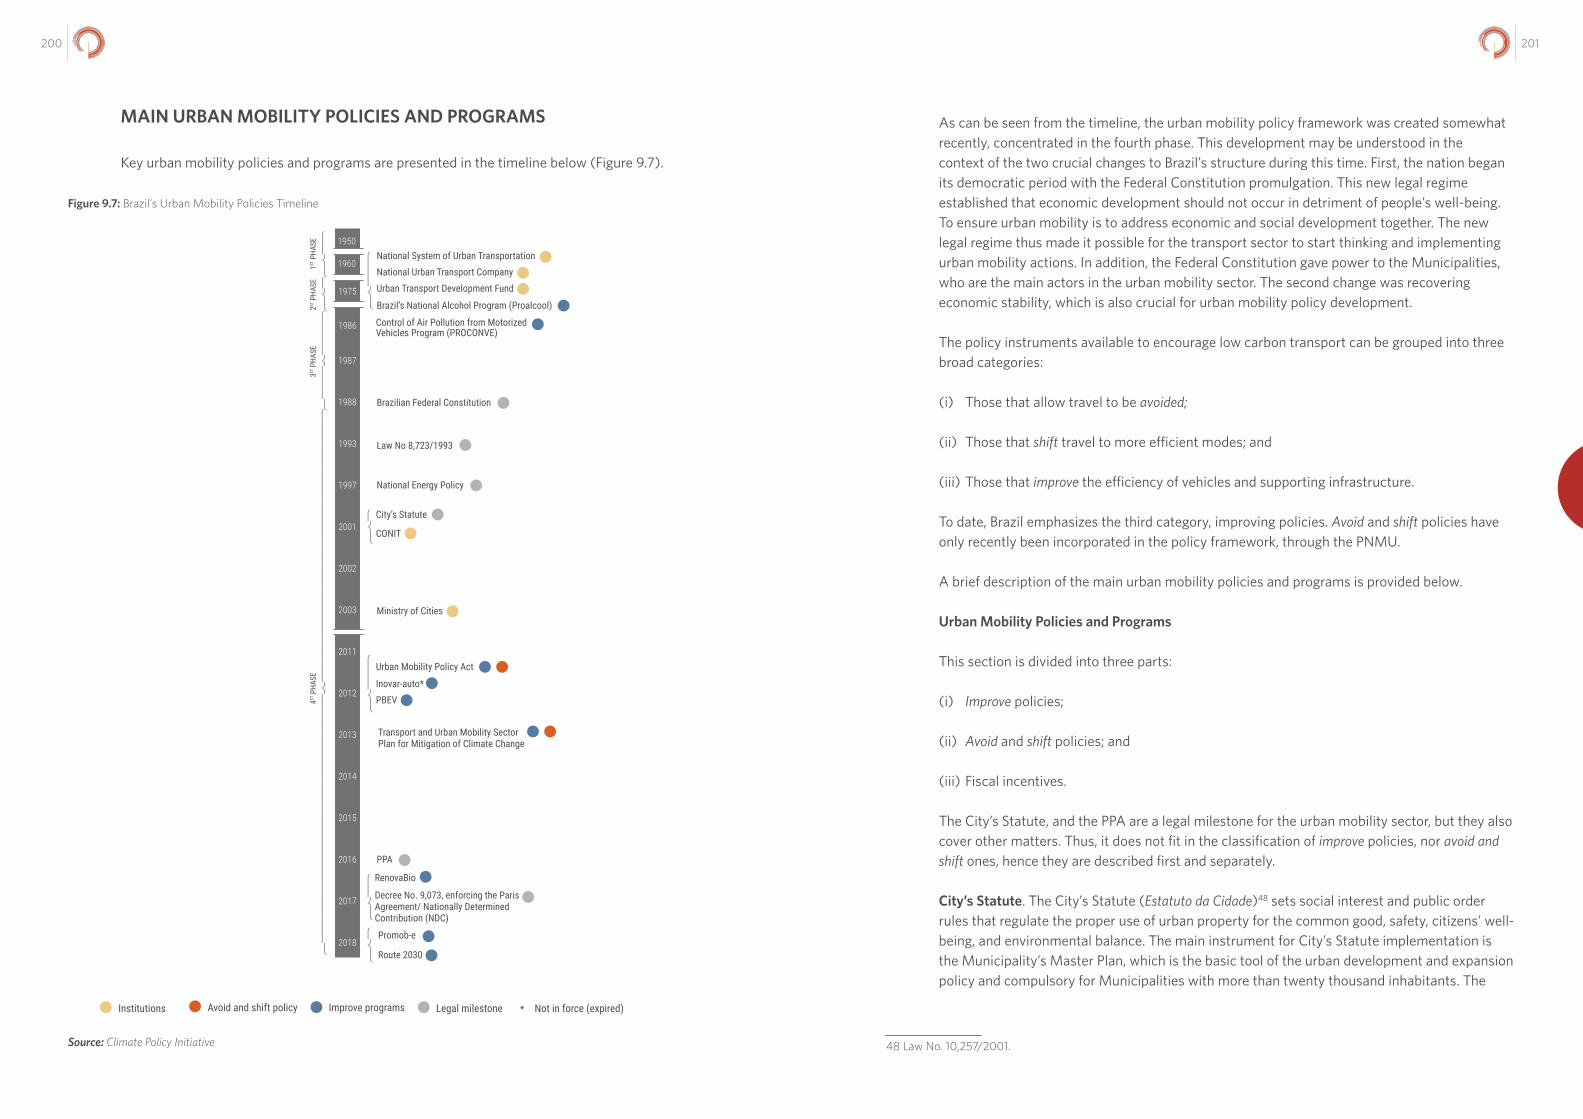
201200
MAIN URBAN MOBILITY POLICIES AND PROGRAMS
Key urban mobility policies and programs are presented in the timeline below (Figure 9.7).
Figure 9.7: Brazil’s Urban Mobility Policies Timeline
As can be seen from the timeline, the urban mobility policy framework was created somewhat recently, concentrated in the fourth phase. This development may be understood in the context of the two crucial changes to Brazil’s structure during this time. First, the nation began its democratic period with the Federal Constitution promulgation. This new legal regime established that economic development should not occur in detriment of people’s well-being. To ensure urban mobility is to address economic and social development together. The new legal regime thus made it possible for the transport sector to start thinking and implementing urban mobility actions. In addition, the Federal Constitution gave power to the Municipalities, who are the main actors in the urban mobility sector. The second change was recovering economic stability, which is also crucial for urban mobility policy development.
The policy instruments available to encourage low carbon transport can be grouped into three broad categories:
(i) Those that allow travel to be avoided;
(ii) Those that shift travel to more efficient modes; and
(iii) Those that improve the efficiency of vehicles and supporting infrastructure.
To date, Brazil emphasizes the third category, improving policies. Avoid and shift policies have only recently been incorporated in the policy framework, through the PNMU.
A brief description of the main urban mobility policies and programs is provided below.
Urban Mobility Policies and Programs
This section is divided into three parts:
(i) Improve policies;
(ii) Avoid and shift policies; and
(iii) Fiscal incentives.
The City’s Statute, and the PPA are a legal milestone for the urban mobility sector, but they also cover other matters. Thus, it does not fit in the classification of improve policies, nor avoid and shift ones, hence they are described first and separately.
City’s Statute. The City’s Statute (Estatuto da Cidade)48 sets social interest and public order rules that regulate the proper use of urban property for the common good, safety, citizens’ well-being, and environmental balance. The main instrument for City’s Statute implementation is the Municipality’s Master Plan, which is the basic tool of the urban development and expansion policy and compulsory for Municipalities with more than twenty thousand inhabitants. The
48 Law No. 10,257/2001.
2016
2015
2014
2013
2012
2011
2003
1988
1993
1997
2002
1987
2001
1986
2017
2018
1975
1950
1960
2ST P
HASE
1ST P
HASE
Institutions Legal milestone
3ST P
HASE
4ST P
HASE
National System of Urban Transportation National Urban Transport Company Urban Transport Development Fund
Brazil’s National Alcohol Program (Proalcool)
Control of Air Pollution from Motorized Vehicles Program (PROCONVE)
Brazilian Federal Constitution
Law No 8,723/1993
National Energy Policy
Ministry of Cities
PPA
City’s Statute
CONIT
Urban Mobility Policy Act
Inovar-auto*PBEV
Transport and Urban Mobility Sector Plan for Mitigation of Climate Change
Decree No. 9,073, enforcing the Paris Agreement/ Nationally Determined Contribution (NDC)
RenovaBio
Promob-e
Avoid and shift policy Improve programs Not in force (expired)*
Route 2030
Source: Climate Policy Initiative
203202
City’s Statute also establishes that Municipalities with more than five thousand inhabitants must elaborate an integrated urban transport plan in accordance with the city’s Master Plan.49
Pluriannual Plan (PPA) For urban mobility the PPA establishes three main goals:
(i) Support the deployment, expansion and re-qualification of mobility systems with affordable, sustainable solutions compatible with local and regional levels, prioritizing modes of mass public transportation and non-motorized vehicles and promoting modal, physical and tariff integration;
(ii) Enforce the PNMU by promoting the institutional strengthening of the sector, and integrated planning for local and territorial development; and
(iii) Promote traffic safety and education though the implementation of the PNT.
I. “Improve” Policies
One category of policy instruments available to encourage low carbon transport aims at improving vehicles or fuel efficiency.
Historically, Brazil has emphasized this kind of policy. The first improve policy had an environmental background: it sets GHG emissions standards for motorized vehicles. To achieve air standards, the auto-industry had to develop more efficient vehicles and/or fuels. Afterwards, Brazil kept focusing on “improving” policies, as listed and described below.
PROCONVE. The Control of Air Pollution from Motorized Vehicles Program (Programa de controle de emissões veiculares - PROCONVE) was enacted in 1986. 50 The program set limits on emissions by motorized vehicles for the following purposes:
(i) Reduce levels of air pollution by motorized vehicles;
(ii) Promote national technology development;
(iii) Create inspection and monitoring programs;
(iv) Promote public awareness about air pollution by motorized vehicle;
(v) Establish assessment criteria to evaluate achieved results; and
(vi) Promote techniques for liquid fuel development. 51
It is the oldest program still in force in Brazil, and throughout the years, the program has set different emissions limits. In the 1980’s, the limit was 25g/Km of carbon oxide, which meant
49 Idem. Article 14, paragraph 2.
50 CONAMA’s Resolution No. 18/1986.
51 Idem.
50% less than the light vehicles emissions average. In 1989, the limit reduced to 12g/Km of carbon oxide. The last reduction52 made set the limit to 1.3g/Km of carbon oxide from 2013 (vehicles by diesel) or 2014 (vehicles by gasoline or alcohol).53
Regarding air pollution, the federal government enacted a law54 that sets the reduction of GHG emissions by motorized vehicles.
PBEV. The National Program of Rationalized Use of Oil By-Products and Natural Gas (Programa Nacional da Racionalização do Uso dos Derivados do Petróleo e do Gás Natural -CONPET)55 is coordinated by the Ministry of Mines and Energy and executed by Petrobras. The main goals of the program are as follows: to decrease oil by-product and natural gas consumption; to decrease GEE emissions; to promote R&D; and to provide technical support for an increase in EE in the energy final use. Concerning light vehicles, CONPET promotes Brazil’s Vehicle Labelling Program (Programa Brasileiro de Etiquetagem Veicular - PBEV), which is a voluntary action for manufacturer to declare their vehicles’ efficiency and inform the consumer (Programa Nacional da Racionalização do Uso dos Derivados do Petróleo e do Gás Natural 2012).
Route 2030. Route 2030 (Rota 2030) was recently published by a Provisional Measure (Medida Provisória), which means that the National Congress has to approve it in the next 120 days,56 otherwise the program will be revoked. Until then, though, the program is in force. The program’s goals are, among others:
(i) Boost energy efficiency, the structural performance and the availability of driver-assistance technologies of commercialized vehicles in the country;
(ii) Increase research, development, and innovation in Brazil;
(iii) Encourage new technologies, production, and innovation, accordingly with global technological trends; and
(iv) Promote biofuels, and alternative propulsion techniques, and to value Brazilian energy matrix.57
The Provisional Measure sets that the federal government must establish mandatory requirements for car labelling, auto energy efficiency, and structural performance tied to driver-assistance technologies. New vehicles produced nationally and new imported vehicles must comply with those requirements or companies will be fined. It is worth noting, though, that the federal government has not set yet those requirements.
52 CONAMA’s Resolution No. 415/2009.
53 Idem.
54 Law No.8,723/1993.
55 Decree from 18h of July of 1991.
56 The Provisional Measure was published in July 06th 2018.
57 Provisional Measure No. 843/2018.
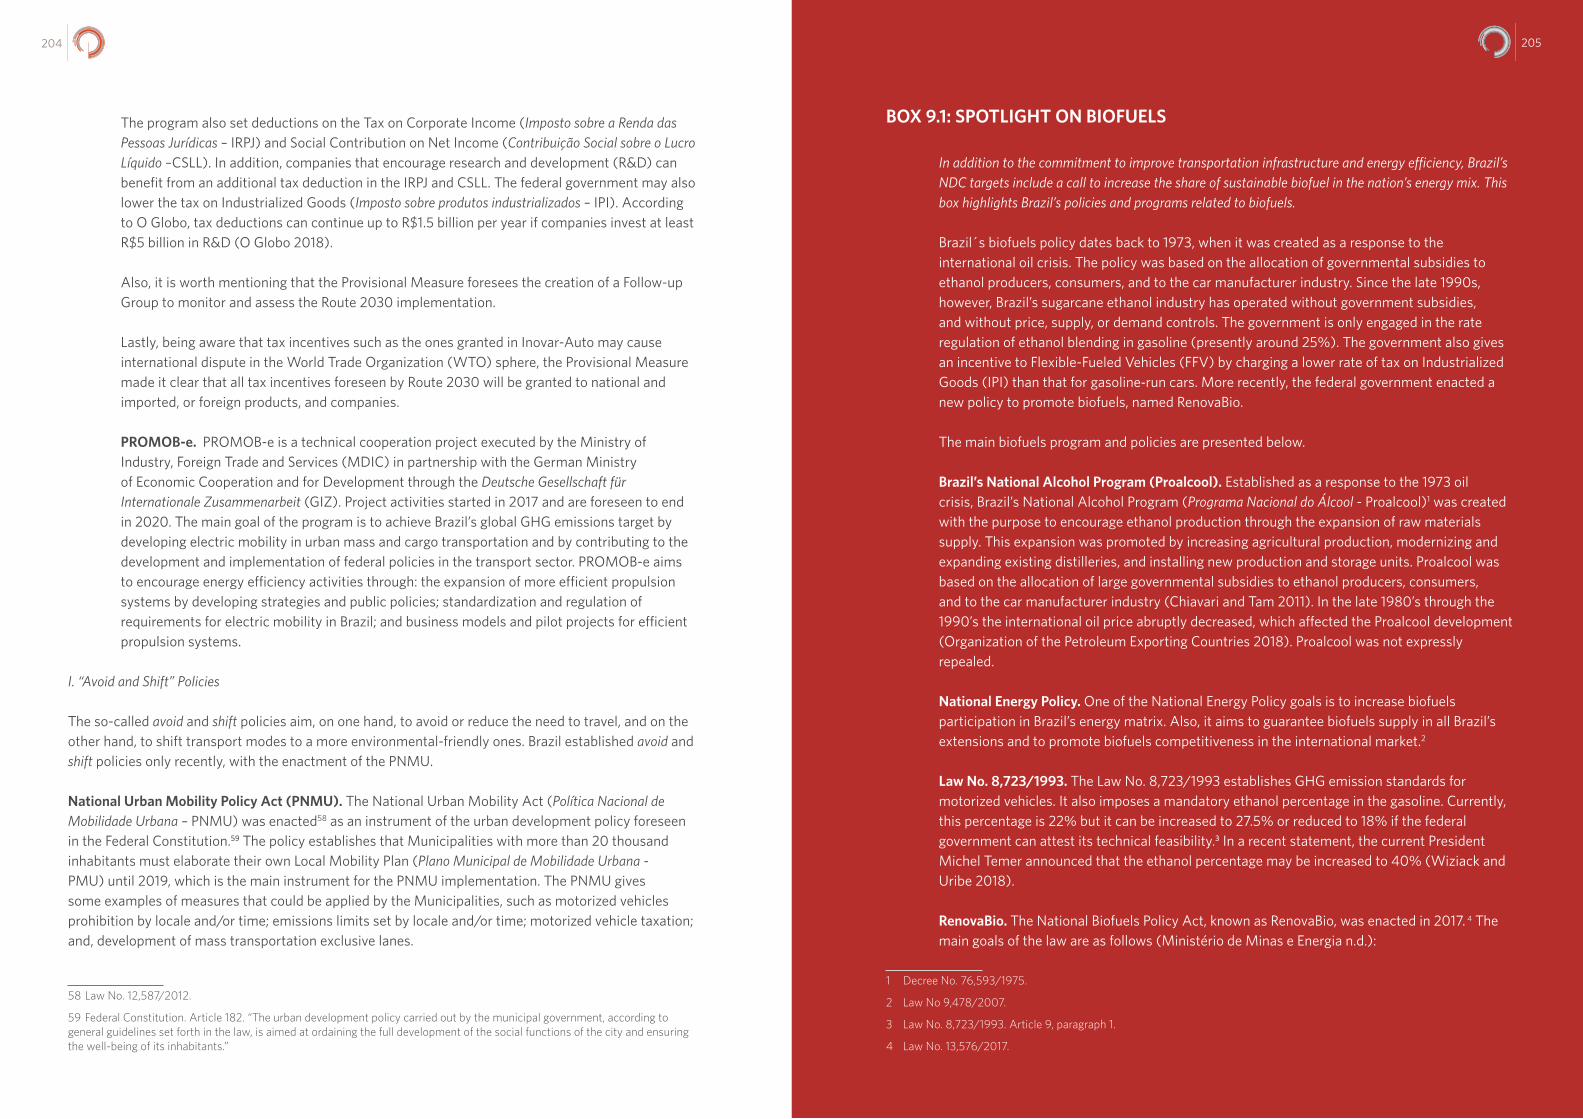
205204
The program also set deductions on the Tax on Corporate Income (Imposto sobre a Renda das Pessoas Jurídicas – IRPJ) and Social Contribution on Net Income (Contribuição Social sobre o Lucro Líquido –CSLL). In addition, companies that encourage research and development (R&D) can benefit from an additional tax deduction in the IRPJ and CSLL. The federal government may also lower the tax on Industrialized Goods (Imposto sobre produtos industrializados – IPI). According to O Globo, tax deductions can continue up to R$1.5 billion per year if companies invest at least R$5 billion in R&D (O Globo 2018).
Also, it is worth mentioning that the Provisional Measure foresees the creation of a Follow-up Group to monitor and assess the Route 2030 implementation.
Lastly, being aware that tax incentives such as the ones granted in Inovar-Auto may cause international dispute in the World Trade Organization (WTO) sphere, the Provisional Measure made it clear that all tax incentives foreseen by Route 2030 will be granted to national and imported, or foreign products, and companies.
PROMOB-e. PROMOB-e is a technical cooperation project executed by the Ministry of Industry, Foreign Trade and Services (MDIC) in partnership with the German Ministry of Economic Cooperation and for Development through the Deutsche Gesellschaft für Internationale Zusammenarbeit (GIZ). Project activities started in 2017 and are foreseen to end in 2020. The main goal of the program is to achieve Brazil’s global GHG emissions target by developing electric mobility in urban mass and cargo transportation and by contributing to the development and implementation of federal policies in the transport sector. PROMOB-e aims to encourage energy efficiency activities through: the expansion of more efficient propulsion systems by developing strategies and public policies; standardization and regulation of requirements for electric mobility in Brazil; and business models and pilot projects for efficient propulsion systems.
I. “Avoid and Shift” Policies
The so-called avoid and shift policies aim, on one hand, to avoid or reduce the need to travel, and on the other hand, to shift transport modes to a more environmental-friendly ones. Brazil established avoid and shift policies only recently, with the enactment of the PNMU.
National Urban Mobility Policy Act (PNMU). The National Urban Mobility Act (Política Nacional de Mobilidade Urbana – PNMU) was enacted58 as an instrument of the urban development policy foreseen in the Federal Constitution.59 The policy establishes that Municipalities with more than 20 thousand inhabitants must elaborate their own Local Mobility Plan (Plano Municipal de Mobilidade Urbana - PMU) until 2019, which is the main instrument for the PNMU implementation. The PNMU gives some examples of measures that could be applied by the Municipalities, such as motorized vehicles prohibition by locale and/or time; emissions limits set by locale and/or time; motorized vehicle taxation; and, development of mass transportation exclusive lanes.
58 Law No. 12,587/2012.
59 Federal Constitution. Article 182. “The urban development policy carried out by the municipal government, according to general guidelines set forth in the law, is aimed at ordaining the full development of the social functions of the city and ensuring the well-being of its inhabitants.”
205
BOX 9.1: SPOTLIGHT ON BIOFUELS
In addition to the commitment to improve transportation infrastructure and energy efficiency, Brazil’s NDC targets include a call to increase the share of sustainable biofuel in the nation’s energy mix. This box highlights Brazil’s policies and programs related to biofuels.
Brazil´s biofuels policy dates back to 1973, when it was created as a response to the international oil crisis. The policy was based on the allocation of governmental subsidies to ethanol producers, consumers, and to the car manufacturer industry. Since the late 1990s, however, Brazil’s sugarcane ethanol industry has operated without government subsidies, and without price, supply, or demand controls. The government is only engaged in the rate regulation of ethanol blending in gasoline (presently around 25%). The government also gives an incentive to Flexible-Fueled Vehicles (FFV) by charging a lower rate of tax on Industrialized Goods (IPI) than that for gasoline‐run cars. More recently, the federal government enacted a new policy to promote biofuels, named RenovaBio.
The main biofuels program and policies are presented below.
Brazil’s National Alcohol Program (Proalcool). Established as a response to the 1973 oil crisis, Brazil’s National Alcohol Program (Programa Nacional do Álcool - Proalcool)1 was created with the purpose to encourage ethanol production through the expansion of raw materials supply. This expansion was promoted by increasing agricultural production, modernizing and expanding existing distilleries, and installing new production and storage units. Proalcool was based on the allocation of large governmental subsidies to ethanol producers, consumers, and to the car manufacturer industry (Chiavari and Tam 2011). In the late 1980’s through the 1990’s the international oil price abruptly decreased, which affected the Proalcool development (Organization of the Petroleum Exporting Countries 2018). Proalcool was not expressly repealed.
National Energy Policy. One of the National Energy Policy goals is to increase biofuels participation in Brazil’s energy matrix. Also, it aims to guarantee biofuels supply in all Brazil’s extensions and to promote biofuels competitiveness in the international market.2
Law No. 8,723/1993. The Law No. 8,723/1993 establishes GHG emission standards for motorized vehicles. It also imposes a mandatory ethanol percentage in the gasoline. Currently, this percentage is 22% but it can be increased to 27.5% or reduced to 18% if the federal government can attest its technical feasibility.3 In a recent statement, the current President Michel Temer announced that the ethanol percentage may be increased to 40% (Wiziack and Uribe 2018).
RenovaBio. The National Biofuels Policy Act, known as RenovaBio, was enacted in 2017. 4 The main goals of the law are as follows (Ministério de Minas e Energia n.d.):
1 Decree No. 76,593/1975.
2 Law No 9,478/2007.
3 Law No. 8,723/1993. Article 9, paragraph 1.
4 Law No. 13,576/2017.
207206
Local Urban Mobility Plan (PMU). To operate effectively, the PNMU states that urban mobility systems should be an organized and coordinated group of different kinds of transportation, services, and infrastructure that together guarantee the transit of people and goods within the Municipalities.60 Being the main instrument to implement the PNMU, the Local Urban Mobility Plan (Planos Municipais de Mobilidade Urbana – PMU) must embody PNMU’s principles, guidelines, and goals, especially transportation network planning.
According to the Transport and Urban Mobility Sector Plan for Mitigation of Climate Change (Plano Setorial de Transporte e Mobilidade Urbana para Mitigação da Mudança do Clima – PSTM), this network planning allows “scale gains and amplifies the mitigation of greenhouse gases - GHGs, when it guarantees the physical, operational and tariff integration of the different modes of transport in the urban environment” (Ministério dos Transportes and Ministério das Cidades 2013).
Other important goals that the PMU must pursue are the following:
(i) Public mass-transportation;
(ii) Road traffic;
(iii) The infrastructure of the urban mobility system;
(iv) Accessibility for people with disabilities and mobility restrictions;
(v) The integration between public transportation with private and non-motorized modes;
(vi) Operation and discipline cargo transport by road;
(vii) Travel Generator Poles;
60 Law No. 12,587/2012. Article 3.
(viii) Public and private parking areas, free or costly;
(ix) Local and/or time controlled areas prohibited for motorized vehicles;
(x) Public mass-transportation and urban mobility finance mechanism and instruments; and
(xi) PMU update in a term not exceeding 10 (ten) years.
Transport and Urban Mobility Sector Plan for Mitigation of Climate Change (PSTM). The Transport and Urban Mobility Sector Plan for Mitigation of Climate Change (Plano Setorial de Transporte e Mobilidade Urbana para Mitigação da Mudança do Clima – PSTM) was elaborated by the Ministry of Transports and by the Ministry of Cities, in accordance with the National Climate Change Policy61 and with the National Urban Mobility Policy Act (PNMU). It aims at GHG emissions reductions in the transport sector through actions that promote infrastructure expansion for cargo transportation and, in the mobility sector, through increasing energy efficiency in public mass transportation systems.
Concerning the urban mobility sector, the PSTM appoints measures to achieve GHG emissions reduction, such as (Ministério dos Transportes and Ministério das Cidades 2013):
(i) Development of bicycle path systems within the municipalities;
(ii) Better integration between ministries that work on the urban mobility agenda and the ones that work on the climate change agenda;
(iii) Development of energy efficiency standards for light and heavy vehicles and to assess Inovar-Auto results; and
(iv) Better integration between the PSTM and other sectoral plans.
I. Fiscal Incentives
Import Tax Reduction or Exemption. The MDIC through its Foreign Trade Chamber reduced the import tax on hybrid and electric cars. In 2014, the first reduction was from 35% import tax to 0% to 7% for non-plugin hybrid cars (Brasil 2014). In 2015, the same reduction was extended to plugin hybrid cars (Câmara de Comércio Exterior 2015). In 2016, cargo electric cars got import tax exemption (Idem 2016). Although it may seem an incentive for hybrid and electric car use, the impact is not significant given the low rate for this kind of import. Currently, MDIC is working on an industrial product tax (Imposto sobre Produtos Industrializados – IPI) reduction (Zomer 2018).
Incentive Program for Technological Innovation and Strengthening of the Motorized Vehicles Chain of Production (Inovar-Auto) – not in force. The Incentive Program for Technological Innovation and Strengthening of the Motorized Vehicles Chain of Production (Programa de Incentivo à Inovação Tecnológica e Adensamento da Cadeia Produtivas de Veículos Automotores
61 Law No. 12,187/2009.
(i) Contribute to Brazil’s NDC compliance;
(ii) Promote biofuels expansion; and
(iii) Contribute predictable, competitive biofuel participation in the national energy market.
A key instrument of Renovabio is the Decarbonization Credit, which is a new type of trading asset created by the law, but it is still pending regulation to be operable.5 Although it is a recent policy, enacted in December 2017, RenovaBio indicates the government’s willingness to expand and encourage biofuels production (Brasil n/d).
5 Idem. Articles 1 and 4.
209208
- Inovar-Auto) was created to encourage competitiveness in the motorized transport sector; to promote safer and more economic vehicles; to invest in engineering, basic industrial technology, research and development; and to invest in suppliers’ training in the supply chain.62
Inovar-Auto offered tax incentives to new investments in the transport sector for technology improvement of vehicles and machinery, vehicle safety improvement, and vehicle energy efficiency. Companies that produced vehicles in Brazil, companies that didn’t produce but sold vehicles in Brazil, and companies that presented investments projects to produce vehicles in Brazil could participate in the program. Companies had to commit to the program goals and if achieved, they received fiscal incentives (Ministério da Indústria, Comércio Exterior e Serviços 2018). Thirty-three companies registered in the program, twenty-five from suppliers and eight from importers. The program was temporary and ended in December 2017 (Inovar-Auto n/d).
Although the program had an expiration date, Japan and the European Union filed a motion in the World Trade Organization (WTO) claiming that Brazil was practicing unfair competition by giving subsidies only to national companies. The WTO ruled in favor of the complaints and gave Brazil ninety days to withdraw the subsidies (World Trade Organization n/d.). By then, though, the program was already disbanded. Notwithstanding, Brazil filed an appeal given that tax incentives are still in the plans for the government as a way to encourage the auto industry (Paraguassu and Cascione 2017).
62 Law No. 12,715/2012.
REFERENCES
Agência Nacional de Transportes Terrestres. n.d. Concessões Rodoviárias. [Accessed 10 May 2018]. http://www.antt.gov.br/rodovias/Concessoes_Rodoviarias/Index.html
Agência Nacional de Transportes Terrestres. n.d. Institucional. [Accessed 11 May 2018]. http://www.antt.gov.br/institucional/index.html.
Araldi F. 2018. Desafios de mobilidade a nível municipal [PowerPoint slides]. CPI Brazil: Mobility Workshop. Brasília: Royal Tulip, 27 March 2018.
Avançar Parceria. n.d. Sobre o programa. [Accessed 15 May 2018]. http://www.avancarparcerias.gov.br/sobre-o-programa.
Banco Nacional do Desenvolvimento Econômico e Social. 2008. O transporte rodoviário de carga e o papel do BNDES. Rio de Janeiro: Revista do BNDES, 14 (29). [Accessed 09 May 2018]. https://www.bndes.gov.br/SiteBNDES/export/sites/default/bndes_pt/Galerias/Arquivos/conhecimento/revista/rev2902.pdf.
Brasil. n.d. Entenda o que é e como funciona o RenovaBio. [Accessed 16 April 2018]. http://www.brasil.gov.br/economia-e-emprego/2017/12/entenda-o-que-e-e-como-funciona-o-renovabio.
Brasil. 2014. Camex reduz imposto de importação para carros híbridos. [Accessed 19 April 2018]. http://www.brasil.gov.br/economia-e-emprego/2014/09/camex-reduz-imposto-de-importacao-para-carros-hibridos.
Câmara de Comércio Exterior. 2015. Camex aprova redução da alíquota do Imposto de Importação para carros elétricos e movidos à células de combustível. [Accessed 19 April 2018]. http://www.camex.gov.br/noticias-da-camex/262-camex-aprova-reducao-da-aliquota-do-imposto-de-importacao-para-carros-eletricos-e-movidos-a-celulas-de-combustivel.
Câmara de Comércio Exterior. 2016. Camex reduz Imposto de Importação de automóveis elétricos para transporte de mercadorias. [Accessed 19 April 2018]. http://www.camex.gov.br/noticias-da-camex/282-camex-reduz-imposto-de-importacao-de-automoveis-eletricos-para-transporte-de-mercadorias.
Chiavari J, Rezende L. 2016. Improving Brazil’s agricultural productivity by targeting infrastructure. Rio de Janeiro: CPI-Brazil. [Accessed 15 May 2018]. http://www.inputbrasil.org/publicacoes/mudancas-na-infraestrutura-de-transportes-para-melhorias-na-produtividade-agricola/.
Chiavari J, Tam C. 2011. Good practice policy framework for energy technology research, development and demonstration (RD&D). Paris: OECD/IEA. [Accessed 02 May 2018]. https://www.iea.org/publications/freepublications/publication/good_practice_policy.pdf.
211210
de Paula M, Bartelt D. 2016. Mobilidade urbana no Brasil: desafios e alternativas. Rio de Janeiro: Fundação Heinrich Böll. [Accessed 12 June 2018]. https://br.boell.org/pt-br/2016/12/12/mobilidade-urbana-no-brasil-desafios-e-alternativas.
de Vasconcellos EA, de Carvalho CHR, Pereira RHM. 2011. Transporte e mobilidade urbana. Rio de Janeiro: Instituto de Pesquisa Econômica Aplicada, No. 1552. [Accessed 02 May 2018]. https://www.econstor.eu/bitstream/10419/91298/1/661582272.pdf.
Empresa de Pesquisa Energética. n.d. Who we are. [Accessed 09 April 2018]. http://www.epe.gov.br/en/about-epe/who-we-are.
Empresa de Planejamento e Logística. n.d. Institucional. [Accessed 11 May 2018]. http://www.epl.gov.br/institucional.
Empresa de Planejamento e Logística. 2015. Program of investment in logistics 2015-2018. [Accessed 18 May 2018]. http://www.epl.gov.br/publicacoes1.
Empresa de Planejamento e Logística. 2015. Plano Nacional de Logística Integrada – PNLI. [Accessed 15 May 2018]. http://www.agricultura.gov.br/assuntos/camaras-setoriais-tematicas/documentos/camaras-tematicas/infraestrutura-e-logistica/anos-anteriores/plano-nacional-de-logistica-integrada-pnli-51.pdf.
Empresa de Planejamento e Logística. 2018. Plano Nacional de Logística. [Accessed 10 May 2018]. http://www.epl.gov.br/consulta-publica-n-1-2018 .
Empresa de Planejamento e Logística. 2018. Sobre o ONTL. [Accessed 04 July 2018]. http://www.ontl.epl.gov.br/sobre-o-ont.
Empresa de Planejamento e Logística. 2018. EPL e Ministério das Cidades firmam acordo para Política Nacional de Mobilidade Urbana. [Accessed 04 July 2018] https://www.epl.gov.br/epl-e-ministerio-das-cidades-firmam-acordo-para-politica-nacional-de-mobilidade-urbana.
Empresa de Planejamento e Logística and Ministério dos Transportes, Portos e Aviação Civil. 2017. Anuário Estatístico de Transportes 2010 – 2016. [Accessed 10 May 2018]. http://www.transportes.gov.br/images/2017/Sumário_Executivo_AET_-_2010_-_2016.pdf.
Galvão OJA. 1996. Desenvolvimento dos transportes e integração regional no Brasil — uma perspectiva histórica. Rio de Janeiro: IPEA. No. 13 Jun 1996. [Accessed 09 May 2018]. http://www.ipea.gov.br/ppp/index.php/PPP/article/view/137/139.
Inovar-Auto. n.d. Sistema de acompanhamento Inovar-Auto. [Accessed 23 April 2018]. http://inovarauto.mdic.gov.br/InovarAuto/public/login.jspx;jsessionid=GSq3hqXTTb2pxTQhPNlyp6t-J7yzdWnwvJ9GDgQJ1NQG2MJWSQBX1!199197868?_adf.ctrl-state=194qoouosj_4.
Instituto Brasileiro de Geografia e Estatística. 2010. Séries históricas e estatísticas: taxa de urbanização. [Accessed 12 June 2018]. https://seriesestatisticas.ibge.gov.br/series.aspx?vcodigo=POP122.
Instituto de Pesquisa Econômica Aplicada. 2011. Infraestrutura Social e Urbana no Brasil: subsídios para uma agenda de pesquisa e formulação de políticas públicas. Rio de Janeiro: Instituto de Pesquisa Econômica Aplicada. [Accessed 04 March 2018]. http://www.mobilize.org.br/midias/pesquisas/a-mobilidade-urbana-no-brasil---ipea2011.pdf.
Instituto de Pesquisa Econômica Aplicada. 2010. Rodovias brasileiras: Gargalos, investimentos, concessões, e preocupações com o futuro. [Accessed 09 May 2018]. http://repositorio.ipea.gov.br/bitstream/11058/5305/1/Comunicados_n52_Rodovias.pdf.
Isto é. 2018. MDIC diz que ‘Rota 2030 vai sair, é compromisso do governo com o País’. [Accessed 02 May 2018]. https://istoe.com.br/mdic-diz-que-rota-2030-vai-sair-e-compromisso-do-governo-com-o-pais/.
Ministério das Cidades. 2018. Levantamento sobre a situação dos planos de mobilidade urbana nos municípios Brasileiros. [Accessed 16th May 2018]. http://www.cidades.gov.br/component/content/article?id=4398.
Ministério da Indústria, Comércio exterior e serviços. 2018. Inovar-auto. [Accessed 23 April 2018]. http://www.mdic.gov.br/index.php/competitividade-industrial/setor-automotivo/inovar-auto.
Ministério da Indústria, Comércio Exterior e Serviços, Rota 2030. 2018. Ministro Marcos Pereira lança Rota 2030 – Mobilidade e Logística. [Accessed: 23 April 2018]. http://www.mdic.gov.br/component/content/article?id=2447.
Ministério de Minas e Energia; Empresa de Pesquisa Energética. 2007. Plano Nacional de Energia 2030. [Accessed 18 April 2018]. http://www.epe.gov.br/sites-pt/publicacoes-dados-abertos/publicacoes/PublicacoesArquivos/publicacao-165/topico-173/PNE 2030 - Eficiência Energética.pdf.
Ministério de Minas e Energia. 2012. Plano Nacional de Eficiência Energética. [Accessed 18 April 2018]. http://www.mme.gov.br/documents/10584/1432134/Plano+Nacional+Eficiência+Energética+%28PDF%29/74cc9843-cda5-4427-b623-b8d094ebf863?version=1.1.
Ministério de Minas e Energia. n.d. RenovaBio. [Accessed 16 April 2018]. http://www.mme.gov.br/web/guest/secretarias/petroleo-gas-natural-e-combustiveis-renovaveis/programas/renovabio/principal.
Ministério do Planejamento. n.d. Sobre o PAC. [Accessed 14 May 2018]. http://www.pac.gov.br/sobre-o-pac.
Ministério do Planejamento. 2018. PAC: 6º Balanço. [Accessed14 May 2018]. http://pac.gov.br/pub/up/relatorio/11fbe9b2f7cbecb3ec5c1f9f67b5f3be.pdf.
Ministério dos Transportes; Ministério das Cidades. 2013. Plano Setorial de Transporte e Mobilidade Urbana para Mitigação da Mudança do Clima. [Accessed 12 March 2018]. http://bibspi.planejamento.gov.br/bitstream/handle/iditem/298/PSTM.pdf?sequence=1.

213212
Ministério dos Transportes and Ministério da Defesa. 2007. Plano Nacional de Logística e Transportes. [Accessed 14 May 2018]. http://bibspi.planejamento.gov.br/bitstream/handle/iditem/561/arq1352742260.pdf?sequence=1&isAllowed=y.
Ministério dos Transportes, Portos e Aviação Civil. 2014. Conheça o PNLT. [Accessed 14 May 2018]. http://www.transportes.gov.br/component/content/article/56-acoes-e-programas/2815-conheca-o-pnlt.html.
Ministério dos Transportes, Portos e Aviação Civil. 2016. Transportes no Brasil - Síntese Histórica. [Accessed 09 May 2018]. http://www.transportes.gov.br/institucional/historico.html.
Ministério dos Transportes, Portos e Aviação Civil. 2016. Evolução cronológica do Ministério dos Transportes. [Accessed 07 May 2018]. http://www.transportes.gov.br/conteudo/137-evolucao-cronologica-do-ministerio-dos-transportes.html.
Ministério dos Transportes, Portos e Aviação Civil. 2016. Transportes. [Accessed 16 May 2018]. http://www.transportes.gov.br/images/2017/Transportes_2016_versão_final.pdf.
Ministério dos Transportes, Portos e Aviação Civil. 2017. Transportes. [Accessed 16 May 2018]. http://transportes.gov.br/images/2018]/fotos_noticias/03_MAR/Transportes_2017_WEB.pdf.
Ministério dos Transportes, Portos e Aviação Civil. 2018. Livro de Estado. [Accessed 16 May 2018]. http://www.transportes.gov.br/images/2018]/documentos/livro_de_estado_versao_1.0.pdf.
Muniz M. 2015. Programas de Infraestrutura PAC e PIL. [Accessed 15 May 2018]. http://www.planejamento.gov.br/apresentacoes/apresentacoes-2015/brasilianas-1.pdf/view.
O Globo (2018). Conheça principais pontos do programa de incentivo às montadoras, o Rota 2030. [Accessed 09 July 2018]. https://g1.globo.com/carros/noticia/conheca-principais-pontos-do-programa-de-incentivo-as-montadoras-o-rota-2030.ghtml
Organization of the Petroleum Exporting Countries. 2018. Brief history. [Accessed 23 May 2018]. http://www.opec.org/opec_web/en/about_us/24.htm.
Paraguassu L, Cascione S. 2017. WTO orders Brazil to remove subsidies, government to appeal. Reuters. [Accessed 23 April 2018]. https://www.reuters.com/article/us-brazil-wto/wto-orders-brazil-to-remove-subsidies-government-to-appeal-idUSKCN1B92QV.
Programa Nacional da Racionalização do Uso dos Derivados do Petróleo e do Gás Natural. 2012. Etiquetagem veicular. [Accessed 20 April 2018]. http://www.conpet.gov.br/portal/conpet/pt_br/conteudo-gerais/etiquetagem-veicular.shtml.
PROMOB. 2017. Quem somos. [Accessed 23 April 2018]. http://www.promobe.com.br/institucional/quem-somos/.
Secretaria do Programa de Parcerias de Investimentos. 2018. Relatório de acompanhamento do andamento dos empreendimentos e demais ações no ambito do programa de Parcerias de Investimentos – PPI. [Accessed 15 May 2018]. http://www.avancarparcerias.gov.br/publicacoes-institucionais.
Secretaria-Geral. n.d. Estrutura Organizacional. [Accessed 11 May 2018]. http://www.secretariageral.gov.br/acesso-a-informacao/institucional.
Wiziack J, Boldrini A. 2018. Ministro diz que plano de logísitica fará ferroria substituírem rodovias em sete anos. [Accessed 04 July 2018]. https://www1.folha.uol.com.br/mercado/2018/07/ministro-diz-que-plano-de-logistica-fara-ferrovias-substituirem-rodovias-em-sete-anos.shtml
Wiziack J, Uribe G. 2018. Decreto pode elevar para até 40% percentual de etanol na gasolina. Folha de São Paulo: Brasília, 12 March 2018. [Accessed 02 May 2018]. https://www1.folha.uol.com.br/mercado/2018/03/decreto-pode-elevar-para-ate-40-percentual-de-etanol-na-gasolina.shtml.
World Trade Organization. n.d. Brazil — Certain measures concerning taxation and charges. [Accessed 23 April 2018]. https://www.wto.org/english/tratop_e/dispu_e/cases_e/ds472_e.htm.
Zomer R. 2018. Políticas públicas e mobilidade urbana. [PowerPoint slides]. CPI Brazil: Mobility Workshop. Brasília: Royal Tulip, 27 March 2018.
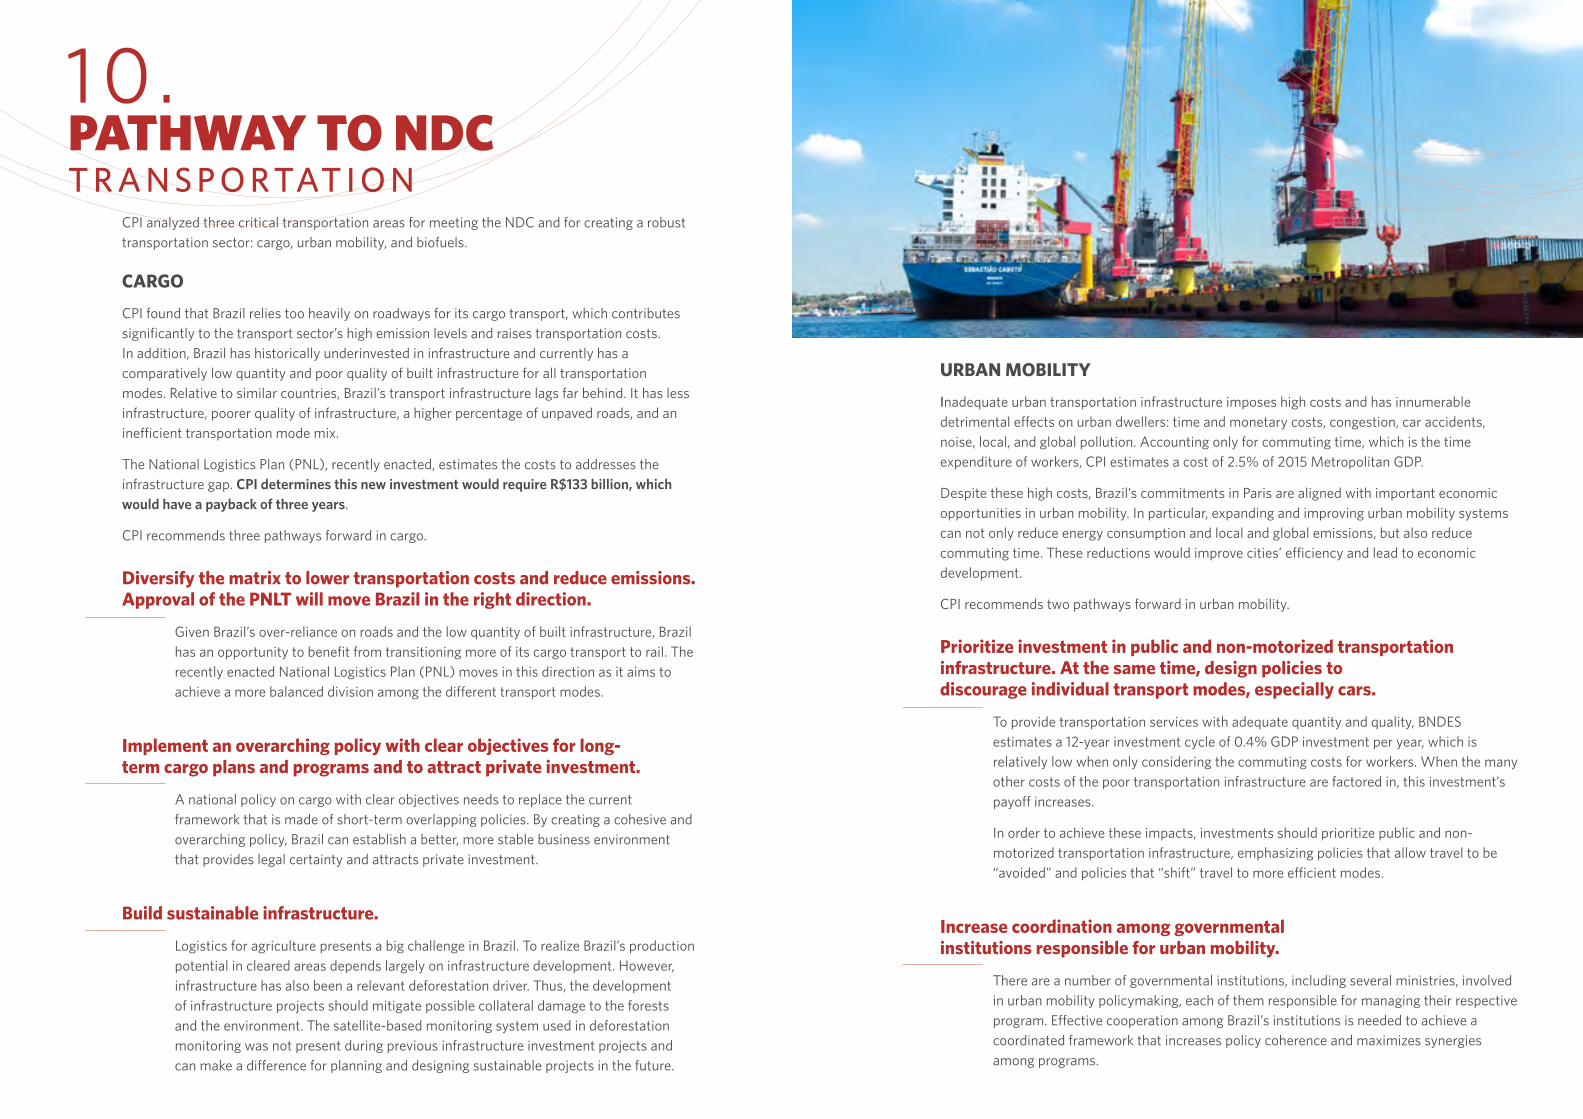
215
CPI found that Brazil relies too heavily on roadways for its cargo transport, which contributes significantly to the transport sector’s high emission levels and raises transportation costs. In addition, Brazil has historically underinvested in infrastructure and currently has a comparatively low quantity and poor quality of built infrastructure for all transportation modes. Relative to similar countries, Brazil’s transport infrastructure lags far behind. It has less infrastructure, poorer quality of infrastructure, a higher percentage of unpaved roads, and an inefficient transportation mode mix.
The National Logistics Plan (PNL), recently enacted, estimates the costs to addresses the infrastructure gap. CPI determines this new investment would require R$133 billion, which would have a payback of three years.
CPI recommends three pathways forward in cargo.
Diversify the matrix to lower transportation costs and reduce emissions. Approval of the PNLT will move Brazil in the right direction.
Given Brazil’s over-reliance on roads and the low quantity of built infrastructure, Brazil has an opportunity to benefit from transitioning more of its cargo transport to rail. The recently enacted National Logistics Plan (PNL) moves in this direction as it aims to achieve a more balanced division among the different transport modes.
Implement an overarching policy with clear objectives for long-term cargo plans and programs and to attract private investment.
A national policy on cargo with clear objectives needs to replace the current framework that is made of short-term overlapping policies. By creating a cohesive and overarching policy, Brazil can establish a better, more stable business environment that provides legal certainty and attracts private investment.
Build sustainable infrastructure.
Logistics for agriculture presents a big challenge in Brazil. To realize Brazil’s production potential in cleared areas depends largely on infrastructure development. However, infrastructure has also been a relevant deforestation driver. Thus, the development of infrastructure projects should mitigate possible collateral damage to the forests and the environment. The satellite-based monitoring system used in deforestation monitoring was not present during previous infrastructure investment projects and can make a difference for planning and designing sustainable projects in the future.
PATHWAY TO NDC T R A N S P O R TAT I O N
CARGO
Inadequate urban transportation infrastructure imposes high costs and has innumerable detrimental effects on urban dwellers: time and monetary costs, congestion, car accidents, noise, local, and global pollution. Accounting only for commuting time, which is the time expenditure of workers, CPI estimates a cost of 2.5% of 2015 Metropolitan GDP.
Despite these high costs, Brazil’s commitments in Paris are aligned with important economic opportunities in urban mobility. In particular, expanding and improving urban mobility systems can not only reduce energy consumption and local and global emissions, but also reduce commuting time. These reductions would improve cities’ efficiency and lead to economic development.
CPI recommends two pathways forward in urban mobility.
Prioritize investment in public and non-motorized transportation infrastructure. At the same time, design policies to discourage individual transport modes, especially cars.
To provide transportation services with adequate quantity and quality, BNDES estimates a 12-year investment cycle of 0.4% GDP investment per year, which is relatively low when only considering the commuting costs for workers. When the many other costs of the poor transportation infrastructure are factored in, this investment’s payoff increases.
In order to achieve these impacts, investments should prioritize public and non-motorized transportation infrastructure, emphasizing policies that allow travel to be “avoided” and policies that “shift” travel to more efficient modes.
Increase coordination among governmental institutions responsible for urban mobility.
There are a number of governmental institutions, including several ministries, involved in urban mobility policymaking, each of them responsible for managing their respective program. Effective cooperation among Brazil’s institutions is needed to achieve a coordinated framework that increases policy coherence and maximizes synergies among programs.
URBAN MOBILITY
215
CPI analyzed three critical transportation areas for meeting the NDC and for creating a robust transportation sector: cargo, urban mobility, and biofuels.
10.