Enhancing Folic Acid Dietary Intervention Research in ...
134
Enhancing Folic Acid Dietary Intervention Research in Mouse Models By Esther Munezero A thesis submitted to the Faculty of Graduate and Postdoctoral Affairs in Partial fulfillment of the requirements for the degree of Master of Science in Biology Carleton University Ottawa, Ontario © 2021 Esther Munezero
Transcript of Enhancing Folic Acid Dietary Intervention Research in ...

Enhancing Folic Acid Dietary Intervention Research
in Mouse Models
By
Esther Munezero
A thesis submitted to the Faculty of Graduate and Postdoctoral Affairs in Partial fulfillment of the requirements for the degree
of
Master of Science in
Biology
Carleton University Ottawa, Ontario
© 2021 Esther Munezero

ii
Abstract
Folates are a group of enzyme co-factors responsible for carrying out cellular one-carbon
metabolic reactions. This one-carbon metabolic pathway plays a critical role in the de novo
production of purines, thymidylates and the precursors required for various methylation reactions.
Adequate folate status is vital for growth, development, and maintenance of health in both humans
and animals. However, like many essential nutrients, there are concerns over potential adverse
health effects associated with both inadequate and excess folate consumption. Specifically, folic
acid (FA), the synthetic form of folate used in fortified foods and supplements, has been associated
with both beneficial and potentially adverse effects. Hence, characterization of safe and adequate
FA intakes while avoiding the risk of an adverse health effect is important for the nutritional risk
assessment of FA. Animal-derived data play an important role in the elucidation of the specific
mechanisms of action linked to FA intake. However, poor reporting of study details, and the
inconsistent use of diets and animal models, hinders knowledge translation from animals to
humans. Here I report the outcomes of two studies. The first was a scoping review of the literature
to determine the reporting quality of studies examining the effect of dietary FA interventions in
mice. The findings of our scoping review showed that 14% of studies did not report ≥1 generic
reporting item(s) (i.e., sex, strain and age) and 41% did not report ≥1 nutrition-specific reporting
item(s) (i.e., base diet composition, intervention doses, duration, and exposure verification). This
incomplete reporting of findings notably limits their generalizability, reproducibility and
interpretation. The second study was designed to facilitate the knowledge translation of animal-
derived data to human nutrition by establishing biomarkers of folate intake, status and function in
mice. This FA dose-response study allowed me to identify a biomarker of folate deficiency,
namely a homocysteine concentration ≥ 3.88 umol/L as a functional marker of deficiency. I also

iii
propose that an unmetabolized FA concentration ≥ 7.71 nmol/L represents a marker of excess FA
intake. The observations made in these two studies will inform future study designs for assessing
the effects of FA on health outcomes in mouse models.

iv
Acknowledgements
First and foremost, I would like to acknowledge and express my deepest gratitude to my
Supervisor Dr. Amanda MacFarlane. Thank you for welcoming me into your lab and offering me
such an amazing opportunity to learn from you. I really appreciate all the support and
encouragement. Thank you and Dr. Alex Wong for being incredible teachers and scientists. I could
not have asked for better supervisors and mentors!
I would also like to express my appreciation to the members of my thesis advisory
committee including Dr. Kristin Connor, Dr. Krista Power and Dr. Jenny Bruin for all their
guidance and contributions. Furthermore, I would also like thanks to all the Health Canada team
including Danielle LeBlanc, Stephanie Diaz, Nathalie Behan, Judy Green, Amy Hendry,
Agnieszka Bielecki, Eleonora Swist, Fernando Matias, Jeremiah Gaudet, Philip Griffin, Gen
Sheng Wang, Allie Steele and Scott Smith for all your help with these animal study. Your help
was invaluable! A special thanks Nathalie Behan and Fernando Matias for all technical support,
guidance and the countless hours your put into teaching me all the procedures. A big thank you
also to Carleton University for their financial support and giving me this unique opportunity to
learn and grow as I pursue my education.
And finally, words cannot express the gratitude I have for the continual support from my
parents, Dr. Euloge and Dr. Aline. Thank you for being the role models I aspire to be every day
and always encouraging me to keep reaching further. To my siblings Elysée, Joshua and David
and friends Hana, Michaella and Gaëlla – thank you for always keeping me motivated and
supporting me when I needed it the most.

v
Table of Contents
Abstract ..................................................................................................................................ii
Acknowledgements ................................................................................................................iv
Table of Contents................................................................................................................... v
List of Abbreviations ........................................................................................................... viii
List of Figures ........................................................................................................................ix
List of Tables ......................................................................................................................... x
CHAPTER 1: INTRODUCTION .........................................................................................11
1.1. Overview of Folate ..................................................................................................11
1.2. Folate and Human Pathology ...................................................................................17 1.2.1. Folate and Neural tube defects ..........................................................................17 1.2.2. Folate and Megaloblastic Anemia .....................................................................18 1.2.3. Other health risks associated with folate deficiency ...........................................19 1.2.4. Folate and Cancers ...........................................................................................20
1.3 Nutritional risk assessments .....................................................................................21 1.3.1 Folate nutritional risk assessment .........................................................................24
1.3.2 Mechanisms for Folate pathologies: Genomic Integrity and Epigenetics ................26
1.4 Animals in research .................................................................................................28
1.5 Objectives ...............................................................................................................30
1.6 Hypotheses..............................................................................................................31
CHAPTER 2: POOR REPORTING QUALITY IN BASIC NUTRITION RESEARCH: A
CASE STUDY BASED ON A SCOPING REVIEW OF RECENT FOLATE RESEARCH
IN MOUSE MODELS (2009-2019) ......................................................................................32
2.1 Abstract ........................................................................................................................32
2.2 Introduction ..................................................................................................................33
2.3 Methods........................................................................................................................35 2.3.1 Search Strategy.......................................................................................................35 2.3.2 Selection of Studies ................................................................................................38
2.3.3 Data Extraction and Charting ..................................................................................38
2.4 Results..........................................................................................................................39 2.4.1 Health outcomes investigated ..................................................................................40 2.4.2 Mouse strain...........................................................................................................42 2.4.3 Sex.........................................................................................................................44 2.4.4 Age ........................................................................................................................46

vi
2.4.5 Folic acid intervention dose(s) ................................................................................48 2.4.6 Base diet ................................................................................................................50 2.4.7 Duration of intervention(s) ......................................................................................52
2.4.8 Folic acid intervention verified by biomarker ...........................................................54
2.5 Discussion ....................................................................................................................56 2.5.1 Reporting Nutrition Specific Items ..........................................................................59 2.5.2 Recommendations ..................................................................................................61
2.6 Conclusions ..................................................................................................................66
CHAPTER 3: FOLIC ACID DOSE-RESPONSE STUDY IN MICE ..................................67
3.1. Abstract ..................................................................................................................67
3.2. Introduction.............................................................................................................68
3.3. Methods ..................................................................................................................70 3.3.1. Animal Models and Study design .....................................................................70
3.3.2. Necropsy and tissue collection..........................................................................71 3.3.3. Plasma total folate analysis ...............................................................................72 3.3.4. Plasma folate vitamer analysis ..........................................................................73 3.3.5. Homocysteine analysis .....................................................................................74
3.3.6. CBC analysis ...................................................................................................75 3.3.7. Micronucleus analysis ......................................................................................75 3.3.8. Statistical analysis ............................................................................................76
3.4. Results ....................................................................................................................77 3.4.1. Body weights ...................................................................................................77 3.4.2. Food consumption............................................................................................80
3.4.3. Tissue weights .................................................................................................82 3.4.4. Folate status .....................................................................................................85 3.4.5. Functional and genomic instability ...................................................................92
3.5. Discussion............................................................................................................. 105 3.5.1. Biomarkers of FA Intake ................................................................................ 105 3.5.1. Functional biomarkers of folate ...................................................................... 109
3.6. Conclusion ............................................................................................................ 111
CHAPTER 4: DISCUSSION .............................................................................................. 113
4.1. Study context and implication to human nutrition ................................................... 113 4.1.1. Reporting animal-based research .................................................................... 113
4.1.1. Mouse sex and strain differences .................................................................... 115 4.1.2. Biomarkers of folate deficiency ...................................................................... 116 4.1.3. Biomarkers of Over Supplementation ............................................................. 118
4.2. Strengths and limitations........................................................................................ 119
4.2. Future directions.................................................................................................... 121
4.3. Conclusion ............................................................................................................ 121

vii
REFERENCES ................................................................................................................... 123
Statement of Contribution .................................................................................................. 134

viii
List of Abbreviations
10-formyl THF 10-formyltetrahydrofolate
5-methyl THF 5-methyltetrahydrofolate
5, 10-methylene THF 5, 10-methylenetetrahydrofolate
5,10-methenyl THF 5,10-methenyltetrahydrofolate
AI Adequate Intake
BMD Benchmark Dose
CRC Colorectal Cancer
DHF Dihydrofolate reductase
DRIs Dietary Reference Intakes
EAR Estimated Average Requirement
FA Folic Acid
FTHFS Formyltetrahydrofolate Synthetase
Hcy Homocysteine
MTHFC Methylenetetrahydrofolate Cyclohydrolase
MTHFD Methylenetetrahydrofolate Dehydrogenase
MTHFD1 Methylenetetrahydrofolate Dehydrogenase 1
MTHFR Methylene Tetrahydrofolate Reductase
MTR Methionine Synthase
NTDs Neural Tube Defects
PCFT Proton-coupled folate transporter
RBC Red Blood Cell
RDA Recommended Dietary Allowances
RFC Reduced folate carriers
SAH (or AdoHcy) S-Adenosyl-Homocysteine
SAM (or AdoMet) S-Adenosyl-Methionine
THF Tetrahydrofolate
TMP Thymidine Monophosphate
TS Thymidylate Synthase
UL Tolerable Upper Intake Level
UMP Uridine monophosphate

ix
List of Figures
Figure 1: Folate Structure.......................................................................................................13
Figure 2: One-Carbon Metabolism of Folate. ..........................................................................16
Figure 3: Nutrition Risk Analysis. ..........................................................................................23
Figure 4: Study selection flow diagram...................................................................................37
Figure 5: Mouse strains. .........................................................................................................43
Figure 6: Mouse sex. .............................................................................................................45
Figure 7: Mouse age. .............................................................................................................47
Figure 8: Folic acid dose included in the dietary intervention(s). .............................................49
Figure 9: Base diets. ..............................................................................................................51
Figure 10: Duration of folic acid dietary interventions. ...........................................................53
Figure 11: Folic acid exposure verification. ............................................................................55
Figure 12: Total body weight gained by mice fed different folic acid diets over the duration of
the study period. .....................................................................................................................78
Figure 13: Body weights of male and female BALB/c and C57BL/6 mice fed different folic acid
diets over time. .......................................................................................................................79
Figure 14: Daily mean food consumption of male and female BALB/c and C57BL/6 mice fed
different folic acid diets over time. ..........................................................................................81
Figure 15: Plasma total folate of male and female BALB/c and C57BL/6 mice fed different folic
acid diets over time. ................................................................................................................86
Figure 16: Benchmark Dose (BMD) response modeling of unmetabolized folic acid (UMFA)
concentrations in mice fed different folic acid diets measured at necropsy. ...............................91
Figure 17 : Homocysteine concentrations in mice fed different folic acid diets measured at
necropsy.................................................................................................................................93
Figure 18: Benchmark Dose (BMD) modeling of homocysteine concentrations in mice fed
different folic acid diets measured at necropsy. ........................................................................94

x
List of Tables
Table 1: Health outcomes investigated....................................................................................41
Table 2: Concepts that should be considered when reporting nutrition research that utilizes animal
models ...................................................................................................................................65
Table 3: Tissue weights of BALB/c and C57BL/6 mice at necropsy. .......................................83
Table 4: Folate vitamers of BALB/c and C57BL/6 mice at necropsy. ......................................89
Table 5: White blood cell counts of BALB/c and C57BL/6 mice at necropsy. ..........................98
Table 6: Red blood cell counts of BALB/c and C57BL/6 mice at necropsy. ........................... 100
Table 7: Platelet counts of BALB/c and C57BL/6 mice at necropsy. ...................................... 102
Table 8: Micronucleus frequencies of BALB/c and C57BL/6 mice at necropsy. ..................... 104
11
CHAPTER 1: INTRODUCTION
1.1.Overview of Folate
Folates are a group of essential water-soluble vitamins, also known as vitamin B9, obtained
through the diet. The term folate refers to a family of polyglutamate enzyme co-factors responsible
for one-carbon metabolic reactions in the nucleus, mitochondria, and cytoplasm (1). Sources of
naturally-occurring folates are green leafy vegetables (e.g. spinach), legumes (e.g. cabbage,
broccoli), citrus fruits (e.g. oranges and grapefruit juices), and other fruits such as bananas, apples,
avocadoes and tomatoes (2,3). It is also naturally occurring in yeast, cheese, poultry (e.g. egg
yolks) and meat products such as liver, kidneys or tongue (2). These naturally occurring folates
consist of a two-ring structure with one to six glutamate molecules peptide bonded to a carboxyl
group p-aminobenzoylglutamic acid (3,4). Additionally, folates can also be obtained in its
synthetic form “folic acid” (FA) in enriched foods or supplements. Synthetic FA (Figure 1a), also
known as pteroylglutamic acid, is more bioavailable and stable than naturally occurring folates.
As a result, it is used in food supplements and fortification initiatives across the world. FA enriched
foods in Canada include white wheat flour, enriched ready-to-eat cereals, and enriched pastas and
cornmeal (5). FA is the most oxidized form of folate with a single glutamate molecule peptide
bonded to a carboxyl group glutamine hence, accounting for its stability and increased ability to
be absorbed by cells; it does not occur in nature (3).
1.1.1. Absorption and transport of folate
Once obtained from the diets, monoglutamate folates are absorbed into the upper intestinal
tract by a proton-coupled folate transporter (PCFT). The low pH dependent PCFT transporters

12
have a very low affinity for the polyglutamate forms of folate. Consequently, folates need to be
deconjugated into a monoglutamate form through the hydrolysis action of glutamate
carboxypeptidase II in the intestine (4). Mediated by the Na+/H+ proton gradient, folate
monoglutamates are absorbed across the apical brush-border membrane of the proximal jejunum
by PCFTs and transported to the liver via the hepatic portal system. Unlike naturally occurring
folates, intestinal hydrolysis is not required for monoglutamate FA for transport into intestinal
cells. Upon arrival in the liver, folates are further metabolized in preparation for liver storage,
transport to peripheral tissues via the systemic circulation, and reabsorption into circulation
through the kidneys (4). Folates enter the systematic system from the liver via the hepatic vein and
are transported into peripheral tissues through the actions of reduced folate carriers (RFC) (4). The
most abundant form of folate in the bloodstream is 5-methyltetrahydrofolate (5-methyl THF).
Unlike PCFT, RFC transporters have a very low affinity for the FA. Therefore, FA metabolism to
reduced bioactive folates occurs in the liver before transport to systemic circulation. However, in
cases where FA intakes are supraphysiological, unmetabolized FA can enter systemic circulation.

13
Figure 1: Folate Structure . A) Synthetic Folic Acid Structure. B) Tetrahydrofolate (THF)
structure with 3 glutamate moieties attached. Different folate forms consist of the attachment of
one-carbon groups at different positions of the THF structure. This could consist of a methyl group
(CH3) at position N-5 (5- methyltetrahydrofolate), a methylene group (CH2) linking N-5 and N-
10 (5,10- methylenetetrahydrofolate), a methenyl group (CH) linking N-5 and N-10 (5,10-
methenyltetrahydrofolate), or a formyl group (CHO) at position N-10 (10-formyletetrahydrolate).
A
B

14
1.1.2. Folate metabolism
Folic acid is not bioactive and must therefore be reduced to enter 1 carbon metabolism. It is
irreversibly reduced to dihydrofolate (DHF) by the activity of the NADPH-dependent enzyme
dihydrofolate reductase (DHFR) and subsequently to tetrahydrofolate (THF), the form in which it
enters the cellular folate pool. Within cells, folylpolyglutamate synthase enzymes restore linkage
of polyglutamate chains onto folate monoglutamate (5-methyl THF and DHF) molecules, resulting
in reduced THF polyglutamate (Figure 1b). Monoglutamate folates have low affinity for the
folate-binding enzymes, whereas polyglutamates have high affinity, thereby restricting them
within the cell (6). The polyglutamated form can have up to 7 glutamate residues attached (7).
THF polyglutamate, the bioactive form of folate acts to carry and transfer one-carbon units in
the mitochondrial, nuclear or cytoplasmic compartments. The mitochondrion contains about 40%
of cellular folates while the nucleus contains about 10% (8). The mitochondrion uses one-carbon
metabolism to form formate, which in turn is exported to the cytoplasm where it is further utilized
as the source of one-carbon units in cytoplasmic metabolic reactions. Formate is synthesized from
formaldehyde, a by-product of serine, glycine, dimethylglycine and sarcosine catabolism in the
mitochondria (8). In the cytoplasm, formate is involved in the interconversion of THF, 10-formyl
THF 5,10-methenyl THF, and 5,10-methylene THF mechanisms governed by the trifunctional
enzymatic activity of the NADPH-dependent enzyme methylenetetrahydrofolate dehydrogenase 1
(MTHFD1) (9). First, formate is incorporated at the C2 and C6 carbons of the purine ring of THF
to 10-formyl THF via the enzymatic activity of formyltetrahydrofolate synthetase (FTHFS; first
enzymatic activity of MTHFD1) (1,9). The cofactor 10-formly THF is used for de novo purine
biosynthesis (Figure 2) in the cytoplasm (8). Next, methenyltetrahydrofolate cyclohydrolase
(MTHFC; second enzymatic activity of MTHD1) reduces 10-formyl THF to 5,10-methenyl THF,

15
which is subsequently further reduced to 5,10-methylene THF by methylenetetrahydrofolate
dehydrogenase (MTHFD; third enzymatic activity of MTHFD1) (9). The latter is the enzyme
cofactor required for de novo thymidylate biosynthesis in the nucleus (Figure 2). The thymidylate
synthase enzyme (TS) catalyzes the methylation reduction of deoxyuridylate (dUMP) to form
thymidylate (dTMP) (8). During the production of thymidylate, DHF is also generated and reduced
back to THF by the DHFR to re-initiate the cycle (8).
5,10-methylene THF can alternatively be reduced to 5-methyl THF by the NADPH-dependent
enzyme methylene tetrahydrofolate reductase (MTHFR) (Figure 2). 5-methyl THF functions as
the methyl donor in methionine synthesis. Homocysteine (Hcy) is methylated to methionine
through a vitamin B12-dependent reaction catalyzed by methionine synthase (MTR) (8).
Biosynthesis of methionine is essential for the production of S-adenosyl-methionine (SAM or
AdoMet), the universal cellular methyl donor for various methylation reactions, including that of
DNA, RNA, neurotransmitter, phospholipids, proteins (e.g. histones) and other small molecule
(10). S-adenosylhomocysteine (SAH or AdoHcy) produced upon the donation of a methyl group
from AdoMet is converted back to homocysteine through the action of S-adenosylhomocyste ine
hydrolase.

16
Figure 2: One-Carbon Metabolism of Folate . DHF: dihydrofolate reductase, MTR: methionine
synthase, MTHFD1: methylenetetrahydrofolate dehydrogenase 1, MTHFR:
methylenetetrahydrofolate reductase, SAH: S-adenosylhomocysteine (AdoHcy), SAM: S-
adenosylmethionine (AdoMet), THF: tetrahydrofolate, TS: thymidylate synthase. Figure modified
from Crider KS, 2012 and Stover PJ, 2009 (8,10).
MTR (V12)
dUMP dTMP

17
1.2.Folate and Human Pathology
Folate metabolism plays an essential role in the normal development, growth, and
maintenance of optimal health (11). Any disruption in the one-carbon metabolic reactions may
lead to various adverse health outcomes. Neural tube defects and megaloblastic anemia are two
well-characterized health outcomes known to be causally related to folate intake and status. Other
health risks, such as congenital anomalies, cancers, cardiovascular diseases and cognitive decline
have also been associated with folate intake (8).
1.2.1. Folate and Neural tube defects
Globally, neural tube defects (NTDs) affect an estimate of over 300,000 fetuses or infants
every year (12). The neural tube is the embryonic precursor for the brain and spinal cord making
up the central nervous system (13). NTDs arise when the neural tube fails to close during the first
18 – 28 days after conception, a period with increased demand for nucleotides and methylation
reactions for the rapidly developing embryo. The most common NTDs are spina bifida and
anencephaly. Anencephaly is fatal and affects over 4000 pregnancies in the US annually (14). It
is a result of the incomplete closure of the anterior end of the neural tube compromising the
development of the fetus – often leading to fetal or perinatal death. Spina bifida is characterized
by the incomplete closure of the posterior end of the neural tube. Although there is an increased
chance of a viable pregnancy, the child is prone to various disabilities ranging from loss of bowel
and bladder control to paralysis due to the impaired development of the spinal cord and lower
backbones (15,16).
The UK Medical Research Council (MRC) randomized double-blinded clinical trial published
in 1991 was one of the first important studies that demonstrated a strong correlation between

18
dietary FA and incidence of NTD-affected pregnancies (17). The study demonstrated that a daily
intake of 4000 𝜇g of FA by high-risk women (women who have had a previous NTD-affected
pregnancy) lowered recurrence by 72%. A 1992 study conducted by Czeizal and Dudás in low-
risk women treated with 800 𝜇g of FA demonstrated similar results (18). Lastly, another trial using
a daily dose of 400 𝜇g of FA in a population-based community trial in China by Berry et al. also
demonstrated similar results (19). Berry et al. and Czeizal et al.’s study became the basis for
recommendations by governing bodies including the WHO and Health Canada that low-risk
women consume 400-800 µg (20).
Mandatory folic acid fortification was implemented in Canada and the United States in 1998
to increase folate intake, raise the population’s baseline folate status, and inevitably decrease the
prevalence of NTDs (3). Mandatory fortification included the addition of FA to white wheat flour
with 150 𝜇g FA added to every 100 g of flour. In Canada, other foods such as pasta and cornmeal
can also be enriched with FA but must be labelled “enriched” on the package (21) . A 2007 study
conducted by De Wals et al. demonstrated that the prevalence of NTDs in Canada reduced to 0.86
per 1000 birth from 1.58 per 1000 births after the fortification program was implemented (22).
This translates to a 46% reduction (95% confidence interval, 40 to 51) in prevalence (22).
Following suit, 87 other countries around the world implemented various models of fortification
programs (3,23).
1.2.2. Folate and Megaloblastic Anemia
Megaloblastic anemia is a group of anemias characterized by impaired DNA synthesis due to
vitamin B12 and/or folate deficiency during red blood cell (RBC) production (24,25). Both vitamin
B12 and folate are cofactors in methionine synthesis. Deficiency in either one of these cofactors

19
results in increased homocysteine concentrations, as well as trapped 5-methyl THF within cells in
a phenomenon known as ‘methyl trap’ (25,26). The methyl trap arises from reduced activity of
the MTR enzyme when vitamin B12 is unavailable as a co-factor and/or 5-methyl THF is
unavailable to transfer a methyl group to homocysteine to form methionine (Figure 2).
Consequently, 5-methyl THF is not converted back to THF - which is eventually depleted and
folate-mediated one carbon metabolism is inhibited. As a result, nucleotide synthesis and therefore
DNA synthesis via the folate pathway is impaired. This is especially damaging for progenitor cells.
During the G1 phase of the cell cycle, progenitor cells continue to grow as RNA and protein
production is relatively unaltered by the folate pathway. However, impaired DNA synthesis halts
the cell cycle at the S phase and subsequent cell division step is obstructed. In RBCs, this results
in enlarged erythroblasts with asynchronous maturation of the nuclear and cytoplasm (25).
Physiologically and clinically, these abnormally enlarged erythroblasts are identified as
megaloblastic (26). Megaloblastic anemia caused by impaired DNA synthesis and/or methylation
reactions can lead to serious neurological damages if the underlining causes (i.e., folate and/or
vitamin B12 deficiency) is left untreated.
1.2.3. Other health risks associated with folate deficiency
Low folate status and/or high plasma homocysteine concentrations have been associated with
various diseases including cardiovascular diseases (CVD) and strokes (27). Various meta-analyses
and observational studies have demonstrated associations between low folate status and increased
risk of ischemic heart diseases and strokes by 32 and 59% respectively (28). Similarly, numerous
studies have also shown an association between elevated plasma homocysteine and rapid cognitive
decline, and an increased rate of dementia and Alzheimer’s disease (27). Alzheimer’s disease is

20
characterized by the accumulation of cellular amyloid- in the brain (29). Other case reports have
also shown an association between folate deficiency and infertility but the causal mechanisms have
yet to be determined (30). Further in vivo studies are required to demonstrate biological plausibility
and explore mechanisms that govern these relationships.
1.2.4. Folate and Cancers
The Canadian Cancer Society states that cancer is the leading cause of death in Canada, with
an estimate of 220,440 new diagnoses in 2020 alone (31). The role of folate intakes on cancer risks
is divided in the literature. On one hand, concerns have been raised over the hypothesis that FA
supplementation allow the progression of existing tumor cells by supplying the necessary
nucleotides required for their rapid proliferation while inactivating tumor-suppressor genes via
methylation (10,27). On the other hand, other meta-analysis studies such as those carried out by
Pierth et. al, revealed that high folate intakes can provide a protective effect for some cancer (e.g.
pancreatic cancer), have little to no effect for some (e.g. lung cancer) while potentially increasing
the risk of others (e.g. Head and Neck squamous cell carcinoma and esophageal cancer) (23). The
exact mechanism of these associations has yet to be outlined.
Colorectal cancer (CRC) is one of the most rigorously studied cancers in relation to folate
intakes. In Canada, it is the third leading cause of cancer death, representing an estimate of 12.9%
and 10.9% of all new cancer diagnosis in men and women respectively (32). While some studies
have demonstrated that folate deficiency increases the risk of CRC, other studies have shown that
increased FA intakes provide a protective effect against CRC. One of the proposed mechanisms
brought forth is the increased DNA mutation frequency and impaired methylation mechanisms
associated with folate deficiency in this highly proliferative tissue (33). Four case-controlled

21
studies conducted by Kim et al. showed that individuals who had a high total folate intake (≥ 900
ug/day) were 35% less likely to develop CRC than individuals who had a low total folate intake
(≤ 200 ug/day) (34). Further studies have also shown that gene variations in the MTHFR and
SHMT enzymes in the folate pathways have been associated with a protective effect against CRC
(33).
1.3 Nutritional risk assessments
Proper and adequate nutrition is vital for growth, development and maintenance of health in
both humans and animals. Nutrition research examines the relationship between nutrient intake
and health outcomes including disease of deficiency and chronic disease. Data derived from animal
and cell culture models inform the mechanisms of actions of nutrients and other food substances
(non-nutritional components of food) and supports their casual relationships to health outcomes.
For both essential nutrients and food substances obtained through foods and supplements, an
exhaustive nutritional risk analysis is required to inform optimal intake.
Nutritional risk analysis encompasses both science-based nutritional risk assessment and
policy-based risk management components working together to provide an informed and
communicable intake guideline for vitamins and minerals (Figure 3a). As defined by the British
Dietetic Association “nutritional risk assessment is defined as the systemic and structured process
of collecting and interpreting information on foods and food supplements in order to make
decisions about the nature and cause of nutrition-related health issues that affect an individual”
(35,36). Namely, nutritional risk assessments set out to identify any adverse health effects
associated with both inadequate and/or excess intakes of a given nutrient or other food substance
based on available scientific research derived from humans, animals and in vitro studies (36).

22
Evidence supporting the relationships between nutritional intakes and health outcomes is used
to inform nutritional risk assessments (Figure 3b). One example of a risk assessment-based
framework for determining nutritional risk is that used for establishing the Dietary Reference
Intakes (DRIs) for essential nutrients. The DRIs are based on the assumption of a U-shaped curve
arising from the fact that there are adverse health comes associated with both inadequate and
excess nutrient intakes, a feature that is unique to essential nutrients. The DRIs, developed by the
National Academies of Sciences, Engineering and Medicine (NASEM), presents the risks
associated with inadequate nutrient intake as well as the potential health risks associated with
excessive intakes (37). The DRIs apply to the general healthy population and include the following
values: Recommended Dietary Allowances (RDA), Estimated Average Requirement (EAR),
Adequate Intake (AI) amounts as well as the Tolerable Upper Intake Levels (UL). Ultimately, the
DRIs are used to establish public health nutrition policies in Canada and the United States and
have been adopted by various other countries.

23
Figure 3: Nutrition Risk Analysis . A) The three key components of nutritional risk analysis as
outlined by the 2006 FAO/WHO report (38). B) U-shaped nutritional risk assessment curve
displaying both the requirement and potential adverse associated with nutritional intake. Each
curve represents the adverse health effects associated with low (left) and high (right) intakes.
Abbreviations: EAR, Estimated Average Requirement; RDA, Recommended Dietary Allowance;
UL, Tolerable Upper Intake Level (35,39).
A
B

24
1.3.1 Folate nutritional risk assessment
The EAR and RDA for folate are primarily based on the minimum required folate intake
required to ensure a red blood cell (RBC) folate status that prevents the development of
megaloblastic anemia (40–42). RBC folate represents long-term folate status and is the preferred
biomarker for assessing folate status (41). Secondary biomarkers such as serum and plasma folate
can be used to determine recent folate intake. Hcy concentration can be used as a functional
indicator of folate status since it is dependent on the rate of remethylation to form methionine,
which requires the donation of a methyl group from 5-methyl THF. Note that Hcy is also
influenced by the concentrations of other B vitamins such as vitamin B12. At the population level,
the WHO recommends a minimum RBC folate concentration of 226.5 nmol/L (100 ng/mL) to
prevent the development of megaloblastic anaemia and a concentration of 906 nmol/L (400 ng/mL)
for maximal protection against NTDs (41).
The folate DRIs are based on the intake of Dietary Folate Equivalent (DFE) values whereby 1
unit of natural folate is equivalent to 1.7 units of its synthetic form FA. This is because natural
folate is ~ 35% less bioavailable than its synthetic counterpart (42,43). The RDA for infants and
children (0-8 years) 80-200 ug DFEs/day depending on age, 300-400 ug DFEs/day for male and
female teenagers (9-18 years) and 400 ug DFEs/day for male and non-pregnant females adults (>
19 years) (42). The RDA is increased to 600 ug DFEs/day for women during pregnancy and 500
ug during lactation (11,42). The UL is set for FA only, not natural folate, at 1000 ug/day in adults
over 19 years (11,42). The UL represents a usual intake of FA that is not associated with increased
risk for an adverse outcome (Figure 3) – this is the intake above which there is increasing risk for
masking of vitamin B12 deficiency masking.
25
To date, no adverse effect has been causally associated with FA over-supplementation.
However, the potential risk associated with the accumulation of unmetabolized FA in circulation
and tissues is one of the hallmark concerns about over-supplementation. For example, a study
carried out by Troen et. al. demonstrated an association between increased unmetabolized FA
levels and a 23% decrease in natural killer (NK) cell activity among obese women (44). Some
potential mechanisms proposed include the hypothesis that high FA intakes can oversaturate the
DHFR enzyme resulting in increased levels of unmetabolized FA in plasma and tissues - especially
in intestine tissues where FA is absorbed (4,45,46). Other studies have proposed that high DHF
concentrations, due to high FA intakes, can function as non-competitive inhibitor of thymidylate
synthase and a competitive inhibitor of MTHFR (47–49). On the other hand, it has also been
hypothesized that any excess FA is excreted rather than reabsorbed in the kidneys (27). Ethically,
these hypotheses cannot be directly tested in humans. However, a study design in animal models
such as rodents could allow us to examine these potential mechanisms and determine the dose
upon which elevated unmetabolized FA start to appear in plasma or tissues and whether they are
related to adverse outcomes.
With the total FA intake increased due to food fortification and prenatal supplementation in
addition to natural folates in our diets, there have been concerns over adverse health effects
associated with over supplementation. The NASEM defined a Tolerable Upper Intake Level (UL)
of 1000 𝜇g FA per day. The UL was based on potential for FA to cause masking of vitamin B12
deficiency when the FA UL is exceeded (13). Two recent Canadian pregnancy cohort studies found
that folate status was very high and revealed evidence of unmetabolized FA in circulation as a
result of the combined exposure of FA from fortified foods and prenatal supplements (50). Such
findings reinforce the call to further accurately define safe folate consumption ranges.

26
1.3.2 Mechanisms for Folate pathologies: Genomic Integrity and Epigenetics
One of the hallmark concerns of FA supplementation is vitamin B12 deficiency masking.
Vitamin B12 deficiency is commonly misdiagnosed when present alongside folate deficiency (6).
To treat folate deficiency, increased FA intakes are encouraged. As the FA enters the cell, it is
metabolized to DHF and subsequently THF – replenishing the cell’s THF supply. This allows the
folate pathway to by-pass the methyl trap, resume nucleotide synthesis and reduce the prevalence
of megaloblastic anemia. The replenished supply of the bioactive THF permits cells to complete
the cell cycle and divide successfully. Nonetheless, megaloblastic anemia also functions as an
early indicator of vitamin B12 deficiency. Without the anemia, vitamin B12 deficiency can go
undetected and can lead to irreversible progression of neurological degeneration and cognitive
decline (6). These two sides of folate supplementation and deficiency points out the conundrum in
determining the safe and adequate range for folate intakes.
Folate-mediated one-carbon metabolic reactions play an essential role in the biosynthesis of
purines, thymidylate and methionine. As seen with megaloblastic anemia, folate and/or vitamin
B12 deficiency can cause a phenomenon called the methyl trap which prevents the regeneration of
THF. Eventually, the depletion of THF within the cells results in the impaired synthesis of the
purine nucleotides from 10-formyl THF and thymidylate from 5,10-methylene THF downstream.
The reduced capacity to produce three of the four nucleotides required for DNA synthesis has
serious consequences for rapidly proliferating cells. Previous studies have shown that impaired de
novo purine synthesis resulted in impaired DNA repair, reduced capacity for DNA replication with
associated mid-cell cycle arrest and increased occurrence of DNA mutagenesis due to an
imbalanced nucleotide pools (51,52).

27
Additionally, intracellular dUMP levels (and eventually dUTP after serial phosphorylation)
increase as the TS-dependent conversion to dTMP is compromised. These elevated uracil levels
notably result in an increased rate of uracil misincorporation (24). When DNA repair mechanisms
recognizes the error, Uracil DNA glycosylase enzymatically removes dUTP (UDG) from the DNA
strand via the base excision repair pathway (53,54). However, DNA polymerase’s attempt to patch
and fill the gap with dTTP is hindered by intracellular shortages resulting in an increased chance
of uracil re-incorporation (24,53). This results in a futile loop of attempting to correct
misincorporation errors (53). Consequently, this leads to double-strand DNA breaks that leave
chromosomes fragmented, unstable and prone to further mutations.
Furthermore, given that methionine can be converted to AdoMet, the universal methyl donor,
folates also play a role in cellular methylation potential. The methionine synthesis pathway is
influenced by the availability of 5-methyl THF to donate a methyl group to Hcy via the activity of
the vitamin B12-dependent MTR enzyme. DNA methylation patterns play a critical epigenetic role
and influence gene expression. In addition to regulating the accessibility of transcription factors to
the genome, methyl group on cytosine functions as anchors to DNA binding proteins and the
recruitment of transcriptional silencing complexes (10). CpG methylation patterns are also critical
in preserving nucleosome packaging as they dictate how tightly chromosomes pack around
histones. This in turn functions as a gene regulation mechanism (55). Hypermethylation reaction
have also been raised as a concern of FA supplementation. It has been hypothesised to silence
promotor activity, thereby inactivating tumor-suppressor genes, regulatory and DNA repair genes
or other functions that prevent carcinogenesis (27).
Even though there are multiple potential mechanisms by which folate intake could impact
health outcomes, most remain hypothetical. Human observational studies are limited as they

28
cannot identify causal mechanism making mechanistic studies a necessity – this is where
performing animal research is crucial. In vivo animal studies allow us to test these hypotheses and
mechanisms in animal feeding studies. We know that folate is causally related to NTDs, but we do
not know yet the exact mechanism. Each day we inch closer to defining these mechanisms using
animal models. Nonetheless, although proposed safe FA intakes in humans is well established,
their equivalents have yet to be defined in the commonly used animal models in folate research.
Mouse models are essential for folate research to identify plausible casual pathways linking folate
dietary intakes and health outcomes. However, it is also essential to accurately interpret animal-
derived data to the relevant human context, something that can only be achieved when studies are
designed to reflect comparable human intakes and findings are transparently and wholly reported.
1.4 Animals in research
While we know that there are causal relationships between folate and NTDs we do not know
yet what the mechanisms are, and we cannot ethically examine these issues in humans. This is
where animal research becomes an important part of assessing risk. They allow us to investigate
and validate the mechanisms and causal associations. The functional and physiological similarit ies
between humans, and some animal models, such as mice, have allowed researchers to study the
progression of diseases, pathologies, responses to drugs and treatments, identify mechanisms and
their interactions in a complex biological system (56). In vivo studies allows researchers to build
onto data derived from in vitro studies by providing additional information on the effects,
interactions and biochemical mechanisms involved in multisystem organisms (56).
In vivo studies are essential for research and continue to inform our knowledge. Scientific
breakthroughs such as Type 1 diabetes treatments in 1921, vaccine development, as well as our

29
basic understanding of healthy biology and disease pathology can be traced back to animal-derived
data (57). The laboratory mouse (Mus musculus) is one of the most prominently used animal
models in the biomedical field. Biologically and physiologically similar to humans, their small
size, relatively easy maintenance, high fertility rate, early maturity and large litter sizes render
them as the animal model of choice for preclinical studies (57,58). Nonetheless, the use of animal
models for research is also debated. Opponents argue that despite similarities to humans, there are
distinct differences in animal models that reduces the validity of information obtained from these
studies. Alongside animal welfare and protection concerns, opponents also argue that no single
mouse model is capable of fully mimicking natural population variation or disease pathology in
humans (57). This is particularly true for the readily available inbred mouse strains favored
because their homogenous genetic background permits the production of results with high
reproducibility and statistical power (57). Translation of this information to the human context can
be challenging and often unsuccessful when compared to the heterogeneous nature of diseases in
genetically diverse human populations (57,58). Furthermore, other concerns, such as size
difference and its correlation to metabolic rates, as well as evolutionary trait differences, dispute
the relevance of animal-model informed data as it relates to human research.
These valid concerns coupled with the undisputed importance of animal-based research created
the foundation for the development of guidelines for animal use in research. These guidelines
establish a balance between encouraging optimum knowledge translation from animal studies
while minimizing the potential for unneeded research or harm (57). While conducting animal
research, institutional Animal Ethics Committees adhere to the fundamental 3Rs – Refinement,
Reduction and Replacement. Adherence to these ethical practices ensured that the minimum
number of animals are used to produce reproducible data with precision and statistical significance.

30
Potential harm is minimized and implicit justification is provided for the use of a particular animal
model and the intervention under study (59). Furthermore, animal reporting guidelines, such as the
Animal Research: Reporting of In Vivo Experiments (ARRIVE) checklist, were developed
partially to address concerns about transparency and reproducibility of findings, and to aid
knowledge translation to human research (60). While animal research is important, it is only as
good as the study designs and reporting of the research to ensure it can be translated to human
health. Together, the ethical use of animal models and proper reporting of animal study design,
conduct and outcomes play a critical role in informing future research, from basic biological
principles to health care and policies. Essentially, guidelines help to ensure the best use of animals
and maximize the ability to use the data derived from their research.
1.5 Objectives
1) I will perform a scoping review of recent mouse-based folate research as a case study to
assess reporting of generic and nutrition-specific items in basic nutrition research.
2) I will identify the range of folic acid intakes in mice used in control, deficient and
supplemented diets used in the folate research field.
3) I will identify strain and sex specific responses to folate exposure in mice.
4) I will determine the relationship between folate intakes using “traditional” exposure
(plasma and tissue folate) and metabolic/health outcome (Hcy, macrocytic anemia)
indicators in mice to better relate folate exposures in rodents to those in humans.
5) I will validate genome stability markers in blood cells (RBC micronuclei) as a potential
functional outcome indicator of folate status in mice.

31
1.6 Hypotheses
1) I hypothesize that an evidence scan of the folate research field will identify a pattern of
poor reporting quality of animal-based studies and the lack of a standardized definition of
control, deficient and supplemented folate diets.
2) I hypothesize that the current ‘control’ diet (2mg/kg) is higher than required to minimize
the functional and blood cell phenotypes in mice.
3) I hypothesize that RBC micronuclei will act as a functional indicator of folate deficiency.

32
CHAPTER 2: POOR REPORTING QUALITY IN BASIC NUTRITION
RESEARCH: A CASE STUDY BASED ON A SCOPING REVIEW OF
RECENT FOLATE RESEARCH IN MOUSE MODELS (2009-2019)
2.1 Abstract
Transparent reporting of nutrition research enables rigour, reproducibility and relevance to
human nutrition. We performed a scoping review of recent articles reporting on dietary folate
interventions in mice as a case study to determine the reporting frequency of generic study design
items (i.e., sex, strain and age) and nutrition-specific items (i.e., base diet composition, intervention
doses, duration, and exposure verification) in basic nutrition research. We identified 646 original
research articles in the EMBASE, Ovid Medline, FSTA, Global Health and IPA databases
published between January 2009 and May 2019 in which a dietary folic acid (FA) intervention was
used in mice. Of these, 246 original peer-reviewed articles including 152 studies in non-pregnant
and 96 in pregnant mice were identified. Most studies reported sex (100%), strain (98%) and age
(85%). The majority of studies used C57BL/6 (51%) or BALB/c (13%) mice aged 3-9 weeks. Non-
pregnancy studies were more likely to use only male mice (57%). Dietary FA interventions varied
considerably and overlapped: deficiency (0-2 mg/kg), control (0-16 mg/kg) and supplemented
(0.1-60 mg/kg). Only 60% of studies used an open-formula base diet with a declared FA content
and folic acid exposure was verified by folate status biomarkers in only 59% of studies. The
duration of interventions ranged from 0-60 weeks for non-pregnancy studies. The duration of
interventions (0-21 weeks) and the period of intervention (before and/or during pregnancy and/or
lactation) in pregnancy studies were variable. Overall, 14% of studies did not report ≥1 generic
reporting item(s) and 41% did not report ≥1 nutrition-specific reporting item(s). The variability

33
and frequent lack of reporting of important generic and nutrition-specific study design details in
nutrition studies limits their generalizability, reproducibility and interpretation. The use of
reporting checklists for animal research would enhance reporting quality of key study design and
conduct factors in animal-based nutrition research.
2.2 Introduction
Nutrition research is essential for establishing nutrient requirements and dietary guidance
to ensure the proper growth, development and maintenance of health for both humans and animals.
The ability to perform accurate and reliable nutritional risk characterization is dependent on the
quality and quantity of animal-based research. Animal studies provide an opportunity to directly
observe biochemical and physiological interactions and responses to food substances that
otherwise cannot be observed in humans (57). As such, basic nutrition research, especially in
animal model systems, informs causal relations between specific food substances and health
outcomes and allows for the elucidation of specific mechanisms of action. Nonetheless, despite
the large quantity of published animal studies, study quality and reporting are crucial for ensuring
that observations are accurate and reproducible.
Findings from pre-clinical studies often provide the plausibility needed to support the
design of clinical trials. However, knowledge translation from animal studies to human research
is dependent on transparent reporting. Poor and incomplete reporting of scientific findings raises
concern for all stakeholders, including researchers, journals, funding agencies, academic
institutions and medical and public health professionals (61). Findings from animal studies are
used extensively to inform nutrition risk assessments, however, when these findings are poorly
reported their utility and validity is limited (62). A systematic review of animal-based studies

34
published between 1999-2005 demonstrated common major omissions of basic animal
characteristics (e.g. strain, sex, age, etc.) and their environmental conditions (63). These study
design characteristics do not only influence the results obtained but are required to reproduce and
appraise the findings (60,64). For instance, underreporting of animal strains can mask existing
biases towards the use of specific inbred strains and limits the ability to generalize findings to other
strains and more broadly to other species and human populations (65,66).
Reporting guidelines such as ‘Animal Research: Reporting of In Vivo Experiments’
(ARRIVE) were developed to provide a checklist of the minimum details required in an animal-
based scientific publication with the aim to mitigate generic issues related to study design and
analysis. Issues addressed include the reporting of both primary and secondary outcomes, key
methodology (i.e., analytical method used; source and validation of reagents; quality control
measures) and results (i.e., unit of analysis; measure of precision)(67)(68). Animal characteristics
(e.g. species, strain, sex and developmental stages), their housing and husbandry conditions
(including welfare-related assessments), and relevant baseline data are highlighted because they
can impact experimental outcomes (68). The guidelines addresses study design issues such as
sample size determination to allow replicability while minimizing selection bias, and the statistical
methods used to analyze experimental outcomes (68). Errors in study design can result in
systematic biases and distorted intake-response relations of reported findings, emphasizing the
need for clear and transparent reporting of study design details. Generic reporting tools do not
focus on nutrition-specific issues that should be reported in basic nutrition research studies in
addition to generic study design details. Nutrition-specific reporting issues include the composition
of base diets, duration of dietary intervention, dietary intervention dose, and verification of

35
intervention/exposure by assessing the diet directly or by assessing nutritional intake/status
indicators.
Our objective was to perform a scoping review of recent basic nutrition research to
determine the frequency of reporting of a selection of fundamental generic study methodology
items, such as sex, strain and age of mice studied, as well as the frequency of reporting of nutrition-
specific items, such as base diet, nutrient intervention dose, exposure verification and intervention
duration. As a case study to assess reporting of generic and nutrition-specific items in basic
nutrition research, we focused the scoping review on recent folate research in mice (last 10 years),
a field with recent exponential growth in publications. We assumed that reporting in folate research
would generally reflect reporting in other nutrition research areas.
2.3 Methods
2.3.1 Search Strategy
A literature search to retrieve articles that included studies of the effect of dietary folic acid
in mouse models was conducted by the Health Canada Library. All scoping review methodology
protocols are based on Preferred Reporting Items for Systematic Reviews and Meta-Analyses
Extension for Scoping Reviews (PRISMA-ScR) guidelines (69).
Electronic databases EMBASE, Medline, Food Science and Technology Abstracts
(FSTA), Global Health and International Pharmaceutical Abstracts (IPA) were searched in the
Ovid interface. All database searches were restricted to 2009-present (May 2019) and English
language published articles. The keywords and their variants used to identify relevant articles in
each database included: folic acid, folic acid deficiency, folate metabolism, folic acid blood level,
folate, diet, diet supplementation, dietary supplement, mouse model, mice or mouse. The specific
syntax expressions used to identify studies with folic acid were (folic acid/ or folic acid deficiency/

36
or folate metabolism/ or folic acid blood level/) OR ((folic acid or folate) adj5 (deficien* or
enriched or exposure or fortifi* or intake* or metaboli* or restrict* or supplement*)).tw,kw; those
used to identify articles with dietary interventions were (diet supplementation/ or dietary
supplement/ or diet/) OR ((diet or diets or dietary or nutrition*).tw,kw.). And finally, the
expressions used to identify articles with mouse models were (mouse model/) OR ((((mice or
mouse) adj3 model*) or mouse?model*).tw,kw.) OR (exp mouse/ or (mice or mouse).tw,kw.) OR
(animal experiment/ or animal model/ or controlled study/ or (control or experimental or studies
or study).tw.). The search was run up to May 3, 2019. The full search strategies are presented in
Supplementary Tables 1-4. The search results were uploaded into the web-based bibliographic
manager RefWorks 2.0 (ProQuest LLC, Bethesda, MD) database. Duplicate articles identified
between databases were removed in RefWorks (Figure 4).
37
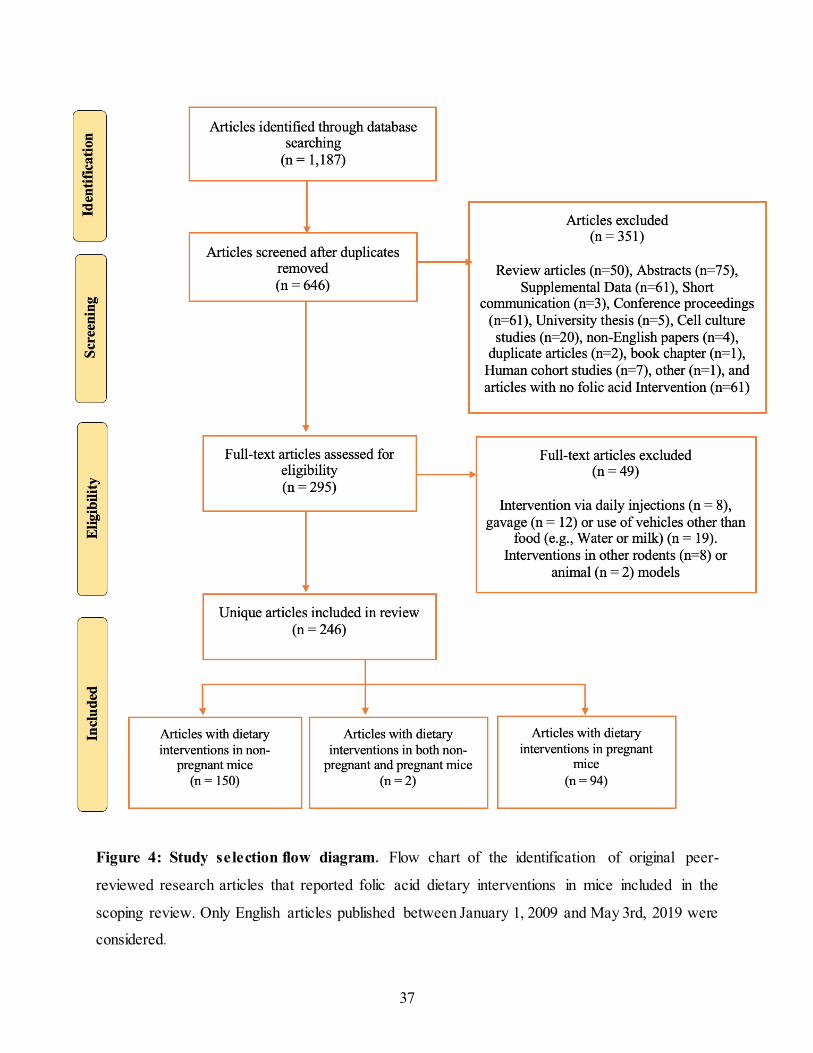
Figure 4: Study selection flow diagram. Flow chart of the identification of original peer-
reviewed research articles that reported folic acid dietary interventions in mice included in the
scoping review. Only English articles published between January 1, 2009 and May 3rd, 2019 were
considered.

38
2.3.2 Selection of Studies
Literature search restrictions were used to focus on the last decade during which folate
research experienced an exponential growth in publications. The inclusion criteria used to select
published articles for analysis in this scoping review were articles that: (1) were original and peer-
reviewed; (2) used a mouse model; (3) conducted a dietary folic acid intervention using food as a
vehicle; (4) were in the English language and (4) published between January 2009 and May 2019.
2.3.3 Data Extraction and Charting
The selected articles were divided into two groups depending on whether the article
described a study that examined folic acid interventions in pregnant or non-pregnant mice. Data
from each article was extracted into a Microsoft Excel spreadsheet (Macintosh 16.30 version:
Microsoft Corporation). If an article presented multiple independent experiments, each experiment
was treated as an independent “Study”. Two articles included both a ‘non-pregnant’ and a
‘pregnant’ mouse experiment; therefore, the two articles were included in both study groups. For
studies in which experimental mice were exposed to two different interventions, each intervention
dose and duration was considered individually.
Full references for each article were extracted including the article title, authors, journal,
pages, country and publication year. Generic data extracted from each study included diseases
and/or mechanisms under study, mouse strains, sex and age at start of intervention(s). Substrains
of mice were grouped by strain. Additionally, nutrition-specific data extracted included the folic
acid dose of the control and intervention(s), base diets and their folic acid content, intervention
duration, and method of folate status verification. Folic acid content was recorded in mg/kg.
Information on folic acid content in base diets was either obtained from the article (reported), from
previously reported diet formulations when a reference was reported (declared), or manufacturer

39
website (declared) when the diet’s catalogue number was provided. Closed-formula base diets and
base diets reported only as standard rodent chow were grouped together as standard rodent chow.
Unless otherwise stated in the article, when a standard rodent chow was used, we defined it as the
control diet. Studies that used a standard rodent chow as a base diet but did not report ingredient
formulation and the formulation could not be found on the manufacturer’s website were defined
as having an unreported folic acid content.
For pregnancy studies, data (when available) were extracted separately for the dams, sires
and offspring, as applicable for the study design. Pregnancies whereby a live birth was achieved
was classified as having an offspring endpoint. Studies whereby the dams were sacrificed during
the pregnancy were classified as having an embryo endpoint. Multigenerational studies were
treated as a single study when the dietary intervention was the same for all generations.
Multigenerational studies in which different generations were given different dietary interventions,
each generation was considered a unique “Study”.
2.4 Results
The literature search was conducted and completed in May 2019 and identified 246 original
research articles published between January 1, 2009 and May 3, 2019 in which a dietary folic acid
intervention in mice was described. Of these articles, 152 articles described a study in non-
pregnant mice, 94 articles described a study in pregnant mice, and 2 articles described studies in
both pregnant and non-pregnant mice. The flow chart representing article identification and
selection is in Figure 4. Review articles (n = 50), abstracts (n = 75), supplements (n = 61), short
communications (n = 3), conference proceedings (n = 61), university theses (n = 5), cell culture
studies (n = 20), articles with no FA intervention (n = 61), articles with folic acid interventions via

40
daily injections (n = 6), gavage (n = 12), or water or milk as a vehicle (n = 19) were excluded.
Additionally, articles in humans (n=7) or those that used an animal model other than mice for their
dietary folic acid intervention were excluded (n = 10; rats (n = 8), pigs (n =1) and monkeys (n =
1)). Finally, non-English papers (n = 4), a duplicate article (n = 2), a book chapter (n = 1) and an
article whereby the full text could not be located (n = 1) were removed.
2.4.1 Health outcomes investigated
A wide variety of health outcomes and biochemical processes were investigated in the
articles selected for this review. Articles were grouped into broad topic areas including cancer,
cardiovascular diseases, congenital defects, gastrointestinal diseases, genetic instability, immune
responses, liver diseases, neurodegeneration, urinary disorders as well various biochemical
pathways (Table 1). Neurodegeneration (n = 36, 23.4%) and cardiovascular disease (n = 22,
14.3%) were the most common health outcomes examined in non-pregnant studies. In the
pregnancy studies, congenital defects (n = 36; 37.9%), genetic instability (n = 23; 24.2%) and
neurodegeneration (n = 15; 15.6%) were the most common outcomes examined.

41
Table 1: Health outcomes investigated.
Health outcome or
biochemical processes
No. of articles with studies in non-
pregnant mice, n (%)
No. of articles with studies in
pregnant mice, n (%)
Biochemical Pathway 16 (10.4) 6 (6.3)
Cancer 31 (20.1) 6 (6.3)
Cardiovascular 22 (14.3) 3 (3.2)
Congenital defects 0 (0.0) 36 (37.9)
Gastrointestinal 7 (4.5) 2 (2.1)
Genetic Instability 16 (10.4) 23 (24.2)
Immune Response 5 (3.2) 1 (1.1)
Liver Disease 16 (10.4) 2 (2.1)
Neurodegeneration 36 (23.4) 15 (15.6)
Urinary disorders 5 (3.2) 2 (2.1)

42
2.4.2 Mouse strain
Most studies (99%) reported mouse strain. A total of 32 strains and 17 substrains were
identified in the studies. Most studies used C57BL/6 (n = 184; 51%) or BALB/c (n = 48; 13%)
mice. The percentage representation of commonly used mouse strains and low representations
strains/substrains used in the studies is shown in Figure 5. Strains and substrains identified in the
studies are presented in Supplementary Tables 5.

43
Figure 5: Mouse strains . Representation of mouse strains used in folate research studies published
between January 2009 and May 2019. *Low representation strains are strains used in less than 5%
of all the studies. These included the following strains: CD1, C3H, Swiss, AJ, WSB/EIJ, FVB,
Kumming, Tg, CAST/EIJ, PWK/PHJ, Big Blue, CBA, LM/BC, ICR, Athymic nu/nu, SCID, SJL,
SMV, DBA, NIH, Intercrossed Inbred, Intercrossed Outbred, 634Mui/J, Beige Nude XID,
Mutamouse, SMV, LPT/LeJ, Curly Tail, CF1 and their substrains.

44
2.4.3 Sex
Among the 152 non-pregnant studied reviewed, all reported the sex of the mice. The
majority of the studies used male mice (n = 87; 56.5%), followed by studies with both male and
female mice (n = 48; 31.2%) and fewer used female mice (n = 19; 12.3%) as shown in Figure 6,
panel A. For obvious reasons, the majority of pregnancy studies reported a dietary intervention
in female mice (pregnant dams), although 7 studies examined the dietary effect in sires and their
offspring. For the sex analysis of pregnancy studies, sex was identified based on the mice for which
the endpoint was measured. Of the pregnancy studies, 54 studies examined embryos and 56 studied
the live birth offspring in the postnatal period. Most studies examined both sexes in embryo (n =
51; 94.4%) analyses, but only about half of the time in live birth offspring (n = 30; 53.6%) analyses
(Figure 6, panel B). When embryo/live birth offspring analyses were performed in only one sex,
it was more likely to be in males (n = 24/29; 82.8%).

45
Figure 6: Mouse sex. Representation of mouse sex included in non-pregnant and pregnancy
studies published between January 2009 and May 2019. A) Representation of mouse sex used in
folate non-pregnant research studies. B) Representation of mouse sex of offspring analyzed in
pregnancy studies.
20
87
47
0
10
20
30
40
50
60
70
80
90
100
Female Male Male and Female
Nu
mb
er
of
Stu
die
s
Sex
3
21
5
51
30
0
10
20
30
40
50
60
Embryo Live-born
Nu
mb
er o
f S
tud
ies
Offspring stage
Male and Female
Female
Male
A
B

46
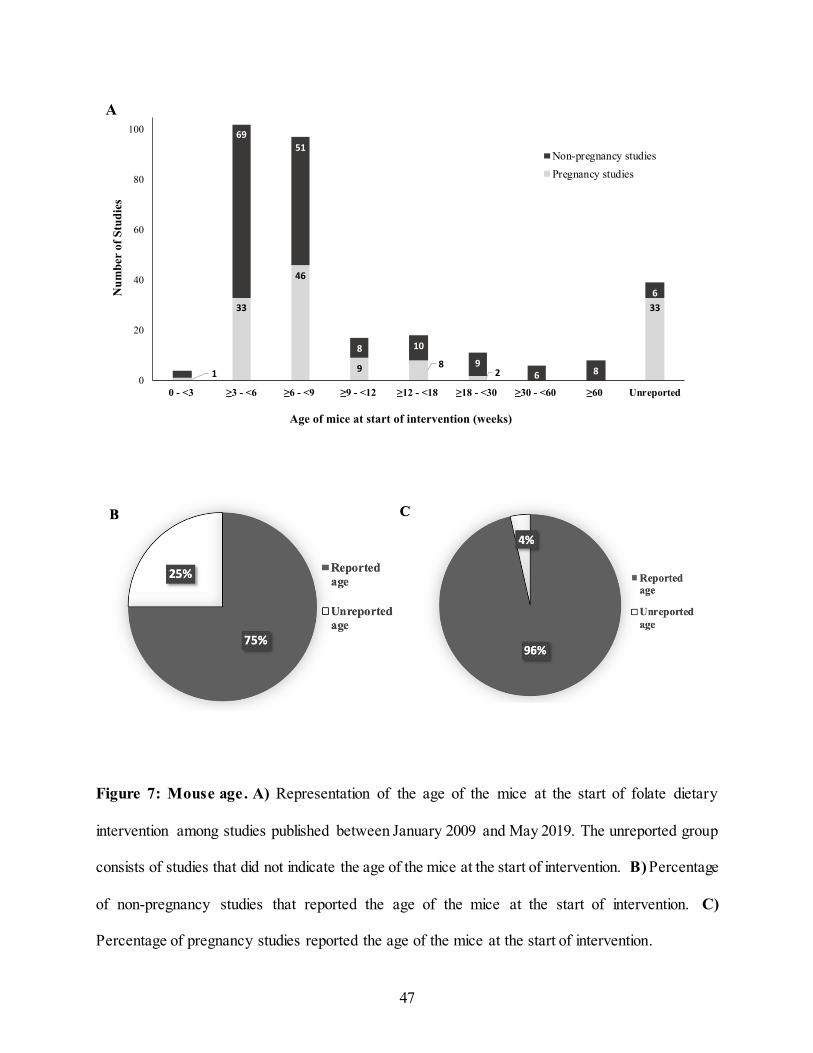
2.4.4 Age
Forty-four studies (14.0%) did not report the age of the mice at the start of the dietary
intervention. This was more common among pregnancy studies with 33 pregnancy studies (25%)
compared to 11 non-pregnant studies (6%) not reporting age (Figure 7, panel B and C). The age
at time of intervention among non-pregnancy studies varied substantially from 3 to 120 weeks
(Figure 7, panel A). However, the majority of the studies (n = 120; 66.7 %) used younger mice
aged 3-9 weeks. In the pregnancy studies, the age range of the dams and sires was smaller varying
from 2 to 30 weeks. Similar to the non-pregnancy studies, the majority of the studies (n = 79;
59.8%) used younger mice aged 3-9 weeks at the start of the dietary intervention.
47
Figure 7: Mouse age. A) Representation of the age of the mice at the start of folate dietary
intervention among studies published between January 2009 and May 2019. The unreported group
consists of studies that did not indicate the age of the mice at the start of intervention. B) Percentage
of non-pregnancy studies that reported the age of the mice at the start of intervention. C)
Percentage of pregnancy studies reported the age of the mice at the start of intervention.
1
33
46
9 82
33
3
69
51
8 10
96 8
6
0
20
40
60
80
100
0 - <3 ≥3 - <6 ≥6 - <9 ≥9 - <12 ≥12 - <18 ≥18 - <30 ≥30 - <60 ≥60 Unreported
Nu
mb
er
of
Stu
die
s
Age of mice at start of intervention (weeks)
Non-pregnancy studies
Pregnancy studies
A

48
2.4.5 Folic acid intervention dose(s)
All studies reported at least one intervention dose, including control, deficient and/or
supplemented intervention groups. Control diets ranged from 0 to 16 mg/kg of FA. This did not
include one outlier study in the non-pregnant category that reported a 200 mg/kg FA control diet;
it was assumed to be a typo but we could not verify with the authors. A control diet containing 2
mg/kg FA was most commonly used (n = 161, 74.8%) of studies. Deficient diets ranged from 0 to
1.99 mg/kg FA with the majority (n = 171, 94.5%) containing 0 mg/kg of FA. A broad range of
supplemented diets was noted ranging from 0.17 – 60 mg/kg of FA with 32.7% of the studies
containing 6 mg/kg of FA. The ranges of FA content of the deficient and supplemented diets
overlapped with each other and the control diet (Figure 8).

49
Figure 8: Folic acid dose included in the dietary intervention(s). Reported folic acid (FA)
content of the control, deficient and supplemented diets used in both non-pregnancy and pregnancy
mouse studies.

50
2.4.6 Base diet
Over half of the studies (n = 261; 60.3%) reported the use of a defined formulated base diet
(Figure 9, panel A). Specifically, the AIN-93 diet (70) was the most commonly used (n = 135;
31.2%), followed by the AIN-76 (71) (n = 31; 7.2%) and NIH-31 (72) (n = 17, 3.9%) diets. For
analysis, closed-formula base diets were grouped together with diets reported as standard rodent
chow. By this definition, eighty-three (43.7%) non-pregnancy studies used a standard rodent chow
base diet, of which only 55 (66.3%) reported/had a declared FA content. Among the pregnancy
studies, 89 (36.6%) used a standard rodent chow base diet, and of those, 79 (88.8%) reported/had
a declared FA content (Figure 9, panel B and C).

51
Figure 9: Base diets. A) Base diets reported in both non-pregnancy and pregnancy mouse studies.
B) Percentage of studies that used an open-formula diet versus a closed-formula base diet in non-
pregnancy and pregnancy mouse studies. C) Reported folic acid content (but not necessarily
measured) in the closed-formula base diets used in non-pregnancy and pregnancy mouse studies.

52
2.4.7 Duration of intervention(s)
The duration of intervention among non-pregnant studies ranged from 2 days to 60 weeks
(Figure 10, panel A). Six studies (2.8%) did not report the duration of intervention. Among the
pregnancy studies, FA dietary intervention duration ranged from 2 – 21 weeks. However, the
initiation of the FA dietary interventions relative to the pregnancy varied with some being initiated
before mating, during pregnancy and/or during lactation, and with variable intervention durations
(Figure 10, panel B). The majority of the studies initiated the dietary intervention before mating
and maintained it throughout pregnancy (40.1%), followed by studies where the intervention
started before mating and was continued until the pups were weaned at 3 weeks old (mating,
gestation and lactation) (35.6%).

53
Figure 10: Duration of folic acid dietary interventions . A) Duration of folic acid dietary
interventions reported in non-pregnancy mouse studies. B) Duration of folic acid dietary
interventions reported in pregnancy mouse studies. Studies were grouped into 3-week intervals up
until 18 weeks. Longer duration studies were grouped into 18-30 and greater than 30 weeks.
19
4744
18
28
12
24
32
2
0
5
10
15
20
25
30
35
40
45
50
0 - <3 ≥3 - <6 ≥ 6 - <9 ≥ 9 - <12 ≥12 - <15 ≥15 - <18 ≥18 - <30 ≥30 - <60 Unreported
Nu
mb
er o
f S
tud
ies
Duration of Intervention (weeks)
1
1081
14
43
20
20
3
12
31
2
1
1
0
10
20
30
40
50
60
Before Mating only Before Mating &
Pregnancy
Before Mating,
Pregnancy & Lactation
Pregnancy only Pregnancy and
lactation
Unreported
Nu
mb
er
of
Stu
die
s
Duration of Intervention in Studies
Unreported
> 18-21 weeks
> 15-18 weeks
> 12-15 weeks
> 9-12 weeks
> 6-9 weeks
> 3-6 weeks
0-3 weeks
A
B

54
2.4.8 Folic acid intervention verified by biomarker
The total exposure to folic acid in a dietary intervention is dependent on both the FA
content of the base diet and the intervention dose. Changes in folate status in response to dietary
intake is one way that the exposure can be verified. Plasma/serum or tissue folate or plasma/serum
homocysteine are biomarkers that can be used to verify folate exposure. About 40% of all studies
did not verify folate status in exposed mice using one of these biomarkers. This included over a
third of the non-pregnancy studies (n = 53; 34.9%) and almost half of pregnancy studies (n = 42;
43.8%) did not verify folate status in the mice (Figure 11, panel A). About 36.4% of the studies
used a closed formula base diet for their intervention. Of these, only 20.8% verified the folate
status in the mice. On the other hand, only 40.8% of the studies that used an open formula diet
verified the folate status in the mice (Figure 11, panel B).

55
Figure 11: Folic acid exposure verification. A) Percentage of studies that used a biomarker to
verify folate status of the mice used in folic acid intervention studies. Acceptable methods of folate
status verification included circulating or tissue folate or circulating homocysteine analyses. B)
Percentage of studies that reported folic acid content in the base diet and verified folate status of
mice.
40.7
23.0
12.5 12.1
8.53.2
0.0
5.0
10.0
15.0
20.0
25.0
30.0
35.0
40.0
45.0
Verified Not Verified Verified Not Verified
Open-formula diet Closed-formula diet
Per
cen
tag
e of
Stu
die
s
Folic acid content verification
Unreported folic acid content
Reported folic acid content
B

56
2.5 Discussion
We identified a high proportion of basic nutrition studies that did not report key generic
and nutrition-specific details. While incomplete reporting in scientific research publications is not
unique to nutrition science (63), it nonetheless needs to be addressed to minimize negative
implications for reproducibility, ethical animal use, funding allocation, and translation to human
health (73) (60,74). Animal models are vital for the identification and investigation of causal
pathways that underpin health outcomes related to nutritional exposures, but the unique
characteristics of the animal models used can influence the final experimental results (64).
Similarly, the dietary intervention and how it is applied will also influence the outcome. Multiple
systematic reviews investigating the reporting quality of animal-based studies, such as the 2009
report by Kilkenny et al. (63), highlight major reporting omissions including the hypothesis,
sample size, basic animal characteristics (e.g., age, sex, strain), actions to reduce bias, and
statistical methods. In addition to these generic reporting issues, we identified key nutrition-
specific items that warrant proper reporting in basic nutrition research studies. These items include
base diet source and composition, intervention dose, exposure verification, and intervention
duration. Among the studies reviewed, 14% did not report at least one of the limited generic items
we assessed and 41% did not report at least one nutrition-specific item, indicating that reporting
omissions are common in basic nutrition research. Because we focused on a limited number of
generic and nutrition specific items, this is likely an underestimate of underreporting in nutrition
studies. It should be noted that this was not a full quality assessment of the studies, but rather a
limited assessment of specific study reporting details in service of highlighting the lack of
reporting of nutrition-specific details in basic nutrition studies. A full quality assessment is beyond
the scope of this review.
57
The majority of studies reported the basic animal characteristics assessed in this scoping
review, with 100%, 98% and 86% of studies reporting sex, mouse strain, and age at intervention,
respectively. The frequency of reporting of these foundational details were better than previously
reported for mouse studies, where only 65% and 68% of studies reported sex and age or weight of
mice, respectively (63). It should be noted that ours was not a fulsome assessment of generic
reporting items and likely represents a major underestimate of poor-quality reporting. For example,
Kilkenny et al. found that ~45% of mouse studies reported the hypothesis, sex, strain, age and/or
weight, and number of animals used, whereas >70% of studies demonstrated low quality reporting
of experimental design and statistical analyses (63). Reporting of these seemingly simple but
foundational details is particularly important because poor reporting can lead to erroneous
conclusions and/or irreproducibility of experimental findings (66). For example, sex-differences
account for differences in gonadal steroid hormones, body size, metabolic rate, epigenetic
programming and gene expression (75–78), all of which can influence responses to nutritional
interventions and health outcomes. Our study also highlighted the known publication bias towards
the use of male animals in preclinical studies; over half (56.5%) of the non-pregnant studies were
conducted in only male mice and only male live-born offspring were studied in over a third
(37.5%) of pregnancy studies. The assumption that findings from single-sex (male) studies can be
applied generally has been repeatedly reputed (75,79). Such publication bias inflates interventions
and treatment outcomes that may be ineffective to the generalized population (66). Preclinical
trials provide the foundations and guidelines for clinical trials, therefore, accounting for variations
due to sex in preclinical trials is an effective way to avoid costly and potentially ineffective clinical
trials (80). Recognizing the influence of sex on experimental outcomes, international agencies such
as the National Institutes of Health (NIH), the Canadian Institutes of Health Research (CIHR) and

58
the European Union (EU) require the sex of animal models to be reported in publications and
funding requests, and to justify the use of single-sex animals in their studies (75,80–82). These
more recent policy changes may account for the consistent reporting of sex in the studies we
surveyed. Time will tell whether they impact the bias towards the use of male animal models.
Animal strain-specific genetic and phenotypic variability can also impact metabolism and
disease pathogenesis (80,83). Genomic diversity, and its manipulation through the use of
transgenic tools, allows researchers to investigate the influence of individual genes on disease
pathogenesis, intervention effectiveness, metabolic rates, susceptibility to disease and much more
(74,83–85). Mouse strains are selected to study specific outcomes based on phenotypes defined by
their genomic background (74). Strains can be more or less susceptible to a nutritional intervention
and/or the development of specific health outcomes making this an important reporting detail (74).
Almost all studies assessed in the scoping review reported mouse strain. It was noteworthy,
however, that 3 major inbred mouse strains were used in 70% of folic acid research studies.
Importantly, this is an underestimate of strain diversity because substrains of major strain types,
which can be genetically and phenotypically distinct (86), were grouped together. The genetic and
phenotypical differences can potentially influence how the mouse models respond to dietary
interventions. The use of single strains or transgenic lines can limit the generalizability of findings
to other strains, and by extension to human populations.
The age of mice at the start of intervention was less likely to be reported compared to sex
and strain. Age varied substantially among studies (i.e., non-pregnant studies: 3 to 120 weeks;
pregnancy studies: 2 to 30 weeks). Variability in age at intervention can be necessary and health
outcome-dependent (i.e.; an aging study performed in older mice), but should be reported and
rationalized given that metabolic rate, physiological response and disease pathogenesis are age-

59
dependent (87). Animal characteristics, including others not assessed in this scoping review, can
interact to influence experimental outcome (88,89) making it essential that all details are reported
consistently and transparently.
2.5.1 Reporting Nutrition Specific Items
Animal-based research allows for the assessment of controlled nutritional interventions on
outcomes. However, this assumes we have an accurate assessment of the nutritional exposure.
Two-thirds of the studies utilized an open-formula diet (63.7%), most often AIN-93. Open-formula
defined diets were developed in the 1970s to address the growth, maintenance and developmental
needs of rodents, to standardize laboratory animal diets, and to facilitate inter-study comparisons
(70,71,90). Unlike closed-formula diets, the ingredients are purified and concentrations are
declared and publicly available (90). Changes to the formulation can be made to meet specific
experimental needs with few, if any, changes to other ingredients, which can enhance consistency
in nutritional exposure within and between distinct study designs.
Surprisingly, over a third of the studies used closed formula diets (36.3%), which included
studies that provided no details on the brand, manufacturer or folic acid content of the “standard
rodent chow” employed. In contrast to open-formula diets, the ingredient list of closed-formula
diets is often proprietary, only available upon request, and subject to change without public
disclosure (90). Standard rodent chow can contain a variety of cereals and other ingredients
resulting in variable concentrations of the food substance of interest (90,91). Diet formulation, and
thereby specific food substance content, can be changed in response to fluctuations in ingredient
costs, and seasonal or geographic variations in source materials (90). Variations in other intrinsic
food substances in ingredients, such as endogenous phytoestrogens, may confound findings. The
diet-health outcome relation investigated depends on the overall exposure from both the base diet

60
and the added intervention dose. For these reasons, if a closed formula diet is used, the absolute
amount of exposure to a food substance may not be known and/or may vary considerably. For this
review, when the catalogue number was provided in the study methods, we reached out to
manufacturer for the ingredient list and FA content. Unfortunately, even that information was
limited because it reflected the current formulation which may not be consistent with the diet used
in the study. Overall, the use of closed formula diets hinders the ability to compare and reproduce
basic nutrition studies. Ideally, investigators would use open-formula diets and declare information
such as the manufacturer, catalogue number and lot number.
The prominent use of closed-formula diets in nutritional studies prompted us to investigate
whether studies reported whether the FA exposure was verified by direct analysis of the diet or by
assessing a biomarker of exposure in the mice. About two-thirds of studies verified the folate
content of their diets and this was similar between closed and open-formula diets. A biomarker of
exposure can be used to validate the nutritional exposure thereby confirming the relationship
between the exposure and health outcome (92,93). Biomarkers can be used to evaluate exposure
(e.g. dietary intake) or a functional response to an exposure (i.e. metabolism) (92,93). Serum folate
is commonly used as an indicator of recent exposure while RBC (or other tissue) folate is an
indicator of long-term folate status (11). Plasma homocysteine is a functional biomarker of folate
status and is inversely correlated with circulating folate concentrations (11). Our findings showed
that 44% of studies (34.9% of non-pregnant studies and 43.8% of pregnancy studies) did not verify
folate status using a biomarker. Studies that lack folate exposure verification combined with the
use of closed-formula diets (15.3%) would have a high degree of uncertainty in relating exposure
to the experimental outcome of interest. Ideally, all studies would verify exposure by measuring

61
the food substance content of the intervention diet and/or analysing biomarkers of exposure in the
animals.
Although not a reporting issue, we found a remarkable degree of variation and overlap
among the definitions for what constituted a control, deficient and supplemented FA intervention.
Open-formula diets generally define adequate folic acid as 2 mg/kg (70,71) and this was indeed
the most commonly used control diet reported (63.9%). However, studies used a control diets
containing 0 to 16 mg FA/kg. In addition, investigators routinely used the term FA deficient (0 to
2 mg FA/kg) or supplemented (0.17 to 60 mg FA/kg) to describe diets with FA contents that
overlapped considerably with 2 mg/kg. The inconsistent definitions for “deficient”, “control” and
“supplemented” underscore the need for standardization. Even though a 2 mg FA/kg diet is
commonly used as a control diet, it is unclear what the appropriate definition for
deficient/excessive FA intake would be. The standardization of terms and definitions along with
clear reporting of actual intervention doses would enable consolidation of findings across studies
and improve reproducibility.
2.5.2 Recommendations
Improving the reporting quality of publications in nutrition science is one way to enhance
accuracy, transparency and reproducibility of findings. Based on our scoping review, we propose
a number of recommendations to address under- and/or misreporting of generic study design and
implementation items and nutrition-specific items (Summarized in Table 2).
For the reporting of generic study design and implementation items, we recommend the use of
the ARRIVE guidelines. The ARRIVE guidelines are currently recommended by the American
Society for Nutrition journals, but only required for the American Journal of Clinical Nutrition.
This reporting checklist outlines essential study design details that should be included in animal-

62
derived publications to facilitate accurate reporting and enhance reproducibility (63,68,73). The
ARRIVE guidelines consist of two checklists, The Essential 10 and the complementary
Recommended Set comprised of an additional 11 reporting items (94). The Essential 10 checklist
addresses fundamental generic items including study design, sample size, inclusion/exclus ion
criteria, randomization, blinding, outcome measures, statistical methods, experimental animals,
experimental procedures and results. The Recommended Set expands on the Essential 10 to
address reporting of the abstract, background, objectives, ethics, housing and husbandry, animal
care and monitoring, interpretation/implications, generalizability/translation, protocol registration,
data access and declaration of interests. It is important to note that we limited our scoping review
to basic experimental animal characteristics (strain, sex and age) as a proof-of-principle assessment
of reporting quality in basic nutrition research. While the majority of studies in our review reported
these basic details, we cannot ensure that the studies represent overall “high” quality reporting for
generic study design items.
Requiring the use of the ARRIVE Guidelines will most certainly enhance the quality of
reporting in basic nutrition research, but they do not address nutrition-specific issues. We
recommend that a nutrition lens be applied to their interpretation. Examples include study design
and experimental procedures. Study design focuses on the reporting of comparison groups and we
would suggest that a rationale for the exposure levels be reported. For essential nutrients, an
appropriate control exposure would be the level of intake required for adequacy, which could be
supported by evidence of an intake-response relation between the nutrient intake and a health
outcome. For non-essential food substances, a more nuanced approach would be needed to
determine appropriate levels of exposure for comparison groups. Experimental procedures focus
on the detailed methods used and the rationale for the approach taken. A number of studies

63
identified in our review used a route of exposure other than oral intake of diet. It would be
important that a rationale be provided for exposing the animals to a food substance via a non-oral
route and how it affects the interpretation of the results.
A rationale should also be provided for the timing of exposure and the duration between
exposure and outcome assessment. Our scoping review saw a wide range of intervention durations
used, ranging from 2 days to 60 weeks in non-pregnancy and 2 to 21 weeks in pregnancy studies.
The timing/duration must be sufficient to plausibly affect a change on the outcome. For example,
spermatogenesis takes 6-8 weeks, so studies examining male fertility should take into account
whether the timing and duration of the nutritional intervention of interest would plausibly affect
fertility parameters. The relevant duration will be outcome specific, and reporting its rational will
improve reproducibility and accurate interpretation of results.
Details about the base diet, including manufacturer, catalogue and lot numbers, and nutrient
composition should be declared. Lack of knowledge of total exposure (for example, base diet
content plus supplement) prohibits the appropriate interpretation of results; conclusions and
inferences to human health are impossible. In addition, study reproducibility is hindered if the
composition of the diet is unknown. Preferably, open-formula diets should be used to better control
the total exposure, minimize errors and increase reproducibility of findings. Ideally, the amount of
the food substance should be verified either in the diet itself or through validated biomarkers of
exposure in the animals. In cases where a closed-formula diet is utilized, the complete diet
formulation should be included, food substance of interest level verified, and biomarker of
exposure assessed. Other nutrition-specific considerations are included in Table 2. Animal-based
nutrition research publications could use the ARRIVE checklist in tandem with our nutrition
specific essential 6 checklist (Supplementary Table 6) as an add-on to further improve the

64
reporting quality of nutrition studies. Our nutrition-specific recommendations aim to enhance
transparency and reproducibility of animal-based nutrition research.
For the purposes of our study, we did not evaluate the reporting of outcomes, but it should be
noted that the use and clear reporting of a validated method for outcome ascertainment is critical
for ensuring transparency and reproducibility. Surrogate markers that predict the outcome can be
used to support these findings. As proposed by the Core Outcome Measures in Effectiveness Trials
(COMET) initiative, using core outcomes in clinical trials allow for comparison and combination
of data across studies (95,96). The core outcomes are defined as a ‘standardized set of outcomes
that should be measured as a minimum’ (95). Similarly, verified outcomes and biomarkers should
be considered in preclinical studies. The findings, effects and health outcomes studied in nutrition
science is highly diverse, as observed in the suite of studies identified in this review. While a
diversity of studies is imperative to fill knowledge gaps, it can also reinforce, undermine or
introduce inconsistencies to the knowledge base depending on how outcomes are measured.

65
Table 2: Concepts that should be considered when reporting nutrition research that utilizes
animal models.
TOPIC CONCEPT RECOMMENDATIONS
Experimental
Animal Model
Rationale for Use Provide rationale for model used including its relevance to the health
outcome being investigated and the food substance under investigation .
Characteristics a. Report details about the species, strain, sex, developmental stage, age,
and body weight of the animal model used.
b. Provide brief details to explain choice of strain, sex, developmental
stage, age, and body weight of animal model used.
c. Comment on randomizations, blinding, statistical methods and actions
to reduce bias.
Outcome a. Provide a rationale for investigating the relation between the food
substance of interest and the health outcome.
b. Report the use of a verified biomarkers of health s tatus to certify
experimental dietary intake-heath outcome investigation.
c. Comment on the choice of tissues analyzed for health outcome.
d. Provide a rationale for investigating non-oral interventions and how it
affects the interpretation of results.
Nutritional
Component
Base Diet a. Use an open-formula diet to minimize experimental variability and
improve precision and reproducibility. If a closed-formula diet is
utilized, provide details of formulation (i.e., complete ingredient list and
their relative concentrations), manufacturer and catalogue number and
lot numbers with publication. The food substance of interest
concentrations should be verified in the diet itself and/or through a
validated biomarker of exposure in the animals.
b. Provide details on method used to verify nutritional composition of diet.
c. Comment on environmental factors that may influence dietary intake
and act as confounding factors.
Intervention Dose a. Give full details on the concentration of dose used in the intervention,
including that of the comparison diet (control), explain whether or not
nutritional component was modified in the base diet or administered
differently. Total exposure (base diet plus added amount, if applicable)
should be reported.
b. Provide a rationale for the doses used and relevance to adequate intakes
(when established for an essential nutrient) or usual intakes for other food
substances.
Duration of Exposure Provide a brief description to justify chosen duration of dietary
intervention, including how it relates to the development of the outcome
being measured.
Verification of Exposure a. Comment on the method used to verify exposure, such as the
measurement of biomarkers of intake or status.
b. Provide a rationale for the choice of tissues analyzed for the biomarkers
of exposure.

66
2.6 Conclusions
Nutrition science publications provide the knowledge foundation that informs decisions
made by the general public, research scientists, clinicians and policy makers (97). However, they
can be influenced by trends and underlying stakeholder interests, and be used by the media to
either promote or undermine the credibility and trust in scientific evidence (98). When publications
are found to be conflicting, incomplete and/or irreproducible, they can erode the public’s trust.
Poor reporting of scientific findings contributes to these challenges. As our scoping review
demonstrates, there is a great need for better reporting of animal-based nutrition research. The use
of reporting guidelines such as ARRIVE to report basic animal characteristics and experimental
designs, combined with consideration of nutrition-specific concepts, will improve the
transparency, reproducibility and reliability of these publications.

67
CHAPTER 3: FOLIC ACID DOSE-RESPONSE STUDY IN MICE
3.1.Abstract
Folic acid, the synthetic form of folate is commonly used to supplement food in fortification
programs. This essential group of enzyme co-factors are essential in nucleotide and methionine
biosynthesis as well as various methylation reactions. Over time, clinical trials have provided
essential information on the causal relationship between this nutrient and health outcomes.
However, animal studies expand on this knowledge by identifying and investigating the causal
mechanism governing these relationships. Knowledge translation of animal-derived data can be
challenging when folate intake and identified health outcomes in mice cannot be accurately
translated to human nutrition. The goal of this dose-response study was to identify folate-
dependent physiological, functional and genomic endpoints that could be used as surrogate
biomarkers of folate intake in mice while taking into account biological variations due to strain
and sex. The findings of our study showed clear sex and strain differences for majority of the
endpoints investigated (i.e., body weight, food consumption, plasma total folate, folate vitamers,
CBC, plasma homocysteine and micronucleus frequency). To harmonize findings from mouse
studies in the folic acid research field, we propose using biomarkers to define the folate intakes
associated with adequacy, deficiency or supplementation. From the findings of our study, we
proposed the appearance of elevated homocysteine concentrations (i.e., ≥ 3.88 umol/L) as a
biomarker of low folic acid intake and elevated unmetabolized folic acid (i.e., ≥ 7.71 nmol/L) as
a biomarker of high folic acid intake.

68
3.2.Introduction
Folates are a group of enzyme co-factors responsible for carrying out one-carbon metabolic
reactions in the body. These one-carbon metabolic reactions play a critical role in purine,
pyrimidine and methionine biosynthesis and mediate multiple methylation pathways
(10,46,99,100). This essential water-soluble vitamin is primarily obtained through our diet. Foods
such as legumes and fruits (especially citrus fruits) are rich in naturally occurring folates (10). The
synthetic form of folate, known as folic acid (FA or PGA) is used to supplement foods such as
pasta and white wheat flour in various countries such as Canada and the United States (101).
Unlike the naturally occurring folates, FA is about 85% more bioavailable, less susceptible to
oxidative cleavage and its monoglutamate structure allows for easier absorption (11,99). These
characteristics makes the synthetic FA the ideal form of folate to use for fortification.
The one-carbon metabolic reactions that folate mediates play a role in gene regulation,
transcription, DNA stability and repair (10,46,102). When these processes are hindered during
embryogenesis due to folate deficiency, it can lead to devasting birth defects, namely NTDs. Food
fortification programs were introduced with the goal of increasing the population’s baseline folate
intakes and ergo reduce the incidence of NTDs. Since the introduction of fortification programs in
1998, the prevalence of NTDs in Canada was reduced by 46% in 2007 (22). Nonetheless, concerns
have been raised that over-consumption of FA may have adverse effects. As such, the challenge is
to balance those potential health risks of over-consumption with the known health risks associated
with deficiency. Identification of the optimal and safe FA intake range remains an important
question.
Clinical trials provide essential information on the causal relationship between nutritional
components and health outcomes, but do not necessarily elucidate mechanism. Animal studies

69
build on this knowledge by identifying and investigating the underlying causal mechanisms that
give rise to these associations (103). However, the issue remains as to how to relate the intakes in
the animals to those observed in humans.
Biomarkers provide us the ability to assess intake (exposure) and status. A number of
accepted folate biomarkers are common to both mice and humans, including serum/plasma total
folate (intake), RBC total folate (status), and plasma homocysteine (biomarker of metabolism).
The different folate forms that make up total folate can also be measured as markers of exposure.
Unlike in humans, the folate intakes associated with adequacy, deficiency or supplementation in
mice have not been firmly established making it difficult to translate health outcome findings in
mice to the human context. However, it might be possible to establish these relationships using
functional biomarkers such as blood cell counts and RBC micronucleus frequencies, or markers of
supraphysiological exposures such as the appearance of unmetabolized folic acid. A dose-response
study allows us to both identify and validate surrogate biomarkers of folate exposure and to
determine intakes associated with markers of inadequate or supplemental intakes.
The goal of this dose-response mouse study was to identify folate-dependent physiological,
functional and genomic endpoints that could be used as surrogate biomarkers of folate exposure.
Our literature review showed a wide variety of investigations on the various health effects
associated with a wide range of, but inconsistent, folic acid doses; however, no comprehensive
dose-response study has identified doses that are related to adequacy or over-exposure.
Furthermore, the review also demonstrated the use of a large variety of mouse strains and bias in
the use of mouse sex. These inconsistencies make it difficult to interpret the findings from mouse
studies to humans. To address this knowledge gap, in this study, we used both male and female
C57BL/6 and BALB/c mice, two of the most commonly used inbred mouse strains. As such, our

70
study investigated status and functional biomarkers of folate exposure in mice, while taking into
account underlying sex and strain effects.
3.3.Methods
3.3.1. Animal Models and Study design
The mice in this study were cared for in accordance with the Guidelines of the Canadian
Council on Animal Care (CACC) as described in the CACC Guide of the Care and use of
Experimental Animals (104). The study was approved by the Health Canada Ottawa Animal Care
Committee. Both male and female C57BL/6 and BALB/c mice (n = 80 sex/strain), the two most
commonly used inbred mouse strains in folate research (see chapter 2) were purchased from
Charles River Laboratories (Saint Constant, QC) at 3 weeks of age and housed at standard humidity
and temperature with 12-hour light cycles. The specific substrains used was C57BL/6Ncrl and
BALB/c AnNCrl. All the mice had ad libitum access to food and water.
Upon arrival, all mice were fed the 2 mg/kg FA-defined diet based on the AIN-93G formula
(70) for 1 week during the acclimation period to establish a baseline folate status. After the
acclimation period, the mice were fed one of the eight modified AIN-93G diets containing 0, 0.2,
0.5, 1, 2, 5, 20 or 40 mg of FA/kg (Dyets, Inc.; Bethlehem, PA). This range of FA content
encompasses intakes that are reported in the literature (See chapter 2). There was a total of 20 mice
(n = 10 male, n = 10 female) per strain per experimental diet for a total of 320 mice (20 mice x 8
diets x 2 strains). The power calculation used to determine the sample size was based on a previous
experiment for RBC micronucleus assays: Alpha = 0.05, power 0.80, 1-sided, a 35% difference in
means was assumed and a 30% standard deviation. The minimum sample size was determined to
be 5. Because of the number of outcomes to be measured, only half of the full sample would be

71
available for MN analysis, therefore an n = 10 was required. The mice were fed their respective
diets for 12 weeks before necropsy, a duration required to examine the impact of folate on
functional endpoints including micronucleus formation in blood cells (105). The primary dietary
exposure was the dose-response of folic acid. Primary outcomes investigated included the
micronucleus frequency, total plasma folate, unmetabolized folic acid and homocysteine. Other
secondary outcomes investigated included body weights, food consumptions, tissue weights, blood
counts and other folate vitamers.
3.3.2. Necropsy and tissue collection
The body weight and food consumption for each mouse was recorded from week 1 until
necropsy for a total of 12 weeks. Additionally, blood from cheek was sampled every 2 weeks
starting at 4 weeks of age (baseline folate at the time the mice were switched to their experimental
diets) to measure changes in plasma and RBC folate concentration over time. After 12 weeks on
diet, the mice were killed under isoflurane anesthesia by cardiac puncture followed by cervical
dislocation. Tissues collected at necropsy included colon epithelium, liver, kidneys, bone marrow,
brain, spleen. Testes were also collected from male mice. All tissues were collected into 1.5 mL
Eppendorf tubes, flash frozen in liquid nitrogen and stored at -80 ℃ until use.
Whole blood was drawn via cardiac puncture into a heparin coated syringe (5:1 ratio of
blood to heparin). 100 𝜇𝐿 of whole blood was aliquoted for micronucleus analysis, 700 𝜇𝐿 for total
folate, folate vitamers and homocysteine analyses and the remaining 200 𝜇𝐿 was used for complete
blood count (CBC) analysis. All blood samples, except CBC samples, were stored on wet ice (~4
°C) until further processing. The CBC samples were stored at room temperature until analysis. The
700 𝜇𝐿 of whole blood collected was separated by centrifugation (5000 × 𝑔 for 10 minutes at 4
°C) into RBC and plasma within an hour of collection. Plasma was divided for folate vitamer (150

72
𝜇𝐿), homocysteine (120 𝜇𝐿) and total folate (20 𝜇𝐿) analyses. Any extra plasma was added to the
total folate. All blood samples, including the RBC pellets, were aliquoted to 1.5 mL Eppendorf
tubes flash frozen and stored at -80 ℃.
The colon was dissected, the fecal pellets were squeezed out gently before being flushed
with 5 mL of cold phosphate buffered saline (PBS). The colon was then cut opened and laid flat
with the lumen side facing up on a glass plate. The epithelial layer was lightly scraped away from
the underlying colon tissue using two glass sides, collected into 1.5 mL Eppendorf tubes, flash
frozen in liquid nitrogen and stored at -80 ℃ until use.
Bone marrow was collected from the femur. The femur was detached from the hip bone
and the tibia cut below knee joint. The femur and tibia were both scraped clean of muscle tissue
using Kimwipes and the ball joint of the femur was cut off to expose the inside of the bone. The
femur was placed cut-end down inside a 0.5 mL Eppendorf tube in which a small hole was created
using a 18G needle at the bottom of the 0.5 mL Eppendorf tube, that was nested in a larger 1.5 mL
Eppendorf tube. The nested tubes were centrifuged (~ 8000 x g) to collect bone marrow pellets
that were resuspended in 200 𝜇𝐿 of PBS. Finally, the resuspended bone marrow was evenly
distributed into 4 separate 1.5 mL Eppendorf tube (~50 𝜇𝐿 each) and flash frozen.
3.3.3. Plasma total folate analysis
Plasma total folate was measured for all necropsy samples (week 12) and a subset of
samples (n = 5) at each time point (weeks 0, 2, 4, 6, 8 and 10) from each of the 32 (8 diets x 2
strains x 2 sex) experimental groups using the Lactobacillus casei (L. casei) microbiological assay
as described by Molloy et al. (106). New L. casei (Lactobacillus rhamnosus from ATCC 7469)
stock was first made in an 80% glycerol and stored in 1 mL cryogenic vials at -80 ℃ until use.
73
Fresh media was prepared according to the manufacturer’s instructions (BD Difco Folic Acid
Casei Medium 282210, lot# 0000434386) weekly and stored in the fridge for up to 5 days, wrapped
in foil. The mouse plasma was diluted with 0.5 (w/v) sodium ascorbate (Sigma A-7631) for
analysis. A plasma dilution of 30x was used for mice fed a 0-5 mg/kg FA diet while a 100x dilution
was used for mice fed a 20-40 mg/kg FA diet. The folic acid standards (2, 5, 10, 25, 50, 75, 100
fmol/ul) used for our standard curve were prepared using serial dilution from a folic acid stock of
98.54 ug/ml. Plated samples were incubated overnight in a CO2 incubator at 37 ℃ for ~ 16 hours.
Absorbances were read using at a single wavelength of 550 nm. The L. casei bacteria used for this
assay is dependent on folate for growth, therefore its growth can be correlated to the total folate
content in the sample. The plasma total folate represents recent folate intakes (107), providing a
biomarker for recent folate intake.
3.3.4. Plasma folate vitamer analysis
Folate vitamers analysis was performed by the Ontario Region Food Laboratories Division,
Health Canada. The 6 folates vitamers analyzed included: unmetabolized FA (UMFA), 5-
methyltetrahydrofolate (5-methylTHF), 5-formyltetrahydrofolate (5-FormylTHF),
Tetrahydrofolate (THF), 5,10-methenyltetrahydrofolate (5,10-methenylTHF), and MeFox (an
oxidation product of 5-methylTHF). Folate vitamers were analyzed by liquid chromatography-
tandem mass spectrometry (LC-MS/MS) (108) using a Waters Xevo TQ-XS Mass Spectrometry
coupled to the Waters Acquity UPLC system (Waters Limited, Mississauga ON). Plasma samples
collected at necropsy were thawed and spiked with one of six internal standard mixtures followed
by the addition of extraction buffer (at pH 5) and an incubation period of 4°C for 30 min. Sample
extraction and cleanup was then performed by solid phase extraction (SPE) using a sodium acetate

74
elution buffer. The final extracts were then filtered through 0.2 𝜇m syringe filter prior to LC-
MS/MS analysis. Folate peaks were separated by a UPLC gradient mobile phase and detected by
MS/MS in MRM mode. Quantitation was performed using external calibration standards based on
the peak area ratio using internal standard. For quality control purposes, the samples were run with
a calibration standard solution (~1 nmol/L FA) prepared on the same day. Quality control metrics
for analysis was determined by percentage recovery and both intra and inter-assay coefficient
variations. Folate vitamer concentrations that were below the limit of detection (LOD) were
assigned a value of LOD/2 for analyses. Data collection and reduction was achieved using the
TargetLynx XS software (MassLynx, V4.2). The sum of folate forms except MeFOX was reported
as total folate. Combined non-methyl folates represented the sum of 5-formyl THF, THF and 5,10-
methenylTHF.
3.3.5. Homocysteine analysis
The Advia Centaur XP (Siemens Healthcare Ltd) was used to perform homocysteine
analysis. Plasma homocysteine was measured by the Nutrition Research Canadian Health
Measures Survey Reference Laboratory following the manufacturer’s instructions. All policies,
procedures and processes conducted in the laboratory aligned with licensing and accreditation
standards of clinical laboratories in Canada and the recommendations of the Institute for Quality
Management in Healthcare (iQMH). The assay was verified prior to sample analysis using third
party quality control materials (BioRad).

75
3.3.6. CBC analysis
The Sysmex® XT-2000i hematology analyzer (Sysmex Corporation, Kobe Japan) was used
to analyse white blood cells and reticulocytes using fluorescent flow cytometry. Red blood cells
and platelet counts were analyzed by the RBC detector using the Hydrodynamic Focusing method
while hemoglobin was analyzed by the hemoglobin (HGB) detector based on a cyanide-free
Sulfolyser hemoglobin detection method (109)(110). A total of 33 analytical parameters were
assessed. White blood cell counts included: Total white blood cells (WBC), lymphocytes
(LYMPH), monocytes (MONO), eosinophils (EO), basophils (BASO) and neutrophils (NEUT).
Red blood cell counts included: red blood cells (RBC), reticulocytes (RET), HGB, mean
corpuscular volume (MCV), mean corpuscular hemoglobin (MCH), mean corpuscular hemoglobin
concentration (MCHC), red cell distribution width with standard deviation (RDW-SD) and
Immature Reticulocyte Fraction (IRF). Platelet counts included: platelets (PLT), mean platelet
volume (MPV), platelet distribution width (PDW) and platelet large cell ratio (P-LCR).
3.3.7. Micronucleus analysis
The In Vivo MicroFlow® assay was used to measure micronucleated cells in whole blood.
The whole blood was collected in a 1.5 mL Eppendorf tubes containing 350 𝜇𝐿 of anticoagulant
solution provided by Litron Laboratories (Rochester, NY). The whole blood-anticoagulant
mixtures were stored at room temperature until fixation, stored at -80 ℃ for 48 hours before
washing in and storing in long-term storage solution (LTSS; glycerol 5-10%) as per instructions
provided in the In Vivo MicroFlow® kit (Litron Laboratories, Rochester NY). Samples stored in
LTSS were sent to Litron Laboratories for analysis.
The In Vivo MicroFlow® assay uses a differential staining technique to measure the
frequency of micronucleated cells in reticulocyte (RET) and mature normochromatic erythrocyte

76
(NCE) cell populations by flow cytometry. The micronucleus (MN) is a small secondary nucleus
that can form spontaneously due to chromosomal damage or breakage (111). The MN develops in
the cytoplasm outside the main nucleus (111). Its presence is most evident in RBCs which
otherwise do not have a nucleus. The assay uses a propidium iodide DNA stain to identify the
presence of micronuclei in cells from which MN frequency can be determined. The frequencies of
micronucleated reticulocytes (MN-RET) and erythrocytes (MN-NCE) are indicators of
chromosomal damage. To differentiate between RET and NCE cell populations, the assay uses an
antibody against the cluster of differentiation 71 (CD71) transferrin receptors – surface proteins
present on immature erythrocytes (RETs) but not on mature erythrocytes (NCE). The frequency
of MN-RET and MN-NCE compared to RET and NCE without MN was determined by the
presence of stained DNA in the cells by flow cytometry.
3.3.8. Statistical analysis
All statistical analyses were performed using SigmaPlot for Windows, version 13.0 (Systat
Software, Inc.). For variables with repeated measures over time (i.e., body weight, food
consumption and plasma total folates), main effects of diet, sex and strain were identified using a
Two-Way Repeated Measure ANOVA. In cases where main effects of sex and strain were
identified, the effect of diet over time was additionally assessed using a Two-Way Repeated
Measure ANOVA within each strain/sex group (e.g., BALB/c females). For variables with a single
endpoint measured at necropsy (i.e., Total body weight gained, homocysteine, folate vitamers,
CBC, micronucleus, and tissue weight) a Three-Way ANOVA was used to identify main effects
of diet, sex and strain. When a main effect of sex and strain were identified, a One-Way ANOVA
analysis was used to identify differences among the diets within each strain/sex group. Differences
in means were considered significant when P ≤ 0.05.
77
3.4.Results
3.4.1. Body weights
The overall body weight gained by the mice differed significantly by sex (p = <0.001),
strain (p = <0.001) and diet (p = 0.009) (Figure 12). As expected, female mice gained 65.0 % less
body weight than male mice. BALB/c mice gained 32.7% less body weight than C57BL/6 mice.
Even though significant diet differences were observed across strains and sexes, the total body
weight gained within each sex/strain group showed no significant differences.
Similarly, when examining body weight gained over the course of the intervention period
(Figure 13), the weight gained by the mice differed significantly by sex (p = < 0.001) and strain
(p = < 0.001) but not by diet. Female mice gained weight at a slower rate than male mice every
week (p = < 0.001). C57BL/6 mice gained weight significantly faster than BALB/c mice
throughout the course of the intervention. Overall, no significant diet effect was observed within
each sex/strain group. However, some inconsistent significant differences were identified among
diets in BALB/c females and C57BL/6 females. Among BALB/c females, significant diet
differences were observed at week 3 between the 40 mg/kg diet and the 0 mg/kg (p = 0.002), 0.2
mg/kg (p = 0.035), 1 mg/kg (p = 0.005), 2 mg/kg (p = < 0.001), 5 mg/kg (p = 0.012) and the 20
mg/kg (p = 0.011) diets. Among C57BL/6 females, the mean body weight of mice fed the 0.2
mg/kg diet was significantly more than mice fed 0 mg/kg at week 9 (p = 0.020) and week 12 (p =
0.013), mice fed 0.5 mg/kg at week 12 (p = 0.031), mice fed 1 mg/kg at week 12 (p = 0.045) and
mice fed 40 mg/kg at week 5 (p = 0.003) and 12 (p = 0.033).

78
Figure 12: Total body weight gained by mice fed different folic acid diets over the duration
of the study period. Differences in means among strain, sex and diets on total body weight gain
were assessed by Three-Way ANOVA and Holm-Sidak post-hoc analysis. Differences in means
among diet groups within each sex/strain group were assessed by One-Way ANOVA and Kruskal-
Wallis post-hoc analysis. Sex/strain groups with different letters (A, B, C, D) are significant ly
different. Data are presented as mean ± SEM. Differences were considered significant if p ≤ 0.05
(n = 10/group).
0
2
4
6
8
10
12
14
16
18
20
BALB/C Female BALB/C Male C57BL/6 Female C57BL/6 Male
Wei
gh
t G
ain
ed (
g)
Sex and Strain Group
0 mg/kg 0.2 mg/kg
0.5 mg/kg 1 mg/kg
2 mg/kg 5 mg/kg
20 mg/kg 40 mg/kg
Strain Effect P value = < 0.001
Sex Effect P value = < 0.001
Diet Effect P value = 0.009
A
B
C
D

79
Figure 13: Body weights of male and female BALB/c and C57BL/6 mice fed different folic acid diets over time . Differences in the means among diet groups within each sex/strain group over time was assessed by a Two-Way Repeated Measures ANOVA and Holm-Sidak post-hoc analysis. A) Weight gained by BALB/c females B) Weight gained by BALB/c males C) Weight gained by C57BL/6 females D) Weight gained by C57BL/6 males. Data are presented as mean ± SEM. Differences were considered significant if p ≤ 0.05
(n = 10/group).
13
16
19
22
25
28
31
34
37
0 1 2 3 4 5 6 7 8 9 10 11 12
Bo
dy w
eigh
t (g
)
Weeks on Diets
A. BALB/C Females
13
16
19
22
25
28
31
34
37
0 1 2 3 4 5 6 7 8 9 10 11 12
Bo
dy w
eigh
t (g
)
Weeks on Diets
B. BALB/C Males
13
16
19
22
25
28
31
34
37
0 1 2 3 4 5 6 7 8 9 10 11 12
Bod
y w
eig
ht
(g)
Weeks on Diets
C. C57BL/6 Females
13
16
19
22
25
28
31
34
37
0 1 2 3 4 5 6 7 8 9 10 11 12B
od
y w
eig
ht
(g)
Weeks on Diets
D. C57BL/6 Males

80
3.4.2. Food consumption
The total food consumed by the mice differed significantly by sex (p = <0.001), strain (p
= <0.001) and diet (p = <0.001). Female mice ate 13% less than male mice. BALB/c mice
consumed 12% less food than C57BL/6 mice. Significant diet effects were also observed within
each sex/strain group (p = <0.001 in BALB/c females; p = 0.019 in BALB/c males; p = < 0.001 in
C57BL/6 females; p = 0.014 in C57BL/6 males) but the differences among the diets was
inconsistent.
When examining the daily food consumption over the course of the intervention (Figure
14), similar trends were observed with significant differences in sex (p = < 0.001), strain (p =
<0.001) but not diet, as assessed by Three-way ANOVA. Generally speaking, in BALB/c females
(p = 0.004) consumed the least amount of food, followed by C57BL/6 females (p = <0.001),
BALB/c males (p = 0.037) and finally C57BL/6 males (p = 0.005). While we did not observe a
main effect of diet overall, within each sex/strain group a diet effect was observed but differences
among the diets on any given week were inconsistent.
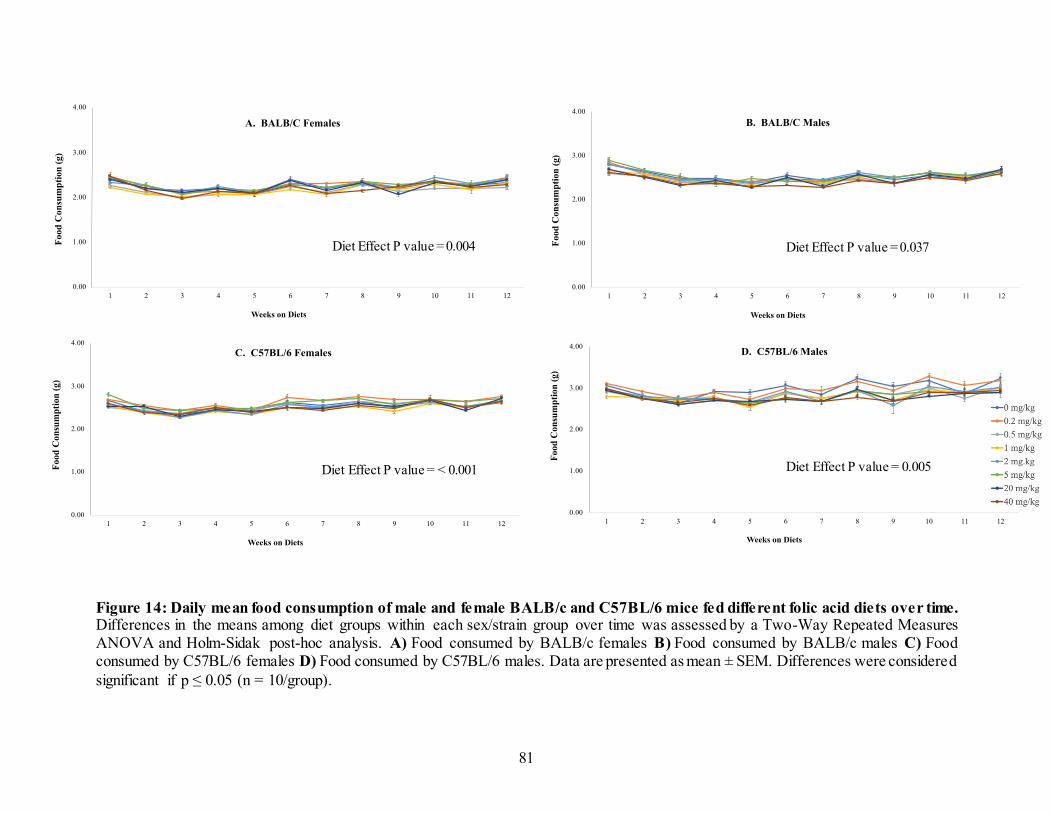
81
Figure 14: Daily mean food consumption of male and female BALB/c and C57BL/6 mice fed different folic acid diets over time. Differences in the means among diet groups within each sex/strain group over time was assessed by a Two-Way Repeated Measures ANOVA and Holm-Sidak post-hoc analysis. A) Food consumed by BALB/c females B) Food consumed by BALB/c males C) Food consumed by C57BL/6 females D) Food consumed by C57BL/6 males. Data are presented as mean ± SEM. Differences were considered
significant if p ≤ 0.05 (n = 10/group).
0.00
1.00
2.00
3.00
4.00
1 2 3 4 5 6 7 8 9 10 11 12
Food
Con
sum
pti
on
(g)
Weeks on Diets
A. BALB/C Females
0.00
1.00
2.00
3.00
4.00
1 2 3 4 5 6 7 8 9 10 11 12
Food
Co
nsu
mp
tio
n (
g)
Weeks on Diets
B. BALB/C Males
0.00
1.00
2.00
3.00
4.00
1 2 3 4 5 6 7 8 9 10 11 12
Fo
od
Con
sum
pti
on
(g
)
Weeks on Diets
C. C57BL/6 Females
0.00
1.00
2.00
3.00
4.00
1 2 3 4 5 6 7 8 9 10 11 12
Food
Con
sum
pti
on
(g
)
Weeks on Diets
D. C57BL/6 Males
Diet Effect P value = < 0.001
Diet Effect P value = 0.004 Diet Effect P value = 0.037
Diet Effect P value = 0.005

82
3.4.3. Tissue weights
A strain effect was observed for liver (p = <0.001) and brain (p = <0.011) weights but not
the testes, kidney and spleen weights. Liver tissues weighed 19% more in C57BL/6 mice compared
to BALB/c mice while brain tissues weighed 1% more in C57BL/6 mice. A sex effect was also
observed for liver (p = <0.001), kidney (p = <0.001) and brain (p = <0.001) weights but not for
the testes and spleen. The male mice had heavier liver (39%) and kidney (47%) tissues while
female mice had heavier brain (1%) and spleen (1%) tissues. No diet effects were identified for
any tissue weights. No significant diet differences were identified within sex/strain groups (Table
3).
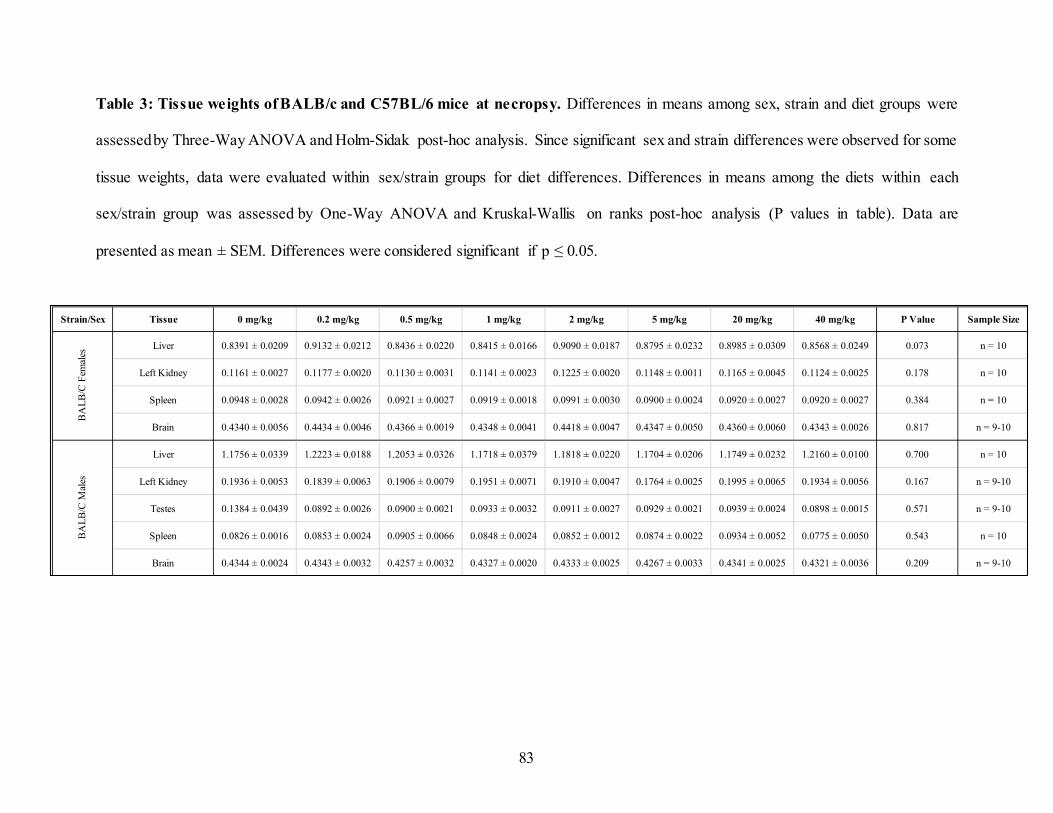
83
Table 3: Tissue weights of BALB/c and C57BL/6 mice at necropsy. Differences in means among sex, strain and diet groups were
assessed by Three-Way ANOVA and Holm-Sidak post-hoc analysis. Since significant sex and strain differences were observed for some
tissue weights, data were evaluated within sex/strain groups for diet differences. Differences in means among the diets within each
sex/strain group was assessed by One-Way ANOVA and Kruskal-Wallis on ranks post-hoc analysis (P values in table). Data are
presented as mean ± SEM. Differences were considered significant if p ≤ 0.05.
Strain/Sex Tissue 0 mg/kg 0.2 mg/kg 0.5 mg/kg 1 mg/kg 2 mg/kg 5 mg/kg 20 mg/kg 40 mg/kg P Value Sample Size
Liver 0.8391 ± 0.0209 0.9132 ± 0.0212 0.8436 ± 0.0220 0.8415 ± 0.0166 0.9090 ± 0.0187 0.8795 ± 0.0232 0.8985 ± 0.0309 0.8568 ± 0.0249 0.073 n = 10
Left Kidney 0.1161 ± 0.0027 0.1177 ± 0.0020 0.1130 ± 0.0031 0.1141 ± 0.0023 0.1225 ± 0.0020 0.1148 ± 0.0011 0.1165 ± 0.0045 0.1124 ± 0.0025 0.178 n = 10
Spleen 0.0948 ± 0.0028 0.0942 ± 0.0026 0.0921 ± 0.0027 0.0919 ± 0.0018 0.0991 ± 0.0030 0.0900 ± 0.0024 0.0920 ± 0.0027 0.0920 ± 0.0027 0.384 n = 10
Brain 0.4340 ± 0.0056 0.4434 ± 0.0046 0.4366 ± 0.0019 0.4348 ± 0.0041 0.4418 ± 0.0047 0.4347 ± 0.0050 0.4360 ± 0.0060 0.4343 ± 0.0026 0.817 n = 9-10
Liver 1.1756 ± 0.0339 1.2223 ± 0.0188 1.2053 ± 0.0326 1.1718 ± 0.0379 1.1818 ± 0.0220 1.1704 ± 0.0206 1.1749 ± 0.0232 1.2160 ± 0.0100 0.700 n = 10
Left Kidney 0.1936 ± 0.0053 0.1839 ± 0.0063 0.1906 ± 0.0079 0.1951 ± 0.0071 0.1910 ± 0.0047 0.1764 ± 0.0025 0.1995 ± 0.0065 0.1934 ± 0.0056 0.167 n = 9-10
Testes 0.1384 ± 0.0439 0.0892 ± 0.0026 0.0900 ± 0.0021 0.0933 ± 0.0032 0.0911 ± 0.0027 0.0929 ± 0.0021 0.0939 ± 0.0024 0.0898 ± 0.0015 0.571 n = 9-10
Spleen 0.0826 ± 0.0016 0.0853 ± 0.0024 0.0905 ± 0.0066 0.0848 ± 0.0024 0.0852 ± 0.0012 0.0874 ± 0.0022 0.0934 ± 0.0052 0.0775 ± 0.0050 0.543 n = 10
Brain 0.4344 ± 0.0024 0.4343 ± 0.0032 0.4257 ± 0.0032 0.4327 ± 0.0020 0.4333 ± 0.0025 0.4267 ± 0.0033 0.4341 ± 0.0025 0.4321 ± 0.0036 0.209 n = 9-10
BA
LB
/C M
ales
BA
LB
/C F
emal
es
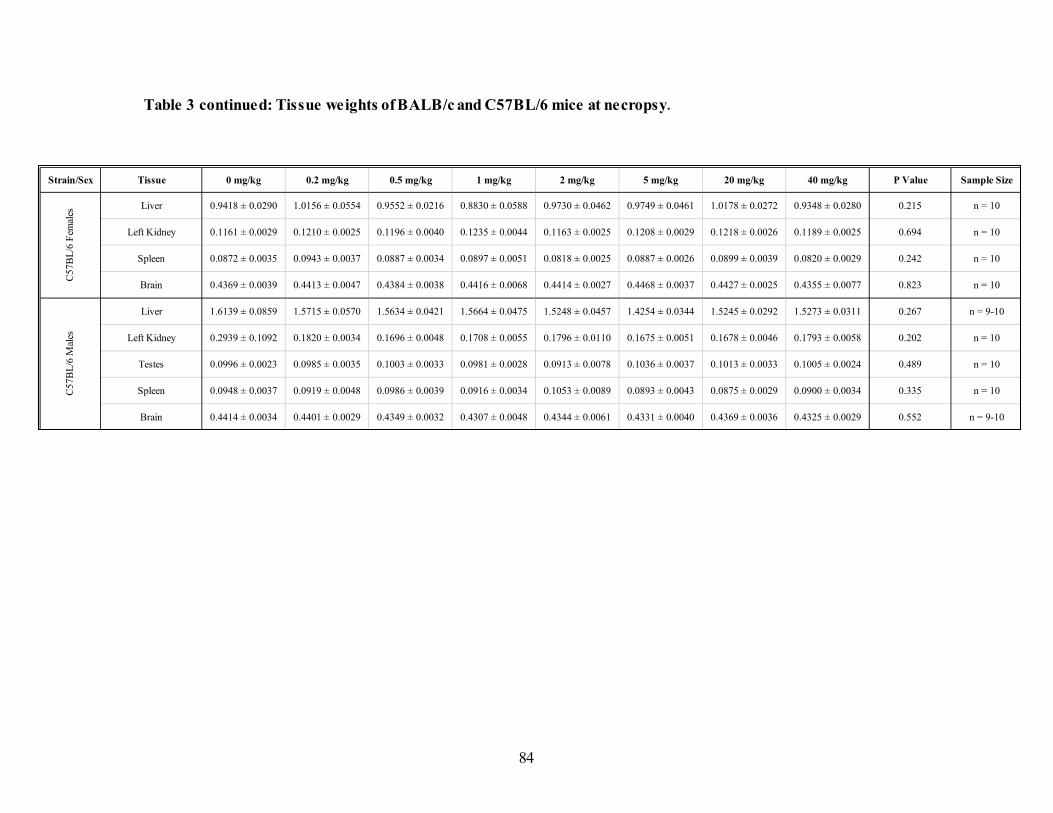
84
Table 3 continued: Tissue weights of BALB/c and C57BL/6 mice at necropsy.
Strain/Sex Tissue 0 mg/kg 0.2 mg/kg 0.5 mg/kg 1 mg/kg 2 mg/kg 5 mg/kg 20 mg/kg 40 mg/kg P Value Sample Size
Liver 0.9418 ± 0.0290 1.0156 ± 0.0554 0.9552 ± 0.0216 0.8830 ± 0.0588 0.9730 ± 0.0462 0.9749 ± 0.0461 1.0178 ± 0.0272 0.9348 ± 0.0280 0.215 n = 10
Left Kidney 0.1161 ± 0.0029 0.1210 ± 0.0025 0.1196 ± 0.0040 0.1235 ± 0.0044 0.1163 ± 0.0025 0.1208 ± 0.0029 0.1218 ± 0.0026 0.1189 ± 0.0025 0.694 n = 10
Spleen 0.0872 ± 0.0035 0.0943 ± 0.0037 0.0887 ± 0.0034 0.0897 ± 0.0051 0.0818 ± 0.0025 0.0887 ± 0.0026 0.0899 ± 0.0039 0.0820 ± 0.0029 0.242 n = 10
Brain 0.4369 ± 0.0039 0.4413 ± 0.0047 0.4384 ± 0.0038 0.4416 ± 0.0068 0.4414 ± 0.0027 0.4468 ± 0.0037 0.4427 ± 0.0025 0.4355 ± 0.0077 0.823 n = 10
Liver 1.6139 ± 0.0859 1.5715 ± 0.0570 1.5634 ± 0.0421 1.5664 ± 0.0475 1.5248 ± 0.0457 1.4254 ± 0.0344 1.5245 ± 0.0292 1.5273 ± 0.0311 0.267 n = 9-10
Left Kidney 0.2939 ± 0.1092 0.1820 ± 0.0034 0.1696 ± 0.0048 0.1708 ± 0.0055 0.1796 ± 0.0110 0.1675 ± 0.0051 0.1678 ± 0.0046 0.1793 ± 0.0058 0.202 n = 10
Testes 0.0996 ± 0.0023 0.0985 ± 0.0035 0.1003 ± 0.0033 0.0981 ± 0.0028 0.0913 ± 0.0078 0.1036 ± 0.0037 0.1013 ± 0.0033 0.1005 ± 0.0024 0.489 n = 10
Spleen 0.0948 ± 0.0037 0.0919 ± 0.0048 0.0986 ± 0.0039 0.0916 ± 0.0034 0.1053 ± 0.0089 0.0893 ± 0.0043 0.0875 ± 0.0029 0.0900 ± 0.0034 0.335 n = 10
Brain 0.4414 ± 0.0034 0.4401 ± 0.0029 0.4349 ± 0.0032 0.4307 ± 0.0048 0.4344 ± 0.0061 0.4331 ± 0.0040 0.4369 ± 0.0036 0.4325 ± 0.0029 0.552 n = 9-10
C57
BL
/6 F
emal
esC
57
BL
/6 M
ales

85
3.4.4. Folate status
3.4.4.1. Plasma total folate
Over time, there were no significant sex or strain differences observed for plasma total
folate concentrations over the course of the intervention period (Figure 15). The plasma total folate
concentrations only differed significantly by sex and strain when comparing week 2 and 6.
However, the plasma total folate in the mice differed significantly by diet (p = < 0.001). The plasma
total folate concentrations differed significantly among all diet groups except when comparing the
2 mg/kg diet versus the 1 mg/kg diet, and 0.2 mg/kg diet versus the 0 mg/kg diet. As expected,
higher folic acid content in the diet correlated with higher plasma total folate concentrations.

86
Figure 15: Plasma total folate of male and female BALB/c and C57BL/6 mice fed different folic acid diets over time. Differences
in the means among diet groups within each sex/strain group over time was assessed by a Two-Way Repeated Measures ANOVA and
Holm-Sidak post-hoc analysis. Plasma total folate of BALB/c females (A), BALB/c males (B), C57BL/6 females (E) and C57BL/6
males (F). Time taken for plasma folate changes to reach hemostasis in BALB/c females (C), BALB/c males (D), C57BL/6 females (G)
and C57BL/6 males (H). Diets with similar letters (A, B, C, D) are not significantly different. Data are presented as mean ± SEM.
Differences were considered significant if p ≤ 0.05 (n = 5).

87
Figure 15 continued: Plasma total folate of male and female BALB/c and C57BL/6 mice fed different folic acid diets over time.

88
3.4.4.1. Folate vitamers
An analysis of the folate vitamers showed a significant strain effect for total folate (p = <
0.001), UMFA (p = < 0.001), 5-methylTHF (p = < 0.001) but not for combined nonmethyl folates
(i.e., 5,10-methenylTHF, 5-formylTHF, THF) and MeFOX. C57BL/6 mice had higher total folate
(48%), UMFA (74%), 5-methylTHF (123%) than BALB/c mice.
There were significant sex effects for all folate vitamers except for MeFOX. Male mice
had higher total folate (p = < 0.001; 51%), UMFA (p = < 0.001; 86%), 5-methylTHF (p = < 0.001;
12%) and combined nonmethyl folates (p = < 0.001; 37%) than female mice.
All folate vitamer concentrations in the mice at necropsy differed significantly by diet (p =
< 0.001). A further examination of the diet effect within each sex/strain group showed similar
significant diet effects (Table 4). Exceptions included an insignificant diet effect for MeFOX in
BALB/c female and C57BL/6 male mice.
Benchmark dose modeling (BMD) showed that UMFA concentrations increased at a
benchmark dose response (BMDR) diets ≥ 1.87 mg FA/kg, 1.03 mg FA/kg, 1.02 mg FA/kg, 1.00
mg FA/kg for BALB/c male, BALB/c female, C57BL/6 female and C57BL/6 male mice
respectively. This respectively corresponded to UMFA concentrations of 7.71 nmol/L, 11.53
nmol/L, 20.75 nmol/L and 18.43 nmol/L (Figure 16).

89
Table 4: Folate vitamers of BALB/c and C57BL/6 mice measured at necropsy. Differences in means among sex, strain and diet
groups were assessed by Three-Way ANOVA and Holm-Sidak post-hoc analysis. Since significant sex and strain differences were
observed for some folate vitamers, data was also evaluated within sex/strain groups for diet differences. Differences in means among
the diets within each sex/strain group was assessed by One-Way ANOVA and Dunn’s method on ranks post-hoc analysis. Data are
presented as mean ± SEM. Differences were considered significant if p ≤ 0.05. Values within a row that share a letter do not differ.
Combined nonmethyl folates includes 5,10-methenylTHF, 5-formylTHF and THF.
Strain/Sex Folate Vitamers (nmol/L) 0 mg/kg 0.2 mg/kg 0.5 mg/kg 1 mg/kg 2 mg/kg 5 mg/kg 20 mg/kg 40 mg/kg P Value Sample size
Total Folate B 20.11 ± 1.76
B,E 21.99 ± 2.30
B,D 33.86 ± 2.08
B,C 51.60 ± 2.90
* A,C,D,E 65.02 ± 4.95
A,C,D 82.92 ± 2.67
A,C 187.39 ± 23.32
* A 303.37 ± 86.20 < 0.001 n = 9-10
Combined Nonmethyl Folates B 2.60 ± 0.45
B 2.65 ± 0.45
B,D 3.99 ± 0.48
B,C 6.91 ± 0.77
* B,C 6.89 ± 0.64
A,C,D 10.53 ± 0.81
A,C 23.61 ± 3.11
* A 50.57 ± 4.43 < 0.001 n = 9-10
UMFA B,C 2.30 ± 0.34
B,C 2.15 ± 0.35
B,C 2.76 ± 0.25
B,C 3.44 ± 0.53
* B,C 4.62 ± 1.10
A,C 12.51 ± 3.21
A 96.62 ± 27.38
* A 168.78 ± 84.06 < 0.001 n = 9-10
5-MethylTHF B 15.42 ± 1.51
B17.44 ± 1.76
B,C,D 27.47 ± 1.75
B,C,D 42.03 ± 2.89
* A,D 54.19 ± 5.60
A,C 60.99 ± 4.00
A,B 69.50 ± 6.43
* A 89.48 ± 2.86 < 0.001 n = 9-10
MeFOX 0.45 ± 0.15 0.32 ± 0.11 0.57 ± 0.15 0.41 ± 0.11* 0.36 ± 0.06 0.47 ± 0.04 0.46 ± 0.06
* 0.46 ± 0.05 0.534 n = 9-10
Total Folate B 8.06 ± 0.64
B,D 10.67 ± 0.90
* B,C 17.43 ± 1.08
B,C 33.08 ± 1.71
A,C,D 51.48 ± 2.02
A,C 81.33 ± 7.19
A,C 211.40 ± 22.61
A 519.55 ± 73.64 < 0.001 n = 9-10
Combined Nonmethyl Folates B 1.59 ± 0.35
B,D 2.24 ± 0.45
* B,D 2.57 ± 0.45
B,C 5.44 ± 0.72
A,C,D 8.13 ± 0.69
A,C 15.62 ± 1.21
A,C 38.83 ± 2.54
A 77.92 ± 7.32 < 0.001 n = 9-10
UMFA B 1.28 ± 0.21
B 1.44 ± 0.24
* B 1.60 ± 0.19
B,C 4.18 ± 0.65
B,C 4.95 ± 0.69
A,C 24.53 ± 6.27
A,C 109.39 ± 19.84
A 446.98 ± 72.00 < 0.001 n = 9-10
5-MethylTHF B 5.35 ± 0.41
B 7.24 ± 0.44
* B,D 13.54 ± 1.02
B,C 24.04 ± 1.46
A,C,D 39.21 ± 1.55
A,C,D 42.72 ± 1.32
A,C 67.19 ± 1.86
A 103.06 ± 7.36 < 0.001 n = 9-10
MeFOX B,D 0.18 ± 0.05
B,C,D 0.23 ± 0.04
* A,D 0.27 ± 0.07
A,C 0.46 ± 0.02
A 0.53 ± 0.05
A 0.53 ± 0.05
A 0.59 ± 0.10
A 0.63 ± 0.09 < 0.001 n = 9-10
BA
LB
/C M
ales
BA
LB
/C F
emal
es

90
Table 4 Continued: Folate vitamers of BALB/c and C57BL/6 mice measured at necropsy.
Strain/Sex Folate Vitamers (nmol/L) 0 mg/kg 0.2 mg/kg 0.5 mg/kg 1 mg/kg 2 mg/kg 5 mg/kg 20 mg/kg 40 mg/kg P Value Sample size
Total Folate B 20.12 ± 1.51
B,E 28.02 ± 2.78
B,D 42.00 ± 1.36
B,C 50.61 ± 2.44
A,C,D,E 63.29 ± 4.66
A,C,D 90.02 ± 5.90
A,C 314.22 ± 123.78
A 393.69 ± 64.76 < 0.001 n = 9-10
Combined Nonmethyl Folates B 2.41 ± 0.17
B 2.57 ± 0.21
B,D 4.20 ± 0.28
B,C 5.53 ± 0.70
B,C 5.65 ± 0.54
A,C,D 11.15 ± 1.02
A,C 29.99 ± 4.19
A 50.41 ± 6.32 < 0.001 n = 9-10
UMFA B 2.59 ± 0.36
B 2.56 ± 0.24
B 3.43 ± 0.30
B,C 4.93 ± 0.63
A,B 5.87 ± 0.83
A,C 17.43 ± 7.48
A,C 217.20 ± 122.08
A 257.87 ± 61.97 < 0.001 n = 9-10
5-MethylTHF B 15.28 ± 1.33
C 23.12 ± 2.64
D 34.72 ± 1.28
E,B 40.69 ± 2.37
A,C 52.37 ± 5.03
A,D 62.65 ± 5.17
A,E 71.13 ± 3.99
A 91.38 ± 4.18 < 0.001 n = 9-10
MeFOX B,C 0.22 ± 0.05
B,C 0.24 ± 0.05
C 0.31 ± 0.06
C 0.36 ± 0.05
A 0.49 ± 0.04
C 0.42 ± 0.05
C 0.44 ± 0.04
C 0.44 ± 0.05 0.001 n = 9-10
Total Folate B 12.14 ± 1.26
B,E 14.31 ± 0.60
B,D 30.18 ± 2.05
B,C 46.52 ± 1.39
A,C,D,E 66.18 ± 3.24
A,C,D 107.97 ± 9.48
A,C 460.05 ± 69.88
A 1206.90 ± 242.16 < 0.001 n = 9-10
Combined Nonmethyl Folates B 2.14 ± 0.21
B,C 2.02 ± 0.17
B,C,D 3.67 ± 0.34
B,C,D,E 6.39 ± 0.42
A,B,C,D,E 7.86 ± 0.80
A,D,E 15.79 ± 1.49
A,E 46.86 ± 6.27
A 83.90 ± 9.40 < 0.001 n = 9-10
UMFA B 2.15 ± 0.25
B,C 2.04 ± 0.35
B,C,D 3.62 ± 0.46
B,C,D,E 6.08 ± 0.87
A,B,C,E 10.63 ± 1.71
A,D,E 40.51 ± 9.13
A,E 339.15 ± 66.04
A 1013.44 ± 233.05 < 0.001 n = 9-10
5-MethylTHF B 8.03 ± 1.01
B,C 10.45 ± 0.43
B,C,D 23.24 ± 1.65
B,C,D,E 34.81 ± 1.19
A,D,E 48.65 ± 2.78
A,D,E 53.50 ± 2.18
A,E 79.88 ± 3.48
A 119.87 ± 4.69 < 0.001 n = 9-10
MeFOX 0.25 ± 0.05 0.32 ± 0.03 0.31 ± 0.04 0.35 ± 0.12 0.61 ± 0.18 0.31 ± 0.11 0.53 ± 0.14 0.52 ± 0.12 0.668 n = 9-10
C57
BL
/6 F
emal
esC
57B
L/6
Mal
es

91
Figure 16: Benchmark Dose (BMD) response modeling of unmetabolized folic acid (UMFA) concentrations in mice fed different
folic acid diets measured at necropsy (n = 5). BMD approach was applied as a continuous response of UMFA with increasing folic
acid content in diets. The Hill function model was fitted to the mean responses to determine folic acid content in diets upon which Hcy
concentrations are elevated.
A. BALB/c Females B. BALB/c Males C. C57BL/6 Females D. C57BL/6 Males

92
3.4.5. Functional and genomic instability
3.4.5.1. Homocysteine
Homocysteine concentrations in mice differed significantly by sex (p = <0.001), strain (p
= <0.001) and diet (p = < 0.001) (Figure 17). C57BL/6 mice had 27% higher homocysteine
concentrations than BALB/c mice. Female mice also had 24% higher homocysteine concentration
than male mice. As expected, the homocysteine concentrations were lower as the folic acid content
in the diets increased.
When examining the homocysteine concentrations within the sex/strain groups, only
BALB/c male mice showed significant diet differences (p = < 0.001). The significant difference
in mean was observed when comparing the 0 mg/kg diet to all other diets (p = 0.010 when
compared to 0.2 mg/kg; p = 0.003 when compared to 0.5 mg/kg; p = < 0.001 when compared to 1
mg/kg; p = < 0.001 when compared to 2 mg/kg; p = < 0.001 when compared to 5 mg/kg; p = <
0.001 when compared to 20 mg/kg and p = < 0.001 when compared to the 40 mg/kg diet).
BMD modeling showed that Hcy concentrations were higher in mice fed diets containing
≤ 0.95 mg FA/kg (3.88 umol Hcy/L) for BALB/c female mice and ≤ 0.53 mg FA/kg (4.01 umol
Hcy/L) for BALB/c male mice. BMDR could not be determined for C57BL/6 mice. BMD analysis
further showed that female mice had higher Hcy threshold/baseline concentrations than male mice
(Figure 18).

93
Figure 17 : Homocysteine concentrations in mice fed different folic acid diets measured at necropsy. Differences in means among
strain, sex and diets on homocysteine concentrations were assessed by Three-Way ANOVA and Holm-Sidak post-hoc analysis.
Differences in means among diet groups within each sex/strain group were assessed by One-Way ANOVA and Kruskal-Wallis post-
hoc analysis. Sex/strain groups with different letters (A, B, C, D) are significantly different. Data are presented as mean ± SEM.
Differences were considered significant if p ≤ 0. 05 (n = 5).
0
1
2
3
4
5
6
7
8
9
10
BALB/C Female BALB/C Male C57BL/6 Female C57BL/6 Male
Hom
ocy
stei
ne
Sex and Strain Group
A B C D
Strain Effect P value = < 0.001
Sex Effect P value = < 0.001
Diet Effect P value = < 0.001

94
Figure 18: Benchmark Dose (BMD) modeling of homocysteine concentrations in mice fed different folic acid diets measured at
necropsy. BMD approach was applied as a continuous response of Hcy with increasing folic acid content in diets. The Hill function
model was used to fit the Hcy response to folic acid content in diets. FA content in diets were transformed for analysis (n = 5).

95
3.4.5.2. CBC analysis
White blood cell counts. Significant strain differences were observed for WBC (p = <
0.001), LYMPH (p = < 0.001), MONO (p = < 0.001), EO (p = < 0.037), BASO (p = < 0.001) cell
counts. C57BL/6 mice had higher WBC (5%), LYMPH (21%), MONO (60%), EO (14%) and
BASO (136%) counts than BALB/c mice.
Significant sex differences were also observed for LYMPH (p = < 0.001), MONO (p =
0.007), BASO (p = 0.003) and NEUT (p = < 0.001) cell counts. Male mice had higher MONO
(37%) and EO (72%) counts than female mice. On the other hand, female mice had a higher
LYMPH (20%) and BASO (79%) cell counts.
No main diet effect was observed in the white blood cell counts. Further analysis of the
diet effect within a sex/strain groups showed a significant difference among diets of LYMPH (p =
0.034) count in BALB/c female mice, which were lower in mice fed 5 mg/kg diet compared to the
0 mg/kg diet. A diet effect was also observed of BASO (p = 0.049) cell counts in BALB/c females
and WBC (p = 0.034) in C57BL/6 males but post hoc analysis could not identify groups that
differed (Table 5).
Red blood cell counts. A significant strain effect for all red blood cell counts, except for
%RET, was identified. C57BL/6 mice had higher MCV (4.40% difference; p = < 0.001) and IRF
(7.92% difference; p = < 0.001) than BALB/c mice. BALB/c mice had higher RBC (8.99%
difference; p = < 0.001), HBG (13.4% difference; p = < 0.001), MCH (2.97% difference; p =
0.026), MCHC (7.57% difference; p = < 0.001), RDW-SD (6.63% difference; p = < 0.001) and
RET (4.86% difference; p = 0.048) than C57BL/6 mice.

96
A significant sex effect for all red blood cell counts was identified, except for the absolute
count /percentage of RET, MCH and MCHC components. Female mice had a higher MCV (1.29%
difference; p = < 0.001) than male mice. On the other hand, male mice had a higher RBC (10.37%
difference; p = < 0.001), HBG (7.74% difference; p = < 0.001), RDW-SD (4.61% difference; p =
< 0.001), and IRF (2.32% difference; p = < 0.024) than female mice.
No overall significant main diet effect was identified when examining red blood cell count.
However, further analysis within the sex/strain groups showed significant difference among diets
for some red blood cell counts. Among the C57BL/6 male mice, IRF (p = 0.015) was lower in
mice fed the 0.2 mg/kg diet than the 0 mg/kg diet. HGB count (p = 0.044) also showed a diet effect
but no specific differences were identified by post hoc analysis. Similarly, MCH (p = 0.31) and
MCHC (p = 0.012) counts in C57BL/6 female mice showed a diet effect but not specific
differences were identified (Table 6).
Platelet counts. Overall, all platelet endpoints showed significant strain (p = < 0.001) and
sex (p = < 0.001) effects. The single exception was the mean differences of the PDW that showed
no sex effect. C57BL/6 mice had a higher mean number of PLT (p = < 0.001) than BALB/c mice.
BALB/c mice had higher PDW (12.02% difference; p = < 0.001), MPV (6.640% difference; p =
< 0.001) and P-LCR (66.5.4% difference; p = < 0.001) than C57BL/6 mice.
Male mice had a higher absolute count of PLT (9.90%-12.15% difference; p = < 0.001)
than female mice. Female mice had higher MPV (2.48% difference; p = < 0.001) and P-LCR
(10.25% difference; p = < 0.001) than male mice.

97
No significant diet effect was observed when platelet endpoints were evaluated. Similar ly,
no diet effect was found when the analysis was carried out within individual sex/strain groups
(Table 7).

98
Table 5: White blood cell counts of BALB/c and C57BL/6 mice at necropsy. Differences in means among sex, strain and diet groups
were assessed by Three-Way ANOVA and Holm-Sidak post-hoc analysis. Since significant sex and strain differences were observed
for some white blood cell components, data was also evaluated within sex/strain groups for diet differences. Differences in means among
the diets within each sex/strain group was assessed by One-Way ANOVA and Kruskal-Wallis on ranks post-hoc analysis. Data are
presented as mean ± SEM. Differences were considered significant if p ≤ 0.05. Values within a row that share a letter do not differ.
WBC: white blood cell; LYMPH: lymphocyte, MONO: monocyte; EO: Eosinophil; BASO: Basophil.
Strain/Sex WBC Components 0 mg/kg 0.2 mg/kg 0.5 mg/kg 1 mg/kg 2 mg/kg 5 mg/kg 20 mg/kg 40 mg/kg P Value Sample size
WBC (109/L) 5.32 ± 0.36 4.56 ± 0.33 4.56 ± 0.35 4.28 ± 0.22 4.31 ± 0.66 3.21 ± 0.44 5.10 ± 1.44 3.76 ± 0.38 0.096 n = 5-8
LYMPH# (109/L)
A 4.18 ± 0.27
A 3.72 ± 0.26
A 3.88 ± 0.32
A 3.31 ± 0.10
A 3.47 ± 0.59
B 2.51 ± 0.40
A 2.92 ± 0.30
A 3.01 ± 0.31 0.034 n = 4-8
MONO# (109/L) 0.24 ± 0.06 0.20 ± 0.06 0.13 ± 0.04 0.16 ± 0.07 0.18 ± 0.03 0.16 ± 0.04 0.61 ± 0.45 0.18 ± 0.04 0.963 n = 4-8
EO# (109/L) 0.15 ± 0.02 0.14 ± 0.02 0.10 ± 0.02 0.10 ± 0.01 0.09 ± 0.16 0.08 ± 0.01 0.09 ± 0.03 0.10 ± 0.02 0.132 n = 4-8
BASO# (109/L) 0.01 ± 0.002 0.00 ± 0.00 0.00 ± 0.002 0.00 ± 0.00 0.00 ± 0.00 0.00 ± 0.00 0.00 ± 0.002 0.00 ± 0.00 0.049 n = 5-8
NEUT# (109/L) 0.76 ± 0.07 0.50 ± 0.05 0.63 ± 0.04 0.61 ± 0.09 0.57 ± 0.08 0.46 ± 0.04 1.48 ± 0.98 0.48 ± 0.06 0.061 n = 4-8
WBC (109/L) 3.74 ± 0.28 4.12 ± 0.48 4.74 ± 0.37 3.54 ± 0.40 3.46 ± 0.51 4.16 ± 0.45 3.84 ± 0.48 3.47 ± 0.49 0.463 n = 9-10
LYMPH# (109/L) 2.62 ± 0.20 3.00 ± 0.37 3.25 ± 0.35 2.56 ± 0.30 2.65 ± 0.42 3.06 ± 0.36 2.62 ± 0.30 2.66 ± 0.46 0.812 n = 9-10
MONO# (109/L) 0.15 ± 0.03 0.17 ± 0.03 0.26 ± 0.05 0.11 ± 0.02 0.13 ± 0.04 0.16 ± 0.02 0.15 ± 0.03 0.11 ± 0.02 0.152 n = 9-10
EO# (109/L) 0.08 ± 0.02 0.08 ± 0.01 0.07 ± 0.01 0.08 ± 0.01 0.08 ± 0.01 0.09 ± 0.01 0.08 ± 0.01 0.08 ± 0.01 0.940 n = 9-10
BASO# (109/L) 0.00 ± 0.00 0.00 ± 0.00 0.00 ± 0.00 0.00 ± 0.00 0.00 ± 0.00 0.00 ± 0.00 0.00 ± 0.00 0.00 ± 0.00 1.000 n = 9-10
NEUT# (109/L) 0.88 ± 0.13 0.87 ± 0.15 1.16 ± 0.25 0.79 ± 0.13 0.60 ± 0.09 0.86 ± 0.12 1.00 ± 0.22 0.62 ± 0.04 0.153 n = 9-10
BA
LB
/C F
emal
esB
AL
B/C
Mal
es

99
Table 5 continued: White blood cell counts of BALB/c and C57BL/6 mice at necropsy.
Strain/Sex WBC Components 0 mg/kg 0.2 mg/kg 0.5 mg/kg 1 mg/kg 2 mg/kg 5 mg/kg 20 mg/kg 40 mg/kg P Value Sample size
WBC (109/L) 4.78 ± 0.47 4.97 ± 0.61 4.92 ± 0.42 4.35 ± 0.63 5.27 ± 0.73 5.10 ± 0.46 5.04 ± 0.41 4.47 ± 0.93 0.964 n = 4-7
LYMPH# (109/L) 4.11 ± 0.41 4.23 ± 0.52 4.20 ± 0.37 0.43 ± 0.20 4.59 ± 0.61 4.30 ± 0.42 4.27 ± 0.34 3.89 ± 0.85 0.995 n = 4-7
MONO# (109/L) 0.21 ± 0.02 0.21 ± 0.02 0.20 ± 0.02 0.20 ± 0.03 0.24 ± 0.08 0.25 ± 0.01 0.24 ± 0.02 0.21 ± 0.05 0.796 n = 4-7
EO# (109/L) 0.11 ± 0.02 0.11 ± 0.02 0.12 ± 0.02 0.11 ± 0.01 0.10 ± 0.03 0.11 ± 0.01 0.09 ± 0.01 0.10 ± 0.02 0.982 n = 4-7
BASO# (109/L) 0.00 ± 0.002 0.00 ± 0.002 0.00 ± 0.002 0.00 ± 0.002 0.00 ± 0.003 0.00 ± 0.002 0.00 ± 0.002 0.00 ± 0.002 0.715 n = 4-7
NEUT# (109/L) 0.35 ± 0.05 0.42 ± 0.07 0.39 ± 0.06 0.39 ± 0.06 0.34 ± 0.04 0.44 ± 0.09 0.44 ± 0.73 0.27 ± 0.04 0.571 n = 4-7
WBC (109/L) 6.54 ± 0.68 6.28 ± 0.72 6.14 ± 0.52 5.18 ± 0.80 6.63 ± 1.10 4.15 ± 0.71 4.44 ± 0.40 4.46 ± 0.44 0.034 n = 8-10
LYMPH# (10^9/L) 4.11 ± 0.38 3.75 ± 0.45 3.94 ± 0.60 3.71 ± 0.59 2.94 ± 0.52 3.08 ± 0.54 3.02 ± 0.50 2.72 ± 0.42 0.324 n = 7-10
MONO# (109/L) 0.66 ± 0.17 0.59 ± 0.13 0.46 ± 0.06 0.38 ± 0.10 0.77 ± 0.15 0.40 ± 0.11 0.31 ± 0.11 0.40 ± 0.08 0.115 n = 8-10
EO# (109/L) 0.15 ± 0.02 0.11 ± 0.03 0.13 ± 0.02 0.13 ± 0.03 0.09 ± 0.02 0.09 ± 0.02 0.10 ± 0.02 0.08 ± 0.02 0.252 n = 8-10
BASO# (109/L) 0.00 ± 0.002 0.00 ± 0.001 0.00 ± 0.001 0.00 ± 0.00 0.00 ± 0.001 0.00 ± 0.001 0.00 ± 0.001 0.00 ± 0.001 0.300 n = 8-10
NEUT# (109/L) 1.61 ± 0.56 1.83 ± 0.64 1.61 ± 0.41 0.97 ± 0.22 2.26 ± 0.60 0.87 ± 0.15 1.01 ± 0.36 1.26 ± 0.26 0.190 n = 7-10
C5
7B
L/6
Mal
esC
57
BL
/6 F
emal
es

100
Table 6: Red blood cell counts of BALB/c and C57BL/6 mice at necropsy. Differences in means among sex, strain and diet groups
were assessed by Three-Way ANOVA and Holm-Sidak post-hoc analysis. Since significant sex and strain differences were observed
for some red blood cell components, data was also evaluated within sex/strain groups for diet differences. Differences in means among
the diets within each sex/strain group was assessed by One-Way ANOVA and Holm-Sidak or Dunn’s method post-hoc analysis. Data
are presented as mean ± SEM. Differences were considered significant if p ≤ 0.05. Values within a row that share a letter do not differ.
RBC: red blood cell; RET: reticulocyte; HGB: hemoglobin; MCV: mean corpuscular volume, MCH: mean corpuscular hemoglobin,
MCHC: mean corpuscular hemoglobin concentration, RDW-SD: red cell distribution width, IRF: immature reticulocyte fraction.
Strain/Sex RBC Components 0 mg/kg 0.2 mg/kg 0.5 mg/kg 1 mg/kg 2 mg/kg 5 mg/kg 20 mg/kg 40 mg/kg P Value Sample size
RBC (1012
/L) 9.94 ± 0.39 9.68 ± 0.19 8.57 ± 1.58 10.11 ± 0.14 9.84 ± 0.18 9.82 ± 0.22 8.03 ± 1.6 9.97 ± 0.08 0.632 n = 5-8
RET# (109/L) 467.3 ± 45.2 462.0 ± 24.6 481.5 ± 27.8 427.6 ± 14.2 434.1 ± 23.0 423.6 ± 13.7 443.6 ± 28.2 423.6 ± 22.1 0.697 n = 5-8
RET (%) 4.70 ± 0.41 4.78 ± 0.26 4.75 ± 0.28 4.23 ± 0.12 4.43 ± 0.27 4.32 ± 0.13 4.67 ± 0.47 4.25 ± 0.22 0.711 n = 5-8
HGB (g/L) 153 ± 3 148 ± 2 128 ± 24 153 ± 2 150 ± 2 150 ± 2 138 ± 8 153 ± 1 0.191 n = 5-8
MCV (fL) 43.5 ± 0.3 43.7 ± 0.2 43.9 ± 1.1 43.5 ± 0.4 43.6 ± 0.1 43.1 ± 0.3 43.2 ± 1.8 43.6 ± 0.3 0.700 n = 5-8
MCH (pg) 15.5 ± 0.3 15.3 ± 0.1 15.2 ± 0.2 15.2 ± 0.07 15.3 ± 0.1 15.3 ± 0.2 14.5 ± 0.5 15.3 ± 0.1 0.462 n = 5-8
MCHC (g/L) 336 ± 7 349 ± 3 348 ± 4 349 ± 3 350 ± 3 356 ± 3 348 ± 2 352 ± 2 0.735 n = 5-8
RDW-SD (fL) 28.3 ± 0.3 28.0 ± 0.3 27.1 ± 0.9 28.2 ± 0.4 28.1 ± 0.2 27.9 ± 0.2 27.0 ± 1.3 28.1 ± 0.2 0.925 n = 5-8
IRF (%) 43.3 ± 1.7 43.0 ± 1.8 42.7 ± 1.9 46.9 ± 1.2 46.0 ± 1.4 45.6 ± 0.9 45.1 ± 1.142.9 ± 0.6
0.321 n = 5-8
RBC (1012
/L) 10.55 ± 0.009 10.32 ± 0.11 10.61 ± 0.14 10.65 ± 0.07 10.54 ± 0.10 10.52 ± 0.09 10.33 ± 0.13 10.12 ± 0.29 0.433 n = 9-10
RET# (109/L) 485.0 ± 12.8 472.9 ± 11.1 492.4 ± 21.2 475.9 ± 12.7 463.0 ± 6.47 471.8 ± 13.8 535.2 ± 40.5 462.4 0.815 n = 9-10
RET (%) 4.60 ± 0.13 4.58 ± 0.09 4.63 ± 0.15 4.47 ± 0.12 4.40 ± 0.09 4.48 ± 0.12 5.22 ± 0.47 4.58 ± 0.11 0.763 n = 9-10
HGB (g/L) 157 ± 1 156 ± 2 160 ± 2 160 ± 1 157 ± 2 158 ± 2 154 ± 2 152 ± 4 0.189n = 9-10
MCV (fL) 43.2 ± 0.2 43.3 ± 0.2 43.0 ± 0.2 43.0 ± 0.2 42.9 ± 0.2 43.4 ± 0.2 43.2 ± 0.3 43.4 ± 0.2 0.877n = 9-10
MCH (pg) 14.9 ± 0.03 15.1 ± 0.1 15.0 ± 0.1 15.0 ± 0.1 14.9 ± 0.04 15.0 ± 0.05 14.9 ± 0.05 15.0 ± 0.1 0.423n = 9-10
MCHC (g/L) 345 ± 1 349 ± 2 350 ± 2 349 ± 2 348 ± 2 346 ± 2 344 ± 2 346 ± 1 0.217n = 9-10
RDW-SD (fL) 28.1 ± 0.2 28.2 ± 0.1 29.1 ± 0.4 28.6 ± 0.1 28.5 ± 0.1 28.2 ± 0.1 29.0 ± 0.3 28.1 ± 0.2 0.075n = 9-10
IRF (%) 47.0 ± 0.6 47.1 ± 0.9 45.8 ± 1.1 44.7 ± 0.5 45.6 ± 0.8 45.0 ± 1.0 48.0 ± 1.346.1 ± 0.9
0.197n = 9-10
BA
LB
/C F
emal
esB
AL
B/C
Mal
es

101
Table 6 continued: Red blood ce ll counts of BALB/c and C57BL/6 mice at necropsy.
Strain/Sex RBC Components 0 mg/kg 0.2 mg/kg 0.5 mg/kg 1 mg/kg 2 mg/kg 5 mg/kg 20 mg/kg 40 mg/kg P Value Sample size
RBC (1012
/L) 7.53 ± 1.47 8.14 ± 1.22 9.05 ± 0.19 8.30 ± 1.24 9.64 ± 0.14 9.38 ± 0.15 9.55 ± 0.14 7.27 ± 1.64 0.201 n = 4-7
RET# (109/L) 450.3 ± 31.9 372.3 ± 60.6 468.1 ± 32.3 418.8 ± 71.8 438.1 ± 15.2 470.3 ± 35.6 455.8 ± 28.9 471.2 ± 57.1 0.752 n = 4-7
RET (%) 5.04 ± 0.44 4.47 ± 0.29 5.19 ± 0.38 4.69 ± 0.45 4.56 ± 0.22 5.01 ± 0.34 4.78 ± 0.32 5.26 ± 0.38 0.752 n = 4-7
HGB (g/L) 112 ± 21 119 ± 19 135 ± 2 120 ± 19 140 ± 2 139 ± 2 138 ± 3 108 ± 25 0.465 n = 4-7
MCV (fL) 46.1 ± 0.8 46.0 ± 0.6 45.1 ± 0.2 45.5 ± 0.8 45.1 ± 0.2 46.3 ± 0.7 44.8 ± 0.1 46.7 ± 0.9 0.084 n = 4-7
MCH (pg) 17.7 ± 2.8 13.9 ± 0.8 14.9 ± 0.1 13.6 ± 1.0 14.5 ± 0.1 14.8 ± 0.2 14.5 ± 0.1 14.0 ± 1.1 0.031 n = 4-7
MCHC (g/L) 381 ± 51 304 ± 20 330 ± 1 302 ± 25 323 ± 3 321 ± 1 323 ± 3 301 ± 28 0.012 n = 4-7
RDW-SD (fL) 25.2 ± 0.5 25.2 ± 0.6 25.3 ± 0.2 25.4 ± 0.7 25.4 ± 0.1 26.1 ± 0.3 25.7 ± 0.1 24.8 ± 0.9 0.698 n = 4-7
IRF (%) 52.4 ± 0.7 46.4 ± 1.9 48.4 ± 1.9 49.3 ± 2.2 45.1 ± 1.3 51.5 ± 0.6 49.6 ± 1.9 47.7 ± 2.1 0.143 n = 4-7
RBC (1012
/L) 9.74 ± 0.19 10.17 ± 0.13 9.70 ± 0.11 9.52 ± 0.26 9.52 ± 0.11 8.84 ± 0.88 9.68 ± 0.12 9.83 ± 0.14 0.102 n = 8-10
RET# (109/L) 445.4 ± 21.2 449.7 ± 15.1 435 ± 32.2 434.7 ± 18.2 458.4 ± 18.5 393.2 ± 43.1 457.6 ± 13.4 450.3 ± 38.0 0.893 n = 7-10
RET (%) 4.61 ± 0.28 4.42 ± 0.14 4.48 ± 0.31 4.58 ± 0.19 4.82 ± 0.18 4.31 ± 0.23 4.73 ± 0.14 4.57 ± 0.36 0.894 n = 7-10
HGB (g/L) 141 ± 3 147 ± 2 141 ± 2 138 ± 4 138 ± 1 127 ± 12 139 ± 2 142 ± 2 0.044 n = 8-10
MCV (fL) 44.9 ± 0.3 44.7 ± 0.3 44.9 ± 0.2 44.9 ± 0.2 45.2 ± 0.2 45.2 ± 0.4 44.8 ± 0.2 44.7 ± 0.2 0.882 n = 8-10
MCH (pg) 14.5 ± 0.1 14.4 ± 0.1 14.5 ± 1 14.5 ± 0.2 14.5 ± 0.1 15.4 ± 1.1 14.3 ± 0.1 14.4 ± 0.1 0.554 n = 8-10
MCHC (g/L) 322 ± 2 323 ± 3 322 ± 2 322 ± 2 321 ± 1 339 ± 20 321 ± 2 323 ± 1 0.957 n = 8-10
RDW-SD (fL) 27.5 ± 0.5 27.2 ± 0.2 27.2 ± 0.4 27.0 ± 0.3 28.6 ± 0.7 26.4 ± 0.6 27.0 ± 0.3 27.5 ± 0.4 0.363 n = 8-10
IRF (%) A 51.9 ± 1.5
B 46.0 ± 1.4
AB 49.8 ± 0.9
AB 51.0 ± 0.6
AB 51.1 ± 0.8
AB 47.9 ± 1.3
AB 47.2 ± 1.6 AB
49.4 ± 1.2 0.015 n = 7-10
C5
7B
L/6
Fem
ales
C5
7B
L/6
Mal
es
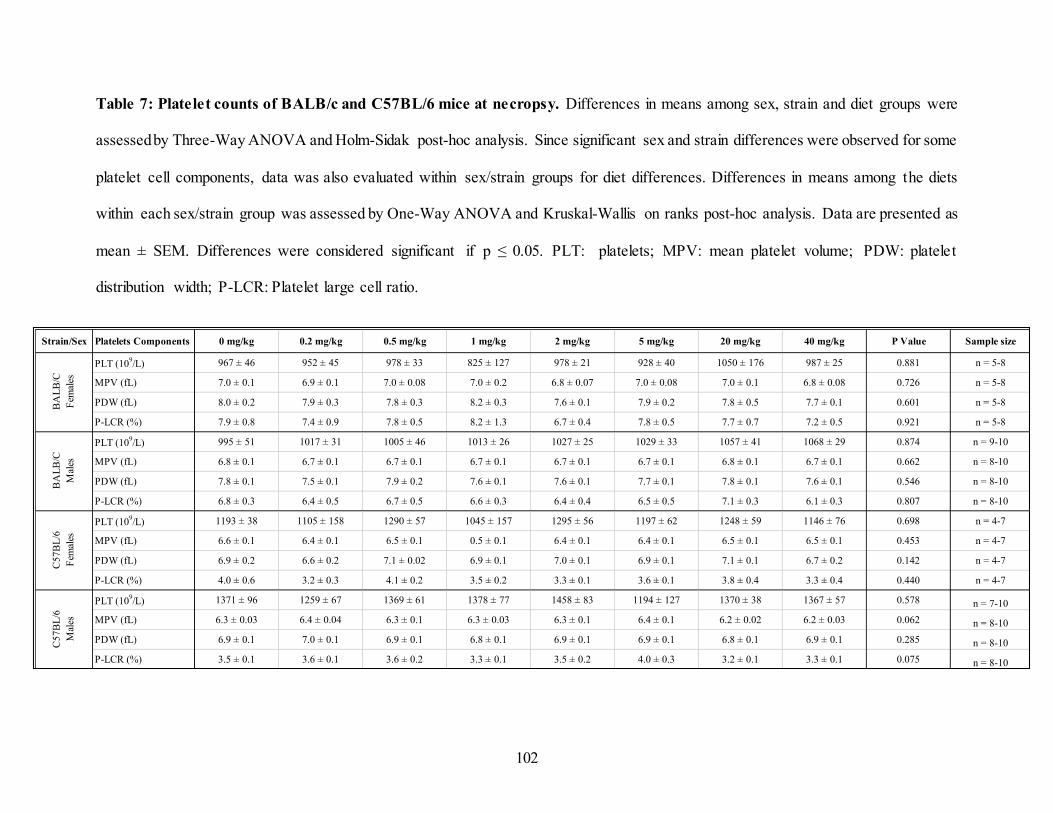
102
Table 7: Platelet counts of BALB/c and C57BL/6 mice at necropsy. Differences in means among sex, strain and diet groups were
assessed by Three-Way ANOVA and Holm-Sidak post-hoc analysis. Since significant sex and strain differences were observed for some
platelet cell components, data was also evaluated within sex/strain groups for diet differences. Differences in means among the diets
within each sex/strain group was assessed by One-Way ANOVA and Kruskal-Wallis on ranks post-hoc analysis. Data are presented as
mean ± SEM. Differences were considered significant if p ≤ 0.05. PLT: platelets; MPV: mean platelet volume; PDW: platelet
distribution width; P-LCR: Platelet large cell ratio.
Strain/Sex Platelets Components 0 mg/kg 0.2 mg/kg 0.5 mg/kg 1 mg/kg 2 mg/kg 5 mg/kg 20 mg/kg 40 mg/kg P Value Sample size
PLT (109/L) 967 ± 46 952 ± 45 978 ± 33 825 ± 127 978 ± 21 928 ± 40 1050 ± 176 987 ± 25 0.881 n = 5-8
MPV (fL) 7.0 ± 0.1 6.9 ± 0.1 7.0 ± 0.08 7.0 ± 0.2 6.8 ± 0.07 7.0 ± 0.08 7.0 ± 0.1 6.8 ± 0.08 0.726 n = 5-8
PDW (fL) 8.0 ± 0.2 7.9 ± 0.3 7.8 ± 0.3 8.2 ± 0.3 7.6 ± 0.1 7.9 ± 0.2 7.8 ± 0.5 7.7 ± 0.1 0.601 n = 5-8
P-LCR (%) 7.9 ± 0.8 7.4 ± 0.9 7.8 ± 0.5 8.2 ± 1.3 6.7 ± 0.4 7.8 ± 0.5 7.7 ± 0.7 7.2 ± 0.5 0.921 n = 5-8
PLT (109/L) 995 ± 51 1017 ± 31 1005 ± 46 1013 ± 26 1027 ± 25 1029 ± 33 1057 ± 41 1068 ± 29 0.874 n = 9-10
MPV (fL) 6.8 ± 0.1 6.7 ± 0.1 6.7 ± 0.1 6.7 ± 0.1 6.7 ± 0.1 6.7 ± 0.1 6.8 ± 0.1 6.7 ± 0.1 0.662 n = 8-10
PDW (fL) 7.8 ± 0.1 7.5 ± 0.1 7.9 ± 0.2 7.6 ± 0.1 7.6 ± 0.1 7.7 ± 0.1 7.8 ± 0.1 7.6 ± 0.1 0.546 n = 8-10
P-LCR (%) 6.8 ± 0.3 6.4 ± 0.5 6.7 ± 0.5 6.6 ± 0.3 6.4 ± 0.4 6.5 ± 0.5 7.1 ± 0.3 6.1 ± 0.3 0.807 n = 8-10
PLT (109/L) 1193 ± 38 1105 ± 158 1290 ± 57 1045 ± 157 1295 ± 56 1197 ± 62 1248 ± 59 1146 ± 76 0.698 n = 4-7
MPV (fL) 6.6 ± 0.1 6.4 ± 0.1 6.5 ± 0.1 0.5 ± 0.1 6.4 ± 0.1 6.4 ± 0.1 6.5 ± 0.1 6.5 ± 0.1 0.453 n = 4-7
PDW (fL) 6.9 ± 0.2 6.6 ± 0.2 7.1 ± 0.02 6.9 ± 0.1 7.0 ± 0.1 6.9 ± 0.1 7.1 ± 0.1 6.7 ± 0.2 0.142 n = 4-7
P-LCR (%) 4.0 ± 0.6 3.2 ± 0.3 4.1 ± 0.2 3.5 ± 0.2 3.3 ± 0.1 3.6 ± 0.1 3.8 ± 0.4 3.3 ± 0.4 0.440 n = 4-7
PLT (109/L) 1371 ± 96 1259 ± 67 1369 ± 61 1378 ± 77 1458 ± 83 1194 ± 127 1370 ± 38 1367 ± 57 0.578 n = 7-10
MPV (fL) 6.3 ± 0.03 6.4 ± 0.04 6.3 ± 0.1 6.3 ± 0.03 6.3 ± 0.1 6.4 ± 0.1 6.2 ± 0.02 6.2 ± 0.03 0.062 n = 8-10
PDW (fL) 6.9 ± 0.1 7.0 ± 0.1 6.9 ± 0.1 6.8 ± 0.1 6.9 ± 0.1 6.9 ± 0.1 6.8 ± 0.1 6.9 ± 0.1 0.285 n = 8-10
P-LCR (%) 3.5 ± 0.1 3.6 ± 0.1 3.6 ± 0.2 3.3 ± 0.1 3.5 ± 0.2 4.0 ± 0.3 3.2 ± 0.1 3.3 ± 0.1 0.075 n = 8-10
BA
LB
/C
Fem
ales
BA
LB
/C
Mal
es
C57
BL
/6
Fem
ales
C5
7B
L/6
Mal
es

103
3.4.5.3. Micronucleus frequency
Similar to what was identified using CBC analysis, the percentage of immature red blood
cells at necropsy (%RET) did not differ by strain, sex or diet either. We did, however, notice that
CBC-determined concentrations were 78-98 % higher than when measured using the micronucleus
assay. A significant sex (p = < 0.001) and strain (p = < 0.001) effects were observed for the
frequency rate of %MN-RET and % MN-NCE. BALB/c mice had 25% more MN-RET cells and
41.6% more MN-NCE cells than C57BL/6 mice. Male mice had 21% more MN-RET cells and
16 % more MN-NCE cells than female mice. No diet effect was observed across all mouse groups
or within each sex/strain group (Table 8).
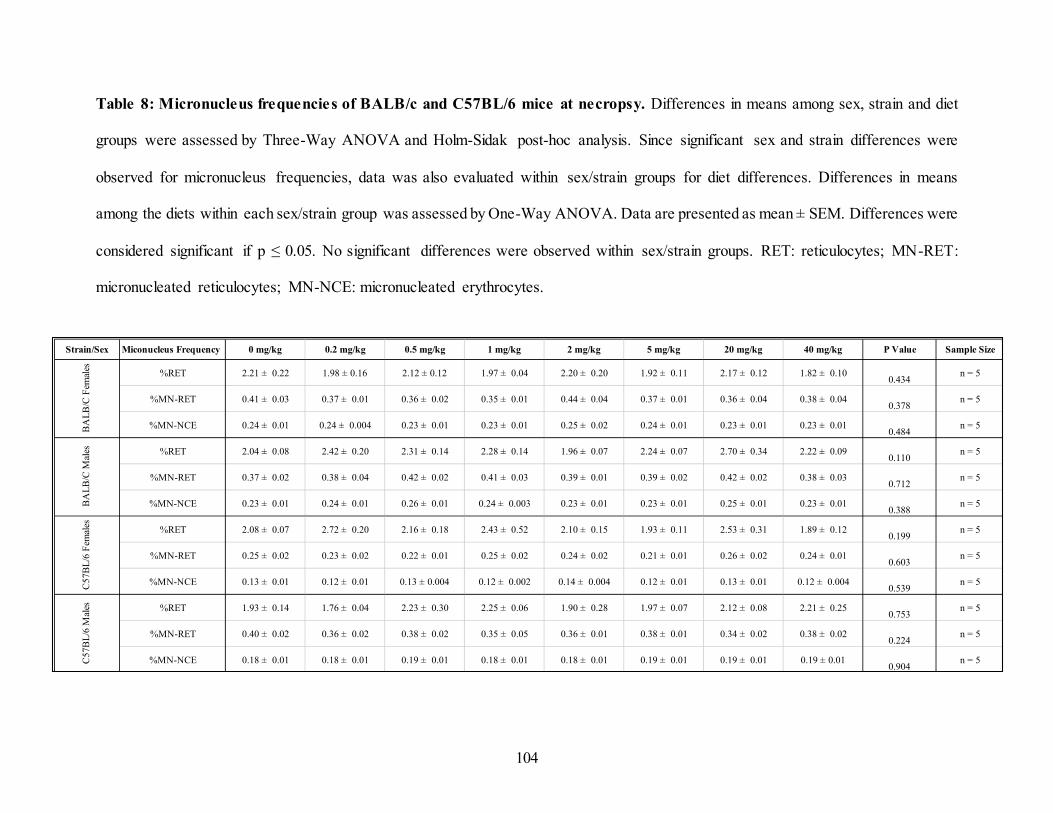
104
Table 8: Micronucleus frequencies of BALB/c and C57BL/6 mice at necropsy. Differences in means among sex, strain and diet
groups were assessed by Three-Way ANOVA and Holm-Sidak post-hoc analysis. Since significant sex and strain differences were
observed for micronucleus frequencies, data was also evaluated within sex/strain groups for diet differences. Differences in means
among the diets within each sex/strain group was assessed by One-Way ANOVA. Data are presented as mean ± SEM. Differences were
considered significant if p ≤ 0.05. No significant differences were observed within sex/strain groups. RET: reticulocytes; MN-RET:
micronucleated reticulocytes; MN-NCE: micronucleated erythrocytes.
Strain/Sex Miconucleus Frequency 0 mg/kg 0.2 mg/kg 0.5 mg/kg 1 mg/kg 2 mg/kg 5 mg/kg 20 mg/kg 40 mg/kg P Value Sample Size
%RET 2.21 ± 0.22 1.98 ± 0.16 2.12 ± 0.12 1.97 ± 0.04 2.20 ± 0.20 1.92 ± 0.11 2.17 ± 0.12 1.82 ± 0.100.434
n = 5
%MN-RET 0.41 ± 0.03 0.37 ± 0.01 0.36 ± 0.02 0.35 ± 0.01 0.44 ± 0.04 0.37 ± 0.01 0.36 ± 0.04 0.38 ± 0.040.378
n = 5
%MN-NCE 0.24 ± 0.01 0.24 ± 0.004 0.23 ± 0.01 0.23 ± 0.01 0.25 ± 0.02 0.24 ± 0.01 0.23 ± 0.01 0.23 ± 0.010.484
n = 5
%RET 2.04 ± 0.08 2.42 ± 0.20 2.31 ± 0.14 2.28 ± 0.14 1.96 ± 0.07 2.24 ± 0.07 2.70 ± 0.34 2.22 ± 0.090.110
n = 5
%MN-RET 0.37 ± 0.02 0.38 ± 0.04 0.42 ± 0.02 0.41 ± 0.03 0.39 ± 0.01 0.39 ± 0.02 0.42 ± 0.02 0.38 ± 0.030.712
n = 5
%MN-NCE 0.23 ± 0.01 0.24 ± 0.01 0.26 ± 0.01 0.24 ± 0.003 0.23 ± 0.01 0.23 ± 0.01 0.25 ± 0.01 0.23 ± 0.010.388
n = 5
%RET 2.08 ± 0.07 2.72 ± 0.20 2.16 ± 0.18 2.43 ± 0.52 2.10 ± 0.15 1.93 ± 0.11 2.53 ± 0.31 1.89 ± 0.120.199
n = 5
%MN-RET 0.25 ± 0.02 0.23 ± 0.02 0.22 ± 0.01 0.25 ± 0.02 0.24 ± 0.02 0.21 ± 0.01 0.26 ± 0.02 0.24 ± 0.010.603
n = 5
%MN-NCE 0.13 ± 0.01 0.12 ± 0.01 0.13 ± 0.004 0.12 ± 0.002 0.14 ± 0.004 0.12 ± 0.01 0.13 ± 0.01 0.12 ± 0.0040.539
n = 5
%RET 1.93 ± 0.14 1.76 ± 0.04 2.23 ± 0.30 2.25 ± 0.06 1.90 ± 0.28 1.97 ± 0.07 2.12 ± 0.08 2.21 ± 0.250.753
n = 5
%MN-RET 0.40 ± 0.02 0.36 ± 0.02 0.38 ± 0.02 0.35 ± 0.05 0.36 ± 0.01 0.38 ± 0.01 0.34 ± 0.02 0.38 ± 0.020.224
n = 5
%MN-NCE 0.18 ± 0.01 0.18 ± 0.01 0.19 ± 0.01 0.18 ± 0.01 0.18 ± 0.01 0.19 ± 0.01 0.19 ± 0.01 0.19 ± 0.010.904
n = 5
BA
LB
/C F
emal
esB
AL
B/C
Mal
esC
57B
L/6
Fem
ales
C57
BL
/6 M
ales

105
3.5.Discussion
Where many human studies can demonstrate associations, or in the case of clinical trials causal
relationships, studies in animal models such as mice allow us to investigate the causal mechanisms
relating the folate pathway to a health outcome. However, even though folate biomarkers in
humans have been established, the corresponding equivalents in animal models have yet to be
identified. Consequently, this limits the translation of animal-based folate research to inform
nutritional risk assessments. Our study aimed to bridge this gap by conducting a dose-response
analysis of FA intake in mice using diets that encompassed the range observed in the literature.
Using both sexes and two of the mostly commonly used inbred mouse strains in folate research,
we investigated both traditional status biomarkers and candidate functional biomarkers of folate
status. The vast majority of the endpoints investigated in our study showed clear sex and strain
effects. Plasma total folate concentrations and folate vitamers in mice progressively increased,
whereas homocysteine decreased, as the FA contents in the diets increased. The candidate
functional biomarkers of status, RBC micronucleus and white and red blood cell counts, were not
related to FA intake.
3.5.1. Biomarkers of FA Intake
Plasma total folate. Mayeux et al. describes biomarkers as “cellular biochemical or molecular
alterations that are measurable” (103). In nutritional research, this could indicate nutritional status
in terms of intake/exposure and/or the functional/metabolic responses (92). For folates, one of the
traditional biomarkers of exposure is plasma/serum total folate. Plasma or serum total folate
concentrations are great indicators of recent intakes. On the other hand, RBC folate concentrations
provide information on long-term storage and accumulation in tissue (7,11). It should be noted that

106
in rodents fed a consistent diet, daily variation in intake is minimal as compared to humans, and
therefore plasma total folate is more likely to represent usual intakes in rodents. Analysis of recent
intake as assessed by plasma total folate allows for a quick identification of dose-response and
dietary patterns over time (7,11). In clinical terms, it can be used as an early indicator of changes
in folate status, therefore allowing early intervention and prevent the onset of adverse health
effects. Similar to what is outlined in the literature for both humans and animals, plasma total folate
concentrations progressively increased as the FA content in the diets increased. Our data further
validated plasma total folate concentration as a biomarker of folate exposure in mice as it is
observed in humans. Additionally, as a biomarker of exposure, plasma total folate concentrations
also quantitively allows us to evaluate the diet and time intervention folate-responsive health
effects start to appear.
Within 2 weeks of the intervention, the plasma total folate concentrations in mice fed diets ≤
5 mg/kg had fallen and plateaued. This trend was shorter than the 6 to 8-week time period observed
for low FA intakes in humans and the 8 to 10-week period previously described in human FA
supplementation studies (7,112). The BALB/c male mice fed the 20 mg/kg diet was the only group
that showed similar trends to those observed in humans. However, this trend was not detected in
the 40 mg/kg diets. Our data showed that plasma total folate concentrations continued to rise and
did not plateau even by the 12-week intervention time period. Our study provides insight on how
long plasma concentrations can take to stabilize and the importance of the duration of interventions
when considering study designs. Underlying causes of observed health effects identified in vivo
may fluctuate and change during a dietary intervention. We can only accurately associate intakes
with health effects if we understand the status at the time of disease pathogenesis. The results of

107
our data showed that the duration of intervention required for animal study designs to investigate
health effects of folate status varied based on the FA content of the diets.
Unmetabolized folic acid. Concerns have been raised that FA can cause adverse effects;
however, there are no biomarkers for high or excessive intake of FA. It has been proposed that
unmetabolized FA in circulation could negatively impact folate metabolism. FA has been shown
to have an inhibitory effect on TS and MTHFR in vitro. As FA is consumed, its monoglutamate
form is metabolized to DHF then THF by the DHFR enzyme primarily in the liver (49,105). High
FA intakes can oversaturate the DHFR enzyme and result in the appearance of unmetabolized FA
in plasma and tissues (113). In humans, for example, this occurs with intakes of FA around 0.4 mg
(114,115). Additional in vitro studies have also shown that DHF, which might accumulate because
of increased FA intake, can also trigger a negative feedback mechanism that prevents the
regeneration of both THF and DHF downstream via the direct inhibition of TS and MTHFR in the
folate cycle. We hypothesized that the appearance of unmetabolized FA or its increase in response
to diet is a marker of supraphysiological FA intake.
The L. casei microbiological assay is considered the ‘gold standard’ for determining folate
status (11). However, this assay is unable to distinguish between the different folate forms in its
determination of total folate because L. casei are able to use all folate forms to grow. In contrast,
LS-MS/MS analysis is able to quantitatively measure the different folate forms in plasma. As such,
LC-MS/MS analysis of folate vitamers allowed us to determine when UMFA appears and/or
increases in the plasma. We show that concentrations of UMFA significantly increased at diets ≥
5mg/kg diets in all the mice. This concentration jump in the plasma can be used as an indicator of

108
the DHFR enzyme saturation levels in mice models and therefore as an indicator of high FA
intakes.
High FA intakes has been associated with a number of adverse health outcomes. The presence
of unmetabolized FA in circulation is associated with concerns of the adverse health outcomes
such as the propagation of existing tumor cells and impaired natural killer (NK) cells in humans
(10,44). Previous studies have identified an inverse U-shaped relationship between the total folate
intake and NK cytotoxicity whereby both low and high FA intakes were associated with impaired
mechanisms in humans. Specifically, the study conducted by Troen et al. further demonstrated a
significant inverse linear association between unmetabolized FA in plasma and NK cytotoxicity
in post-menopausal women (44,49). Furthermore, it has also been proposed that high FA intakes
can increase the availability of nucleotides and methyl groups via the folate pathway which could
facilitate that growth of existing tumors (10). Furthermore, the UL of 1000 ug of FA/day was
established due to the concern of masking or exacerbating vitamin B12 deficiency.
Despite some associations with adverse effects in humans, there are no plasma total folate or
unmetabolized FA cut-offs for high/excessive FA intake. At one point, a high folate cut-off of 45.3
nmol/L of plasma total folates was proposed for humans. However, this was based on the highest
calibrator used in the radioimmunoassay (116,117), not on an adverse health effect (116,117). This
limitation highlights an existing knowledge gap of a cut-off intake concentration associated with
an adverse health effect that can be used as an indicator of over-consumption of FA in humans and
animal models. We propose using the appearance and increase of UMFA in circulation as a
biomarker of high exposure, as it likely results from supraphysiological intakes. In our study, we
saw elevated concentrations of UMFA at an estimated FA intake ≥ 1.00 mg/kg (range: 1.00 – 1.87
mg/kg). This correlated with an estimated UMFA concentration ≥ 7.71 nmol/L (range: 7.71 –

109
20.75 nmol/L) in our mice models. The appearance of elevated UMFA concentration in plasma
could potentially be a better indication of high/excess FA intakes. Equivalent determinations in
humans could also be determined to establish a plasma concentration associated with high FA
intakes.
3.5.1. Functional biomarkers of folate
Macrocytic anemia. In 1968, a plasma total folate cut-off concentration of 6.8 nmol/L was
proposed as an indicator of folate deficiency (7,116). This cut-off value was based on an increased
risk for developing macrocytic anemia. Macrocytosis is a condition whereby the RBC are
abnormally enlarged and oval shaped (24,26). Macrocytic anemia can result from folate and/or
vitamin B12 deficiency (26). Unlike humans, rodents generally do not exhibit these characteristic
enlarged RBC cells unless folate/vitamin B12 deficiency occurs simultaneously with protein
restriction, an observation confirmed in this study. As a result, macrocytic anemia cannot be used
as a biomarker of health effect due to folate deficiency in mice. In our dose-response study, we
investigated if FA intakes influenced other blood cell phenotypes. Even though strain and sex
differences exist, no consistent diet effect was identified when analysing the size or number of
blood cell components. These findings further highlighted the need to identify and validate other
biomarkers of health effect due to folate deficiency in mouse models.
RBC micronuclei. The presence of imbalanced intracellular nucleotide pools increases the
likelihood of DNA mutations and chromosome strand breaks (24). For instance, when thymidylate
synthesis is impaired and uracil is misincorperated into the DNA strand, DNA repair mechanisms
attempt to correct the error by excising uracil. However, the lack of thymidylate to fill in the gap

110
leaves single strand breaks in the chromosome and depending on the extent of uracil
misincorporation, double strand DNA breaks can occur (24,25). If chromosome instability occurs,
micronuclei can form. As erythroblasts proliferate and differentiate to RET in the bone marrow,
they lose their nucleus but may retain small fragments of DNA in the cytoplasm (111,118). This
small cluster of chromosomal fragments, known as the micronucleus, can be retained as the cells
differentiate to NCE. Due to this, the micronucleus frequency in immature (RET) or mature (NCE)
RBCs can be used as an indicator of DNA fragmentation due to folate deficiency. In a previous
study, mice fed a FA deficient diet (0 mg/kg) had a 1.3 fold increased MN-NCE than those fed a
control diet (2 mg/kg) (105). On the other hand, another study showed that a FA supplemented
diet (6 mg/kg) diet dot not affect the micronucleus frequency (119). Our aim with a dose-response
study was to determine the FA intake that the micronucleus frequency started to increase. Despite
results from previous studies, no diet effect was observed in the micronucleus frequency of both
RET and NCE cells in this study. Our micronucleus data differed from the literature and findings
from previous studies that have shown that low FA diets are induce increased micronucleus
frequencies (105,118). We were unfortunately, unable to validate the use of micronucleus
frequency as a functional biomarker of low FA intake.
Plasma Homocysteine. In 2005, an alternative cut-off plasma total folate concentration value
for folate deficiency (10 nmol/L) was proposed based on population-based observations that
homocysteine increases with lower folate intake (116,120,121). There is an inverse relationship
between Hcy and folate at plasma total folate concentrations < 15 nmol/L in humans (122). This
is related to the role of folate in the remethylation of homocysteine to form methionine. 5-methyl
THF is converted to Hcy which is then methylated to methionine via a vitamin B12-dependent

111
reaction catalyzed by MTR (8,26). In other words, increased plasma Hcy concentrations can be an
indication of impaired MTR activity and subsequently methionine synthesis. THF is also
regenerated from 5-methyl THF concurrently (7). As a metabolic intermediate of the folate
pathway, Hcy acts as an effective functional biomarker of folate status.
Mice also demonstrate higher homocysteine on lower FA diets (123), our study aimed to find
the FA intake dose associated with a rise in homocysteine in mice. Using benchmark dose
modeling (PROAST), we found that Hcy concentrations continued to decrease with increasing FA
intakes and plateaued at an estimated intake dose of 0.53 mg/kg in BALB/c females and 0.95
mg/kg in BALB/c males. Unfortunately, even though previous studies have shown that plasma
homocysteine in C57BL/6 mice was significantly higher in mice fed deficient diets, this was not
observed in our study (124). A null model was produced when analysing C57BL/6 mice. This
indicated that there was either no change in slope or a relationship could not be modeled to
determine a benchmark dose. Therefore, Hcy cannot be accurately used as an indicator of low FA
intake in C57BL/6 mice. It is unclear why a dose-response change in Hcy concentrations was not
observed in the C57BL/6 mice. However, these mice eat more and had a higher folate status than
BALB/c mice, but they also exhibited higher Hcy concentrations. One theory that might explain
these differences is a difference in the activity of the DHFR enzyme. Strain-specific differences
could be assessed to explore whether it results in differences in folate metabolism.
3.6.Conclusion
In this study, we determined the mouse-equivalent cut of values associated with both high
and low FA intake. We found that Hcy concentrations started to increase when FA intakes were ≤
0.53 mg/kg and 0.95 mg/kg in BALB/c female and male mice respectively. We propose using this

112
as the lower limit cut off value for adequate FA intakes for BALB/c mice. The equivalent diet dose
upon which Hcy concentrations started to increase could not be determined using BMD modeling.
Furthermore, we also propose using significantly elevated concentrations of unmetabolized FA
(UMFA) in plasma as an indicator of high FA intake. Our study showed that this occurred with
estimated FA intakes ≥ 1.87 mg/kg, 1.03 mg/kg, 1.02 mg/kg and 1.00 mg/kg in BALB/c female ,
BALB/c male C57BL/6 female and male mice respectively. Additionally, the use of multiple
analytical methods to identify indicators of high and low FA intake can go a long way in
harmonizing data derived from mouse models in the folate research field. Accordingly, this would
improve the translation of animal-derived data to human nutrition.

113
CHAPTER 4: DISCUSSION
4.1. Study context and implication to human nutrition
Adequate folate status is vital for growth, development and maintenance of health in both
humans and animals. Its synthetic form, FA, is mainly obtained via fortified foods or prenatal
supplements. However, like many essential nutrients, there are concerns over the adverse health
effects associated with inadequate folate intakes and the potential for adverse effects from excess
FA consumption. The purpose of our study was to evaluate animal-based research available to
inform FA nutritional risk assessments and to address some of the challenges that hinder their
knowledge translation to human nutrition.
4.1.1. Reporting animal-based research
Folic acid research in animal models has allowed us to examine the relationship between
FA intakes and adverse health effects associated with both inadequate and excess intakes. Animal-
derived data play an important role in the elucidation of the specific mechanisms of action linked
to FA intakes. Evidence derived from these studies can inform the U-shaped nutritional risk
assessment curve. Nutritional risk assessments are important for establishing guidelines on safe
nutrient intakes upon which public health nutrition policies are based.
Our ability to accurately and transparently perform nutritional risk assessment is based on
both the quantity and quality of available data. As seen in our study, multiple health effects and
their relationships to folate status have been investigated using mouse models. The dietary
intervention and how it is applied will also influence the outcome of these investigations. One of
the surprising findings of our scoping review was the number of studies that used a closed formula

114
diet (39.7%) as their base diets. Unlike open-formula diets, closed-formula diets or “standard
rodent chow” can vary significantly in formulation without notification from the manufacturer
(90,91). In fact, other than basic information such as source materials and macronutrient
proportions, little is often known about their composition. Simple differences such as changing the
geographic source of the ingredients can introduce variation that may contribute to total nutrient
exposure and confounding thereby limiting their reproducibility (90). To avoid these limitations ,
we strongly recommend the use of open-formula diets for dietary interventions investigating health
outcomes associated with intakes. Open-formula diets, such as the AIN-93G diet used in our dose-
response study, will limit confounding variables, improve transparency, reproducibility and
therefore give confidence to the proposed causal associations with health effects.
Additionally, important basic details such as age of the mice and the duration of the dietary
intervention should be considered when designing a study and interpreting findings. Often the age
of the mice at the start of intervention is chosen based on the intended health outcome under
investigation (e.g., older mice would be chosen for aging studies), and the rationale for the choice
of particular details should be reported. The lack of reporting of age in 14% of the studies reviewed
raises concerns on how the findings from these studies are to be interpreted and utilized when
planning further research and/or performing nutritional risk assessments. Metabolic rate,
physiological response and disease pathogenesis are animal characteristics that are age-dependent
(87). For example, in a nutritional intervention such as our own, the metabolic rate and nutrient
requirements of a growing mouse would be significantly different to that of an older mouse. In the
context of a FA dietary intervention study, growing mice would potentially require higher FA
intakes to meet their metabolic needs. This is apparent when examining the rapid decline in plasma
total folate in our mice fed lower than adequate diets early on in the study. Similarly, a rationale

115
should also be provided for the timing of exposure and the duration between exposure and outcome
assessment. Namely, if the timing/duration must be sufficient to plausibly affect a change on the
outcome. For instance, spermatogenesis takes 6-8 weeks, so studies examining male fertility
should take into account whether the timing and duration of the nutritional intervention of interest
would plausibly affect fertility parameters. Studies that investigate the effect of FA intake on
initiation and/or progression of tumors, which can take weeks to months in rodents, should report
the rationale for the proposed timing and duration of the dietary intervention. In our study, the
mice were fed their respective diets for a total of 12 weeks. We chose this duration because this
was the time it took to examine the full impact of folate, if any, on functional endpoints including
micronucleus formation in blood cells as previously reported in the literature (7). Reporting these
details in publications improves transparency and our ability to accurately repeat findings.
Furthermore, it also allows data derived from these studies to accurately inform nutritional risk
assessments.
4.1.1. Mouse sex and strain differences
Even though generic animal characteristics (i.e., sex, strain and age) were generally well
reported in 86% of studies reviewed, serious publication bias in the literature was also highlighted.
The findings from our study showed that over half (56.5%) of the non-pregnant studies were
conducted in only male mice and only male live-born offspring were studied in over a third
(37.5%) of pregnancy/offspring studies. The assumption that findings from these single-sex (in
this case, male) studies can be generalized is erroneous and has been repeatedly refuted (75,79).
The findings of our own dose-response study indicated clear and consistent sex differences across
the majority of our endpoints. Based on these findings, we recommend using both sexes to

116
investigate and validate health effects associated with folate and any other nutrient intake. This
will ensure that studies account for any sex effects that influence responses to nutritional intake.
This includes, but is not limited to differences in gonadal steroid hormones, body weight, food
consumption, tissue weights, metabolic rate, epigenetic programming and gene expression (75–
78).
Similarly, significant strain differences were observed across the majority of our endpoints.
Different mouse strains can be more or less susceptible to a nutritional intervention and/or the
development of specific health outcomes (74). C57BL/6 mice generally ate 12% more than
BALB/c mice and gained 32.7% more weight. This translated to the measured plasma total folate
concentrations. C57BL/6 mice had higher plasma folate concentrations at necropsy than BALB/c
mice. Accordingly, Hcy plateaued to baseline at a higher concentration (5.71 umol/L and 4.18
umol/L for female and male mice respectively) for C57BL/6 mice than what was observed in
BALB/c mice (4.01 umol/L and 3.88 umol/L for male and female mice respectively). With a higher
folate status, homeostasis with Hcy was achieved at a higher concentration, and therefore a lower
diet was required for elevated Hcy to be observed. These differences highlight the importance of
considering genomic diversity while investigating nutritional interventions and the importance of
reporting strain in publications. For the purpose of our dose-response study, we used only the two
most commonly used strains in folate research to determine the generalizability of our findings to
other studies
4.1.2. Biomarkers of folate deficiency
There is a need to establish biomarkers of folate intake, status and associated health effects
in animal models to facilitate comparisons between findings in mice and humans. From our
117
scoping review, the ‘control’ diets identified in articles ranged from 0 to 16 mg/kg FA with the
majority (63.9%) containing 2 mg/kg FA. However, this range often overlapped with the content
from diets considered as “deficient” or “supplemented” in other studies. Additionally, we also
showed that 41.2% of the studies reviewed did not report verifying the folate status in their mouse
models using a biomarker. This poses a challenge when associations of folate with health outcomes
are proposed solely based on the reported FA content of the diets. We propose the use of
biomarkers as indicators of FA intake and verifiers of folate status. Specifically, we propose using
elevated Hcy concentrations (i.e., ≥ 3.88 umol/L) in mouse models as an indicator of folate
deficiency, which in our study was associated with an estimated intake of ≤ 0.95 mg/kg diet.
Establishing elevated Hcy concentration as a functional marker of deficiency in mice has
multiple benefits. Primarily, it functions as an indicator of the increased risk of developing an
adverse health effect associated with folate deficiency. In both humans and mouse models,
elevated Hcy is an indicator of impaired MTR activity, limited supply of 5-methyl THF and
reduced methionine synthesis and THF recapitulation (7). Diminished subsequent nucleotide
synthesis can have dire consequences including the development of megaloblastic anemia,
induction of DNA mutation and altered genome methylation patterns (33,42,116). In humans at
the population level, Hcy concentrations increase when plasma total folate concentrations are < 10
nmol/L (122). Below this cut-off concentrations, there is an increased risk of developing adverse
effects. The use of functional biomarkers of deficiency associated with a health effect has benefits.
Used as a deficiency biomarker, it can be used to validate proposed health claims related to low
FA intakes/folate status. It can also be used to harmonize and standardize the use of the term
“deficiency” in mouse studies that use a FA intervention.

118
4.1.3. Biomarkers of Over Supplementation
The total FA intake among the Canadian population, and more specifically women of
childbearing age via food fortification and prenatal supplementation, in addition to the naturally
occurring folates in our diets, has raised concerns over the potential for adverse health effects due
to high intakes. Multiple health effects have been hypothesised including promoting the
progression of existing tumors, increased DNA mutations, and reducing NK cell cytotoxicity
(10,44). However, a definition for “high intake” has yet to be established.
Furthermore, the UL of 1000 ug of FA/day recommended is based on the concern of vitamin
B12 masking with FA supplementation. Vitamin B12-deficiency, which results in impaired MTR
activity and low THF production, is usually clinically diagnosed with the appearance of
megaloblastic anemia. Because FA is reduced to THF by the enzyme DHFR, its consumption can
bypass this methyl trap and treat megaloblastic anemia. However, other vitamin B12 related
pathologies, namely neurodegeneration, are not rectified by FA and can progress and possibly even
exacerbated (6,42). Left untreated, vitamin B12-deficiency can lead to irreversible neurological
degeneration and cognitive decline (6). Nonetheless, this value does not reflect an adverse health
effect specifically associated with high folate intake. Even though generalized, this UL does not
necessarily apply to individuals with no vitamin B12-deficiency.
Similarly, it is not clear what level of dietary FA should be considered high in mouse models.
Our review of the literature showed a broad range of FA content considered as “supplemented”.
Ranging from 0.17 to 60 mg/kg of FA, this range markedly overlapped with diets defined as
“control” (0 to 16 mg/kg of FA). We propose the use of elevated unmetabolized FA (UMFA) as a
biomarker of high folate intake. Although elevated UMFA has not been definitively associated
with a specific adverse outcome, it does represent a FA exposure that is likely supraphysiological.

119
Previous studies have shown that high FA intakes can oversaturate the DHFR enzyme and result
in the appearance of UMFA in plasma and tissues (113). Furthermore, increased DHF
concentrations due to high FA intakes have also been hypothesised to have an inhibitory effect on
TS and MTHFR (49,105). In our mouse models, we found that the concentration of UMFA
significantly increased above 7.71 nmol/L (range: 7.71 nmol/L – 20.75 nmol/L) when our mouse
models consumed diets with FA content ≥ 1.00 mg/kg (range: 1.00 – 1.87 mg/kg). We currently
do not have a human-equivalent value correlated with a significant UMFA concentration increase
in plasma, as its concentration remains fairly low even among women consuming prenatal
supplements. However, two Canadian pregnancy cohort studies revealed ubiqutous unmetabolized
FA in circulation (125) and a recent study among women consuming very high dose FA
supplements (4-5 mg) demonstrated that at this intakes UMFA is higher compared to women
consuming lower doses (126). With a defined upper cut-off value, researchers are in a better
position to investigate various health effects associated with supraphysiological UMFA
concentration and therefore high FA intakes. In animal models, such as the mice used in our study,
it will also allow us to further investigate the causal mechanisms of actions related to elevated
UMFA concentrations in circulation due to high FA intakes.
4.2. Strengths and limitations
One of the main strengths of this study was our ability to use multiple FA diets in our dietary
intervention. Informed by the findings of our scoping review, we were able to encompass most of
the diets investigated in the literature. Additionally, our study design also allowed us to take blood
samples over the course of the intervention which enabled us to follow the progressive effect of
chronic FA intake for each of the diets. Our use of both sexes and the two most commonly used

120
mouse strains used in folate research (also identified in the scoping review) highlights the
consistent sex and strain effect of FA intake on various endpoints and improves the generalizability
of our findings.
Additionally, we also used different analytical methods to evaluate FA intake and status. These
analytical methods included the L. casei microbiological assay, LC-MS/MS, complete blood
counts and micronucleus detection by flow cytometry. This allowed us to investigate
simultaneously multiple biomarkers of folate intake, status and functional mechanisms. Plasma
total folate concentration was used as our main biomarker of FA intake, as it is a marker of recent
exposure. We also investigated different folate forms using LC-MS/MS, an analysis that has only
been performed in mice in a handful of studies. This allowed us to examine the different folate
forms in circulation and their response to different levels of intake.
On the other hand, the use of plasma total folate concentrations as a biomarker of FA intake
has its limitations. Hemolyzed plasma samples could result in inflated total folate concentrations
due to folate released from RBCs (7,11).
Our scoping review only focused on a limited number of generic (i.e., sex, strain, age) and
nutritional specific item (i.e., base diet composition, intervention doses, duration, and exposure
verification). This is likely an underestimation of the underreporting of important study design
details in nutrition studies, ranging from housing to statistical analysis. We also only reviewed
major strain types reported in the studies identified in the review. A limitation of this is that even
though substrains can be genetically and phenotypically distinct, they were grouped together to
streamline our results (86). As a result, the biodiversity of mouse models used in the folate research
is likely underestimated in this study. A next step would be to validate the proposed reporting
121
criteria against the studies included in this scoping review. Finally, the scoping review was limited
to only a 10-year period so does not reflect the totality of reporting in FA-related research in mice.
4.2. Future directions
Red blood cell total folate concentration is an important biomarker used for assessing long
term folate status. At the population level, the WHO recommends a minimum RBC folate
concentration of 226.5 nmol/L (100 ng/mL) to prevent the development of megaloblastic anaemia
and a concentration of 906 nmol/L (400 ng/mL) for maximal protection against NTDs (41). As a
next step, we will evaluate RBC folate status to determine the FA dose at which tissue saturation
is reached and concentrations plateau. Correlated with the increased concentration of
unmetabolized folate in circulation, this data would further inform the upper limit cut-off value of
folate intake. Additionally, since RBC folate represents long-term folate status, analysis of RBC
concentrations across time can also help us determine when saturation occurs.
Furthermore, we will also measure folate vitamers by LC-MS/MS in liver to determine the
dose at which UMFA is measurable in tissues. In humans, UMFA does not accumulate in tissues
to an appreciable degree, so it is important to determine whether it does in mice at the doses we
have used in our study. Such analysis could also be used to inform sex and strain differences
observed in our mouse models.
4.3.Conclusion
Our ability to perform accurate and efficient nutritional risk assessments for folic acid depends
on the quality and relevance of the available evidence. The findings outlined in this thesis shows
that more work is needed to improve the reporting frequency of key generic and nutritional specific
items in basic nutrition mouse-based publications. We recommend the use and requirement of

122
reporting guidelines to improve the reporting quality of nutrition research, and specifically animal-
based research publications. We have also identified candidate biomarkers, namely homocysteine
and UMFA, to use in future studies to determine inadequate and excessive exposure to FA. These
biomarkers can be used to harmonized proposed health effects associated with varying FA intakes.

123
REFERENCES
1. Fox JT, Stover PJ. Chapter 1 Folate‐Mediated One‐Carbon Metabolism. In: Vitamins & Hormones [Internet]. Elsevier; 2008 [cited 2019 Dec 1]. p. 1–44. Available from:
https://linkinghub.elsevier.com/retrieve/pii/S0083672908004019
2. Devi R, Arcot J, Sotheeswaran S, Ali S. Folate contents of some selected Fijian foods using tri-enzyme extraction method. Food Chem. 2008 Feb 1;106(3):1100–4.
3. Fajardo V, Alonso-Aperte E, Varela-Moreiras G. Lack of data on folate in convenience
foods: Should ready-to-eat products be considered relevant for folate intake? The European challenge | Elsevier Enhanced Reader [Internet]. 2012 [cited 2019 Dec 1]. Available from: https://reader.elsevier.com/reader/sd/pii/S0889157512001305?token=EBADD3A6E396B
C8CC0CDA9851D944C40FB0E431EDCD2F9429E0F57309B2A81E237353E1FFFABFF7BF065BB9DE335DC46
4. Zhao R, Matherly LH, Goldman ID. Membrane transporters and folate homeostasis: intestinal absorption and transport into systemic compartments and tissues. Expert Rev
Mol Med [Internet]. 2009 Jan [cited 2019 Dec 1];11. Available from: https://www.cambridge.org/core/journals/expert-reviews-in-molecular-medicine/article/membrane-transporters-and-folate-homeostasis-intestinal-absorption-and-transport-into-systemic-compartments-and-
tissues/F1DABF935BC3A5D9D6811B91F3E2E585
5. Lawrence JM, Bpetitti D, Watkins M, Umekubo MA. Trends in serum folate after food fortification. The Lancet. 1999 Sep 11;354(9182):915–6.
6. Stover PJ. Physiology of Folate and Vitamin B 12 in Health and Disease. Nutr Rev. 2004
Jun;62:S3–12.
7. Bailey LB, editor. Folate in health and disease. 2nd ed. Boca Raton: Taylor & Francis; 2010. 583 p.
8. Stover PJ. One-Carbon Metabolism–Genome Interactions in Folate-Associated Pathologies.
J Nutr. 2009 Dec;139(12):2402–5.
9. MacFarlane AJ, Perry CA, Girnary HH, Gao D, Allen RH, Stabler SP, et al. Mthfd1 Is an Essential Gene in Mice and Alters Biomarkers of Impaired One-carbon Metabolism. J Biol Chem. 2009 Jan 16;284(3):1533–9.
10. Crider KS, Yang TP, Berry RJ, Bailey LB. Folate and DNA Methylation: A Review of Molecular Mechanisms and the Evidence for Folate’s Role2. Adv Nutr. 2012 Jan 5;3(1):21–38.
11. Bailey LB, Stover PJ, McNulty H, Fenech MF, Gregory JF, Mills JL, et al. Biomarkers of
Nutrition for Development—Folate Review12345. J Nutr. 2015 Jul;145(7):1636S-1680S.

124
12. Flores A, Vellozzi C, Valencia D, Sniezek J. Global Burden of Neural Tube Defects, Risk Factors, and Prevention. Indian J Community Health. 2014 Nov;26(Suppl 1):3–5.
13. Genetics C on. Folic Acid for the Prevention of Neural Tube Defects. Pediatrics. 1999 Aug
1;104(2):325–7.
14. Honein MA, Paulozzi LJ, Mathews TJ, Erickson JD, Wong L-YC. Impact of Folic Acid Fortification of the US Food Supply on the Occurrence of Neural Tube Defects. JAMA. 2001 Jun 20;285(23):2981–6.
15. Centers for Disease Control. Recommendations for the Use of Folic Acid to Reduce the Number of Cases of Spina Bifida and Other Neural Tube Defects [Internet]. MMWR. 1992 [cited 2019 Dec 1]. Available from: https://www.cdc.gov/mmwr/preview/mmwrhtml/00019479.htm
16. Greene NDE, Copp AJ. Neural Tube Defects. Annu Rev Neurosci. 2014;37(1):221–42.
17. Prevention of neural tube defects: results of the Medical Research Council Vitamin Study. MRC Vitamin Study Research Group. Lancet Lond Engl. 1991 Jul 20;338(8760):131–7.
18. Czeizel AE, Dudás I. Prevention of the first occurrence of neural-tube defects by
periconceptional vitamin supplementation. N Engl J Med. 1992 Dec 24;327(26):1832–5.
19. Berry RJ, Li Z, Erickson JD, Li S, Moore CA, Wang H, et al. Prevention of Neural-Tube Defects with Folic Acid in China. N Engl J Med. 1999 Nov 11;341(20):1485–90.
20. Hibbard E, Smithells RW. FOLIC ACID METABOLISM AND HUMAN
EMBRYOPATHY. The Lancet. 1965 Jun 12;285(7398):1254.
21. Health Canada. Canada Gazette, Part II. Regulatory impact analysis statement. Bur Food Regul Aff. 1998;132(24):3029–33.
22. De Wals P, Tairou F, Van Allen MI, Uh S-H, Lowry RB, Sibbald B, et al. Reduction in
neural-tube defects after folic acid fortification in Canada. N Engl J Med. 2007 Jul 12;357(2):135–42.
23. Pieroth R, Paver S, Day S, Lammersfeld C. Folate and Its Impact on Cancer Risk. Curr Nutr Rep. 2018;7(3):70–84.
24. Beck WS. Diagnosis of Megaloblastic Anemia. Annu Rev Med. 1991;42:311–22.
25. Castellanos-Sinco HB, Ramos-Peñafiel CO, Santoyo-Sánchez A, Collazo-Jaloma J, Martínez-Murillo C, Montaño-Figueroa E, et al. Megaloblastic anaemia: Folic acid and vitamin B12 metabolism. Rev Médica Hosp Gen México. 2015 Jul 1;78(3):135–43.
26. Aslinia F, Mazza JJ, Yale SH. Megaloblastic Anemia and Other Causes of Macrocytosis. Clin Med Res. 2006 Jan 9;4(3):236–41.

125
27. Johnston RB. Will Increasing Folic Acid in Fortified Grain Products Further Reduce Neural Tube Defects without Causing Harm?: Consideration of the Evidence. Pediatr Res. 2008 Jan;63(1):2–8.
28. Azad MdAK, Huang P, Liu G, Ren W, Teklebrh T, Yan W, et al. Hyperhomocysteinemia and cardiovascular disease in animal model. Amino Acids. 2018 Jan 1;50(1):3–9.
29. Luchsinger JA, Tang M-X, Miller J, Green R, Mayeux R. Relation of Higher Folate Intake to Lower Risk of Alzheimer Disease in the Elderly. Arch Neurol. 2007 Jan 1;64(1):86.
30. Jackson IM, Doig WB, McDonald G. Pernicious anaemia as a cause of infertility. Lancet Lond Engl. 1967 Dec 2;2(7527):1159–60.
31. Canadian Cancer Statistics Advisory Committee. Canadian Cancer Statistics: A 2020 special report on lung cancer [Internet]. Toronto, Ont.: Canadian Cancer Society; 2020
[cited 2021 Mar 15]. Available from: https://www.cancer.ca/~/media/cancer.ca/CW/cancer%20information/cancer%20101/Canadian%20cancer%20statistics/Canadian-cancer-statistics-2020_special-report_EN.pdf?la=en
32. Canadian Cancer Society. Canadian Cancer Statistics 2019 [Internet]. Toronto, Ont.: Canadian Cancer Society; 2019 [cited 2021 Mar 16]. Available from: https://www.cancer.ca/~/media/cancer.ca/CW/publications/Canadian%20Cancer%20Statistics/Canadian-Cancer-Statistics-2019-EN.pdf
33. Lévesque N, Leclerc D, Rozen R. Folate and Epigenetics: Colorectal Cancer Risk and Detection. In: Patel VB, Preedy VR, editors. Handbook of Nutrition, Diet, and Epigenetics [Internet]. Cham: Springer International Publishing; 2019 [cited 2021 Mar 16]. p. 61–78. Available from: https://doi.org/10.1007/978-3-319-55530-0_93
34. Kim Y-I. Folate and carcinogenesis: evidence, mechanisms, and implications. J Nutr Biochem. 1999 Feb 1;10(2):66–88.
35. Suitor CW, Yaktine A, Oria M. Nutritional Risk Assessment: Perspectives, Methods, and Data Challenges, Workshop Summary [Internet]. Washington, D.C.: National Academies
Press; 2007 [cited 2020 Mar 30]. Available from: http://www.nap.edu/catalog/11940
36. Richardson DP. Risk Analysis Approaches for Establishing Maximum Levels of Essential Nutrients in Fortified Foods and Food (Dietary) Supplements. In: Town WG, Currano JN, editors. Science and the Law: How the Communication of Science Affects Policy
Development in the Environment, Food, Health, and Transport Sectors [Internet]. Washington, DC: American Chemical Society; 2015 [cited 2020 Apr 5]. p. 153–73. (American Chemical Society, editor. ACS Symposium Series; vol. 1207). Available from: https://pubs.acs.org/doi/10.1021/bk-2015-1207.ch009
37. Dwyer JT, Woteki C, Bailey R, Britten P, Carriquiry A, Gaine PC, et al. Fortification: new findings and implications. Nutr Rev. 2014 Feb;72(2):127–41.
126
38. Byford T. Principles for modelling dose-response for the risk assessment of chemicals. Int J Environ Stud. 2014 May 30;1–2.
39. IOM. How Should the Recommended Dietary Allowances Be Revised? [Internet].
Washington, DC: National Academy Press.; 1994 [cited 2021 May 4]. (Food and Nutrition Board). Available from: https://www.nal.usda.gov/sites/default/files/fnic_uploads//How_Should_RDAs_Be_Revised.pdf
40. Institute of Medicine (U.S.), Standing Committee on the Scientific Evaluation of Dietary Reference Intakes, Institute of Medicine (U.S.), Panel on Folate OBV and Choline, Institute of Medicine (U.S.), Subcommittee on Upper Reference Levels of Nutrients. Dietary Reference Intakes for Thiamin, Riboflavin, Niacin, Vitamin B6, Folate, Vitamin
B12, Pantothenic Acid, Biotin, and Choline. National Academies Press; 1998.
41. World Health Organization, Nutrition for Health and Development. Guideline: Optimal Serum and Red Blood Cell Folate Concentrations in Women of Reproductive Age for Prevention of Neural Tube Defects [Internet]. 2015 [cited 2020 Jun 7]. Available from:
http://www.ncbi.nlm.nih.gov/books/NBK294192/
42. Yates AA, Schlicker SA, Suitor CW. Dietary Reference Intakes: the new basis for recommendations for calcium and related nutrients, B vitamins, and choline. J Am Diet Assoc. 1998 Jun;98(6):699–706.
43. Sauberlich HE, Kretsch MJ, Skala JH, Johnson HL, Taylor PC. Folate requirement and metabolism in nonpregnant women. Am J Clin Nutr. 1987 Dec 1;46(6):1016–28.
44. Troen AM, Mitchell B, Sorensen B, Wener MH, Johnston A, Wood B, et al. Unmetabolized Folic Acid in Plasma Is Associated with Reduced Natural Killer Cell Cytotoxicity among
Postmenopausal Women. J Nutr. 2006 Jan 1;136(1):189–94.
45. Bailey SW, Ayling JE. The extremely slow and variable activity of dihydrofolate reductase in human liver and its implications for high folic acid intake. Proc Natl Acad Sci. 2009 Sep 8;106(36):15424–9.
46. Stover PJ, Field MS. Trafficking of intracellular folates. Adv Nutr Bethesda Md. 2011 Jul;2(4):325–31.
47. Sharma V, Gupta S, Verma M. Dihydropyrimidine dehydrogenase in the metabolism of the anticancer drugs. Cancer Chemother Pharmacol. 2019 Dec 1;84.
48. Matthews RG, Baugh CM. Interactions of pig liver methylenetetrahydrofolate reductase with methylenetetrahydropteroylpolyglutamate substrates and with dihydropteroylpolyglutamate inhibitors. Biochemistry. 1980 May 13;19(10):2040–5.
49. Smith AD, Kim Y-I, Refsum H. Is folic acid good for everyone? Am J Clin Nutr. 2008 Mar
1;87(3):517–33.

127
50. Lamers Y, MacFarlane AJ, O’Connor DL, Fontaine-Bisson B. Periconceptional intake of folic acid among low-risk women in Canada: summary of a workshop aiming to align prenatal folic acid supplement composition with current expert guidelines. Am J Clin
Nutr. 2018 Dec 1;108(6):1357–68.
51. Collins AR, Black DT, Waldren CA. Aberrant DNA repair and enhanced mutagenesis following mutagen treatment of Chinese hamster Ade−C cells in a state of purine deprivation. Mutat Res Repair Rep. 1988 Mar 1;193(2):145–55.
52. Kondo M, Yamaoka T, Honda S, Miwa Y, Katashima R, Moritani M, et al. The rate of cell growth is regulated by purine biosynthesis via ATP production and G(1) to S phase transition. J Biochem (Tokyo). 2000 Jul;128(1):57–64.
53. Robertson AB, Klungland A, Rognes T, Leiros I. DNA repair in mammalian cells: Base
excision repair: the long and short of it. Cell Mol Life Sci CMLS. 2009 Mar;66(6):981–93.
54. Berger SH, Pittman DL, Wyatt MD. Uracil in DNA: consequences for carcinogenesis and chemotherapy. Biochem Pharmacol. 2008 Sep 15;76(6):697–706.
55. Lee JY, Lee T-H. Effects of DNA methylation on the structure of nucleosomes. J Am Chem Soc. 2012 Jan 11;134(1):173–5.
56. Barré-Sinoussi F, Montagutelli X. Animal models are essential to biological research: issues and perspectives. Future Sci OA [Internet]. 2015 Nov 1 [cited 2019 Dec 5];1(4).
Available from: https://www.ncbi.nlm.nih.gov/pmc/articles/PMC5137861/
57. Barré-Sinoussi F, Montagutelli X. Animal models are essential to biological research: issues and perspectives. Future Sci OA [Internet]. 2015 Nov 1 [cited 2019 Dec 2];1(4). Available from: https://www.ncbi.nlm.nih.gov/pmc/articles/PMC5137861/
58. Perlman RL. Mouse models of human diseaseAn evolutionary perspective. Evol Med Public Health. 2016 Jan 1;2016(1):170–6.
59. Alfaro V. Specification of laboratory animal use in scientific articles: Current low detail in the journals’ instructions for authors and some proposals. Methods Find Exp Clin
Pharmacol. 2005;27(7):495.
60. Ellery AW. Guidelines for specification of animals and husbandry methods when reporting the results of animal experiments. Lab Anim. 1985 Apr 1;19(2):106–8.
61. Landis SC, Amara SG, Asadullah K, Austin CP, Blumenstein R, Bradley EW, et al. A call
for transparent reporting to optimize the predictive value of preclinical research. Nature. 2012 Oct;490(7419):187–91.
62. Gulin JEN, Rocco DM, García-Bournissen F, Burleigh BA. Quality of Reporting and Adherence to ARRIVE Guidelines in Animal Studies for Chagas Disease Preclinical Drug
Research: A Systematic Review. In: PLoS neglected tropical diseases. 2015.

128
63. Kilkenny C, Parsons N, Kadyszewski E, Festing MFW, Cuthill IC, Fry D, et al. Survey of the Quality of Experimental Design, Statistical Analysis and Reporting of Research Using Animals. PLoS ONE. 2009;4(11):11.
64. Obrink KJ, Rehbinder C. Animal definition: a necessity for the validity of animal experiments? Lab Anim. 2000 Apr 1;34(2):121–30.
65. Dwan K, Gamble C, Williamson PR, Kirkham JJ. Systematic Review of the Empirical Evidence of Study Publication Bias and Outcome Reporting Bias — An Updated Review.
PLoS ONE [Internet]. 2013 Jul 5 [cited 2020 May 10];8(7). Available from: https://www.ncbi.nlm.nih.gov/pmc/articles/PMC3702538/
66. van der Worp HB, Howells DW, Sena ES, Porritt MJ, Rewell S, O’Collins V, et al. Can Animal Models of Disease Reliably Inform Human Studies? PLoS Med [Internet]. 2010
Mar 30 [cited 2020 May 3];7(3). Available from: https://www.ncbi.nlm.nih.gov/pmc/articles/PMC2846855/
67. Freedman LP, Venugopalan G, Wisman R. Reproducibility2020: Progress and priorities. F1000Research [Internet]. 2017 May 2 [cited 2020 Apr 5];6. Available from:
https://www.ncbi.nlm.nih.gov/pmc/articles/PMC5461896/
68. Kilkenny C, Browne WJ, Cuthill IC, Emerson M, Altman DG. Improving Bioscience Research Reporting: The ARRIVE Guidelines for Reporting Animal Research. PLoS Biol [Internet]. 2010 Jun [cited 2020 Apr 1];8(6). Available from:
https://journals.plos.org/plosbiology/article/file?id=10.1371/journal.pbio.1000412&type=printable
69. Tricco AC, Lillie E, Zarin W, O’Brien KK, Colquhoun H, Levac D, et al. PRISMA Extension for Scoping Reviews (PRISMA-ScR): Checklist and Explanation. Ann Intern
Med. 2018 Oct 2;169(7):467.
70. Reeves PG, Nielsen FH, Fahey GC. AIN-93 purified diets for laboratory rodents: final report of the American Institute of Nutrition ad hoc writing committee on the reformulation of the AIN-76A rodent diet. J Nutr. 1993 Nov;123(11):1939–51.
71. Reeves PG. AIN-76 Diet: Should We Change the Formulation? J Nutr. 1989 Aug 1;119(8):1081–2.
72. NIH. Quality Assurance Plan & Information on NIH Diets [Internet]. [cited 2020 Jun 14]. Available from: https://www.ors.od.nih.gov/sr/dvr/drs/nutrition/Pages/Diets.aspx
73. Percie du Sert N, Hurst V, Ahluwalia A, Alam S, Avey MT, Baker M, et al. The ARRIVE guidelines 2019: updated guidelines for reporting animal research [Internet]. Scientific Communication and Education; 2019 Jul [cited 2020 Apr 1]. Available from: http://biorxiv.org/lookup/doi/10.1101/703181
74. Fahey JR, Katoh H, Malcolm R, Perez AV. The case for genetic monitoring of mice and rats used in biomedical research. Mamm Genome. 2013 Apr 1;24(3):89–94.

129
75. Clayton JA, Collins FS. Policy: NIH to balance sex in cell and animal studies. Nat News. 2014 May 15;509(7500):282.
76. Legato MJ, Johnson PA, Manson JE. Consideration of Sex Differences in Medicine to
Improve Health Care and Patient Outcomes. JAMA. 2016 Nov 8;316(18):1865–6.
77. Reeves MJ, Bushnell CD, Howard G, Gargano JW, Duncan PW, Lynch G, et al. Sex differences in stroke: epidemiology, clinical presentation, medical care, and outcomes. Lancet Neurol. 2008 Oct 1;7(10):915–26.
78. Stevenson DK, Verter J, Fanaroff AA, Oh W, Ehrenkranz RA, Shankaran S, et al. Sex differences in outcomes of very low birthweight infants: the newborn male disadvantage. Arch Dis Child - Fetal Neonatal Ed. 2000 Nov 1;83(3):F182–5.
79. Beery AK, Zucker I. Sex bias in neuroscience and biomedical research. Neurosci Biobehav
Rev. 2011 Jan 1;35(3):565–72.
80. Yoon DY, Mansukhani NA, Stubbs VC, Helenowski IB, Woodruff TK, Kibbe MR. Sex bias exists in basic science and translational surgical research. Surgery. 2014 Sep 1;156(3):508–16.
81. Klinge I. Bringing Gender Expertise to Biomedical and Health-Related Research. Gend Med. 2007 Jan 1;4:S59–63.
82. Klinge I. Gender perspectives in European research. Pharmacol Res.; 2008. 183–189 p.
83. Doetschman T. Influence of genetic background on genetically engineered mouse
phenotypes. Methods Mol Biol Clifton NJ. 2009;530:423–33.
84. Kempermann G, Kuhn HG, Gage FH. Genetic influence on neurogenesis in the dentate gyrus of adult mice. Proc Natl Acad Sci. 1997 Sep 16;94(19):10409–14.
85. Yoshiki A, Moriwaki K. Mouse Phenome Research: Implications of Genetic Background.
ILAR J. 2006 Jan 1;47(2):94–102.
86. Fontaine DA, Davis DB. Attention to Background Strain Is Essential for Metabolic Research: C57BL/6 and the International Knockout Mouse Consortium. Diabetes. 2016 Jan 1;65(1):25–33.
87. Huang K, Rabold R, Schofield B, Mitzner W, Tankersley CG. Age-dependent changes of airway and lung parenchyma in C57BL/6J mice. J Appl Physiol. 2007 Jan 1;102(1):200–6.
88. Deerberg F. Age-associated versus husbandry-related pathology of aging rats. Neurobiol Aging. 1991 Nov 1;12(6):659–62.
89. Research NRC (US) I for LA. The Research Animal [Internet]. Guidance for the Description of Animal Research in Scientific Publications. National Academies Press

130
(US); 2011 [cited 2020 Jul 12]. Available from: https://www.ncbi.nlm.nih.gov/books/NBK84212/
90. Barnard DE, Lewis SM, Teter BB, Thigpen JE. Open- and Closed-Formula Laboratory
Animal Diets and Their Importance to Research. J Am Assoc Lab Anim Sci JAALAS. 2009 Nov;48(6):709–13.
91. Pellizzon MA, Ricci MR. Choice of Laboratory Rodent Diet May Confound Data Interpretation and Reproducibility. Curr Dev Nutr. 2020 Apr 1;4(4):nzaa031.
92. Combs GF, Trumbo PR, McKinley MC, Milner J, Studenski S, Kimura T, et al. Biomarkers in nutrition: new frontiers in research and application. Ann N Y Acad Sci. 2013 Mar;1278(1):1–10.
93. Dragsted LO, Gao Q, Praticò G, Manach C, Wishart DS, Scalbert A, et al. Dietary and
health biomarkers—time for an update. Genes Nutr. 2017 Sep 29;12(1):24.
94. Percie du Sert N, Ahluwalia A, Alam S, Avey MT, Baker M, Browne WJ, et al. Reporting animal research: Explanation and elaboration for the ARRIVE guidelines 2.0. Boutron I, editor. PLOS Biol. 2020 Jul 14;18(7):e3000411.
95. Williamson PR, Altman DG, Blazeby JM, Clarke M, Gargon E. The COMET (Core Outcome Measures in Effectiveness Trials) Initiative. Trials. 2011 Dec 13;12(1):A70.
96. Williamson PR, Altman DG, Bagley H, Barnes KL, Blazeby JM, Brookes ST, et al. The COMET Handbook: version 1.0. Trials. 2017 Jun 20;18(3):280.
97. Kroeger CM, Garza C, Lynch CJ, Myers E, Rowe S, Schneeman BO, et al. Scientific rigor and credibility in the nutrition research landscape. Am J Clin Nutr. 2018 Mar 1;107(3):484–94.
98. Garza C, Stover PJ, Ohlhorst SD, Field MS, Steinbrook R, Rowe S, et al. Best practices in
nutrition science to earn and keep the public’s trust. Am J Clin Nutr. 2019 Jan 1;109(1):225–43.
99. Frewin R. CHAPTER 27 - Biochemical aspects of anaemia. In: Marshall WJ, Lapsley M, Day AP, Ayling RM, editors. Clinical Biochemistry: Metabolic and Clinical Aspects
(Third Edition) [Internet]. Churchill Livingstone; 2014 [cited 2021 Mar 1]. p. 515–32. Available from: https://www.sciencedirect.com/science/article/pii/B9780702051401000274
100. Coşar A, İpci̇oğlu OM, Özcan Ö, Gültepe M. Folate and homocysteine metabolisms and
their roles in the biochemical basis of neuropsychiatry. Turk J Med Sci. 2014 Jan 20;44(1):1–9.
101. Lamers Y, MacFarlane AJ, O’Connor DL, Fontaine-Bisson B. Periconceptional intake of folic acid among low-risk women in Canada: summary of a workshop aiming to align

131
prenatal folic acid supplement composition with current expert guidelines. Am J Clin Nutr. 2018 Dec 1;108(6):1357–68.
102. Lm S, Rl J, Me B, Jt B. Methylation demand and homocysteine metabolism. Adv Enzyme
Regul. 2004 Jan 1;44:321–33.
103. Mayeux R. Biomarkers: Potential Uses and Limitations. NeuroRx. 2004 Apr;1(2):182–8.
104. Canadian Council on Animal Care. Guide to the care and use of experimental animals. Vol. 1. Vol. 1. Ottawa, Ont.: Canadian Council on Animal Care; 1993.
105. LeBlanc DP, Behan NA, O’Brien JM, Marchetti F, MacFarlane AJ. Folate deficiency increases chromosomal damage and mutations in hematopoietic cells in the transgenic mutamouse model. Environ Mol Mutagen. 2018;59(5):366–74.
106. Molloy AM, Scott JM. Microbiological assay for serum, plasma, and red cell folate using
cryopreserved, microtiter plate method. Methods Enzymol. 1997;281:43–53.
107. Brevik A, Vollset SE, Tell GS, Refsum H, Ueland PM, Loeken EB, et al. Plasma concentration of folate as a biomarker for the intake of fruit and vegetables: the Hordaland Homocysteine Study. Am J Clin Nutr. 2005 Feb 1;81(2):434–9.
108. Pirkle JL. Folate Forms in Serum [Internet]. CDC Environmental Health; [cited 2021 Mar 17]. Available from: https://wwwn.cdc.gov/nchs/data/nhanes/2011-2012/labmethods/FOLFMS_G_MET.PDF
109. Frankowski M, Theisen J, Kummrow A, Simon P, Ragusch H, Bock N, et al. Microflow
Cytometers with Integrated Hydrodynamic Focusing. Sensors. 2013 Apr;13(4):4674–93.
110. Karsan A, Maclaren I, Conn D, Wadsworth L. An evaluation of hemoglobin determination using sodium lauryl sulfate. Am J Clin Pathol. 1993 Aug;100(2):123–6.
111. Dertinger SD, Camphausen K, MacGregor JT, Bishop ME, Torous DK, Avlasevich S, et al.
Three-color labeling method for flow cytometric measurement of cytogenetic damage in rodent and human blood. Environ Mol Mutagen. 2004;44(5):427–35.
112. Farrell C-JL, Kirsch SH, Herrmann M. Red cell or serum folate: what to do in clinical practice? Clin Chem Lab Med. 2013 Mar 1;51(3):555–69.
113. Diaz Gonzalez S. Folate induced mutagenesis and identification of folate-specific mutation profiles in somatic cells [Internet] [Master of Science]. [Ottawa, Ontario]: Carleton University; 2019 [cited 2021 Mar 12]. Available from: https://curve.carleton.ca/899d76e1-ec42-45b0-8237-a8ea4702e3f7
114. Pentieva K, Selhub J, Paul L, Molloy AM, McNulty B, Ward M, et al. Evidence from a Randomized Trial That Exposure to Supplemental Folic Acid at Recommended Levels during Pregnancy Does Not Lead to Increased Unmetabolized Folic Acid Concentrations in Maternal or Cord Blood. J Nutr. 2016 Mar;146(3):494–500.

132
115. Kelly P, McPartlin J, Goggins M, Weir DG, Scott JM. Unmetabolized folic acid in serum: acute studies in subjects consuming fortified food and supplements. Am J Clin Nutr. 1997 Jun;65(6):1790–5.
116. WHO. Serum and red blood cell folate concentrations for assessing folate status in populations [Internet]. Geneva: World Health Organization; 2012 [cited 2021 Mar 7]. (Vitamin and Mineral Nutrition Information System). Available from: https://www.who.int/vmnis/indicators/serum_RBC_folate.pdf
117. WHO. Nutritional anaemias. Report of a WHO scientific group [Internet]. Geneva: World Health Organization; 1968 [cited 2021 Mar 7] p. No. 405. (WHO Technical Report Series). Available from: https://apps.who.int/iris/bitstream/handle/10665/40707/WHO_TRS_405.pdf;jsessionid=00
FD4B28D0D67886F8CA3641E2909054?sequence=1
118. Phonethepswath S, Bryce SM, Bemis JC, Dertinger SD. Erythrocyte-based Pig-a gene mutation assay: Demonstration of cross-species potential. Mutat Res Toxicol Environ Mutagen. 2008 Dec 8;657(2):122–6.
119. Swayne BG, Behan NA, Williams A, Stover PJ, Yauk CL, MacFarlane AJ. Supplemental Dietary Folic Acid Has No Effect on Chromosome Damage in Erythrocyte Progenitor Cells of Mice. J Nutr. 2012 May 1;142(5):813–7.
120. Cascalheira JF, Parreira MC, Viegas AN, Faria MC, Domingues FC. Serum Homocysteine:
Relationship with Circulating Levels of Cortisol and Ascorbate. Ann Nutr Metab. 2008;53(1):67–74.
121. Selhub J, Jacques PF, Dallal G, Choumenkovitch S, Rogers G. The use of Blood Concentrations of Vitamins and their Respective Functional Indicators to Define Folate
and Vitamin B12 Status. Food Nutr Bull. 2008 Jun 1;29(2_suppl1):S67–73.
122. Venn BJ, Mann JI, Williams SM, Riddell LJ, Chisholm A, Harper MJ, et al. Assessment of three levels of folic acid on serum folate and plasma homocysteine: a randomised placebo-controlled double-blind dietary intervention trial. Eur J Clin Nutr. 2002 Aug;56(8):748–
54.
123. Macfarlane A, Behan N, Matias F, Green J, Caldwell D, Brooks S. Dietary folate does not significantly affect the intestinal microbiome, inflammation or tumorigenesis in azoxymethane-dextran sodium sulphate-treated mice. Br J Nutr. 2012 Jul 5;109:1–9.
124. MacFarlane AJ, Behan NA, Matias FMG, Green J, Caldwell D, Brooks SPJ. Dietary folate does not significantly affect the intestinal microbiome, inflammation or tumorigenesis in azoxymethane–dextran sodium sulphate-treated mice. Br J Nutr. 2013 Feb;109(4):630–8.
125. Fayyaz F, Wang F, Jacobs RL, O’Connor DL, Bell RC, Field CJ, et al. Folate, vitamin B12,
and vitamin B6 status of a group of high socioeconomic status women in the Alberta Pregnancy Outcomes and Nutrition (APrON) cohort. Appl Physiol Nutr Metab. 2014 Dec;39(12):1402–8.

133
126. Murphy MS, Muldoon KA, Sheyholislami H, Behan N, Lamers Y, Rybak N, et al. Impact of high-dose folic acid supplementation in pregnancy on biomarkers of folate status and 1-carbon metabolism: An ancillary study of the Folic Acid Clinical Trial (FACT). 2020 Dec
4;11.

134
Statement of Contribution
Chapter 1: Introduction
Writing of introduction: Esther Munezero
Chapter 2: Poor reporting quality in basic nutrition research
Study design: Amanda MacFarlane
Literature search: Eva-Marie Neumann
Literature Analysis: Stephanie Diaz, Nathalie Behan and Esther Munezero
Writing of chapter: Esther Munezero
Chapter 3: Folic acid mouse dose-response
Study design: Amanda MacFarlane
Sample collection: Danielle LeBlanc, Nathalie Behan, Judy Green, Amy Hendry,
Agnieszka Bielecki, Eleonora Swist, Fernando Matias, Jeremiah Gaudet, Philip Griffin,
Gen Sheng Wang, Allie Steele and Scott Smith.
Complete blood count: Dominique
Homocysteine: Penny Jee and Marc Duciaume
Micronucleus: Dorothea Torous
Plasma Folate: Esther Munezero
Statistical Analysis : Esther Munezero
Writing of Chapter: Esther Munezero
Chapter 4: Discussion
Writing of Chapter: Esther Munezero


![Folic Acid, Dietary Patterns and Perinatal Health · 2019. 3. 9. · outcome, both synthetic folic acid intake and dietary patterns have been examined with varying results.[15-34]](https://static.fdocuments.us/doc/165x107/60138eaf643dbc05033a6fe5/folic-acid-dietary-patterns-and-perinatal-health-2019-3-9-outcome-both-synthetic.jpg)