Barrier Corrosion Protection Properties of Metakaolin Clay ...
ENGINEERING PROPERTIES OF THE
ORINOCO CLAY
by
Robert William Day
B.S.E., Villanova University (1976)M.C.E., Villanova University (1978)
SUBMITTED IN PARTIAL FULFILLMENTOF THE REQUIREMENTS FOR THE
DEGREES OF
MASTER OF SCIENCE INCIVIL ENGINEERING
and
CIVIL ENGINEER
at the
MASSACHUSETTS INSTITUTE OF TECHNOLOGY
December 1980
Robert William Day 1980
The author hereby grants to M.I.T. permission to reproduce andto distribute copies of this t-esis document in whole or in part.
Signature of Author
/ Department of ivil Engineering' ecember 15, 1980
Certified by
I CZ'les 9'%ddThps Su9 sor
Accepted by
//'KC. Allin CornellCha rman, Department Committee
ARCHIVESMASSACHUSETTS INSTITUTEOF TECHNOLOGY
APR 1 1981
LIBRARIES
2
ENGINEERING PROPERTIES OF THE
ORINOCO CLAY
by
Robert William Day
Submitted to the Department of Civil Engineering on December15, 1980 in partial fulfillment of the requirements for theDegrees of Master of Science in Civil Engineering and CivilEngineer.
ABSTRACT
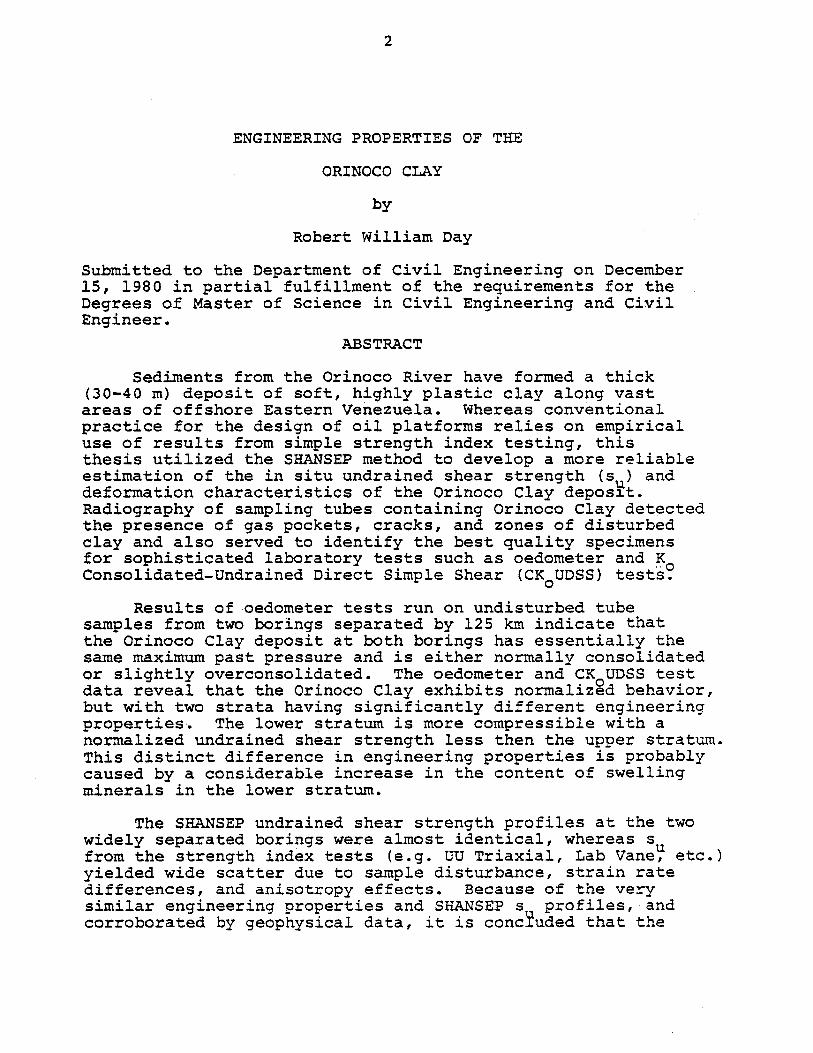
Sediments from the Orinoco River have formed a thick(30-40 m) deposit of soft, highly plastic clay along vastareas of offshore Eastern Venezuela. Whereas conventionalpractice for the design of oil platforms relies on empiricaluse of results from simple strength index testing, thisthesis utilized the SHANSEP method to develop a more reliableestimation of the in situ undrained shear strength (s )anddeformation characteristics of the Orinoco Clay deposit.Radiography of sampling tubes containing Orinoco Clay detectedthe presence of gas pockets, cracks, and zones of disturbedclay and also served to identify the best quality specimensfor sophisticated laboratory tests such as oedometer and K0Consolidated-Undrained Direct Simple Shear (CK0UDSS) tests.
Results of oedometer tests run on undisturbed tubesamples from two borings separated by 125 km indicate thatthe Orinoco Clay deposit at both borings has essentially thesame maximum past pressure and is either normally consolidatedor slightly overconsolidated. The oedometer and CK0UDSS testdata reveal that the Orinoco Clay exhibits normalized behavior,but with two strata having significantly different engineeringproperties. The lower stratum is more compressible with anormalized undrained shear strength less then the upper stratum.This distinct difference in engineering properties is probablycaused by a considerable increase in the content of swellingminerals in the lower stratum.
The SHANSEP undrained shear strength profiles at the twowidely separated borings were almost identical, whereas s ufrom the strength index tests (e.g. UU Triaxial, Lab Vane, etc.)yielded wide scatter due to sample disturbance, strain ratedifferences, and anisotropy effects. Because of the verysimilar engineering properties and SHANSEP s profiles, andcorroborated by geophysical data, it is concluded that the

3
Orinoco Clay exists as basically the same deposit aroundand between the two borings.
Thesis Supervisor:
Title
Charles C. Ladd
Professor of Civil Engineering

4
ACKNOWLEDGMENTS
I am indebted to my parents for their encouragement
in completing this thesis.
I would like to especially thank Professor Charles C.
Ladd, my thesis supervisor, for his constructive criticism
and Instituto Tecnologico Venezolano del Petroleo (INTEVEP)
for their financial aid.
My thanks also to Enrique Urdaneta Lafee and Aziz M.
Malek for their friendship and assistance in the laboratory.

5
TABLE OF CONTENTS
PAGE NO.
TITLE PAGE 1
ABSTRACT 2
ACKNOWLEDGMENTS 4
TABLE OF CONTENTS 5
LIST OF TABLES 7
LIST OF FIGURES 8
LIST OF SYMBOLS 10
CHAPTER 1. INTRODUCTION 13
1-1 ORINOCO CLAY 13
1-2 BORINGS El AND Fl 14
1-3 ORGANIZATION OF THESIS 17
CHAPTER 2. SHANSEP METHOD 22
2-1 TV, LV, AND UUC TESTS 22
2-2 SHANSEP METHOD 24
2-3 SUMMARY 27
CHAPTER 3. INDEX PROPERTIES AND COMPOSITION OF 30ORINOCO CLAY
3-1 UNDRAINED SHEAR STRENGTH FROM STRENGTH INDEXTESTS: TV, LV, AND UUC
3-2 INDEX PROPERTIES: NATURAL WATER CONTENT 32
3-3 INDEX PROPERTIES: ATTERBERG LIMITS 32
3-4 IN SITU VERTICAL EFFECTIVE STRESS 33
3-5 COMPOSITION ANALYSES: MINERALOGY 34
3-6 SALT CONCENTRATION AND ORGANIC MATTER 35
3-7 SUMMARY 36

6
PAGE NO.
CHAPTER 4. RADIOGRAPHY
4-1 INTRODUCTION: X-RAYS
4-2 DESCRIPTION OF M.I.T.'s RADIOGRAPH FACILITY
4-3 RADIOGRAPHY OF SAMPLING TUBES CONTAININGORINOCO CLAY
4-4 SUMMARY
CHAPTER 5. STRESS HISTORY AND CONSOLIDATION PROPERTIES
5-1 INTRODUCTION: TEST PROCEDURES FOR OEDOMETERTESTS
5-2 EFFECTS OF SAMPLE DISTURBANCE
5-3 STRESS HISTORY
5-4 COMPRESSIBILITY AND COEFFICIENT OFCONSOLIDATION
5-5 EMPIRICAL CORRELATIONS
5-6 SUMMARY
45
45
46
48
52
60
60
62
65
66
68
68
CHAPTER 6. NORMALIZED SOIL PROPERTIES AND SHANSEPSTRENGTH PROFILES
6-1 NSP FROM NORMALLY CONSOLIDATED CK UDSSTESTS
6-2 OVERCONSOLIDATED CK0UDSS TEST DATA
6-3 ANISOTROPY
6-4 SHANSEP STRENGTH PROFILES
CHAPTER 7. SUMMARY AND CONCLUSIONS
REFERENCES
APPENDIX A. CONSOLIDATION TESTS
APPENDIX B. CK0UDSS TESTS
APPENDIX C. CK UC AND CK UE TESTS
77
77
82
83
85
101
107
109
122
138

7
LIST OF TABLES
TABLE
1-1
1-2
2-1
3-1.
3-2
3-3
5-1
5-2
6-1
6-2
6-3
TITLE
SAMPLE LOCATION, TYPE AND PRINCIPAL TESTS:BORING El
SAMPLE LOCATION, TYPE AND PRINCIPAL TESTS:BORING Fl
SHANSEP APPROACH
UNIT WEIGHTS AND EFFECTIVE STRESS
CLAY MINERALOGY SUMMARY FOR BORING Fl
CLAY MINERALOGY SUMMARY FOR BORING El
SUMMARY OF OEDOMETER TEST DATA: BORING El
SUMMARY OF OEDOMETER TEST DATA: BORING Fl
SUMMARY OF CK UDSS TEST DATA: N.C. ORINOCOCLAY
SUMMARY OF CK UDSS TEST DATA: O.C. ORINOCOCLAY
SUMMARY OF CK U TRIAXIAL TESTS: N.C. ORINOCOCLAY
ENGINEERING PROPERTIES OF THE ORINOCO CLAY
PAGE NO.
19
20
28
37
38
39
69
70
90
91
92
7-1 106

8
LIST OF FIGURES
FIGURE .TIE PAGE NO.
1-1 BORING LOCATIONS 21
2-1 APPLICATION OF SHANSEP TO UNDRAINED STABILITY 29ANALYSIS USING CK U DIRECT SIMPLE SHEAR TESTS
3-1 NATURAL WATER CONTENT AND STRENGTH INDEX 40TESTS: BORING El
3-2 NATURAL WATER CONTENT AND STRENGTH INDEX 41TESTS: BORING Fl
3-3 EFFECTS OF DISTURBANCE AND STRAIN RATE ON 42TORVANE DATA: SAMPLE F1557 4
3-4 PLASTICITY CHART: ORINOCO CLAY 43
3-5 SALT CONCENTRATION AND ORGANIC MATTER: 44ORINOCO CLAY
4-1 RADIOGRAPHY OF A SAMPLING TUBE CONTAINING 54ORINOCO CLAY
4-2 OEDOMETER AND STRENGTH DATA ON SAMPLE 55FlS57 FOR COMPARISON WITH RADIOGRAPH
4-3 SAMPLE F1557: RADIOGRAPH PRINT SHOWING 56SAMPLE DISTURBANCE
4-4 SAMPLE E1512: RADIOGRAPH PRINT SHOWING 57GAS POCKETS
4-5 SAMPLE ElS21: RADIOGRAPH PRINT SHOWING 58HORIZONTAL CRACKS
5-1 EFFECTS OF DISTURBANCE ON OEDOMETER TEST 71DATA: SAMPLE F1557
5-2 OEDOMETER TEST DISTURBANCE INDICES: 72ORINOCO CLAY
5-3 STRESS HISTORY: ORINOCO CLAY 73
5-4 COMPRESSIBILITY AND COEFFICIENT OF 74CONSOLIDATION: ORINOCO CLAY

9
FIGURE -TIE PAGE NO.
5-5 EMPIRICAL CORRELATIONS WITH NATURAL WATER 75CONTENT: ORINOCO CLAY
5-6 EMPIRICAL CORRELATIONS WITH LIQUID LIMIT: 76ORINOCO CLAY
6-1 CK UDSS TEST DISTURBANCE INDICES: ORINOCOCIAY 93
6-2 NORMALIZED STRESS PATHS FROM CK 0UDSS TESTS:N.C. ORINOCO CLAY
6-3 NORMALIZED STRESS VERSUS STRAIN FROM CK0UDSS 95TESTS: N.C. ORINOCO CLAY
6-4 NORMALIZED UNDRAINEDCMODULUS FOR CK 0UDSS 96TESTS: N.C. ORINOCO CLAY0
6-5 s lavc VERSUS PI FOR NORMALLY CONSOLIDATED 97CL AND CH CLAYS
6-6 EFFECT OF OCR ON s /avc 98
6-7 COMPARISON OF UNDRAINED STRENGTH DATA: 99BORING El
6-8 COMPARISON OF UNDRAINED STRENGTH DATA: 100BORING Fl
10
LIST OF SYMBOLS
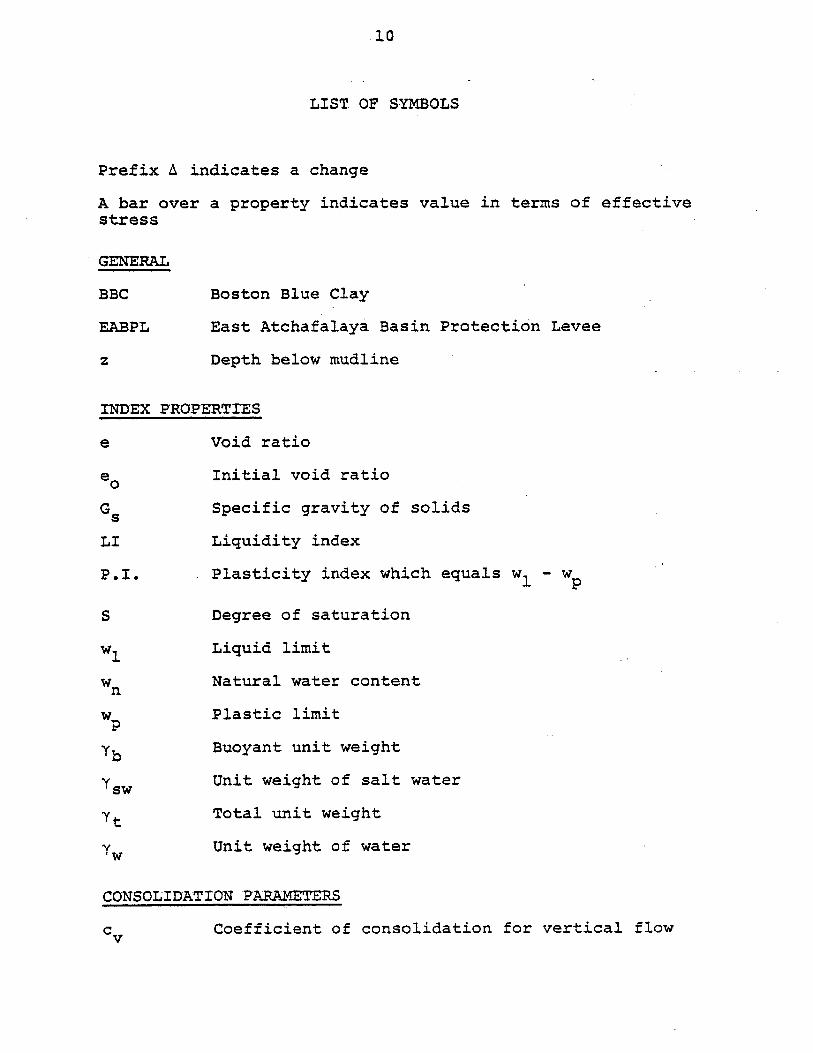
Prefix A indicates a change
A bar over a property indicates value in terms of effectivestress
GENERAL
BBC Boston Blue Clay
EABPL East Atchafalaya Basin Protection Levee
z Depth below mudline
INDEX PROPERTIES
e Void ratio
e Initial void ratio
G s Specific gravity of solids
LI Liquidity index
P.I. Plasticity index which equals w1 - w
S Degree of saturation
w Liquid limit
w Natural water contentn
w Plastic limitp
Yb Buoyant unit weight
Ysw Unit weight of salt water
Yt Total unit weight
Yw Unit weight of water
CONSOLIDATION PARAMETERS
cv Coefficient of consolidation for vertical flow

11
C Virgin compression index = -Ae/Aloga
Cs Swelling index
Ca Rate of secondary compression = Ae /Alog t
CR Virgin compression ratio = Av /Aloga
K 0ho vo, the in situ lateral stress ratio forone-dimensional vertical strainduring deposition
OCR Overconsolidation ratio = a or a /lvc
RR Recompression Ratio
SR Swelling ratio
t Time
t Consolidation time for preshear a vc
E: Vertical strain
avc Vertical consolidation stress
av In situ vertical effective stress
av Maximum past pressure
STRENGTH AND DEFORMATION PARAMETERS
E Young's modulus
E Undrained secant Eu
E5 0 Eu half way to failure
s uUndrained shear strength
s /W Normalized undrained shear strength where a isSvc the consolidation vertical effective stress priorto undrained shearing (applicable for CKQU strengthtests)
Angle of rotation of the principal stress duringshearing for a CK0U strength test
Shear strain
12
y Shear strain needed to reach s
Vertical effective stress during shearing(Direct Simple Shear test)
T h Shear stress on horizontal plane during shearing(Direct Simple Shear test)
Slope of Mohr-Coulomb failure envelope
CONSOLIDATION AND STRENGTH TESTS
CK0 U K0 Consolidated Undrained shear test
CK UC CK U Triaxial Compression test
CK0 UDSS CK U Direct Simple Shear test
CK UE CK U Triaxial Extension test
LV Lab Vane
Oed Oedometer test
TV Torvane test
UUC Unconsolidated Undrained Triaxial Compressiontest

13
1. INTRODUCTION
Laboratory soil tests were performed to determine
the engineering properties of the offshore Orinoco Clay
deposit and the objective of this thesis is to present the
results of those tests. The SHANSEP method is utilized to
obtain normalized soil properties and the undrained shear
strength profiles at two widely separated borings off the
coast of Eastern Venezuela. The-engineering properties
of the Orinoco Clay are needed for the design of oil plat-
forms.
1-1 ORINOCO CLAY
Transgression is defined as a rise in sea level rela-
tive to the land which causes areas to be submerged and
new deposition to begin in that region. In the past
fifteen thousand years, sea level has risen about 100
meters caused by the termination of an ice age and melting
of glaciers. In Venezuela, transgression produced a wider
continental shelf upon which the Orinoco Clay has been
deposited.
The Orinoco River (see Fig. 1-1) has a length of 2500
kilometers and transports an estimated sediment load of
108 tons/year (Butenko and Hedberg, 1980). The river
deposits most of it's granular soil inland, while the
suspended clay particles are carried into the Atlantic

14
Ocean. Salt water causes these particles to flocculate
and then the flocs settle to the sea floor. For the past
fifteen thousand years, clay deposition has produced a
vast and thick "mud wedge", extending up to 60 to 100
kilometers from the shoreline for a distance of about 450
kilometers along the continental shelf, with a maximum
thickness of 50 to 70 meters. The swift longshore Guyana
Current also transports some of the suspended flocs towards
the West where deposition occurs in the placid waters of
the semienclosed Gulf of Paria (Fig. 1-1). This offshore
clay deposit composed of sediments derived from the Orinoco
River has been termed the Orinoco Clay
1-2 BORINGS El AND Fl
Jackup exploration and oil production platforms will
be constructed in the Atlantic Ocean within the Orinoco
River delta and in the Gulf of Paria. The Orinoco Clay
deposit will totally support the jackup platforms and to
determine their stability to ocean waves, winds, and plat-
form dead and live loads, the undrained stress-strain-
strength and consolidation properties of the deposit must
be determined. For the oil production platforms, tubular
steel piles will be driven through the Orinoco Clay deposit
and into the stronger underlying dense sand and stiff clay
strata. The oil production platforms will not rely upon

15
the Orinoco Clay to support axial loads, but the clay
deposit must resist lateral pile deformations due to
horizontal loads from wind and waves acting upon the oil
platforms. In order to determine the resistance of the
Orinoco Clay to lateral pile deformations, the undrained
shear strength (su) and the stress-strain characteristics
(e.g. Young's moduli, E ) of the clay deposit must beu
ascertained. Borings El and Fl (Fig. 1-1) were drilled to
obtain Orinoco Clay for laboratory soil tests. The water
depth and thickness of the Orinoco Clay deposit at each
boring are presented below:
-Boring Water Depth (f t) Deposit Thickness (f t)
El 86 149
Fl 78 134
Orinoco Clay was sampled using cylindrical thin-
walled stainless steel tubes. The sampling tubes were
two to three feet long and 0.1 inch thick with an outside
diameter of 3 inches. Two processes were utilized to
penetrate the sampling tubes into the clay. At the top
40 to 60 feet of the deposit, the tubes were hammered into
the soil. At greater depths, Orinoco Clay was obtained
by using Fugro's "WIP" sampling equipment which consists
of pushing the sampling tube into the soil at a constant
velocity of about 0.8 inch per second (Fugro, 1979).
After the tube samples were hoisted onboard the Fugro

16
drilling ship, some of the clay was used to classify the
soil and to estimate the undrained shear strength by*
performing Lab Vane (LV), Torvane (TV), and Unconsolidated
Undrained Triaxial Compression (UUC) tests. The remaining
Orinoco Clay was sealed by pouring molten wax into both
ends of the sampling tube. M.I.T. received 17 tubes
containing Orinoco Clay for laboratory soil tests: 6 tubes
from boring El and 11 from boring Fl. Tables 1-1 and 1-2
present the sampling tube location and type of laboratory
tests performed on Orinoco Clay specimens for borings El
and Fl respectively. Each table presents the following
data:
(Column 1) Depth below the mudline of the tube sample.
(Column 2) Sampling tube number; for example, E1512
means sampling tube number 12 from boring El.
(Column 3) Type of sampler used; either "WIP" or
hammered sampler where N is the number of blows (from a
198 pound hammer falling five feet) required to drive
the sampling tube one foot.
(Column 4) The in situ vertical effective stress at
the depth of the sampling tube.
(Column 5) The condition of the Orinoco Clay observed
* Shannon and Wilson, Inc. Seattle, Washington, manufacturethe Torvane device, a hand operated torsional vane sheardevice.

17
upon extrusion from it's sampling tube. For example,
the Orinoco Clay from tube ElSl2 was highly disturbed
and neither composition nor engineering tests were perforned.
(Columns 6, 7, and 8) Composition results. "Salt"
means that the salt concentration of the pore fluid was
determined, "Org" refers to an estimation of the organic
content of the soil, and "Mineral" pertains to X-ray
diffraction analyses to determine the type of minerals
present.
(Columns 9, 10, and 11) Engineering tests. Mostly
oedometer (Oed) and Direct Simple Shear (CK UDSS) tests
were performed upon Orinoco Clay specimens.
Of the 17 tubes containing Orinoco Clay received by
M.I.T., four of the tubes had soil suffering from excessive
sample disturbance causing the clay to be too soft to trim
for engineering tests.
1-3 ORGANIZATION OF THESIS
Chapter 1 has introduced the Orinoco Clay and borings
El and Fl.
Chapter 2 discusses Lab Vane, Torvane, and UUC tests
which generally give unreliable values of the undrained
shear strength with large scatter because of sample
disturbance, strain rate effects, and anisotropy. The
SHANSEP method is presented, which is generally a more
reliable method to determine a s profile.
18
Chapter 3 presents index properties and composition
analyses of the Orinoco Clay.
Chapter 4 discusses radiography, an invaluable tool
used to detect those portions of Orinoco Clay within the
sampling tubes least likely to be disturbed and hence most
suitable for sophisticated laboratory tests such as
oedometer and Direct Simple Shear tests.
Chapter 5 presents the stress history and consolidation
properties obtained from oedometer tests.
Chapter 6 presents the normalized soil properties
obtained from Direct Simple Shear (CK0UDSS), K Consolidated
Undrained Triaxial Compression (CK UC) and Extension (CK UE)
tests and the SHANSEP undrained shear strength profiles at
borings El and Fl.
Chapter 7 is the thesis conclusion.

SAMPLE LOCATION, TYPE AND PRINCIPAL TESTS: BORING El
Depth No. Type (1)emarks Composition Engineering(2)
(ft) (kg/cm ) Salt Org. Mineral. Oed. CKoU Other
37-40 12 N-3 0.77 Highly disturbed - - - - - -
55-57 15 N-10 1.13 Uniform clay with yes yes yes Oed-l DSS-2 Effect ofgas pockets DSS-3 salt on wL
83-84 18 WIP 1.74 form clay with yes yes yes Oed-2 - -
DSS-498-100 21 WIP 2.08 horiontal crac yes yes yes Oed-3 DSS- -
TC-3
113-116 24 WIP 2.41 Disturbed yes yes - - - -
Oed-13133-136 27 WIP 2.84 Uniform clay yes yes yes Oed-14 DSS-13-
(1) Computed for Ga - 2.72 and S - 100% (see Table 3-1)
(2) Test No: DSS - Direct Simple Shear; TC - Triaxial Compression; TE - Triaxial Extension
Hk0
TABLE 1 -1

TABLE 1-2 SAMPLE LOCATION, TYPE AND PRINCIPAL TESTS: BORING F1
- (1) Composition (Engineering)(2)Depth no. Type. ov Remarks(ft) (kgycm2) Salt Org. Mineral. Oed. CK U Other
25-27 54 WIP 0.44 Disturbed yes yes - - -
27-29 9 N=4 0.48 horizont a i few yes yes yes Oed-5 DSS-12 -
36-38 12 N-8 0.64 Uniform clay yes yes - Oed-9 DSS-6
51-52.5 15 WIP 0.93 Slightly disturbed with yes yes yes Oed-11few horizontal cracks
65-67 55 WIP 1.20 Disturbed yes yes yes - -
66-68 18 WIP 1.22 Uniform clay yes yes yes Oed-4 DSS-l1 -
81-83 21 WIP 1.51 Platy Structure yes yes - Oed-8 DSS-10 -
96-98 24 WIP 1.80 Platy Structure,Disturbed yes yes yes Oed-6 DSS--
111-113 27 WIP 2.09 Uniform clay yes yes yes Oed-1-
126-128 30 WIP 2.38 Uniform clay with Oed-7. shell fragments Oed-16
Oed-12 -127-130 57 WIP 2.41 Very uniform clay yes yes yes Oed-18 S_- . - II E-i
(1) Computed for Ga = 2.72 and S = 100% (see Table 3-1)
(2) Test No; DSS = Direct Simple Shear; TC = Triaxial -Compression; TE - Triaxial Extension
t~J0

SCALE I a 2,000,000
TRINIDAD
GULF OF PARIA
-. BORING El ..
: . .. BORING Fl
VENEZUELA -- '1
RINOCO RIVER.- .....
FIGURE 1-1 BORING LOCATIONS
NI
H

22
2. SHANSEP METHOD
2-1 TV, LV, AND UUC TESTS
Several types of engineering tests can be used to deter-
mine the undrained shear strength (su) of a clay specimen.
Some examples are Torvane (TV), Lab Vane (LV), and Uncon-
solidated Undrained Triaxial Compression (UUC) tests. But
TV, LV, and UUC test suffer inaccuracies because of such
factors as:
(1) Sample disturbance: the more disturbed the soil
structure, the lower the value of the undrained shear strength.
Sample disturbance can be caused by stress relief when making
a borehole, by hammering or pushing the sampling tube into
the clay stratum, expansion of gas during retrieval of the
sampling tube, jarring or banging the sampling tube during
transportation to the laboratory, roughly removing the clay
from the sampling tube, and crudely cutting the clay specimen
to a specific size for a laboratory test. These actions
cause a decrease in the effective stress, a reduction in
the interparticle bonds, and a rearrangement of the soil
particles. An "undisturbed" soil specimen will have little
rearrangement of the soil particles and perhaps no distur-
bance except that caused by stress relief where there is a
change from a in situ K condition to a isotropic "perfect
sample" stress condition. (Ladd and Lambe, 1963). A disturbed
soil specimen will have a disrupted soil structure with

23
perhaps a total rearrangement of soil particles. The results
of laboratory tests run on undisturbed specimens obviously
better represent in situ properties than laboratory tests
run on disturbed specimens.
(2) Strain rate: the faster a soil specimen is sheared,
i.e. a fast strain rate, the higher the value of su . For
Torvane, Lab Vane, and UUC tests, the strain rate is very
fast with failure occuring in only a few minutes or less.
(3) Anisotropy: clay has a natural strength variation
where su depends on the orientation of the failure plane,
thus su along a horizontal failure plane will not equal s
along a vertical failure plane. Lab Vane and Torvane tests
have simultaneous horizontal plus vertical failure planes
with an undrained shear strength that rarely equals s u
from a UUC test which has an oblique failure plane.
Because of sample disturbance, strain rate effects, and
anisotropy, considerable scatter in TV, LV, and UUC results
usually occurs (for example, see Fig. 3-1). Neglecting
anisotropic effects, an average line drawn through the s
data points in Figure 3-1 will not equal the in situ undrained
shear strength unless there is a fortuitous cancellation of
factors: i.e. the increased su due to a high strain rate is
compensated by an equal reduction in su due to sample
disturbance. In addition, stress-strain curves can not be
obtained from TV and LV tests, and moduli from UUC tests
are typically much too low.

24
2-2 SHANSEP METHOD
Several important symbols and there representative
definitions are presented below:
avo - in situ vertical effective stress, which equals (forsubmerged soil) the buoyant unit weight (Y timesthe depth below the mudline (z) .
a - maximum past pressure, obtained from the compressioncurve of an oedometer test by using Casagrande'smethod (see page 297 of Lambe and Whitman, 1969)..
OCR - overconsolidation ratio, which equals /Clay that is at equilibrium under the mafimmon verticaleffective stress it has ever experienced is normallyconsolidated (OCR = 1.0), whereas clay that is atequilibrium under a vertical effective stress lessthan that to which it once had is overconsolidated(OCR > 1.0).
a vertical consolidation stress, for laboratory testsvc such as oedometer and CK 0UDSS tests.
s - undrained shear strength, from strength tests such asTV, LV, UUC, and CK 0 UDSS tests.
s / - normalized undrained shear strength, where avc isu vcthe vertical consolidation stress prior to shearing.
s /a is only applicable for strength tests wheretie Ygil specimen is first consolidated to a , thensheared (e.g. CK 0 UDSS, Triaxial tests). vc
The SHANSEP method (Ladd and Foott, 1974) was developed
to obtain the stress-strain and strength properties of soft
clay deposits. This method is based upon experience which
indicates that the in situ stress-strain and strength prop-
erties of many clay deposits are controlled by the stress
history of the deposit; for 'example, the undrained shear
strength is proportional to the overconsolidation ratio.
* An acronym for Stress History And Normalized SoilEngineering Properties.

25
A clay deposit must exhibit "normalized behavior" for
SHANSEP to give reliable values of su. Normalized behavior
means that laboratory strength tests on clay specimens
having the same overconsolidation ratio will have similar
normalized stress-strain curves and identical values of
su vc. But naturally cemented clays and "quick clays"
have their interparticle bonds broken during the consolidation
portion of the SHANSEP laboratory strength testing technique
and thus su by SHANSEP does not represent in situ strength.
Table 2-1 presents the basic components of the SHANSEP
method. Figure 2-1 illustrates the SHANSEP procedure to
determine the undrained shear strength profile for a uniform
clay deposit subjected to a bearing capacity failure. The
SHANSEP method has -two distinct parts: stress history and
normalized soil properties.
Stress History
The first step in SHANSEP is to establish the stress
history of the clay deposit. This means that both Q and
a versus depth must be ascertained (Fig. 2-la). The in
situ vertical effective stress versus depth can be computed
from the index properties (wn, S, Gs). The maximum past
pressure data points in Figure 2-la were obtained from
oedometer tests. Knowing the -vo profile and estimating
the j profile from oedometer tests, the overconsolidation
ratio (OCR = /7vo) can then be calculated (Fig. 2-lc).
26
A reasonably well defined stress history is essential for
reliable s values from SHANSEP.u
Normalized Soil Properties
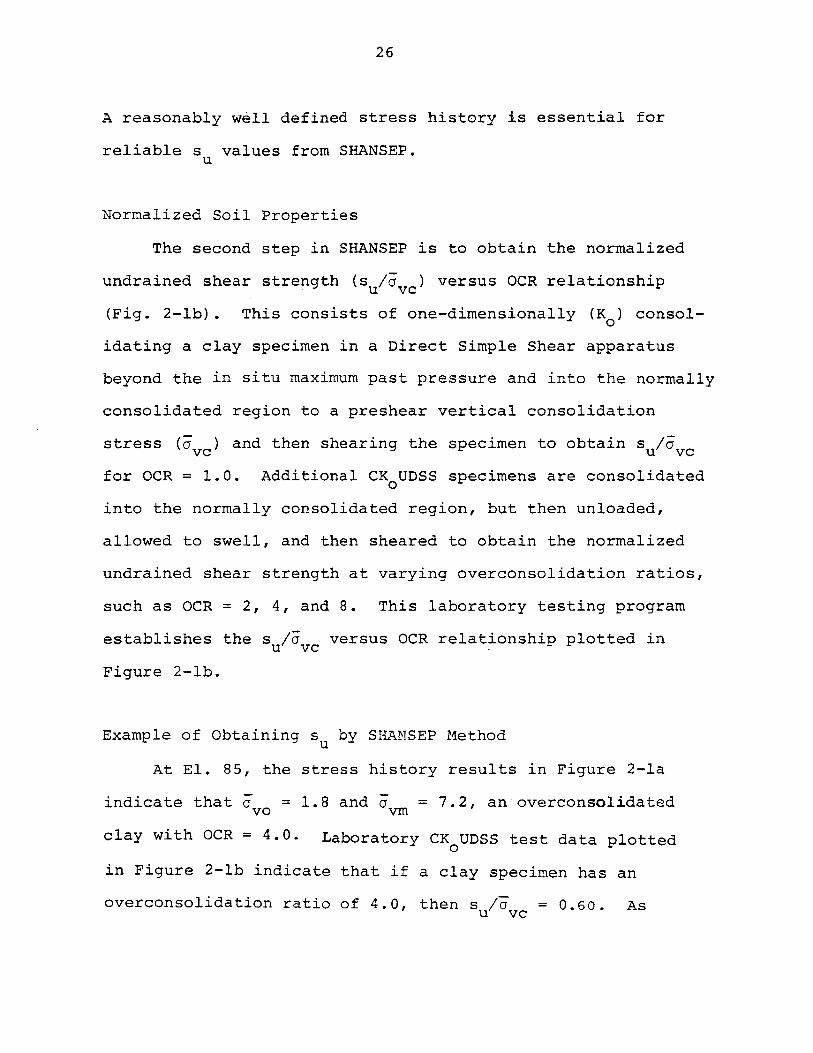
The second step in SHANSEP is to obtain the normalized
undrained shear strength (sU vc ) versus OCR relationship
(Fig. 2-lb). This consists of one-dimensionally (K0 ) consol-
idating a clay specimen in a Direct Simple Shear apparatus
beyond the in situ maximum past pressure and into the normally
consolidated region to a preshear vertical consolidation
stress (avc ) and then shearing the specimen to obtain s /Gvc
for OCR = 1.0. Additional CK 0 UDSS specimens are consolidated
into the normally consolidated region, but then unloaded,
allowed to swell, and then sheared to obtain the normalized
undrained shear strength at varying overconsolidation ratios,
such as OCR = 2, 4, and 8. This laboratory testing program
establishes the s /a versus OCR relationship plotted inu vc
Figure 2-lb.
Example of Obtaining s by SHANSEP Method
At El. 85, the stress history results in Figure 2-la
indicate that a = 1.8 and a = 7.2, an-overconsolidatedvo vm
clay with OCR = 4.0- Laboratory CK UDSS test data plotted
in Figure 2-lb indicate that if a clay specimen has an
overconsolidation ratio of 4.0, then s /avc = 0.60. As

27
shown in Figure 2-ic, multiplying 0.6 times a gives anvo.
su = 1.08, which is plotted in Figure 2-id.
2-3 SUMMARY
The SHANSEP method will be used to determine the
undrained shear strength profiles for the Orinoco Clay at
borings El and Fl. Knowing the index properties (wn',
G s), the in situ vertical effective stress ( vo) versus
depth can be computed (Chapter 3). The stress history of
the Orinoco Clay deposit is obtained by performing oedometer
tests where the maximum past pressure (F v) can be deduced
by Casagrande's method and the overconsolidation ratio can
then be calculated (Chapter 5). From Direct Simple Shear
tests run on Orinoco Clay specimens, a plot similar to
Figure 2-lb of the normalized undrained shear strength
(s /3vc) versus overconsolidation ratio (OCR) is presented
(Chapter 6). Then by performing the computations illustrated
in Figure 2-ic, the undrained shear strength profiles can
be drawn for the Orinoco Clay at borings El and Fl.

28
Table 2-1
SHANSEP Approach
After Ladd (1971)
Stress History And Normalized Soil Engineering
Properties Method of Estimating
Stress-Strain-Strength Properties of Clay
Generation of Data
1. Consolidate samples to appropriate conditions
a) If N.C. clay, use avc = 1.5 - 4 x avo
If O.C. clay, use a > in situ aVc vm
b) Use K = in situ K, such as K
c) Allow secondary compression to simulate
"aging".
2. Shear samples under appropriate conditions
a) Same stress system (Mode of failure)
(Proper a2 and rotation of principal planes)
b) Proper strain rate
Presentation of Data
1. Use "normalized" parameters such as su vc
and E/3vc; plot vs. OCR = a lavc
Utilization of Data
1. Determine in situ OCR and stress system
2. Select normalized parameter
3. Multiply parameter by in situ avo
z0I.-
wj
EFFECTIVE STRESSO 2 4 6 8 10
100------ -SAND
90 -
80 /
UNIFORM70 CLAY 0
DEPOSIT -- e60-
50 .1t _
ou
ANDsu
v0 o
(a) IN SITU SOIL PROFILE AND STRESS HISTORY
EL. Tvo rvm OCR su
85 1.8 7.2 4.00 0.60 1.08
75 2.8 5.3 1.90 0.34 0.95
65 3.8 5.8 1.50 0.28 1.06
55 4.8 6.5 1.35 0.25 1.20
(c) COMPUTATION OF SHANSEP su VALUES
1.0
0.8
0.6
0'
CKJJDSS TEST DATA
- ou /(vc Vs.
4-
FIELD APPLICATION
[su /&,o vs. IN SITU lvm /dvo]
I , (LOG SCALE)-
OCR 0 vm (vc AND OVm '0o(b) NORMALIZED UNDRAINED STRENGTH vs. OCR
z0I-
w
UNDRAINED STRENGTH,
to-(
60 -I%
su1.4
(d) SHANSEP su PROFILE FOR ANALYSES
0.8 1.0 1.2
FIGURE 2 -1 APPLICATION OF SIANSEP TO UNDRAINED STABILITY ANALYSIS USING CK U DIRECT SIMPLESHEAR TESTS
0.4
0.2
.

30
3. INDEX PROPERTIES AND COMPOSITION OF ORINOCO CLAY
Chapter 3 begins the presentation of results from
laboratory tests upon Orinoco Clay. Many of the laboratory
tests presented within this chapter were performed upon
clay specimens of unknown quality. For specific gravity
tests, Atterberg Limits, X-ray diffraction tests, and
organi6 matter determinations, an initially disturbed
clay specimen should not effect the results. However,
natural water contents and TV, LV, and UUC strength tests
can be significantly altered by sample disturbance.
3-1 UNDRAINED SHEAR STRENGTH FROM STRENGTH INDEX TESTS:TV, LV, AND UUC
Figures 3-1 and 3-2 present undrained shear strength
(s ) values obtained by Torvane, Lab Vane, and UUC tests.
After retrieval of a sampling tube containing Orinoco
Clay, some of the soil was used onboard the Fugro ship
to perform these strength tests. Notice the wide scatter
in results; for example, in Figure 3-1 at z = 130 feet,
2s varies between 0.35 to 0.75 kg/cm . This scatter is
caused by sample disturbance, strain rate effects, and
clay anisotropy (Chapter 2).
Figure 3-3 illustrates how the strain rate and sample
disturbance influence Torvane undrained shear strengths.
The Torvane tests on "undisturbed" F1S57 clay specimens

31
(open symbol,A) indicate that the faster the soil specimen
is sheared (i.e. a fast strain rate), the higher the value
of s . Standard Torvane tests usually have failure in
less than 10 seconds, and the very fast strain rate causes
about a 20% increase in s for F1S57 clay specimens. Torvane
tests on deliberately disturbed (remolded) clay specimens
(closed symbol,A) have much lower su values, the reductionu2
in the undrained shear strength is from 0.5 to 0.1 kg/cm2
Figure 3-3 clearly shows that su can be reduced much more
by sample disturbance than by differences in strain rate.
Figures 3-1 and 3-2 also illustrate the effects of
different sampling techniques. It has been stated (Wilun
et al, 1972) that "the method of forcing the sampler into
the ground has a considerable effect on the sample disturb-
ance; samplers pushed into the soil at a fast uniform rate
produce little disturbance whereas samplers driven into
the soil with individual blows induce considerable disturb-
ance".* At z = 60 feet in Figure 3-1 and at z = 40 feet in
Figure 3-2 there is a distinct discontinuity in the undrained
shear strength. Above these depths, sampling tubes were
hammered causing sample disturbance with low values of su
Below these depths, sampling tubes were pushed into the
soil strata at a fast uniform rate by using Fugro's "WIP"
sampling equipment causing less sample disturbance and
values of su more representative of the in situ undrained
shear strength.

32
3-2 INDEX PROPERTIES: NATURAL WATER CONTENT
Figures 3-1 and 3-2 also present the natural water
content (wn) for Orinoco Clay recorded onboard the Fugro
ship, at M.I.T., and at Catholic University (C.U.) in
Venezuela for borings El and Fl respectively. For boring
El (Fig. 3-1), the natural water content decreases from
7S% at the mudline to 45% at a depth of 55 feet. Below
55 feet, the natural water content increases and is constant
with depth at 53 & 2%. Except for results from sampling
tubes ES1l2 and E1S24, good agreement exists between the
water contents determined by Fugro, C.U., and M.I.T.
Sampling tubes ElS12 and ElS24 contained highly disturbed
clay with very high natural water contents that probably
do not correspond to the wn of the in situ clay.
For boring Fl (Fig. 3-2), the natural water content
decreases from 90% at the mudline to 63% at a depth of
30 feet. Below 30 feet, the water content is essentially
constant at 65 . 5%. Once again, good agreement exists
between M.I.T. and Fugro data except for tubes F1S54 and
F1S55 which contained highly disturbed clay.
3-3 INDEX PROPERTIES: ATTERBERG LIMITS
The results of Atterberg Limits performed by M.I.T.
and C.U. are plotted on Casagrande's Plasticity Chart,
Figure 3-4. For boring El, the plasticity index (P.I.)

33
ranges from 25 to 45%, classified as a CH clay. At boring
Fl, the plasticity index above z = 70 feet is generally
40 to 50%, while below z = 70 feet, the P.I. is 50 to 65%.
The Orinoco Clay at boring Fl is classified as a CH to CH-
OH clay and is more plastic then at boring El.
3-4 IN SITU VERTICAL EFFECTIVE STRESS
Six specific gravity tests were performed at M.I.T.
with an average of the specific gravity of solids (G s
equal to 2.72 and values ranging from 2.69 to 2.74.
Table 3-1 presents data for computing the in situ
vertical effective stress at borings El and Fl. Each
boring was divided into layers where the change in natural
water content was approximately constant; then using wnl
with Gs = 2.72, a unit weight of salt water (y ) equal,
to 64 pounds per cubic foot, and assuming 100% saturation,
both yb and y were calculated using the equations presented
in Table 3-1. The in situ vertical effective stress. was
obtained by assuming hydrostatic in situ pore water pressures:
therefore avo equals depth below mudline times buoyant unit
weight (yb)'
For comparison, Table 3-1 also presents the yt values
obtained by Fugro: they weighed a sampling tube containing
Orinoco Clay, subtracted the weight of the steel liner and
then divided this value by the volume of the sampling tube.
Most values computed by Fugro are close to the M.I.T. yt
34
calculations.
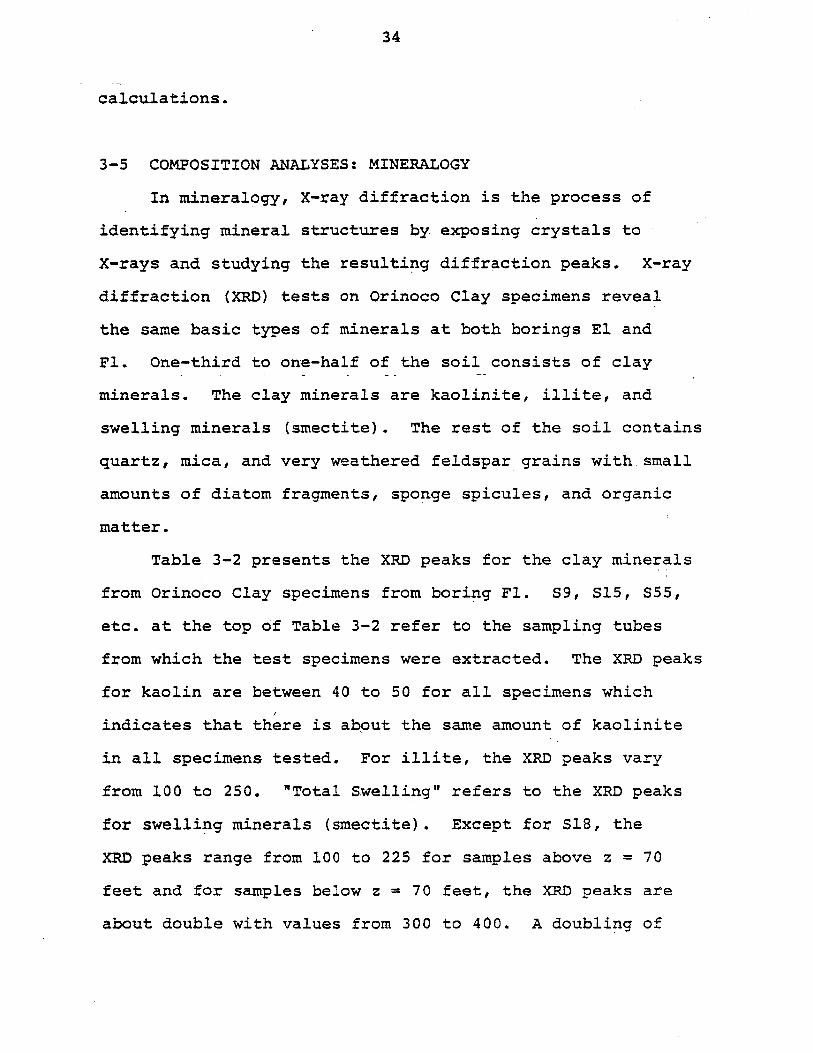
3-5 COMPOSITION ANALYSES: MINERALOGY
In mineralogy, X-ray diffraction is the process of
identifying mineral structures by exposing crystals to
X-rays and studying the resulting diffraction peaks. X-ray
diffraction (XRD) tests on Orinoco Clay specimens reveal
the same basic types of minerals at both borings El and
Fl. One-third to one-half of the soil consists of clay
minerals. The clay minerals are kaolinite, illite, and
swelling minerals (smectite). The rest of the soil contains
quartz, mica, and very weathered feldspar grains withsmall
amounts of diatom fragments, sponge spicules, and organic
matter.
Table 3-2 presents the XRD peaks for the clay minerals
from Orinoco Clay specimens from boring Fl. S9, 515, S55,
etc. at the top of Table 3-2 refer to the sampling tubes
from which the test specimens were extracted. The XRD peaks
for kaolin are between 40 to 50 for all specimens which
indicates that there is about the same amount of kaolinite
in all specimens tested. For illite, the XRD peaks vary
from 100 to 250. "Total Swelling" refers to the XRD peaks
for swelling minerals (smectite). Except for S18, the
XRD peaks range from 100 to 225 for samples above z = 70
feet and for samples below z = 70 feet, the XRD peaks are
about double with values from 300 to 400. A doubling of

35
the XRD peak does not necessarily imply a doubling in the
amount of swelling minerals, but it can be stated that below
z = 70 feet the clay contains considerably more swelling
minerals. This discovery is very important because swelling
minerals have profound effects upon engineering properties.
Unfortunately, only four mineralogy tests were performed on
boring El specimens and, as shown -if Table 3-3, an increase
in swelling minerals below z = 70 feet is not indicated by
the scant data.
3-6 SALT CONCENTRATION AND ORGANIC MATTER
As shown in Figure 3-5, the salt concentration of the
pore fluid for both borings El and Fl decreases with depth
from 35 grams/liter at the mudline to 25 + 5 grams/liter
at z = 130 feet. The salt concentration woild -be expected
to be 35 grams/liter for the entire deposit since the
Orinoco Clay has been deposited in salt water. Perhaps
the reduction in salt concentration with increasing depth
is caused by chemical diagenesis. The pore fluid, incompatible
and/or unstable minerals (feldspar grains), organic matter,
and carbonates interact with each other to bring the soil
into equilibrium, perhaps causing the salt concentration to
decrease with time.
Figure 3-5 also presents the percentage of the soil
mass that is organic matter. The organic matter content
is very small, 2 + 0.5%, but it does decrease slightly

36
at depths greater than 100 feet.
3-7 SUMMARY
In Figures 3-1 and 3-2 there is considerable scatter
in the undrained shear strength from TV, LV, and UUC tests.
A distinct discontinuity exists in the undrained shear
strength data at z = 60 feet in Figure 3-1-and at z 40
feet in Figure 3-2 caused by different sampling techniques
where hammering a sampling tube causes more sample disturb-
ance than Fugro's "WIP" sampling procedure.
The Orinoco Clay at boring El is classified as a CH
clay and has a P.I. between 25 to 45%. The Orinoco Clay
at boring Fl'is classified as a CH to CH-OH clay with a P.I.
between 40 to 50% above z = 70 feet, while below z = 70
feet, the P.I. is 50 to 65%.
Mineralogy results indicate that the Orinoco Clay at
both borings El and Fl contains the same basic minerals;
one-third to one-half of the soil being clay minerals such
as kaolinite, illite, and swelling minerals (smectite).
The rest of the soil consists mostly of quartz, mica, .and
weathered feldspar grains. For boring Fl, there is consid-
erably more swelling minerals below than above z = 70 feet.

TABLE 3-1 UNIT WEIGHTS AND EFFECTIVE STRESS
Yt= GsYw (1 + wn)/(I + wnGsywysw) Assuming 100% saturation
Yb t sw
avo b(z) Assuming hydrostatic in situ pore water pressures
Using the above yt equation, with Gs = 2.72, y w = 62.4 pcf, and y = 64 pcf
Svo(kg/cm2) = a0 + a1Z(ft)
Assumed FUGRO Parameters -
Boring Depth Y (tube)
(ft) VN (t pcf a0 ai(M) (pcf) Ave. i SD
0-55 59 105.2 101.6 ± 8.2 0 0.0201
El 55-75 49 110.0 105.0 t 1.4 -0.129 0.0225
75-140 52 108.4 107.1 ± 5.8 -0.0703 0.0217
0-30 77 98.8 94.2 ± 4.0 0 0.0170
Fl30-140 63 103.6 104.4 ± 9.4 -0.0703 0.0193
(1)
(2)

TABLE 3-2 CLAY MINERALOGY SUMMARY FOR BORING Fl
Absolute Peak Amplitude
S9 S15 S55 S18 S24 S27 S57Phase (27') (51') (66') (66') (96') (111') (127')
Kaolin 45 45 40 40 40 50 45
Illite 200 120 100 200 250 200 220
Total Swelling 225 200 100 400 400 300 400
W~h
co
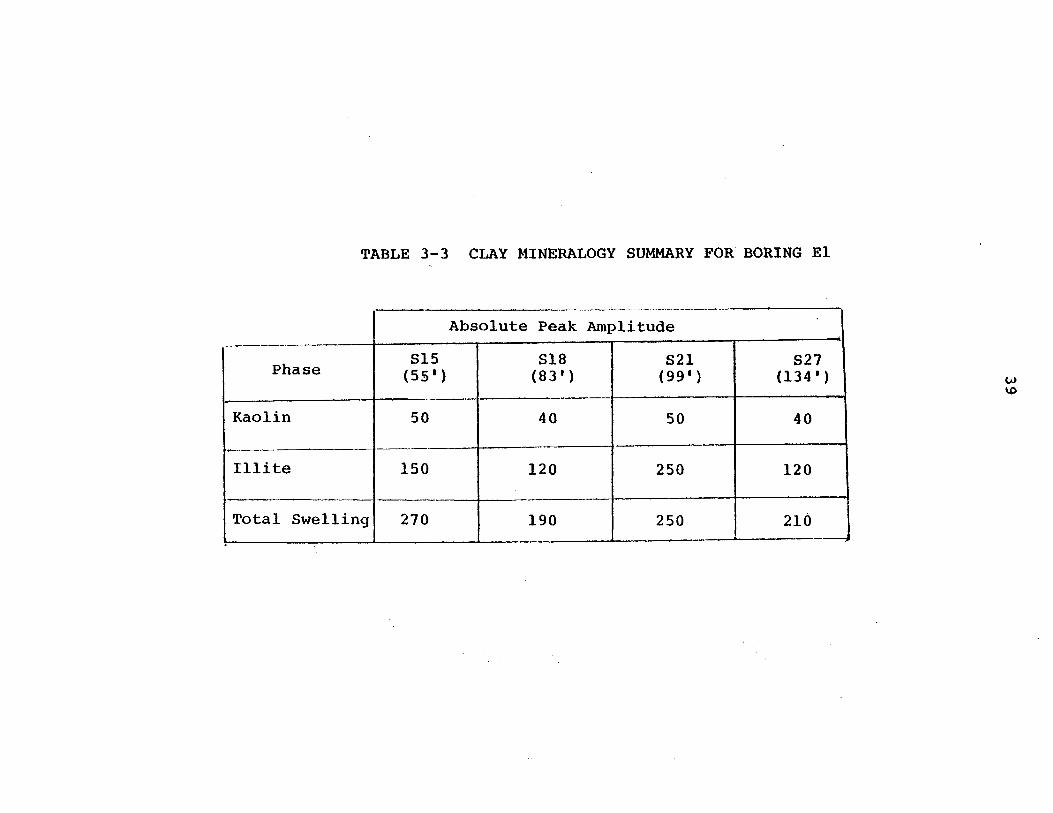
TABLE 3-3 CLAY MINERALOGY SUMMARY FOR BORING El
Absolute Peak Amplitude
PhseS15 S18 S21 S27Phase (55') (83') (99') (134')
Kaolin 50 40 50 40
Illite 150 120 250 120
Total Swelling 270 190 250 210
WN (%)50 60 70 Rfl 0
0
20
104
TWIP
su (TSF, kg /cma)0.2 0.4 0.6 0.8 l.0
NATURAL WATER CONTENT AND STRENGTH INDEX TESTS: BORING El
MITSAMPLES
40
cD
00
0
some0
00
000 000am a
00
0
0 1o O FUORO
C * MIT
- -1 -0 C.u.
40[ 512
S 5-
4..
Id0
80
100
120
S18
-S21
S24
S27140L
e x FUGRO
t x TORVANE
20 - 0 LAB VANE
XV* 0 uucxe C
40 --
x e>
x 6
0 0x ()p80 -o i3K 0
x 00
1000 0
K 60
120K 00
x 6 0S 00
401-
FIGURE 3-1

LES WN N50 60 T 80 90 100 0
0
20
TWIP
20
40
00
0
(WIP) 0 o
0 00a_ ___
00 0
000
40
0
000
00
00
00 0 FUGRO
0 MIT
0.2su (TSF, kg/cma)
0.4 0.6 0.1
C FUGRO
X TORVANE
C LAB VANE
APXx ,0 uuc
e 0
o e
_ _ _ O _ _ _ _
x
X00
0
X C0x
C
>OC
00x ex' C
A A 1
NATURAL WATER CONTENT AND STRENGTH INDEX TESTS; BORING Fl
MilSAMP
60
80
100
120
140
401
S54
S12
S15
S55SIB
604-
I--
80 -21
1 V243001-
S27
H 1
12011530[S57
140L
.
0
FIGURE 3-2

- - IA
A
A
A Sample F1S57 z = 129 ft
A - "UNDISTURBED" CLAY
A - REMOLDED CLAY
ONBOARD TV = 0.48 kg/cm 2
20 40 60 80 100
TIME TO FAILURE (SECONDS)
FIGURE 3-3 EFFECTS OF DISTURBANCE AND STRAIN RATE ON TORVANE DATA: SAMPLE F1S57
0.50
0.40
ra)
0.30
0.20
0.10
00
N)J

70 - OIN -ET -f -0
0
600
O>NG DT
00 50I 0__ 00. (i.__ __ __
o20
() By C.U.-40 ALL OTHER DATA BY MIT
200
20
10 20 30 40 50 60 70 s0
LIQUID LIMIT, wL ()
PLASTICITY CHART: ORINOCO CLAY
III
U)
FIGURE 3-4
so IOU ilu0

SALT CONCENTRATION (g/l) ORGANIC MATTER (%)IC
o
20
40
60
15 20- I
El 0FI O
25 30 35 0
00
I _ I__ -1_0_
80
100
(20 0120
00
0
I 2 3
00
0
0
l 0
0 M
'9
SALT CONCENTRATION AND ORGANIC MATTER: ORINOCO CLAY
wa
I
FIGURE 3- 5

45
4. RADIOGRAPHY
4-1 INTRODUCTION: X-RAYS
In 1895, Wilhelm Konrad Roentgen discovered X-rays,
which are one form of electromagnetic radiation. Other
examples of electromagnetic radiation are radio waves and
visible light where a distinguishing characteristic is .the
wave length; defined as the distance, measured in the direc-
tion of propagation of the wave, between two successive
peaks. The approximate wave lengths for X-rays and visible
light are 100 millionths and 20 thousandths of a centimeter
respectively, while radio waves have wave lengths that vary
between a meter to several kilometers in length. The fact
that X-rays have wave lengths that are 5,000 times smaller
than those of visible light accounts for the penetration
through metals by X-rays compared to the reflection or
absorption of light waves.
X-rays are produced when electrons traveling at high
speeds collide with matter. The kinetic energy of a high
speed electron is transferred into heat and X-ray photons
as it strikes the nucleus of a stationary atom. One
mechanism that produces X-ray photons is the cathode ray
tube.
Photography using X-rays is called radiography. A
radiograph is the photographic record produced by the
passage of X-rays through an object and onto a white photo-

46
graphic film. If silver halide crystals are placed upon
a white photographic film and then bombarded with X-rays,
the chemicals will react with X-ray photons causing the
photographic film to darken. As X-ray photons travel
through a solid medium, some photons will be absorbed and
the denser a material the more photons absorbed. For
example, a radiograph produced after positioning a man's
chest between an X-ray source and a photographic film will
distinctly reveal the bones of the chest cavity which are
much denser than the surrounding flesh, tissue, and organs.
4-2 DESCRIPTION OF M.I.T.'s RADIOGRAPH FACILITY
M.I.T. received radiograph facilities for use in
geotechnical engineering research by a N.S.F. equipment
grant (number ENG78-10435). The facilities include:
(1) a X-ray source generator containing a double
beryllium window,
(2) a constructed enclosure 12 feet by 8 feet by 7
feet containing lead shielding on all walls, and
(3) a dark room to develop the radiographs.
The major advantage of radiography is that a photo-
graph of the soil can be obtained before the soil is
extruded from it's sampling tube. Worm holes, coral
fragments, cracks and gravel inclusions can easily be
identified by -using radiography (e.g. Allen et al., 1978).
Photons contain energy with zero mass and thus X-rays

47
can not displace or disturb soil particles. X-rays can
kill organisms, for example bacteria, fungi, etc. living
within the soil mass, but the lethal dose for such organ-
isms is several orders of magnitude greater than that
induced during radiography.
A sampling procedure using thin-walled cylindrical
sampling tubes was utilized to obtain Orinoco Clay. The
sampling tubes are stainless steel having a thickness of
0.1 inch with an outside diameter of 3 inches. Tubes
were two to three feet long with both ends sealed with
approximately two inches of wax. Hitherto, the only means
of examining the clay was to extrude it from the tube.
Because the sampling tubes are cylindrical, X-rays
that strike at the center of the tube (point A, Fig. 4-la)
must travel through 0.2 inches of stainless steel and 2.8
inches of soil, while those X-rays that strike at point B
(Fig. 4-la) travel through much less soil. The density
at point A is much greater than the density at point B and
aluminum plates of varying thickness are arranged so that
the density across the tube is approximately uniform. The
vertical lines in the radiograph prints (for example, see
Fig. 4-3) are caused by the varying thickness of the
aluminum plates.
Some X-ray photons are reflected off the walls and
these photons could strike the photographic film from behind.
To eliminate this scatter radiation, lead shielding is

48
positioned behind and around the photographic film (Fig.
4-1).
The variables for the radiography of sampling tubes
are the input voltage and current to the X-ray source, the
duration of X-ray bombardment of the photographic film,
the distance from the X-ray source to the photographic
film, and the developing time of the photographic film.
After numerous trials, the following values produced the
best radiographs for 3 inch diameter sampling tubes:
Input Voltage: 160 kilovolts
Input Current: 3.9 milliamperes
Exposure Time: 5 minutes
Distance From X-ray Source: 6 feet
Developing Time: 15 minutes
4-3 RADIOGRAPHY OF SAMPLING TUBES CONTAINING ORINOCO CLAY
This'section will present radiograph prints, that have
been reproduced as positives using the radiograph as.a
negative, of Orinoco Clay within sampling tubes. Light
areas represent zones of low soil density and dark areas
represent zones of high soil density. The radiograph
prints are close to true scale.
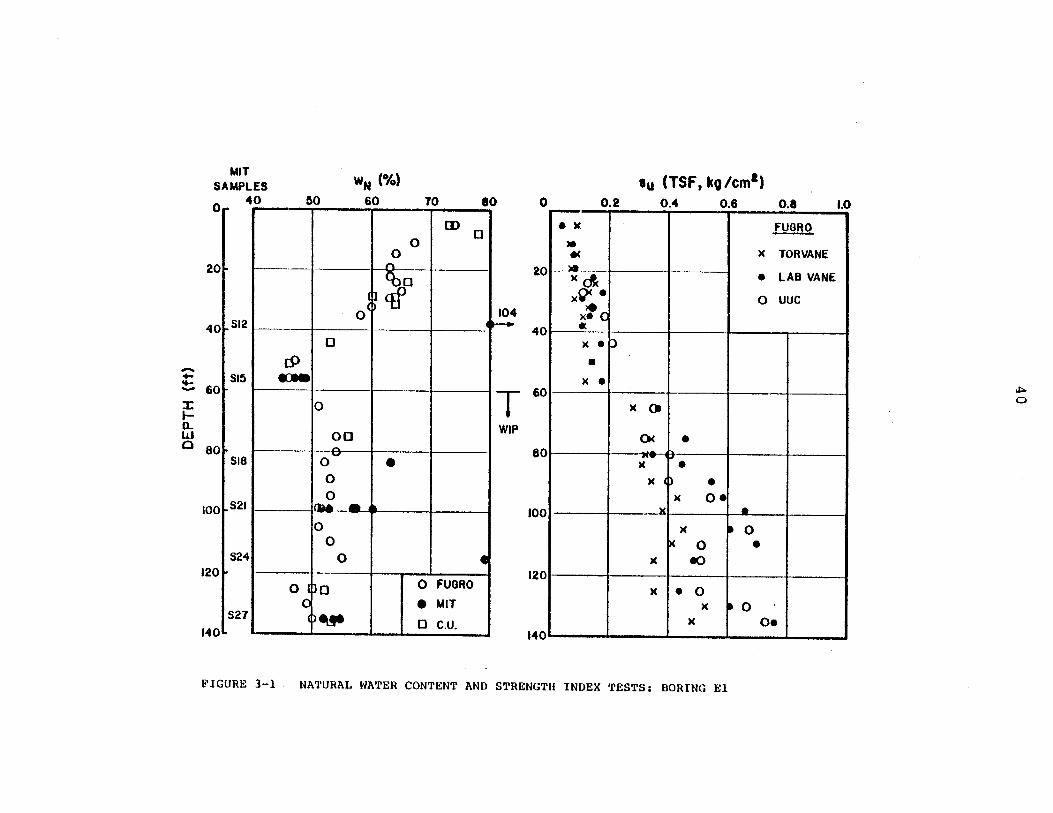
Sampling Tube F1S57, Sample Disturbance
Figure 4-3 is a radiograph print of the top 10 inches
of sampling tube F1S57 (depth = 127 to 130 feet). Lead

49
numbers (0 through 9) and letters (A, B, C, etc.) were usually
attached at one inch nominal distances along each tube and
radiographs taken at 10 inch intervals, which is the size of
the photographic film.
The top of Figure 4-3 at letter E is the top wax seal,
which has a very low density. As the Orinoco Clay was
extruded from sampling tube F1S57, Torvane and engineering
tests were performed and the results are presented in Figure
4-2. Several important conclusions can be obtained by
comparing Figure 4-2 with Figure 4-3.
(1) Figure 4-3 illustrates a swirling mass of clay
containing large voids. The clay between letters Z to U is
highly disturbed with Torvane undrained shear strengths
less than 0.1 kg/cm2 . Possibly this highly disturbed clay
is cuttings inadvertently left at the bottom of the bore-
hole. Some of the disturbance could also be caused by
tube friction during sampling as the clay near the tube
wall may become remolded as it travels up the tube.
(2) In Figure 4-3, the Orinoco Clay below letter U
is uniform in appearance and does- not contain voids.
Figure 4-2 indicates that between letters U to S the
Torvane undrained shear strength increases from 0.1 to
20.5 kg/cm2. Below letter S, the Torvane undrained shear
strength is constant at 0.5 kg/cm2 and this value is very
close to the Torvane strength obtained onboard the Fugro
ship.

50
(3) The Orinoco Clay between letters T-S appeared to
be of excellent quality when viewing Figure 4-3 and was
used for oedometer test No. 12 (oed-12). The oedometer
results indicated that the Orinoco Clay at this depth of
127.7 feet was underconsolidated (OCR = 0.56). The Torvane
undrained shear strengths obtained directly above the
oedometer specimen were considerably less than the Torvane
s value obtained onboard the Fugro ship (0.3 versus 0.48
kg/cm2). The lower Torvane su value of 0.3 kg/cm2 was
caused by sample disturbance and the clay specimen for the
oedometer test No. 12 was also disturbed resulting in a low
maximum past pressure and subsequent low OCR. A new
oedometer test was performed on a better quality specimen
(Oed-18, see Fig 4-2) and the results indicated a slightly
overconsolidated deposit (OCR = 1.15). In this instance,
only the radiograph was used to select oedometer test No.
12 specimen, yeti comparing the Torvane undrained shear
strength obtained above the oedometer specimen (TVoed)
to the Torvane strength obtained onboard the Fugro drilling
ship (TVboat would have provided an additional assurance
of a good quality specimen.
Sampling Tube ElS12, Gas Pockets
Figure 4-4 is a radiograph print of a 10 inch portion
of tube ElSl2 (depth = 37 to 40 feet). The white specks
dispersed throughout the print represent voids. The voids

51
probably. occurred- when air and -hyarogen sulfide gas (H2S)
came out of solution as the in situ confining pressure was
reduced to zero during retrieval of a sampling tube. As
the dark gray Orinoco Clay was extruded from tube ElSl2,
a pungent odor of rotten eggs assailed one's senses. The
clay was exceedingly soft, it was closer to a viscous liquid
than a solid, and it possessed negligible shear strength
(Torvane readings were zero).
Tubes ElS24 (depth = 113 to 116 feet), F1S54 (depth =
25 to 27 feet), and F1S55 (depth = 65 to 67 feet) had
similar looking radiographs that contained white specks
(voids). Upon extrusion from the sampling tubes, the
Orinoco Clay was highly disturbed with low Torvane strengths
and high natural water contents.
Sampling Tube ElS21, Horizontal Cracks
Figures 4-5a and 4-5b are radiograph prints of tube
ElS21 (depth = 98 to 100 feet). The Orinoco Clay at the
top of Figure 4-5a was disturbed with very low Torvane
undrained shear strengths. The bottom of Figure 4-5a
shows numerous horizontal cracks, probably the result of
gas coming out of solution. At the top of Figure 4-5b,
the horizontal cracks diminish in number with excellent
quality soil between letters E through I. Radiograph
prints can also reveal the type of soil structure, e.g.
in Figure 4-5b the clay has a slightly layered appearance.

52
Figures 4-5a and 4-5b clearly demonstrate the value
of using radiography to select zones of good quality soil
for laboratory tests. Only a small portion of the Orinoco
Clay within sampling tube ElS21 was suitable for the
sophisticated engineering tests. All the Orinoco Clay
above letter E was extruded and used for index tests, then
the good quality clay between letters E through I was
extruded and used for oedometer, triaxial, and CK0 UDSS
tests.
4-4 SUMMARY
Radiography is an invaluable tool that can be used to
detect those portions of soil within the sampling tubes
least likely to be disturbed and hence most suitable for
sophisticated laboratory tests such as oedometer and Direct
Simple Shear tests. The radiograph prints presented
within this chapter clearly show several important features:
(1) Zones of disturbed Orinoco Clay due to:
(a) possible cuttings inadvertently left at the bottom
of the borehole and/or highly remolded soil (Fig. 4-3),
and
(b) expansion of gas pockets as the gas comes out of
solution upon release of in situ confining pressures (Fig.
4-4).
(2) Zones containing horizontal cracks, presumably
caused by expanding gas (Fig. 4-5)

53
(3) Different soil structure; for example, very
uniform (bottom of Fig. 4-3) or slightly layered (middle
of Fig. 4-5b).
The radiograph prints clearly indicated the proportion
of "good-excellent" quality clay to that of disturbed soil.
Thus radiography enables the geotechnical engineer to locate
the best quality clay before extruding the soil from the
sampling tube. This aids in planning a soil testing program
and reduces the likelihood of performing meaningless labora-
tory tests on severely disturbed soil.

54
ALUMINUM RADIOGRAPH FILM
PLATES B
TUBE SAMPLE
X-RAYS
X-RAY HEAD
NOTE: TARGET AREASURROUNDED BY
LEAD SHIELDING
(a) ELEVATION VIEW
6 F
10 IN. RADIOGRAPH FILM
TUBESAMPLE
ALUMINUMPLATES
X-RAYS
EJ X-RAY HEAD
(b) PLAN VIEW NOT TO SCALE
FIGURE 4-1 RADIOGRAPHY OF A SAMPLING TUBE CONTAINIUG ORINOCOCLAY
.

MARKINGS
I TUBEw WAX
VOID
N
0 0
(I)
ENGINEERINGTESTS
NOTE:
(1) STRESSES IN kg/cm2
(2) EST. TVO= 2.40
(3) ONBOARD TV=0.48
UUc No. 4
su =0.14
WN=72.2 %
OED No. 12, wN= 6 4 .8 %
vm =1.35, CR=0.25
OED No. 18, WN= 6 6 .5 %
Ivm=2.75, CR=0.36
0su (kg/cm2)
0.1 0.2 0.3 0.4 0.5
z
FIGURE 4-2 OEDOMETER AND STRENGTH DATA ON SAMPLE FlS57 FOR COMPARISON WITH RADIOGRAPH-
127.01-
01-
wa
127.51-
128.0O
0 TORVANE
0 uuc
444
>00z
L,u,
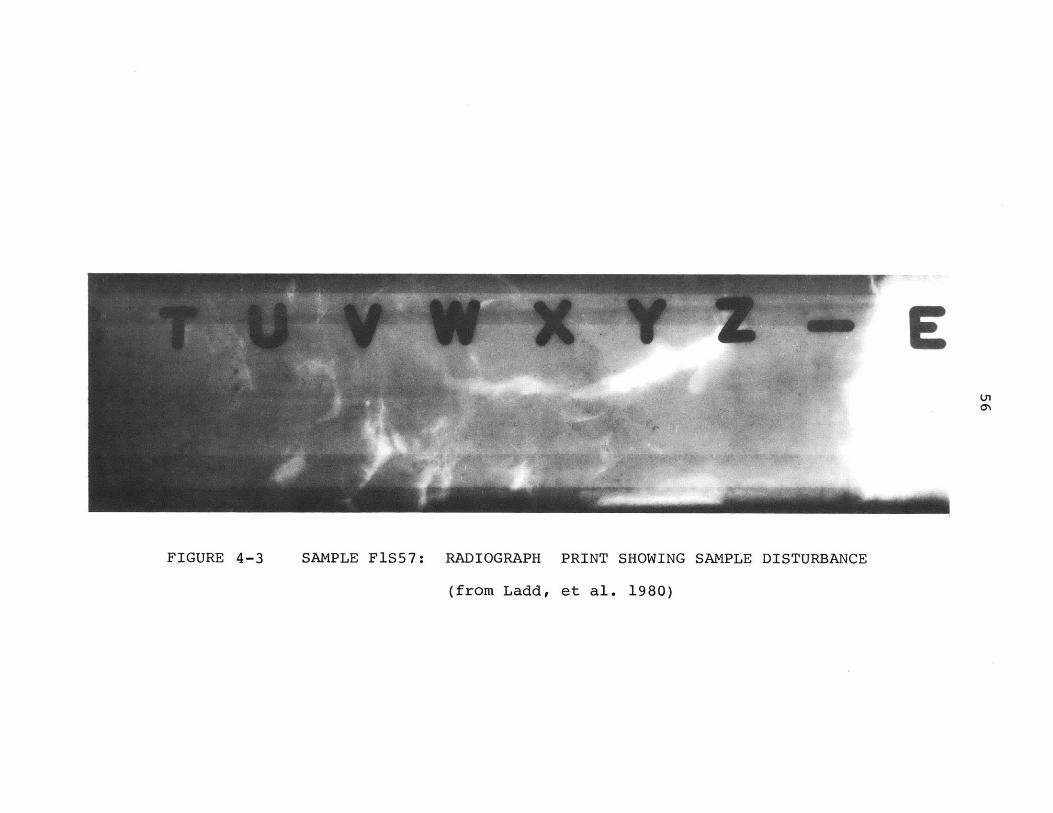
FIGURE 4-3 SAMPLE F1S57: RADIOGRAPH PRINT SHOWING SAMPLE DISTURBANCE
(from Ladd, et al. 1980)
EU51M~
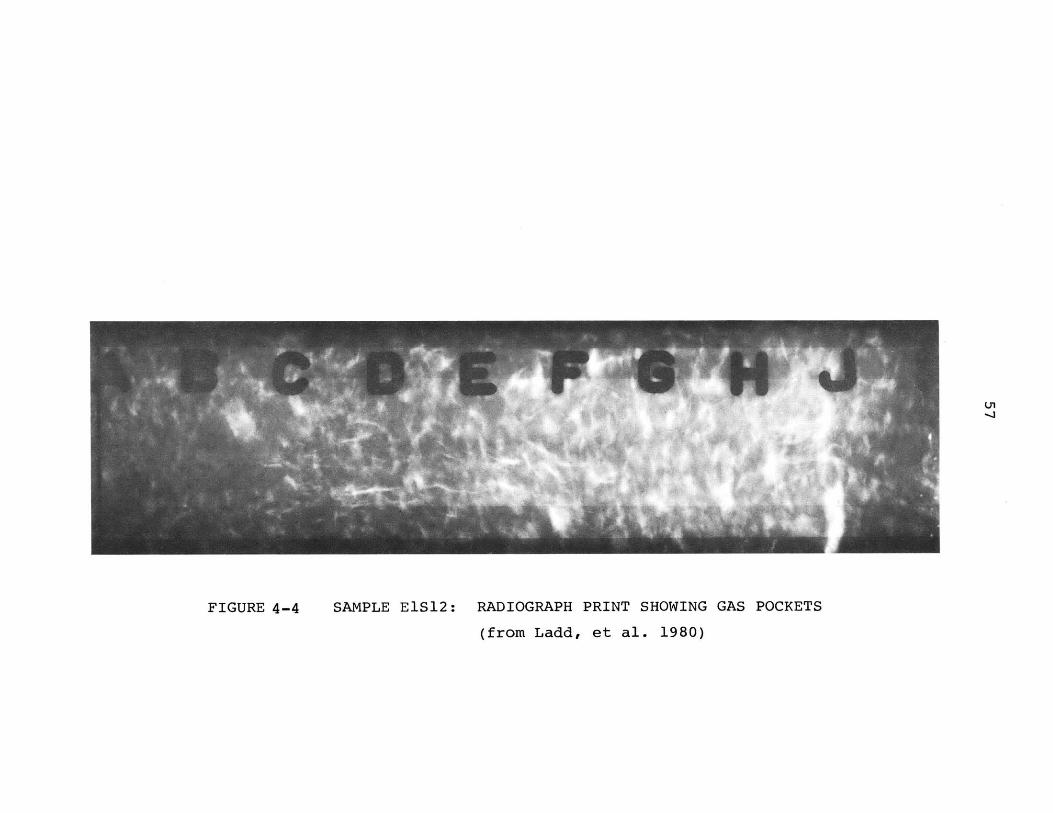
FIGURE 4-4 SAMPLE ElS12: RADIOGRAPH PRINT SHOWING GAS POCKETS
(from Ladd, et al. 1980)
uL

FIGURE 4-5a SAMPLE ElS21: RADIOGRAPH PRINT SHOWING HORIZONTAL CRACKS
(from Ladd, et al. 1980)

FIGURE 4-5b SAMPLE ElS21: RADIOGRAPH PRINT SHOWING HORIZONTAL CRACKS
(from Ladd, et al. 1980)
60
5. STRESS HISTORY AND CONSOLIDATION PROPERTIES
5-1 INTRODUCTION: TEST PROCEDURES FOR OEDOMETER TESTS
Seventeen oedometer tests were performed on Orinoco
Clay specimens in the M.I.T. geotechnical laboratory,
five from boring El and twelve from boring Fl. The
procedures used for all oedometer tests are the same
as those described in Lambe (1951), except as noted
below:
(1) The oedometer tests were performed with a load
increment ratio equal to 1.0, except near the presumed
maximum past pressure where it was reduced to approximately
0.5 in order to better define the maximum curvature-of the
compression curve.
(2) The maximum past pressure was obtained by using*
Casagrande's method (Casagrande, 1936) for compression
curves based on vertical strain (Ev) versus vertical consol-
idation stress (7vc), where the vertical strains are those
corresponding to the end of primary consolidation (Ladd
1973). The load increments were applied for a time interval
of sufficient duration to enable the determination of the
end of primary consolidation.
Oedometer Orinoco Clay specimens were cylindrical,
2.5 inches in diameter and approximately 1.0 inch in height.
During testing, the clay specimens were continuously
surrounded by distilled water in the oedometer apparatus.

61
Some of the dissolved salt in the pore fluid of the clay
specimen will diffuse into this distilled water. To
investigate whether or not a change in the pore fluid
salt concentration will effect engineering properties,
two Atterberg Limits were performed on ElS15 clay specimens
where the liquid limit was 63% for an original specimen
having a pore fluid salt concentration of 29 grams/liter
and when the pore fluid salt concentration was diluted to
1 gram/liter, the liquid limit was essentially unaltered
(64%). Since a significant reduction in the pore fluid
salt concentration does not alter liquid limits, then the
small change in pore fluid salt concentration during an
oedometer test should not effect the result's.
Table 5-1 summarizes all oedometer results for boring
El and Table 5-2 for boring Fl. Both tables present the
following data:
(Column 1) Depth of oedometer specimen and sample
tube number.
(Column 2) Oedometer test number.
(Column 3) The natural water content and the Atterberg
Limits for each oedometer test as measured from test
specimen trimmings.
(Column 4) Two sample disturbance indices; TV(oed/boat)
is the ratio of Torvane undrained shear strength obtained
directly above the oedometer specimen to that recorded
onboard the Fugro ship during sampling operations, and also

62
the vertical strain (e ) during recompression to '
(Column 5) The in situ vertical effective stress ( vo)
using the equations presented in Table 3-1.
(Column 6) Best estimate (along with a range) of the
maximum past pressure determined by the Casagrande method.
(Column 7) Virgin compression ratio (CR), defined as
the slope of the vertical strain versus log consolidation
stress in the normally consolidated region. Swelling ratio
(SR), defined as the average slope, over one log cycle, of
the rebound curve starting from the maximum consolidation
stress.
(Column 8) Average coefficients of consolidation (c
determined from the dial reading versus log time and square
root time curves, in the normally consolidated region.
(Column 9) The rate of secondary compression (Ca
defined as the slope of the secondary compression line
from a log time curve, in the normally consolidated region.
(Column 10) An assessment of the quality of each
oedometer specimen (excellent, good, fair, or poor) based
on it's disturbance indices, TV(oed/boat) and Ev at avo'
and the general appearance of the compression curve (e.g.
sharp break at a , etc.).
5-2 EFFECTS OF SAMPLE DISTURBANCE
This section will discuss how sample disturbance
effects oedometer results by comparing Oed No. 12 and
63
Oed No. 18 (specimens from sampling tube F1S57). As
discussed in Chapter 4, Oed No. 12 was disturbed and had
significantly different engineering properties than Oed
No. 18, yet the clay specimens were within two inches of
each other (see Fig. 4-2). From Table 5-2, the ratio
TV(oed/boat) for Oed No. 12 is 0.63, while for Oed No. 18
the value is 1.06.
Figure 5-1 presents the compression curves and values
of the coefficient of consolidation for Oed No. 12 and
Oed No. 18. By comparing these two oedometer tests, we
can observe the effects of sample disturbance:
(1) An increase in the measured vertical strain for
disturbed specimens. The vertical strain during recom-
pression to -vo is 11.3% for Oed No. 12, but only 5.5%
for Oed No. 18.
(2) A reduction in the maximum past pressure for
. 1 - 2disturbed specimens. Oed No. 12 has a = 1.35 kg/cm2
2.while for Oed No. 18, F = 2.75 kg/cm2. Because a =
2.4 kg/cm2, the results of Oed No. 12 indicate an under-
consolidated clay deposit (OCR = 0.56) but the results
for Oed No. 18 indicate a slightly overconsolidated deposit
(OCR = 1.15).
(3) Sample disturbance caused a reduction in the
virgin compression ratio (CR). The value for CR is 0.245
for Oed No. 12 and 0.355 for Oed No. 18. Sample distur-
bance has caused a 30% reduction in the virgin compression

64
ratio.
(4) During recompression to %vo' the coefficient of
consolidation (c ) is less for disturbed specimens. At
2 -4 2avc = 0.75 kg/cm2, Oed No. 12 has a c = 3 x 10 cm2/sec,
-4 2but Oed No. 18 has a cv = 11.5 x 10 cm /sec. Sample
disturbance does not effect c. in the normally consolidated
region where both Oed Nos. 12 and 18 have cv = 2 x 104 cm2 /sec.
(5) Oed Nos. 12 and 18 have rebound curves that are
almost parallel. The swelling ratio (SR) was not altered
by sample disturbance.
It must be reemphasized that Oed No. 12 was disturbed
and this caused the significant difference in engineering
properties between Oed No. 12 and Oed No. 18. An excellent
quality specimen was used for Oed No. 18, and the results
of this test better represent the in situ soil properties
(e.g. - , CR, etc.).
Figure 5-2'presents the oedometer disturbance indices
TV(oed/boat) and ev at 'vo for all oedometer tests .performed
at M.I.T. As previously discussed, disturbed specimens
will have a TV(oed/boat) ratio less than 1.0, a high value
of ev at avo, and a low value of av with a subsequent low
OCR. In Figure 5-2, the undisturbed or slightly disturbed
specimens are open symbols (e.g. [, 0) and the disturbed
specimens are closed symbols (e.g.E,@0). The radiographs
enabled what appeared to be good quality specimens to be
chosen for oedometer tests, yet the disturbance indices

65
presented in Figure 5-2 indicate that 5 out of the 17
oedometer tests were performed on disturbed specimens.
5-3 STRESS HISTORY
Figure 5-3 (similar to Fig. 2-la) presents a plot of
in situ vertical effective stress (Fvo) versus depth for
borings El and Fl using the equations presented in Table
3-1. A specific gravity of 2.72, a degree of saturation
of 100%, and hydrostatic pore water pressures were used
to compute jvo at both borings El and Fl. The difference
between the two Ivo profiles is caused by the different
natural water contents at each site, e.g. at z = 40 feet,
wn = 54% at boring El and wn = 60% at boring Fl.
Maximum past pressure data from Tables 5-1 and 5-2
are also plotted in Figure 5-3. The open symbols for
borings El and Fl suggest that these deposits both have
the same maximum past pressure profile and the dashed
straight line is a reasonable linear fit through the data
points. Considering only the oedometer tests upon
excellent-good quality specimens, the overconsolidation
ratio is approximately 1.0 for boring El and 1.15 for
boring Fl. A normally consolidated deposit (OCR = 1.0)
is what would be expected for the offshore Orinoco Clay
since the mudline has always been below sea level and
the deposit has a recent depositional history. An
overconsolidation ratio of 1.15 at boring Fl is difficult

66
to explain since essentially the same geologic conditions
are believed to exist at both borings El and Fl. Since
boring Fl is exposed to larger ocean waves than boring
El (see Fig. 1-1), the very small amount of overconsolidation
could be caused by wave induced cyclic shear stresses
(Madsen, 1978). However, the author doubts that these
shear stresses could create a uniform OCR of 1.15. The
author has no rational explanation for the slightly over-
consolidated clay at boring Fl.
5-4 COMPRESSIBILITY AND COEFFICIENT OF CONSOLIDATION
Figure 5-4 presents the virgin compression ratio (CR),
swelling ratio (SR), and normally consolidated coefficient
of consolidation (c v) versus depth for borings El and Fl.
Considering only the excellent-good oedometer data, the
virgin compression ratio, swelling ratio, and coefficient
of consolidation have significantly different values above
than below z = 70 feet. Suggesting a distinct boundary
at z = 70 feet is only for convenience, since a transition
zone of engineering properties probably exists between
z = 60 to 80 feet.
Appendix A contains the laboratory data from consol-
idation tests and a summary of oedometer results is
presented in the following table:

67
STRESS HISTORY AND CONSOLIDATION PROPERTIES
Boring El Boring Fl
z<70 ft t z>70 ft z<70 ft I z>70 ft
Overconsolidation Normally Slightly
Ratio (OCR) Consolidated Overconsolidated
Virgin CompressioniriCor0.19 0.30 0.22 0.33
Ratio (CR)
SwellingRatin(R)0.03 0.05 0.04 0.08Ratio (SR)
N.C. Coefficient of
Consolidation 7x10 2x10 4 5x10 2x10²
(c ) in cm /sec
As shown in the preceding table, the values of CR,
SR, and c v are almost identical at both borings El and
Fl but different above and below z = 70 feet. In Table
3-2, mineralogy data for boring Fl indicate considerably
more swelling minerals below z = 70 feet. The doubling
of the swelling ratio (SR = 0.04 versus 0.08) below
z = 70 feet is caused by the increase in swelling minerals.
Also, the author believes that the higher compressibility
(CR = 0.22 versus 0.33) and lower normally consolidated
coefficient of consolidation (cv = 5 x 10⁻⁴ versus 2 x 10⁻⁴
cm 2/sec) is caused by the increase in swelling minerals
below z = 70 feet.
-1

68
5-5 EMPIRICAL CORRELATIONS
Figures 5-5 and 5-6 compare data obtained from the
oedometer tests versus some empirical correlations published
in the literature: Nishida (1956), DM-7 (1971), and Terzaghi
and Peck (1967). There is considerable scatter in both
figures, but the data are distributed symmetrically above
and below the empirical correlations. Thus, the empirical
correlations derived for the most part from land based clays
are also applicable for the offshore Orinoco Clay.
5-5 SUMMARY
As shown in Figure 5-3, the Orinoco Clay at boring
El is normally consolidated (OCR = 1.0) and at boring
Fl it is slightly overconsolidated (OCR = 1.15). Similar
geologic conditions exist at both borings El and Fl which
suggests that both deposits should be normally consolidated.
The author has no rational explanation for the slightly
overconsolidated clay (OCR = 1.15) at boring Fl.
At both borings El and Fl, two distinct zones of
Orinoco Clay exist, one above and the other below z = 70
feet. The virgin compression ratio for the Orinoco Clay
above z = 70 feet is 0.19 at boring El and 0.22 at boring
Fl, while below z = 70 feet the Orinoco Clay is much more
compressible, CR equals 0.30 at boring El and 0.33 at
boring Fl. A considerable increase in the swelling
minerals is probably the cause of the different consol-
idation properties below z = 70 feet.

TABLE 5-1 SUMMARY OF OEDOMEIER TEST DATA: BORING El
All stresses in kg/cm2 (A) TESTS PERFORMED AT MIT
z(ft) Oed. WN WL TV(Wd/Boat) Est. 'Uvo Est. Uvm CR Normal Consolidated Remarks(Sample) Test No. PI LI (ev at 5 ) (Range) (SR) 6 (10~ cm /sec) Ca(Z)
55.7 1 48.1 58.0 1.75, 1.12 1.3 0.190 7.1510.15 0.55 Good(S15) 32.5 69.5 (6.50) (1.1-1.5) (RR-0.031)
83.3 2 63.1 74.0 0.94 1.74 1.6 0.260 3.0010.30 0.83 Poor(S18) 42.7 74 (10.50) (1.5-1.7) (RR-0.060)
99.3 3 52.7 64.8 1.14 2.08 2.2 0.300 2.95±0.05 0.94 Good(S21) 31.5 62 (6.50) (2.1-2.3) (RR=0.056 )
133.8 13 54.6 76.5 1.04 2.83 2.9 0.300 1.9010.40 1.04±0.35 Good(S27) 39.4 44 (6.40) (2.8-3.0) (0.053)
133.9 14 53.5 76.5 1.04 2.84 2.8 0.300 2.80±0.50 0.6010.07 Good(S27) 39.4 42 (6.40) (2.7-2.9) (0.051)
(B) TESTS PERFORMED AT CATHOLIC UNIVERSITY, CARACAS
75 56 70 1.56 1.35 0.32 0.60t0.20 - Fair(S16B) 41 66 (1.3-1.4) (0.038)
125.5 52 65 1.8 0.25 3.00±2.00. - Poor(S25C) 38 66 2.65 (1.7-1.9) (0.077)
145.5 55 73 3.11 3.0 0.30 5.001.00 - Fair(S29D) 40 55 (2.7-3.3) (0.046)

TABLE 5-2 SUMMARY OF OEDOMETER TEST DATA: BORING Fl
All stresses inrkg/cm 2
Normally Consolidatedz(ft) Oed. WN UL TV(Oed/Boat) Est. 4v Est.UVM CR Remarks
(Sample) Test No. PI LI (ev at -a.) (Range) (SR) Cv(10:4cm2/s1ec) Ca(Z)
27.2 5 63.5 81.8 1.27 0.46 0.55 0.205 4.7310.95 0.55±0.10 Good(S9) 46.6 61 (4.2) (0.45-0.65) (0.035)
36.6 9 63.3 80.0 1.43 0.64 0.75 0.230 5.43±1.09 0.67±0.03 Excellent(S12) 43.7 62 (4.8) (0.70-0.80) (0.045)
51.6 11 66.2 96.5 0.75 0.93 1.00 0.245 5.18±1.36 0.53±0.11 Fair(S15) 57.5 47 (5.3) (0.90-1.10) (0.055)
66.7 4 64.1 80.7 1.09 1.22 1.50 0.305 4.73±0.96 0.54±0.08 Excellent(s18) 47.9 65 (6.4) (1.40-1.60) (0.060)
81.5 8 67.0 104 1.07 1.50 1.85 0.315 4.00±0.55 0.89±0.08 Good,"Platy"(S21) 64.9 43 (8.0) (1.70-2.00) (0.075) Structure
96.3 6 62.5 87.5 1.06 1.79 2.40 0.255 7.10±2.22 0.5310.13 Excellent(S24) 51.2 51 (5.1) (2.30-2.50) (0.060) 'Platy"Struc.
111.4 10 66.5 90 0.82 2.08 2.00 0.310 3.10±0.75 0.75±0.05 Poor(S27) 48.3 51 (6.3) (1.90-2.10) (0.070)
111.8 17 68.3 93.0 1.22 2.09 2.20 0.325 3.50±0.45 1.0010.24 Good(S27) 56.4 56 (5.2) (2.10-2.30) (0.080)
126.2 7 59.8 101.8 0.68 2.37 1.60 0.260 2.33±0.51 0.75±0.11 Poor(S30) 67.8 38 (11.3) (1.50-1.70) (0.090)
126.5 16 65.0 96.0 0.97 2.37 2.80 0.330 2.55±0.35 0.820.03 Excell.-good(S30) 55.4 44 (4.9) (2.70-2.90) (RR=0.075)
127.8 12 64.8 99.0 0.63 2.40 1.35 0.245 2.15±0.13 0.84±0.15 Poor(S57) 57.1 40 (11.3) (1.25-1.45) (0.085)
128.0 18 66.5 99.0 1.06 2.40.- 2.75 0.355 2.08±0.48 1.0510.18 Excell.-good(S57) 57.1 43 (5.5) (2.65-2.85) (0.0900)
.40

71
5 __ _vm m2.75
10
15
20
SYM. TEST wN TVNo. (%) (TSF)
0 is 66.5 0.51
0 12 64.8 0.30
0.1 0.2 0.2 5 10
12 1~- bi1
18 -8
0.5 1 2 5 100.1 0.2
CONSOLIDATION STRESS, Tc (kg/cm2 )
EFFECTS OF DISTURBANCE ON OEDOMETER TESTSAMPLE F1 S57
.
U,
20
c-
0C(nz0u
0
z
w0uL
E
00)c*E
FIGURE 5-1 DATA:

TV (OED)/(BOAT) E6 (%) AT Mo OCR a (m 1T.o0.4 0.6 0.8
01 1 11.0 1.2 1.4 1.6
cu
0
400
60 -
0
0-
0100 - -- --- --
* 0
120 -
0(2 TESTS)
1.75
0 2 4 6 8 10 1214 .4 0.6 0.8 1.0 1.2I I I
1.4 1.6
FIGURE 5-2 OEDOMETER TEST DISTURBANCE INDICES: ORINOCO CLAY
(-
BORING EXCELLr FAIR-GOOD POOR
El 0 UFl 0 __
0
0
0
0
- ----- -
00
o T0(2 TESTS)
I I I I
- -- -~ -0
0
0
00
@0
- -
-4Is.)

0.5 1.0(r.0 AND Tvm (kg /cm?)
1.5 2.0 2.5 3.0 3.5 4.0
BORING TEST EXCELL- FAIR-BY GOOD POORcu _ _
20 MIT 0 U
4 0F l M IT 0 _ _ _
40
60
_ _O(FI)
100
120
140
o (E1)
I I
STRESS HISTORY: ORINOCO CLAY
0
3-
a.0
FIGURE 5-3

020CR= Cc/(1+e)
025 0.30 0.35 0.40 4
BORING EXCELL7 FAIR-GOOD POOR
El 0 U20 -- ----- -
Ft 0 .
40 - - - -
VF60
80 --
N%
0--+
- 0 0._00 __
120 __1 t -- 'I___0 0
~JJ0
a4 1~ - II
nSRa C /(I+e)
005C, (10
4 cm/sec)0.J0 0 5 10
NOTE: AVE. FROM -AND LOG t METHODS
- IN N.C. RANGE
0
0
0
0
00---
- 0 .
04
COMPRESSIBILITY AND COEFFICIENT OF CONSOLIDATION: ORINOCO CLAY
C
-.1
-0----1
FIGURE 5-4

75
0.6
0.5
O3 0.4
z 0.30*vi
w
0
20.2
0
FIGURE 5-5 EMPIRICAL CORRELATIONS WITH NATURAL WATER CONTENT:ORINOCO CLAY
BORING EXCELL.- FAIR-GOOD POOR
El 0 a
- Ft 0
0
NISHIDA (1956)
uw
0
20 40 60 80 100 120 140 160
NATURAL WATER CONTENT, wN (%)

76
0
E
U:
'O
0
-J0
z
0
wc-
a.
0
0
FIGURE 5-6
LIQUID LIMIT, WL ()
EMPIRICAL CORRELATIONS WITH LIQUID LIMIT:ORINOCO CLAY
DM-7 (1971)
80
0 0
00
2 0uDO
50 60 70 80 90 100 110 120
BORING EXCELL.- FAIR -
GOOD POOR
El 0 a TERZAGHI AND PECK (1967)
F 0 0
0.8
0.6
D.450 60 70 80 90 too I10 120
77
6. NORMALIZED SOIL PROPERTIES AND SHANSEP STRENGTH PROFILES
Stress history results showed that both borings El and
F1 have an identical and well defined maximum past pressure
profile (Fig. 5-3). Because the Orinoco Clay is normally
consolidated at boring El (OCR = 1.0) and only very slightly
overconsolidated at boring Fl (OCR = 1.15),.the CK0 U Direct
Simple Shear testing program first concentrated on obtaining
the normalized soil properties (NSP) for normally consolidated
Orinoco Clay. Overconsolidated CK0U Direct Simple Shear
results will be presented next, followed by a brief discussion
of how anisotropy effects undrained strength, and then this
chapter will be concluded by comparing the SHANSEP su profile
and TV, LV, and UUC data.
6-1 NSP FROM NORMALLY CONSOLIDATED CKIUDSS TESTS0
The Direct Simple Shear apparatus was built by Geonor
and a description of the device was published by Bjerrum
and Landva (1966). The test procedures used for all CKIUDSS
tests are the same as those presented in Appendix B of Ladd
and Edgers (1972), but using cylindrical Orinoco Clay
specimens having an area of 35 cm2 and a height of about
2.5 centimeters.
A CK0 UDSS test has two parts: consolidation and shearing.
(1) In the consolidation portion, the clay specimens
were one-dimensionally (K0) consolidated beyond the in situ
78
maximum past pressure and into the normally consolidated
region in accordance with the SHANSEP technique. To assess
the quality of a clay specimen, a compression curve can be
drawn to determine the vertical strain (e ) during recom-
pression to -a and the maximum past pressure by Casagrande'svo
method. These "disturbance indices" (Fig. 6-1) will be
compared with oedometer disturbance indices (Fig. 5-2).
(2) The shearing portion consists of shearing the clay
specimen along a horizontal plane at a strain rate of about
4% of the specimen height per hour while varying the effective
stress (a ) to maintain a constant height and hence constantv
volume. The failure plane is assumed to be horizontal and
the maximum value of the applied horizontal shear stress
(Thmax) is equal to the undrained shear strength.
Nine normally consolidated CK UDSS tests were performed,
three upon boring El specimens and six from boring Fl. By
using the radiographs, the very best quality Orinoco Clay
specimens were selected for these CKQUDSS strength tests
and all TV(DSS/boat) ratios are equal to or greater than
1.0 (Fig. 6-1). For some CK UDSS tests, a was only
slightly greater than the in situ FvM, which made it
difficult to determine the virgin compression curve and
hence am by Casagrande's method.
Figures 6-2, 6-3, and 6-4 present data from the
shearing portion of the normally consolidated CKQUDSS
strength tests, which are discussed in the following

79
subsections.
a) Normalized Stress Paths
The stress paths in Figure. 6-2 are plots of the stresses
(Thand v) on the horizontal plane normalized by dividing
them by the preshear a. At the start of shearing, a
equals vc and Th equals zero and thus all normalized stress
paths start at Ev vc = 1.0 and Th Vc = 0.0. As the hori-
zontal shearing force is applied to the clay specimen,
deformation occurs, av decreases until Thmax is reached,
and then both Th and Ev decrease due to strain softening.
The normalized stress paths fall into two groups,
those for clay specimens above (open symbols: &,0, etc.)
and below z = 70 ft (closed symbols: A,E , etc.). Notice
that for specimens below z = 70 ft, there is a lower
normalized undrained shear strength (s /1 = 0.20) and
a lower friction angle at maximum obliquity (T = 200).
b) Normalized Stress-strain Curves
As illustrated in Figure 6-3, the normalized stress-
strain curves fall into two groups, above and below z =
70 ft. As stated in Chapter 2, normalized behavior means
that laboratory strength tests on clay specimens having
the same overconsolidation ratio will have similar norm-
alized stress-strain curves and identical values of s /avc
independent of the magnitude of E and vm. CK UDSSvc v
80
Test Nos. 2 and 3 from boring El at z = 56 ft have the
same in situ maximum past pressure but Test No. 2 has a
preshear i = 2.26 kg/cm2 while Test No. 3 has a preshearvC2
avc = 4.57 kg/cm , yet these tests have identical normalized
stress-strain curves. Similarly, CK 0 UDSS Test Nos. 10, 8,
and 9 were performed on clay specimens below z = 70 ft at
boring F1 having different in situ maximum past pressure
and preshear - values but identical normalized stress-vc
strain curves. Although there is some scatter (e.g.
compare Test Nos. 12 and 6), generally at both borings
above and below z = 70 ft there are unique normally con-
solidated normalized stress-strain curves irrespective
of the in situ maximum past pressure and Evc and therefore
the Orinoco Clay exhibits normalized behavior.
The normalized stress-strain curves indicate that all
CK0 UDSS tests have a large strain (yf = 11 + 4%) before
reaching the undrained shear strength. Beyond Thmax,
most stress-strain curves remain relatively horizontal up
to about 18% strain.
c) Secant Moduli Data
Figure 6-4 presents a plot of secant values of E /su u
versus the applied shear stress level Th/s u The normal-
ized moduli are slightly higher for those DSS tests run
on specimens above z = 70 ft. The Orinoco Clay (P.I. =
35 to 55%) moduli data plot between Boston Blue Clay and

81
EABPL clay results.
The data presented in Figures 6-2, 6-3, and 6-4 are
summarized in Table 6-1 and in the table below:
Normalized Soil Properties From CK UDSS Tests on N.C.Orinoco Clay 0
Boring El Boring Fl
z<70 ft z>70 ft z<70 ft z>70 ft
su a 0.23 0.19 0.24 0.20
260 200 260 200rn.o.
E /S 340 215 290 + 20 270 + 40so u - -
As discussed in Chapter 5, the compressibility and
swelling ratio increase below z = 70 ft. The reason for
the difference in consolidation properties is an increase
in the amount of swelling minerals below z = 70 ft, which
is probably also the reason for the reduction in both i
at maximum obliquity and su vc
Figure 6-5 presents a comparison of su /vc from CK0 UDSS
tests upon normally consolidated Orinoco Clay and other CL
and CH clays [Ladd and Edgers (1972) and Ladd et al., (1977)].
The Orinoco Clay data above z = 70 ft fit in well with
published test results but the data below z = 70 ft are
lower than other CH clays. As mentioned, the considerable
increase in swelling minerals below z = 70 ft is probably
part of the reason for this unusual behavior.

82
6-2 OVERCONSOLIDATED CK 0UDSS TEST DATA
To obtain overconsolidated CK UDSS strength data,0
Orinoco Clay specimens were K consolidated in a Direct
Simple Shear apparatus into the normally consolidated
region, then unloaded (allowed to swell) and then sheared
to obtain the normalized undrained shear strength at varying
overconsolidation ratios such as OCR = 2, 4, and 8. Six
CK 0 UDSS tests were performed on Orinoco Clay specimens, all
at depths greater than z = 70 ft. The results are summarized
in Table 6-2.
Normalized undrained shear strength (s / vc) versus
overconsolidation ratio (OCR) data from the six CK0UDSS
tests are presented in Figure 6-6. Several important
conclusions are evident from this figure:
(1) For the Orinoco Clay below z = 70 ft, the s /au vc
versus OCR relationship plots very close to that of Boston
Blue Clay.
(2) CK 0 UDSS Test No. 5 was performed upon a very
disturbed Orinoco Clay specimen resulting in a high value
of s /7vc (0.383). Therefore, consolidating highly disturbed
Orinoco Clay specimens well into the normally consolidated
region does not necessarily restore the in situ soil
structure.
(3) CK0 UDSS Test No. 7 was consolidated to Evo rather
than using the SEANSEP consolidation technique. The higher
s /c value (0.276) was probably caused by the decrease inu vc

83
water content during recompression to avo'
The Orinoco Clay s versus OCR relationship plottedU VC
in Figure 6-6 can be expressed mathematically as:
su vc = (0.20) (OCR) 0.72 (Orinoco Clay, z>70 ft) .... 1
No overconsolidated CK0 UDSS test were performed upon
specimens above z = 70 ft, but it has been stated (Atkinson
and Bransby, 1978) that equation 1 can be approximated
without performing overconsolidated tests. Knowing s_______U/ vc
for normally consolidated clay and the consolidation
parameters CR and SR, then:
s / = (su 1/a for N.C. clay) (OCR) (1 - SR/CR)u vc vc *..2
Above z = 70 ft at boring Fl, s /Uv = 0.24 foru c
normally consolidated clay, SR = 0.04, and CR = 0.22.
Substituting these values into equation 2, the relationship
is:
su/ivc = (0.24) (OCR) 0.82 (for Orinoco Clay at boring 3Fl, z<70 ft) 3
Normally consolidated and overconsolidated CK0UDSS
laboratory data are presented in Appendix B.
6-3 ANISOTROPY
This section is presented to illustrate the effects
of anisotropy upon F1S57 clay specimens. Table 6-3

84
summarizes the results of one CK 0 UE and three CK0 UC tests.
The stress paths, stress strain curves and other laboratory
data are presented in Appendix C.
Test Nos. TEl, TC4, and CK UDSS No. 9 were all performed0
upon excellent quality normally consolidated F1S57 clay
specimens and sheared at about the same strain rate. Since
these tests do not suffer from sample disturbance nor strain
rate differences, we can observe the effects of anisotropy
by comparing these three tests.
Anisotropy Effects* **
Test Test No. s/U CY f E5 0/s U M.O.
CK0 UC TC4 00 0.23 3.4 390 270
CK UDSS No. 9 30-600 0.20 12.5 225 200
CKOUE TEl 9o0 0.16 9+ 130 270?
As shown by the above table, the Orinoco Clay exhibits
a stress-strain-strength behavior that depends on the
applied stress system and the rotation of principal stresses.
The strength from the CKQUC test is an upper bound strength
* 6= angle between the major principal stress directionat failure and the vertical direction.
su= 0.05(at-t-a3)Cs for triaxial tests and s = Thmaxfor DSS :te-zts.

85
due to the vertical loading with no rotation of principal
stresses. The strength from the CK0 UE test is- a iowor bound
strength due to anisotropy and increased pore pressures
caused by a 90 degree rotation of principal stresses with
a2 = a3 at the start of shearing and a1 a2 at the end
of shearing. The CK0 UDSS test has an s u/E1,c value that is
the average of the CKIUC and CK UE results and this "average"
strength is deemed most appropiate for bearing capacity and
stability analyses. --
6-4 SHANSEP STRENGTH PROFILES
a) Boring El
Fugro TV, LV, and UUC strength data (from Fig. 3-1);
TV data recorded in the M.I.T. geotechnical laboratory;
and the SHANSEP undrained shear strength profile are
presented in Figure 6-7. The SHANSEP s profile was
obtained from the following data:
(1) Stress History:
As shown in Figure 5-3, the in situ vertical effective
stress is about equal to the maximum past pressure deter-
mined from oedometer tests. The Orinoco Clay at boring El
is normally consolidated (OCR = 1.0).
(2) Normalized Undrained Shear Strength:
From laboratory CK0 UDSS strength tests upon normally
consolidated specimens:
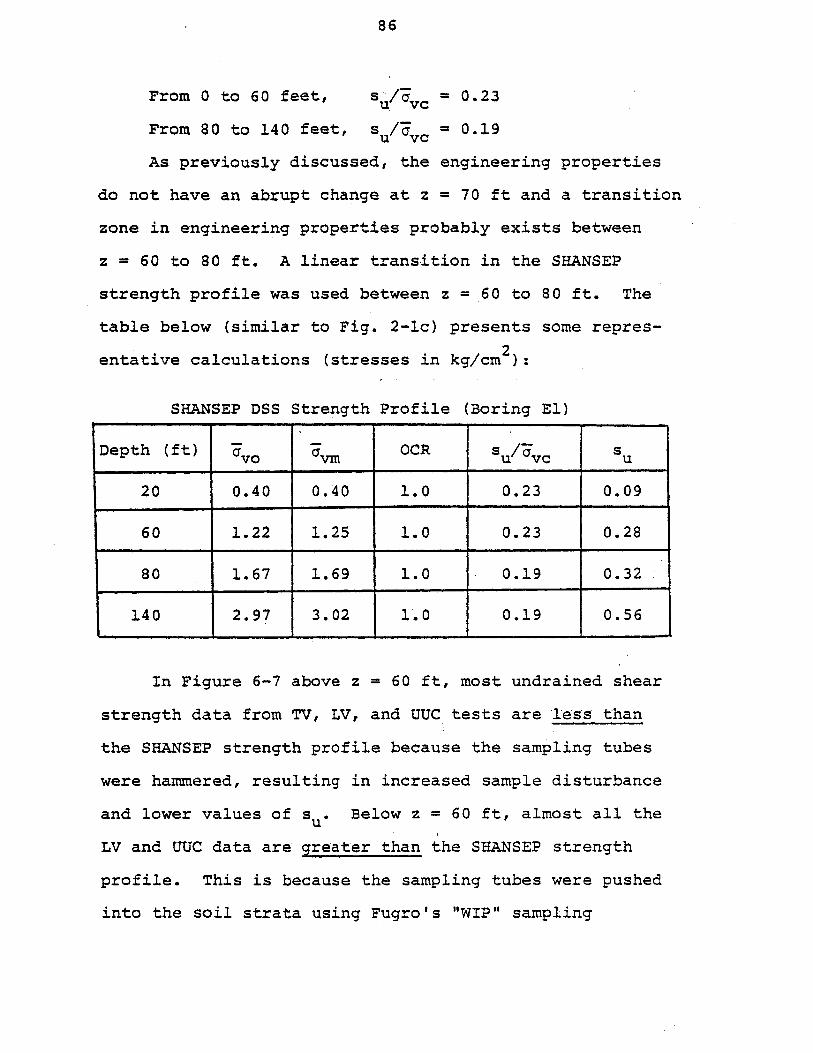
86
From 0 to 60 feet, s / = 0.23
From 80 to 140 feet, s 0/vc = 0.19
As previously discussed, the engineering properties
do not have an abrupt change at z = 70 ft and a transition
zone in engineering properties probably exists between
z = 60 to 80 ft. A linear transition in the SHANSEP
strength profile was used between z = 60 to 80 ft. The
table below (similar to Fig. 2-1c) presents some repres-
2entative calculations (stresses in kg/cm ):
SHANSEP DSS Strength Profile (Boring El)
Depth (ft) o OCR su savo ujv UFvc u
20 0.40 0.40 1.0 0.23 0.09
60 1.22 1.25 1.0 0.23 0.28
80 1.67 1.69 1.0 0.19 0.32
140 2.97 3.02 1.0 0.19 0.56
In Figure 6-7 above z = 60 ft, most undrained shear
strength data from TV, LV, and UUC tests are less than
the SHANSEP strength profile because the sampling tubes
were hammered, resulting in increased sample disturbance
and lower values of su. Below z = 60 ft, almost all the
LV and UUC data are greater than the SHANSEP strength
profile. This is because the sampling tubes were pushed
into the soil strata using Fugro's "WIP" sampling

87
equipment resulting in much less sample disturbance with
higher LV and UUC data due to strain rate effects and
anisotropy.
b) Boring Fl
In Figure 6-8, two SHANSEP undrained shear strength
profiles are presented. The lower SHANSEP profile was
obtained from the following data:
(1) Stress History:
The Orinoco Clay at boring Fl was assumed to be
normally consolidated (OCR = 1.0).
(2) Normalized Undrained Shear Strength:
From laboratory CK UDSS strength tests upon normally
consolidated specimens:
From 0 to 60 feet, s /_c= 0.24t~vc
From 80 to 140 feet, s / c = 0.20
with a linear transition between z = 60 to 80 feet. The
table below presents some representative calculations
(stresses in kg/cm 2
Lower Bound SHANSEP Strength Profile (Boring Fl)
Depth (ft) avo OCR su vc su
20 0.34 1.0 0.24 0.08
60 1.09 1.0 0.24 0.26
80 1.47 1.0 0.20 0.29
140 2.63 1.0 0.20 0.53

88
The upper SHANSEP strength profile (Fig. 6-8) corres-
ponds to an OCR = 1.15. This su profile was computed by
substituting OCR = 1.15 into equations 1 and 3 to obtain
s /3 = 0.27 for Orinoco Clay above z = 60 ft and su /vc
0.22 for Orinoco Clay below z = 80 ft. However, since the
reason for the slight overconsolidation (OCR = 1.15) at
boring Fl is unknown, the author recommends using the
lower SHANSEP strength profile for stability and bearing
capacity analyses.
From z = 20 to 40 ft (hammered samplers), most TV, LV,
and UUC data are below the SHANSEP strength profiles. Even
though below z = 40 ft better quality specimens were obtained
because of pushed samplers, about half of the LV and UUC
results plot below the SHANSEP strength profiles, probably
because these tests were performed on more disturbed
specimens resulting in lower su values.
c) Comparision Between SHANSEP Strength Profiles at BoringsEl and Fl
Comparing the SHANSEP profiles at borings El and Fl,
the SHANSEP profile in Figure 6-7 plots midway between the
two SHANSEP profiles in Figure 6-8. Hence, borings El and
Fl have very similar undrained shear strength profiles.
But by comparing only TV, LV, and UUC data (e.g. compare
Fig. 3-1 and 3-2) this important conclusion is not so evident
due to the very large scatter in the results of these

89
conventional strength tests. Thus, because the SHANSEP
method has considered the effects due to sample disturbance,
strain rate differences and anisotropy, more reliable su
profiles were obtained by this procedure, which also
indicated that both borings El and Fl have an almost
identical undrained shear strength versus depth.

TABLE 6-1 SUMMARY OF CK UDSS TEST DATA: N.C. ORINOCO CLAY
All stresses in kg/cm2
- - At Maximum Th At Maximum ObliquityZf Test UP Eat. c at0 0 T a 17Tz(ft) WN(%) vo vo vc h v o E50 h 00 Remarks
No. _(1) Y _1 Y(Boring) oample) PI(Z) Est. U £ at v te(day) ) aa a U M
(L (9) 46.6 0.4 13.2 0.99 10.9 0.238 0.576 22.5 275 27 0.170 27.7 I FAI )
36.8 6 61.0 0.64 3.1 2.02 EXCELLENT(Fl) (S12) 43.7 0.74 15.2 0.91 15.2 0.243 0.599 22.1 270 27.5 0.193 25.0 . ( E Z. 0.82) (2 )
55.8 2 45.0 1.13 11.6 0.226 0.576 21.4 340 30 0.173 26.9 D )
(E) (sS5) 33 0 1.16 1.7 1.7 11.6 0.229 0.593 21.1 340 32 0.165 26.2 GD 3)(2)(El) 0S15) 33.0 1.16 21.2 0.98 142 029059 11 30 32 0152.
67.6 18) 45.9 1.2 9.3 .86 7.3 0.240 0.635 20.7 310 23 0.114 24.7 FAIR
(F) (s1) 9 1.74 125.0 2.86 10.7 0.204 0.603 18.7 260 25.7 0.110 21.3 VEY 1GO.5 (2)
96.5 8 61.0 1.79 6.0 4.98 2nd shear(Fl) (S24) 48.9 2.06 15.7 1.66 8.1 0.200 0.666 16.7 310 22 0.145 19.3 of No. 7
128.1 9 65.6 2.40 5.2 2.86 12.5 0.204 0.607 18.6 225 27 0.098 20.1 EXCELLENT(Fl) (S57) 57.1 2.78 8.2 1.07
14 .13 51.8 2.84 8.0 13 0.193 0.605 17.7 215 25 0.098 18.7 GOOD(El) (S27) 39.4 2.90 14.7 0.99
(1) from dashed line in Fig. 5-3
(2) estimated from CK UDSS test
0

SUMMARY OF CK UDSS TEST DATA; 0,C. ORTNOCO CLAY
All stresses In kg/cm 2
At Maximum h At Maximum ObliquityTest wN(%) Est. £vo y at vo -y Th E50 l h h
z(ft) No. vm oo_5(Boring) (Sample) PI(%) Est. c £ at 5 (OCR) (%) a s (%) a Remarks
vm v vc vc vc u VC v
96.5 7 61.0 1.79 6.0 1.72 Recompression
(1) 2.40 (Est) 5.3 0.276 0.709 470 Not Reached to aIO(F) (S24) 48.9 2.40 6.0 (1.4 Est) t C 0.84 days
98.8 5 60.2 2.07 16.3 2.02 Poor sample
2)12.0 0.383 1.018 280 28 0.23 0.42 (a .)3(El) (S21) 42.8 2.11(2) 21.4 4.00 1 = 2.dy
._(1.98) __c = 2.1 days
99.8 4 57.0 2.10 8.5 2.50 Fair sample
14.6 0.337 0.986 180 21 0.32 0.36 (5 z 2.0)(3)
(El) (S21) 32.0 2.13(2) 19.1 5.00t - 0.31 days______(2.00) 0.1dy
128.3 16 62.9 2.41 9.3 2.29 Fair sample(3 )
(2) 11.0 0.328 1.073 190 19 0.31 0.32 (a ::: 1.7)(Fl) (557) 63.4 2.77(2 16.4 4.55 t = 3.0 days
(1.99) t_=.da
128.9 17 64.2 2.42 8.5 1.16 Fair sample
(Fl) (S57) 61.0 2.78(2) 13.5 16.3 0.545 1.348 125 18 0.54 0.41 (a vM 1.9/3)F7 . 23 4.9'1)t - 1.0 days
(3.91) c
129.1 18 62.9 2.42 6.7 0.59 Excellent saple
(Fl (57) 545 278(2) 9. .3 15.2 0.875 1.829 80 17 0.86 0,49 (a-vM -: 2.5)(3)
(Fl) (S57) 54.5 2.78 9.4 4.53 t = 1.0 days(7.70) t _ = 1.0 c
(1) Based on test No. Oed-6(2) From dashed line in Fig. 5-3(3) Estimated from CK UDSS test
H
TABLE 6r-2

TABLE 6-3 SUIVARY OF CK U TRIAXIAL TEST DATA: N.C. ORINOCO CLAY
All stresses in kg/an2
At Maximum q At maximum Obliquity
z (ft) Test w,(%) Est. Gvo E at a0vo vc q Eso q Remarks
(Boring) (Sample) PI(%) Est. ; (1 E at 5 K ( ) 0 5 (%) ainn vc vc C vC vc U VC
99.1 TC3 57.4 2.08 7.0 3.52 Good SampleLarge Au at
4.8 0.269 0.621 25.7 410 13 0.257 27.1 start of shec
tc - 2.8 days(El) (S21) 39.0 2.11 14.6 0.625
99.5 TC2 51.5 2.09 6.0 3.48Good Sample
6.2 0.277 0.617 26.7 300 NOT REACHED tc - 2.7 days
(El) (S21) 31.5 2.13 12.7 0.61
128.7 TEl 60.1 2.41 2.5 3.01
(2)6.2 0.175 0.510 20.1 130 NOT REACHED t = 2.2 days
C
(Fl) (S57) 57.1 2.77 4.1 0.60
129.3 TC4 61.8 2.43 3.7 2.90 NOT ACCURATE. Excellent sample
2.6 0.260 0.715 21.3 390 FAILURE PLANE t - 1.7 daysDEVELOPED AT
(Fl) (s57) 51.9 2.79 5.7 0.60 c - 2 to 3%
'.0I,.j
(1) From dashed line in Fig. 5-3 (2) Extent of reliable data

TV (DSS)/(BOAT)0.4 0.6 0.8 1.0 1.2 1.4 1.6
20
0
40
0
80- 0
100300 -- - - - - - - --
120
140 --
ev (%) AT Mvo OCR a im /do0 2 4 6 8 10 1214 0.4 0.6 0.8 1.0 1.2 1.4 1.6
2,5
CK UDSS TEST DISTURBANCE INDICESs ORINOCO CLAY
3-
La-w.
BORING EXCELL.- FAIR-GOOD POOR
El 0 U
00
03
0
0
0
- - - - - -- - - -- -
FIGURE 6- I1
- ~1~~ ~ -
0
0
0
-U- -
'.0U)

1(t) TEST SYM. BORING ww Pi
No. (%) (%)
27.5 12 a Fl 62.5 46.6
36.8 6 0 Fl 61.0 43.755.8 2 0 El 45.0 33.056.0 3 0 El 47.0 33.067.6' I v F1 59.4 47.982.0 10 A Fl 59.2 43.996.5 8 a FI 61.0 48.9128.0 9 * FI 65.6 57.1134.0 13 0 El_ 51.8 39.4
n 4 1
0.1 0.2 0.3 0.4 0.5
rv / fvc
0.6 0.7 0.8 0.9 1.0
FIGURE 6- 2 NORMALIZED STRESS PATHS FROM CK UDSS TESTS: h.C. ORINOCO CLAY
0.3
Th
oVcO.2
0.1
0
26'
ENVELOPES AT MAXIMUM OBLIQUITY
I I

0.30 -rn - u -V r mm, injinp w
5 i t k I-- I 1
0a-~o--
ZIrZIIF~~Iz (ft) TEST SYM. BORING WN P1
No. 4%) 4%)
27.5 12 A Fl 62.5 46.6
0 - 36.8 6 0 Fl 61.0 43.7 -
55.8 2 0 El 45.0 330
560 3 0 El 470 33.0676 I V I Fl 594 47.9
5 820 10 A Fl 59.2 439- 6. 8 Fl 6[0 48.9
128.0 9 0 Fl 65.6 57.1
134.0 13 1E 5.8 39.4-
a 4 6
-a--
8 10 12 14 16 Is 20
SHEAR STRAIN, y (%)
FIGURE 6-3 NORMALIZED STRESS VERSUS STRAIN FROft CK UDSS TESTS: N.C. ORINOCO CLAY
0.
00.2Th
ov c0.
0.1
0.0
ti'.0
0
0.3C
.0--
R5 -Jjpv-

96
134.0 13 El 51.8 39.4
N
_________ 4 t
(PI=21 %)7
200
100
IF____SP ____ ____ 10.2 0.4 0.6 0.8
0 BC
Lo
Th/su
FIGURE 6- 4 NORMALIZED UNDRAINED MODULUS FOR CKUDSS TESTS:.N.C. ORINOCO CLAY *
z (ft) TEST SYM. BORING w " P,No. (%) (%)
27.5 12 a F1 62.5 46.636.8 6 3 Fl 61.0 43.7
55.8 2 o El 45.0 33.056.0 3 0 El 47.0 33.0
67.6 11 7 Fl 59.4 47.9
82.0 10 A Fl 59.2 43.9
96.5 8 I F1 61.0 48.9128.0 9 Fl 65.6 57.1
1000
800
400
0
so0
afnL- I I
I I
17

0.35 1
0.30 w
0
0.250
000
0.20 - - _-
0.15 -0 FROM LADD 8 EDGERS (1972)AND LADD ET AL. (1977)
i < 7d ORINOCOx z>70 J CLAY
0.101 1_ _ .. 1__._.0 20 40 1 60 80 100
PLASTICITY INDEX, PI (%)
Fu /v- VERSUS PI FOR NORMALLY CONSOLIDATED CL AND CH CLAYS
C)
lbN1I.
I
FIGURE 6-5.

98
ORINOCO CLAY
DEPTH N.C. O.C.
z<70' -
z >70'
,1
/I,
/'I,
(0.200) (OCR) 0 .7 2
(2 TESTS)
RECOMPRESSION TO y
I-
2
OCR a rm/rc
4
Me. ORGANIC(P1=34%)
EABPL(P1=75 %10)
BBC(PIZ21 %)ORINOCO
CLAY
6 8
FQURE 6-6 EFFECT OF OCR ON Su /vc
1.61
1.4
12
o -0
W.
0.'
0
W.
I

0UNDRAINED SHEAR STRENGTH, su (TSF, kg/cmt)
0.1 0.2 0.3 0.4 0.5 0.6 0.7 0.6 0.9 1.0
X LEGEND
FUGRO: LAB VANE *20 ------ - - -_ -- TORVANE X
SUUc 0
0 MIT: TORVANE +40 -- - -_-- - - - - - - -_-- -_ - -
4 x SHANSEP DSS
a FROM tvm PROFILE (OCRaI.0)X 0 ++
60 - -- -- - - --- ----
WIP X) 00SAMPLES
80+ ++ + 6
x D0100 -- -
x 0+ x x 0
120 -
+ x 0141
COMPARISON OF UNDRAINED STRENGTH DATA: BORING El
IIIIin
FIGURE 6 - 7

UNDRAINED SHEAR STRENGTH, Su (TSF, kg/cma)0.1 0.2 0.3 0.4 0.5 0.6 0.7 0.8
- -
LEGEND
FUGRO: LAB VANE 020 - TORVANE X
Xix + UuC 0
40 meA_ + MIT: TORVANE +T p SHANSEP DSSSAMPLES
+ + +60 c0\
4f1+ X + (0: +X C0 FROM im PROFILE (OCR 1. 15)
so
MINIMUM FOR N.C. CLAY (OCRaI)X
100 -- -
04 - x+ +
X0
+. + + X 0
140L-
FIGURE 6-8 COMPARISON OF UNDRAINED STRENGTH DATA: BORING Fl
0
X-
1-
H0303
09 1

101
7. SUMMARY AND CONCLUSIONS
The Orinoco Clay is a thick deposit (30-40m) of soft,
highly plastic CH-OH soil encountered throughout vast areas
of the Gulf of Paria and the Orinoco Delta. Undisturbed
tube samples of Orinoco Clay obtained from borings El (Gulf of
Paria) and Fl (Orinoco Delta) were utilized for laboratory
soil tests in order to determine their engineering properties,
and a major objective of this thesis has been to present
the results of those tests. The engineering properties of
the Orinoco Clay are needed for the design of oil platforms
to be built in offshore Venezuela.
(a) Results of Classification Tests and Composition
Analyses
The Orinoco Clay at boring El is classified as
a CH Clay and has a P.I. between 25 to 45%, whereas the clay
at boring Fl is classified as a CH to CH-OH clay with a P.I.
between 40 to 65%. Table 7-1 summarizes the plasticity
index and natural water content data.
Mineralogy results indicate that the Orinoco Clay at
borings El and Fl has the same basic composition, the prin-
cipal clay minerals being kaolinite, illite, and swelling
minerals (smectite). The rest of the soil consists of
quartz, mica, and weathered feldspar grains with small
amounts of carbonates and organic matter (about 2%).

102
b) Radiography
Sampling tubes containing Orinoco Clay were
radiographed and the radiograph prints detected the pres-
ence of gas pockets, cracks, zones of disturbed soil, and
different soil structures. The radiograph prints clearly
indicated the proportion of "good-excellent" quality clay
to that of disturbed soil. Thus radiography was an
invaluable tool used to locate the best quality Orinoco
Clay specimens before extruding the soil for sophisticated
laboratory tests such as oedometer and CK UDSS tests.
c) Stress History and Consolidation Properties
The results of seventeen oedometer tests showed
that borings El and Fl both had an identical and well
defined maximum past pressure. But due to different natural
water contents, the computed in situ vertical effective
stress assuming hydrostatic pore pressures and 100% saturation
is less at boring Fl. At boring El, the in situ vertical
effective stress is about equal to the maximum past pressure
and thus the Orinoco Clay at this location is normally
consolidated (OCR = 1.0). At boring Fl, the deposit is
slightly overconsolidated, OCR = 1.15 (see Fig. 5-3),
perhaps caused by wave action,
The consolidation properties (i.e. CR, SR, c ) are
very similar at both borings, but with different values
above and below z = 70 ft. Below z = 70 ft, the Orinoco
Clay is more compressible, probably caused by a significant

103
increase in content of swelling minerals.
d) SHANSEP Stress-Strain-Strength Parameters
The SHANSEP strength testing program concentrated
on obtaining normalized stress-strain-strength properties
from CK UDSS tests because this type of test yields an
"average" strength (due to anisotropy) which is deemed
most appropriate for stability and bearing capacity analyses.
At both borings El and Fl, the DSS tests yielded similar
normalized soil properties (see Table 7-1) but once again
with different values above and below z = 70 ft. This
different behavior is probably also caused by the increase
in content of swelling minerals below z = 70 ft.
e) Comparision of "Conventional" and SHANSEP
Undrained Strength Profiles
Figures 6-7 and 6-8 compare su data at borings El
and Fl obtained by "conventional" practice and the SHANSEP
method. The former includes results from Lab Vane, Torvane,
and UUC tests, and these tests yielded wide scatter due to
sample disturbance, strain rate differences, and anisotropy
effects.
Above z = 60 feet at boring El, the sampling tubes
were hammered, causing increased sample disturbance and
hence a majority of the TV, LV, and UUC strengths were
less than the SHANSEP strength profile (Fig. 6-7). Below
z = 60 ft in Fig. 6-7, almost all of the LV and UUC data
show higher su values. These higher strengths from "pushed"

104
samples probably result from a combination of: better
sample quality; the fast strain rate; and consideration of
anisotropy (pecular mode of failure in LV tests and vertical
loading with no rotation of principal stresses in UUC tests).
From z = 20 to 40 ft (hammered samples) at boring
Fl, most TV, LV, and UUC data are below the SHANSEP strength
profiles (Fig. 6-8). At depths greater than z = 40 ft,
about half of the LV and UUC data plot below the SHANSEP
strength profiles, probably because these tests were performed
on more disturbed specimens resulting in lower s values
even though better quality specimens were obtained because
of pushed samplers.
Comparing the SHANSEP strengths at borings El and Fl,
the s profile in Fig. 6-7 plots midway between the two
SHANSEP lines in Fig, 6-8. This is because of the identical
maximum past pressure at both borings and similar normalized
undrained shear strengths from strength tests. But, comparing
only "conventional" TV, LV, and UUC data (e.g. compare Figs.
3-1 and 3-2) this important conclusion is not so evident
due to the very large scatter in the results.
Because of the similar SHANSEP strength profiles at
both borings El and Fl, they could be used at other sites.
Suppose a decision is made to construct an oil platform
between borings El and Fl. Geophysical survey data reveal
that the Orinoco Clay is continuous between borings El and
Fl and if an in situ test, e.g. a piezometer probe, gives

105
approximately the same results at borings El, F; and
new site, then the SHANSEP strength profile in Fig. 6-7
(which is the average of the two profiles in Fig. 6-8) can
be used at the new site for preliminary oil platform designs.
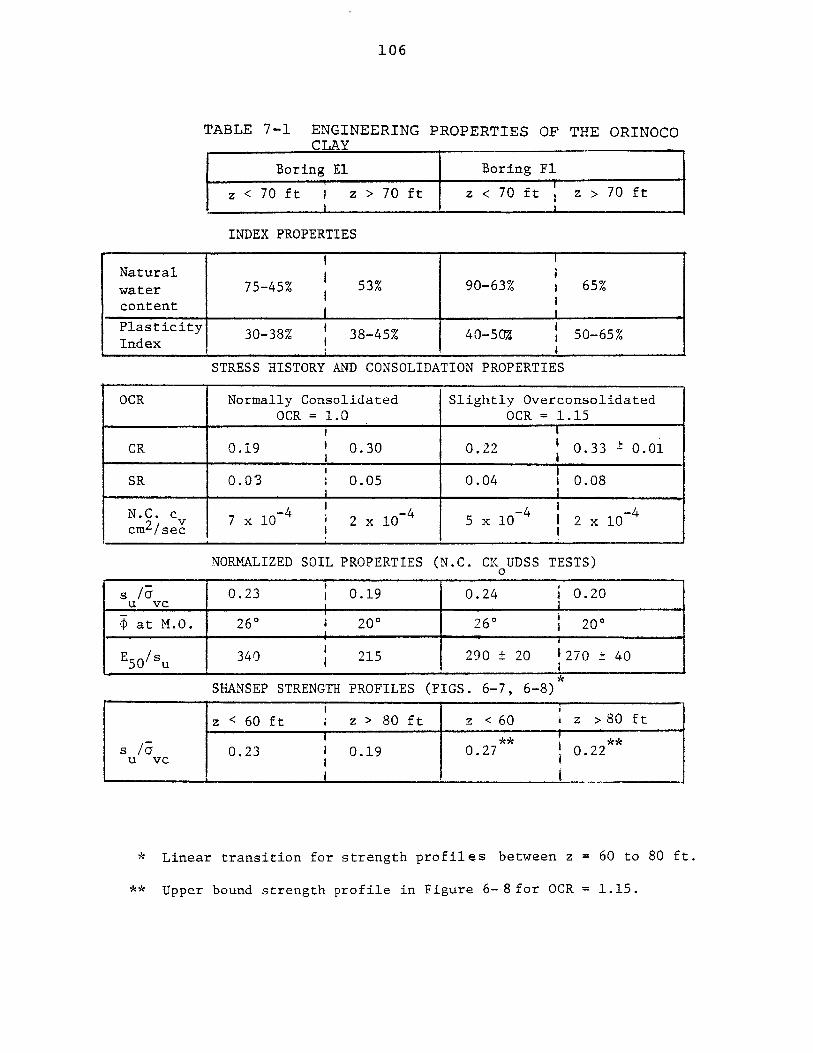
106
TABLE 7-1 ENGINEERING PROPERTIES OF THE ORINOCOCLAY
Boring El Boring Fl
z < 70 ft i z > 70 ft z < 70 ft z > 70 ft
INDEX PROPERTIES
Natural
water 75-45% 53% 90-63% 1 65%
content
Plasticity 30-38% 38-45% 40-50% 50-65%IndexI
STRESS HISTORY AND CONSOLIDATION PROPERTIES
OCR Normally Consolidated Slightly Overconsolidated
OCR = 1.0 OCR = 1.15
CR 0.19 0.30 0.22 0.33 ± 0.01
SR 0.03 0.05 0.04 0.08
N.C. c -4 - 4 -4 -4C.v 7 x 10~ 2 x 10~ 5 x 10 2 x 10
cm2/sec
NORMALIZED SOIL PROPERTIES (N.C. CK 0UDSS TESTS)
s /9 0.23 0.19 0.24 0.20u vc
~ at M.O. 260 200 260 200
E /s 340 215 290 ± 20 1270 ± 40
SHANSEP STRENGTH PROFILES (FIGS. 6-7, 6-8)
z < 60 ft z > 80 ft z < 60 i z > 80 ft
-s** **s /a 0.23 I0.19 0.27 0.22
U vc
* Linear transition for strength profiles between z = 60 to 80 ft.
** Upper bound strength profile in Figure 6- 8 for OCR = 1.15.

107
REFERENCES
Note: ASCE = American Society of Civil EngineersASTM = American Society for Testing and MaterialsJGED = Journal of Geotechnical Engineering
DivisionJSMFD = Journal of Soil Mechanics and Foundation
DivisionICSMFE = International Conference on Soil Mechanics
and Foundation Engineering
Allen, L.R.; Yen, B.C.; and McNeill, R.L. (1978), "Stereo-scopic X-Ray Assessment of Offshore Soil Samples",Offshore Technology Conference, Vol. 3, pp. 1391-1399.
Atkinson, J.H. and Bransby, P.L., The Mechanics of Soils,McGraw-Hill, London, 1978, pp. 329-336.
Bjerrum, L. and Landva, A. (1966), "Direct Simple ShearTests on Norwegian Quick Clay", Geotechnique, Vol. 16,No. 1, pp. 1-20.
Butenko, J. and Hedberg, J, (1980), "The Distribution ofthe Orinoco Soft Clay", Report by INTEVEP in Venezuela,July, 161 p.
Casagrande, A. (1936), "The Determination of the Precon-solidation Load and Its Practical Significance", Proc.lst Int. Conf. Soil Mech. and Found. Eng., Cambridge,Mass., p. 60-64.
DM-7 (1971), Design Manual - Soil Mechanics, Foundations, andEarth Structures, U.S. Naval Facilities EngineeringCommand Publication, Washington, D.C.
Fugro Gulf, Inc. (1979) "Geotechnical Investigation GolfoDe Paria, Offshore Venezuela", Report to INTEVEP inVenezuela, Report No. 79-005-5, December, 82 p.
Ladd, C.C. (1971), "Strength Parameters and Stress-StrainBehavior of Saturated Clays", M.I.T. Research ReportR71-23.

108
Ladd, C.C. (1973), "Settlement Analysis for Cohesive Soils",M.I.T. Research Report R71-2, No. 272, 115 p. (revised1973).
Ladd, C.C.; Azzouz, A.S.; Martin, R.T.; Day, R.W.; andMalek, A.M. (1980), "Evaluation of Compositional andEngineering Properties of Offshore Venezuelan Soils,Vol. 1", M.I.T. Research Report R80-14, No. 665, 286 p.
Ladd, C.C. and Edgers, L. (1972), "Consolidated-UndrainedDirect-Simple Shear Tests on Saturated Clays", M.I.T.Research Report R72-82, No. 284, 354 p.
Ladd, C.C. and Foott, R. (1974), "New Design Procedure forStability of Soft Clays", JGED, ASCE, Vol. 100, No.GT7, pp. 763-786.
Ladd, C.C.; Foott, R.; Ishihara, K.; Schlosser, F.; andPoulos, H.G. (1977), "Stress-Deformation and StrengthCharacteristics", Proc. 9th ICSMFE, Tokyo, Vol. 2,pp. 421-494.
Ladd, C.C. and Lambe, T.W. (1963), "The Strength of 'Undis-turbed'Clay Determined from Undrained Tests", ASTM,STP 361, pp. 342-371.
Lambe, T.W. (1951), Soil Testing for Engineers, John Wileyand Sons, New York.
Lambe, T.W. and Whitman, R.V. (1969), Soil Mechanics, JohnWiley and Sons, New York.
Madsen, O.S. (1978), "Wave-Induced Pore Pressures and Effec-tive Stresses in a Porous Bed", Geotechnique, Vol. 28,No. 4, pp. 377-393,
Nishida, Y. (1956), "A Brief Note on Compression Index ofSoil", JSMFD, ASCE, Vol. 82, No. SM3, pp. 1207-1 -1207-14.
Terzaghi, K. and Peck, R.B. (1967), Soil Mechanics inEngineering Practice, John Wiley and Sons, 2nd ed.,New York, 729 p.
Wilun, Z.and Starzewski, K. (1972), Soil Mechanics inFoundation Engineering, Vol. 1, John Wiley and Sons,New York, pp. 187-190.

109
APPENDIX A
CONSOLIDATION TESTS
This appendix presents typical laboratory data from
oedometer tests performed on Orinoco'Clay specimens. Six
representative consolidation test data and compression
curves (Figs. A-i to A-6) were chosen to further
illustrate the effects of sample disturbance.
TEST NO.
16
7
18
12
14
2
COMPRESSION CURVE
Fig. A-i
Fig. A-2
Fig. A-3
Fig. A-4
Fig. A-5
Fig. A-6
QUALITY
Excellent
Poor
Excellent
Poor
Good
Poor
Additional laboratory data from oedometer tests is
presented in Appendix B of Ladd et al. (1980).
SAMPLE
FlS30
FlS30
F1S57
FlS57
ElS27
ElS18

CONSOLIDATION TEST
Project /rATvCEF Type of Test srAA4b4i
Soil Type ORI__oCO
C.L.AV
Location
Initial w(%) 65--o Gs 2.72.
Void Ratio e /,7 S/6(%) /o/ /
Fl S*s
WN(%)-.o WL(%
WP(%)YO. .P. 1.(%
No.oe&-/k Tested by x.ib. Date Z A3j. I/,o
Sample Height /.'tp a
Sample Diameter 6..3,) 9,o Corrections APPA19ATv! e_"om6 -ss ,Lpry)5 5-j/ Units: &vC 7/c c Cr L 5ecJv
C>
GEOTECHNICAL LABORATORYDEPT. OF CIVIL ENGR.
M. I. T.
Remarks E. v SASEb Co too L6M to. -/lmc- cux0vf
Primary Total Coef.of Consol. Remarks_vc _t( h r Ev(%) e t(hr) Ev(%) e C (%) frogkt0,/0 .co.9 /.7,v7 - ec /. ?/? - I _
1.00 O.4/ 2. /.9ZZ~ /.'/'4 /2,.3 2.37 /.4 ______ .8_~Z,5 o.-o o 2.oo 1'3 . ?q7 q.1 0. 000 /.7/7- oz.o -3o /LL3L /.-1/ 0LL... L/-./2. /. 72q
1.33 zo.k913 1,1741 21.r-C /(. O7 97-~SL
.15,0 2.0 /3.3 0 8 /' zq.o /z.9zs /-312 - _
2.00 0-7 /6.7 7 /.3/5~ / /5.7? /,3/3 -- %_1?_. O.53 22.KI /.1 1/ 23.o z .SiZ.. .0/ _
2.00 O.47 20./0 /-/9L/ V1.7 /9. S;77 2.20c F---Si40.5~0 2.5"0 15-. C;- 1.317 ./ 15.4 0 /- o_,? WkrER
a.5' '.2 3oAl -.( 9 33 q,.'lo0 /. 41s.

CONSOLIDATION TEST
Project AITE VE P Type of Test srAb, 'A No. oel>- 7 Tested by A, w. 1. Date An r/977Location Fps o S
S
Initial w/(%) 5-1.' Gs 2'72 WN(%) -5. P WL(%) /0/. Correc
Void Ratio e /.C95 S(%)9-5. wp(%)7V'/o RI.(%)LL.g Units:
imple Height Z.35 e-#..
3mple Diameter - - s-,
t ions A rf/T ATu-s COe/O/Z /,(ry
SVc Ih/ cv <-22 s 4 .e
HHH
GEOTECHNICAL LABORATORYDEPT. OF CIVIL ENGR.
M. I. T.
Remarks E 3A6 oAj d
Cu ' .
Soil Type -- / ,Ao 0
CLA Y
Primary Total _cc((%) Coef. of Consol.VC t(hr) Ev(%) e t (hr) Ev(%) e C ) ogt Remarks
0.10 ,0 /.0 o0o00o /9, 5 0 (1950.2 O) Z 01370 6/.45, /4c o.'/z? L.~' S? _____
0./ .52. 2.t/T J. / . 2.2S /.1.3. 1._ _5
/10/ 0.99 /-5.6' 0 /q . 5.117 /.65_/.7s 2.00 f.. C/: /. 6,07- 84.i/ /./?7 / 4___7
2.So 2, 5 /1.8 7 /.395 /1./0 2.4/a7 ._34.o Z 313,5T0 2.b /5.20i /.29 5z.q2. /4.-09 2.z. O.7 / /.
/_._00 2.S 2129 1.1/24 Z/e9L 22-/62 /-0'? 0.352- --7 - y/2.00 22.S 29.406 0.397 I?.iz. 30.2V/ 6.9 o.7 z.I 10
3.00 2.06' 2.1q59 q o.8z 2,,az. 26.3i( 0.9_ __
-5.6o 6 - /9.?Y?. /./f3 70.q7 /9/o1 /. / ? F0./0 2.4 I.fJ! ."23 2 q-07,27o 35 ____
FoPA Lo6- T/ME

CONSOLIDATION TEST
Project /TrC vcp Type of Test :rAtbqb No. o0b- lo Tested by 8. LO.b. DateSoil Type opwog o
Ca-Al
Location
Initial w(%) (o- Gs z.7z
Vold Ratio e /-71 S(%) /00(.
F1 55-7
WN(%)6..bWL(%) 99.o Cor
w p(0/%/-? P.RI.(%) 5-- Un i
Sample Height 1.1_s __ e
Sample Diameter /- 4- e
rections AeeAtA-rus CorE'cW55d,3
ts:.Ty
ovc kJ/ Cv cA/s.-c
Hu
GEOTECHNICAL LABORATORYDEPT. OF CIVIL ENGR.
M.I.T.
Remarks Ev 645Eb ON FoM -o- -T/MA
(1 TU OF-b-Q2
Primary Total Coef. of Consol.____c t ( hr) E(%) e t ( hr) ev(/) e C.(%) V ogt Remarks
._ O2__ _0.0 Q 00 f-J /.7'1/ o_ oo /-'/5? ______
0.0 2L O.g /o300 /.7 /.3f /.799 --
00 0.23 7.27 . 13.07 2..z 7 /.7Zg -- _2-_x
Ic_0:.9__ _ c; 7 _ /.6S5 I. '1 _ _.. 0 0__|_. iKI3,21' /./2 .7/3 /1,1*5 ~ 6.2.5 1-.,3 zt /4,5~.39
6.'G1. C 0 1. /2- I 10 1 /-29?. 1 .2-01) ) 7e. ZG . - /2 5 1 W/ -q x xtIZ.00 0.80 2 . 8 e/.oT .7-12 ol.4 .02.q /.235-3.oo .57 2/.272 /.//1 /2.3q 23.7S /./3-
o.50 2. , /7./31 /317 ''.33 /f-. 5-0Z /-337_ 0_to '.S . ,9$ /.9' 2?.Oo /o..1 /1 b

CONSOLIDATION TEST
Project /'U TE vr P Type of Test sfAAIUWf
Soil Type 9 /A/oc.o
C tA
Location
No. ocb-r.. Tested by R. w.b. Date 1r 7
Sample Height
Sc
Initial w(%) 6Y.8, Gs 2.,?z wN(%)4/..d. wL(%) 11.o Correc
Void Ratio e /.767 S(%) 9?7- wp(%).Y/.l PI.(%) 5-7. Units:
Primar Total Coef. of Consol. RfvC t(hr) Ev(%/) e t(hr) Ev(%) e cc/) yr logt
0,0 / ----_ 0.co0 /.7?1 0 3.0X2 /.?49 _ _ _
0,10 0.19 /.?4. 6.Zo O./i9 /. __
0, 2-g 5 0? .91 {.796 /0,- 1y I?
0. 5 /.17 2.1/ 1o 2.33 Z..Ie0 /-7o9 -
/.0 /.33 ./7 /.5 2.6 9 g 1.6!- 7_ qq- 2 -
/.?.-.-- . x /0
.2. g7-4. 6P /I.q6 l ,1/7 z /2.7Y7 /.0 -_6x
?__56 2. 93 ,q(s7 /3 1q 2q.67 /6.02< 42-25 6.73q V41, qs. 20.g2-, /19L 21.-2 2 1 /./q3 0.987 2
/2.~~~~2 2., /q 3, 0g, x.9 //0-1102~O-5 06
R_ 6. F3 Z 3 . /9 6( Z.Z el 21 /o?/0.5 15._ --.-3 /.- -o 1 | . ' l3 5
.1 3 _.? / 3,oV"7 /.Yo( 21.00 /2.i7g /32. _
GEOTECHNICAL LABORATORYDEPT. OF CIVIL ENGR.
M. I. T.
Remark s E v B ASE b ON 16C () kVrI S
mple Diameter . ci--'
tions A gWArOs (OAR55/C.1rY
Cvc .-
r
Fgbeim Lo&- riE
Z.o 00 e
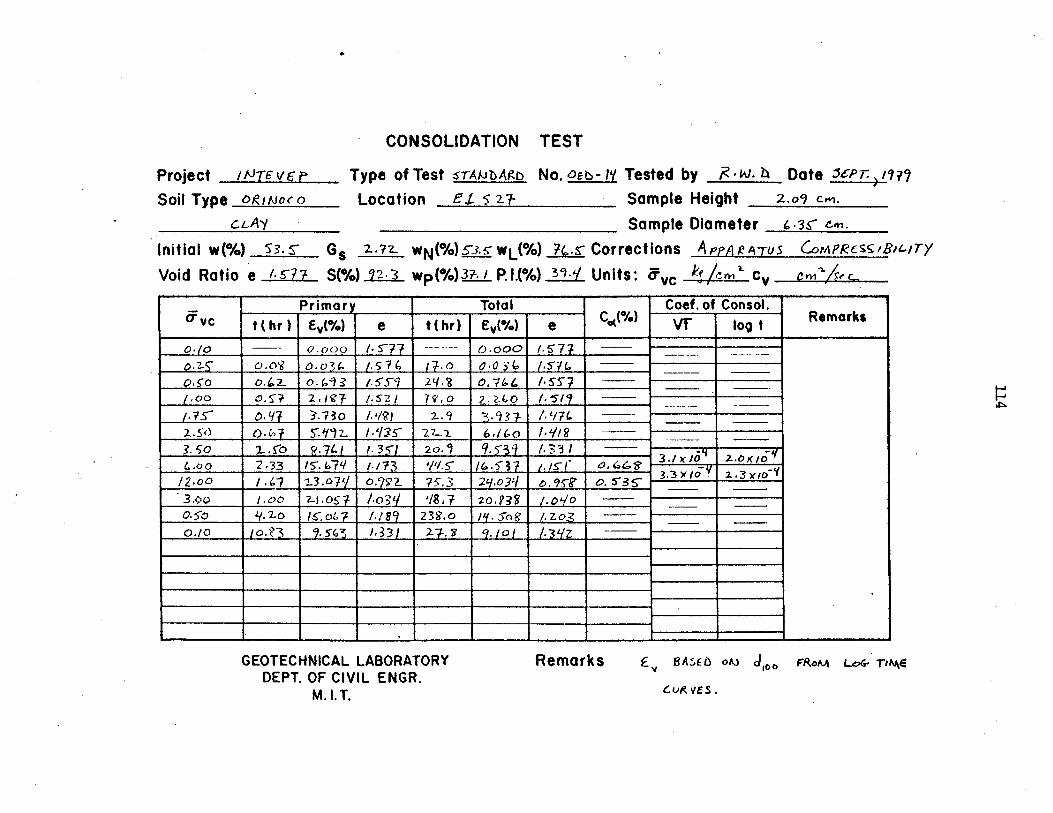
CONSOLIDATION
Project / tF7vcP
Soil Type Ogimo-oType of Test srAlTbA#>Location Et. s 2.7-
No. oEt- Tested by R- W. b DateSample Height 2.09 C'".
Initial w(%) . Z.72. WN(%) 53 WL(%) 7.-
Sample Diameter 4 - .
Corrections APPARATUS MPCSs B/Ty
Void Ratio e /-7? S(%) 72.3 wp(%)3.L./ PI.(%) 3T-/ Units: &vc kP / cA C rSIA
____ Primar y_ Total ______ Coef. of Consol.dVC t(hr) E(%) e t (hr) e(%) e C (%) Vr logt Remarks
0./o - 0.000 /.~S77 ---- .oOO /.5776.1s~ 0.03 6. 3 /.57(. 17.0 0.0 /.5
o.6z. . / 9 . 0.764 /-5S71.00 o 2.P97 /.S2/ 1. z.. /.025/. /I IS/?
/.?S jf 3-3 /.'z? 1J i 9.,( -39 -1
3.50 . ' .7C. /-.35/, 20.1 9.5j /.331 -
C.oO 2-33 /5 .7 1473 /'/.5 /6.637 ./s' *J 0,6 3./ / -I .- x/0
/2.00 / .61 .3.07 0.95'2. 75.3 2q.03 .95- 0. :'3 S- 3.3 X /O 2.3-x10
3.oo /.oo 7-.0s /-0,3 '/8,7 zo. /.O-/o0.! o 4.7-o 1,.6 7 /.18 239.o y. 5b'e /.Zo3 _
0.10- I 9-54'S 1,33) 27. F 2./o1 J1IL. __
GEOTECHNICAL LABORATORYDEPT. OF CIVIL ENGR.
M.I. T.
Remarks E V A oM J100
e..oK vES.
FRoM LoG' TIAi
TEST
HHa~.

CONSOLIDATION TEST
Project 1"TE 'F P
Soil Type 0 -4#Noco
initial w (%) is.i Gs 2.?2.
Void Ratio e S(%)
Type of Test 6r-ANbArb
Location E I. I
WN(%) L l WL(%
w p(%/) P. , P.l.(
No. oED- 2 Tested by R.w.b. Date .Tuy, 117?
Sample Height /,143
Sample Diameter 6.3Y/2. cn
,) 7.o Corrections 4PPAgArOS COMP,?-e5,8,6/ry
,) 7 Units: Svc C/c - C j%
ul
GEOTECHNICAL LABORATORYDEPT. OF CIVIL ENGR.
M. I. T.
Remarks g 13AS66 i J Fv ,, -R
Primor Total _ Ca(%) Coef. of Consol.OVC t(hr) E v(%) e t (hr) E(%) e C %) It Remarks
b,00 -- __-- o.oco -_000__
0.2 d. . 2.3 - .C
0, So 6. 5'/ 3,52. o.82- 3?-,L2. -
1.00 Q.j 4.2. 0.Z 6.-H2. __-/
2.00 0.9i /0.1s 1 -75 to. 99(. --
.00 _ .3: .?:r._ . / . '/ 30.2 1/5 //. -. 2.'. 2. //. -. - )( 10-4
l 0.oO o.7 < /3.T3 0 . 1 . / 3 15 1 ? ) 5 --2.,00 01,/1 /i .- 1 0 ?2. /4.029 x
_ ._. __ 0.(2. q.q 0.42. /9.(0 7 -
9,00 6./ 25.3 21,93 .3- 3_0
/,oo b.6/ 22.9 o.S2 22.52.-
41 .G /8./0 XI.T3 17.

116
0.2 0.5CONSOLIDATION
1 2STRESS &vC
Sample No.=FIS30Depth = 126.5 ftSoil Type=
Orinoco Clay
o At t ore At ( ) hr
hr
WN(%) = 65.0
W L(%) = 96.0wp(%) = 40.6
P..(%) = 55.4
Remarks ev(%)corrected for
Estimated
vo= 2.37 &m =280±0.10CR=O.330 RR=O.075
Gs=2.72 e =l.75 S(%)=101.1based on dIoo from log time-apparatus compressibility
GEOTECHNICAL LABORATORYDEPT. OF CIVIL ENGR.
M.I.T.
COMPRESSION CURVE
TEST NO. Oed-16
FIGURE A-1
0
5
10
15
20
.0-
z
I-
25
5(kg/cm 2 )
10
(24.0)
(2 5.7-
(2 3.0)-
0.13

117
5
10
15
>0
a5 ' '' ' ' '
0.1 0.2 0.5CONSOLIDATION
Sample No.= FIS30
Depth = 126.2 ftSoil Type=
Orinoco Clay
o At tp or
eAt (19.1) hrhr
GEOTECHNICAL LABORATDEPT. OF CIVIL ENG
M. I. T.
1 2STRESS &vC
5(kg/cm 2 )
10
wN(%) =59.8 Estimated
wL(%) 101.8 0: =2.37 &vm=1.6±0.1wp(%) =34.0 CR=0.260 SR=0.090
P. I.(%) =67.8 Gs=2.72 eo=1.695 S(%)=95.7
RemarksEv(%) based on dio0 from log timescorrected for apparatus compressibility
ORY COMPRESSION CURVE.
TEST No. Oed-7
FIGURE A-2
z
w'
3
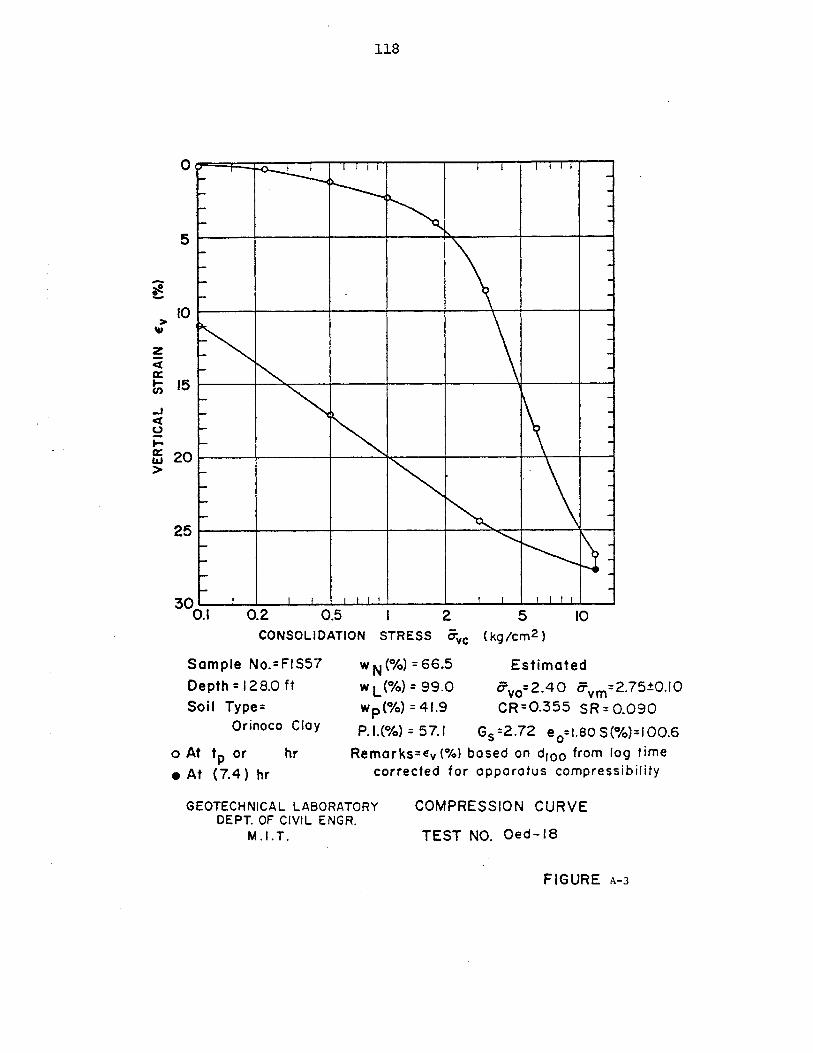
118
25
3010.1
I I I I I I
0.2 0.5CONSOLIDATION
Sample No.=FIS57
Depth = 128.0 ftSoil Type=
Orinoco Clay
o At tp ore At (7.4) hr
hr
GEOTECHNICAL LABORATORYDEPT. OF CIVIL ENGR.
M.I.T.
1 2STRESS &vC
L I I -
5(kg/cm2 )
10
w N (%) = 66.5 Estimated
w L(%) = 99.0 :o= 2.40 &vm= 2.75±0.10w p(%) = 41.9 CR=0.355 SR=0.090
P.1.(%) = 57.1 Gs=2.72 eozI.8OS(%)=100.6Remarks=ev (%) based on d1oo from log time
corrected for apparatus compressibility
COMPRESSION CURVE
TEST NO. Oed-18
FIGURE A-3
0
5
10
15
20
z
I-
I I

119
5
I I
.1I I I
0.2 0.5 1 2CONSOLIDATION STRESS ov
5(kg/cm 2 )
10
Sample No. = FIS57Depth = 127.8 ft
Soil Type=Orinoco Cloy
o At tp or* At (18.2) hr
hr
GEOTECHNICAL LABORATORYDEPT. OF CIVIL ENGR.
M.I.T.
WN(%) 64.8 Estimated
w L(%) 990 &VO= 2 .4 0 &vm=I.35±0.10w (%) 41.9 CR=0.245 RR=0.085
P.l.(%) 57.1 Gs=2.72 e =i.769S(%)=99.7Remarks= based on d, 00 from log time-corrected for apporotus compressibility
COMPRESSION CURVE
TEST NO. Oed-12
FIGURE A-4
-ir FmTT -
______ ____I________ ___________ _________ _________ 2
______ __I____ ____ I________ j
0
z
w.
10
15
20
25
3010.

120
25
30'0 .1 0.2 0.5
CONSOLIDATION
Sample No.= EIS27Depth = 133.9 ft
Soil Type=Orinoco Clay
o At tp or. At (75.3) hr
hr
GEOTECHNICAL LABORATORYDEPT. OF CIVIL ENGR.
M.I.T.
1 2STRESS -vC
5( kg/cm 2)
10
W N (%)= 53.5 Estimated
w L(%) 76.5 &v.=2.84 avm=2 .80±0.10wp(%)=37.I CR=0.30 SR=O.051
P..(%)= 39.4 Gs=2.72 e =l.58 S(%)=92.3Remarks = based on d, 00 from log timecorrected for apparatus compressibility
COMPRESSION CURVE
TEST NO. Oed-14
FIGURE A-5
0
5
S
10
15
20
z
w
.L.LL I I
F--
I -I I I i i 1 1 1 1
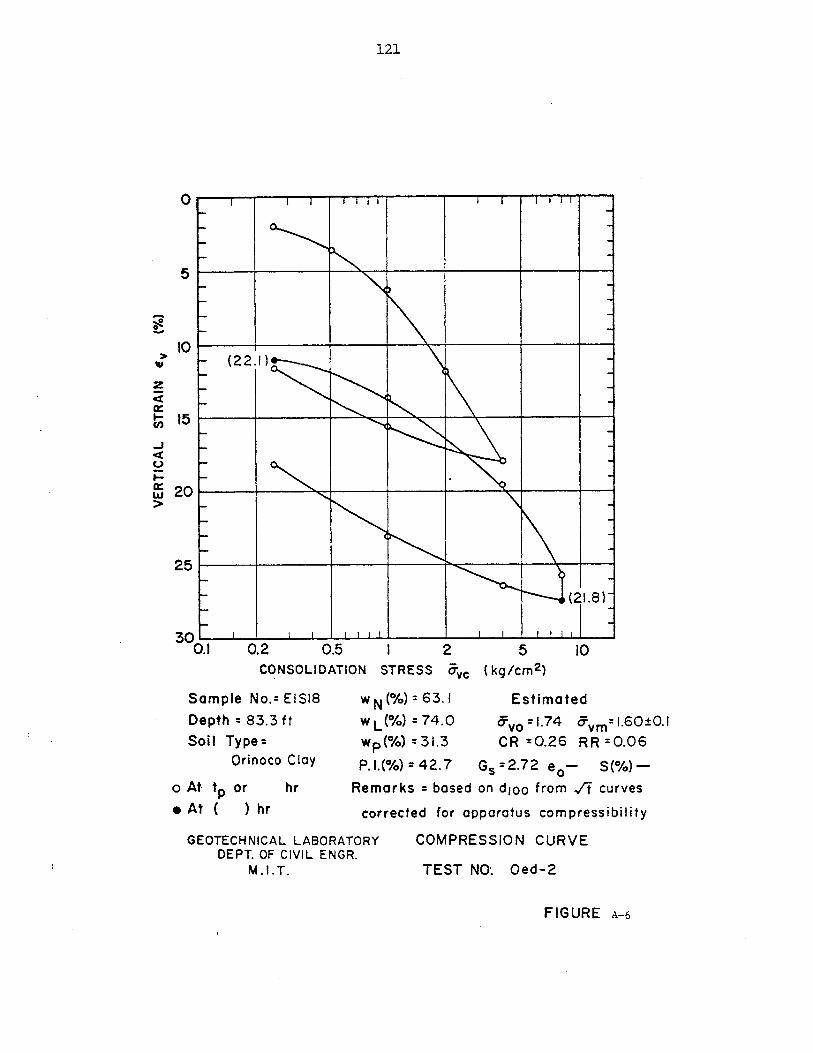
121
r(2 2.)
(21.8)~
Si I I I I -I I I I i I
0.1 0.2 0.5 1 2 5 10CONSOLIDATION STRESS &vc (kg/cm 2 )
Sample No.= EISI w N (%) 6 3 .1 EstimatedDepth = 83.3 ft wL(%) =74.0 &o=1. 7 4 &vm=1.60±0.1Soil Type= wp(%) 31.3 CR =0.26 RR =0.06
Orinoco Clay P. .(%) =42.7 Gs =2.72 eo- S(%)-At tp or hr Remarks = based on dI 0 0 from /t curves
At ( ) hr corrected for apparatus compressibility
GEOTECHNICAL LABORATORY COMPRESSION CURVEDEPT. OF CIVIL ENGR.
M.I.T. TEST NO. Oed-2
FIGURE A-6
0
5
10
15
20
6-2
z
w.
25
3
0
0
In

122
APPENDIX B
CKQUDSS TESTS
Appendix B presents representative laboratory data
from four CK0UDSS strength tests. One normally consolidated
CK0UDSS test (No. 9) and three overconsolidated CKQ0UDSS
tests (Nos. 16, 17, and 18) are presented in tables and
figures as follows:
(1) Tabulated laboratory data.
(2) Normalized stress paths for all overconsolidated
CK0UDSS tests (Fig. B-1) and the stress path for Test
No. 9 (Fig. B-2).
(3) Normalized stress-strain and pore pressure curves
(Figs. B-3 to B-6).
(4) Normalized undrained modulus (Figs. B-7 to B-10).
Additional laboratory data from CK0UDSS tests is
presented in Appendix C of Ladd et al. (1980).
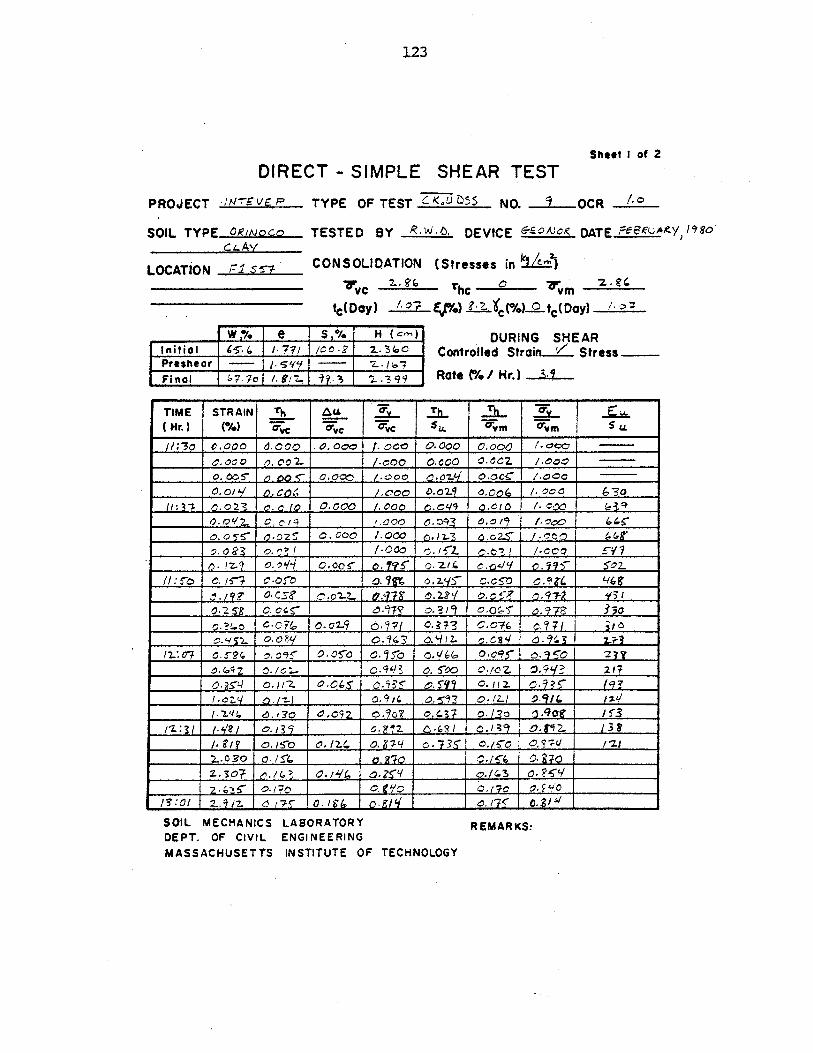
123
Sheet I of 2
DIRECT - SIMPLE SHEAR TEST
PROJECT HN7rvEP TYPE OF TEST IK-v7U55 NO. 2-OCR 1.
SOIL TYPE OR/NOnco
LOCATION Fl s"7'
TESTED BY R-14-6 DEVICE (EOA4O DATE e4,u r- 80
CONSOLIQATION (Stressos in ktc/)
fvc 7 hc _vm _22:
tc(Day) 1-07 ff/.) ?fal/%.CL0 t,(Day) -,-
w H/. e S,/ ( )
Ini ial 95-. J 2.. 0 7 oPresheor - I 6 1. / I
IFinal 1 -7 ? /12 ?.3 1
DURING SHEARControlled Strain Stress
11.399 Rate (%/ Hr.) A-1
SOIL MECHANICS LABORATORYDEPT. OF CIVIL ENGINEERINGMASSACHUSETTS INSTITUTE OF TECHNOLOGY
TIME STRAIN Th A" . 7. .J-L. .. !(Hr.) (/0) F o drOc 5. m vm5
/;30 e. 000 4. o 0,00- I.coc 0.000 0.002. /.cc, -
0.0001 0002-.. /.coo 0C000 0-.oc /._000
0. 005 6.005 CQ 0c 4.000 0.02. 0.O0c /- O c c
___ 0.023 -0- /o 0.000 /.000 0.049 .OCl /-.000 9
0.12.. c. 1.000 6.0 .3 0.o /. __0 _ _&
0.05's~ 0.2 -. coo /,000 n.2.e.2 -%O. /IW_ ._ 0r3 o. . / L 1000 .Cc a SYYI
Q.17.9 0.0 0.00- C c?. o. ZI/ o.o 4 9 Q.1 5002.1l:Th 0./5 is ~f o.g o.v/5" C.c5s c.9tC I G
2. ' a.C58 c .o* .l |.1 _.2___ c.ot n.1 ____
____ .?z. 0.7o ouZ. a-.7? 0.?3 o-G p.9li __~___
___ .9oZ. 0.0 0.'/ .9 .97? &-.11 0.os'1 c.1
/2-'0'7 o.s5-of. 0.0 5-0O. f 0. c10.<,/ 0.095 o.35" j2j___ .G92 0./01-- 0 -9q5 o.5-00 cX/'2. ni'? 217
___ .gs'q c.I!'z 0.c0S' c.9? 2.j1j c.n1. c.9?f (9______ .z 2.... 0."9i( O. ~ O-./2./ 0.9/4, /2./
____ 7L41. a./?Q &,C92 o.97 0..C3 o.12o 1.90g' Is-P'2.'1 p.4/1/ o.;35 0.??2. 6-.2 C~t 0.02.. /39
;I./S . o e,/2.(. ./.J/? 0.0. C-77d /'______
____2...O30 0./5-4 9g jlf O. Q.s? 4 / o.gt;, o0.-1 o./C3 .07-- 2 . 0.c .2 n . .. I__-8 0. < 0 3 L;"-
7- :0( 0.5-21. 015 05Jbc 0. __ ro 0 .,(,0
REMARKS:

124
4
SOIL MECHANICS LABORATORYDEPT. OF CIVIL ENGINEERING
REMARKS.
MASSACHUSETTS INSTITUTE OF TECHNOLOGY
Sheet 2 of 2
DIRECT - SIMPLE SHEAR (continued)
PROJECT /WrveP SOIL OR '^10CO <-A"TYPE OF TEST LNO.
TIME STRAIN Au 3. lh i. __L(Hr.) (%) C =vc avc U vm vm _
3.'9 C.l'1 0.2-4 0.820 . 0. o2.0.S,'? 1 Q a 1 0,700 _.__ _. _ _ _
?.l13 o.Zf'- 0.7 90"/ l _ o.09 - ____._ _ 0_90z.4 7 '7 2. o.0 0.70 S. 0.0 /_?7L/1
r'.3I 0.1j- -4 0-1 6._;57 _.-8. 1 , 1 9 6. x 4 . / .,4
S .5'2 c.lt __.__. O.? .- 0 _ _0
_____ ./34 0. 1' 70 . .. -j3 0.44?/.Zo 0.7(.3 _____
/O.2A 0 0.2j 0 0 .. 0.2o 0.4/ _r._C
C.3/1 6. -zoo 0.3'2.. 0o otO z.ooL 0. 2?0
1,-7 - 6 .2; 7 0.f,/aZ3 - .0. (,( 3
z.T,3R 0. z. q 0.: 9 t.a,, C;.0 c1r,/ 1:o / .'2? Oo., 3 0 - 31 0G29 O-2 0.02.5 20q S
/IT: 0 3 .l _ 0. ? (_ 0, q _ 0_2..4/ 0.___ _ _ /..32 c.2.eV C-.93 0.o7 __.___ .- ,o? _ _ _ _ _
_ 3.(. .2.0.0 40n'z . _____ . C.-4 0.1____54/5:5o I9.or., 0.. __ __ .__ _ ____ ,_ 4 a __ __ _
f2 .94 O.2.a2. 0-4'? o.5-; _. , 0.507
2_ _ .0 3.f CA7 0*5 33 ___ _ o-4'3 _ _ __
_ _ o7.7 4 0.15q _0.0 0 0.- C _ _
/ . 12. n. 197 0. -fg 0.q12 0. a5/9 0___ __ 2.?'/C o,1 /eL o. (2 /9 ____ _ _.__ __
___.' ;.o'9 0., . . o.(oc o o.104 o -I$0 1 __ __d
___.? 2.i7 o.'3! Oo Z c.C o.3' ____ c? 2 0.34'2 .'70 o./3. 0 ./,6 0.-370C.G o.
2.7.073 0./34 _.4__ _- I2 .4/ . . 0.490 ?-W20 o./ o
143-970 Z0./3q7 0-72-0 0 -'Z70 0./ 1 .370.Zg.2.1 o.,i' o.4.o c.?zo _._ 0-3Z.0
iV.2.5 2.*3 0.IQ02 0.Z2. .217 ____ 0.02 . 2-'0 __
2..2' Q.C9T 0 . 2.G ____ . cW o.z __.:__

125
Sheet I of I.DIRECT - SIMPLE SHEAR TEST
PROJECT ILTIE/P TYPE OF TEST C NO. OCR
SOIL TYPE9L . ".o TESTED BY 2- DEVICEGE COR DAT E
LOCATION 7 CONSOLIDATION (Stresses in )
vc Thc _
fc(Day) erf.) /X:. C(%).- (Day) -3,w */ Ie S,%/o H ( ,m)
P sin i hi a r -0,9 '/-7 3 .1(0 2 -pPreshear /4 71, 1 - 1 -.. /
DURING SHEARControlled Strain '--'' Stress
SOIL MECHANICSDEPT. OF CIVILMASSACHUSETTS
LABORATORYENGINEERINGINSTITUTE OF TECHNOLOGY
Final V.D / . 6 1 Rate 0/%/ Hr.) S. b
TIME STRAIN Th A&L 7 .rh.. .. j jF
Hr.) (1/0) 'Fe -1v c r m O m
,/'Ls O.oo0 CO(Oo o~c /. -- 000Oi'n,025, 6.nzo 0o~c /.ooo - 0-010 0So,4
o-OSS 0.6 0 no ccou /.ooo 0-o .c .C015' __-j.T 4 Y ,
in o - 0 - .00G. /.- ao 4 l ,/77 I0-o29 o.sCo7 3n, 24 .i3( - / -. Q..' t Q0A 2 ? I --. 04t 2.0. , i .0 - ./57 0. -3( -0.o1 /,109 O._ 1-cq _s__ __6;
0,7;i 0.-17Z- .- -V Z. _.5. n.067 IO I?1 / 1221 0.207 -m -,7 /.0 -67 /.4 . 10.t4 _7 / _7
2.ol.74 0.27 ,. . / 7 / o. a /t-_It_ '_ _ %'11 O.32.( -. 1., /.//g' O.92o q ./3 3 0- S . _ _
././ -0.215 C - 7 7 ? .0- e7 111 ^_Z-*, //3i a.29? -ej . . /, // o I.' r, c> -5c 2-
Z. /O 0.313 2 ./7 /4 0? 7 j. 0 -2 5.7 214r 0.?z.o-17 oS97 no 07 n 4'_.7-11.1y' o."3.- -0.072 A,072 0./6' 6-5 4//. 023 S .10 .? ...n-.07n I 0. y 7.45 0.,7-1
H. 31? 0.32.-7 - at /,/ -- 2 ")/34 1.3-5/2
/ 272 0.',116 0.0( O-- .. 3o 1'^./60 n - IqO
7q,3. / 0. 7so 10.n q.C .2 .5 .
24. /0Z- -77 ^O, 2 0-72 151o e4/9 7 ,
.24 .. reI 0.2zTZ 0. t7l o.3Zj 0,jo5 -,./27 c).4 1717'./T 127,407 /0. 20C T .-85 0.905'C -30q 0, /Z. 3 10- cof
REMARKS:

126
Sheef I of IDIRECT - SIMPLE SHEAR TEST
PROJECT INE\E/? TYPE OF TEST C utD- NO. '7 OCR 3.1
SOIL TYPE C4 TESTED BY A a DEVICE - DATE _o
LOCATION 7 CONSOLIDATION (Stresses in
Tvc _hC_ _
fc(Day) - Ep/.) 4-:.. fc(%/)- tc(Day) /A 0'
W,% 6 H (C.)
Initial (i. 2 /- I% I~I7I. u.I4 cPreshear -- / -171Final 27, I .
DURING SHEARControlled Strain Stress
Rate (% / Hr.) 3-
SOIL MECHANICS LABORATORYDEPT. OF CIVIL ENGINEERING
INSTITUTE OF TECHNOLOGY
TIME STR AIN Th A_ F _ h _(Hr.) (%) Fc avc vc Vm "V I
-oo ~ o-coco /ceo ___ 0C-coo C~r.. -
o.olg O.0 O.. /,ooo --- ,. c.-0.0 ?( o~n c-0*6 /- o4 0-14 . -/?V
0.3:';4 -o-i;, /C3 .I 1.02L !.40 ___ ___
4 ._ / / I 0 7-3 -. V 7o i-C. 14 0.i 'j f.,9? 2 D
/ n 6.2(5 -216 /./4/ .4 .y. . 1 /3/
_76 o.2 - .3q0 __ _ _
72. 7 . .. -- y o /,9 0-40r 0.09) 1 n03/ -. 9 -, / >.(,/95- 0OP7 2.3 9 _ .
3.77K& 0. 40-4 -o. . /.Q .. 7 Sit o.//c3 .3 Z o. 777 i -z / - ?i Afl? 1 0 229 .3)31 C
6 . /4'2- 6 .4'-, f- 0. . .1 40.\I c. 97, D3 I 79 - 0-d-i/. CO ioo n.IK 0.1
/C,,, 350 - . /, %41?/3 c iM
1* /il IT 1 . 3 - 1,j 3V4f 0 9 1. /2? a. 3/_&, , .43 -c M / f (,0 Ir" 0/1 0 .3,
173 : 05 7 , 13% 0.0 ,D 34;2 Pg
/cM .4 3 -1~ - j 6, 0.4O 0,/3? .392 . 21 0.09-2Z j. 0 -11 0f 0~ -, /2/ 3/ q
17'.lo~~~~~~~~~ .0Ms ~/ .s //N 2 9o/(. o i
REMARKS:
MASSACHUSETTS

127
Sheet I ofDIRECT - SIMPLE SHEAR TEST
PROJECT lMT)JE TYPE OF TEST NO. 1 OCR 7-~70
SOIL TYPE c A TESTED BY DEVICE GEO102C. DATE Igo
LOCATION 7 CONSOLIDATION (Stresses in )4vc rhc - - vm
c(Day) OZ.)tDING (DARy)
w % e S,% H ) ^
Initial -M/7% S6 . D. 4,Presheoar 70o ----- 2.0 iFina l.
DURING SHJEARControlled Strain- Stress
Rate V%/ Hr.) 3.?
TIME STRAIN T1 . A M T Tt h 0 ( Hr.) (s%) Fvc O7 vm IF m ovm
/L:. 0'e, il 0.0339 n. n - c., _
0.06a O.C94 c z '. .9 jal 1 _ _ _
0.1 a lo jq 0.N -o.u /,4q Oqo n. /42 o oll o/3. 2 7
(:4r o. 4 . -0.-S . - . a. . _____ /720. 7Z2 0. "1 - 0.194 /. - .331 In g 32 0./q= /Ii/n
S/./5/ 0-3S4 - -1./ .4c,5 LnA 4 6 ./6'/ /0 S _
___/, ~o5 o.37 o / L oL~ .i. .. pOJ/g 7.2. 6't g.47c - .3012 ./. 2 o ; 0.537 6- jl6 . ./ 7" c 19
36 3. Y o.5' -o.330 /,332 t -/. ? b.- 0. /7 3
r.,13 3 0.54/ -6, /MS $ 57 .1, a,6 012 r -0 1IW_3_ 0./ # 47 /. e 0O RS ( ./I L____ 'o O.?? - - N / -su oo o,~, ___ __
7./7/ 6. 7' . -t-3 3 . 2/0
/3: 3 , r o. 772 & L,41I2. 41 01 .03 0. 3 _
/,___o- 31 -. 5 j/,7~ 7't II (N ,7 .23
4_ 7 -7 1 - 0 -4 1 1 - o .Q 2L / . 2 64. -i23i1
_ _ _ _ /? 7 - a .. - / 1 9 0 .. / 5 1 /0 1__._1
7 .5- 1 5.7Y- -e-6, / 2 Yi Z O.o'f 0.,217 . 7 /6, 196 -O.'Y 11 () . 4 0.010 0; 1154).?/ / 6. 5 7 -6.9 { ' 1 0-41 c o .0 5 _a 2ol
22.3, 0 - T'f-D - 0,q / I /','7 o40f 1,0 t I~o Z'3., Y.2 r>.71 11. '171Q 385 _ 0at TYo, I.191
SOIL MECHANICS LABORATORYDEPT. OF CIVIL ENGINEERINGMASSACHUSETTS INSTITUTE OF TECHNOLOGY
REMARKS:

Test Sample No. Depth wN &Vc 6vm OCR SymbolNo. (f t) (%) (kg/cm 2) (kg/cm2
7 FIS24 96.5 61.0 1.72 2.40 1.40 0
5 EIS21 98.8 60.2 2.02 4.00 1.98 0
4 EIS21 99.8 57.0 2.50 5.00 2.00 A
_ ____ F S'1 I11(.1 4. .E 1..1 l.f 0
I9 FIS _________ 6a. 1. 0-;, o '1 115 7. 1o v
GEOTECHNICAL LABORATORYDEPT. OF CIVIL ENGR., M. 1.T.
0.4
0.3
0.2
0.1
0 0.1 0.2 0.3 0.4 0.5
v vm
NORMALIZED STRESS PATHS FROM
0.6 0.7 0.8 0.9
BORING - SOIL TYPE ORINOCO CLAY
0rh
0'1
:0mn
to.
Ht'J
1.0
CKOUDSS TESTS.

liii'
I~1j ii
th~L
i-fIf'
ii'fiT
"ii,
li-n
44;
II~iIi'
Fi~
I
Ii
I.Ii
'if:1
~i1Jilt
iiJ~iii:14
iiiII
ill',III
lIDii"
I'!"I
IDI'Ini-LiIi,
'11
Ii ll
iD-f~'IfI
Fl,
14~
1~ili-ti
tEL.
0 0.1 0.2 0.3
NORMALIZED
it oi'Li4ij{
ii
44
hi
$itill
i~If"444
4:4
iii0.4
In,
'Ja
144
i
If',
ifl~t1
14t
fin
,11L 1
'i-f,~tii
1I
ii
it,-''
'if
0.5
av / vm
if
ILI-
0.6
ff1'Hi
liii
ii-:it"
-liltIi Iii~
IiIiIf"iL
0.7
GEOTECHNICAL LABORATORYDEPT. OF CIVIL ENGR.
M.I.T.
"''Il
4,-iy~
I';
ill'ftDIi'
III'~IIn,
II
'Utff1-ItittLI
ih~ I
in
'flu
I,,
K
I'llliii
Im1
.1liiiii'ii
IJiFiii~
I 44
till
0.8 0.9 1.0
STRESS PATHS FROM CKOUDSS TESTS
Boring Soil Type C O^-w( (A
Test Depth wN &vc Ovm OCR SymbolNo. Sample No. D%) ( .
S Fic,97 //. d(,OE470 -o-
0.4
0.3
0.2
Th
6vmn
to
0.1
-Ti
GCP1
0
i;;,144441 4
------
Illllllllilllllilllllllllll I Illll lilllllllllIlllli

130
*........................----
~~ 4:
-- --- - - - - - - - -
itsr ----- -------
77~ -7-
t:
.0
.2 ... .. .. .
... .....-.-
.. .. . .. ... .
-- -- -- --
.. ... . .. -- ------.. .... .. .. . . . .. .. .
..:. .. ...:7 - 7
n . .. ...... .... ....5~. ..-..2..4
5 10 15SHEAR STRAIN X'
20 40
(%)
Sample No. w N &vcN(%) ('z' A 12 t c(Days) -L>
Depth(.) /2.L wL(%) & Svm(4/ ) OCR /o
Soil Type C 0 0 c wp(%) I Estimated &*o(A // ) -.
GEOTECHNICAL LABORATORY NORMALIZED STRESS VS STRAINDEPT. OF CIVIL ENGR.
M. I. T. CK.UUDSS TEST NO. 7
FIGURE B-3
0
vh
cVC ,
1.
C
Aurc.
0
0

.. 7~~_ __ _ :71 ::: 77: ... .
20
SHEAR STRAIN Y (%)
Sample No. FWs7 WN(%)i 0.cI avc( /,-z )2210 tc(Days) C-9
r+)t /zF w L(% 10' a vm(/ )M OCR /?PC
Soil Type C O--o w p(%) A Estimated aGo/ / ) 2/C U
GEOTECHNICAL LABORATORY NORMALIZED STRESS VS STRAINDEPT. OF CIVIL ENGR.
M.I.T. CKoUDSS TEST NO. ___
FIGURE B-4
131
I
4jK.p -..
7L ---t- ii7:T h
I',
--- - ---- ----
t
H:p
... - . - -- -
.....-.. ... ... ......... 4
7-p ... -..-.
b.777t:-- ... ... -... . . .... .. ... .. ... . ... .. ... ......... ..........
-.7 i 'A
A
VC
0
0 5 10 15
0.&1
T-T -T Ti y T F E T

132
0 5 10 15 20 3w 40SHEAR STRAIN 2r (%)
Sample No. 'S 7 wN(%) k' ( d - ) tc(Days) i
Depth(#) /4 - wL(%) o&vm(6 /~2 R 7/
Soil Type - w p/(%) _ Estimated avo(k ) 2lC-Q
GEOTECHNICAL LABORATORY NORMALIZED STRESS VS STRAINDEPT. OF CIVIL ENGR.
M.I.T CK.UDSS TEST NO. /7
FIGURE B-5
- - ------ --
T , -- - - --- +--
K - H H
77-- 7 p *
:=. :4 - - rz:*
Th C
5~vc
0
uo-.v c
F F t-.... -.. - -.... -7
7 . ... .. . ... ....
.. . .. . .
... . .. .. . ... .
-.. .. ....
0 5 10 15 20 _A_
O.z
.) .4
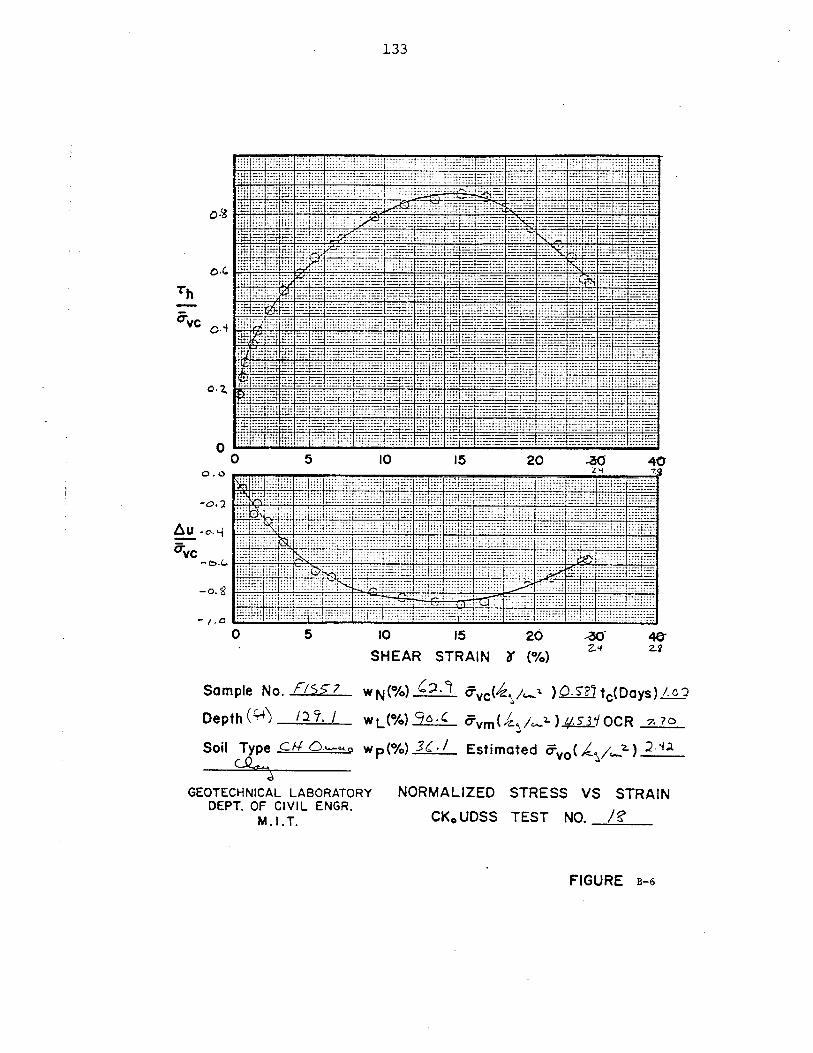
......... . ..... . 1::. :j 7 7":
tr 7-. ....I ....
t
...............
.... ...... .. .... I--.- ........... ..... .. t77:::777- .... .....
I ---- ------ .... .... .... ....
.... . .. .... I... --------- . .. ....:
-:1:7
7:-_: 7
----- --------- "-t-=7.' =7
Z-47--- J:7- :r7=
at
-- -------- ------------------- ---- ------ -............... ----- --
.7+
:7.:
HH..=
tt,
0 5 10 15 20 -30 4C...... .........--------- -........ .......... .... .... ................ ......... . ...... ............ . -------.... ......... .. ............. ... ...... ...... 1' -11'........ . ...... ......... ......... ......... ........ '-7 7: t:
:% _"1::: . ......... ... .... I .... .I .... ........... ........ 1 1. --:........ . ..... .. .... ....... -..... :.. . - -- j .. ..... - ---------
. ......... ......... - -,::::: --.. .: -: .... .......... ............ ..... .. ......... I --------
.......... . ......... .
..... ......... ---- ------------- : ..... .... ........ .... ...... .........
.. .... ...... -7 ....... . .......... .........
z.:: ..... ... 7-7........ ....:-:1 7= ......
--------- ----..... .........
.. . ... ....
7 .. ........ ---------- .. ... ........ ......... ... ......... .... ..
.... ......... --------
Sample No. W N evc(/z4 tc(Days)Depth (;4 0 C R -7. 7 0
wL(%) a:vm(
Soil Type c14 (0,4-4f- wp(%) Estimated &vo(/C
GEOTECHNICAL LABORATORY NORMALIZED STRESS VS STRAINDEPT. OF CIVIL ENGR. CKOUDSS TEST NO.M. 1. T.
FIGURE B-6
133
Th
O'vc 0.4
0.2.
0
0.0
0 5 10 15 20 -W7a
4er2-T
Au -0-,j
c'vc
SHEAR STRAIN a' (%)
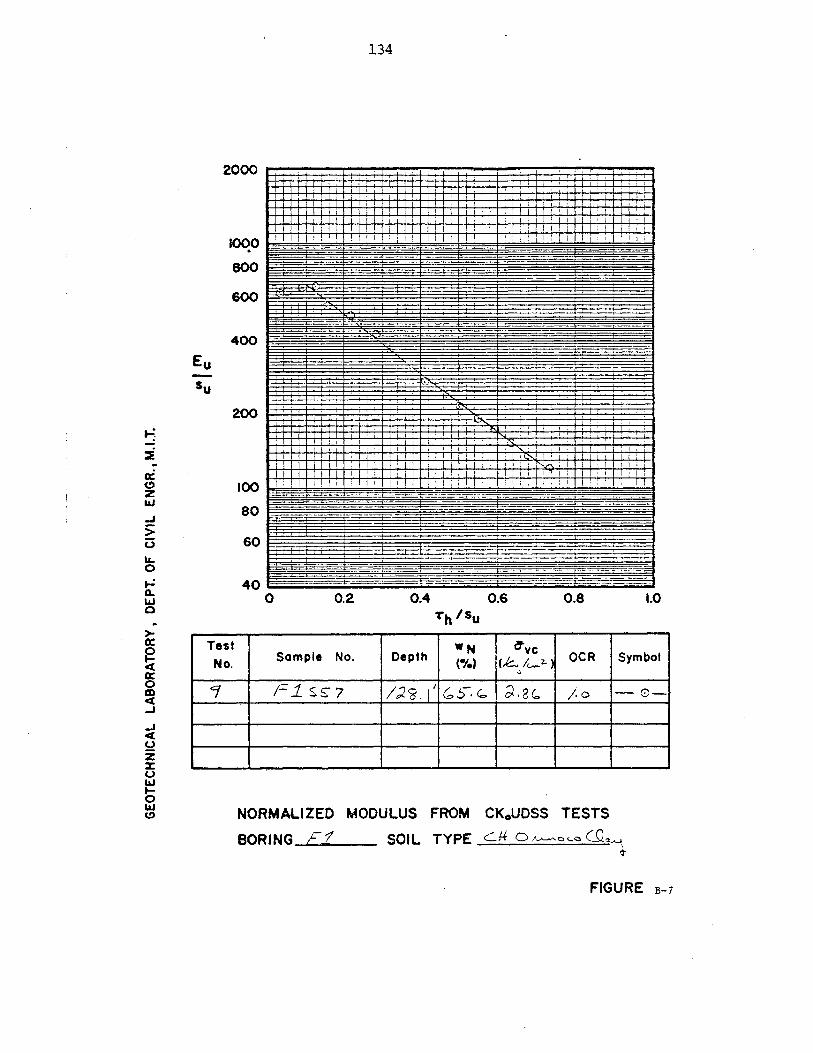
134
2000
i fiI iI I
1000
Soo
600
400
100
80
60
40L0
I (IN
+11 II I
0.2 0.4 0.6 0.8 1.0rh /Su~
Test wN vNo. Sample No. Depth WN V6 OCR Symbol
___ /-_ _S-7 /.)'G5~ . o - 0-
NORMALIZED MODULUS FROM CK.UDSS TESTS
BORING zl SOIL TYPE c < C-Q
FIGURE B-7
Eu
su
200
z
0
1-;w
0
Ix
0
0z(D
411 i i i i H I, + i i
! 1 1 it 1 1 ! 1 j 1 ,

135
I L i I I! ! ;I I I I I
2000
1000
800
600
400
I MIII i
0.2
I I
0.4 0.6 0.8 1.0T'h /Su
Test wN vNo. Sample No. Depth WN VC OCR Symbol
/S 5' i7 /2 .3 (o). 2-;J,0 6 -Q
NORMALIZED MODULUS FROM CKoUDSS TESTS
BORING f. SOIL TYPE O ke- e
FIGURE B-8
ii Ij ~*jiIII II
I IIII
'I
EuSu
200
100
80
60
40 L0
z
-
0
CL0
0
w
0
0
1111fi-1-11
I I I I I I I I I I I 1 1.
11

136
2000
1000
800
600
400
I I I I
Eusu
200
100
80-
60
40 -
0
I I ) I I i 1i i iI iI I +i1.11 I i IL
11 1
0.2 0.4 0.6 0.8
7tI
I I I i
1.0Th/Su
Test W NNo. Sample No. Depth g VC OCR Symbol
17 F-/__D-~7 _/2. V.2 /'/ / SAI ---
NORMALIZED MODULUS FROM CK.UDSS TESTS
BORING LL SOIL TYPEC4 O - C-
FIGURE B-9
0zw
-
.-0
Fa.
0
ca
.a0co
w4
0.
-
I I I I
~I I I

137
~I[F
I II I I I II!iiliii IF i~ j
1 1 1 1 1 1 1 M 1 1 1 1 !-q 1 1 I M I l ! ; i i ! ! 1 1 7
0.8
! I ltII ! ; L i II ,
II I I I I ',Ii I I I I I I -
N I i
0.2 0.4 0.6
'I .'
I I i
i I I
1.0
Th /su
rest wN vNo. Sample No. Depth WN YC OCR Symbol
/___ __/____ /2./t. ( . o.si 770 0
NORMALIZED MODULUS FROM
BORING F1 SOIL TYPE
CKoUDSS TESTS
C'a cL 4Cla~
FIGURE B-10
2000
1000
800
600
400
Eusu
200
100
80
60
40
C9z
U-0
0
uJ
0
I.-0a:0
0
4+4I i I I
I I L!17 -1,
tt+-t
I I ..; I
; i i
I ! I i I I i i
I j ! I i i , ! i I : ;

138
APPENDIX C
CK UC AND CK UE TESTS0 0
Appendix C presents laboratory data from CK UE and
CK UC tests. The following data is summarized in this
appendix:
(1) Figure C-1 presents the stress paths for all
triaxial tests.
(2) Figure C-2 presents the stress-strain curves for
all triaxial tests.
(3) Laboratory data from CK0UC Test No. TC4 is
presented in the next two tables.
Additional information concerning pertinent test
procedures can be obtained from Appendix D of Ladd et
al. (1980).

z (ft) TEST SYM. BORING WN Pi I24.5 , 27.0.3 No. (%) (%) -
99.1 TC3 0 El 57.4 39.099.5 TC2 A El 51.5 31.5
0.2 128.7 TEl O Fl 60.1 57.1
I'l.3 TV 9 Fli 61.8 519
0.Iq
crvc
0.00.1 0.2 0.3 0.4 0.5 0.6 0.7 0.8 0.9 1.0
-0.1 OF
q= 0.5 ((V - Oj) .
-0.2 p=0.5(&,+-
FIGURE C-i STRESS PATHS FOR CK UC AND CK0 UE TESTS: N.C. ORINOCO CLAY
t.0

140
3 4
AXIAL STRAIN , e0 (%)
FIGURE C-2 STRESS VERSUS STRAIN FOR CK UC AND CK UE TESTS:N.C. ORINOCO CLAY
z (ft) TEST SYM. BORING wN pf
No. (%) (/)
99.1 TC3 0 El 57.4 39.099.5 TC2 a El 51.5 31.5
128.7 TEl 0 Fl 60.1 57.11 .3 Tc V F1 GIA. g.9
4
6
-0.
-0.0 2 5 6 7
0.
0.
. v c7 iO
I
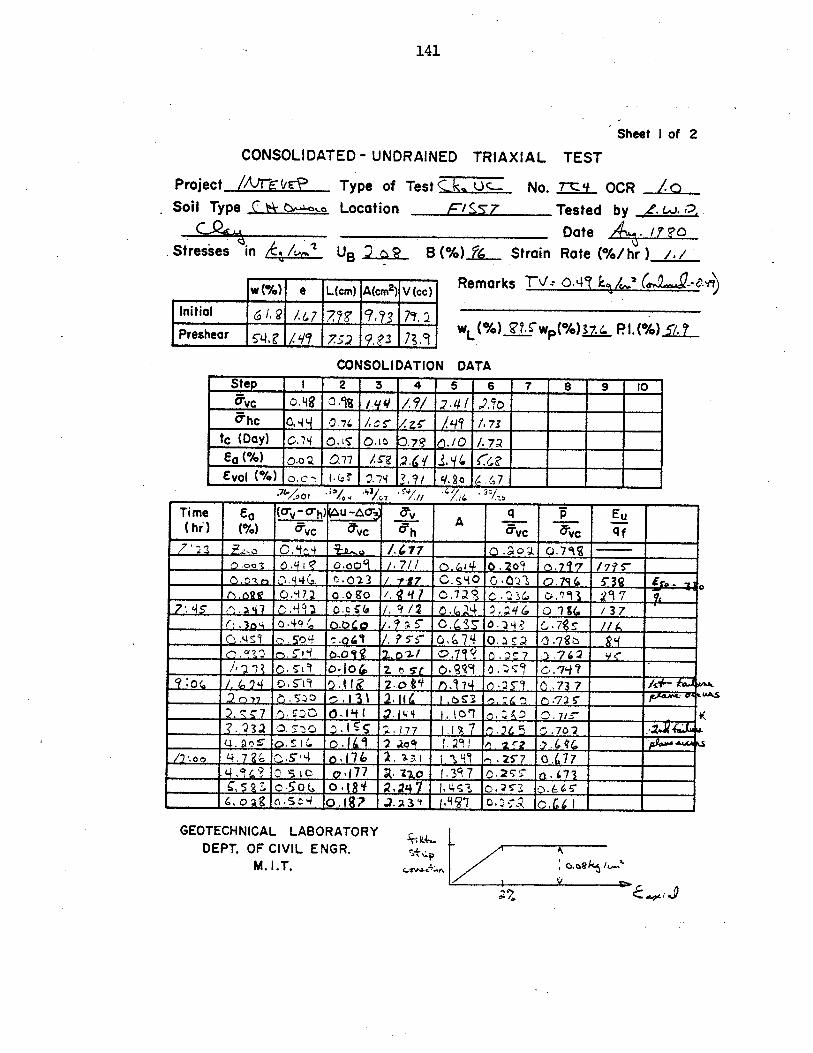
141
Sheet I of 2
CONSOLIDATED - UNDRAINED TRIAXIAL TEST
Project /AWfF E? Type of Test C .O- No. TC'L OCR /LQSoil Type C & , Location FISS7 Tested by A w.
Date .A/LfStresses in ,i / UB 26. B (%)B M Strain Rate (%/ hr) /
w (%) e L(cm) A(cm2 ) V (cc)
Initial 61- 16 4 7 77 '??37 1.1Preshear T./9 7 71/ 1 . 23 .9
Remarks TV O.4r 4/- ( -
WL(%M V. wp M 3 7.4. PI.(%M2.,1L
CONSOLIDATION DATAStep 2 3 4 5 6 7 8 9 10
avc 0.80.1% /.q V_ / . /J?&hc o,4 0.74 A .*S / .4 /.7.
tc (Day) 0. . o 7 .O /.71 1 --
S(%) 0.0q .7 /S-g 2.-1.C Vol M% ~ y ./4g
- 114 11
GEOTECHNICAL LABORATORYDEPT. OF CIVIL ENGR.
M. I.T.ILA"
e-4 e.o ta-
Time C0 (0 v- 0 h) u-a O. A q Eu(h) % vc &vc &h A &v- q f
7 23 NcJ O 2 , g /,477 O.2 .' c .770oa Qo .qi 0-ooi /-7// n. 6,1 0-20? 0,7'17 /7f 5q~s .44G.- 1) -0-3 /. G2 .s40 0 -o 0 ' o.794 5,32
g.82 0.472 0.00 1 1.29 Z.&91 29 77 -) 7 C, jL .j'.j o. /0 / - 4 .2q76 o ? /-37
4 . I o- 5o psa(I . 27; . 3 0 .o 7 4 ..)7 ____ _____4z 0 9 n. "1 . 77 Iq 2' 0,(711.3E w:7 -D .2 y
1? . rTl 0-l 10 & S .9j o. 0. : '.?9 4,9 0 -~ Q .( 2-0t , ). 74 n -25 n7 .7
Q 7 --5 -,13\ 2,11 1 0,Z6 ..72.TC 7 .2-,9 .1149 1,t '7 :A; C " /
32 0 5 0 -. 1 I ,5177 7~' n. -% !s .70-2
.'-oo 14. 7 9 5 -T1 76" 2. 1 t 1 m.7 0.4774,3, q-io o 177 g. z-.o T.3 7 02- ,7C, 5 c~o .5 0 , 24 -41,4 1.L.Sl >-2 L- 6 S( . 0 2 6S C q -,197 1.7-.A34 0517 121:1-4 OC41
Lk~s
.7&/ .;"/ 11 1 11 11/c 7
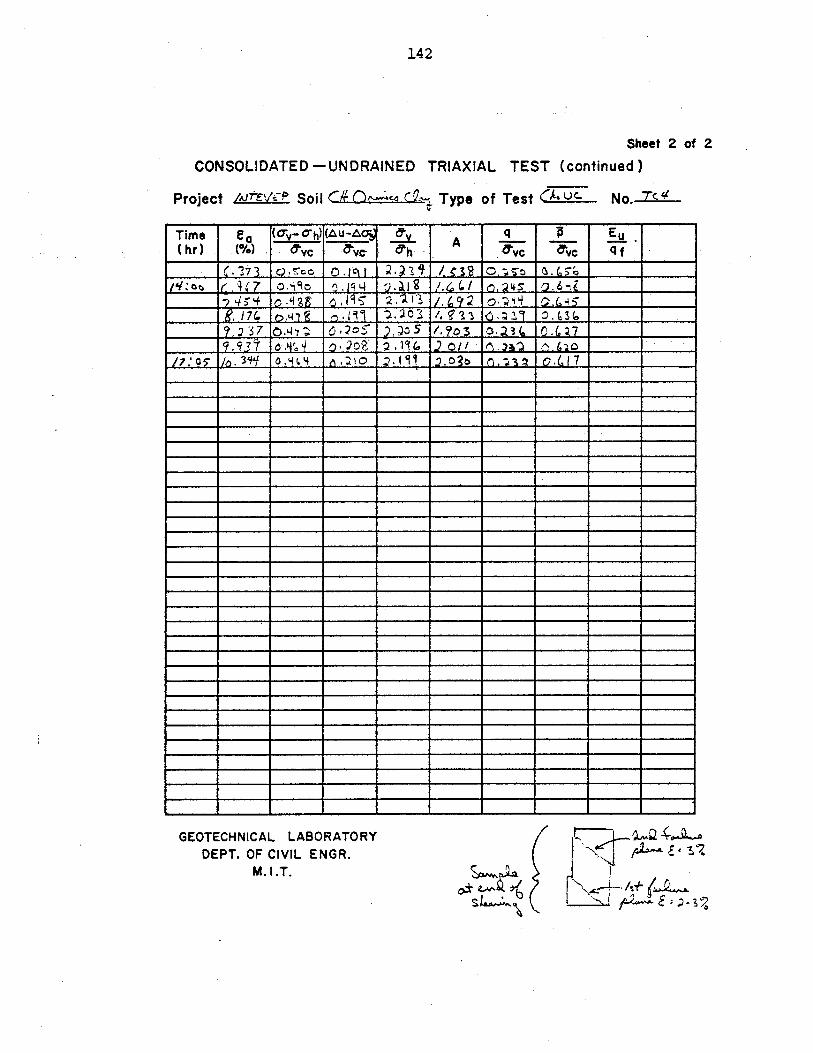
142
Sheet 2 of 2
CONSOLIDATED -'UNDRAINED TRIAXIAL TEST (continued)
Project Aj!VP Soil ( ~ Type of Test CA- uc. No. 7C4
Time ea (Ov'-G6h) (Au-A A -(hr) . (%) &vc a6vc- &h A _c _f
C. 373 2.rco Ojfj .3' / 0,S v 5.(%4:__ I..'7 o.'o A-2o ' 3% /.?60 (. .;a 4 .7 _ _,_
To 4 0.u ZE ,M /. . / 92 & -15-.(
9 793t W, q n 2. 6.01 e's /7 a- n, 0.
7,. f n. -;- I o. 179/ O
GEOTECHNICAL LABORATORYDEPT. OF CIVIL ENGR.
M.I.T.
SLLDA~A-(-
A
-2-1