Engine Dynamic Torque Prediction and validation of … · Engine Dynamic Torque Prediction and...
25
Engine Dynamic Torque Prediction and validation of TCI CRDE engine using GT Power 1 Copyright © 2012 Mahindra & Mahindra Ltd. All rights reserved. Padmavathi Ramadandi Saravanan Muthiah Date:16/09/2013 Date:7 th Jan, 2013
Transcript of Engine Dynamic Torque Prediction and validation of … · Engine Dynamic Torque Prediction and...
Engine Dynamic Torque Prediction and validation
of TCI CRDE engine using GT Power
1Copyright © 2012 Mahindra & Mahindra Ltd. All rights reserved.
� Padmavathi Ramadandi
� Saravanan Muthiah
� Date:16/09/2013
Date:7th Jan, 2013
Objective: To model ,Predict and validate the Full throttle dynamic Torque of an common
rail turbocharged intercooled engine as a part of establishing a process for dynamic torque
estimation at powertrain development concpet phase . All engine parameters air ,fuelling
boost pressures and turbocharger lags measured and compared with simulations at various
gear ratios.
Introduction:
2Copyright © 2012 Mahindra & Mahindra Ltd. All rights reserved.
Introduction:
Engine dynamic torque is defined as the torque delivered by the engine at 100% throttle
position at specified gear engaged transient condition from low idle to high idle engine
speed.
The main limiting factors for engine dynamic torque delivery are:
1. Air availability or Turbocharger lag
2. Combustion stability or smoke
3. Power Train oscillations
Activated/calibrated Common rail injection Fuel limiting parameters for engine protections are:
1. Active surge dampening(for crankshaft and power train oscillations),
2. Smoke limitation for engine combustion and air availability
consideration for smoke limitation,
3Copyright © 2012 Mahindra & Mahindra Ltd. All rights reserved.
consideration for smoke limitation,
3. Engine protection for high TC speed, high fuel injection quantity
limitation, overheat protection
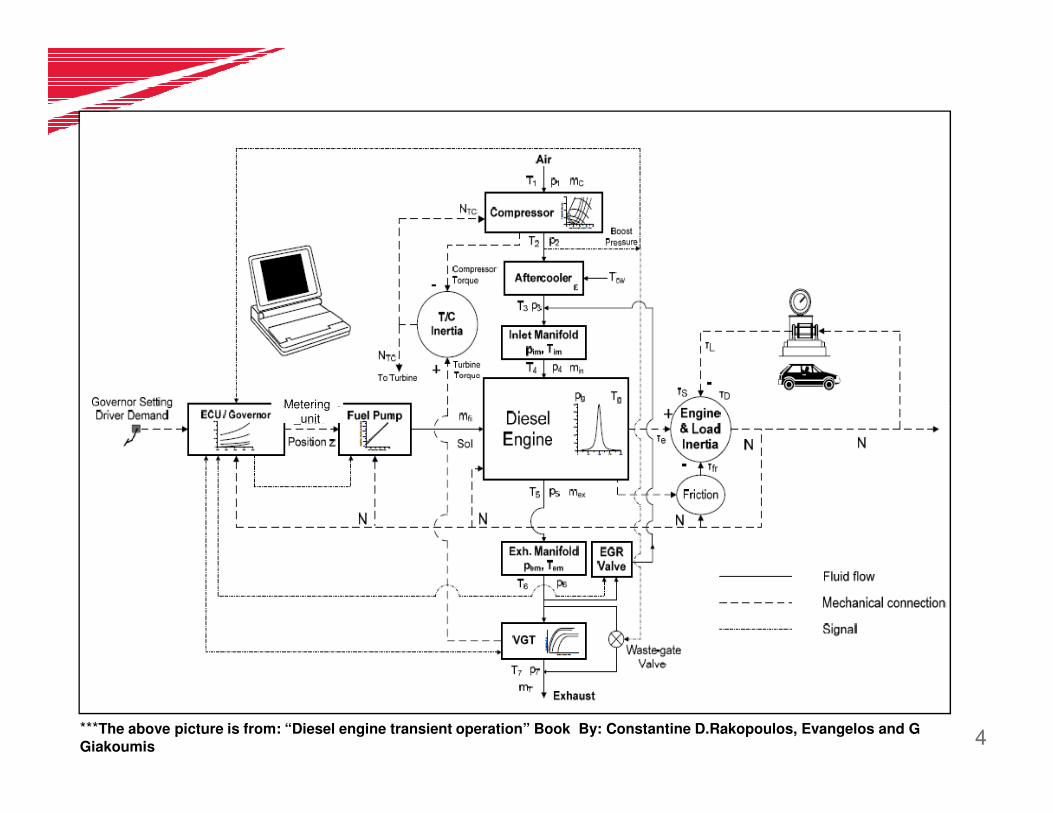
Schematic representation of transient calculations flow
Metering
4***The above picture is from: “Diesel engine transient operation” Book By: Constantine D.Rakopoulos, Evangelos and G
Giakoumis
Metering
_unit

Methodology
1.Engine modeling and validation for steady state engine
performance
2.Converting steady state model
to transient model from low idle to
high idle speeds 2.Modeling controllers for Fuelling
1.. Loading vehicle Elements into
to engine environment with various gear ratios
5Copyright © 2012 Mahindra & Mahindra Ltd. All rights reserved.
high idle speeds 2.Modeling controllers for Fuelling
,Turbo charger vane position and ECU logics
3.Dynamic torque prediction andvalidation. With fuelling limitations:
Results discussion
4. Summary and Conclusions

BS
FC
En
gin
e
[g/(
kW
.h)]
220
240
260
Test data_FTP
GT POWER_simulated
1.Engine Modeling and Validation For Steady State
Complete engine with turbocharger intercooler is modelled using GT power . The engine
full throttle performance is validated with test data . Engine power torque bsfc, airflow
rate and fuel flow rates are correlated very well at steady state condition.
Air
flo
w r
ate
(k
g/h
) [k
g/h
]
400
500
600Test data_FTP
GT POWER_simulated
6Copyright © 2012 Mahindra & Mahindra Ltd. All rights reserved.
1000 1250 1500 1750 2000 2250 2500 2750 3000 3250 3500 3750 4000Speed [rpm]
To
rqu
e E
ng
ine
1 (
N.m
) [N
.m]
160
240
320
400
Po
we
r E
ng
ine
1 (
kW
) [k
W]
0
30
60
90
120
BS
FC
En
gin
e
[g/(
kW
.h)]
180
200
220
Engine BSFC
Engine power
Engine torque
1000 1250 1500 1750 2000 2250 2500 2750 3000 3250 3500 3750 4000Speed [rpm]
Fu
el
FL
ow
ra
te (
kg
/h)
[kg
/h]
0
10
20
30
40
Air
flo
w r
ate
(k
g/h
) [k
g/h
]
0
100
200
300
400
Total air flow rate
Total fuel flow rate
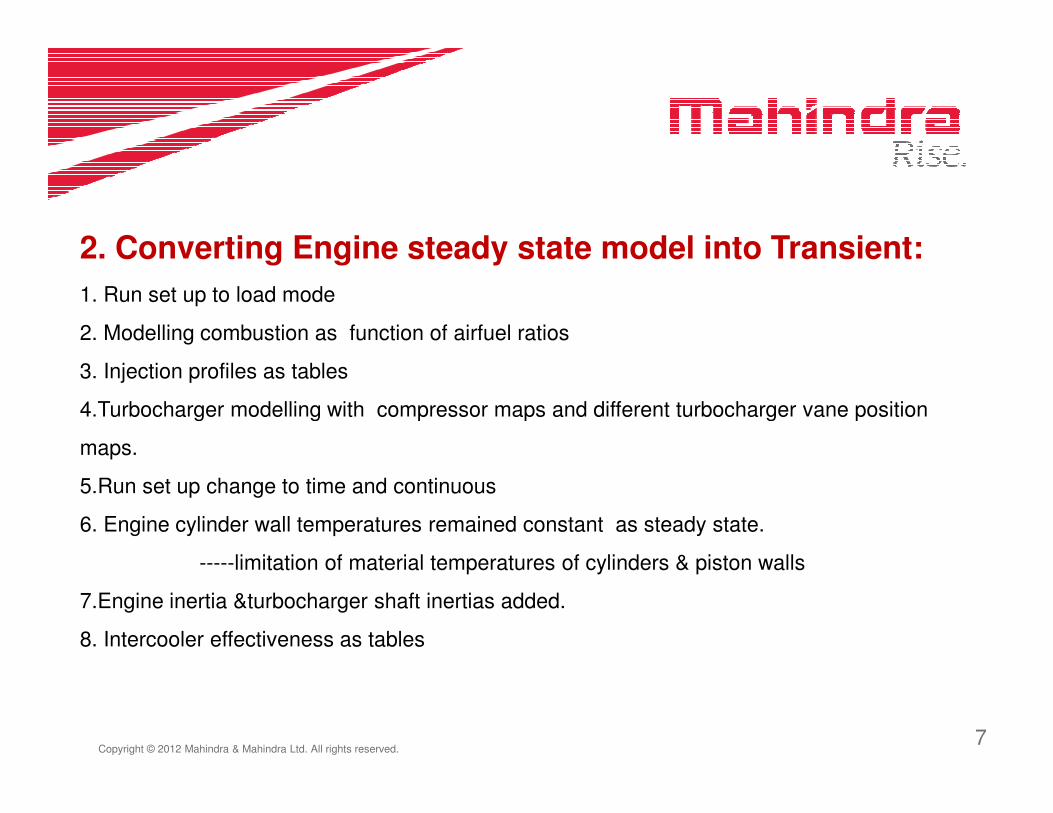
2. Converting Engine steady state model into Transient:
1. Run set up to load mode
2. Modelling combustion as function of airfuel ratios
3. Injection profiles as tables
4.Turbocharger modelling with compressor maps and different turbocharger vane position
7Copyright © 2012 Mahindra & Mahindra Ltd. All rights reserved.
4.Turbocharger modelling with compressor maps and different turbocharger vane position
maps.
5.Run set up change to time and continuous
6. Engine cylinder wall temperatures remained constant as steady state.
-----limitation of material temperatures of cylinders & piston walls
7.Engine inertia &turbocharger shaft inertias added.
8. Intercooler effectiveness as tables
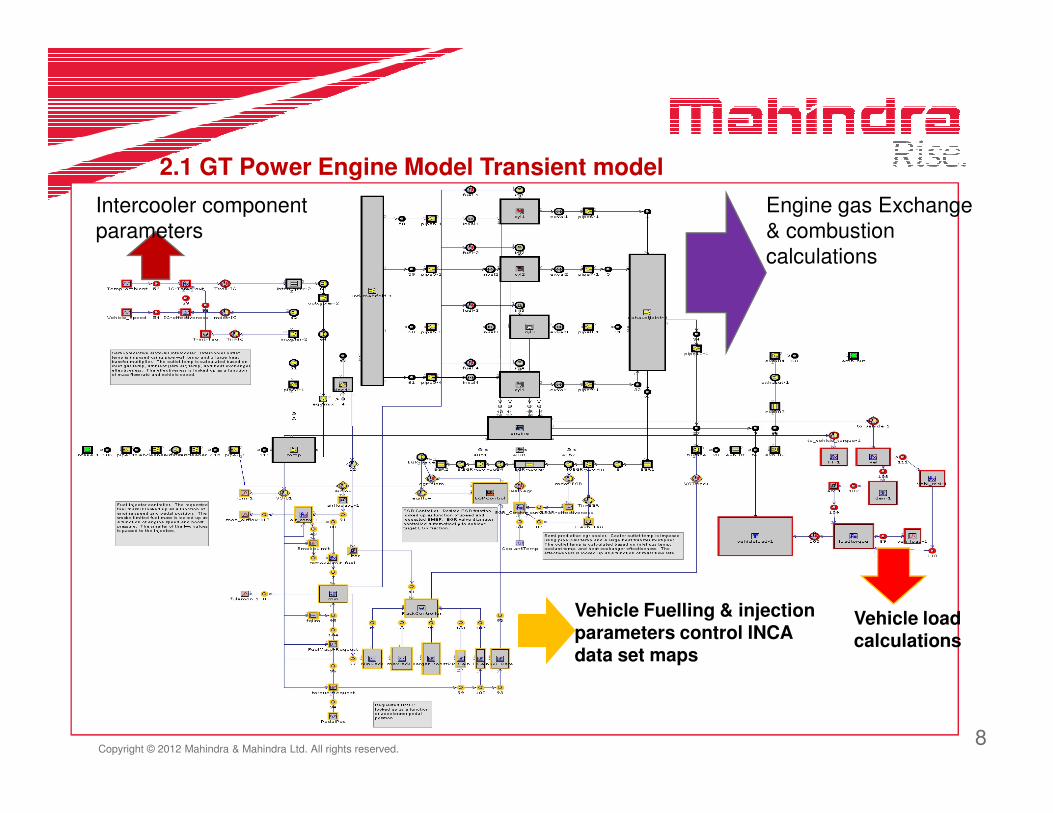
GT Power Engine Model_scorpio_88kwEngine gas Exchange
& combustion
calculations
Intercooler component
parameters
2.1 GT Power Engine Model Transient model
8Copyright © 2012 Mahindra & Mahindra Ltd. All rights reserved.
Vehicle Fuelling & injection parameters control INCA data set maps
Vehicle load calculations
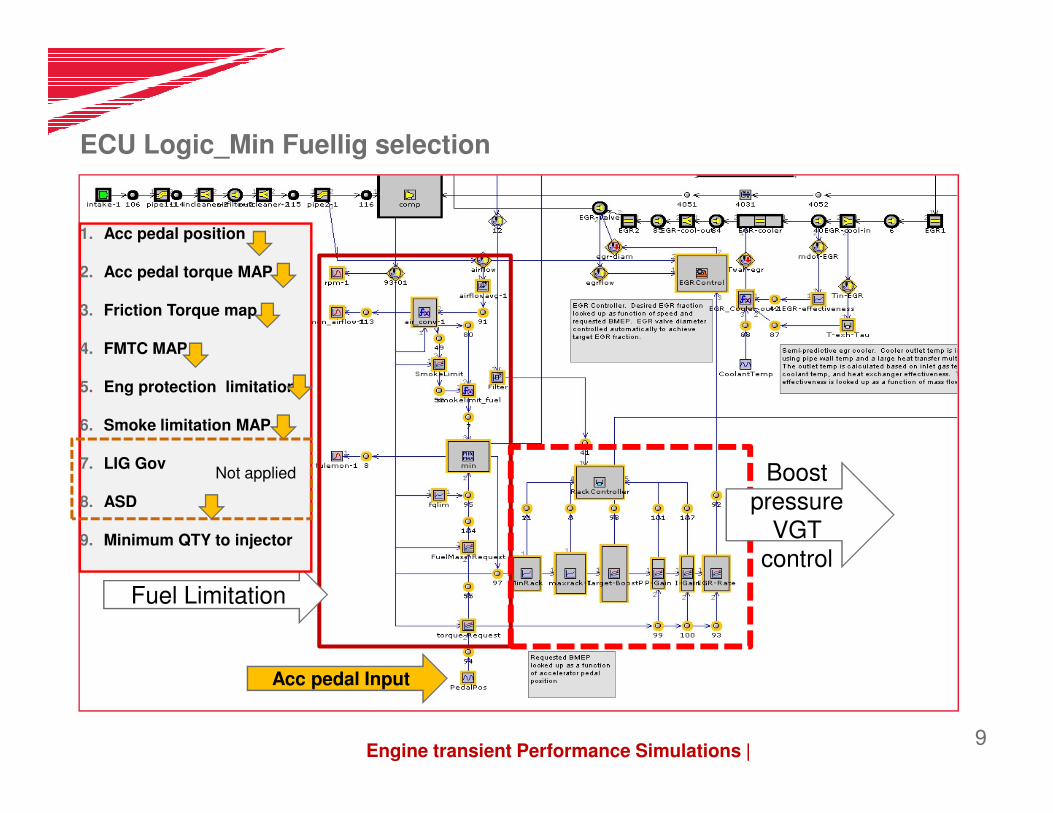
ECU Logic_Min Fuellig selection
99
1. Acc pedal position
2. Acc pedal torque MAP
3. Friction Torque map
4. FMTC MAP
5. Eng protection limitation
9Engine transient Performance Simulations |
Acc pedal Input
Fuel Limitation
Boost
pressure VGT
control
6. Smoke limitation MAP
7. LIG Gov
8. ASD
9. Minimum QTY to injector
Not applied
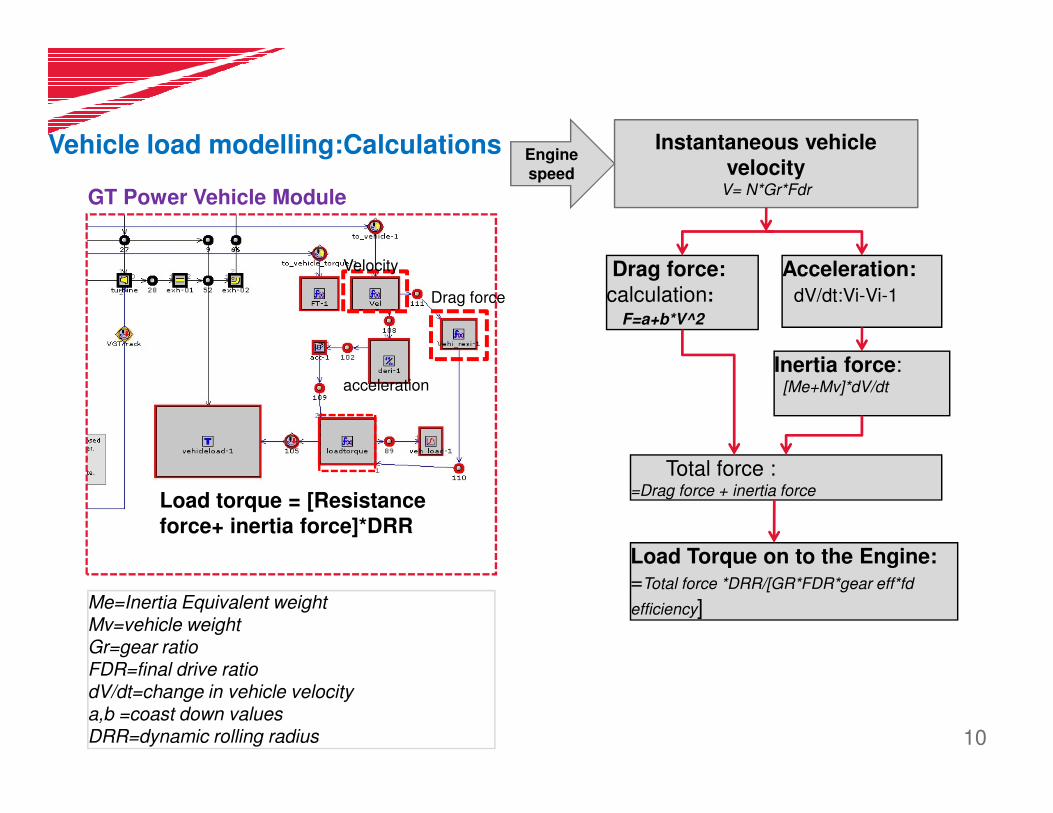
Vehicle load modelling:Calculations
1010
Drag force
Velocity
acceleration
Instantaneous vehicle
velocity V= N*Gr*Fdr
Drag force:
calculation:
F=a+b*V^2
Acceleration:
dV/dt:Vi-Vi-1
Inertia force:[Me+Mv]*dV/dt
Engine
speed
GT Power Vehicle Module
10
Load torque = [Resistance
force+ inertia force]*DRR
Total force :=Drag force + inertia force
Load Torque on to the Engine:
=Total force *DRR/[GR*FDR*gear eff*fd
efficiency]Me=Inertia Equivalent weightMv=vehicle weightGr=gear ratioFDR=final drive ratiodV/dt=change in vehicle velocitya,b =coast down valuesDRR=dynamic rolling radius

Measured Vs simulated dynamic Torque 1st gear
1111
200
250
300simulated
measured
En
gin
e t
orq
ue
Nm
Initially 50 nm difference .
Observations:
�1 st gear estimated dynamic torque at
1000rpm is high compared to measured.
�The reason may be the ASD&LIG fuel
limitation.
� parameter or the turbine inertia, or the
instantaneous combustion properties.
3. Dynamic Torque Prediction and Validation
11
50
100
150
1000 2000 3000 4000 5000
En
gin
e t
orq
ue
Nm
difference . Simulations are on higher side
Engine speed rpm
instantaneous combustion properties.
0
20
40
60
80
100
120
0 1 2 3 4
accpedal signal
accpedal …
Time sec

1212
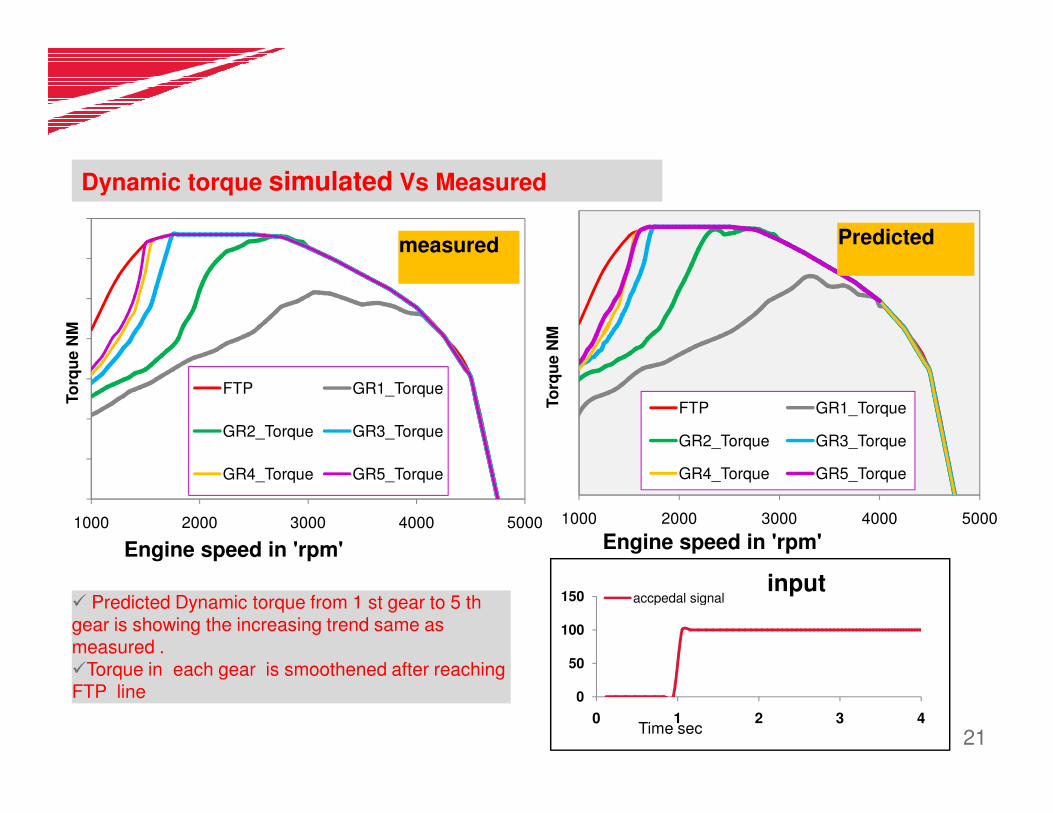
Dynamic torque simulated Vs Measured
150.00
200.00
250.00
300.00
dynamictorque_1stgear150
200
250
300
5thgear 4thgear
Measured Predicted
12
50.00
100.00
1000 1500 2000 2500 3000 3500 4000 4500 5000
dynamictorque_2ndgear
dynamictorque_3rdgear
dynamictorque_4thgear
dynamictorque_5thgear
50
100
1000 1500 2000 2500 3000 3500 4000 4500 5000
5thgear 4thgear
3rdgear 2ndgear
1stgear
� Predicted Dynamic torque from 1 st
gear to 5 th gear is showing the
increasing trend same as measured .
�But the initial torque at 1000 rpm is high in case of predicted torque compared to measured
0
20
40
60
80
100
120
0 1 2 3 4
accpedal signalaccpedal signal
Time sec
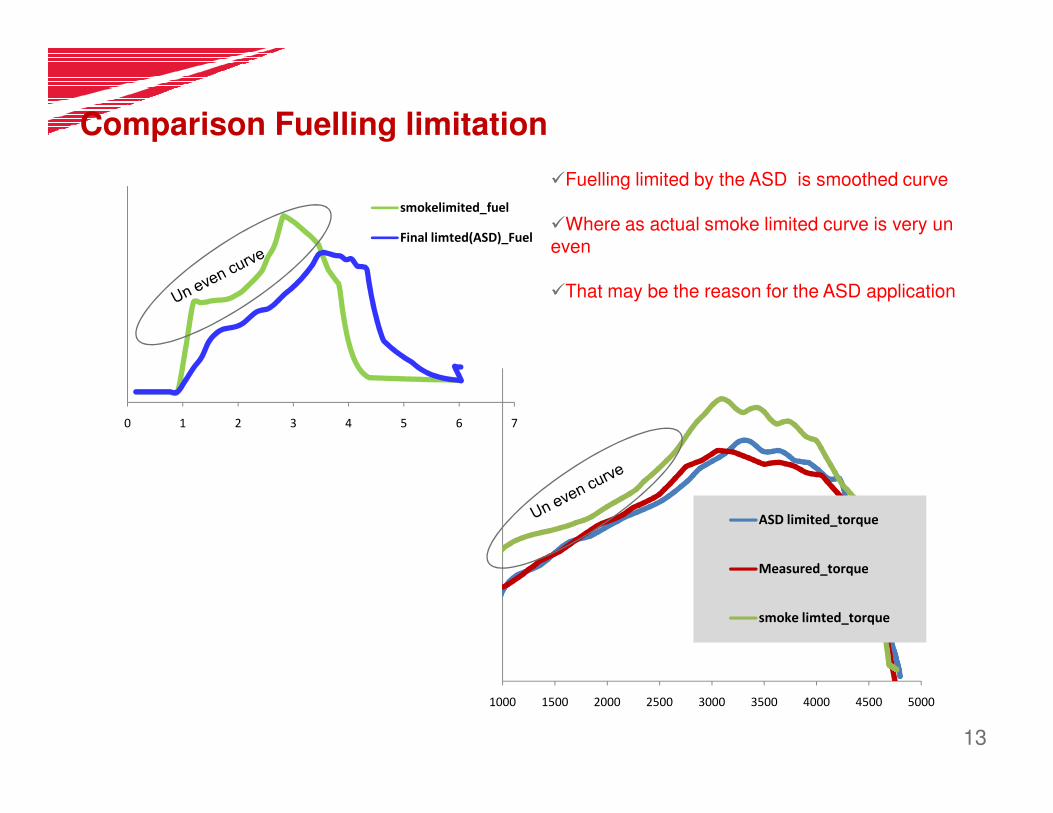
Comparison Fuelling limitation
smokelimited_fuel
Final limted(ASD)_Fuel
1313
�Fuelling limited by the ASD is smoothed curve
�Where as actual smoke limited curve is very un even
�That may be the reason for the ASD application
13
0 1 2 3 4 5 6 7
1000 1500 2000 2500 3000 3500 4000 4500 5000
ASD limited_torque
Measured_torque
smoke limted_torque

1414
0
1000
2000
3000
4000
5000
6000
Time Vs Engine speed_simulation
Time VSEngine speed_measured
Dynamic torque Nm measured Vs simulated
Measured Vs simulated dynamic Torque _1st gear_with actual Fuel as input
Engine speed and dynamic torque
is matching with measured performance
141000 1500 2000 2500 3000 3500 4000 4500 5000
sim test
Dynamic torque Nm measured Vs simulated
After updating ASD limited fuelling.

Engine parameters Estimation at 1 st gear
1515
sim_air
test_airflow
Air flow rate kg/hr
P2_Boost pressure
p2_sim_actual
p2sim_desired
test_act
Desired
15
P3
b
ar
ab
s
P3_PressureBF TC
P3_test
p3_sim
Simulated boost pressures is following the desired boost pressure after the turbo lag. But the actual measurement shows the is not.Reasons may be1. The dynamic turbocharger inertia/vane
inertia 2. Or the PID delay in actual3. Choke limitation in simulation 4. But performance does not effect
Time secTime sec
Time sec

Engine dynamic operating points on compressor
1616
16
Operating points limited within map only.

Boost Pressure in all gears
1717
P2_simulated
P2_measured
Desired
Time sec
p2_sim
P2_Test
Desired
1st gear
2nd gear
17
Time sec
P2_test
P2_simulated
Desired
3rd gear
P2_Simulated
P2_tested
Desired
4th gearTime sec
Time SecTime sec
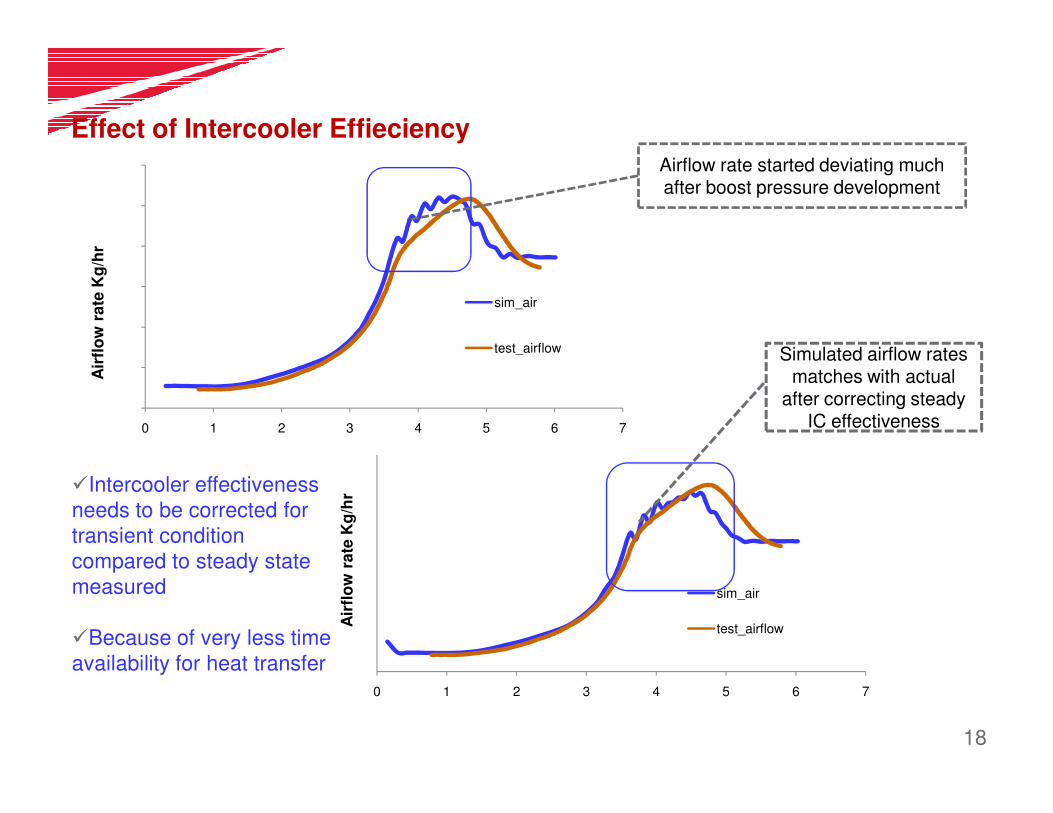
Effect of Intercooler Effieciency
1818
sim_air
test_airflow
Air
flo
w r
ate
Kg
/hr
Simulated airflow rates matches with actual
after correcting steady
Airflow rate started deviating much after boost pressure development
18
0 1 2 3 4 5 6 7
0 1 2 3 4 5 6 7
sim_air
test_airflow
�Intercooler effectiveness
needs to be corrected for
transient condition
compared to steady state
measured
�Because of very less time
availability for heat transfer
after correcting steady IC effectiveness
Air
flo
w r
ate
Kg
/hr
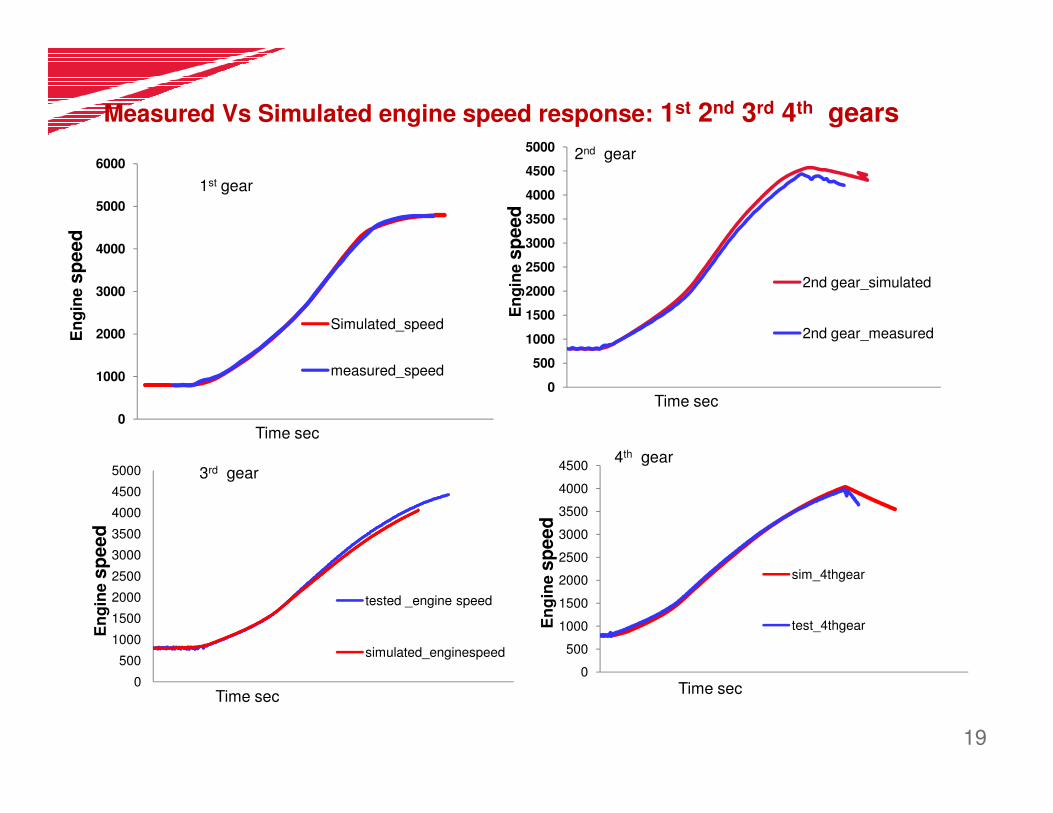
Measured Vs Simulated engine speed response: 1st 2nd 3rd 4th gears
1919
1000
2000
3000
4000
5000
6000
Simulated_speed
measured_speed0
500
1000
1500
2000
2500
3000
3500
4000
4500
5000
2nd gear_simulated
2nd gear_measured
2nd gear
Time sec
En
gin
e s
peed
1st gear
En
gin
e s
peed
19
0
Time sec
0
500
1000
1500
2000
2500
3000
3500
4000
4500
sim_4thgear
test_4thgear
4th gear
Time sec 0
500
1000
1500
2000
2500
3000
3500
4000
4500
5000
tested _engine speed
simulated_enginespeed
3rd gear
Time sec
Time sec
En
gin
e s
peed
En
gin
e s
peed

Measured Vs Simulated Dynamic Torque 2nd 3rd 4th 5th gears
2020
1000 1500 2000 2500 3000 3500 4000 4500 5000
1st gear_measured
1st_gear_simulated
To
rqu
e N
M
1000 1500 2000 2500 3000 3500 4000 4500 5000
2nd_ gear_measured
2nd_gear_simulated
To
rqu
e N
M
1 st gear 2nd gear
20
1000 1500 2000 2500 3000 3500 4000 4500 5000 1000 1500 2000 2500 3000 3500 4000 4500 5000
1000 2000 3000 4000 5000
3rd gear_measured
3rd_gear_simulated
3rd gear
To
rqu
e N
M
1000 2000 3000 4000 5000
4th gear_measured
4th_gear_simulated
4th gear
To
rqu
e N
M
1000 2000 3000 4000 5000
5th gear_measured
5th_gear_simulated
5th gear
To
rqu
e N
M
2121
Dynamic torque simulated Vs Measured
150
200
250
300
350
FTP GR1_Torque
measured
To
rqu
e N
M
FTP GR1_Torque
Predicted
To
rqu
e N
M
21
� Predicted Dynamic torque from 1 st gear to 5 th gear is showing the increasing trend same as measured .�Torque in each gear is smoothened after reaching FTP line 0
50
100
150
0 1 2 3 4
input accpedal signal
Time sec
0
50
100
1000 2000 3000 4000 5000
Engine speed in 'rpm'
GR2_Torque GR3_Torque
GR4_Torque GR5_Torque
1000 2000 3000 4000 5000
Engine speed in 'rpm'
FTP GR1_Torque
GR2_Torque GR3_Torque
GR4_Torque GR5_Torque
To
rqu
e N
M
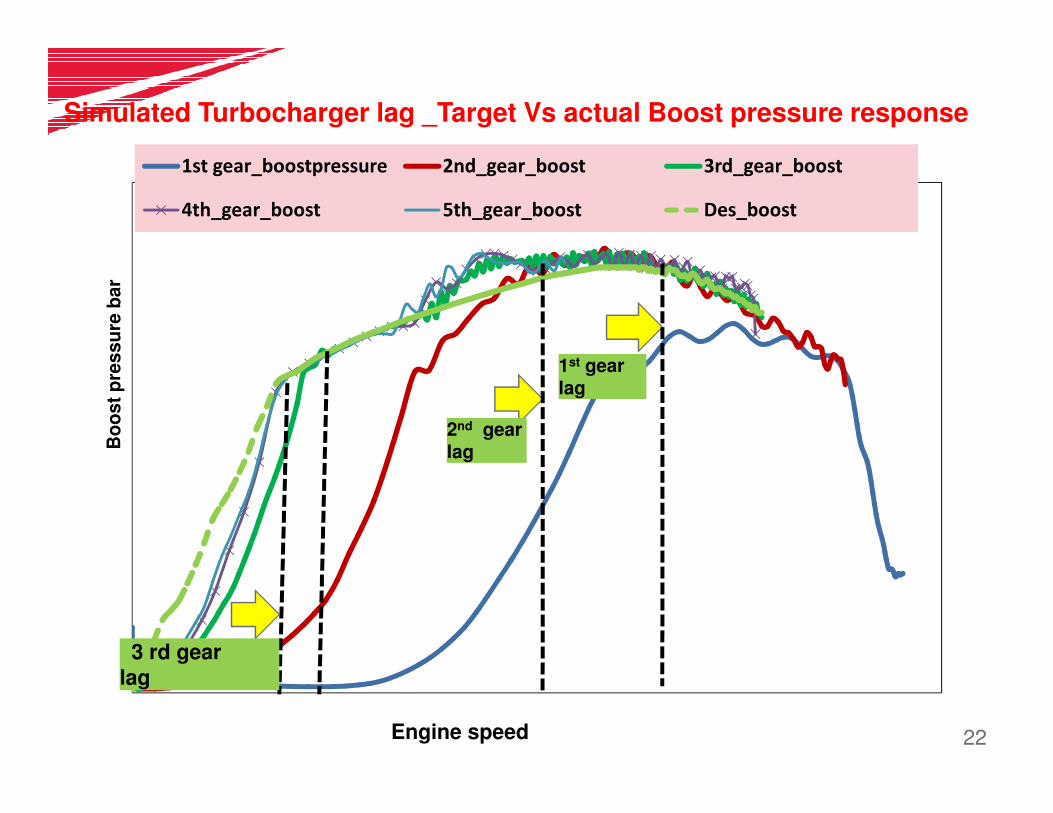
Simulated Turbocharger lag _Target Vs actual Boost pressure response
2222
1st gear_boostpressure 2nd_gear_boost 3rd_gear_boost
4th_gear_boost 5th_gear_boost Des_boost
1st gear lag
Bo
ost
pre
ssu
re b
ar
22Engine speed
2nd gear lag
3 rd gear
lag
Bo
ost
pre
ssu
re b
ar
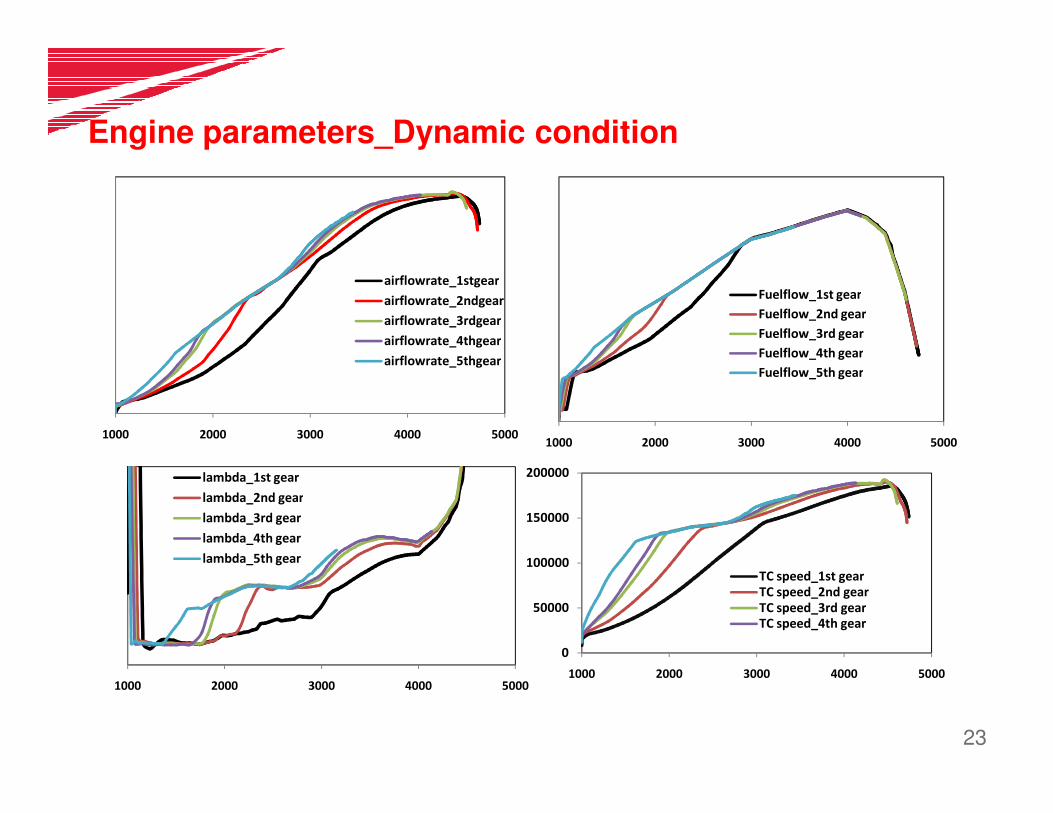
Engine parameters_Dynamic condition
2323
airflowrate_1stgear
airflowrate_2ndgear
airflowrate_3rdgear
airflowrate_4thgear
airflowrate_5thgear
Fuelflow_1st gear
Fuelflow_2nd gear
Fuelflow_3rd gear
Fuelflow_4th gear
Fuelflow_5th gear
23
1000 2000 3000 4000 50001000 2000 3000 4000 5000
1000 2000 3000 4000 5000
lambda_1st gear
lambda_2nd gear
lambda_3rd gear
lambda_4th gear
lambda_5th gear
0
50000
100000
150000
200000
1000 2000 3000 4000 5000
TC speed_1st gear
TC speed_2nd gear
TC speed_3rd gear
TC speed_4th gear
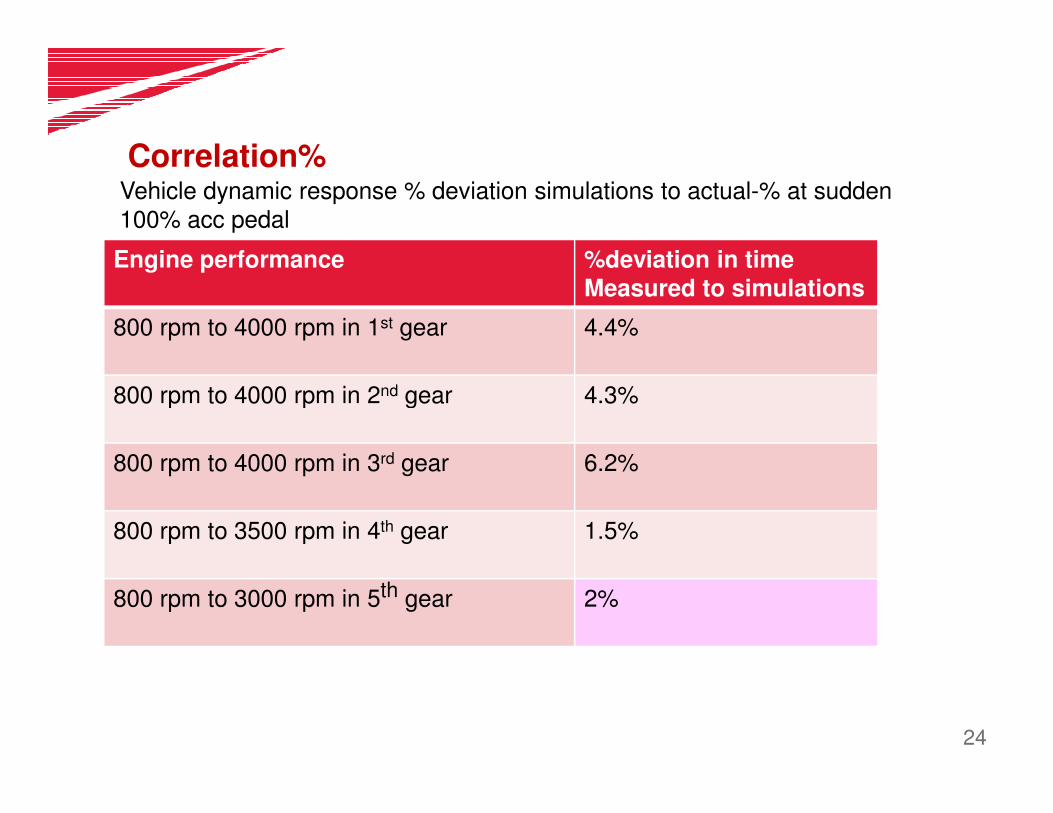
Correlation%
2424
Engine performance %deviation in timeMeasured to simulations
800 rpm to 4000 rpm in 1st gear 4.4%
800 rpm to 4000 rpm in 2nd gear 4.3%
Vehicle dynamic response % deviation simulations to actual-% at sudden 100% acc pedal
24
800 rpm to 4000 rpm in 2 gear 4.3%
800 rpm to 4000 rpm in 3rd gear 6.2%
800 rpm to 3500 rpm in 4th gear 1.5%
800 rpm to 3000 rpm in 5th gear 2%
4.Conclusions and summary
� Engine dynamic torque is limited by smoke limitation and smoothend by powertrain
oscillations
� Engine dynamic torque behaviour is not linear without surge dampening calibration.
� Turbocharger lag in each gear successfully predicted using GT simulations tool.
� Engine dynamic torque behaviour is predicted to accury above 94% .
2525
25
� Turbocharger dynamic moment of inertia or vane hysterysis needs to be included in
the model to improve the boost pressure predictive capability to a better level
especially at very high engine speeds in lower gears
� Engine ECU logics &controls ,and TC modelling is very convinient in GT power tool
Further actions:
� 1.Dynamic Tc moment of inertia modelling & ASD LIG ECU logic adding to model
� 2. Extending the mode to predict the part throttle driveabilty & BSFC prediction in
NEDC cycle by modelling full vehicle and temperature solvers.


![New 6CXBM-GT Series - Yanmar italia · 2015. 1. 28. · MARINE DIESEL ENGINES 6CXBM-GT Series DIMENSIoNS [uNIt: MM] EN_DS6CXBM-G t _0413 Front view, engine only Left side view, engine](https://static.fdocuments.us/doc/165x107/6074d19a224bcf2a934f20f9/new-6cxbm-gt-series-yanmar-italia-2015-1-28-marine-diesel-engines-6cxbm-gt.jpg)