Energy Systems and Sustainability: a perspectiverb/Professional Activities/EatonEnergy17.pdf ·...
87
Rangan Banerjee Dept. of Energy Science and Engineering IIT Bombay Energy Systems and Sustainability: a perspective Invited Talk at Eaton Centre of Excellence Pune, July 7, 2017
Transcript of Energy Systems and Sustainability: a perspectiverb/Professional Activities/EatonEnergy17.pdf ·...
Rangan Banerjee
Dept. of Energy Science and Engineering
IIT Bombay
Energy Systems and Sustainability: a perspective
Invited Talk at Eaton Centre of Excellence Pune, July 7, 2017

2
Barbegal 4 AD
http://www.waterhistory.org/histories/barbegal/
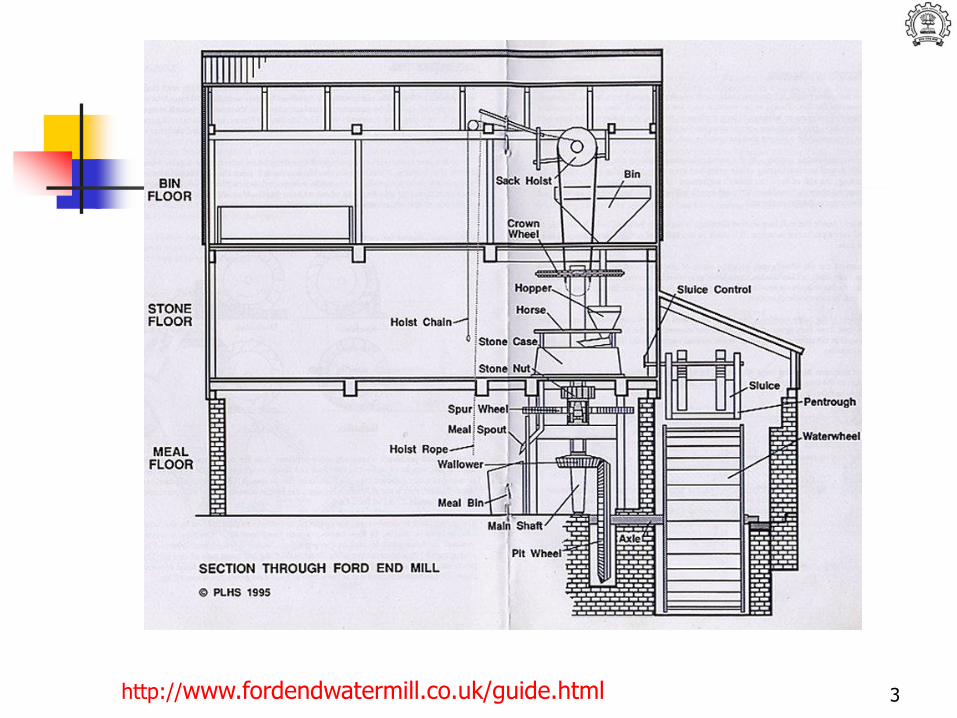
3http://www.fordendwatermill.co.uk/guide.html
4
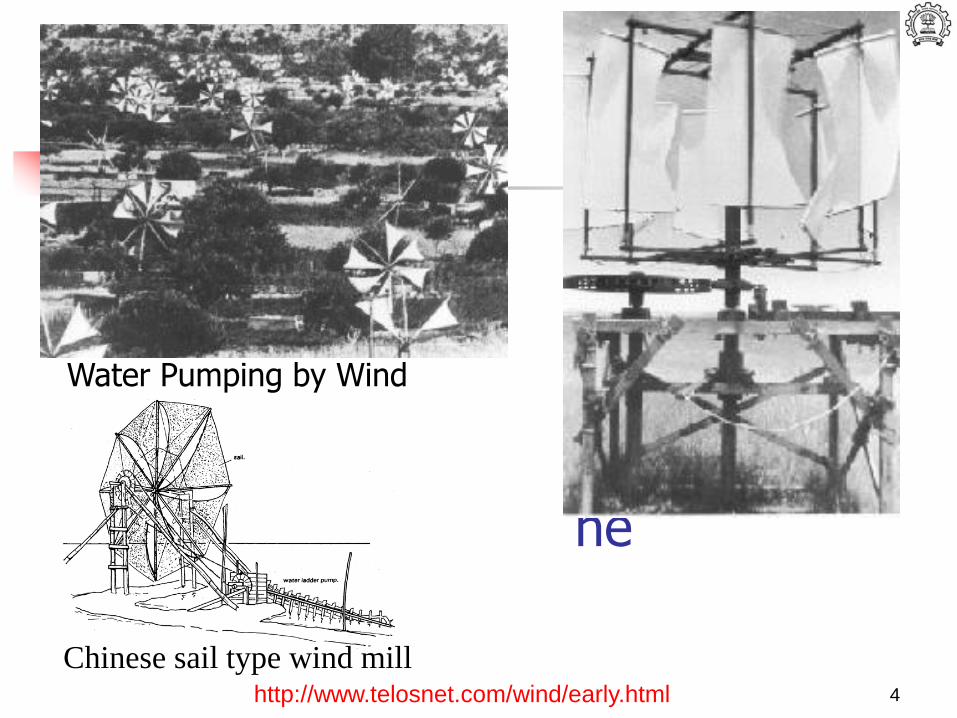
Panemone
http://www.telosnet.com/wind/early.html
Water Pumping by Wind
Chinese sail type wind mill
5
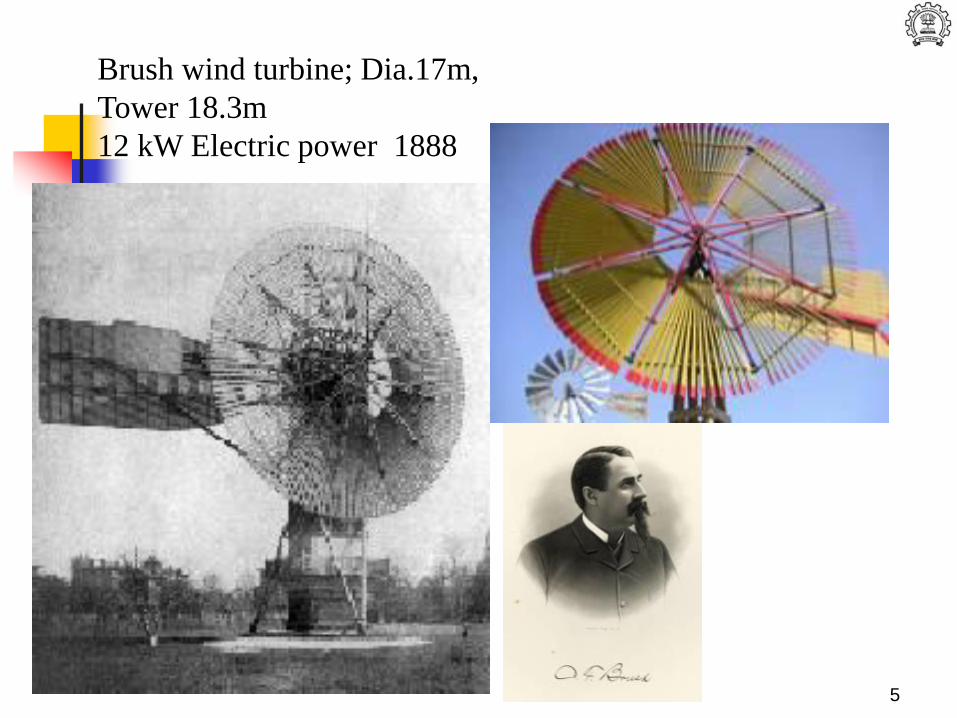
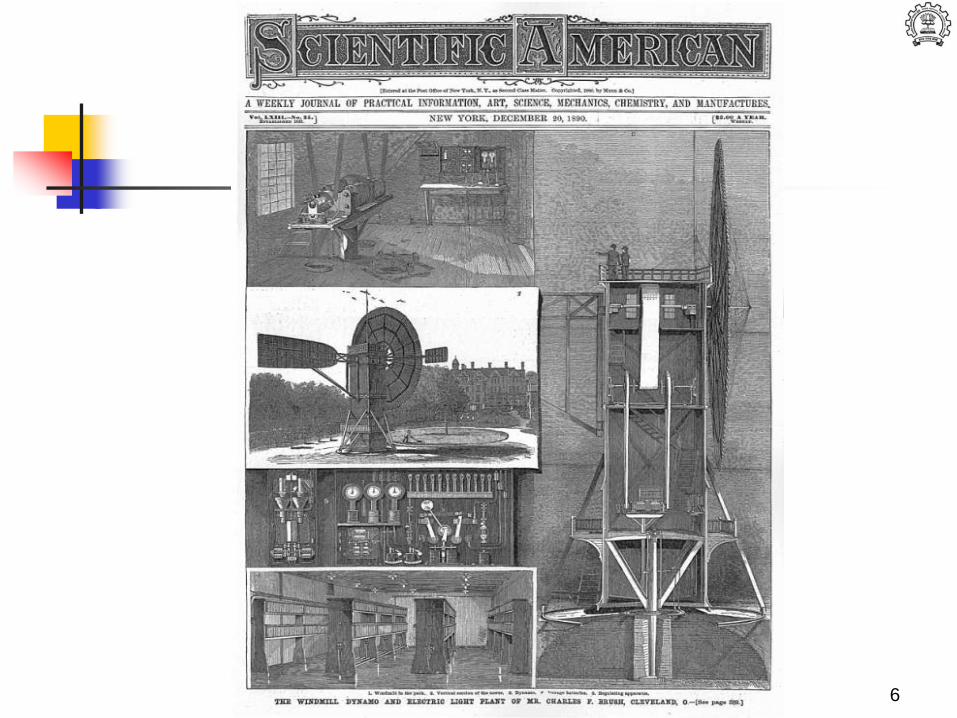
Brush wind turbine; Dia.17m,
Tower 18.3m
12 kW Electric power 1888
6
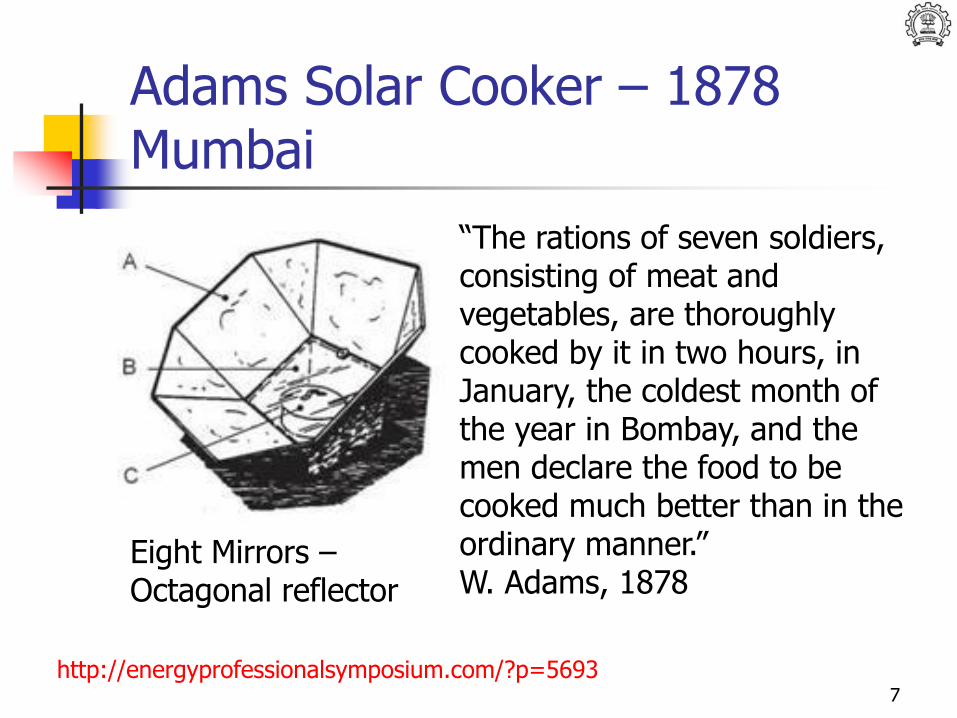
Adams Solar Cooker – 1878 Mumbai
7
“The rations of seven soldiers, consisting of meat and vegetables, are thoroughly cooked by it in two hours, in January, the coldest month of the year in Bombay, and the men declare the food to be cooked much better than in the ordinary manner.”W. Adams, 1878
http://energyprofessionalsymposium.com/?p=5693
Eight Mirrors –Octagonal reflector
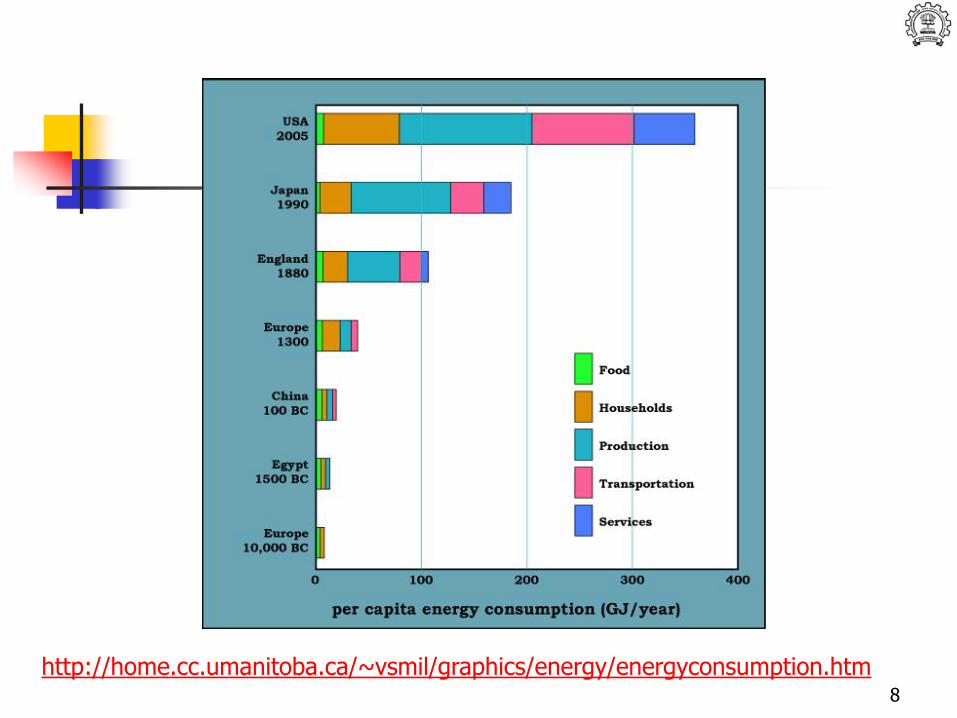
http://home.cc.umanitoba.ca/~vsmil/graphics/energy/energyconsumption.htm8
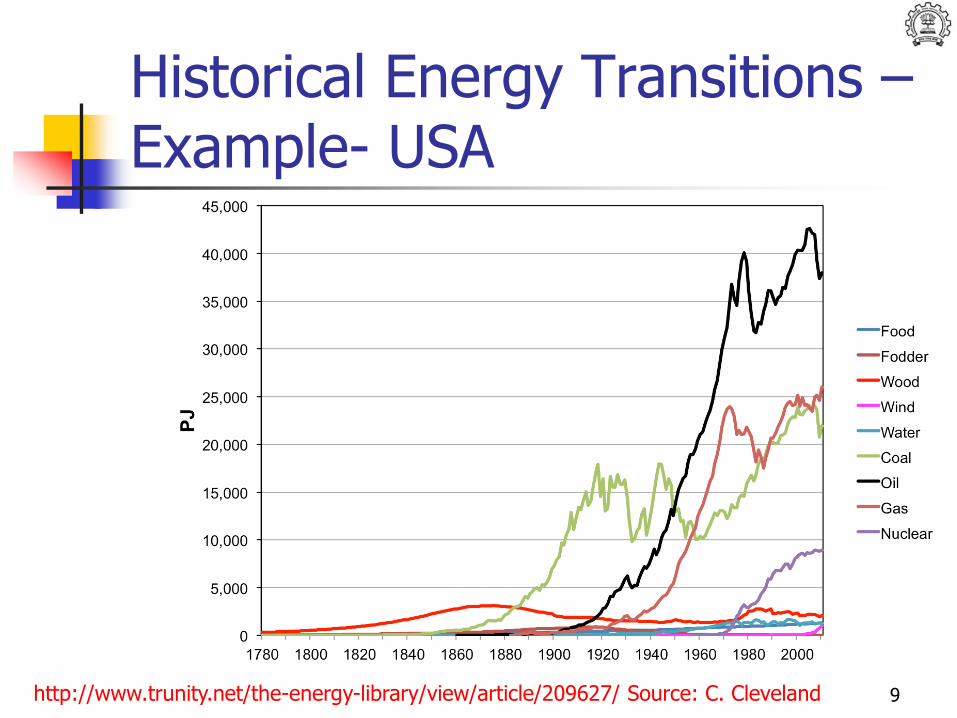
Historical Energy Transitions –Example- USA
9http://www.trunity.net/the-energy-library/view/article/209627/ Source: C. Cleveland
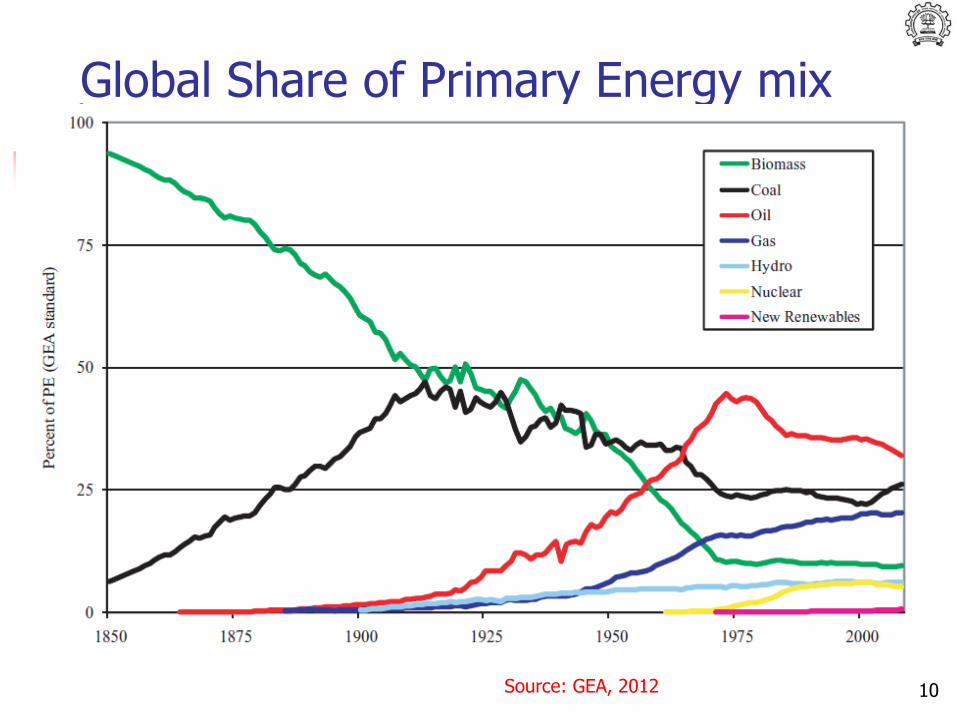
Global Share of Primary Energy mix
Source: GEA, 2012 10
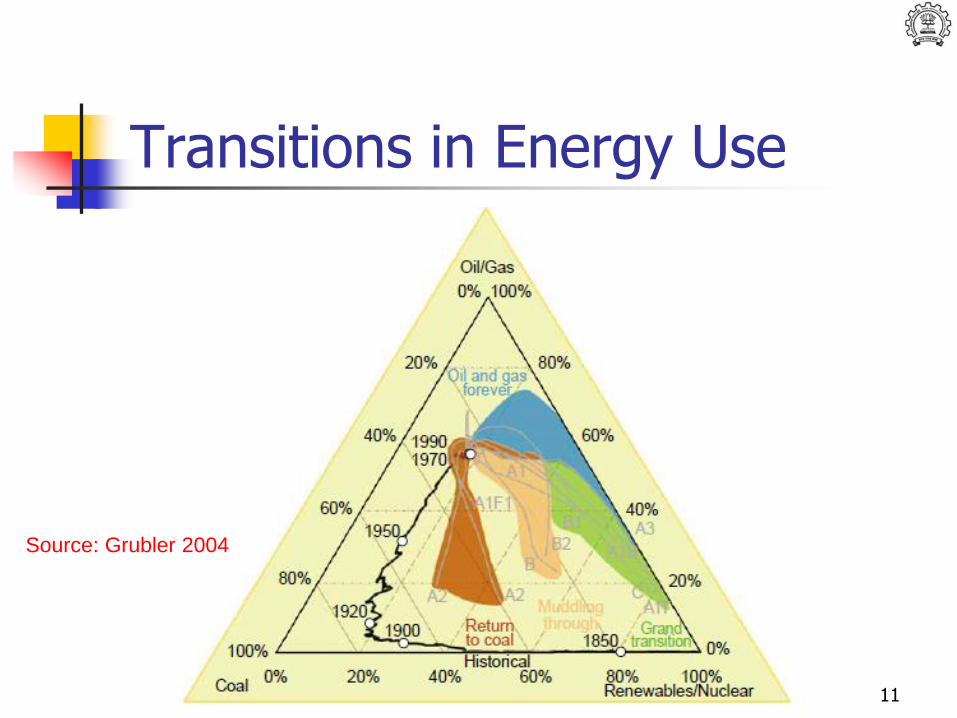
Transitions in Energy Use
Source: Grubler 2004
11
Sustainable Development?
Is our present consumption and growth pattern sustainable? Can we continue this into the future?
12
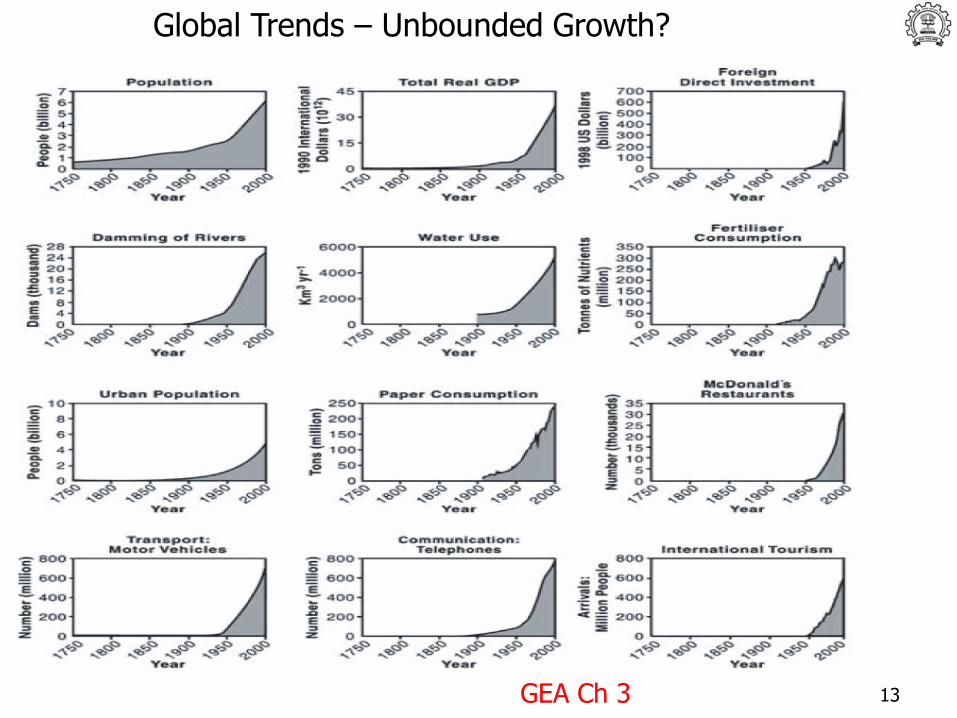
Global Trends – Unbounded Growth?
GEA Ch 3 13
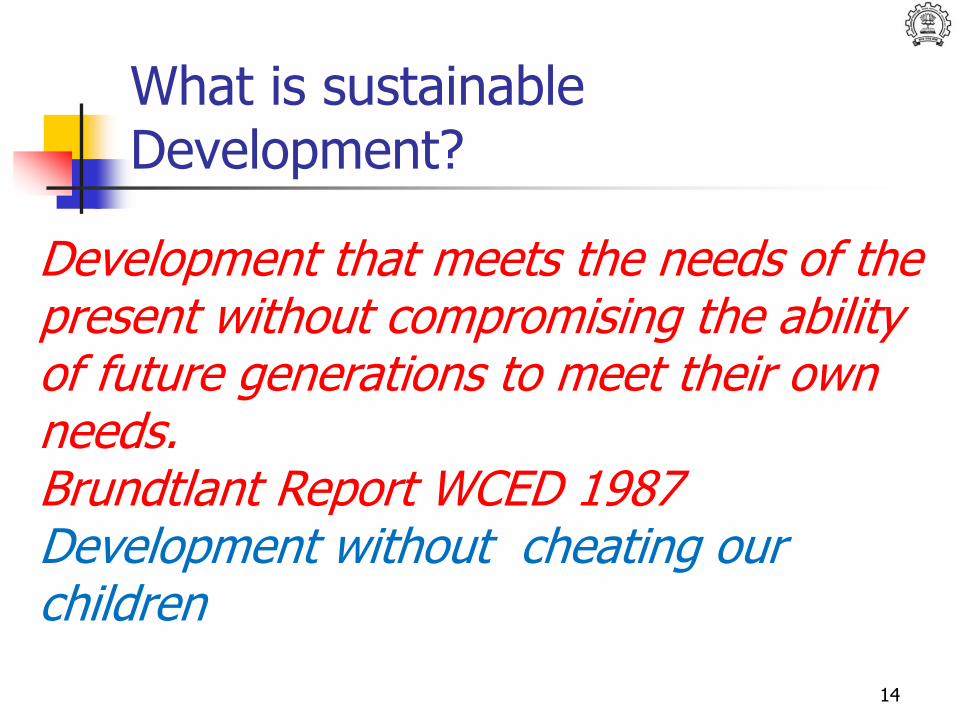
What is sustainable Development?
14
Development that meets the needs of the present without compromising the ability of future generations to meet their own needs.Brundtlant Report WCED 1987Development without cheating our children
15
Are our energy systems sustainable?
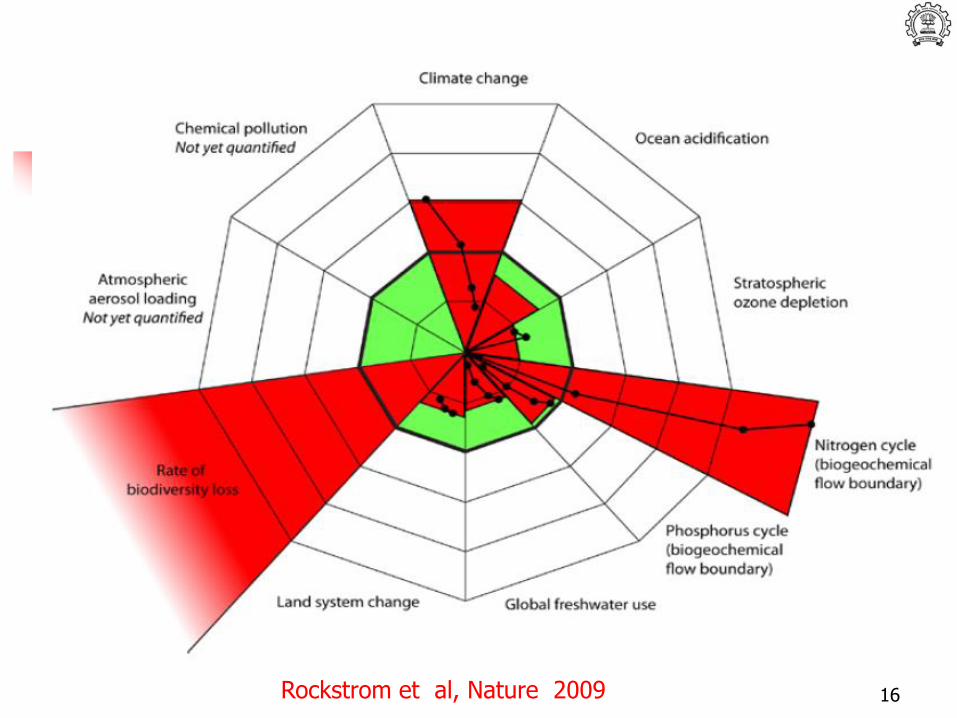
16Rockstrom et al, Nature 2009
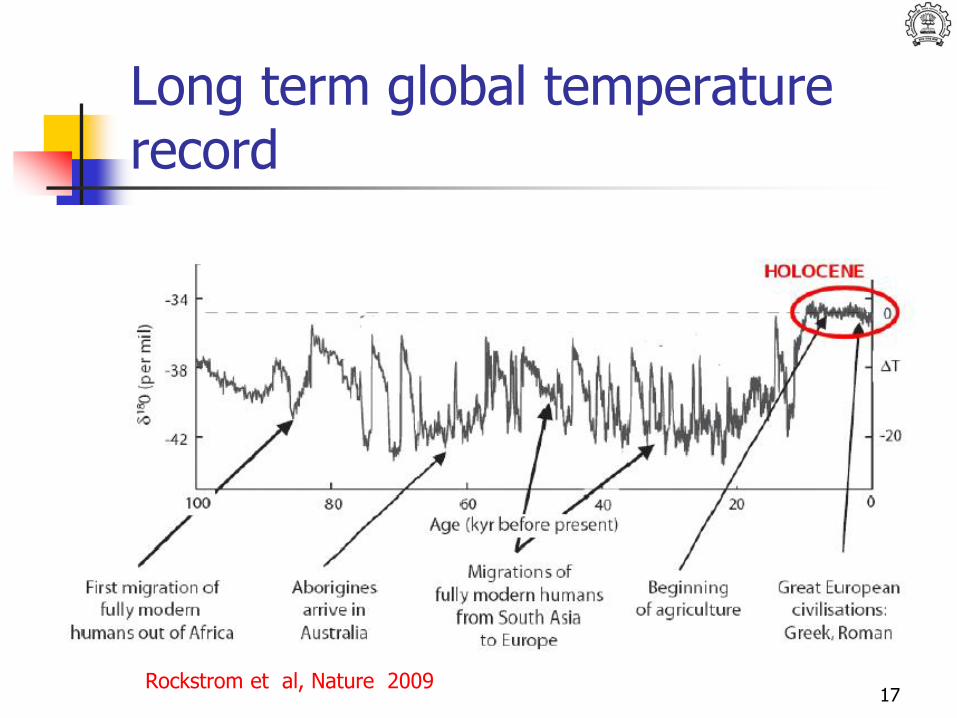
Long term global temperature record
17Rockstrom et al, Nature 2009
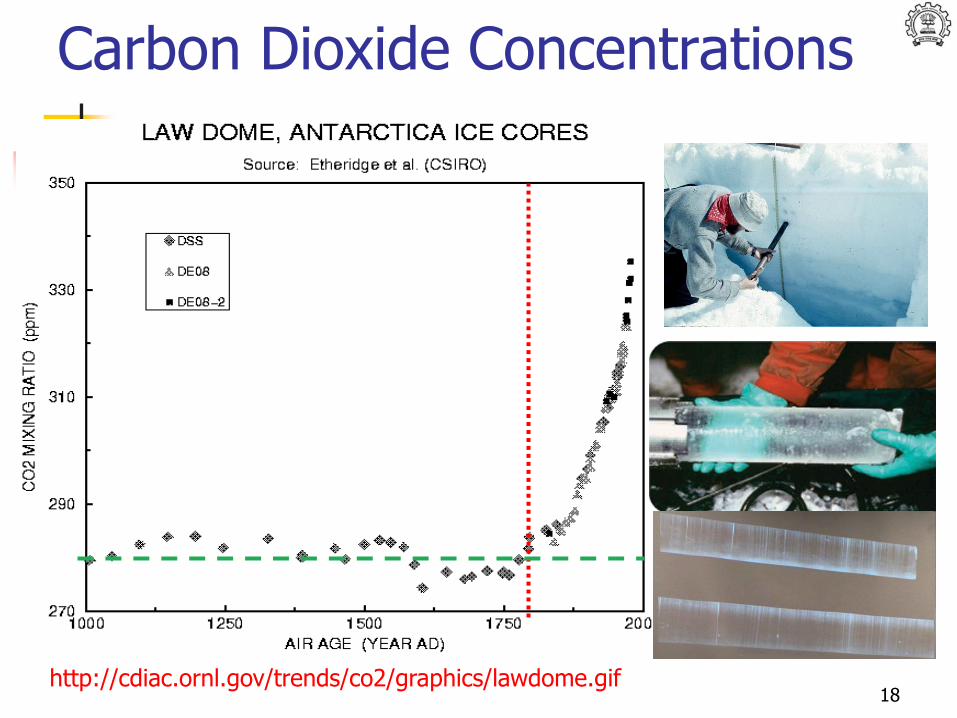
Carbon Dioxide Concentrations
18http://cdiac.ornl.gov/trends/co2/graphics/lawdome.gif
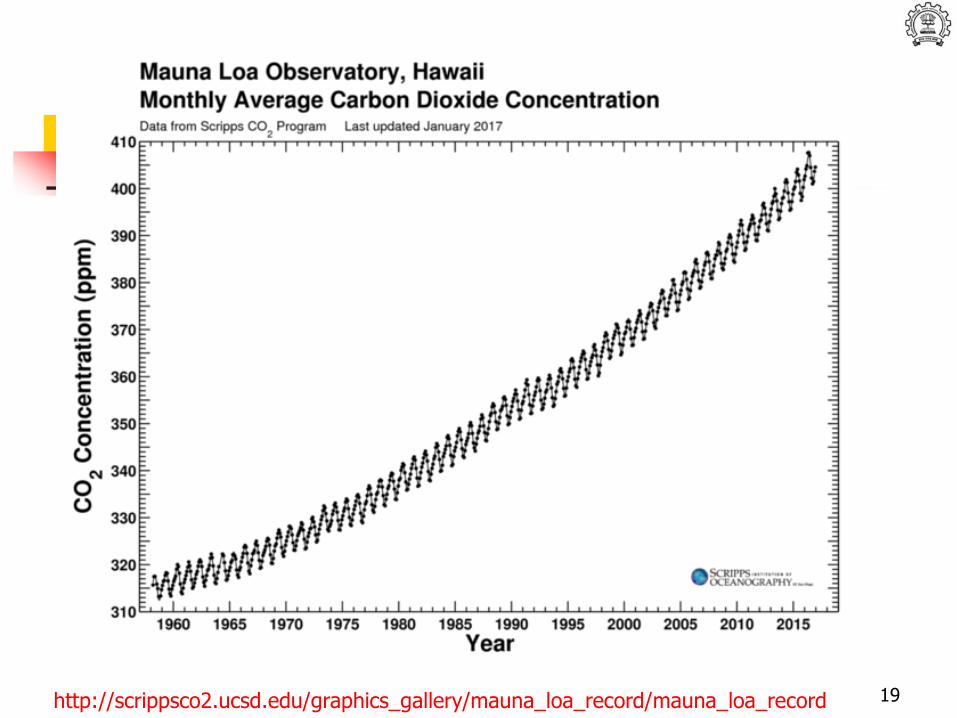
19http://scrippsco2.ucsd.edu/graphics_gallery/mauna_loa_record/mauna_loa_record
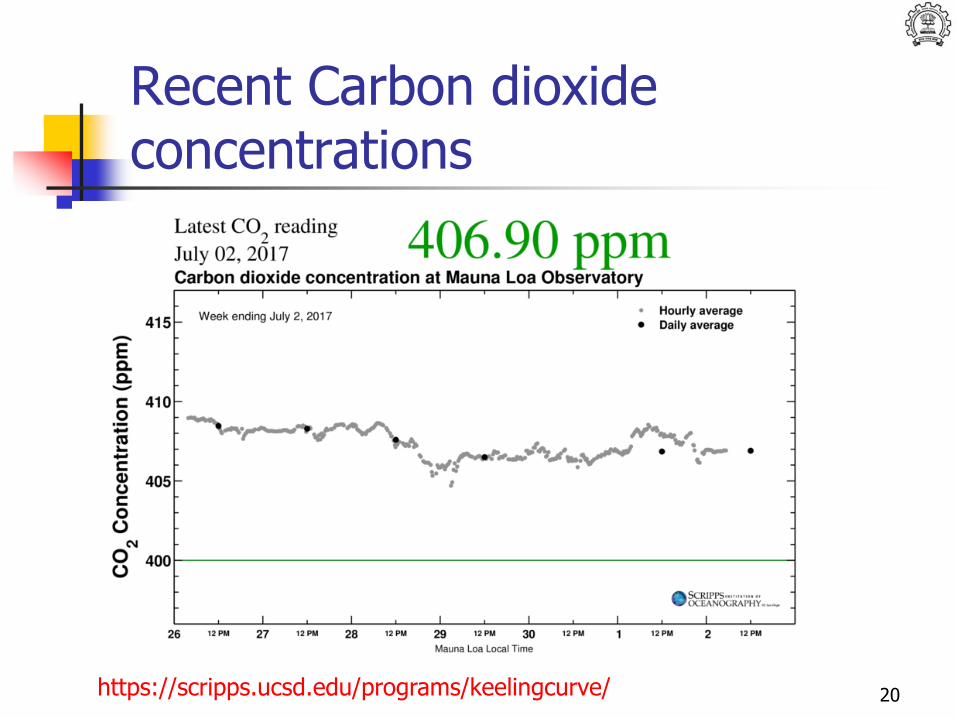
Recent Carbon dioxide concentrations
20https://scripps.ucsd.edu/programs/keelingcurve/
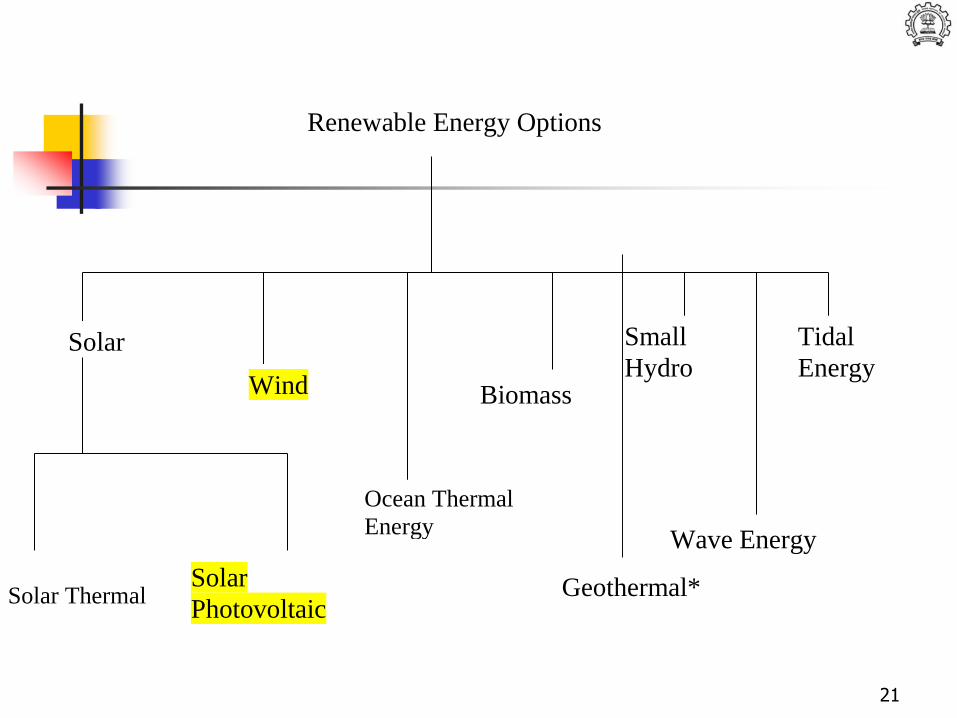
Renewable Energy Options
Wind
Solar Small
Hydro Biomass
Tidal
Energy
Wave Energy
Ocean Thermal
Energy
Solar Thermal
Solar
Photovoltaic
Geothermal*
21
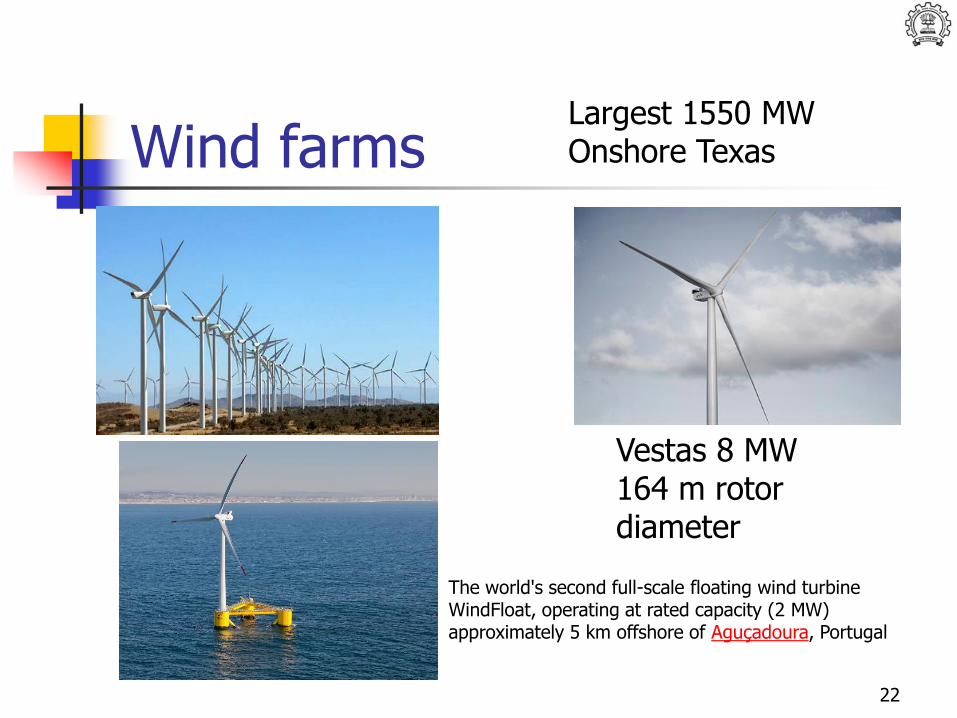
Wind farms
22
Largest 1550 MW Onshore Texas
Vestas 8 MW164 m rotor diameter
The world's second full-scale floating wind turbine WindFloat, operating at rated capacity (2 MW) approximately 5 km offshore of Aguçadoura, Portugal
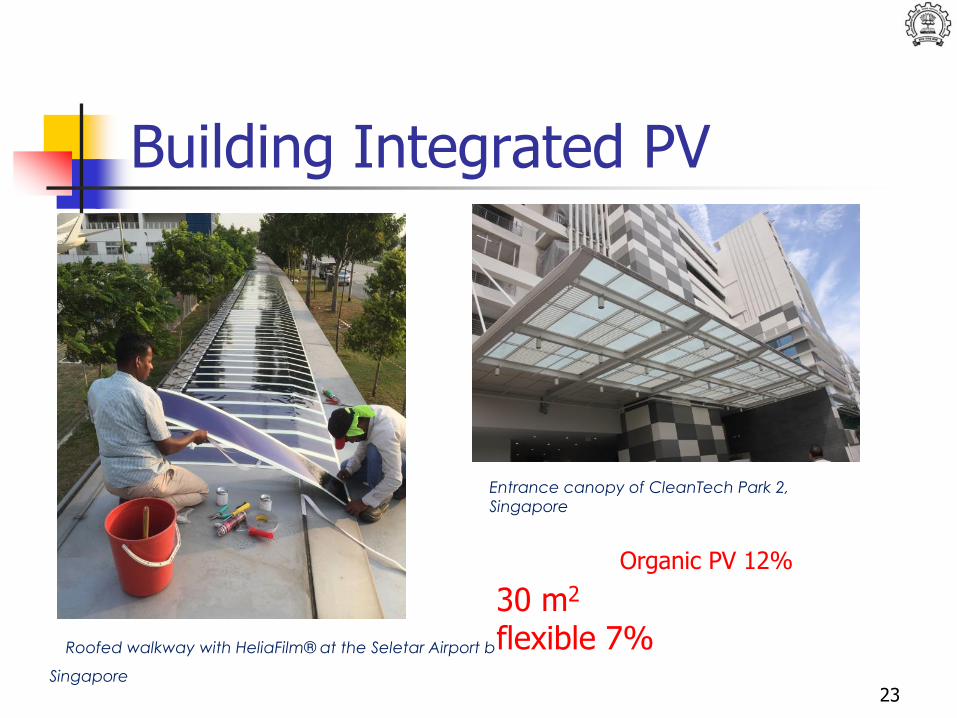
Building Integrated PV
23
Roofed walkway with HeliaFilm® at the Seletar Airport b
Singapore
Entrance canopy of CleanTech Park 2,
Singapore
30 m2
flexible 7%
Organic PV 12%
24
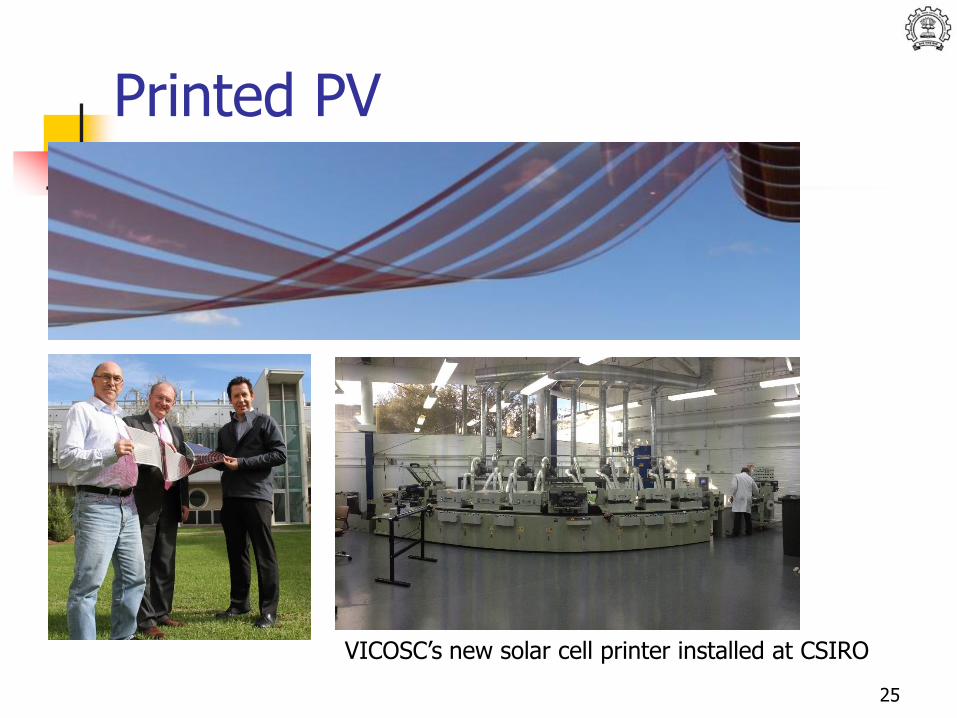
Printed PV
25
VICOSC’s new solar cell printer installed at CSIRO
Renewable Potential
How do we estimate the potential ?
Flows/Fluxes – Not stocks
Technical/ Economic Potential
Spatial Distribution of resource
Daily/Seasonal Variation
Uncertainty
26
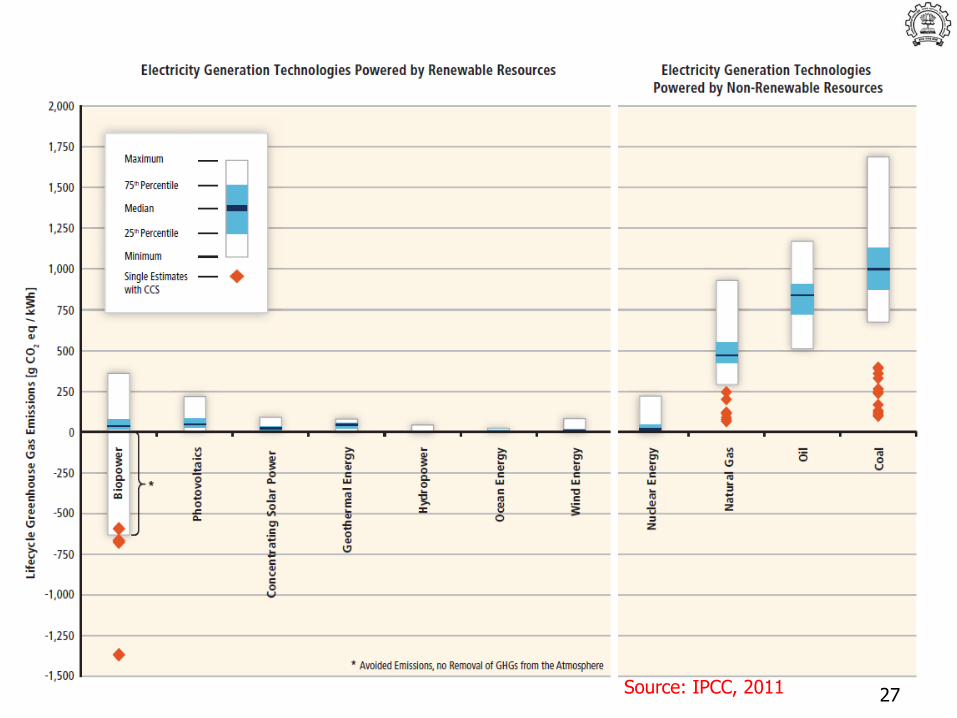
Source: IPCC, 2011 27
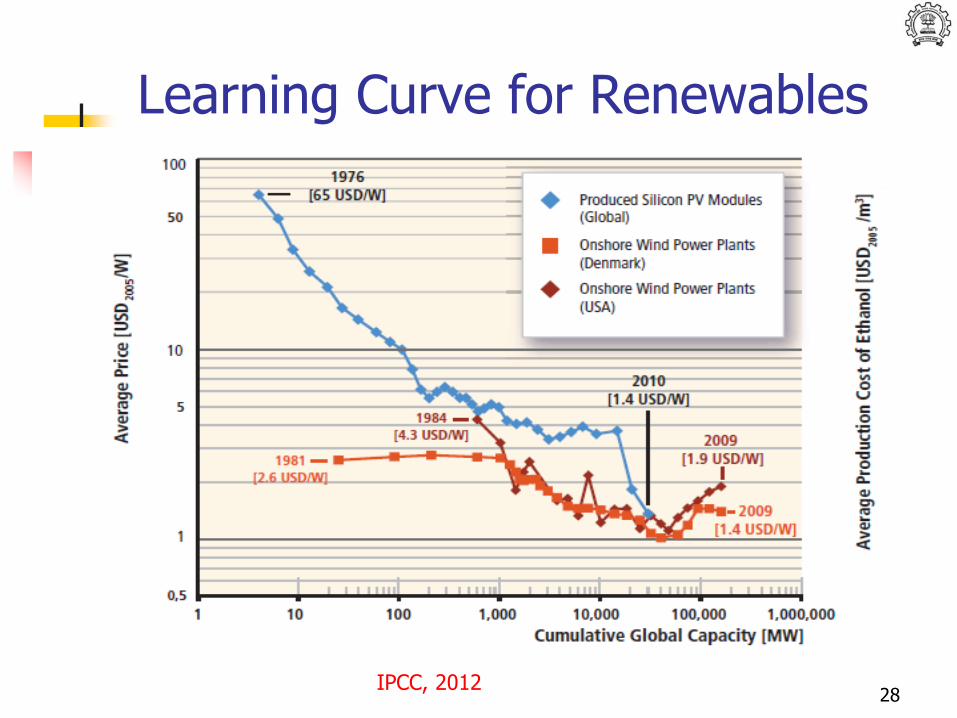
Learning Curve for Renewables
28IPCC, 2012
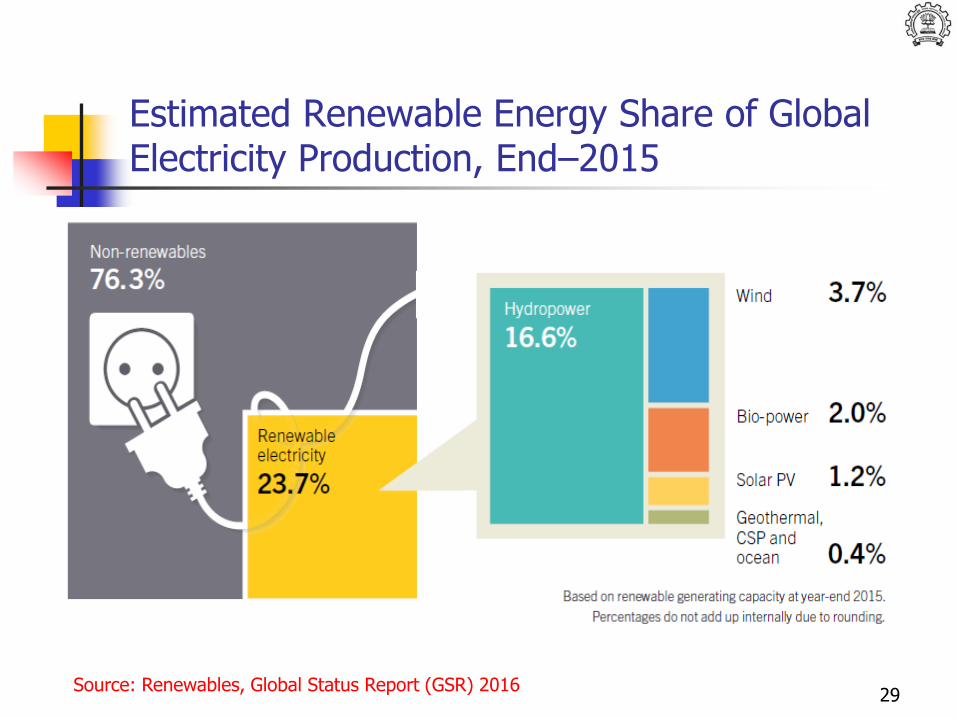
Estimated Renewable Energy Share of Global Electricity Production, End–2015
29Source: Renewables, Global Status Report (GSR) 2016
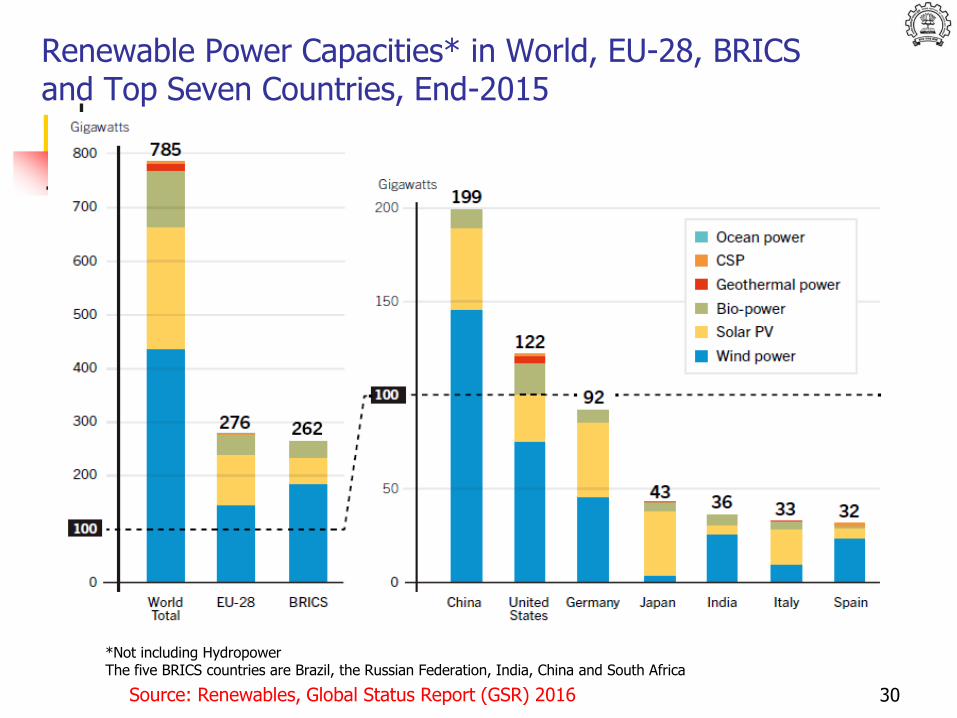
Renewable Power Capacities* in World, EU-28, BRICS and Top Seven Countries, End-2015
30
*Not including HydropowerThe five BRICS countries are Brazil, the Russian Federation, India, China and South Africa
Source: Renewables, Global Status Report (GSR) 2016
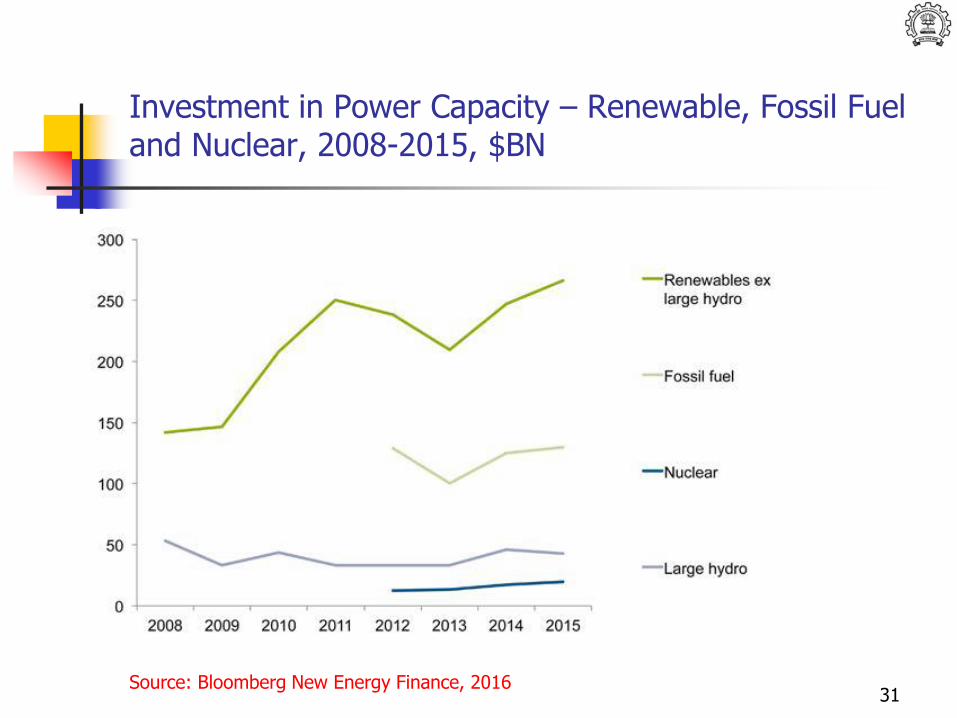
Investment in Power Capacity – Renewable, Fossil Fuel and Nuclear, 2008-2015, $BN
31Source: Bloomberg New Energy Finance, 2016
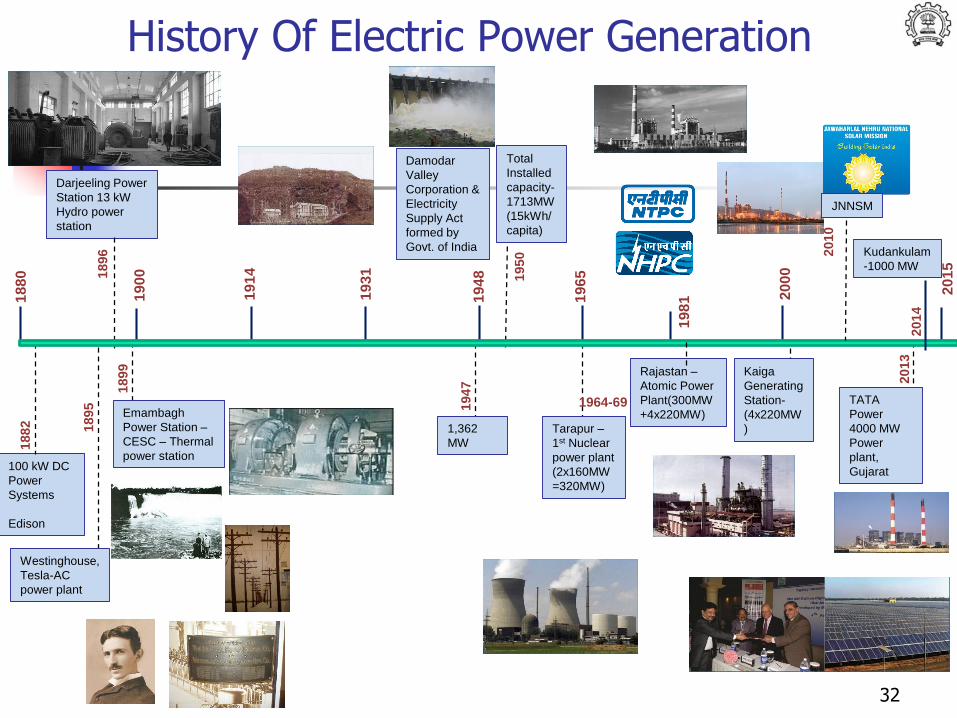
History Of Electric Power Generation
32
100 kW DC
Power
Systems
Edison
1880
1882
Darjeeling Power
Station 13 kW
Hydro power
station
1896
1948
2015
1914
19811
900
1931
1965
2000
1895
Emambagh
Power Station –
CESC – Thermal
power station
1,362
MW
19471899
1964-69
Tarapur –
1st Nuclear
power plant
(2x160MW
=320MW)
Westinghouse,
Tesla-AC
power plant
TATA
Power
4000 MW
Power
plant,
Gujarat
2013
Damodar
Valley
Corporation &
Electricity
Supply Act
formed by
Govt. of India
Total
Installed
capacity-
1713MW
(15kWh/
capita)
1950
JNNSM
2010
Rajastan –
Atomic Power
Plant(300MW
+4x220MW)
Kaiga
Generating
Station-
(4x220MW
)
Kudankulam
-1000 MW
2014
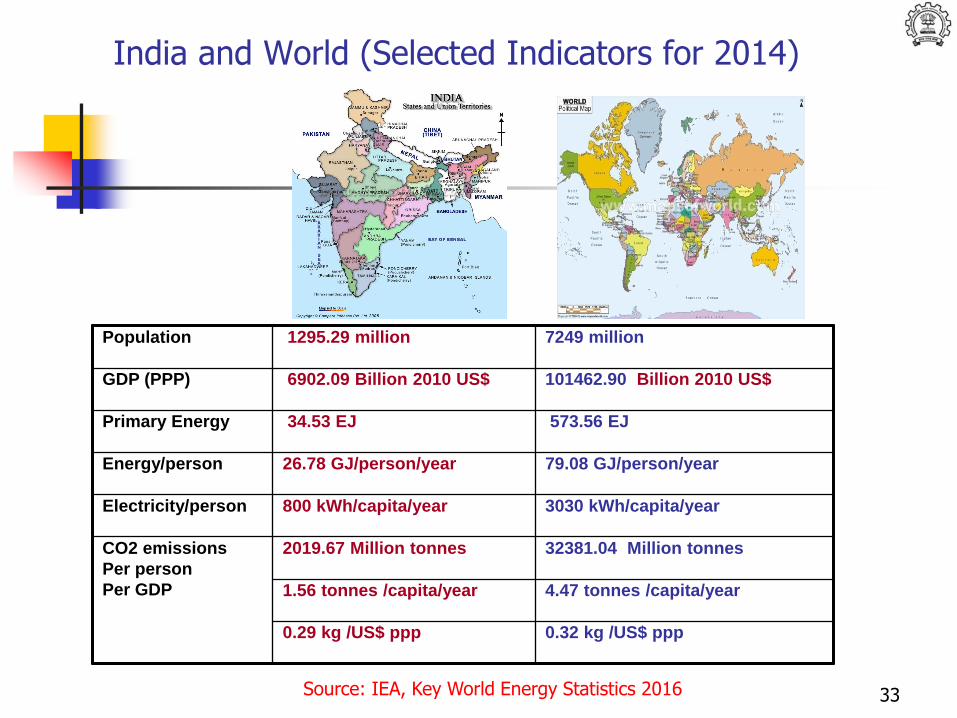
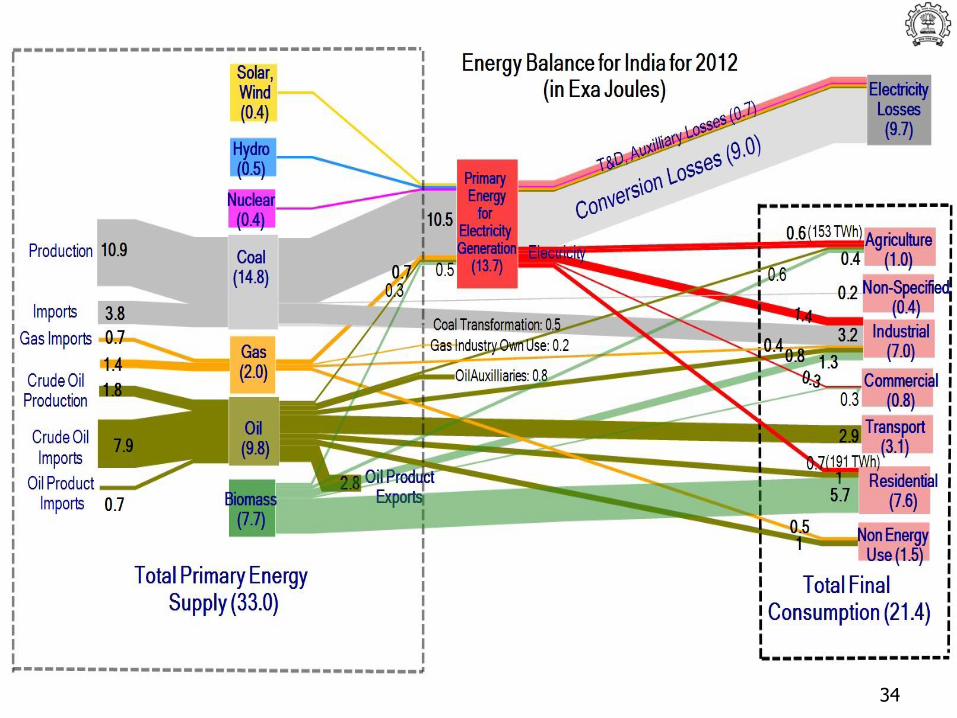
India and World (Selected Indicators for 2014)
Population 1295.29 million 7249 million
GDP (PPP) 6902.09 Billion 2010 US$ 101462.90 Billion 2010 US$
Primary Energy 34.53 EJ 573.56 EJ
Energy/person 26.78 GJ/person/year 79.08 GJ/person/year
Electricity/person 800 kWh/capita/year 3030 kWh/capita/year
CO2 emissions
Per person
Per GDP
2019.67 Million tonnes 32381.04 Million tonnes
1.56 tonnes /capita/year 4.47 tonnes /capita/year
0.29 kg /US$ ppp 0.32 kg /US$ ppp
33Source: IEA, Key World Energy Statistics 2016
34

During the last 40 years the share of renewables in electricity generation in India?
I) Has doubled from its earlier valueII) Has remained almost constantIII) Has decreasedIV) Has increased by 10%V) None of the above
35
India’s INDC
#1 Reduce Emissions Intensity of GDP by 33-35% of 2005 level in 2030
#2 Create 40% cumulative non fossil power by installed capacity by 2030 (using finance from Green Climate Fund)
#3 Create an additional carbon sink of 2.5 to 3 billion tonnes of CO2 equivalent through additional tree cover and forest
36
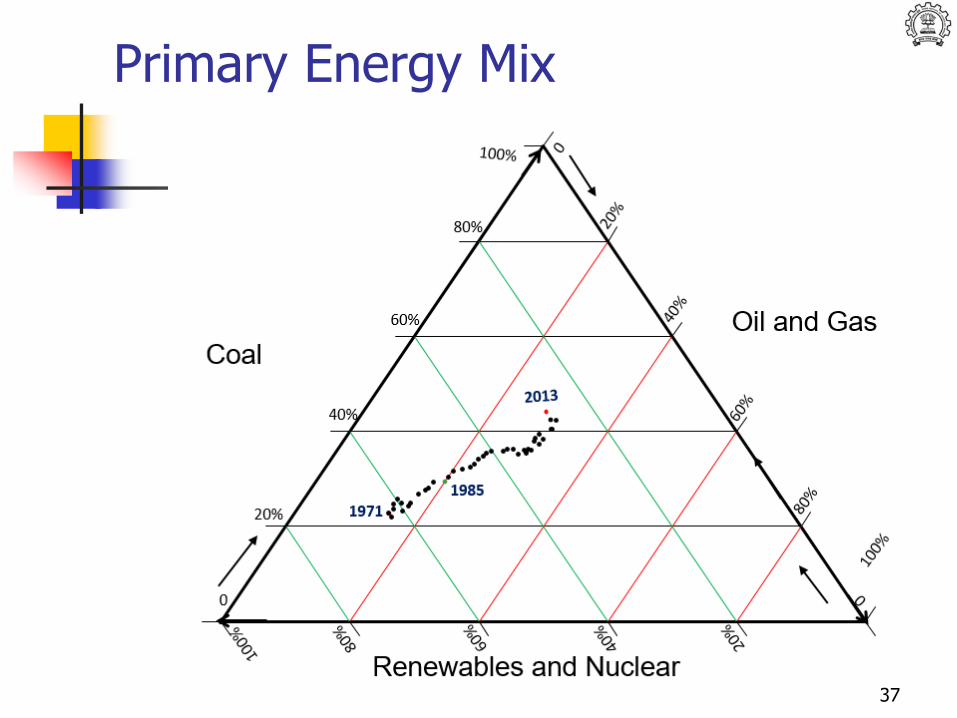
Primary Energy Mix
37
13
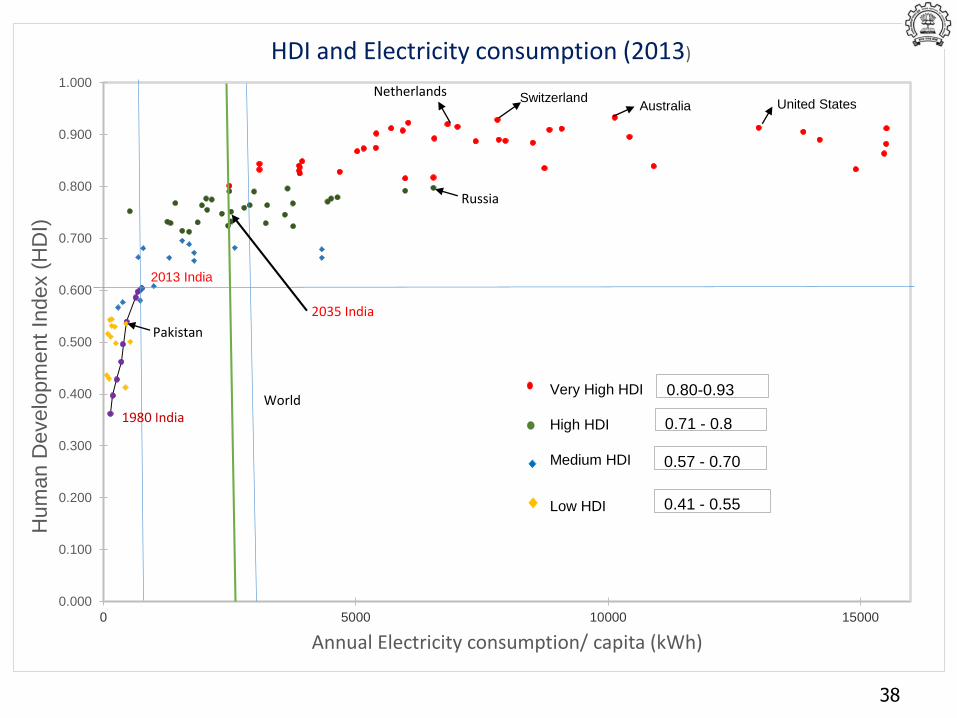
AustraliaSwitzerland
2013 India
United States
0.000
0.100
0.200
0.300
0.400
0.500
0.600
0.700
0.800
0.900
1.000
0 5000 10000 15000
Hum
an D
evelo
pm
ent
Index (
HD
I)
Annual Electricity consumption/ capita (kWh)
HDI and Electricity consumption (2013)
World
2035 India
1980 India
Netherlands
Russia
Pakistan
0.80-0.93
0.71 - 0.8
Very High HDI
High HDI
Medium HDI
Low HDI
0.57 - 0.70
0.41 - 0.55
38
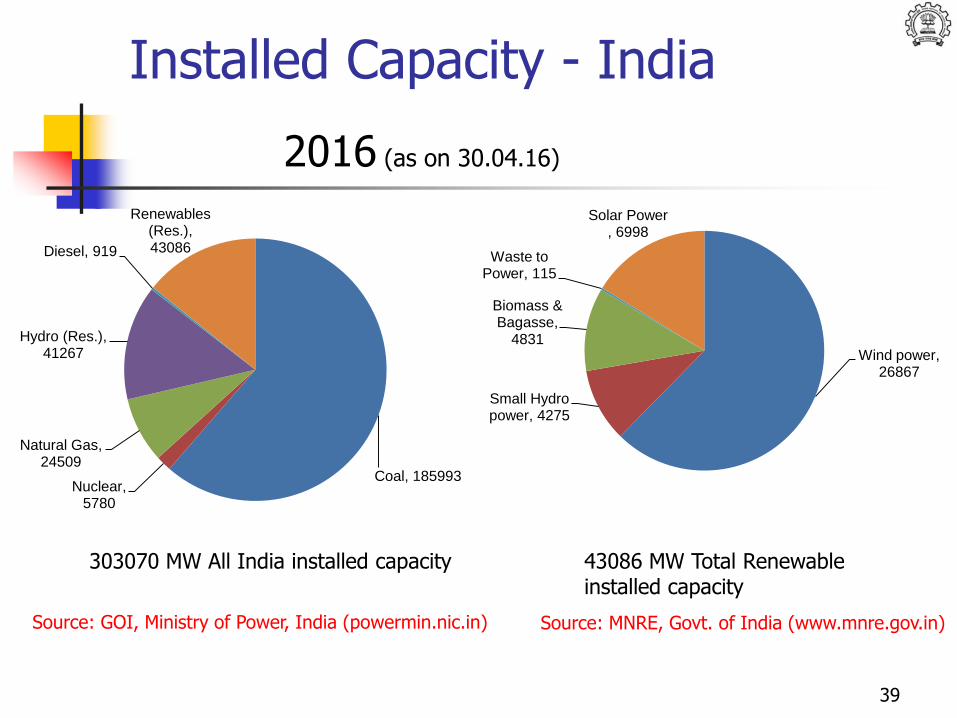
Installed Capacity - India
303070 MW All India installed capacity
Source: GOI, Ministry of Power, India (powermin.nic.in)
43086 MW Total Renewable installed capacity
2016 (as on 30.04.16)
Coal, 185993Nuclear,
5780
Natural Gas, 24509
Hydro (Res.), 41267
Diesel, 919
Renewables (Res.), 43086
Wind power, 26867
Small Hydro power, 4275
Biomass & Bagasse,
4831
Waste to Power, 115
Solar Power , 6998
Source: MNRE, Govt. of India (www.mnre.gov.in)
39
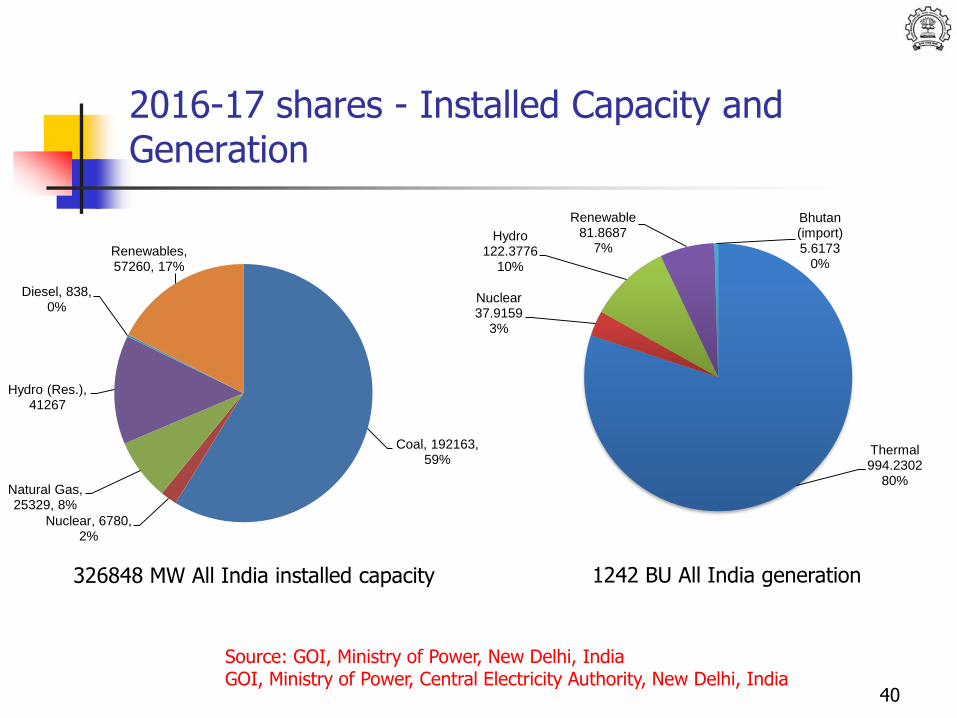
2016-17 shares - Installed Capacity and Generation
326848 MW All India installed capacity
Source: GOI, Ministry of Power, New Delhi, India GOI, Ministry of Power, Central Electricity Authority, New Delhi, India
Coal, 192163, 59%
Nuclear, 6780, 2%
Natural Gas, 25329, 8%
Hydro (Res.), 41267
Diesel, 838, 0%
Renewables, 57260, 17%
Thermal994.2302
80%
Nuclear37.9159
3%
Hydro122.3776
10%
Renewable 81.8687
7%
Bhutan (import)5.6173
0%
1242 BU All India generation
40
Renewable share?
41
What will be the future supply mix for the Electricity sector ?
How much can renewables and nuclear supply?
0
2
4
6
8
10
12
14
2001 2002 2003 2004 2005 2006 2007 2008 2009 2010 2011 2012 2013
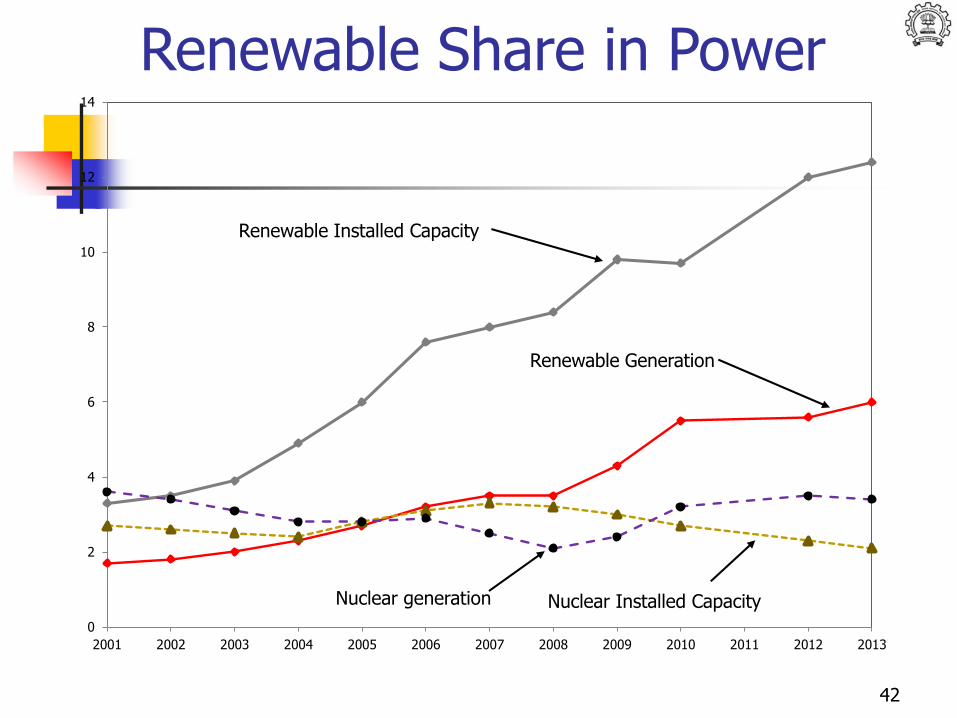
Renewable Installed Capacity
Renewable Generation
Nuclear generation Nuclear Installed Capacity
Renewable Share in Power
42
43
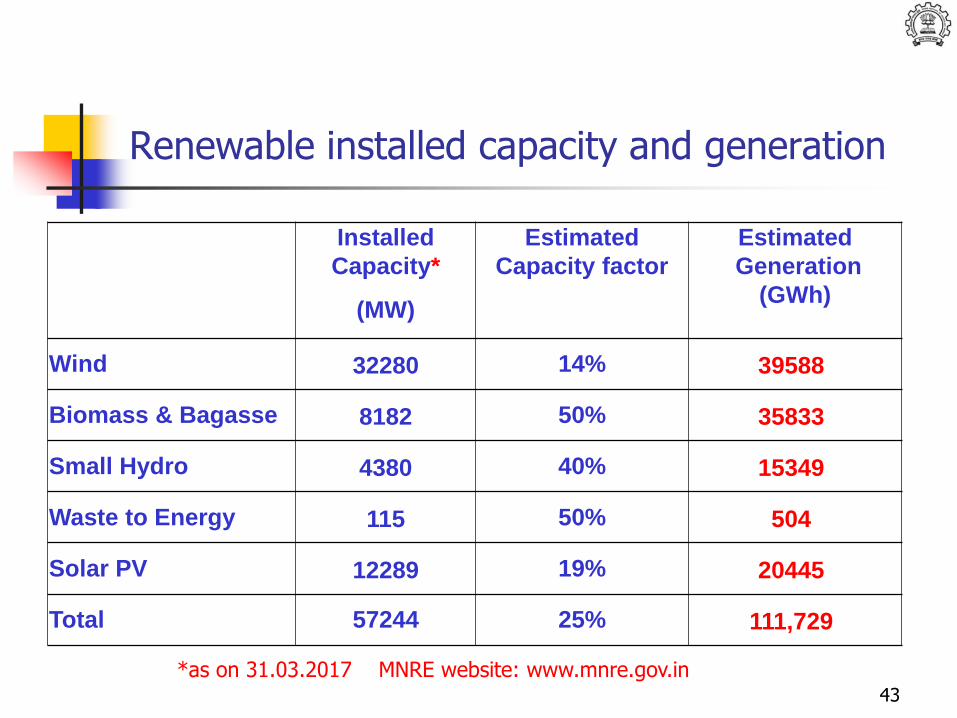
Renewable installed capacity and generation
*as on 31.03.2017 MNRE website: www.mnre.gov.in
Installed
Capacity*
Estimated
Capacity factor
Estimated
Generation
(GWh) (MW)
Wind 32280 14% 39588
Biomass & Bagasse 8182 50% 35833
Small Hydro 4380 40% 15349
Waste to Energy 115 50% 504
Solar PV 12289 19% 20445
Total 57244 25% 111,729
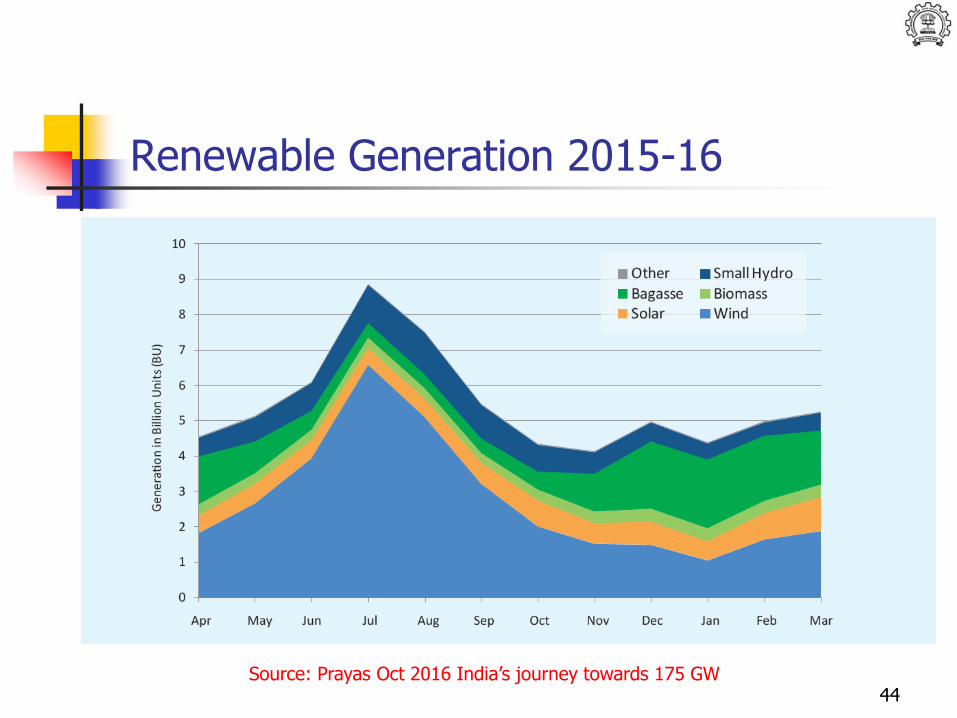
Renewable Generation 2015-16
Source: Prayas Oct 2016 India’s journey towards 175 GW44
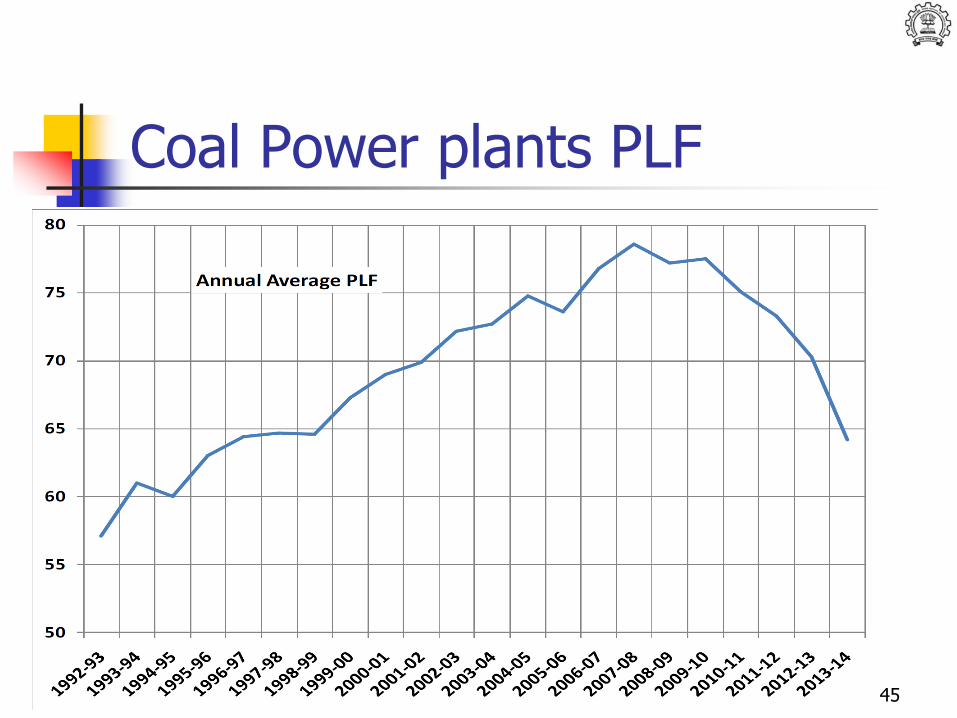
Coal Power plants PLF
45
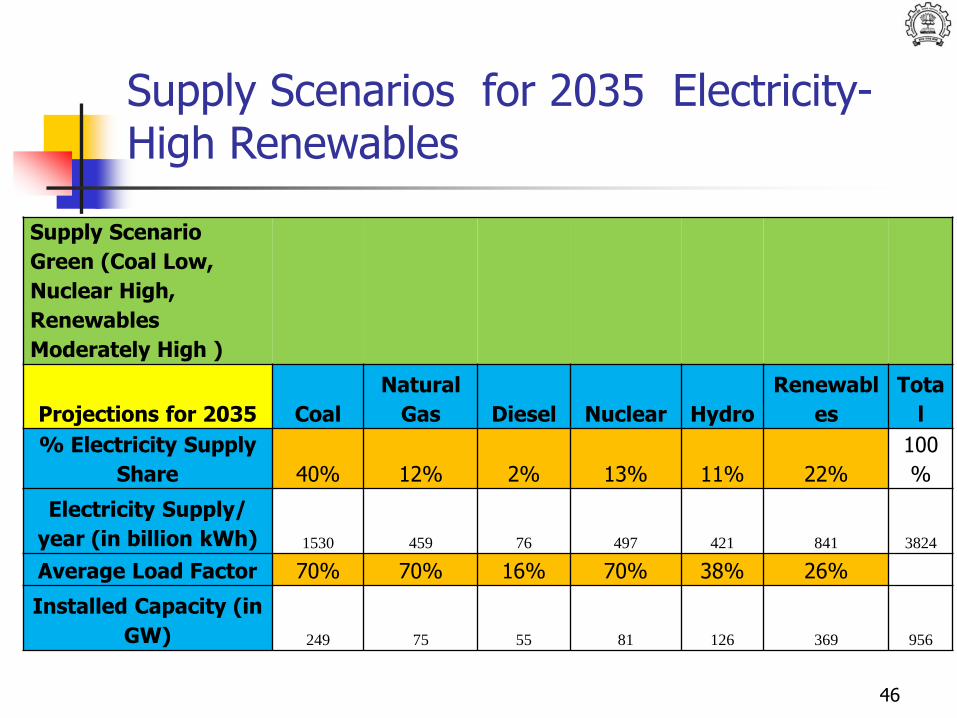
Supply Scenarios for 2035 Electricity-High Renewables
Supply Scenario
Green (Coal Low,
Nuclear High,
Renewables
Moderately High )
Projections for 2035 Coal
Natural
Gas Diesel Nuclear Hydro
Renewabl
es
Tota
l
% Electricity Supply
Share 40% 12% 2% 13% 11% 22%
100
%
Electricity Supply/
year (in billion kWh) 1530 459 76 497 421 841 3824
Average Load Factor 70% 70% 16% 70% 38% 26%
Installed Capacity (in
GW) 249 75 55 81 126 369 956
46
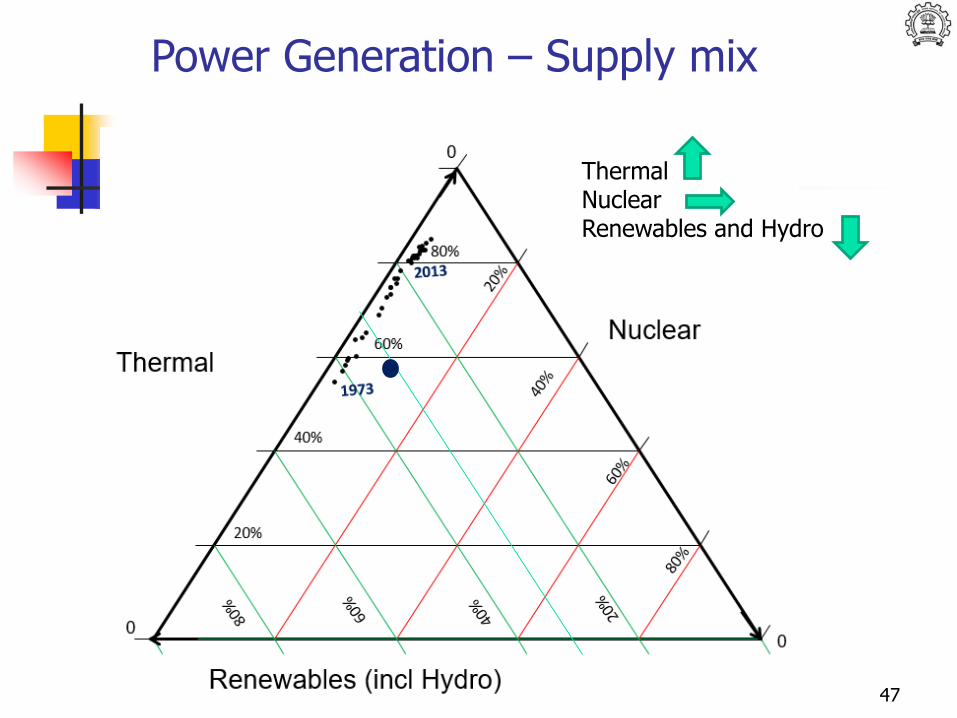
Power Generation – Supply mix
Thermal NuclearRenewables and Hydro
47
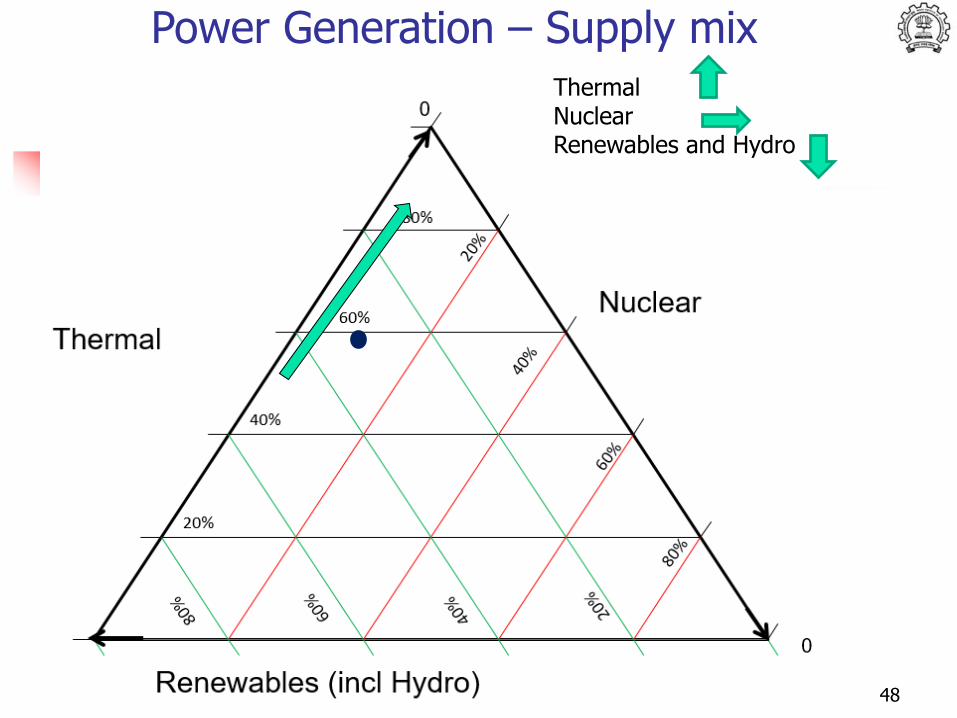
Power Generation – Supply mixThermal NuclearRenewables and Hydro
48
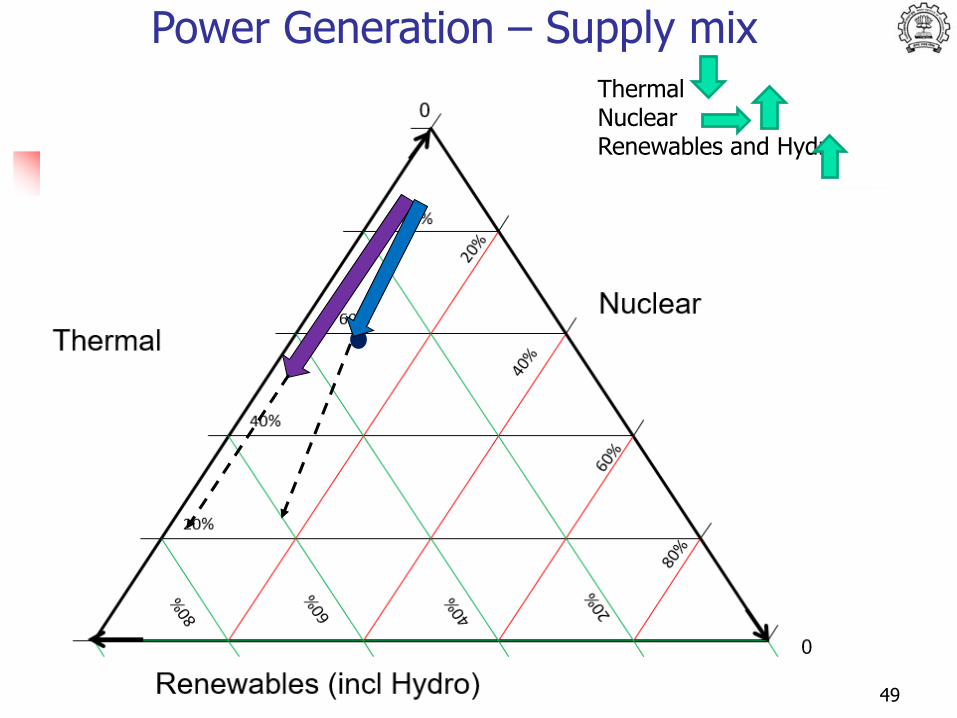
Power Generation – Supply mix
Thermal NuclearRenewables and Hydro
49
50
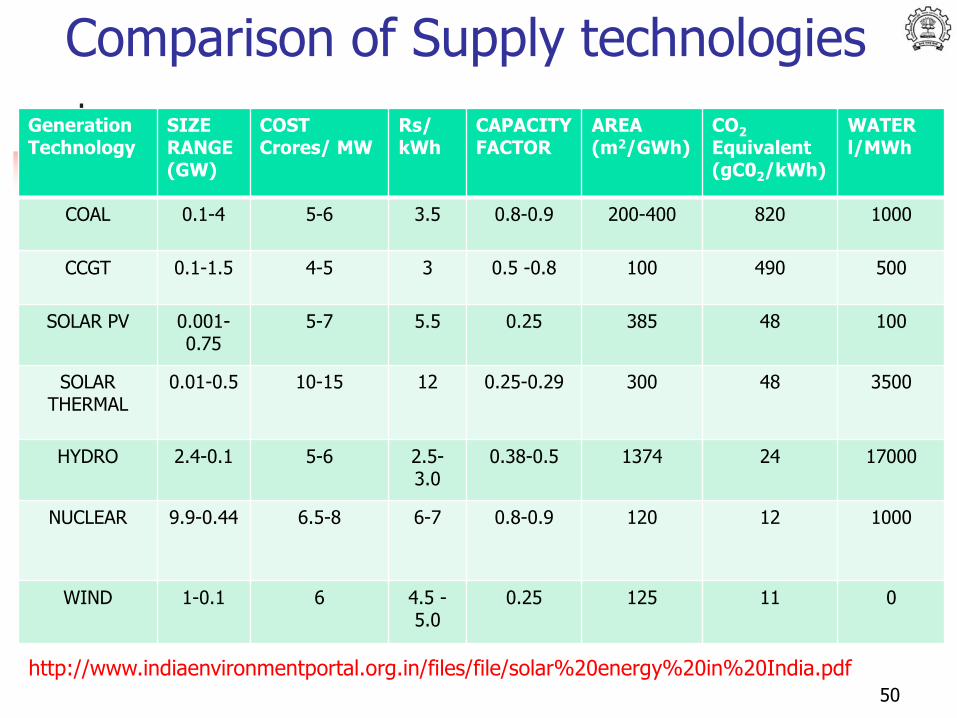
Comparison of Supply technologies
GenerationTechnology
SIZERANGE(GW)
COSTCrores/ MW
Rs/kWh
CAPACITY FACTOR
AREA(m2/GWh)
CO2
Equivalent(gC02/kWh)
WATERl/MWh
COAL 0.1-4 5-6 3.5 0.8-0.9 200-400 820 1000
CCGT 0.1-1.5 4-5 3 0.5 -0.8 100 490 500
SOLAR PV 0.001-0.75
5-7 5.5 0.25 385 48 100
SOLARTHERMAL
0.01-0.5 10-15 12 0.25-0.29 300 48 3500
HYDRO 2.4-0.1 5-6 2.5-3.0
0.38-0.5 1374 24 17000
NUCLEAR 9.9-0.44 6.5-8 6-7 0.8-0.9 120 12 1000
WIND 1-0.1 6 4.5 -5.0
0.25 125 11 0
http://www.indiaenvironmentportal.org.in/files/file/solar%20energy%20in%20India.pdf

Variation in Solar Price Bids
51
0
1
2
3
4
5
6
7
8
9
10
11
12
Ta
riff
Bid
Rs/k
Wh
Aus 6 c/kWh
Aus 10 c/kWh
Aus 20 c/kWh
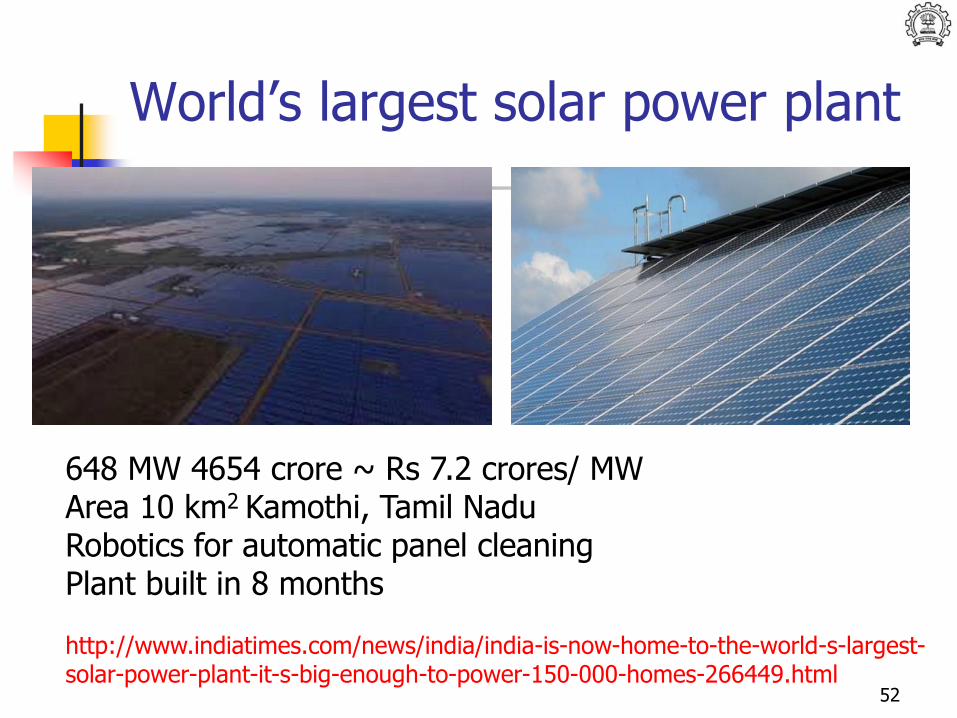
World’s largest solar power plant
52
648 MW 4654 crore ~ Rs 7.2 crores/ MWArea 10 km2 Kamothi, Tamil NaduRobotics for automatic panel cleaningPlant built in 8 months
http://www.indiatimes.com/news/india/india-is-now-home-to-the-world-s-largest-solar-power-plant-it-s-big-enough-to-power-150-000-homes-266449.html
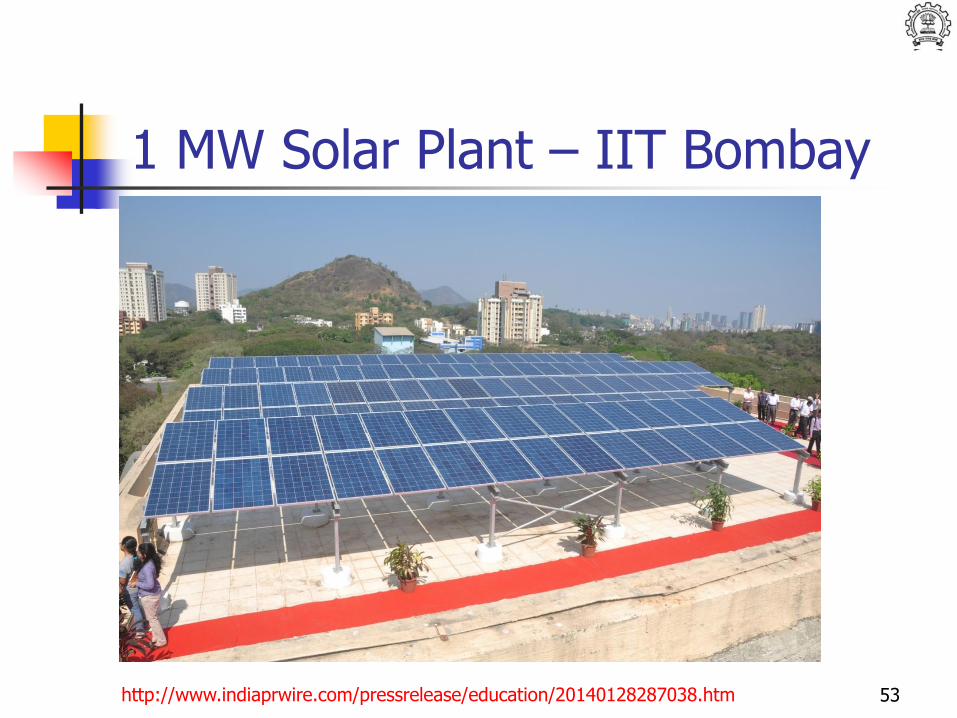
1 MW Solar Plant – IIT Bombay
53http://www.indiaprwire.com/pressrelease/education/20140128287038.htm
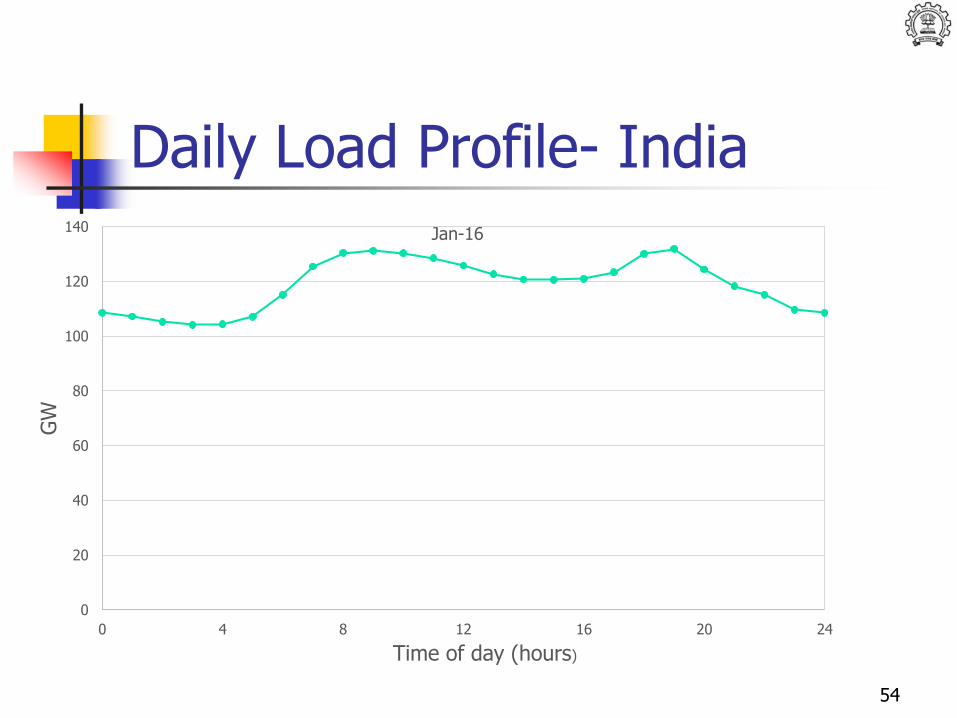
Daily Load Profile- India
54
0
20
40
60
80
100
120
140
0 4 8 12 16 20 24
GW
Time of day (hours)
Jan-16
Non Fossil Electricity
175 GW Target Achievable
Low Capacity factors- High daily and seasonal variability
Financing issues – Initial capital –Reduction in GDP, Equity impacts
Need for R&D and indigenization
55
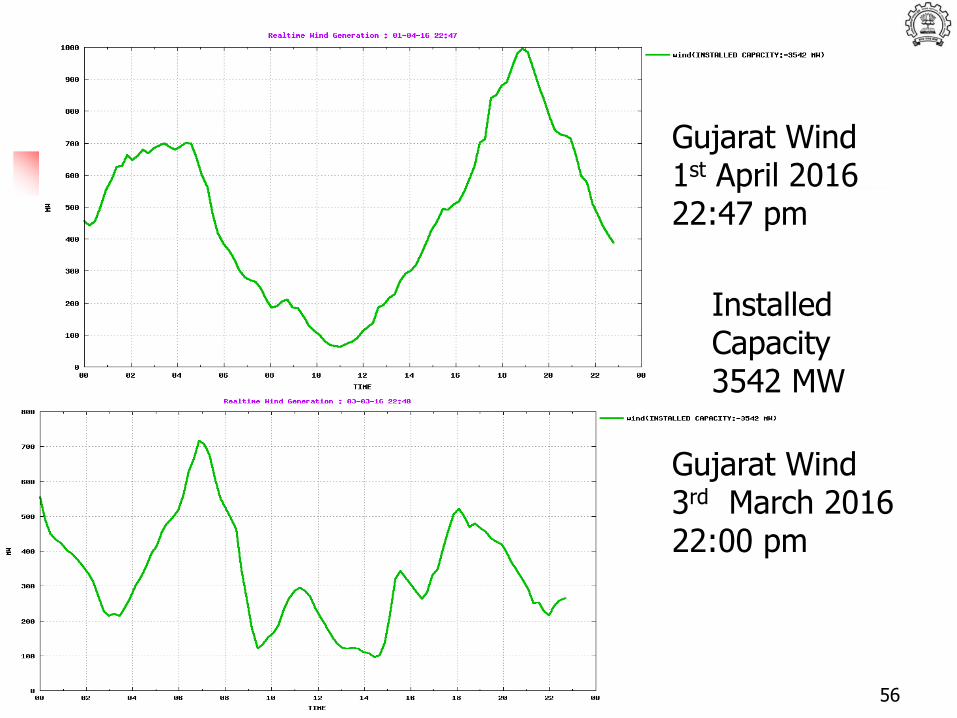
56
Gujarat Wind1st April 201622:47 pm
Gujarat Wind3rd March 201622:00 pm
Installed Capacity 3542 MW
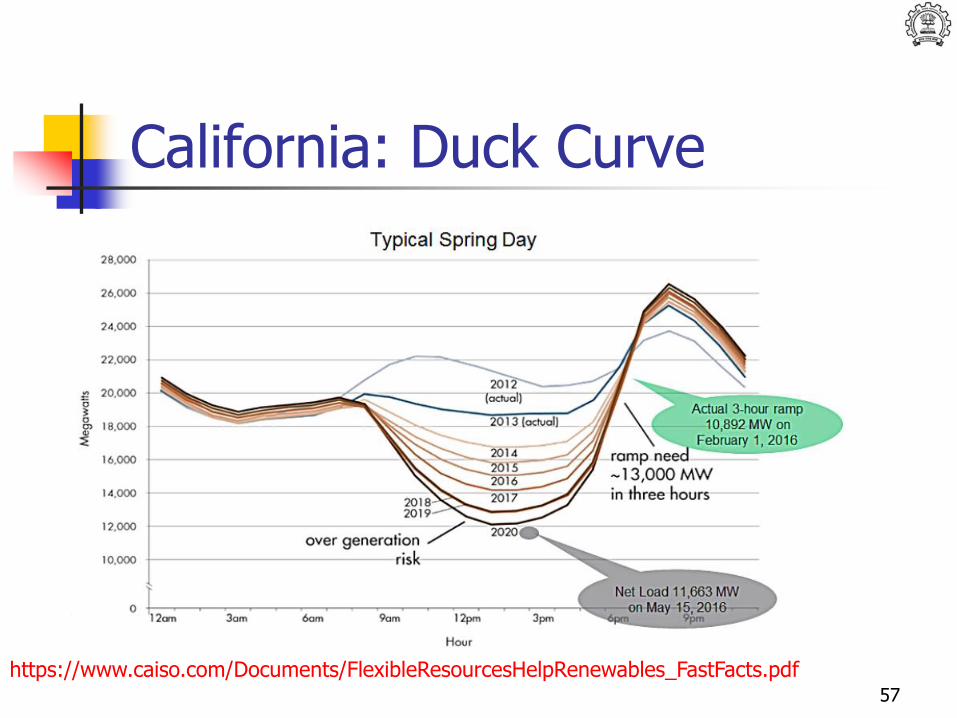
California: Duck Curve
57
https://www.caiso.com/Documents/FlexibleResourcesHelpRenewables_FastFacts.pdf
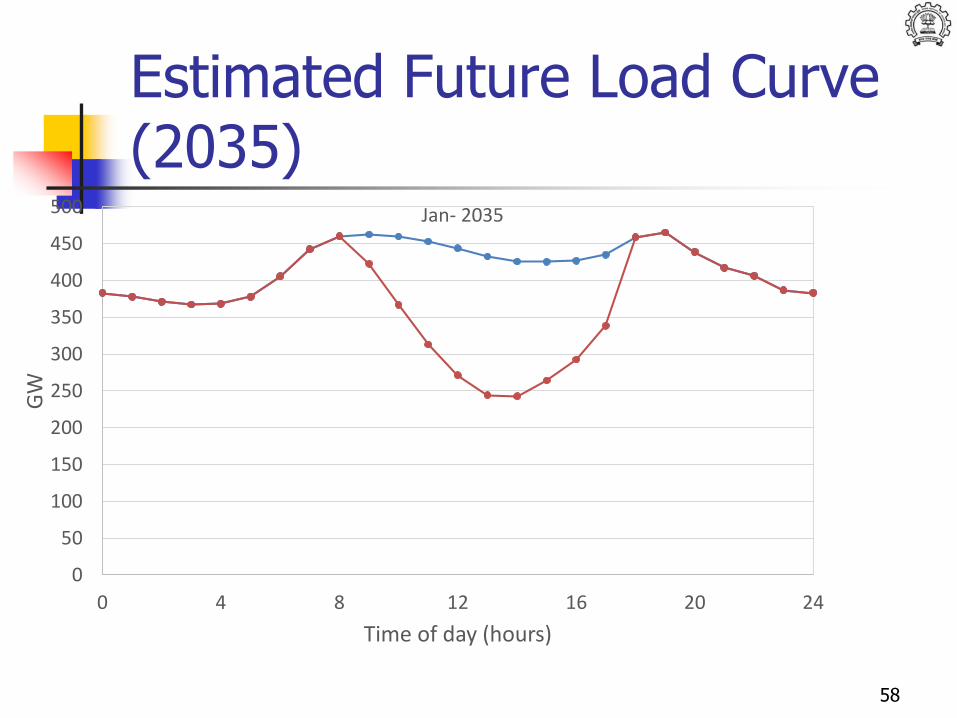
Estimated Future Load Curve (2035)
58
0
50
100
150
200
250
300
350
400
450
500
0 4 8 12 16 20 24
GW
Time of day (hours)
Jan- 2035
59
Are we reaching the limits to Energy Efficiency?
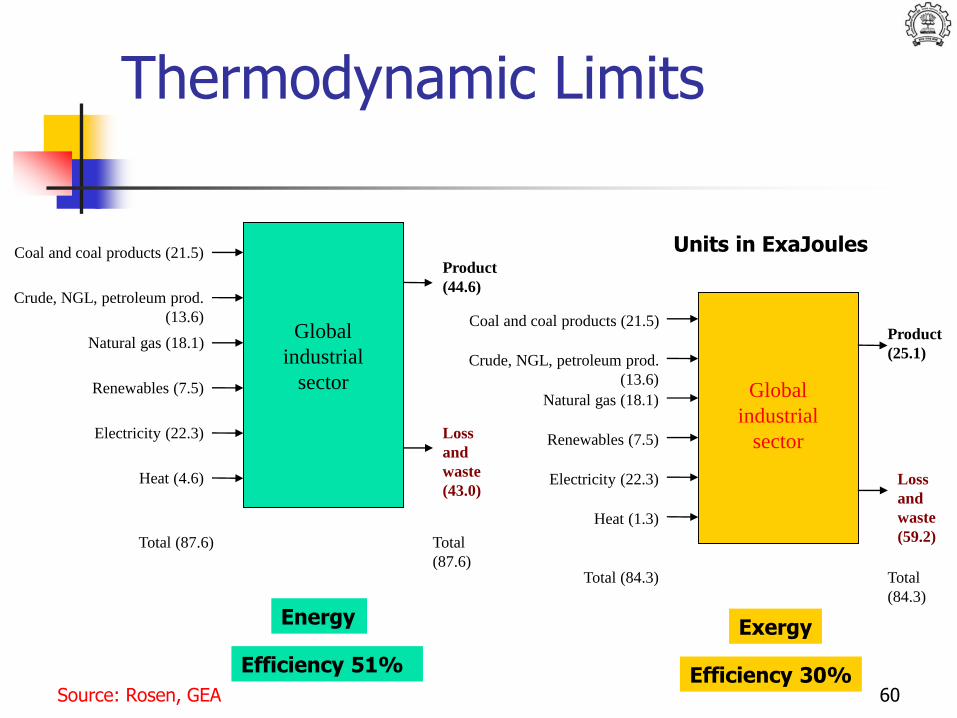
Thermodynamic Limits
Coal and coal products (21.5)
Crude, NGL, petroleum prod.
(13.6)
Natural gas (18.1)
Renewables (7.5)
Product
(44.6)
Loss
and
waste
(43.0)
Global
industrial
sector
Electricity (22.3)
Heat (4.6)
Total (87.6) Total
(87.6)
Coal and coal products (21.5)
Crude, NGL, petroleum prod.
(13.6)
Natural gas (18.1)
Renewables (7.5)
Product
(25.1)
Loss
and
waste
(59.2)
Global
industrial
sector
Electricity (22.3)
Heat (1.3)
Total (84.3) Total
(84.3)
Units in ExaJoules
Efficiency 51% Efficiency 30%
Energy Exergy
Source: Rosen, GEA 60
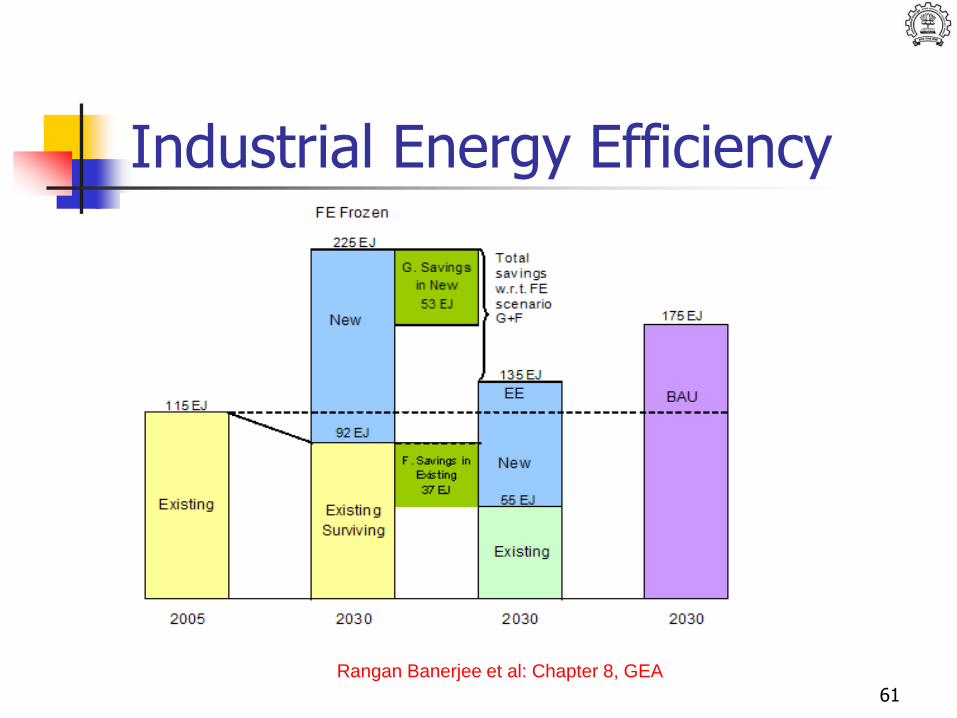
Industrial Energy Efficiency
Rangan Banerjee et al: Chapter 8, GEA
61
Energy Efficiency?
Does the metric remain relevant?
Consider other metrics also –Sustainability – water, emissions, land, cost
Input energy – renewable – not constrained
Embodied Energy, Embodied Carbon
Life Cycle Analysis, Energy Patback Period
Additional indices
62
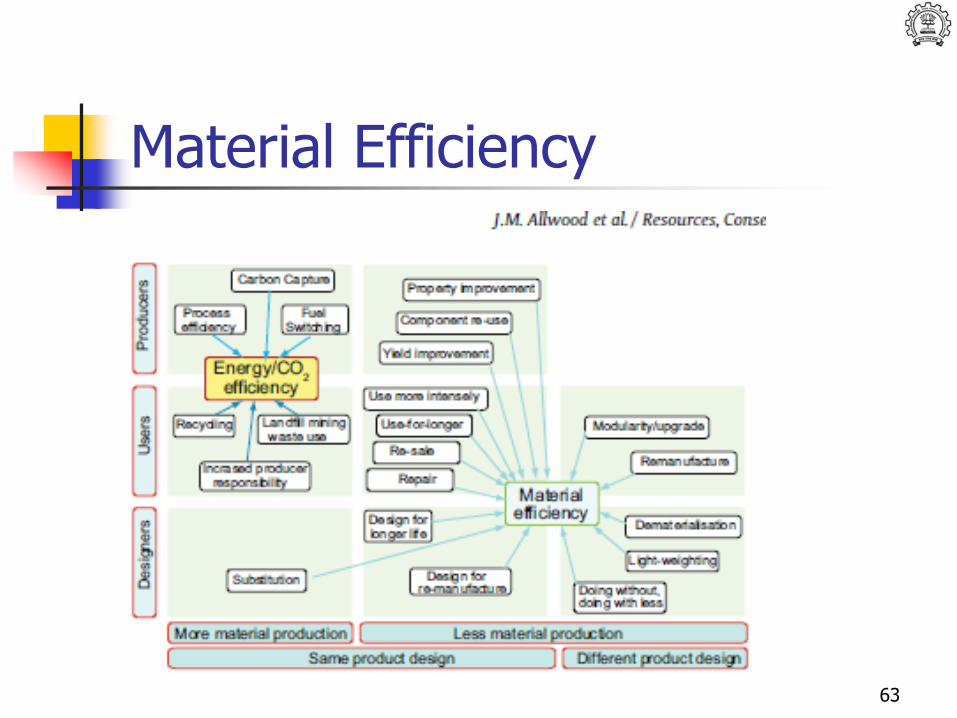
Material Efficiency
63

Material Choice
64Allwood et al, 2011
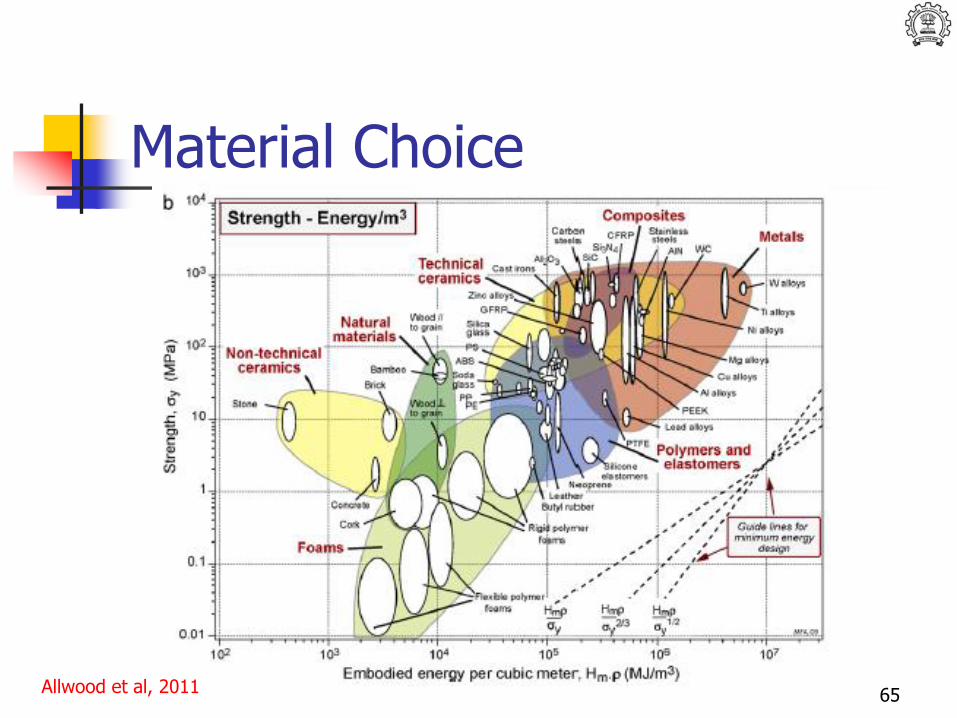
Material Choice
65Allwood et al, 2011
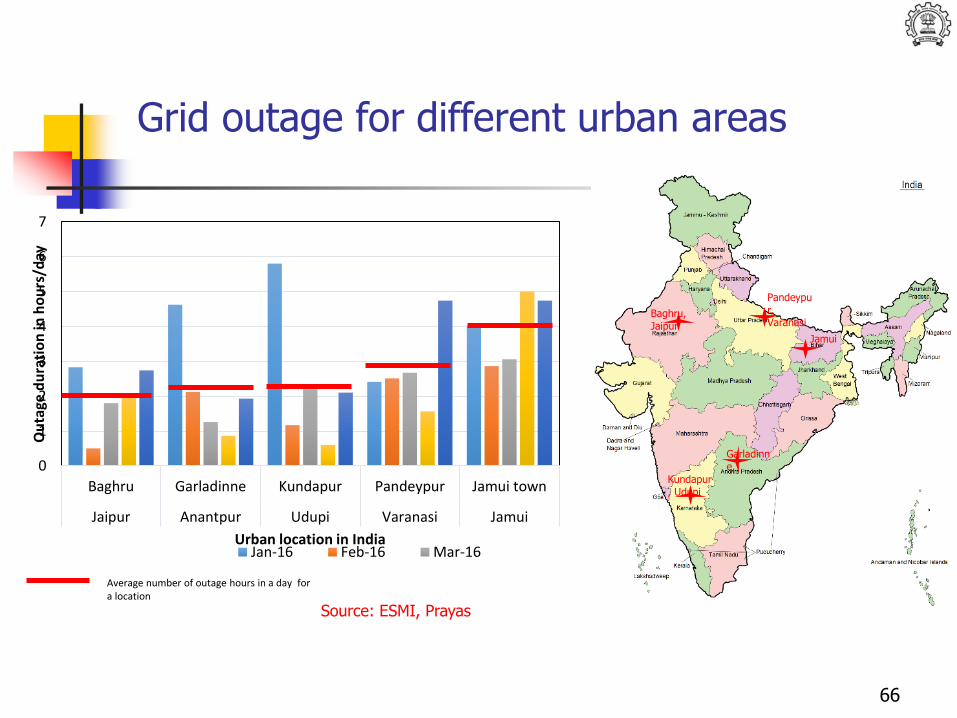
Grid outage for different urban areas
Source: ESMI, Prayas
66
Baghru,
Jaipur
Garladinn
e,
Kundapur
, Udupi
Pandeypu
r, Varanasi
Jamui
0
1
2
3
4
5
6
7
Baghru Garladinne Kundapur Pandeypur Jamui town
Jaipur Anantpur Udupi Varanasi Jamui
Ou
tage
du
rati
on
in h
ou
rs/d
ay
Urban location in IndiaJan-16 Feb-16 Mar-16
Average number of outage hours in a day for a location
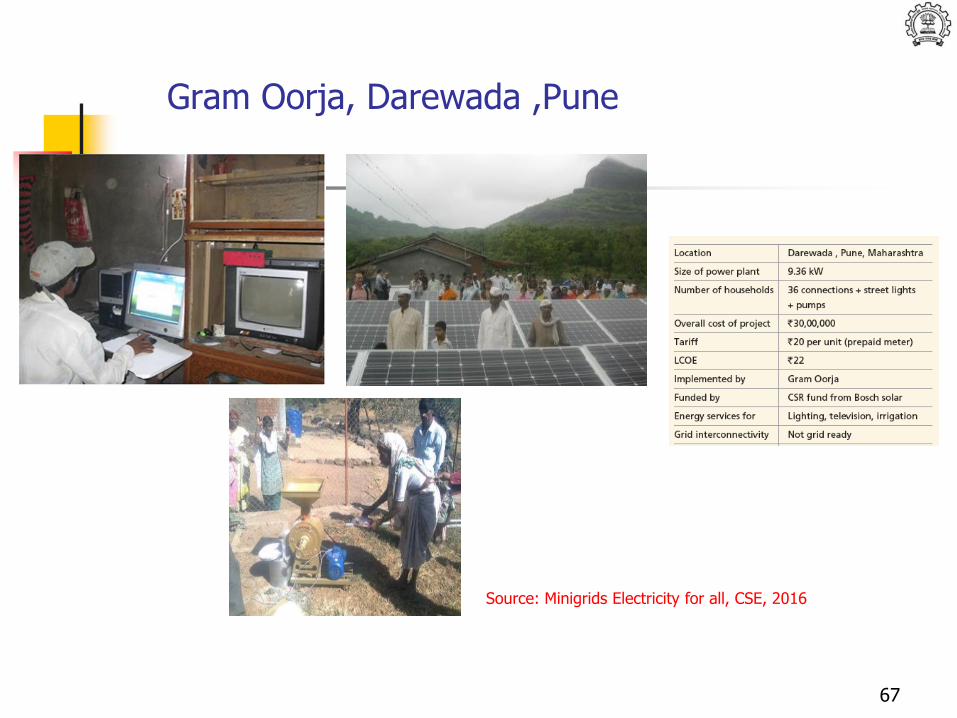
Gram Oorja, Darewada ,Pune
Source: Minigrids Electricity for all, CSE, 2016
67
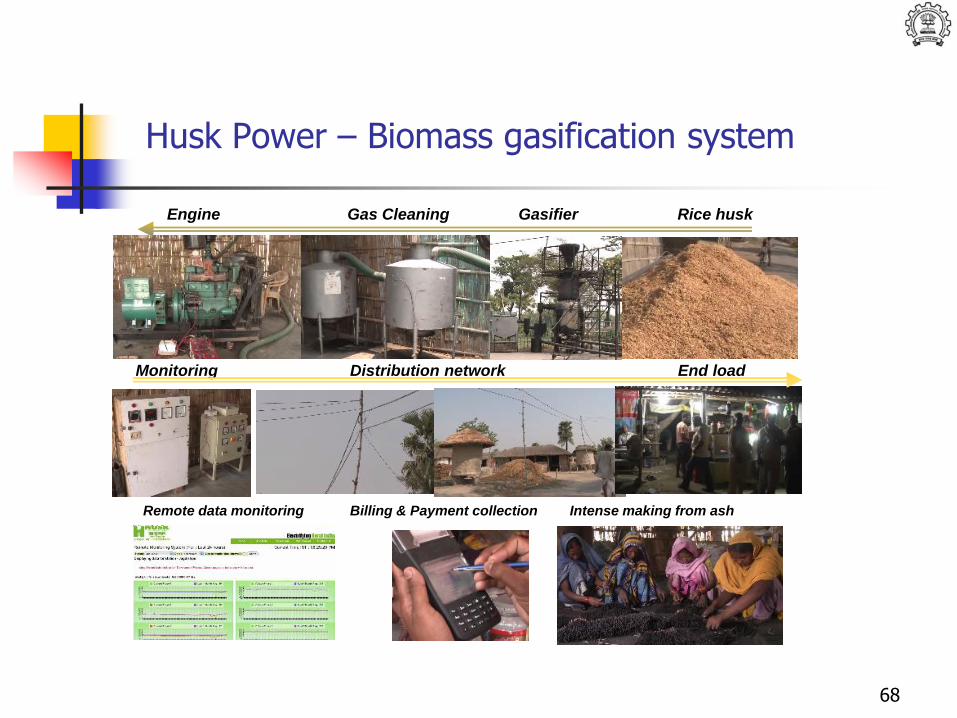
Husk Power – Biomass gasification system
Rice huskGasifierGas CleaningEngine
Monitoring Distribution network End load
Remote data monitoring Billing & Payment collection Intense making from ash
68
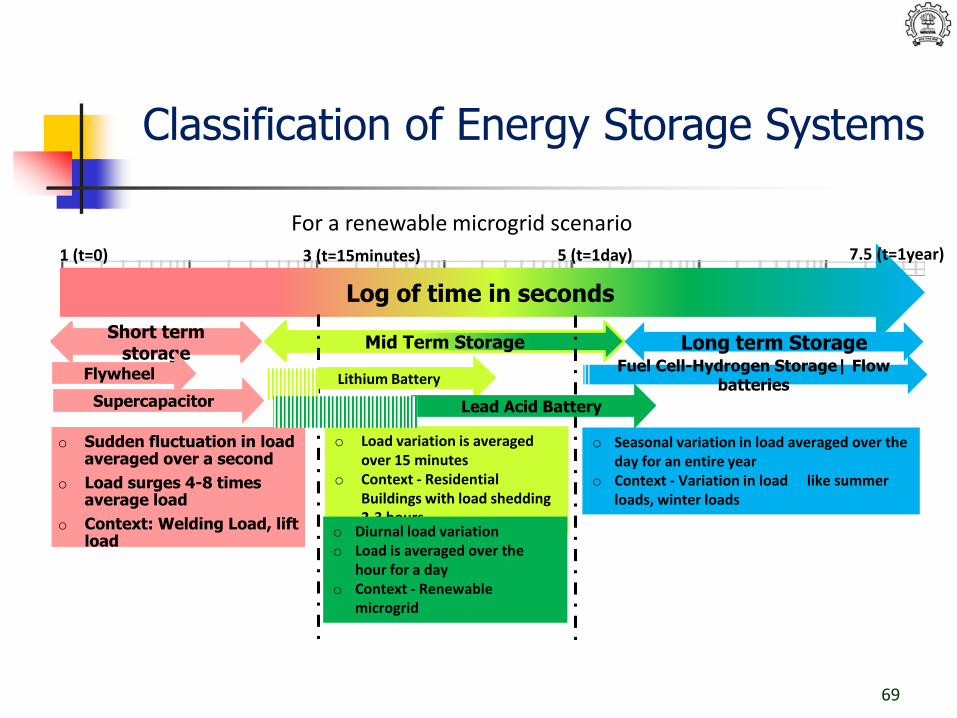
For a renewable microgrid scenario
Log of time in seconds
1 (t=0) 3 (t=15minutes) 5 (t=1day) 7.5 (t=1year)
Short term storage
Mid Term Storage Long term Storage
o Sudden fluctuation in load averaged over a second
o Load surges 4-8 times average load
o Context: Welding Load, lift load
o Load variation is averaged over 15 minutes
o Context - Residential Buildings with load shedding 2-3 hours
o Seasonal variation in load averaged over the day for an entire year
o Context - Variation in load like summer loads, winter loads
o Diurnal load variationo Load is averaged over the
hour for a dayo Context - Renewable
microgrid
Supercapacitor
69
Classification of Energy Storage Systems
Lithium Battery
Lead Acid Battery
FlywheelFuel Cell-Hydrogen Storage| Flow
batteries
70
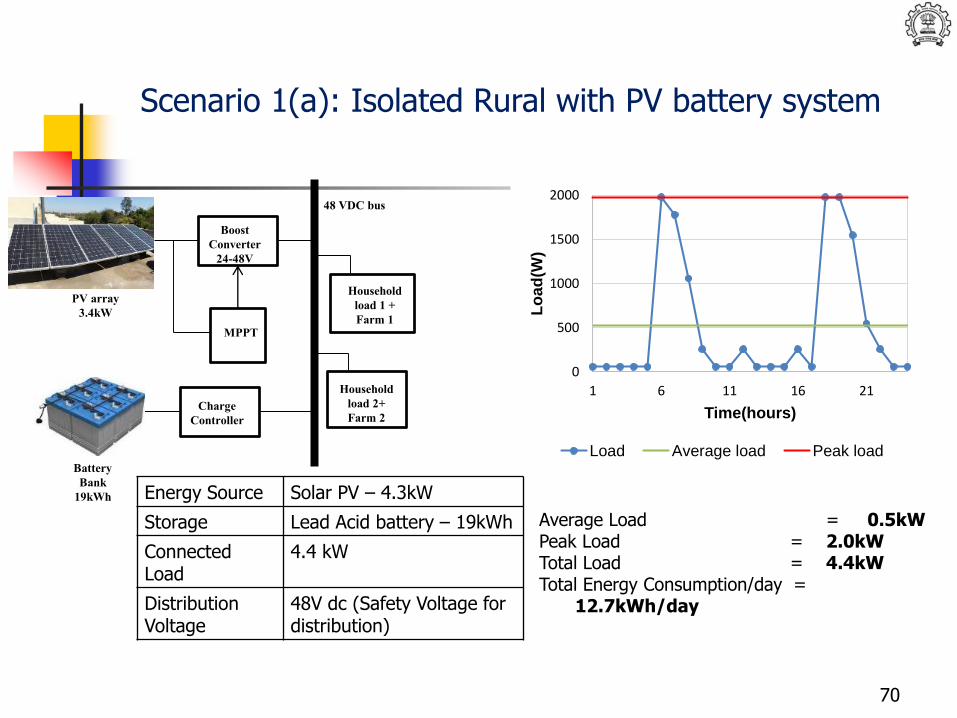
Scenario 1(a): Isolated Rural with PV battery system
Energy Source Solar PV – 4.3kW
Storage Lead Acid battery – 19kWh
Connected Load
4.4 kW
DistributionVoltage
48V dc (Safety Voltage for distribution)
Boost
Converter
24-48V
MPPT
Charge
Controller
Battery
Bank
19kWh
48 VDC bus
Household
load 1 +
Farm 1
Household
load 2+
Farm 2
PV array
3.4kW
0
500
1000
1500
2000
1 6 11 16 21
Lo
ad
(W)
Time(hours)
Load Average load Peak load
Average Load = 0.5kWPeak Load = 2.0kWTotal Load = 4.4kWTotal Energy Consumption/day =
12.7kWh/day
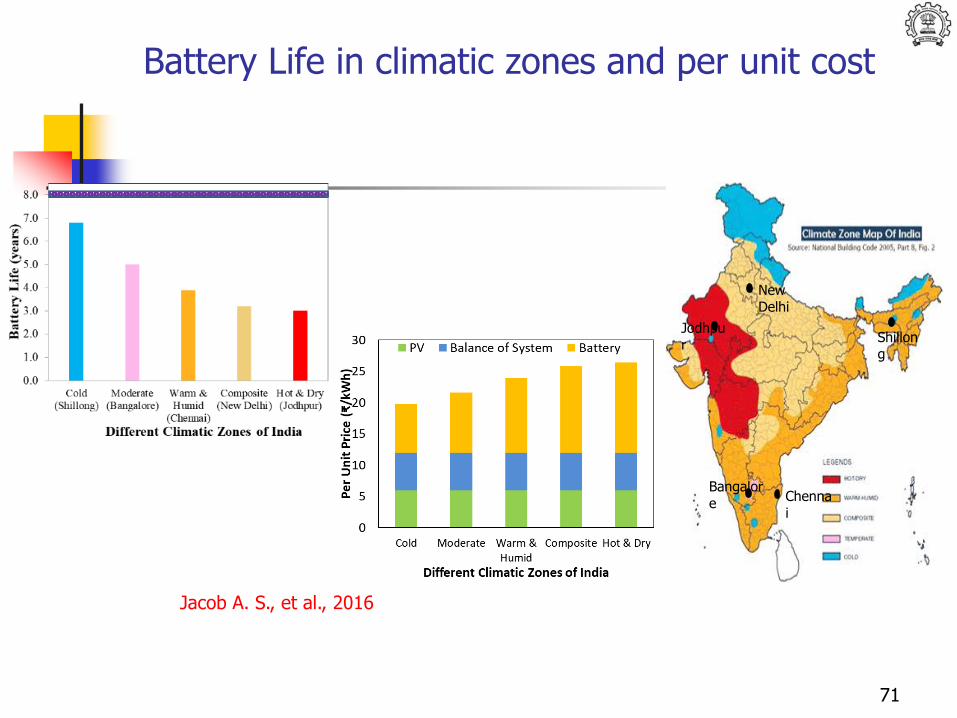
Battery Life in climatic zones and per unit cost
Shillong
Bangalore
Chennai
Jodhpur
New Delhi
Jacob A. S., et al., 2016
71
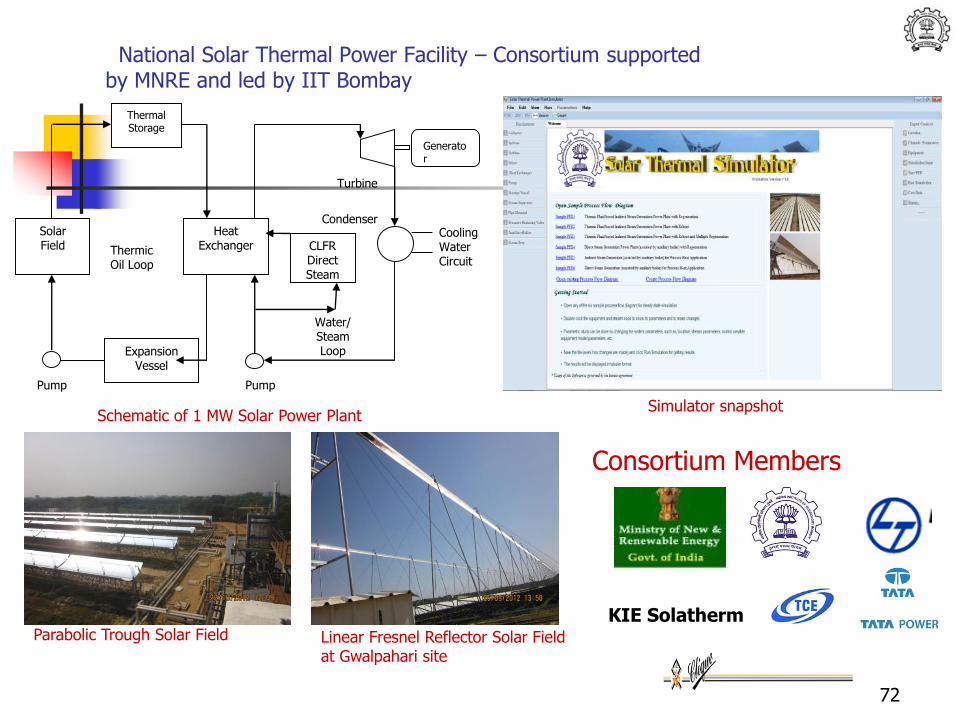
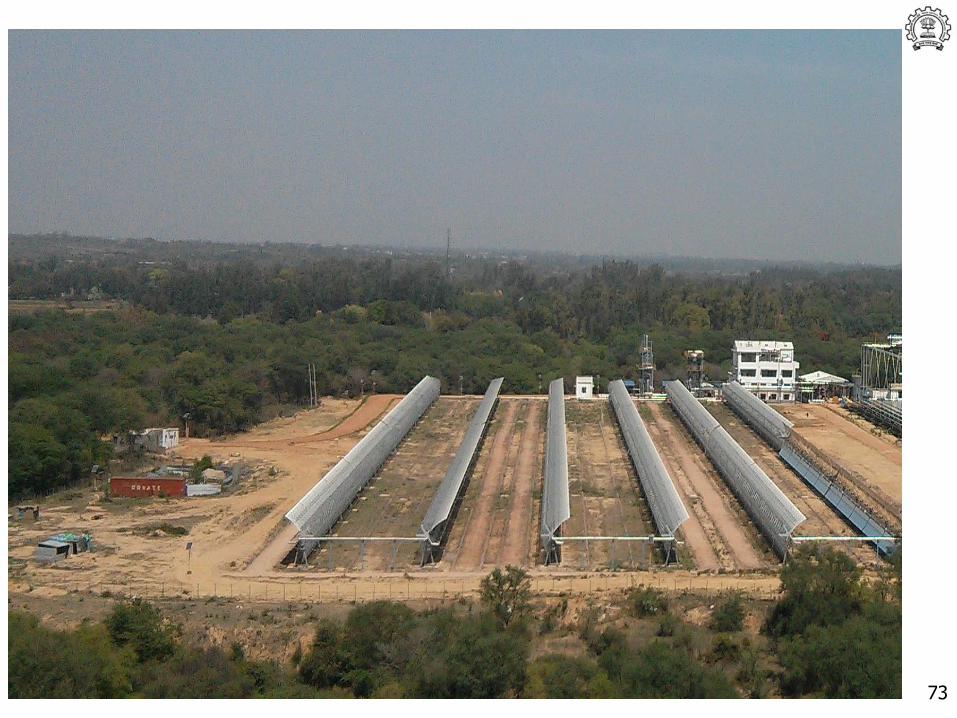
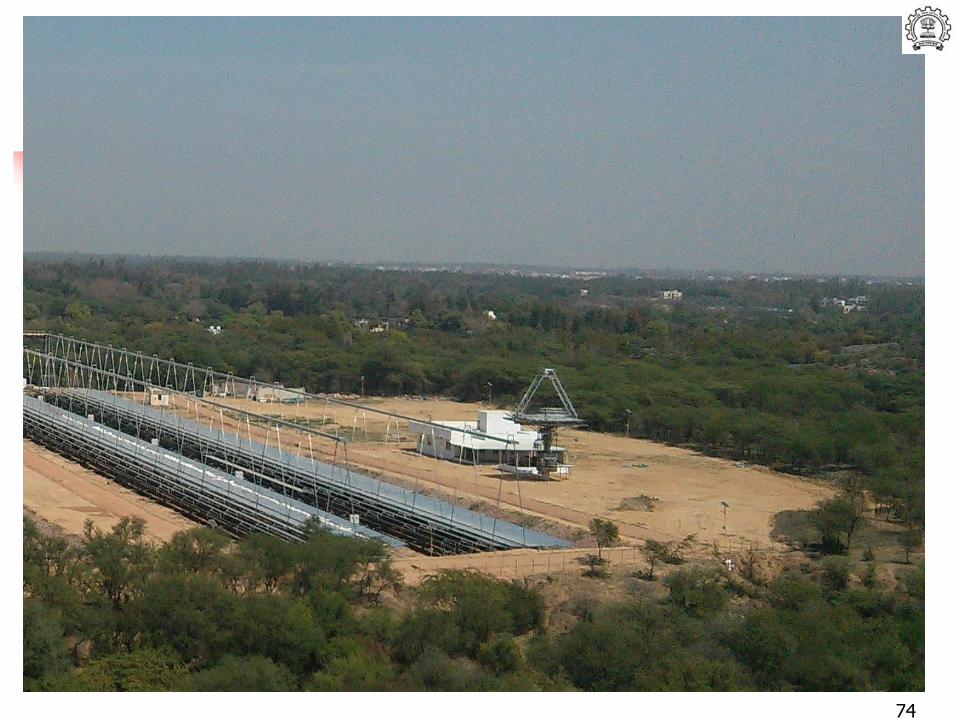
National Solar Thermal Power Facility – Consortium supported by MNRE and led by IIT Bombay
Thermal Storage
Solar Field
Expansion Vessel
Heat Exchanger
Generator
Condenser
Turbine
PumpPump
Cooling Water Circuit
Water/ Steam Loop
ThermicOil Loop
CLFR Direct Steam
Schematic of 1 MW Solar Power PlantSimulator snapshot
Parabolic Trough Solar Field Linear Fresnel Reflector Solar Field at Gwalpahari site
Consortium Members
KIE Solatherm
72
73
74
74
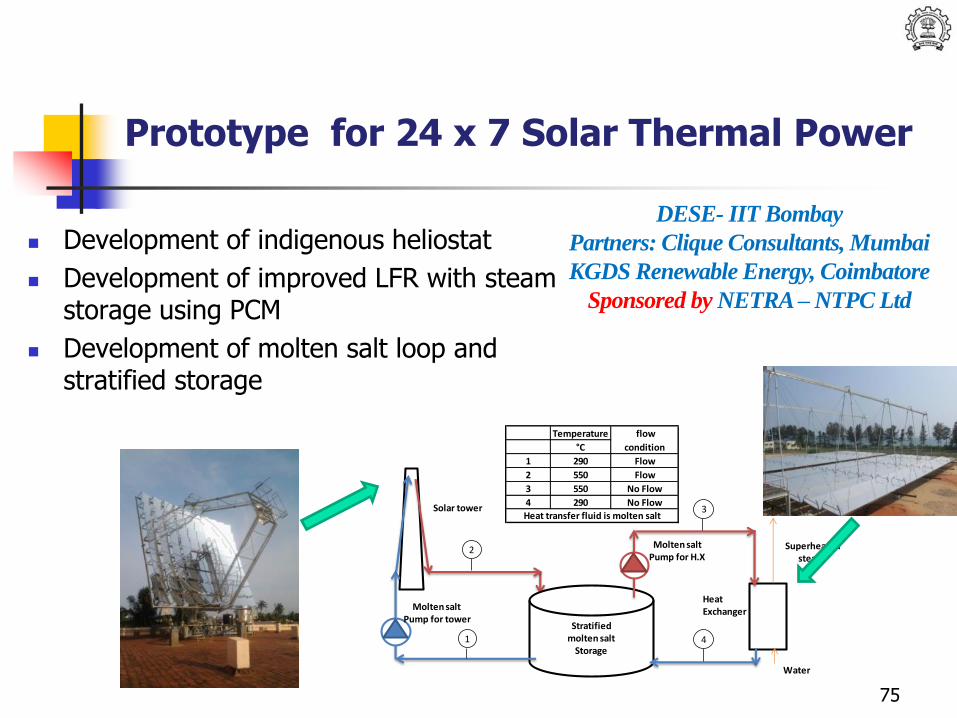
Prototype for 24 x 7 Solar Thermal Power
Development of indigenous heliostat
Development of improved LFR with steam storage using PCM
Development of molten salt loop and stratified storage
75
Temperature
°C
1 290 Flow
2 550 Flow
3 550 No Flow
4 290 No Flow
Heat transfer fluid is molten salt
flow
condition
Heat Exchanger
Stratifiedmolten salt
Storage
Solar tower
1
2
3
4
Molten saltPump for tower
Molten saltPump for H.X
Water
Superheatedsteam
DESE- IIT Bombay
Partners: Clique Consultants, Mumbai
KGDS Renewable Energy, Coimbatore
Sponsored by NETRA –NTPC Ltd
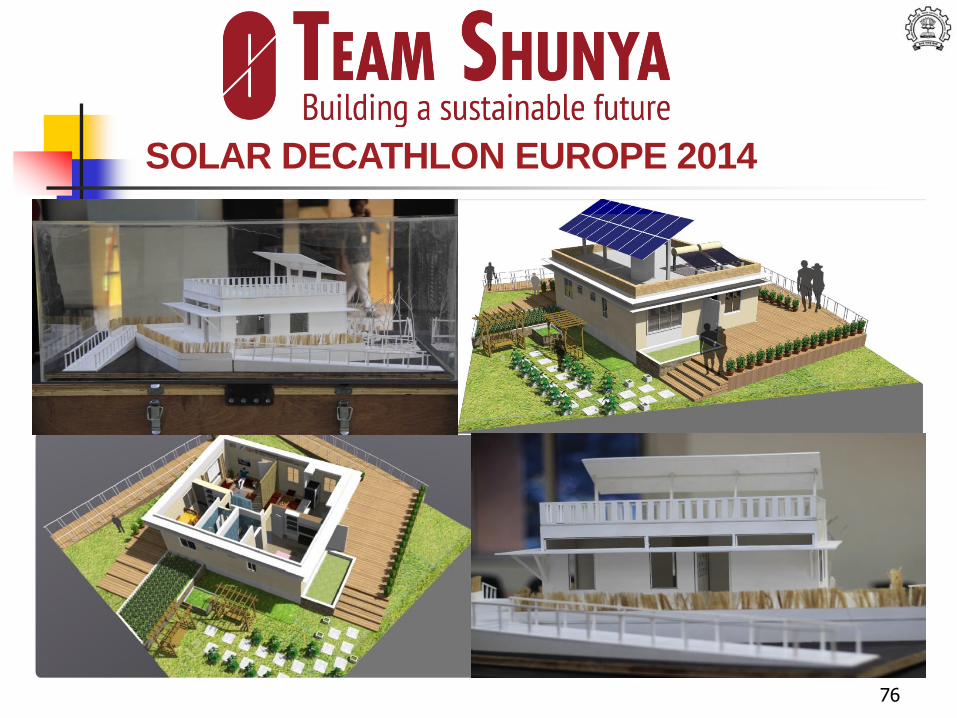
TEAM SHUNYASOLAR DECATHLON EUROPE 2014
76
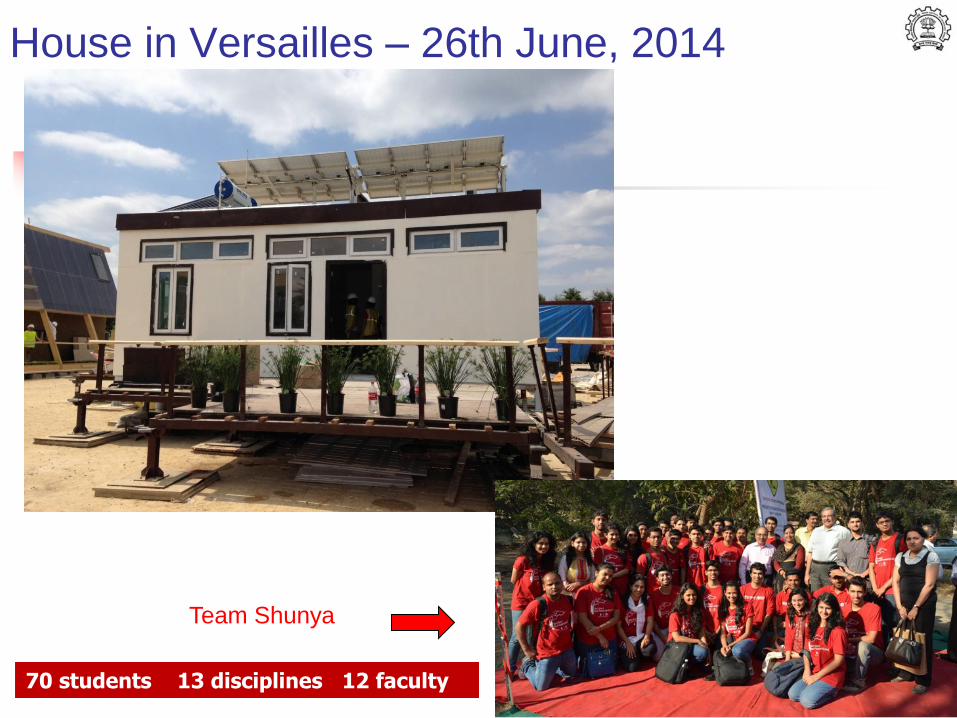
House in Versailles – 26th June, 2014
33
Team Shunya
70 students 13 disciplines 12 faculty
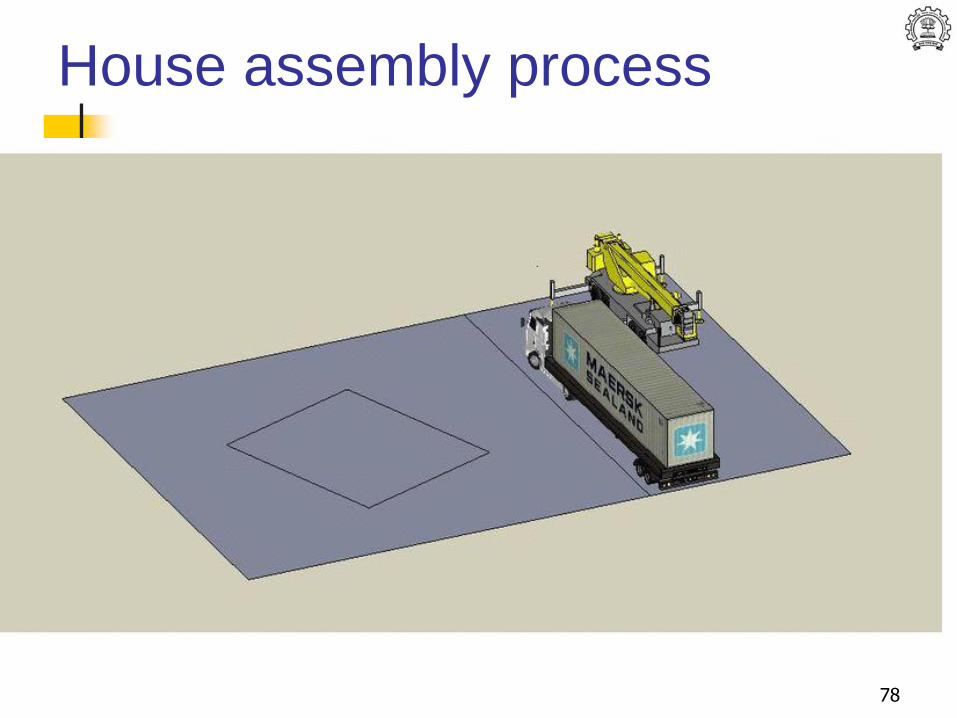
House assembly process
78
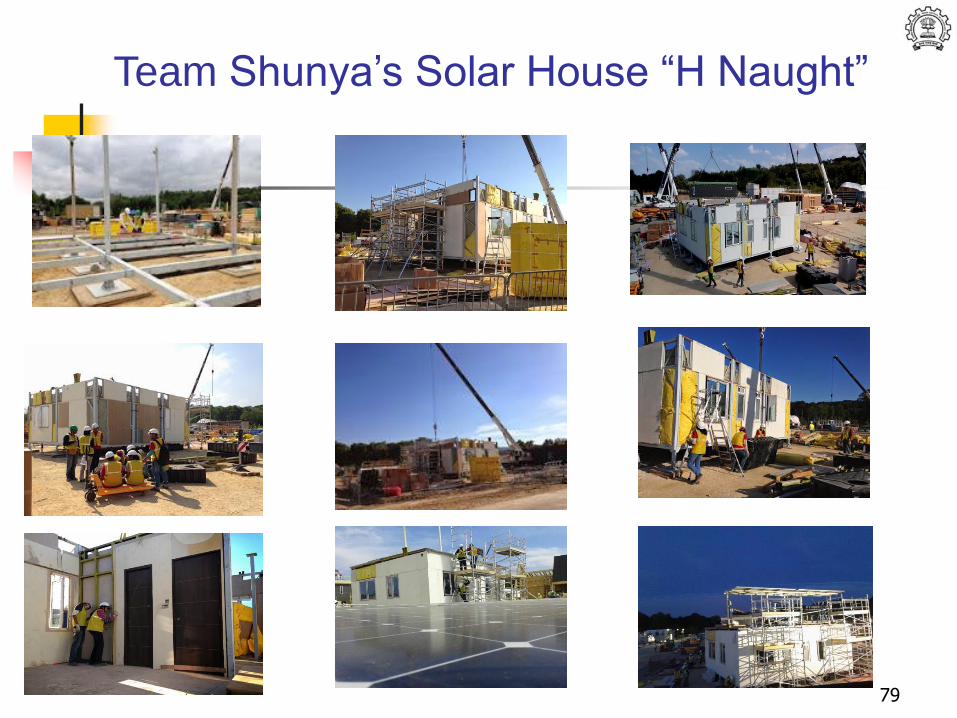
Team Shunya’s Solar House “H Naught”
79
0
50
100
150
200
250
300
350
20
00
20
02
20
04
20
06
20
08
20
10
20
12
20
14
20
16
20
18
20
20
Tota
l In
stal
led
Cap
acit
y o
f So
lar
and
Win
d E
ne
rgy
(GW
)
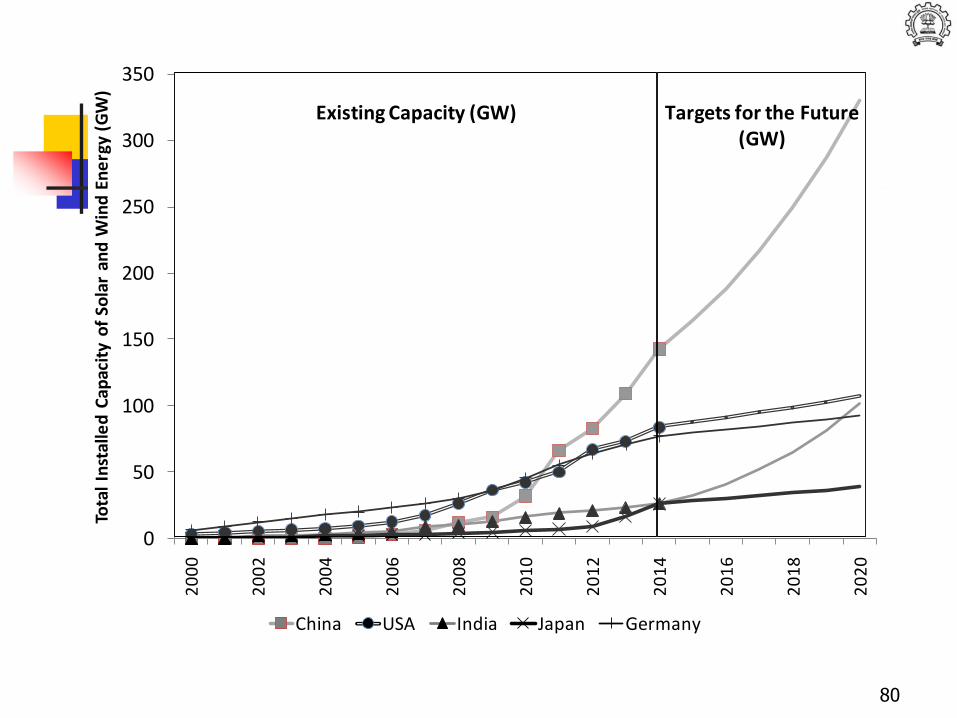
China USA India Japan Germany
Existing Capacity (GW) Targets for the Future (GW)
80
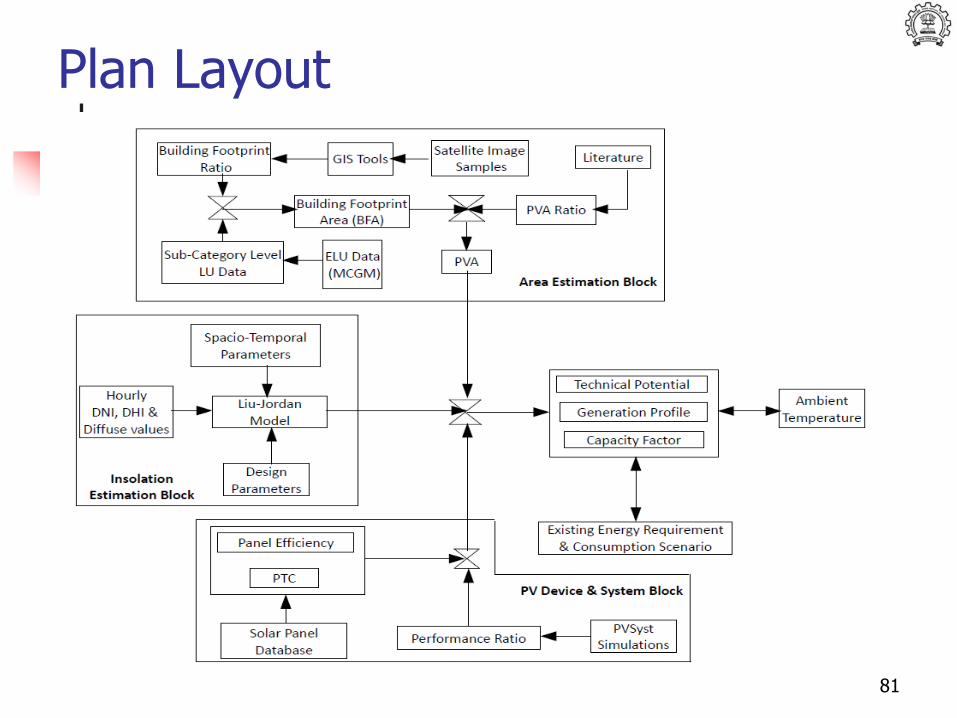
Plan Layout
81

82
A portion of the ELU map of Ward A of MCGM
Corresponding Satellite Imagery for the area from Google Earth
Analyzed in QGIS 1.8.0To determine-Building Footprint Ratios- Usable PV AreasFor Sample Buildings
Source: R. Singh and Banerjee, 2015
0
0.5
1
1.5
2
2.5
0:0
1-
1:0
0
1:0
1-
2:0
0
2:0
1-
3:0
0
3:0
1-
4:0
0
4:0
1-
5:0
0
5:0
1-
6:0
0
6:0
1-
7:0
0
7:0
1-
8:0
0
8:0
1-
9:0
0
9:0
1-1
0:0
0
10:0
1-1
1:0
0
11:0
1-1
2:0
0
12:0
1-1
3:0
0
13:0
1-1
4:0
0
14:0
1-1
5:0
0
15:0
1-1
6:0
0
16:0
1-1
7:0
0
17:0
1-1
8:0
0
18:0
1-1
9:0
0
19:0
1-2
0:0
0
20:0
1-2
1:0
0
21:0
1-2
2:0
0
22:0
1-2
3:0
0
23:0
1-2
4:0
0
MU
s
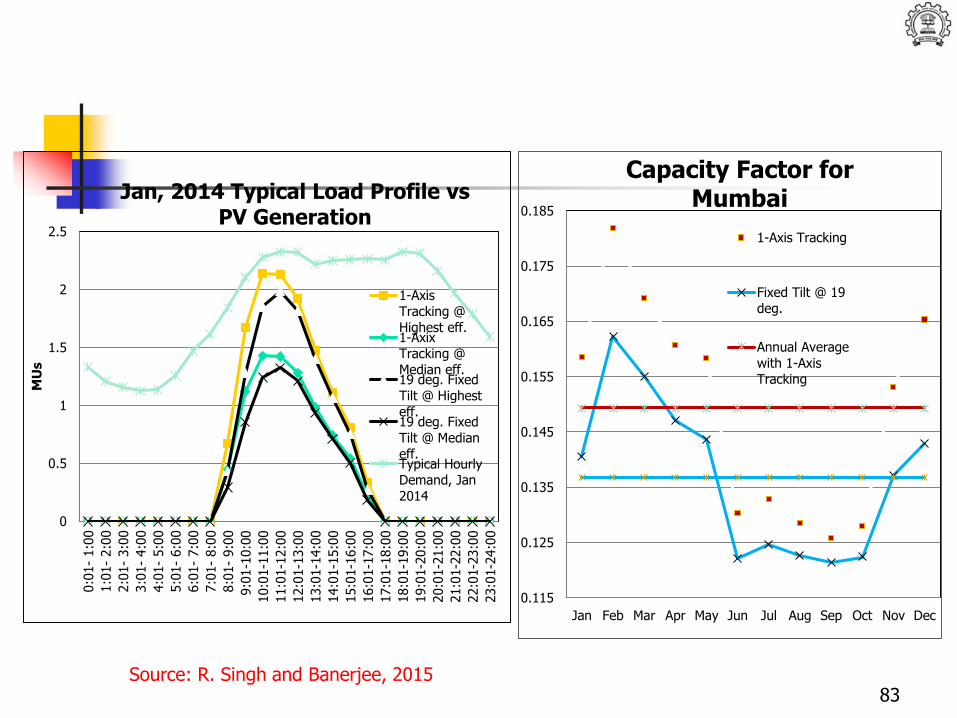
Jan, 2014 Typical Load Profile vsPV Generation
1-AxisTracking @Highest eff.1-AxixTracking @Median eff.19 deg. FixedTilt @ Highesteff.19 deg. FixedTilt @ Medianeff.Typical HourlyDemand, Jan2014
0.115
0.125
0.135
0.145
0.155
0.165
0.175
0.185
Jan Feb Mar Apr May Jun Jul Aug Sep Oct Nov Dec
Capacity Factor for Mumbai
1-Axis Tracking
Fixed Tilt @ 19deg.
Annual Averagewith 1-AxisTracking
Source: R. Singh and Banerjee, 201583
Summing Up
Present energy use pattern – mainly fossil fuel
Climate Change – major driving factor
Renewables – technically feasible, almost cost-effective
Transition – challenge and opportunity
Low Capacity factors- daily , seasonal variability,
Storage costs – problems with high penetration
Need for R&D and innovation
Redesign of products, Next Practices
Designer materials – Nano Technology, Bio-inspired materials
Future industrial growth- zero carbon growth 84
85
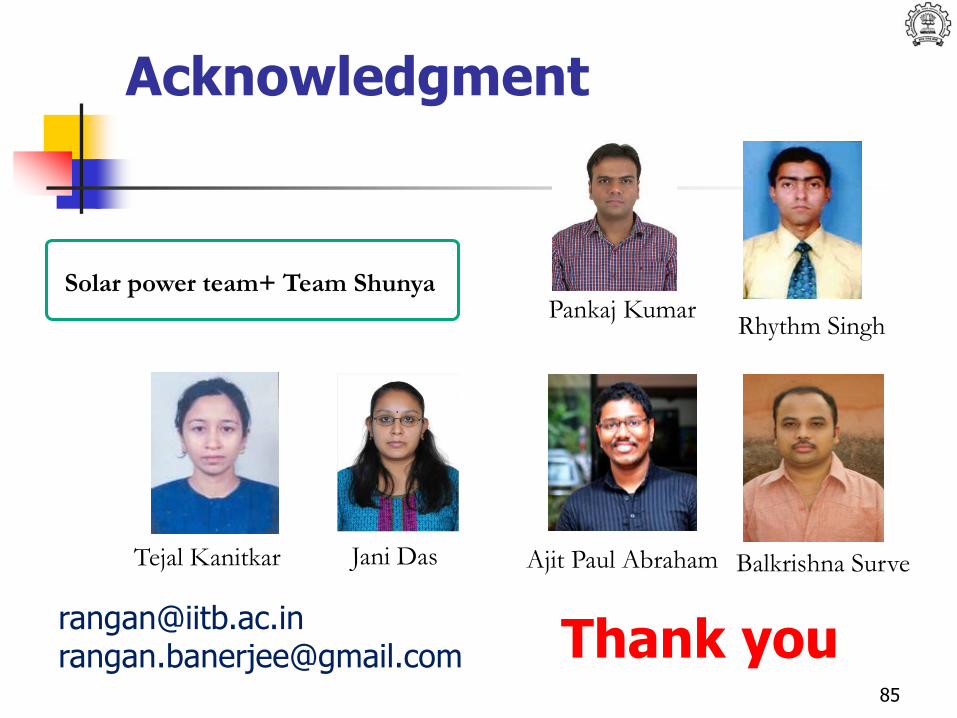
Acknowledgment
Balkrishna SurveTejal Kanitkar
Thank [email protected]@gmail.com
Solar power team+ Team Shunya
Rhythm Singh Pankaj Kumar
Jani Das Ajit Paul Abraham
References IEA, Key World Energy Statistics 2016, http://www.iea.org/statistics/statisticssearch/
GEA, 2012 Chapter 3 : Global Energy Assessment - Toward a Sustainable Future, Cambridge University Press,
Cambridge, UK and New York, NY, USA and the International Institute for Applied Systems Analysis, Laxenburg, Austria.
Banerjee, R., et al., Chapter 8 - Energy End Use: Industry. In Global Energy Assessment - Toward a Sustainable Future,
Cambridge University Press, Cambridge, UK and New York, NY, USA and the International Institute for Applied Systems
Analysis, Laxenburg, Austria, pp. 513-574.
T. Kanitkar et al 2015: Tejal Kanitkar, Banerjee, R. Banerjee and T. Jayaraman, Impact of economic structure on
mitigation targets for developing countries, Volume 26, June 2015, 56–61, June 2015.
Ministry of New and Renewable Energy (MNRE), Government of India, New Delhi, website: www.mnre.gov.in
Ministry of Power, Government of India, http://powermin.nic.in/
R. Singh and Banerjee, 2015: Singh, R., and Banerjee, R., Estimation of rooftop solar photovoltaic potential of a city, Solar
Energy, Vol. 115, 589-602, May 2015.
Rockstrom et al, Nature 2009
http://cdiac.ornl.gov/trends/co2/graphics/lawdome.gif
Bloomberg New Energy Finance, 2016: Global Trends in Renewable Energy Investment 2016.
A.Dave, T.Kanitkar and R.Banerjee Analysing Implications of India's Renewable Energy Targets, 2016 - draft
Renewables, Global Status Report (GSR) 2016: REN21 ‒ the Renewable Energy Policy Network for the 21st Century,
'Renewables 2016: Global Status Report', yearly publication since 2005.
IPCC, 2012: Managing the risks of extreme events and disasters to advance climate change adaption,
https://www.ipcc.ch/pdf/special-reports/srex/SREX_Full_Report.pdf
http://www.indiaenvironmentportal.org.in/files/file/solar%20energy%20in%20India.pdf
http://www.indiatimes.com/news/india/india-is-now-home-to-the-world-s-largest-solar-power-plant-it-s-big-enough-to-
power-150-000-homes-266449.html86
References
Prayas Oct 2016: India’s journey towards 175 GW Renewables by 2022, Ashwin Gambhir et al., Prayas Energy
Group, October 2016. .
https://www.caiso.com/Documents/FlexibleResourcesHelpRenewables_FastFacts.pdf
ESMI, Prayas: Electricity Supply Monitoring initiative, Prayas Energy Group, http://www.watchyourpower.org/,
Minigrids Electricity for all, A Centre for Science and Environment Report, 2016;
http://www.cseindia.org/userfiles/mini-grids.pdf
Jacob A. S., et al., 2016: Jacob, A. S., Banerjee, R., Ghosh, P.C., Modelling and simulation of a PV battery grid
backup system for various climatic zones of India', Proceedings of 43rd IEEE Photovoltaic Specialists
Conference, PVSC 2016; Portland; United States; pp 1807-1812, Article number 7749934, June 5-10, 2016.
http://www.indiaprwire.com/pressrelease/education/20140128287038.htm
http://www.waterhistory.org/histories/barbegal/
http://www.fordendwatermill.co.uk/guide.html
http://www.telosnet.com/wind/early.html
http://energyprofessionalsymposium.com/?p=5693
http://home.cc.umanitoba.ca/~vsmil/graphics/energy/energyconsumption.htm
http://www.trunity.net/the-energy-library/view/article/209627/ Source: C. Cleveland
Grubler 2004: Transitions in Energy Use, Arnulf Grubler, International Institute for Applied Systems Analysis
Laxenburg, Austria.
http://scrippsco2.ucsd.edu/graphics_gallery/mauna_loa_record/mauna_loa_record
https://scripps.ucsd.edu/programs/keelingcurve/ 87