Strengthening disaster risk reduction in Indonesia through Multi-stakeholder Partnership

100% Renewables Cities and Regions Roadmap
Energy Situational and Stakeholder Analysis
Indonesia
ICLEI Indonesia
May 2020
100% Renewables Cities and Regions Roadmap
Energy Situational and Stakeholder
Analysis Indonesia
ICLEI Indonesia
May 2020

renewablesroadmap.iclei.org i Energy Situational and Stakeholder Analysis
Energy Situational and Stakeholder Analysis : Indonesia
The material in this publication is copyrighted. Content from this discussion paper may be used for non-
commercial purposes, provided it is attributed to the source.
ICLEI - Local Government for Sustainability
Jakarta, Indonesia
May 2020
Author:
Muhammad Saladin Islami, ICLEI Indonesia; Emy Aditya, ICLEI Indonesia
Reviewer (in Alphabetical Order):
Ari Mochamad, ICLEI Indonesia; Jan-Albrecht Harrs, ICLEI World Secretariat; Laura Noriega, ICLEI World
Secretariat; Renz Cerillo, ICLEI Southeast Asia; Rohit Sen, ICLEI World Secretariat; Victorino E. Aquitania, ICLEI
Southeast Asia.
Design and Layout:
Dhyanayu L. Almitra, ICLEI Indonesia
Acknowledgement
This report was produced as part of the project 100% of Renewables Cities and Regions Roadmap, or 100%RE
for short, implemented by ICLEI and funded by the International Climate Initiative (IKI). The Federal Ministry
for the Environment, Nature Conservation and Nuclear Safety (BMU) of Germany.
All opinions expressed, as well as omissions and eventual errors are the responsibility of the authors alone.

renewablesroadmap.iclei.org ii Energy Situational and Stakeholder Analysis
Table of Contents
List of Figures ....................................................................................................................................... iv
List of Tables ......................................................................................................................................... v
List of Abbreviations.............................................................................................................................. vi
Introduction ........................................................................................................................................... 1
Organization of Paper ................................................................................................................................... 1
Chapter 1 National Energy Status ............................................................................................................ 3
1.1 Energy Target.......................................................................................................................................... 3
1.1.1 Energy Mix Target ............................................................................................................................ 3
1.1.2 Energy Efficiency Target .................................................................................................................. 3
1.2 Energy Production and Consumption ..................................................................................................... 4
1.2.1 Energy Production ............................................................................................................................ 4
1.2.2 Energy Consumption ........................................................................................................................ 8
1.3 Energy Share in Electricity ..................................................................................................................... 10
1.4 Forecast ................................................................................................................................................ 10
1.4.1 Energy Demand .............................................................................................................................. 10
1.4.2 Electricity Demand ......................................................................................................................... 12
Chapter 2 Renewable Energy Potential and Status.................................................................................. 13
2.1 Geothermal ........................................................................................................................................... 14
2.2 Hydro Energy ........................................................................................................................................ 15
2.3 Ocean Energy ........................................................................................................................................ 16
2.4 Solar Energy .......................................................................................................................................... 16
2.5 Wind Energy .......................................................................................................................................... 18
2.6 Bioenergy .............................................................................................................................................. 19
2.7 Waste Energy ........................................................................................................................................ 19
Chapter 3 Electrification Status ............................................................................................................. 21

renewablesroadmap.iclei.org iii Energy Situational and Stakeholder Analysis
Chapter 4 Energy Governance ............................................................................................................... 23
4.1 Energy Organizational Structure ........................................................................................................... 23
4.2 Energy Legal Framework ...................................................................................................................... 25
4.2.1 Energy in General (Fossil and Renewables) ................................................................................... 25
4.2.2 Energy Efficiency ........................................................................................................................... 28
Chapter 5 National Energy Program ....................................................................................................... 30
Chapter 6 Energy Financing .................................................................................................................. 32
Chapter 7 Energy Situational Analysis ................................................................................................... 34
Chapter 8 Stakeholder Mapping ............................................................................................................ 36
References ........................................................................................................................................... xiii

renewablesroadmap.iclei.org iv Energy Situational and Stakeholder Analysis
List of Figures
Figure 1 Indonesia’s Primary Energy Mix by 2025 and 2050. Source: Government Regulation No.79/2014 [5]. 3
Figure 2 Energy production share in percentage. Source: Ministry of Energy and Mineral Resources 2018 [7] .5
Figure 3 Energy Subsidy in 2009-2016 (in Trillion IDR). Source: Ministry of Finance 2016 [8] .............................6
Figure 4 Coal energy distribution. Source: Patria Energy 2018 [11]. .......................................................................7
Figure 5 Indonesia Natural Gas Reserves. Source: Directorate General of Oil and Gas 2016 [12] .......................7
Figure 6 Energy intensity Indonesia in BOE/Billion IDR. Source: Ministry of Energy and Mineral Resources 2018
[13] ................................................................................................................................................................8
Figure 7 Energy Consumption by Sector in 2018. Source: Ministry of Energy and Mineral Resources 2018 [7].9
Figure 8 Comparison of final energy demand in three scenarios. Source: National Energy Council 2019 [15].
................................................................................................................................................................... 11
Figure 9 Geothermal development from 1983-2018 (in MW). Source: RUPTL 2017-2026 [17] ......................... 15
Figure 10 Mini-Micro hydro Potential per Islands (in MW). Source: RUEN 2017 [2] ........................................... 15
Figure 11 Solar Potential per Islands. Source: World Bank Group 2019 [19]....................................................... 17
Figure 12 Installed Capacity of Solar PV by November 2019. Source: IESR 2019 [20] ....................................... 17
Figure 13 Wind potential per islands (in MW). Source: RUEN 2017 [2] ................................................................ 18
Figure 14 Indonesia’s mean wind power density map. Source: World Bank Group 2020 [21] ........................... 18
Figure 15 Potential of Bioenergy (in MW). Source: Statistics of EBTKE 2016 [22] ............................................. 19
Figure 16 Electrification Ratio. Source: Directorate General of Electricity [14] ................................................... 21
Figure 17 Electrification ratio per provinces. Source: Directorate General of Electricity [14] ......................... 22
Figure 18 Energy organizational structure in Indonesia. Source: Personal Identification 2019 ........................ 23
Figure 19 Energy legal framework in Indonesia. Source: Personal Identification 2019 ..................................... 26
Figure 20 Energy efficiency legal framework in Indonesia. Source: Personal Identification 2019 .................... 28
Figure 21 Progress of 35 GW program. Source: RUPTL 2019-2028 [3] ............................................................... 30
Figure 22 Financing Scheme of Energy in Indonesia. Source: Personal Identification, 2019 ............................ 32
Figure 23 Stakeholder Mapping for the 100% Renewable Cities and Regions Roadmap Network. Source:
Personal Identification, 2019................................................................................................................... 37

renewablesroadmap.iclei.org v Energy Situational and Stakeholder Analysis
List of Tables
Table 1 Energy Efficiency Target by 2025 and 2050. Source: Government Regulation No.22/2017 [2]. .............4
Table 2 Renewable energy potential in Indonesia. Source: RUEN 2017 [2] and Directorate General of Electricity
2019 [14] ...................................................................................................................................................... 13
Table 3 Provinces with the largest renewable energy potential in 2019. Source: IESR 2019 [16] ..................... 13
Table 4 Geothermal potential per islands. Source: RUEN 2017 [2] and Directorate General of Electricity 2019
[14] ................................................................................................................................................................ 14
Table 5 Waste volume in large cities of Indonesia. Source: Ministry of Energy and Mineral Resources, 2018 20
Table 6 List of Ministerial Regulation on Renewable Energy. Source: Personal Identification 2019 ................ 27
Table 7 List of Ministerial Regulation on Energy Conservation. Source: Personal Identification 2019 ............ 29
Table 8 PLN’s renewable electricity provision plan 2019-2028. Source: RUPTL 2019-2028 [3] ........................ 31
Table 9 Detailed Stakeholder Mapping Framework to the Project. Source: Personal Identification, 2019 ...... 37

renewablesroadmap.iclei.org vi Energy Situational and Stakeholder Analysis
List of Abbreviations
ADB
BAPPENAS
BPS
CNG
DEN
DMO
EE
ER
FiT
GHG
GoI
GR
IEA
IPP
KEN
LSP
MEMR
MoF
MoI
MoSOE
MoT
NDC
NGO
NTT
Pertamina
PLD
PLN
PPA
Asian Development Bank
National Development Planning Agency
National Statistics Agency
Compressed Natural Gas
National Energy Council
Domestic Market Obligation
Energy Efficiency
Electrification Ratio
Feed-in-tariff
Greenhouse Gases
Government of Indonesia
Government Regulation
International Energy Agency
Independent Power Producers
National Energy Policy
Professional Certification Body
Ministry of Energy and Mineral Resources
Ministry of Finance
Ministry of Industry
Ministry of State-Owned Enterprises
Ministry of Transportation
Nationally Determined Contribution
Non-Government Organization
East Nusa Tenggara
National Oil Company
Electricity Management Committee
State-Owned Electricity Company
Power Purchase Agreement

renewablesroadmap.iclei.org vii Energy Situational and Stakeholder Analysis
PPU
RE
RIKEN
RUED
RUEN
RUKD
RUKN
RUPTL
WNT
Private Power Utility
Renewable Energy
National Energy Conservation Masterplan
Regional Energy Plan
National Energy Plan
Regional Electricity Plan
National Electricity Plan
PLN’s Electricity Provision Plan
West Nusa Tenggara

renewablesroadmap.iclei.org 1 Energy Situational and Stakeholder Analysis
Introduction
In support of the Paris agreement, Indonesia has announced its commitment to achieving a 29%
reduction in its national greenhouse gas (GHG) emissions, and even reaching 41% with international support
by 2030 [1]. Indonesia’s Nationally Determined Contribution (NDC) has identified five main sectors responsible
for the country’s GHG emissions: energy (including transport), industrial processes and product use (IPPU),
agriculture, land-use, land-use change, and forestry (LULUCF), and waste. The biggest GHG emitter sector in
Indonesia is LULUCF, representing 61% of the national GHG emissions in 2010. The Government of Indonesia
(GoI) has set to reduce its share to 37% by 2030 [1].
Following the LULUCF sector is the energy sector, which represents 29% of the 2010 emissions. Considering
the archipelago’s rapid population and urban growth, the energy sector proves to be a critical sector to focus
on considering its emissions, which are projected to increase dramatically. Besides, the energy sector
contributes up to 11% of the 29% national GHG emission reduction target [1]. The energy sector includes
electricity, transportation, households, and industry. The country is also committed to reaching a share of 23%
of renewable energy (RE) in its energy mix by 2025 [2].
Achieving the target is challenging for the GoI as it faces an energy trilemma: energy security, energy equity,
and environmental sustainability. GoI has to put efforts not only on the 23% of RE target (environmental
sustainability) but also on the electrification ratio (ER) target of 100% by 2024 for all Indonesians to have
access to energy/electricity (energy equity) [2]. Moreover, GoI is attempting to strengthen its energy security
by reducing its dependence on imported oil and harnessing its renewable, clean, and indigenous resources.
According to the International Energy Agency (IEA) [3], the coronavirus (Covid-19) has sent the biggest
shockwaves through societies around the world. One sector that is also severely affected by the crisis is the
energy sector. While energy security remains a cornerstone priority, the implications of the pandemic include
the decline in mobility demand, electricity demand, and energy investment. Additionally, clean energy
transitions must be at the center of economic recovery and stimulus plans [3], as they present strong
opportunities to cut fossil-fuel subsidies, to implement renewable energy and energy efficiency programs, and
to be an avenue to create job opportunities in a new green economy.
Organization of Paper This paper discusses the energy situation and energy stakeholders in Indonesia with a focus on the
current and forecast energy status. The first chapter will present the national energy status and will elaborate
in detail on the identification of current and forecast energy looked from the energy consumption and

renewablesroadmap.iclei.org 2 Energy Situational and Stakeholder Analysis
production, energy target of the national energy mix (fossil and renewable energy), energy conservation, and
electrification ratio. Energy and electricity demand will be discussed at the end of this chapter.
The second chapter focuses on the strong potentials for renewable energy in Indonesia. In this chapter,
renewable energy potential will only cover wind, solar, tidal, hydro, and geothermal.
The next chapter discusses the electrification status in Indonesia. Indonesia is struggling to provide universal
electricity access to all people as it is a basic right stipulated in the constitution. This chapter will show the
disparity between the western and eastern parts of Indonesia.
The fourth chapter brings energy governance as a central discussion. This chapter seeks to identify multi-level
governmental arrangements in Indonesia’s energy sector. This also displays regulations regulating energy,
including energy conservation. This chapter is essential to understand how the energy sector in Indonesia is
arranged and structured.
The last four chapters will show the identification of programs that have been conducted and still under
construction to achieve energy and electricity targets, such as 35-GW electricity from fossil fuel [4, 5] and 23%
renewable energy in the energy mix [2]. Energy financing schemes, situational analysis, and stakeholder
mapping are presented in the last three chapters in this paper.

renewablesroadmap.iclei.org 3 Energy Situational and Stakeholder Analysis
Chapter 1 National Energy Status
This chapter discusses Indonesia’s current energy status, including its energy targets, energy
production, and consumption concerns, energy share in electricity and energy forecast.
1.1 Energy Target
The main targets of energy in Indonesia are (1) to increase the national energy independence by
increasing the production for domestic use and reducing energy imports, (2) to improve the universal access
to energy through the electrification targets, and (3) to ensure an optimal, integrated and sustainable energy
management, which can be reached through renewable energy and energy efficiency [2, 6].
1.1.1 Energy Mix Target
The Government of Indonesia stipulated in its National Energy Policy (KEN) in 2014 to set out a target
of New and Renewable Energy (NRE) in the primary energy mix to 23% (92 Mtoe) by 2025 and 31% (313.72
Mtoe) by 2050 by minimizing the use of oil and coal [2, 6]. The renewable energy sources mentioned in KEN
includes hydro, solar, wind, geothermal, tidal, and biomass. Meanwhile, New Energy includes hydrogen,
nuclear, coal bed methane (CBM), liquefied coal, and gasified coal energy. Concerning the fossil fuel in the
primary energy mix, the oil will have a significant decline at least to 25%, while coal share will increase to 30%
by 2025 [6]. Gas follows with the target of 22% in 2025 [6]. Hence, fossil fuel still dominates the primary energy
mix share with a total of 77%.
Figure 1 Indonesia’s Primary Energy Mix by 2025 and 2050. Source: Government Regulation No.79/2014 [6].
1.1.2 Energy Efficiency Target
The National Energy Policy (KEN), the National Energy Plan (RUEN) and the country’s NDCs stipulated
on the GR 79/2014 and the energy sector, respectively, target to (1) reduce energy intensity by 1% per year
until 2025, (2) reach energy elasticity of >1 by 2025 and (3) to save energy final to 17.4 % by 2025 and 38.9%

renewablesroadmap.iclei.org 4 Energy Situational and Stakeholder Analysis
by 2050 [2]. The efforts to achieve final energy savings are split between the industry sector (17% of savings),
the transport sector (20%), and the commercial sector and households (15%) [7]. Efforts are also to be made
in the energy transformation, aiming to save 0.5% of energy in electricity production, and 0.25% in distribution,
transmission, and refineries [7].
Table 1 Energy Efficiency Target by 2025 and 2050. Source: Government Regulation No.22/2017 [2].
Final Energy Demand 2015 2025 2030 2050
BAU Scenario 152.8 Mtoe 300.7 Mtoe 397.1 Mtoe 1049.1 Mtoe
RUEN Scenario 148.0 Mtoe 248.4 Mtoe 310.0 Mtoe 641.5 Mtoe
Energy Efficiency Target 3.1% 17.4% 21.9% 38.9%
To achieve the stated energy conservation targets, the Government of Indonesia has prepared several national
programs [7]. Firstly, GoI will utilize energy management targeting the company with the amount of 6,000
Toe/year. To support this program, the GoI plans to provide coaching and capacity-building support and apply
the SNI ISO 50001 on Energy Management System in the industrial sector. Secondly, GoI will employ the
Minimum Energy Performance Standards (MEPS) and energy efficiency labeling. Thirdly, the GoI will apply the
Standard Competence for managers and energy auditors to be provided through a series of capacity-building
activities to achieve the standard competency issued by LSP (Profession Certification Institute). Fourthly, GoI
will carry out an energy efficiency program in government facilities supported through the program of capacity
building for the civil servant as well as the development of an energy monitoring system. Fifthly, GoI will
strengthen the monitoring process on the MPES to ensure that the implementation will be conducted as
expected. Sixthly, GoI understands that awareness plays an important role in the success of the programs.
Therefore, the GoI plans to carry out seminars, workshops, and campaigns to increase people’s awareness of
energy efficiency issues. the GoI will improve the existing regulation on energy conservation to support all
energy conservation programs.
1.2 Energy Production and Consumption
1.2.1 Energy Production
Understanding the trends of energy production in a country is essential when working on GHG
emission reduction, especially when the country’s energy mix is mainly composed of fossil fuel. Historically,
Indonesia’s energy production remains strongly dominated by fossil fuel sources. Figure 2 shows a slightly
changing share trend of sources utilization from 2008 to 2018. Nevertheless, fossil fuels still dominated with
a total share of 91.45% in 2018 [8]. The steady increase is shown by renewable energy share and coal, while
there is a decrease in oil and natural gas. Oil has experienced a declining trend from 48.63% in 2008 to 38.81%
in 2018 [8]. This declining trend is also followed by natural gas share which reduced by 5.41% to 19.67% in
2018 [8]. The remaining sources, which are coal and renewable energy, went through a rise of 10.05% and
3.18% respectively in 2018 [8].

renewablesroadmap.iclei.org 5 Energy Situational and Stakeholder Analysis
Figure 2 Energy production share in percentage. Source: Ministry of Energy and Mineral Resources 2018 [8]
1.2.1.1 Oil Energy
Since the discovery of resources in Sumatra at the end of the 19th century, oil has been one of the
main fuels in energy consumption and had been exported in Indonesia. Based on the idea that oil export
revenues should benefit the people, the oil sector has been subsidized since 1967, representing the biggest
share of the state budget expenditure in 2014 of 341.8 trillion IDR compared to the non-energy sector of 50.2
trillion IDR (Figure 3) [9].
The decrease of oil reserves and the growing need to meet local energy demands are key factors to Indonesia’s
oil importation. The country was an oil exporter before 2004 and becomes a net oil importer as of the year.
Despite this shift in the oil resources, the subsidies on oil were not questioned at that time, prioritizing the
people’s right to have access to energy. It is acknowledged that importing oil is expensive and creates a strong
dependency on the international market and prices. Also, given Indonesia’s topography, importing oil to
isolated regions of the country increases the cost of fuel transportation significantly [10].
With the recent increase in oil prices, Indonesia tends to shift toward energy independence by supporting
investments in alternative fuel sources. These efforts started since 2014 when transport and electricity
subsidies have been gradually cut off [9]. However, GoI still promotes oil exploration and exploitation by giving
tax incentives and preferential direct loans to companies willing to do it. Indeed, at the current exploitation
rate, MEMR predicts that the 3.69 billion barrels of oil in Indonesia will be consumed in the next 23 years if no
other sources are explored [11].

renewablesroadmap.iclei.org 6 Energy Situational and Stakeholder Analysis
Figure 3 Energy Subsidy in 2009-2016 (in Trillion IDR). Source: Ministry of Finance 2016 [9]
1.2.1.2 Coal Energy
The high share of coal in the energy mix can be explained by the considerable resources of the country
(Figure 4). At the current rate, the country still has enough coal to last for the next 146 years (120.5 billion tons
according to MEMR) [11]. This abundant resource makes Indonesia one of the biggest coal exporters in Asia,
with coal mining representing up to 2.4% of the country’s GDP in 2017 [5]. Apart from exportation revenues,
coal is one of the main energy fuels and will remain important in the years to come. This is because coal fuel
is economic, available, and easy to extract and to transport. Moreover, coal fuel has been supported with a
well-established technology which makes the power plants quick to assemble and less risky to invest in.
Indonesia was known as one of the largest coal exporters in the world after Australia. Nevertheless, the
decrease in coal prices in the international markets pushes the country to reduce its exports and focus to
satisfy national demand instead. It is estimated that coal will remain the most reliable fossil fuel source due
to its inexpensive price. Moreover, it is also the most easily implementable fuel today in Indonesia to help
reach the electrification ratio targets more quickly and independently from the international oil market.
1.2.1.3 Natural Gas Energy
The natural gas share remains important in the national energy mix and is expected to grow in the next
years. Indeed, natural gas is perceived as the best substitute for oil in the shortfall since Indonesia has large
gas reserves with 101.22 trillion cubic feet of gas. This number signifies that it is sufficient to last 59 years at
the current rate according to the MEMR (Figure 5) [11].

renewablesroadmap.iclei.org 7 Energy Situational and Stakeholder Analysis
Figure 4 Coal energy distribution. Source: Adapted from Patria Energy 2018 [12].
Figure 5 Indonesia Natural Gas Reserves. Source: Adapted from Directorate General of Oil and Gas 2016 [13]
Unlike oil, the price of gas energy remains stable. Natural gas also has the advantage of emitting half less GHG
emissions than oil and coal. This can, therefore, contribute to reaching the GHG emission reduction target.
However, the expansion of the natural gas sector will require support from the state through incentives to
encourage investment on behalf of the private sector. The incentive holds a crucial role due to the costly
infrastructure projects. The support to the field has already been shown by the state and SKK Migas, which is
the Special Task Force for upstream oil and gas business activities, with the development of various projects
to increase the national oil and gas production [10].
renewablesroadmap.iclei.org 8 Energy Situational and Stakeholder Analysis
1.2.1.4 Renewable Energy
Indonesia today must face increasing demand and therefore finds itself in need to increase the global
energy capacity of the country to meet the demand. In addition, this is also to ensure energy security by
creating sufficient energy stock. The diversification of energy sources through renewable energy is then a way
to ensure energy security by not relying merely on one or imported energy, which is the path Indonesia is aiming
to take today.
In 2018, the renewable energy share of 8.55% remains low compared to fossil fuel shares in the national energy
mix [8]. Hydropower, the oldest renewable energy used in Indonesia, represents the highest proportion with
2.74% out of 8.55%, followed by biofuel and geothermal with 1.94% and 1.78%, respectively [8]. Solar (0.02%)
and wind energy (0.03%) together account for 0.05% out of 8.55% [8].
1.2.2 Energy Consumption
Energy consumption will be described into three sub-sections which are energy intensity that explains the
efficiency of energy use in Indonesia, energy consumption per sector, and energy consumption per source.
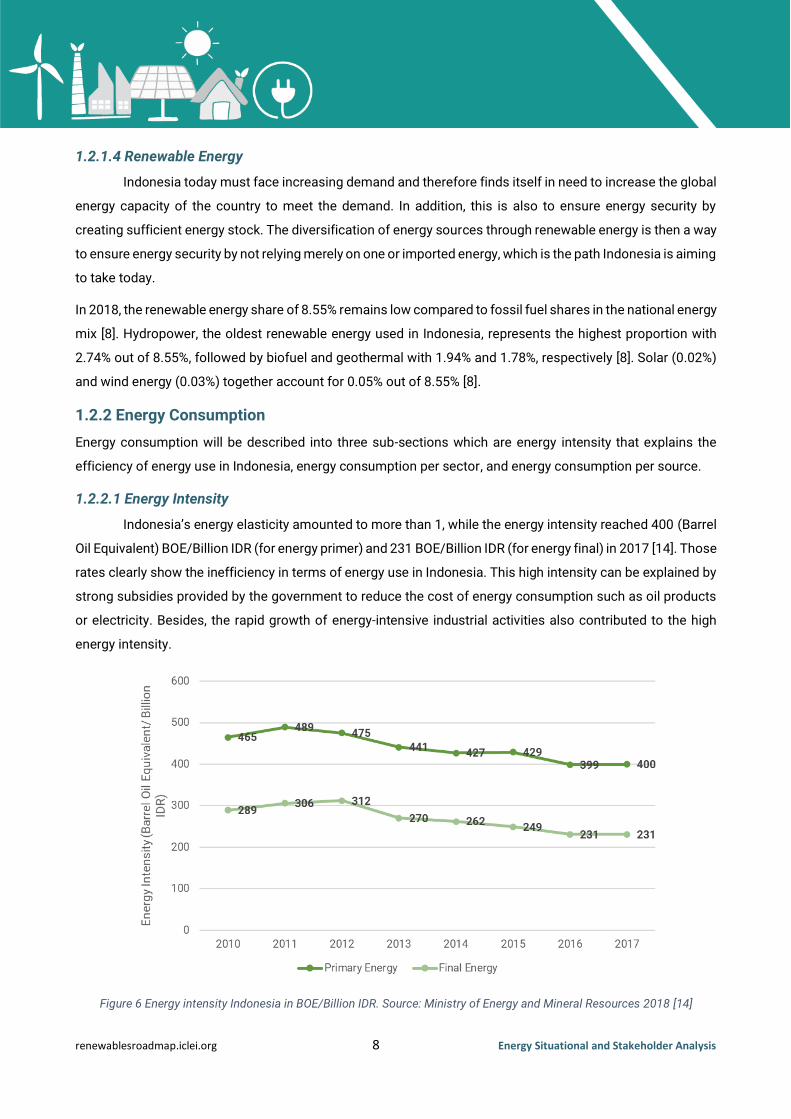
1.2.2.1 Energy Intensity
Indonesia’s energy elasticity amounted to more than 1, while the energy intensity reached 400 (Barrel
Oil Equivalent) BOE/Billion IDR (for energy primer) and 231 BOE/Billion IDR (for energy final) in 2017 [14]. Those
rates clearly show the inefficiency in terms of energy use in Indonesia. This high intensity can be explained by
strong subsidies provided by the government to reduce the cost of energy consumption such as oil products
or electricity. Besides, the rapid growth of energy-intensive industrial activities also contributed to the high
energy intensity.
Figure 6 Energy intensity Indonesia in BOE/Billion IDR. Source: Ministry of Energy and Mineral Resources 2018 [14]

renewablesroadmap.iclei.org 9 Energy Situational and Stakeholder Analysis
However, looking at the historical trend from 2010, it shows progress in terms of energy efficiency. For energy
final, the declining trend is identified through a gradual decrease started in 2012 to 2017 by 81 BOE/Billion IDR
[14]. This signifies a gradual decline by 16.2 BOE/Billion IDR per year. Concerning the primary energy, the trend
shows the same declining pattern started one year earlier than that of the energy final. Figure 6 shows that the
energy intensity of the primary energy reduced by 89 BOE/Billion IDR from 2011 to 2017 or equivalent to 14.83
BOE/Billion IDR per year.
1.2.2.2 Energy Consumption per Sector
In 2018, Indonesia consumed 936.33 Million BOE, mainly shared between the industrial sector
(35.72%) and the transportation (41.80%) sectors [8]. Household consumption is at 16.15% of the energy
consumption, followed by the commercial sector which only consumes 4.61%. (Figure 7) [8].
the transportation sector represents the biggest share of the final energy consumption with 41.80%. The sector
can be divided into two main categories, namely passengers and freight. In terms of sources, the final energy
demand in the transportation sector is met by 96% with oil fuel, 4% with New and Renewable Energy (NRE)
(mostly with biodiesel), 0.10% of gas in big cities, and only 0.04% by electricity with the use of trains [8]. Efforts
have been made to reduce the share of oil in the energy sources by increasing the share of biodiesel in diesel
up to 30% and bioethanol in gasoline up to 20% by 2025 [13].
The industry sector accounts for the second-largest energy consumption. Industrial energy demands include
process heating and cooling, and machine drives. Regulations aim to increase the use of biomass by 2050 as
well as an increase in the use of gas and biogas. As required in Presidential Regulation no. 40/2016 on gas
price, some sectors can see their gas price reduced, depending on various criteria. New and Renewable energy
is limited to biodiesel and biomass in the industry sector to replace other heating fuels and oil.
Figure 7 Energy Consumption by Sector in 2018. Source: Ministry of Energy and Mineral Resources 2018 [8].

renewablesroadmap.iclei.org 10 Energy Situational and Stakeholder Analysis
The third is the household sector which represents a share of 16.15% in the final energy consumption [8].
Consumption is mainly used for cooking, lighting, air conditioning, and various electronic devices. The main
sources of energy to meet the final energy demand in households are electricity (49%) and LPG (47%), while
the rest is kerosene [8]. There are plans to increase the use of gas in the household sector, as one of the targets
for 2015 was to reach an 85% household access to gas.
The last sector with the lowest share of energy consumption is the commercial sector with 4.61% of the total
energy share [8]. This sector is often linked to the household sector since it calculates the consumption inside
commercial buildings, such as lighting and AC.
1.2.2.3 Energy Consumption per Source
In terms of the final energy consumption by sources, fossil fuel still dominated in 2018 with a total of
63.7% or equivalent to 597.60 Million BOE [8]. The oil contributed to 35.9% of the total with the domination of
use in the transport sector [14]. The electricity and the coal contributed to 16.8% and 10.7% of the total final
consumption respectively [8]. This is followed by natural gas and LPG with a share of 10.2% and 6.9%,
respectively in 2018 [8].
1.3 Energy Share in Electricity
The electricity production sector now represents a share of 75% in the contribution to the GHG
emissions reduction target which makes it essential when working on the energy sector. The installed power
plant capacity in Indonesia was 64.9 GW (2018), with the biggest share belonging to the state-owned company
PLN (63%), followed by the Independent Power Producers (23%), while the rest belonging to the private power
utilities and non-fossil operating licenses [15].
The electricity sector in Indonesia relies strongly on fossil fuels (84.96%), and specifically on the local coal
production, which represents 48.6% of the power generation mix [15]. The majority of share with coal as the
main source for electricity is in Java Island. The rest of 15.04% comes from renewable energy which includes
8.27% from hydro, 3% from geothermal, 2.71% from biomass, and the remaining coming from solar, biogas,
wind, and waste [15].
1.4 Forecast
1.4.1 Energy Demand
According to National Energy Council (2019) [16], Indonesia’s energy final will be assumed to have
three major scenarios, which are (1) the Business as Usual (BAU), (2) the Sustainable Development (PB)
Scenario, and (3) Low Carbon (RK) Scenario (Figure 8).

renewablesroadmap.iclei.org 11 Energy Situational and Stakeholder Analysis
Figure 8 Comparison of final energy demand in three scenarios. Source: National Energy Council 2019 [16].
The energy demand will significantly increase to 170.8 and 548.8 Mtoe in 2025 and 2050, respectively, under
BAU [16]. This means there will be a rise of 56 Mtoe compared to the energy final rate in 2018 [16]. The
significant rise is dominated by the growing industrial and transportation sectors which will reach about 231
Mtoe and 140 Mtoe respectively in 2050 [16]. Pertaining to household and commercial sectors, it is estimated
that the household sector will need 120 Mtoe by 2050, while the commercial sector will need 47.7 Mtoe by
2050 [16]. The rest of the demand will come from other sectors, including agriculture, mining, and construction.
Under the Sustainable Development trend, the energy demand will rise slightly, but the rate is still lower to the
rate of BAU. The demand will be expected to reach 154.7 Mtoe and 481.1 Mtoe by 2025 and 2050, respectively
[16]. This scenario employs an annual increase of 4.7% of energy demand [16]. In this scenario, fossil fuel
energy still becomes the main choice in meeting the energy demand with the annual increase of oil of 3%,
natural gas of 5%, and coal of 5% from 2018 to 2050. Concerning renewables, renewable energy has received
more attention with a slight rise of use in several sectors, such as transportation, industry, commercial, and
households with an annual increase of 8% annually from 2018 to 2050.
The last scenario is the Low Carbon trend. This scenario, which has a 4.3% annual increase, shows a significant
decline in energy demand compared to the BAU and the normal efficiency scenarios, with the total demand of
150.1 and 424.2 Mtoe by 2025 and 2050, respectively [16]. This rate is 23% lower than the BAU scenario by
2050 [16].

renewablesroadmap.iclei.org 12 Energy Situational and Stakeholder Analysis
1.4.2 Electricity Demand
Considering significant population growth and increase energy demand, electricity demand is
predicted to increase substantially as well. Like the energy demand, the electricity demand has three scenarios
to predict the electricity demand in the future, which are the BAU, the Sustainable Development, and the Low
Carbon.
Under the BAU scenario, the electricity demand will increase to a total of 2,214 TWh by 2050 [16]. In this
scenario, oil share has completely been reduced to 0. With the total demand, coal contributes to 41%, while
natural gas and renewable energy account for 32% and 27%, respectively [16].
Under the Sustainable Development scenario, the total electricity demand will be lower than that of the BAU
scenario, with a total of 1,918 TWh by 2050 [16]. This rate will be composed of 39% of coal, natural gas of 33%,
and renewable energy of 28% [16].
Finally, the Low Carbon scenario will require an additional 1,371 TWh from the rate of 2018 by 2050 [16]. With
the total demand of 1,626 TWh by 2050, the demand will be sourced from coal of 32%, natural gas of 5%, and
renewable energy of 63% [16]. This scenario pushes the use of renewable energy as a substitute for oil in
satisfying the electricity demand. In addition, the share of coal and natural gas is lower than that of the BAU
and the Sustainable Development scenario.
renewablesroadmap.iclei.org 13 Energy Situational and Stakeholder Analysis
Chapter 2 Renewable Energy Potential and
Status
This chapter will focus on the potential for renewable energy in Indonesia. This section will present a
comprehensive explanation of renewable energy potential for geothermal, solar, hydro, wind, ocean energy,
waste, and bioenergy.
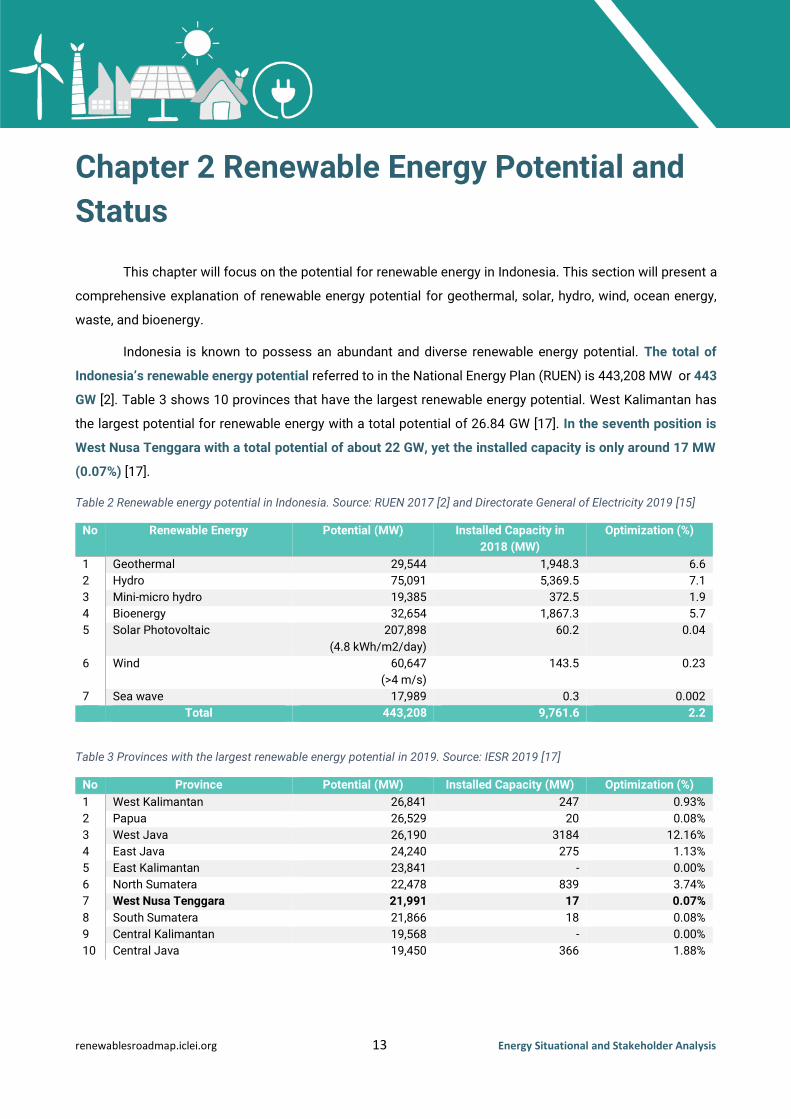
Indonesia is known to possess an abundant and diverse renewable energy potential. The total of
Indonesia’s renewable energy potential referred to in the National Energy Plan (RUEN) is 443,208 MW or 443
GW [2]. Table 3 shows 10 provinces that have the largest renewable energy potential. West Kalimantan has
the largest potential for renewable energy with a total potential of 26.84 GW [17]. In the seventh position is
West Nusa Tenggara with a total potential of about 22 GW, yet the installed capacity is only around 17 MW
(0.07%) [17].
Table 2 Renewable energy potential in Indonesia. Source: RUEN 2017 [2] and Directorate General of Electricity 2019 [15]
No Renewable Energy Potential (MW) Installed Capacity in
2018 (MW)
Optimization (%)
1 Geothermal 29,544 1,948.3 6.6
2 Hydro 75,091 5,369.5 7.1
3 Mini-micro hydro 19,385 372.5 1.9
4 Bioenergy 32,654 1,867.3 5.7
5 Solar Photovoltaic 207,898
(4.8 kWh/m2/day)
60.2 0.04
6 Wind 60,647
(>4 m/s)
143.5 0.23
7 Sea wave 17,989 0.3 0.002
Total 443,208 9,761.6 2.2
Table 3 Provinces with the largest renewable energy potential in 2019. Source: IESR 2019 [17]
No Province Potential (MW) Installed Capacity (MW) Optimization (%)
1 West Kalimantan 26,841 247 0.93%
2 Papua 26,529 20 0.08%
3 West Java 26,190 3184 12.16%
4 East Java 24,240 275 1.13%
5 East Kalimantan 23,841 - 0.00%
6 North Sumatera 22,478 839 3.74%
7 West Nusa Tenggara 21,991 17 0.07%
8 South Sumatera 21,866 18 0.08%
9 Central Kalimantan 19,568 - 0.00%
10 Central Java 19,450 366 1.88%
renewablesroadmap.iclei.org 14 Energy Situational and Stakeholder Analysis
2.1 Geothermal
Located on the pacific ring of fire, Indonesia possesses the second biggest geothermal energy
reserves on the planet, representing 40% of the world’s resources. The global electricity generation through
geothermal has a potential of 29.54 GW, yet the utilization is still 6.6% (1.94 GW) [2, 15]. The target is thus to
reach 7.2 GW of geothermal energy in electricity generation by 2025.
Unlike most renewable energy, geothermal energy has the advantage of having a stable baseload power,
making it more reliable for the power grids. However, the implementation of geothermal projects has many
engineering and technical challenges that can slow down its development and deployment. Indeed,
geothermal technology is yet to be improved and it still has a high-risk exploration.
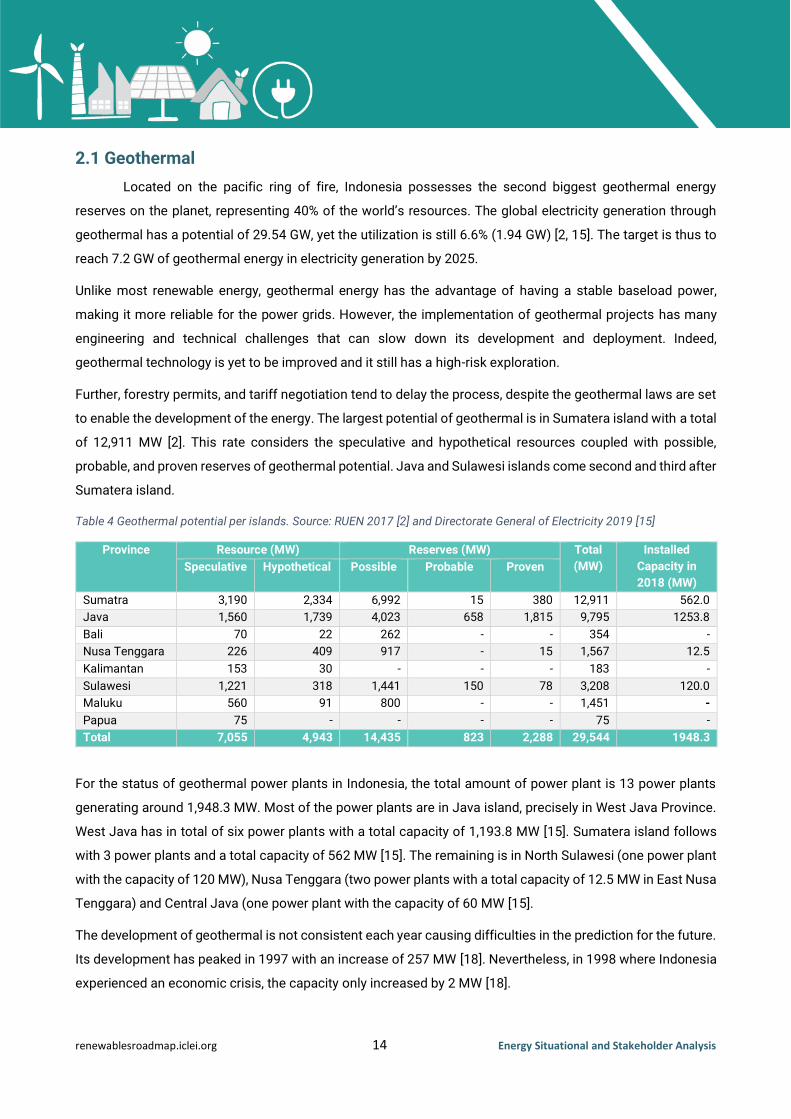
Further, forestry permits, and tariff negotiation tend to delay the process, despite the geothermal laws are set
to enable the development of the energy. The largest potential of geothermal is in Sumatera island with a total
of 12,911 MW [2]. This rate considers the speculative and hypothetical resources coupled with possible,
probable, and proven reserves of geothermal potential. Java and Sulawesi islands come second and third after
Sumatera island.
Table 4 Geothermal potential per islands. Source: RUEN 2017 [2] and Directorate General of Electricity 2019 [15]
Province Resource (MW) Reserves (MW) Total
(MW)
Installed
Capacity in
2018 (MW)
Speculative Hypothetical Possible Probable Proven
Sumatra 3,190 2,334 6,992 15 380 12,911 562.0
Java 1,560 1,739 4,023 658 1,815 9,795 1253.8
Bali 70 22 262 - - 354 -
Nusa Tenggara 226 409 917 - 15 1,567 12.5
Kalimantan 153 30 - - - 183 -
Sulawesi 1,221 318 1,441 150 78 3,208 120.0
Maluku 560 91 800 - - 1,451 -
Papua 75 - - - - 75 -
Total 7,055 4,943 14,435 823 2,288 29,544 1948.3
For the status of geothermal power plants in Indonesia, the total amount of power plant is 13 power plants
generating around 1,948.3 MW. Most of the power plants are in Java island, precisely in West Java Province.
West Java has in total of six power plants with a total capacity of 1,193.8 MW [15]. Sumatera island follows
with 3 power plants and a total capacity of 562 MW [15]. The remaining is in North Sulawesi (one power plant
with the capacity of 120 MW), Nusa Tenggara (two power plants with a total capacity of 12.5 MW in East Nusa
Tenggara) and Central Java (one power plant with the capacity of 60 MW [15].
The development of geothermal is not consistent each year causing difficulties in the prediction for the future.
Its development has peaked in 1997 with an increase of 257 MW [18]. Nevertheless, in 1998 where Indonesia
experienced an economic crisis, the capacity only increased by 2 MW [18].

renewablesroadmap.iclei.org 15 Energy Situational and Stakeholder Analysis
Figure 9 Geothermal development from 1983-2018 (in MW). Source: Adapted RUPTL 2017-2026 [18]
2.2 Hydro Energy
Hydropower is one of the oldest and largest RE resources utilized in Indonesia. Currently, the country
has a potential of 75 GW of hydropower, equivalent to 16.9% of the renewable energy total mix. [2]. Papua has
the largest hydropower potential which is 22,371 MW followed by South, Central, and East Kalimantan with a
total potential of 16,844 MW [2]. In the national target, hydropower is targeted to achieve 18 GW of the national
power generation by 2025 [2]. Currently, the use of hydropower only represents 9% or equivalent to 5.34 GW
from the total hydro potential in Indonesia [15]. Despite the advantages of hydropower, its development has
been slow due to land acquisition issues. The constraints and impacts of the development of a hydropower
plant tend to limit its development at a larger scale.
Figure 10 Mini-Micro hydro Potential per Islands (in MW). Source: RUEN 2017 [2]
Concerning mini-micro hydropower, East Kalimantan Province is a province with the largest of mini-micro
hydropower potential, which is 3,562 MW (Figure 10). This rate is followed by Central Kalimantan with the

renewablesroadmap.iclei.org 16 Energy Situational and Stakeholder Analysis
potential of 3,313 MW [2]. Those provinces are the only provinces with the mini-micro hydro potential of more
than 3,000 MW. Out of Kalimantan island, Aceh in Sumatera island has a large potential with 1,538 MW
followed by West Sumatera (1,353 MW) and North Sumatera (1,204 MW) [2]. In Java island, East Java is a
province with the largest mini-micro hydro potential of 1,142 MW followed by Central Java with the potential
of 1,044 MW [2].
2.3 Ocean Energy
Indonesia as an archipelago has a huge potential for ocean energy. The accumulation of ocean energy
potential in Indonesia is around 61 GW, including 18 GW tidal-current energy, 2 GW sea-wave energy, and 41
GW Ocean Thermal Energy Conversion (OTEC) [19]. Nevertheless, until now Indonesia has not yet optimized
this potential.
Indonesia’s OTEC potential is the largest in the world, spreading across 17 locations in the country. The
potential is derived from the western coast of Sumatra, southern Java, Sulawesi, North Maluku, Bali, and East
Nusa Tenggara. Meanwhile, the tidal current potential is spotted in some straits in Indonesia, such as Sunda
Strait, Riau Island, Lombok Strait in West Nusa Tenggara, Lembeh Strait in North Sulawesi, and some straits
in Papua [19]. The development of ocean renewable energy in Indonesia still needs research to collect basic
data and synergize with the technology providers.
2.4 Solar Energy
Indonesia has immense solar potential reaching up to 207 GWp where most of the potential is located
in the eastern part of Indonesia (Figure 11), which is West Nusa Tenggara and East Nusa Tenggara [2].
However, only 152 MW had been installed by November 2019 (Figure 12). Out of this 152 MW, around 11% or
16.6 MW were coming from rooftop solar PV [21]. There were 46 MW additional capacity in 2019, 33 MW were
from ground-mounted on-grid utility-scale solar PV developed by Independent Power Producer (IPP) [21]. The
biggest solar power plant project in Indonesia was PLTS Likupang (15 MW) in Minahasa which was
commissioned in September 2019 [21].
Based on the current situation through RUPTL 2019-2028 [18], Indonesia has a solar power plant target to
reach 908 MW by 2028 (lower than RUPTL 2018-2027 target as 1.074 MW) in which 10 MW is going to be
developed in West Nusa Tenggara. Meanwhile, to achieve the solar PV 6,500 MW in the RUEN target by the
end of 2025 [2], the government needs to develop more capacity of solar PV from 2020-2025. One of the
government’s strategies to meet the installed solar PV capacity targets is through rooftop solar PV program
namely “One Million Rooftop Solar Initiative (Gerakan Nasional Sejuta Surya Atap - GNSSA)” that can be
implemented in residential, commercial, public and government buildings, and industrial complexes [17].

renewablesroadmap.iclei.org 17 Energy Situational and Stakeholder Analysis
Figure 11 Solar Potential per Islands. Source: World Bank Group 2019 [20]
Figure 12 Installed Capacity of Solar PV by November 2019. Source: IESR 2019 [21]
The limits to the development of the solar power plants can be linked to the high maintenance needs that
cannot be met in the most remote areas because of a lack of specific capacity, and the instability of the power
production that is difficult to compensate due to the high costs of battery storage and technology. The high
investment cost of solar power is a major issue that can be explained by the lack of local manufacturing for
batteries and PV modules. The development of individual solar power in homes still lacks an incentive system,
which slows down development and deployment.

renewablesroadmap.iclei.org 18 Energy Situational and Stakeholder Analysis
2.5 Wind Energy
Figure 13 Wind potential per islands (in MW). Source: RUEN 2017 [2]
Figure 14 Indonesia’s mean wind power density map. Source: World Bank Group 2020 [22]
Indonesia’s archipelagic geography is a key factor in the country’s huge wind potential representing
60.6 GW [2]. However, wind energy is still minor in the electricity production sector which only shares 0.22% of
the total generation [15]. East Java and East Nusa Tenggara have the largest wind potential, 7,907 and 10,188

renewablesroadmap.iclei.org 19 Energy Situational and Stakeholder Analysis
MW, respectively [2]. Nevertheless, the potential is yet to be utilized optimally in those regions since in at this
time, the wind power plant is mostly developed in the Sulawesi region today with South Sulawesi province
possessing the most wind energy potential accounting for 4,193 MW [2].
2.6 Bioenergy
Bioenergy is one of the renewable energies that have not been optimally utilized in Indonesia. The
potential of bioenergy is around 32,653 MW [2]. Compared to the potential, Indonesia only uses 1,867.3 MW
which equals 5.7% of the potential [15]. Riau Province has the largest bioenergy potential of 4,195 MW [2].
Additionally, the utilization of bioenergy is quite high at around 1,279 MW [15]. The second province with the
largest bioenergy potential is East Java with a potential of 3,420 MW. However, compared to the potential it
has, East Java only uses 145 MW [15].
Figure 15 Potential of Bioenergy (in MW). Source: Statistics of EBTKE 2016 [23]
2.7 Waste Energy
As one of the most complex urban problems, the waste sector has not been managed well. Most of
the cities in Indonesia still use old systems of managing waste, namely open dumping and sanitary landfill.
The former has been banned by GoI but in practice, there are still some cities managing their waste with this
system. The latter is used by a few cities.
Waste to energy has a large potential in the country. Nationally, Indonesia produces 64 million tons per year
and only 10-15% of the waste is managed through reusing and recycling (MoEF, 2008). Table 5 shows the
waste volume in large cities in which DKI Jakarta had the largest volume of waste in 2016 with a total of 2.1
million tons. Makassar and Surabaya had the second and third largest waste volume with a total of 2.0 and
1.9 million tons, respectively.

renewablesroadmap.iclei.org 20 Energy Situational and Stakeholder Analysis
Table 5 Waste volume in large cities of Indonesia. Source: Ministry of Energy and Mineral Resources, 2018
City
Type of Waste Total (Tons)
Organic Inorganic Organic Inorganic
2015 2016 2015 2016 2015 2016
Banda Aceh 149,942 165,327 82,640 88,994 232,582 254,321
Medan 419,130 441,504 123,063 129,666 542,193 571,170
Pekanbaru 122,804 67,715 26,773 53,202 149,577 120,917
Jambi 161,615 144,055 191,191 170,422 352,806 314,477
Bengkulu 94,973 105,565 50,991 58,364 145,964 163,929
Bandar Lampung 276,590 295,949 118,537 126,838 395,127 422,787
Pangkal Pinang 55,407 88,016 48,545 38,369 103,952 126,385
Tanjung Pinang 73,913 64,715 39,825 34,847 113,738 99,562
DKI Jakarta 1,259,356 1,180,326 1,070,530 1,003,349 2,329,886 2,183,675
Bandung 206,955 216,810 176,295 184,690 383,250 401,500
Semarang 984,179 1,005,904 603,206 616,522 1,587,385 1,622,426
Yogyakarta 164,980 164,980 119,862 122,348 284,842 287,328
Surabaya 976,390 1,038,275 821,418 873,485 1,797,808 1,911,760
Denpasar 1,035,724 1,058,500 220,091 224,931 1,255,815 1,283,431
Kupang 99,280 105,558 73,730 75,482 173,010 181,040
Pontianak 340,217 352,554 183,194 184,413 523,411 536,967
Banjarmasin 109,865 110,048 931,845 1,095,730 1,041,710 1,205,778
Samarinda 415,991 423,896 291,595 306,925 707,586 730,821
Makasar 1,092,836 1,528,894 353,524 523,724 1,446,360 2,052,618
Kendari 55,305 55,287 5,201 5,336 60,506 60,623
Gorontalo 80,118 85,136 29,510 37,139 109,628 122,275
Ambon 40,880 41,610 6,570 5,840 47,450 47,450
Ternate 10,078 11,538 11,457 10,330 21,535 21,868
Manokwari 37,942 37,942 22,283 22,283 60,225 60,225

renewablesroadmap.iclei.org 21 Energy Situational and Stakeholder Analysis
Chapter 3 Electrification Status
Understanding that electricity is an essential part of the energy, this section will be dedicated to
describing the electrification ratio status of Indonesia quantitatively.
In terms of access to electricity, the electrification ratio target is to reach a 100% electrification ratio by 2024
according to the RUPTUL 2019-2028 [4]. This target is to be reached by increasing energy capacity on the
territory through an on- and off-grid energy development. The aim is to produce 115 GW by 2025 and 430 GW
by 2050 according to the RUEN [2].
Based on the 2018 data, Indonesia has reached the electrification ratio of 98.3% [15], meaning only 1.7% of
the population lacks access to electricity The electrification ratio has been increased from the previous years
through the efforts from PLN with 95.45% of electricity share and Non-PLN or IPP with 2.48% of electricity
share [15]. The remaining comes from solar-powered lamps (LTSHE), provided by MEMR, accounting for 0.37%
of the electricity share. This explains clearly that PLN is supported by IPP to meet the electricity demand.
Technically, the electricity calculation does not come merely from electrified households but also street
lighting using LTSHE.
Figure 16 Electrification Ratio. Source: Directorate General of Electricity [15]
However, these national averages do not show the disparity amongst the provinces (Figure 17). For instance,
while DKI Jakarta has an electrification ratio of 99.99%, West Nusa Tenggara of 89.10 % (red circle in Figure),
and East Nusa Tenggara only reaches 61.90% [15]. The concentration of electricity has been focused to
strengthen and improve the quality and quantity of electricity in Java Island, while for the remaining islands,
electricity is only focused to improve the quantity through the calculation of electrification ratio.
Furthermore, despite the annual increased rate of electrification ratio, the quality is still being questioned by
many energy actors and experts. This is based on the definition of electrification ratio which focuses only on

renewablesroadmap.iclei.org 22 Energy Situational and Stakeholder Analysis
the quantification basis, while the quality is not considered. This means that the increased rate of
electrification ratio does not guarantee that all people have a decent service of electricity. According to the
study conducted by IESR (Institute for Essential Services Reform) in 2019 [24], most Indonesian provinces,
especially in rural areas, belong to Tier 1 and Tier 2 under the Multi-Tier Framework (MTF) developed by the
World Bank. The grading system defines five levels of tier which describes the quality of electricity in general.
For Indonesia, Tier 1 and Tier 2 mean that the electricity they receive is only sufficient to electrifying the basic
lighting and very-low-power electronic devices [24]. This limits them to do daily activities and unable to push
productively economic growth.
Figure 17 Electrification ratio per provinces. Source: Directorate General of Electricity [15]

renewablesroadmap.iclei.org 23 Energy Situational and Stakeholder Analysis
Chapter 4 Energy Governance
After being presented with quantitative data on energy in Indonesia, this chapter discusses energy
governance in Indonesia. Exploring energy governance is essential to understand how the coordination
amongst ministries are structured and how the policies are interconnected to achieve the set goals. This
section will be parted into two main sub-chapters, which are energy organizational structure and energy legal
framework.
4.1 Energy Organizational Structure
Energy organizational structure describes how energy policies are developed and implemented by
multi-level government bodies, both at the national and local levels (Figure 18).
Figure 18 Energy organizational structure in Indonesia. Source: Personal Identification 2019
In the organizational structure, the President holds the most powerful authority on how energy will be brought
in the future through the president’s energy vision. The president has a prerogative authority to determine the
energy direction. This sets the president as the most influential actor in the government side to set the energy
direction which, consequently, implicates the policies to be developed and implemented at the national and
local levels.

renewablesroadmap.iclei.org 24 Energy Situational and Stakeholder Analysis
In developing energy direction which is referred to as the president’s energy vision, the National Energy Council
(DEN) together with The Ministry of Energy and Mineral Resources (MEMR) conceptualized the National
Energy Policy (KEN) before submitting it to the national legislation for the approval [5]. Without the national
legislature’s approval, the conceptualized KEN cannot be passed and implemented [5]. This, implicitly, signifies
a big role of the national legislature in determining how national energy future should be directed.
The KEN will then be a reference for the MEMR, as the technical line ministry for energy, to develop National
General Energy Plan (RUEN) in the coordination with relevant technical ministries and institutions, such as the
Ministry of Industry (MoI), the Ministry of Transportation (MoT), the Ministry of Public Work and Human
Settlements (MPWHS), the Ministry of State-Owned Enterprises (MSOE) and PT. PLN as the only one
Electricity State-Company [5]. The coordination between those ministries and institutions is also assisted by
the Coordinating Ministry for Economic Affairs which is to monitor if the plan aligns with the president’s vision
and mission.
At the national level, the MEMR holds the most important role in the energy sector compared to other
coordinating and technical ministries since the MEMR is the focal point for the energy sector. Further, MEMR
holds an authority to develop and issue energy policies and programs to ensure that the energy vision
stipulated in the KEN and RUEN is implemented accordingly at the national and local levels [5].
Then, the National Development and Planning Ministry (BAPPENAS) plays essential roles in ensuring that the
energy programs developed by the MEMR are accommodated and incorporated into the National Medium-
Term Development Plan (RPJMN) [5]. Without the roles of the Bappenas, the energy programs will not be
realized into actions at the national and local levels.
Finally, from the national level, the Ministry of Finance (MoF) and PT. PLN also have an important role. Without
approval from MoF, the RPJMN which consists of the energy programs will not be allocated with sufficient
budgets. In addition, the MoF is also the one that provides incentives in the energy sector [5]. Concerning the
role of PT. PLN, PT. PLN is the main actor in the electricity sector; indeed, the company has the exclusive
authority over transmission, distribution, and supply of energy [5]. The Government Regulation No. 10/1989
amended by GR No.3/2005 and GR No.26/2008 authorizes the creation of Independent Power Producers, who
have the right to produce electricity and sell it to PLN under PPAs. Apart from PLN and IPPs, Private Power
Utility (PPUs) also have the competence to produce electricity, but only for personal use. Moreover, if the
electricity generated is over 200 kVA, an operating license delivered from the state is required. In the case of
excess electricity is generated, the electricity can be sold to PLN and IUPTLs after state authorization. IUPTLs
is an Electricity Supply Business License that must be granted before an entity can sell electrical power for
public use [5]. However, PLN remains the most important actor in the sector, since the state company has the
priority to conduct business since the 2009 electrical law, but also since it is the only owner of the distribution
infrastructures.

renewablesroadmap.iclei.org 25 Energy Situational and Stakeholder Analysis
At the local level, the provincial and city/regency government have different roles in the energy sector (please
see the next section on the energy legal framework). At the provincial level, Energy and Mineral Agency will be
the focal point which in day-to-day tasks, will coordinate intensively with the MEMR. This type of department
does not exist at the city/regency level due to the energy authority stipulated on the law No. 23/2014 on local
governance. As the substitute of the department, The Regional Development Planning Agency (BAPPEDA)
will be in charge of all planning and development tasks, including the energy sector.
According to the law No. 23/2014 concerning local governance, most of the energy authority is held by the
national and provincial governments, while the city/regency government has only one authority, which deals
with the issuance of the geothermal permits in the city/regency level. However, city/regency can develop waste
to energy as a part of the waste management sector. This is also supported by Presidential Regulation No.
35/2018 concerning the acceleration of waste to energy, stating that appointed city/regency governments can
develop renewable energy in city-scale, such as waste to energy. This means that a city has the authority to
develop the city-scale renewable energy.
4.2 Energy Legal Framework
In the energy sector, the energy legal framework is split into two parts, first is to explain the general
energy, including fossil fuel and renewable energy policies, and the second will be dedicated to describing the
energy efficiency policies.
4.2.1 Energy in General (Fossil and Renewables)
In general, the authority on energy in Indonesia is shared with three government levels, which are
national, provincial, and city/regency government levels (see figure 19). The energy sector in Indonesia is
regulated under the Energy Law No. 30/2007. The law shows the principles of the energy direction that
Indonesia must follow, which is justice for people to have access to energy. In addition, the law emphasizes
that the priority of Indonesia in the energy sector consists of energy independence, national energy availability,
national energy fulfillment, optimal, integrated and sustainable energy management, energy efficiency and
energy accessibility for people, especially for those residing in isolated islands/areas and having financial
difficulties [25].
Related to renewable energy, there is no law that specifically and comprehensively regulates renewable energy
in Indonesia (the law is still under development). Nevertheless, some types of renewable energy are described
under the law on energy. The law on energy states that energy that contains fossil fuel, geothermal, large-scale
hydropower plants, and nuclear power plants is ruled by the state [25]. Moreover, the development of
renewable energy is focused to provide people with prosperity. Finally, the domestic content level must be
maximized in good service provision to underpin an independent, efficient, and competitive energy. This law
is a reference to the development of the National Energy Policy (KEN).

renewablesroadmap.iclei.org 26 Energy Situational and Stakeholder Analysis
Figure 19 Energy legal framework in Indonesia. Source: Personal Identification 2019
Under the law on energy is the government regulation on KEN, whose development is referred to as the law of
energy and Electricity Law No. 30/2009 [26]. The KEN is an energy road map of Indonesia 2010-2050 which
provides general energy directions. The KEN shows that Indonesia has an optimal energy mix of (1) New and
Renewable Energy (NRE) of at least 23%, oil of less than 25%, coal of at least 30% and natural gas of at least
22% by 2025; (2) NRE of at least 31%, oil of less than 20%, coal of at least 25% and natural gas of at least 24%
by 2050 [6]. The KEN also states other energy targets; the target of energy elasticity of less than 1 by 2025, the
target of electrification ratio closing to 100% by 2020, and the target of gas utilization for households of 85%
by 2025 [6].
To achieve the targets, the KEN has a general direction that consists of two policy categories in the energy
sector, which are the main policy and the supporting policy. The main policy of Indonesia in the energy sector
includes ensuring the availability of energy for national needs, the development of energy, as well as the
utilization of national energy resources and energy reserve. For supporting policy, it includes energy
conservation, energy diversification, environment, subsidy and incentive, infrastructure development. From the
policy, ensuring the availability of energy is the main goal of Indonesia until 2050.

renewablesroadmap.iclei.org 27 Energy Situational and Stakeholder Analysis
In the lower regulation, Indonesia has developed the National Energy Plan (RUEN) under Government
Regulation No. 22/2017 [2]. The RUEN is a general energy management direction in Indonesia that depicts the
energy vision and status, GHG emission impact reduction, energy availability for national needs, energy
development priority, energy utilization, and energy reservation [2]. The document states that power plant
generation is the biggest contributor to GHG emission from the energy sector, followed by industry,
transportation, household, and other sectors. It is also estimated that the energy sector will contribute to 34.8%
and 58.3% of GHG reduction by 2025 and 2050, respectively [2]. The target will be achieved through energy
diversification (renewable energy), clean coal technology application, oil fuel substitution to gas, and energy
conservation. The RUEN is used as a reference for the development of the National Electricity Plan (RUKN).
In addition, under the RUEN, the Provincial Government is mandated to develop the Regional Energy Plan
(RUED) which sets out the provincial target on energy mix, including the renewable energy by 2025 and 2050.
The RUKN 2015-2034 is focused merely on electricity fulfillment in Indonesia [5]. It acts as a guideline in
electricity generation, distribution, and transmission. It also states the electrification ratio target, which must
reach 100% by 2024, the electricity status per province and consumption growth, the electricity demand and
electricity investment needs. The RUKN also mandates provincial governments to develop the Local Regional
Electricity Plan (RUKD). Further, the RUKN is also a reference to the development of the PLN’s Electricity
Provision Plan (RUPTL) which is PLN’s action plan on electricity distribution, transmission, and generation.
Aside from those main regulations on energy in general, this sector is also governed by various other
regulations as below in Table 6.
Table 6 List of Ministerial Regulation on Renewable Energy. Source: Personal Identification 2019
No Ministerial Regulation
1 MEMR Regulation No. 0002/2004 on Renewable energy development and energy conservation (Green Energy
Development)
2 MEMR Regulation No. 53/2018 on the utilization of renewable energy for electricity provision
3 MEMR Regulation No. 39/2017 replaced by MEMR Regulation No.12/2018 on the implementation of physical
activity on the renewable energy and energy conservation utilization
4 MEMR Regulation No. 44/2015 on the purchase of electricity by PT. PLN from urban waste to energy power plant
5 MEMR Regulation No. 17/2014 on the purchase of electricity from geothermal source by PT. PLN
6 MEMR Decision No.55 K/ 20/MEM/2019 on Basic Fee of the Provision of Generation (BPP) PT. PLN
7 MEMR Regulation No. 10/2018 on the amendment of MEMR No. 10/2017 on basic agreement of electricity buy
and sell
8 MEMR Regulation No. 47/2018 on the procedure for determining electricity tariffs
9 MEMR Regulation No. 33/2018 on management and utilization of geothermal data and information for indirect
use
10 MEMR Regulation No. 37/2018 No. 37/2018 Geothermal Working Area Offer, Geothermal Permit, and Geothermal
Business Assignment
11 MEMR Regulation No.5/2018 on the procedure for providing LTSHE for the community that has not yet had
access to electricity
12 MEMR Regulation No. 13 /2019 on amendment to Number 49 of 2018 concerning Use of the PLTS Roof System
by PT.PLN consumers
13 MoF Regulation No. 62/2017 Fund Management and Infrastructure Financing for Geothermal Sector at PT. SMI
renewablesroadmap.iclei.org 28 Energy Situational and Stakeholder Analysis
14 MoF Regulation No. 135/2019 The procedures for implementing government guarantees to accelerate
electricity infrastructure development
15 MoF Regulation No 21/2010 Provision of taxation and customs facilities for the utilization of renewable energy
sources
4.2.2 Energy Efficiency
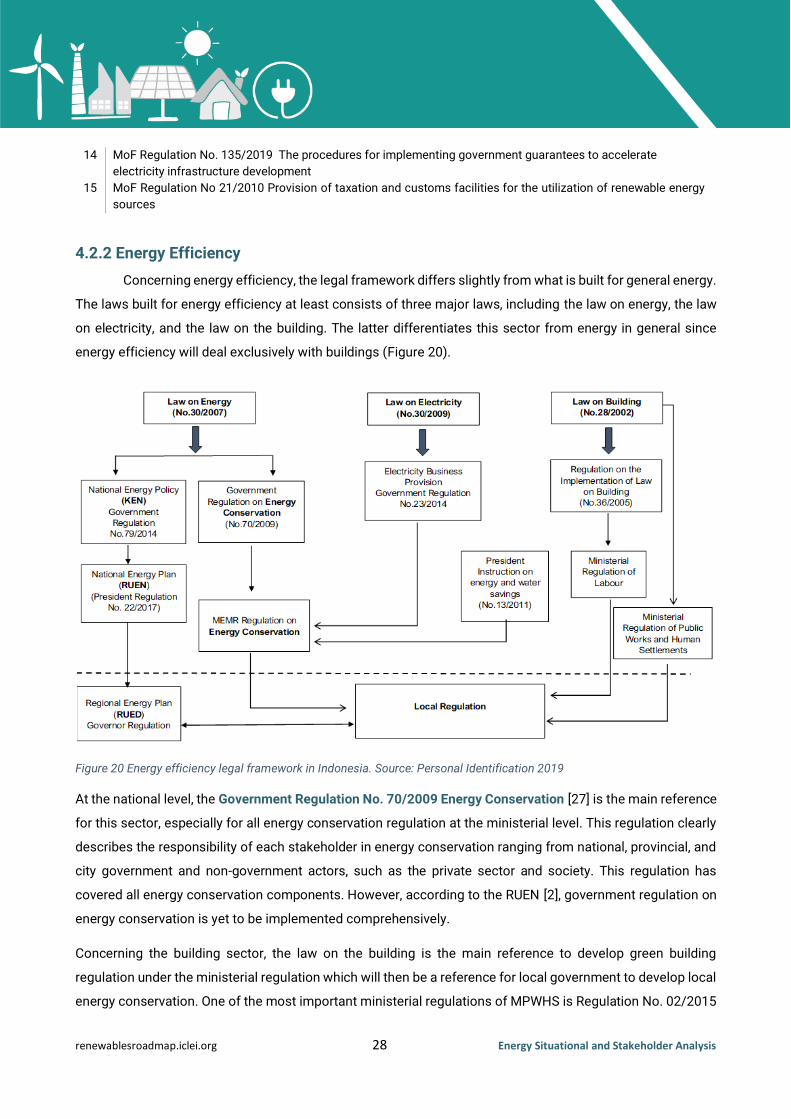
Concerning energy efficiency, the legal framework differs slightly from what is built for general energy.
The laws built for energy efficiency at least consists of three major laws, including the law on energy, the law
on electricity, and the law on the building. The latter differentiates this sector from energy in general since
energy efficiency will deal exclusively with buildings (Figure 20).
Figure 20 Energy efficiency legal framework in Indonesia. Source: Personal Identification 2019
At the national level, the Government Regulation No. 70/2009 Energy Conservation [27] is the main reference
for this sector, especially for all energy conservation regulation at the ministerial level. This regulation clearly
describes the responsibility of each stakeholder in energy conservation ranging from national, provincial, and
city government and non-government actors, such as the private sector and society. This regulation has
covered all energy conservation components. However, according to the RUEN [2], government regulation on
energy conservation is yet to be implemented comprehensively.
Concerning the building sector, the law on the building is the main reference to develop green building
regulation under the ministerial regulation which will then be a reference for local government to develop local
energy conservation. One of the most important ministerial regulations of MPWHS is Regulation No. 02/2015

renewablesroadmap.iclei.org 29 Energy Situational and Stakeholder Analysis
on the green building which governs how green buildings are built and describes the principles, requirements,
certification, roles of society, and incentives.
At the local level, the governor regulation development always refers to RUED and Ministerial regulation of
MEMR related to energy conservation, Ministerial regulation of Home Affairs (MOHA), Ministerial regulation of
Labor (MoL), and Ministerial regulation of Public Work and Human Settlement (MPWHS). For detail, energy
conservation and energy efficiency are governed under various regulations.
Table 7 List of Ministerial Regulation on Energy Conservation. Source: Personal Identification 2019
No Ministerial Regulation and the Indonesian National Standard
1 MEMR Regulation No. 2/2004 Renewable Energy Development and Energy Conservation (Green Energy
Development)
2 MEMR Regulation No. 12/2012 Control of the Use of Fuels
3 MEMR Regulation No. 13/2012 Saving Electricity Consumption
4 MEMR Regulation No. 14/2012 Energy Management
5 MEMR Regulation No. 15/2012 Savings in Groundwater Use;
6 MEMR Regulation No. 01/2013 concerning Controlling Use of Fuels
7 MEMR Regulation No. 18/2014 concerning Affixing Energy Saving Sign Labels for Swaballast Lights
8 MEMR Regulation No. 39/2017 Implementation of Physical Activity Utilization of New and Renewable Energy and
Energy Conservation
9 MEMR Regulation No. 41/2017 concerning the Second Amendment to the MEMR Regulation No. 28/2016 on
Electricity Tariffs Provided by the State Electric Company (Persero)
10 MEMR Regulation 57/2017 implementation of minimum energy performance standards and inserting energy
saving signs label for air conditioning devices
11 MPWHS Regulation No. 02/PRT/M/2015 on green buildings
12 MoL Regulation No. 53/2018 concerning the Establishment of Indonesian National Work Competency Standards
in the Energy Audit field
13 MoL Regulation No. 80/2015 concerning the Determination of Indonesian National Work Competency Standards
in the Position of Energy Manager in Industrial Buildings and Buildings
14 Indonesia National Standard (SNI): 6196: 2011 concerning Energy Audit Procedures on Building Envelopes
15 Indonesia National Standard (SNI): 6197: 2011 concerning Energy Conservation in Lighting Systems

renewablesroadmap.iclei.org 30 Energy Situational and Stakeholder Analysis
Chapter 5 National Energy Program
This chapter describes the energy programs that have been implemented and are under construction,
for both fossil fuel energy and renewable energy. To achieve the set targets in the energy sector, such as the
energy mix target (including the 23% RE target), EE target and ER target, GoI has carried out massive efforts
through the National Budget (APBN) and other budgets, such as energy cooperation with private sectors which
is called Public-Private Partnership (PPP) or KBPU in Indonesia context. Nevertheless, most of the project was
financed by the APBN.
Concerning fossil fuel power plant development, fossil fuel energy was targeted in a 35,000 MW program from
2015 to 2019. From a total of 35.3 GW, 52% or an equivalent of 18.2 GW is still under construction, while 8%
or equivalent to 2.9 GW are completed. The remaining is still on the PPA and planning stages (40% or
equivalent to 14.2 GW) [4]. The installation is distributed to Sumatera island with 9.6 GW in total, West Java
with 5.7 GW, Central Java with 11.8 GW, Kalimantan island with 3.4 GW, Sulawesi island with 2.7 GW, East
Java, Bali and Nusa Tenggara with the total of 1.46 GW, and Maluku as well as Papua with 0.8 GW power
installation.
Figure 21 Progress of 35 GW program. Source: RUPTL 2019-2028 [4]
For renewable energy development, financing is derived from various sources. The National Budget comes as
the main source of development. Between 2017 and 2019, 75 projects had been proposed to be implemented
in Indonesia. Nevertheless, 27 out of 75 projects did not reach the financial close signifying there was no

renewablesroadmap.iclei.org 31 Energy Situational and Stakeholder Analysis
financing source to implement the projects despite having obtained PPA with the PLN where most projects
are micro-hydro ones [21]. For the remaining projects, 30 projects are under construction, five projects have
reached the financial close and 13 projects are in full operational status [21]. The completed and under
operation projects include the on-shore-wind power installed in Sidrap, South Sulawesi with a total power
generated of 75 MW, the Karaha geothermal power plant with a total power of 30 MW, the hydropower plant
in Rajamandala with the power of 47 MW and the Sarulla geothermal power plant in north Sumatera with 110
MW power.
According to RUPTL 2019-2028, GoI has targeted to install 16,714 MW of renewables [4]. In the plan, the
installation of renewable energy is concentrated more on Java island with a total capacity of 7 GW or
equivalent to 42% of the total installation plan [4]. Meanwhile, Sumatra island follows with a total of 5.7 GW or
equivalent to 34% of the total installation plan [4].
In terms of sources, hydropower (including micro and mini-hydro) plants still predominantly contribute to 60%
of the renewable energy capacity, while geothermal comes second with 27% of shares (8,009 MW). Solar
energy, which has large potential throughout Indonesia, is only set to reach a target of 908 MW or equivalent
only to 5% of the renewable energy plan) [4].
For the installation plan in 2019, GoI plans to install 560 MW sourcing from various renewables, such as hydro,
solar, and geothermal. For the latter, there has been a certainty of the installments amounting to 190 MW
which is planned to be installed in North Maluku, East Java, and West Java [4]. A total of 10 MW geothermal
power plant is planned to be developed in West Nusa Tenggara in 2027 [4].
Table 8 PLN’s renewable electricity provision plan 2019-2028. Source: RUPTL 2019-2028 [4]
Type Capacity 2019 2020 2021 2022 2023 2024 2025 2026 2027 2028 Total
Geothermal PP MW 190 151 147 455 245 415 2,759 45 145 55 4,607
Hydro PP MW 154 326 755 - 182 1,484 3,047 129 466 1,467 8,009
Micro-hydro PP MW 140 238 479 200 168 232 27 20 20 10 1,534
Solar PP MWp 63 78 219 129 160 4 250 - 2 2 908
Wind PP MW - - 30 360 260 50 150 - - 5 855
Biomass/Waste PP MW 12 139 60 357 50 103 19 5 15 35 794
Ocean PP
MW - - 7 - - - - - - - 7
Total MW 560 933 1,697 1,501 1,065 2,287 6,251 199 648 1,574 16,714

renewablesroadmap.iclei.org 32 Energy Situational and Stakeholder Analysis
Chapter 6 Energy Financing
This chapter will describe generally the energy financing scheme in Indonesia. The focus is on the
financing scheme of fossil fuel and renewable energy.
Figure 22 Financing Scheme of Energy in Indonesia. Source: Personal Identification, 2019
As seen in Figure 22, the energy targets cannot be funded only by GoI through the National Budget (APBN)
although it is admitted that the APBN provides the majority of the finance for energy development, both from
fossil fuel and renewable energy. In the APBN, the budget is allocated to several posts which include the
government financing institution under the Ministry of Finance (MoF) and the Ministry of National Planning
and Development (BAPPENAS), the Special Allocation Budget (DAK), the Village Fund (Dana Desa) and
ministerial budget, especially for the energy-related ministries, such as MEMR, Bappenas, MoI, MoT, MoF,
MoEF, and MPWHS.
The global fund is channeled through one financing scheme. The fund is allocated to the government financing
institutions/agencies which are mostly situated under the Ministry of Finance, such as PT. SMI and Bappenas

renewablesroadmap.iclei.org 33 Energy Situational and Stakeholder Analysis
with its ICCTF. Indonesia’s government financing institutions focus the assistance on renewable energy
development. These GFIsserve as a third party under the government to manage funds coming from the APBN
and the Global Funds in the form of loans and grants [5]. The function of the financing institutions is to collect
and select local RE proposals from local governments or the private sector. Some local governments plan to
develop a proposal to be proposed to the global fund through various financing schemes, such as PT. SMI,
ICCTF, and Global Climate Fund (GCF).
The DAK and Village Fund are not reserved merely for renewable energy development. DAK is not distributed
to all provinces and cities in Indonesia since DAK aims to provide financial assistance to special regions that
have an urgent issue to resolve [28]. In 2016, the allocation for energy is around 0.7 trillion IDR [9]. The main
function of the Village Fund is to provide financial assistance to villages in Indonesia towards a better
economic growth of the villages. Nevertheless, the fund can be used for the development of renewable energy.
The allocation of the fund is heavily dependent on the decision of the society in the villages with the supervision
of the national and local governments. Still sourcing from the APBN, the ministerial budget is allocated for the
development of the conventional (fossil fuel) and renewable energy. The use of the fund depends on the
programs set by the Ministry of Energy and Mineral Resources (MEMR).
Local governments through the local budget, which is large and generally supported by the APBN, assists in
the development of a small amount of renewable energy at the local level, such as the installation of micro-
hydro in Lombok island. The small amount of the fund is originated from local retribution and tax. For private
sectors, the concerns are split into two types of energy development, which are fossil fuel and renewable
energy. Each development requires going through the PPP mechanism [5].
The development of renewable energy can be financed through individual budgets. Nevertheless, the scope of
renewable energy development is limited to the installation of the solar rooftop and this initiative is still low
due to the expensive price of the installments.

renewablesroadmap.iclei.org 34 Energy Situational and Stakeholder Analysis
Chapter 7 Energy Situational Analysis
This chapter discusses the current challenges and opportunities in developing renewable energy and
energy efficiency programs in Indonesia. The analyses in this chapter are based on the previous chapters and
were supported by materials and references from ICLEI and IESR [29].
According to the first chapter of this report, energy consumption and production are still dominated by fossil
fuel. It is predicted that the energy demand will increase under BAU, Sustainable Development, and Low Carbon
Scenarios [16]. Interestingly, Indonesia has set a significant renewable and energy efficiency targets by 2025
and 2050 stipulated under KEN and RUEN [2, 6]. Under the RUEN scenario, the greenhouse gas emission in the
energy sector is predicted to decrease by 35% by 2025 and 58% by 2050 [29, 2]. This decrease will come mainly
from the utilization of renewable energy [29].
Regarding renewable energy, Indonesia has abundant and diverse renewable energy potential. According to
chapter 2, there is around 443 GW renewable energy potential coming from geothermal, hydropower, solar,
wind, ocean, bioenergy, and waste potential [2]. However, the installed capacity of renewable energy in the
country is still low [15]. It happens because the given potential does not consider financial/economic of
individual projects and it does not consider locational factor, where some high potentials are located in areas
with very low electricity demand [5]. Additionally, the distribution of the potential is quite different between
regions, particularly in big cities. For example, DKI Jakarta province has a limited amount of renewable
potential whereas its electricity demand is high [29]. Thus, waste-to-energy can be developed as a part of the
waste management sector in the city/regency level as well as the implementation of rooftop solar PV.
A small portion of renewables has been utilized to electrify rural area. According to the third chapter, Indonesia
almost reaches a 100% electrification ratio [15]. Yet, the electricity provided is only sufficient for basic lightings
and small electronic appliances which are unable to increase significant productivity [24]. Hence, it is
important to improve not only the quantity but also the quality. In addition, unsustainable operation and
maintenance, lack of willingness-to-pay, and limited electricity infrastructure in the rural area can be an
additional challenge [29].
According to chapter four, the energy sector in Indonesia is governed mainly by the Ministry of Energy and
Mineral Resources. Several laws and regulations have also been developed in the country. KEN and RUEN are
two documents that depict the energy roadmap in Indonesia until 2050. This RUEN and KEN are developed by
the National Energy Council. Based on RUEN, the provincial government is mandated to develop RUED [2].
RUED provides not only the energy target of the provinces but also the opportunities to develop the energy
infrastructure in the region. Nevertheless, by April 2020, only 16 out of 34 provinces in Indonesia that already
have developed RUED [29]. One challenge in implementing RUED is political instability that can cause
commitment inconsistency.

renewablesroadmap.iclei.org 35 Energy Situational and Stakeholder Analysis
PLN has exclusive power over the transmission, distribution, and retailing of electricity in Indonesia [5]. The
company also has a responsibility to develop the RUPTL document which sets the electricity provision plan
for 10 years. However, according to chapter five, the share of renewables in the plan is still low [4]. Hence, it is
important to synchronize between RUPTL and RUED/RUEN [29]. Local government, private entities, and
communities can participate in developing electricity generation through PPP scheme (Including IPP’s regular
PPA scheme) [5]. However, more than one-third of renewable projects proposed between 2017 and 2019 have
not been funded yet [21].
Regarding the funding, the funding for renewable energy can come from the local budget (APBD) or the
national budget (APBN). The presence of energy targets under RUED has a consequence on the budget, yet
the financial capacity of local government is limited. International loans and grants are managed by third
parties under the government such as PT. SMI [5]. However, small developers have difficulty in accessing
funding because they have no guarantee [29].
Despite its significant challenges, renewable energy and energy efficiency still have significant opportunities
in Indonesia, particularly as part of economic stimulus and recovery plans after the Covid-19 pandemic. Clean
energy transitions must be at the center of economic recovery and stimulus plan [3]. Several strategies can be
taken to help develop renewable energy and energy efficiency in Indonesia:
1. Setting renewable energy and energy efficiency targets as an annual Key Performance Indicator (KPI)
in both state/regional/local governments/institutions to achieve an ambitious commitment.
2. Aligning renewable energy and energy efficiency implementation with the priority of regional
development planning, for example, RE implementation for ecotourism or remote area’s mining.
3. Prioritizing renewable energy development based on local renewable energy potentials such as waste
power plant and rooftop PV in the urban areas, or biogas in the agricultural areas.
4. Developing alternative funding schemes for small developers, such as through crowdfunding.
5. Incorporating local vocational or tertiary institutions to provide education and/or research to improve
the capacity building of local government/institutions as well as to increase community awareness.

renewablesroadmap.iclei.org 36 Energy Situational and Stakeholder Analysis
Chapter 8 Stakeholder Mapping
This chapter shows the stakeholder mapping identification and analysis. The stakeholders presented
in this chapter are those that influence the implementation of the ICLEI’s 100% Renewable Cities and Regions
Roadmap Project.
In the energy sector, actors involved are not only from government bodies but also from non-government
bodies. The non-government bodies range from the private energy sector, non-government organization/civil
society organization, banks, and society. The stakeholder mapping in this section will answer a question on
who has the most significant influence in the project implementation. This means that the provided
stakeholder mapping will show the involvement of actors according to their influence on the project.
The stakeholder mapping focuses on three actor divisions according to the frequency of involvement and the
influence on the project continuity. The key actor is defined as actors that influence significantly to the project.
This signifies that the actors determine how the project goes and with their absence, the project cannot carry
on. The primary actor is translated into actors whose existence is important although they are temporarily
present for the project. Finally, the secondary actor consists of actors that are temporarily involved in the
project and their presence is not significantly influential to the project.
As shown in Figure 23, the MEMR together with ICLEI – Local Governments for Sustainability, the selected
project region, and city/regency (Deep-Dive and Networks) dominate the key actor category. Firstly, ICLEI is,
indeed, a vital part of the project since ICLEI is the facilitator and implementer of the project. ICLEI plays as a
facilitator of the selected region/city/regency where attempts to assist in the selected deep-dive region and
network cities/regencies.
Secondly, MEMR holds a significant role to ensure the alignment of the project with the national energy priority.
In addition, MEMR will be a member of the National Advisory Group (NAG) which aims to improve multi-level
governance. This is essential for multi actors in the multi-level coordination to understand on-ground issues
to develop a comprehensive policy addressing local issues. Finally, in this category, the selected
region/city/regency has a core role since the project plays at the local level. The direction on where the project
will go is also partly determined by the selected region/city/regency.
The second category, which is the primary actors, includes several ministerial bodies and one state-owned
company for electricity (PT. PLN). Ministerial ministries will take part in the project as their inputs are important
to enrich insights that build on in a whole process of the project implementation. The PT. PLN is also an
important actor playing in the energy sector, especially electricity. As the project relates to electricity and
electricity is monopolized by the PT. PLN, their present to the project will provide them with a deep

renewablesroadmap.iclei.org 37 Energy Situational and Stakeholder Analysis
understanding of on-ground issues. It is also expected that they will be a member of the NAG together with
MEMR. Their involvement will enrich multi-level dialogues in energy governance.
The last category is the secondary actors. The category consists of various actors coming from the state,
private sectors, and civil society. From the state sector, energy-related ministries that are not mentioned in the
previous categories belong to this category, such as BAPPENAS, CMMA, CMEA, MSOE, MoEF, DEN, and State
Financial Institutions. From the private sector, private energy developers and banks belong to this category,
while NGOs, academes, and communities are a part of this category (see Table 9 for the detail of the detailed
stakeholders’ role).
Figure 23 Stakeholder Mapping for the 100% Renewable Cities and Regions Roadmap Network. Source: Personal Identification, 2019
Table 9 Detailed Stakeholder Mapping Framework to the Project. Source: Personal Identification 2019
No Name of Entities Entities Detail Function to the 100% Renewable Cities and Regions Roadmap
Project
Key Actors
1 Selected Provincial,
City and Regency
Local
Government
● A veto actor ● Their roles are essential to the continuation of the project since the
project focuses directly on the local government.

renewablesroadmap.iclei.org 38 Energy Situational and Stakeholder Analysis
Government (Deep-
Dive and Networks)
● The daily engagement will occur with the selected local governments.
● The focus is detailed in the energy department at the provincial level. The energy department is a department dealing with the energy sector with daily tasks to develop and execute energy policy and plan at the provincial level affecting city and regency level.
● The focus in city and regency is on the development and planning agency (BAPPEDA) since, at the city and regency level, the energy department is not present.
2 Ministry of Energy
and Mineral
Resources (MEMR)
National
Government
technical
ministry
● A veto actor ● The MEMR holds considerable roles in the project since they are a
technical ministry dealing with the energy sector, including renewable energy and energy efficiency. Since the project aims to help attain national energy targets, intense and coherent coordination between ICLEI and MEMR is a must.
● Direct support from the MEMR is necessary for this project. ● MEMR is expected to be a member of NAG to help multi-level
governance coordination. ● Their involvement will provide us a perspective on multi-level
coordination in the energy sector.
Primary Stakeholders 3 PT. PLN (The State-
owned Electricity
Company)
National
Government
under the
Ministry of
State-Owned
Enterprises
(MSOE)
● No direct or daily basis coordination and no power to decide the project
● Coordination with PT. PLN is necessary to ensure that they are involved directly at the national level in this project.
● They are the only company with a monopolized power in the electricity sector, ranging from the distribution, transmission, generation of electricity.
● Their involvement will provide us a perspective on multi-level coordination in the energy sector.
● PT. PLN is expected to be a member of NAG to help multi-level governance coordination.
4 Ministry of Industry National
Government -
Technical
Ministry
● No direct or daily basis coordination and no power to decide the project
● MoI has intermediate influence since MoI can provide direction on the use of energy efficiency in the industry sector
● MoI is involved directly to the energy issue 5 Ministry of
Transportation
National
Government -
Technical
Ministry
● No direct or daily basis coordination and no power to decide the project
● MoT can provide inputs on sustainable transportation development
● MoT is involved directly to the energy issue
6 Ministry of Finance National
Government -
Technical
Ministry
● No direct or daily basis coordination and no power to decide the project
● MoF holds a role in building financing mechanisms for renewable energy and energy efficiency which is important in triggering the development of EE and RE at the local level.
Secondary Actors
7 Ministry of National
Development and
Planning
(BAPPENAS)
National
Government
● BAPPENAS has a role in conceptualizing energy programs to the national development plan
● However, BAPPENAS has less influential power to direct the project
● BAPPENAS will occasionally be present in the project 8 Coordinating Ministry
for Economic Affairs
(CMEA)
National
Government –
coordinating
ministry
● Their presence is important to identify multi-level governance due to their role as a coordinator of the energy management

renewablesroadmap.iclei.org 39 Energy Situational and Stakeholder Analysis
9 Coordinating Ministry
for Maritime Affairs
(CMMA)
National
Government –
coordinating
ministry
● Their presence is important to identify multi-level governance due to their role as a coordinator of the energy resource management
10 National Energy
Council (DEN)`
National
Government
● Although the DEN has a major role in determining energy direction, for this project, the DEN has only a light involvement in the project.
11 Ministry of
Environment and
Forestry (MoEF)
National
Government
● As the focal point of CC mitigation, the involvement of MoEF in the project is needed although it is only a light involvement. Their presence is needed in the project to understand multi-level coordination in the energy sector.
12 Ministry of State-
Owned Enterprises
(MSOE)
National
Government –
coordinating
ministry
● The presence of MSOC is needed in the project to understand the multi-level coordination in the energy sector, especially to the activities related to PERTAMINA and PT. PLN.
13 Ministry of Public
Works and Human
Settlement (MPWHS)
National
Government
● MPWH holds a role to assist in energy infrastructure development. The relation of the ministry to the project is less intense than that of the Ministry of Energy. The presence of MPWHS is needed in the project to understand the multi-level coordination in the energy sector.
14 Academe University ● The contribution of the academe is needed to understand the energy gap and problems that have been identified before.
15 NGOs CSO ● The contribution of NGOs is needed to understand the energy gap and problems that have been identified before.
16 Society Public Society ● The role of society is important in terms of energy development. Their presence is also useful to collect inputs and feedback for this project on the RE and EE development, especially for policy development. They will only be involved in a series of workshops to be held to map out local barriers and promote commitment for RE and EE.
17 Private Energy
Sectors
Private sectors ● The private energy sector will be involved in the project as the resource person in the series of workshops. Their inputs will be used when developing energy vision and programs. Nevertheless, their involvement is temporary.
18 Banks State and
Private sectors
● Since RE and EE may be a new issue for banks, the presence of banks is essential in the process of project implementation, especially to mainstream and to obtain their feedback/inputs on RE and EE financing mechanisms/systems. Nevertheless, they will not be actively engaged in this project.

renewablesroadmap.iclei.org xiii Energy Situational and Stakeholder Analysis
References
[1] Directorate General for Climate Change Control, "Implementation Strategy of Nationally
Determined Contribution (NDC)," 2017.
[2] Republic of Indonesia, "Government Regulation No. 22/2017 on the National General Energy
Policy (RUEN/NGEP)," 2017. [Online]. Available:
https://www.esdm.go.id/assets/media/content/content-rencana-umum-energi-nasional-
ruen.pdf. [Accessed 2020].
[3] I. E. Agency, "Exploring the impacts of the Covid-19 pandemic on global energy markets, energy
resilience, and climate change," International Energy Agency, 2020. [Online]. Available:
https://www.iea.org/topics/covid-19.
[4] PLN, "Electricity Provision Plan 2019-2028," PLN, 2019.
[5] PWC, "Power Guide 2018," PWC, 2018.
[6] Republic of Indonesia, "Government Regulation No. 79/2014 on the National Energy Policy
(KEN)," 2014. [Online]. Available: https://jdih.esdm.go.id/index.php/web/result/186/detail.
[Accessed 2020].
[7] Ministry of Energy and Mineral Resources, "Energy Conservation Policy and Program in
Indonesia," 2018. [Online]. Available: https://www.jase-w.eccj.or.jp/indonesiaforum/pdf/10-
05_hariyanto.pdf. [Accessed 2020].
[8] Ministry of Energy and Mineral Resources, "Handbook of Energy and Economic Statistics of
Indonesia," 2018. [Online]. Available: https://www.esdm.go.id/assets/media/content/content-
handbook-of-energy-and-economic-statistics-of-indonesia-2018-final-edition.pdf. [Accessed
2020].
[9] Ministry of Finance, "Informasi APBN 2016," 2016. [Online]. Available: http://www.data-
apbn.kemenkeu.go.id/Publications/ambilFileDariDisk/21. [Accessed 2020].
[10] F. Mahiddin and S. Aziz, "ICLG Indonesia: oil and gas regulations 2019," 2020. [Online]. Available:
https://iclg.com/practice-areas/oil-and-gas-laws-and-regulations/indonesia.
[11] P. Tharakan, "Summary of Indonesia's Energy Sector Assessment," 2015. [Online]. Available:
https://www.adb.org/sites/default/files/publication/178039/ino-paper-09-2015.pdf.
[12] Patria Energy, "Patria Energy, Map of Coal Reserves in Indonesia," 2018. [Online]. Available:
https://patriaenergycoal.wordpress.com/category/coal-mines/.
[13] BPPT, "Outlook Energi Indonesia 2018," 2018. [Online]. Available:
https://d1io3yog0oux5.cloudfront.net/_d7a71c03e5d9d1d6e246eb7c02ef1111/continentalener
gy/db/337/2200/pdf/BPPT+Outlook+Energi+Indonesia+2018.
[14] Ministry of Energy and Mineral Resources, "Data dan Informasi Konservasi Energi," 2018. [Online].
Available: https://drive.esdm.go.id/wl/?id=gsosgQED5UkwyBActHlnzHrr1MUX0fWC.
[15] Directorate General of Electricity, "Electrification Statistics 2018," Directorate General of
Electricity, 2019.

renewablesroadmap.iclei.org xiv Energy Situational and Stakeholder Analysis
[16] National Energy Council, "Indonesia Energy Outlook 2019," 2019. [Online]. Available:
https://www.esdm.go.id/assets/media/content/content-indonesia-energy-outlook-2019-english-
version.pdf.
[17] IESR, "Laporan Status Energi Terbarukan Indonesia," 2019. [Online]. Available:
http://iesr.or.id/wp-content/uploads/2019/07/IESR_Infographic_Status-Energi-Terbarukan-
Indonesia.pdf. [Accessed 2020].
[18] PLN, "RUPTL 2017-2026," 2018. [Online]. [Accessed 2019].
[19] National Energy Council, "Indonesia Energy Outlook 2016," 2016. [Online]. Available:
https://www.esdm.go.id/assets/media/content/content-indonesia-energy-outlook-2016-versi-
inggris-my33nxb.pdf.
[20] World Bank Group, "Globar Solar Atlas Indonesia," 2019. [Online]. Available: https://worldbank-
atlas.s3.amazonaws.com/download/Indonesia/Indonesia_PVOUT_mid-size-map_220x128mm-
300dpi_v20191015.png?AWSAccessKeyId=ASIAS2HACIWTKN76LHHG&Expires=1590484242&Si
gnature=ZTiAdiV9rk01FsknDyx0sc%2B7t8A%3D&x-amz-security-token=IQoJb3JpZ2luX2Vj.
[21] IESR, "Indonesia Clean Energy Outlook 2020," 2019. [Online]. Available:
http://iesr.or.id/pustaka/iceo2020/.
[22] World Bank Group, "Global Wind Atlas," 2020. [Online]. Available:
https://globalwindatlas.info/area/Indonesia.
[23] R. E. a. C. E. Directorate General of Various New, "New, Renewable Energy, and Conservation
Energy Statistics 2016," 2016. [Online]. Available:
https://www.esdm.go.id/assets/media/content/content-statistik-ketenagalistrikan-tahun-
2016.pdf. [Accessed 2020].
[24] IESR, "Beyond Connections: Meningkatkan Kualitas Akses Energi di Indonesia," 2019. [Online].
Available: http://iesr.or.id/pustaka/beyond-connections-meningkatkan-kualitas-akses-energi-di-
indonesia/#. [Accessed 2020].
[25] Republic of Indonesia, "Law No 30/2007 on Energy," 2007. [Online]. Available:
https://jdih.esdm.go.id/peraturan/uu-30-2007.pdf. [Accessed 2020].
[26] Republic of Indonesia, "Electricity law No. 30/2009," 2009. [Online]. Available:
https://gatrik.esdm.go.id/assets/uploads/download_index/files/9ef73-03.uu-30-2009-tentang-
ketenagalistrikan.pdf. [Accessed 2020].
[27] Republic of Indonesia, "Government Regulation No. 70/2009 on Energy Conservation," 2009.
[Online]. Available: https://jdih.esdm.go.id/peraturan/PP%20No.%2070%20Thn%202009.pdf.
[28] B. Saputro, "Pembiayaan Energi Terbarukan: Solusi Atas Membengkaknya Subsidi Energi,"
Ministry of Finance, [Online]. Available: https://www.kemenkeu.go.id/media/4464/pembiayaan-
energi-terbarukan-solusi-atas-membengkaknya-subsidi-energi.pdf.
[29] ICLEI and IESR, "Peran Perencanaan Energi Nasional Dorong Ambisi Mitigasi Perubahan Iklim,"
2020. [Online]. Available: https://www.youtube.com/watch?v=qoM2u0UUTNA.