energy security:Layout 1pmt.physicsandmathstutor.com/download/Geography/A-level...4 ippr|...
25
WWW.IPPR.ORG EnergySecurity intheUK AnipprFactFile ByJennyBird August2007 ©ippr2007 InstituteforPublicPolicyResearch Challengingideas– Changingpolicy
Transcript of energy security:Layout 1pmt.physicsandmathstutor.com/download/Geography/A-level...4 ippr|...

WWW.IPPR.ORG
Energy�Security�in�the�UKAn�ippr�FactFile
By�Jenny�Bird
August�2007
©�ippr�2007
Institute�for�Public�Policy�ResearchChallenging�ideas�– Changing�policy
ippr�|�Energy�Security�in�the�UK:�an�ippr�FactFile2
Contents
About�ippr .................................................................................................................................................................................. 3Acknowledgements.....................................................................................................................................................................3About�the�author....................................................................................................................................................................... 3About�this�paper� ....................................................................................................................................................................... 3Glossary .......................................................................................................................................................................................4Executive�summary.................................................................................................................................................................... 5
1.�Introduction ........................................................................................................................................................................... 6
2.�Use�of�fossil�fuels�in�the�UK ................................................................................................................................................. 6Oil�–�keeping�the�UK�moving................................................................................................................................................. 6Gas�–�jack�of�all�trades ........................................................................................................................................................... 7Coal�–�keeping�the�lights�on .................................................................................................................................................. 8Summary............................................................................................................................................................................... 10
3.�Global�context...................................................................................................................................................................... 10Oil ......................................................................................................................................................................................... 10�Gas........................................................................................................................................................................................ 12Coal�...................................................................................................................................................................................... 12Summary............................................................................................................................................................................... 12
4.�Threats�to�UK�energy�security ............................................................................................................................................ 13Import�dependency�and�supply�disruption .......................................................................................................................... 13Power�station�closures.......................................................................................................................................................... 13Price�volatility ........................................................................................................................................................................14Peak�oil�and�gas ....................................................................................................................................................................14Transportation�and�infrastructure ..........................................................................................................................................14The�global�context.................................................................................................................................................................15Summary............................................................................................................................................................................... 15
5.�Possible�solutions�and�barriers ........................................................................................................................................... 15Ensure�security�of�supply�of�fossil�fuels�with�climate�change�in�mind ................................................................................ 15Alternatives�to�fossil�fuels..................................................................................................................................................... 17Demand�reduction................................................................................................................................................................ 19Summary............................................................................................................................................................................... 20
6.�Conclusion............................................................................................................................................................................ 20
References................................................................................................................................................................................ 21
Annex�I��Cumulative�global�investment�in�energy�infrastructure�in�the�IEA’s�reference�scenario�(business�as�usual)�by�fuel�and�activity,�2005–2030�(2005�prices ....................................................................................................................... 24
Annex�II�Approximate�conversion�factors�for�weight,�volume�and�calorific�content�for�crude�oil,�natural�gas,�liquid�natural�gas�and�coal�........................................................................................................................................ 24

ippr�|�Energy�Security�in�the�UK:�an�ippr�FactFile3
The�Institute�for�Public�Policy�Research�(ippr)�is�the�UK’s�leadingprogressive�think�tank,�producing�cutting-edge�research�andinnovative�policy�ideas�for�a�just,�democratic�and�sustainable�world.
Since�1988,�we�have�been�at�the�forefront�of�progressive�debateand�policymaking�in�the�UK.�Through�our�independent�research�andanalysis�we�define�new�agendas�for�change�and�provide�practicalsolutions�to�challenges�across�the�full�range�of�public�policy�issues.
With�offices�in�both�London�and�Newcastle,�we�ensure�our�outlookis�as�broad-based�as�possible,�while�our�international�and�migrationteams�and�climate�change�programme�extend�our�partnerships�andinfluence�beyond�the�UK,�giving�us�a�truly�world-class�reputation�forhigh�quality�research.
ippr30-32�Southampton�Street,�Covent�Garden,�London�WC2E�7RATel:�+44�(0)20�7470�[email protected]�Charity�No.�800065
This�paper�was�first�published�in�July�2007.�©�ippr�2007
About�ippr
This�FactFile�comes�from�ippr’s�Low�Carbon�Britain�Post-2010project.�It�aims�solely�to�review�the�existing�literature�on�energysecurity.�Our�policy�recommendations�will�be�published�in�a�separatereport�later�this�year.
About�this�paper
The�Institute�for�Public�Policy�Research�(ippr)�is�very�grateful�for�thefinancial�support�provided�to�its�Low�Carbon�Britain�Post-2010project�by�the�Greenpeace�Environmental�Trust,�Johnson�MattheyFuel�Cells�and�the�Royal�Society�for�the�Protection�of�Birds,�and�thecore�funders�of�the�two-year�Low�Carbon�Programme:�the�EsmeeFairbairn�Foundation,�Shell�International,�CE�Electric,�the�AshdenTrust,�WWF-UK�and�E.ON�UK.�Without�their�willingness�tocontribute�to�our�research,�this�project�could�not�have�beenundertaken.
The�findings�of�this�research�are,�however,�the�responsibility�ofthe�author�alone�and�do�not�necessarily�represent�the�views�ofour�funding�partners�or�any�other�individual�or�organisationinvolved�in�the�project.
The�author�would�like�to�thank�Bridget�Woodman,�WarwickUniversity;�Nick�Mabey,�E3G;�John�Mitchell�and�Beverley�Darkin,Chatham�House;�Sonia�Brown,�Ofgem;�Kirsty�Hamilton,�UKBCSE;Matthew�Lockwood,�Ian�Kearns,�Simon�Retallack,�Georgina�Kyriacouand�Raquel�Alvarez,�ippr�for�their�helpful�comments,�advice�andsupport.�Any�omissions�and�errors�remain�the�author’s�own.
Acknowledgements
Jenny�Bird�is�a�researcher�with�the�sustainability�team�at�ippr.�She�isthe�co-author�of�ippr’s�reports�on�attitudes�towards�road�pricing,Steering�Through�Change�(2006)�and Charging�Forward�(2006)�andis�working�on�the�Low-Carbon�Britain�Post-2010�project.�
Prior�to�joining�ippr,�Jenny�worked�for�the�Environment�Agency.�Shehas�a�Masters�degree�in�Sustainable�Development�from�Forum�forthe�Future.
About�the�author

ippr�|�Energy�Security�in�the�UK:�an�ippr�FactFile4
APEC Asia-Pacific�Economic�Cooperation
bcm Billion�cubic�metres
CCL Climate�Change�Levy
CCS Carbon�capture�and�storage
CHP Combined�heat�and�power
CNG Compressed�natural�gas
CO2 Carbon�dioxide
CTL Coal�to�liquid
Developing�Asia Afghanistan,�Bangladesh,�Bhutan,�Brunei,�Cambodia,�China,�Chinese�Taipei,�Fiji,�French�Polynesia,�India,�Indonesia,�Kiribati,�Democratic� People’s�Republic�of�Korea,�Laos,�Macau,�Malaysia,�Maldives,�Mongolia,�Myanmar,�Nepal,�New�Caledonia,�Pakistan,�Papua�New�Guinea,�Philippines,�Samoa,�Singapore,�Solomon�Islands,�Sri�Lanka,�Thailand,�Tonga,�Vietnam,�Vanuatu
EIA Energy�Information�Administration
EU�ETS European�Union�Emissions�Trading�Scheme
GWh Giga�Watt�Hour
IEA International�Energy�Agency
LCPD Large�Combustion�Plant�Directive
LNG Liquid�natural�gas
LPG Liquid�petroleum�gas
m3 Cubic�metre
mcm Million�cubic�metres
NOx Nitrogen�oxide�
OECD Organization�for�Economic�Co-operation�and�Development
OECD�Europe Austria,�Belgium,�Czech�Republic,�Denmark,�Finland,�France,�Germany,�Greece,�Hungary,�Iceland,�Ireland,�Italy,�Luxembourg,�Netherlands,�Norway,�Poland,�Portugal,�Slovak�Republic,�Spain,�Sweden,�Switzerland,�Turkey,�United�Kingdom
OLADE Organizacion�Latinoamericana�de�Energia
OPEC Organization�of�the�Petroleum�Exporting�Countries
Pa Pascal�
RTFO Renewable�Transport�Fuel�Obligation
SO2 Sulphur�dioxide
UKCS UK�Continental�Shelf
UNSD United�Nations�Statistics�Division
Tables�showing�the�factors�for�converting�the�weight,�volume�and�calorific�content�for�oil,�gas�and�coal�are�contained�in�Annex�II.��
Glossary

ippr�|�Energy�Security�in�the�UK:�an�ippr�FactFile5
Executive�summary
The�Energy�White�Paper,�published�in�May�2007,�highlighted�energysecurity�and�mitigating�climate�change�as�the�two�major�challengesfacing�the�energy�sector�in�the�UK.�This�FactFile�assesses�the�energysecurity�challenges�facing�the�UK’s�electricity,�transport�and�heatingsectors.�It�goes�on�to�outline�potential�solutions,�the�barriers�to�theirimplementation,�and�their�impact�on�efforts�to�reduce�greenhousegas�emissions.
The�issue�of�energy�security�is�currently�receiving�a�lot�of�attention�inthe�UK.�Dwindling�oil�and�gas�reserves�in�the�North�Sea�and�theimpending�closure�of�a�number�of�power�stations�have�focusedattention�on�the�problem�of�ensuring�the�lights�do�not�go�out.�Butenergy�security�is�not�just�about�electricity.�Transport�accounts�foralmost�all�of�our�oil�use�and�a�greater�proportion�of�natural�gas�isused�in�the�domestic�and�commercial�sectors�(mainly�for�heating)than�is�used�to�generate�electricity.�This�means�that�disruption�of�gasand�oil�supplies�could�leave�us�cold�and�stationary,�as�well�as�in�thedark.
The�UK�is�rapidly�moving�from�a�position�of�relative�self-sufficiencyto�one�of�import-dependence�for�oil,�gas�and�coal.�At�present,�mostof�our�oil�and�gas�imports�are�from�Norway.�In�the�future�Russia,�theCaspian�region,�West�and�North�Africa�and�the�Middle�East�are�likelyto�become�more�important�sources�of�imports.�Coal�is�imported�froma�more�diverse�range�of�countries;�among�these,�South�Africa�andRussia�provide�the�largest�amounts.�
Although�the�UK’s�transition�to�dependency�is�perhaps�occurringmore�quickly�than�in�some�other�countries,�the�situation�is�similaracross�Europer.�The�story�is�one�of�increasing�dependence�onimported�energy.�Globally,�demand�for�energy�is�rising�–�particularlyfrom�India�and�China�–�and�this�leads�to�questions�about�whethersupply�will�be�able�to�meet�demand�in�the�future.�This�uncertainty�isfounded�on�concerns�about�achieving�the�required�level�ofinvestment,�geo-political�tensions,�and,�more�fundamentally,�ondoubts�about�the�accuracy�of�reporting�on�the�size�of�reserves.
The�UK�faces�both�short-term�and�longer-term�threats�to�its�energysecurity,�which�are�quite�different�from�one�another�in�nature.�Thegreatest�short-term�threat�is�the�risk�of�disruption�to�gas�suppliesfrom�mainland�Europe.�Exposure�to�Russian�gas�in�particular�isviewed�as�a�problem.�Oil�price�volatility�may�also�pose�a�short-termrisk,�although�the�UK’s�oil�use�appears�to�be�fairly�unresponsive�tohigher�prices�at�the�moment.
In�the�medium�term,�the�planned�closure�of�a�number�of�coal-firedand�nuclear�power�stations�has�lead�to�concerns�about�how�thisgenerating�capacity�will�be�replaced.�The�Government�has�estimatedthat�this�will�amount�to�a�‘gap’�equivalent�to�around�30�per�cent�oftoday’s�existing�capacity�(DTI�2006a).�In�practice�it�is�likely�that�newcapacity�that�gets�built�before�2015�will�consist�mostly�of�gas-�andcoal-fired�stations�as�well�as�some�wind�farms,�but�longer-term�plansare�less�clear.
In�the�long�term�the�fundamental�concerns�are�about�whether�supplywill�be�able�to�meet�demand,�for�the�reasons�mentioned�above.
However,�proponents�of�the�‘peak�oil’�analysis�suggest�that�we�mightreach�this�point�sooner�than�has�previously�been�expected.�This�couldhave�particularly�serious�consequences�for�climate�change.�Pressureon�oil�supplies�resulting�in�high�oil�prices�would�make�non-conventional�sources�of�oil�(such�as�oil�sands,�extra-heavy�oil,�oilshale�and�coal-to-oil)�more�economic�to�produce.�Extraction�andcombustion�of�all�of�these�non-conventional�sources�is�highlycarbon-intensive�and�so�would�result�in�an�increased�rate�of�climatechange.�
Clearly�there�is�no�one-size-fits-all�solution�to�these�challenges�andundoubtedly�a�mix�of�policy�measures�will�be�required.�However,�forconvenience,�it�is�useful�to�talk�about�the�potential�solutions�in�termsof�three�main�categories:�ensuring�security�of�supply�of�fossil�fuels(but�keeping�climate�change�in�mind),�finding�alternative�sources�ofenergy�and�reducing�demand�for�energy.�
In�the�first�category,�options�for�the�UK�are�relatively�limited�butinclude�increasing�investment�in�the�UK�Continental�Shelf�tomaximise�oil�and�gas�production�and�continuing�to�push�for�marketliberalisation�in�Europe.�Turning�to�coal�as�a�cheaper�and�more�securefuel�for�electricity�generation�could�increase�energy�security�butwould�come�at�the�cost�of�increasing�carbon�dioxide�(CO2)�emissions.Carbon�capture�and�storage�may�present�one�way�round�thisproblem.
Alternative�sources�of�energy�already�exist�for�electricity�generation,transport�and�heating�although�the�technologies�are�at�differentstages�of�development�and�market�penetration.�Options�forelectricity�generation�include�renewables,�such�as�wind,�solar,�waveand�nuclear�power.�For�transport�the�main�alternative�in�the�nearterm�is�biofuels,�with�hydrogen�presenting�an�option�in�the�longerterm.�For�heating,�biomass�can�be�used�in�dedicated�heat�orcombined�heat�and�power�plants.�Solar�heating,�geothermal�heatingand�heat�pumps�are�other�options.�
Measures�for�energy�reduction�are�also�already�available.�In�theelectricity�sector,�one�important�idea�is�that�of�a�decentralisedsystem�of�combined�heat�and�power�plants.�This�would�have�thedual�benefits�of�more�efficient�use�of�fuel�(since�it�is�used�toproduce�both�electricity�and�heat)�and�reduced�losses�duringtransmission�and�distribution.�For�transport,�using�more�fuel-efficient�vehicles,�changing�our�driving�habits�and�reducing�theoverall�amount�of�transport�would�all�help�to�cut�oil�use.�Finally,�inthe�heating�sector,�better�insulation�and�draught-proofing�inbuildings�would�help�to�reduce�our�use�of�oil.�Clearly,�reduced�useof�fossil�fuels�through�efficiencies�and�the�use�of�alternatives�willalso�reduce�emissions�of�CO2.
Whatever�the�precise�mix�of�measures�taken,�it�is�clear�that�a�radicalshift�is�necessary�in�our�energy�supply�and�use.�The�policy�decisionsmade�by�government�in�the�coming�months�and�years�will�set�thecourse�for�our�energy�use�for�decades�to�come.�Investments�in�newinfrastructure�will�tie�us�to�particular�fuels�and�technologies.�Thechallenge�is�to�set�a�course�that�has�the�vision�to�meet�our�long-termobjectives�and�that�can�achieve�both�security�of�supply�and�securityof�the�climate.

ippr�|�Energy�Security�in�the�UK:�an�ippr�FactFile6
1.�Introduction
Energy�security�is�a�topic�that�features�frequently�in�the�Britishheadlines.�The�issue�is�often�portrayed�as�being�about�the�need�toensure�there�is�enough�electricity�to�‘keep�the�lights�on’,�but�energysecurity�encompasses�a�much�wider�set�of�concerns.�A�balancedpolicy�response�to�the�challenges�of�energy�security�today�needs�toreflect�four�strands�of�debate:�
• Security�of�supply�
• Energy�and�climate�security�
• Infrastructure�protection�and�system�resilience�
• Implications�of�energy�choices�for�foreign�policy�and�defencestrategy.�
This�FactFile�has�been�produced�as�part�of�ippr’s�Low�Carbon�BritainPost-2010�project�and�as�such�focuses�mainly�on�the�first�two�ofthese�strands,�but�further�work�on�the�other�two�areas�will�becarried�out�by�ippr’s�Commission�on�National�Security�in�the�21stCentury1.
Almost�every�aspect�of�our�lives�depends�on�fossil�fuels:�fromrunning�electrical�appliances,�to�heating�our�buildings,�to�thetransport�we�use�to�get�around.�It�is�clear�that�the�UK�is�becomingmore�dependent�on�imports�of�fossil�fuels�as�our�own�reserves�in�theNorth�Sea�decline�and�this,�combined�with�high�gas�and�oil�pricesand�the�looming�closure�of�many�power�stations,�has�ledcommentators�to�express�concern�about�how�we�can�ensure�‘thelights�do�not�go�out’.�We�also�face�the�risk�of�increasing�levels�offuel�poverty,�which�is�linked�to�increased�gas�prices,�and�severedisruption�to�our�transport�systems,�which,�at�present,�are�almostentirely�dependent�on�oil.
These�are�important�concerns�but�they�must�not�be�addressed�atthe�expense�of�global�climate�security.�The�use�of�fossil�fuels�isunder�heavy�scrutiny�amid�efforts�to�mitigate�climate�change,�andthe�UK�Government�has�set�a�target�of�reducing�emissions�by�60per�cent�on�1990�levels�by�2050.�If�this�is�to�be�achieved,�major�cutsin�emissions�will�be�required�across�the�power�generation,�domesticand�transport�sectors.
This�FactFile�aims�to�investigate�whether�there�could�be�synergiesbetween�these�two�agendas.�It�analyses�just�how�‘energy-secure’the�UK�is,�and�explores�how�efforts�to�increase�levels�of�energysecurity�could�also�contribute�to�efforts�to�reduce�carbon�dioxideemissions�and�conversely,�how�increased�energy�security�could�leadto�increased�emissions.
Fossil�fuels�are�at�the�root�of�concerns�about�both�energy�securityand�climate�change�and�so�in�section�2�we�begin�by�looking�at�howthey�are�currently�used�in�the�UK�–�where�they�come�from,�howmuch�is�left�and�what�they�are�used�for.�In�section�3�this�is�put�inthe�context�of�what�is�happening�globally,�in�terms�of�energy�useand�production.�Section�4�highlights�the�key�energy�securityconcerns�for�the�UK�and�the�final�section�provides�an�account�of�thepossible�solutions�and�barriers�to�increased�security�and�what�these
might�mean�for�carbon�dioxide�emissions.
In�drawing�together�the�evidence�we�hope�to�provide�a�usefuloverview�of�the�key�issues�in�the�energy�security�and�climate�changedebates.
2.�Use�of�fossil�fuels�in�the�UK
Around�90�per�cent�of�the�UK’s�demand�for�energy�is�met�fromfossil�fuels�and�they�are�expected�to�remain�the�principal�source�ofenergy�for�the�foreseeable�future�(DTI�2006a).�Different�fuels�areused�for�different�purposes.�Gas�and�coal�fuel�most�of�our�electricityproduction;�heating�needs�are�met�mostly�by�gas,�andtransportation�is�run�on�oil.�This�section�looks�at�the�supply�anddemand�for�each�fuel�in�turn,�as�well�as�current�infrastructure�andprojections�of�future�use.
Oil�–�keeping�the�UK�movingOil�production�and�useBefore�the�1970s,�the�UK�was�dependent�on�imported�oil�to�meetits�needs.�In�the�1970s�however,�indigenous�production�in�the�NorthSea�began�and�by�the�1980s�the�UK�was�a�net�exporter�of�oil.�Thishas�–�more�or�less�–�remained�the�situation�up�until�the�present�day,but�production�from�the�UK�Continental�Shelf�(UKCS)�is�now�indecline.�These�trends�are�depicted�in�Figure�1.
Although�the�UK�is�still�a�net�exporter�of�oil,�there�is�nevertheless�aneed�to�import�a�certain�amount�of�crude�oil,�one�reason�being�that
1.�ippr’s�Commission�on�National�Security�in�the�21st�Century�was�launched�on�23�May�2007.�For�more�information�see�www.ippr.org/events/index.asp?id=2718�
020,00040,00060,00080,000
100,000120,000140,000160,000
1970
1973
1976
1979
1982
1985
1988
1991
1994
1997
2000
2003
Year
Thou
sand
ton
nes
Imports
Indigenousproduction
Exports
Refinerythroughput
Figure�1:�UK�crude�oil�trends,�1970-2005
Source:�DTI�2007a�
-40,000 -20,000 - 20,000 40,000 60,000 80,000 100,000
Motor spirit
Aviation turbine fuel
Burning oil
Gas/diesel oil*
Fuel oils
Total products
Thousand tonnes
Total demand
Exports
Imports
Production
Figure�2:�Supply�and�demand�of�selected�petroleum�productsin�the�UK,�2005
Source:�DTI�2007a�*�includes�marine�diesel�oil

ippr�|�Energy�Security�in�the�UK:�an�ippr�FactFile7
other�crude�oils�contain�a�greater�proportion�of�heavierhydrocarbons�than�North�Sea�oil,�which�are�needed�to�manufacturecertain�petroleum�products�(DTI�2006b).�The�UK�also�has�asignificant�refining�capacity,�although�again�some�petroleumproducts�must�be�imported�where�domestic�production�is�unable�tomeet�demand.�The�most�important�example�of�this�is�aviationturbine�fuel,�as�depicted�in�Figure�2�(DTI�2007a).�In�2005,�importsaccounted�for�62�per�cent�of�UK�consumption�of�this�product�(JESS2006).
Norway�is�the�biggest�supplier�of�oil�imports�to�the�UK�andaccounted�for�75�per�cent�of�imports�in�2005�(DTI�2006b).�Russia,Saudi�Arabia�and�Algeria�are�also�important�producers�for�the�UK(See�Figure�3).�Imports�of�petroleum�products�(aviation�turbine�fuel,motor�spirit�and�gas�oil/diesel)�came�from�France,�Germany,�Kuwait,the�Netherlands,�Saudi�Arabia�and�the�United�Arab�Emirates�in2004.�The�UK�exported�oil�products�to�the�USA,�Belgium,�France,Ireland,�the�Netherlands�and�Spain.�Of�these,�most�(17�per�cent)went�to�the�USA�(DTI�2006b).�
The�vast�majority�of�oil�use�in�the�UK�is�for�transport.�In�2004,�74per�cent�of�petroleum�products�were�used�for�this�purpose�(DTI2006b).�This�reflects�the�fact�that�transport�in�the�UK�is�almostentirely�dependent�on�oil.�In�2005,�petroleum�accounted�for�98.8per�cent�of�energy�consumption�used�for�transportation�(DfT�2006).This�means�that�this�sector�is�particularly�vulnerable�to�oil�supplydisruption.
Other�uses�include�domestic�(especially�for�those�living�in�remoteareas�who�are�not�connected�to�a�gas�network�or�who�require�back-up�generators),�industrial�and�the�energy�sector.�Use�of�oil�togenerate�electricity�has�declined�over�the�last�few�decades�as�gashas�become�the�fuel�of�choice�for�electricity�generators.�However,there�was�an�increase�in�oil�use�in�this�sector�in�the�winter�of�2004,owing�to�high�gas�prices�(DTI�2006b).
Oil�infrastructureThe�UK�has�nine�major�and�three�minor�oil�refineries�with�a�totaldistillation�capacity�of�92�million�tonnes�(DTI�2006b).�The�refineriessupply�approximately�50�major�oil�terminals�by�pipeline,�rail�and�sea.There�is�a�network�of�around�3,000�miles�of�oil�pipelines�in�the�UK,around�1,500�miles�of�which�is�privately�owned.�The�remainder�isused�by�the�Government�to�supply�oil�to�airfields�(UKPIA�2006).
Under�EU�law,�the�UK�must�hold�at�least�67.5�days’�worth�of�oilstocks�in�case�of�emergency.�This�figure�will�increase�as�domesticproduction�falls.�In�order�to�comply�with�this,�the�Governmentplaces�an�obligation�on�oil�companies�to�maintain�oil�stocks�(JESS2006,�DTI�2006a).
Future�oil�production�and�useBecause�of�the�decline�in�the�production�of�oil�from�the�UKContinental�Shelf�since�its�peak�in�1999,�the�UK�will�not�remain�anet�exporter�of�oil�for�much�longer.�It�is�predicted�that�it�willbecome�a�net�importer�by�around�2010.�Norway�is�already�a�keysupplier�of�imported�oil�to�the�UK�and�is�likely�to�remain�so�in�thefuture,�but�it�is�likely�that�Russia,�the�Caspian�region,�West�Africa,North�Africa�and�the�Middle�East�will�also�increase�supplies�as�theUK�comes�to�rely�more�and�more�on�imports�(JESS�2006).
Gas�–�jack�of�all�tradesGas�production�and�useGas�has�become�a�much�more�important�component�of�the�UK’senergy�mix�since�the�‘dash�for�gas’�in�the�1980s�and�90s�(see�Figure4).�Much�of�this�consumption�was�due�to�fuel�switching�inelectricity�production�away�from�coal�and�oil.�However,�gasproduction�from�UK�North�Sea�sites�peaked�in�1999�and�is�nowdeclining.�In�2004,�the�UK�became�a�net�importer�of�gas�(DTI2005).
Figure�5�shows�that�in�2005,�most�of�the�UK’s�gas�imports�werefrom�Norwegian�North�Sea�gas�fields.�A�significant�proportion�wasalso�piped�through�the�UK-Belgium�interconnector�betweenZeebrugge�in�Belgium�and�Bacton�in�Norfolk�.�This�source�of�gas�isparticularly�important�for�meeting�peak�demand�during�the�colderwinter�months.�Smaller�amounts�came�from�Algeria�and�Trinidad�and
-
5,000
10,000
15,000
20,000
25,000
30,000
35,000
40,000
45,000
2000 2001 2002 2003 2004 2005
Year
Thou
sand
ton
nes
Norway
Russia
Saudi Arabia
Algeria
Total othercountries*
Figure�3:�UK�imports�of�oil�by�country�of�origin,�2000-2005
Source:�DTI�2006*�Angola,�Latvia,�Libya,�Lithuania,�Mexico,�Netherlands,�Nigeria,Venezuela�and�other
- 200,000 400,000 600,000 800,000
1,000,000 1,200,000 1,400,000
1970
1973
1976
1979
1982
1985
1988
1991
1994
1997
2000
2003
Year
GW
h
Total UKproduction
Imports
Exports
Consumption
Figure�4:�UK�production�and�consumption�of�natural�gas,1970-2005
Source:�DTI�2007a
0
2000
4000
6000
8000
10000
12000
14000
Jan
Feb
Mar Apr
May Ju
n Jul
Aug Sep
Oct NovDec
Month
GW
h
via Belgium
Norway
Algeria
Trinidad
Figure�5:�UK�imports�of�gas�by�country/inter�connector,�2005
Source:�DTI�2007b�

ippr�|�Energy�Security�in�the�UK:�an�ippr�FactFile8
Tobago,�shipped�as�liquid�natural�gas�(LNG).
A�total�of�39�per�cent�of�the�UK’s�electricity�is�produced�in�gas-firedstations,�but�as�Figure�6�demonstrates,�this�only�accounts�for�30�percent�of�the�total�gas�demand�(DTI�2007a).�The�greatest�demand�isactually�from�the�domestic�sector,�where�gas�is�used�primarily�forspace�and�water�heating.�The�fact�that�the�majority�of�our�gas�use�isfor�heating�has�important�implications�for�the�debate�on�security�ofgas�supplies�and�potential�alternatives�as�this�often�focuses�onelectricity�generation�only.�It�is�estimated�that�approximately�75�percent�of�the�UK’s�heat�needs�are�met�by�gas�delivered�through�thenational�grid.�Disruption�to�gas�supplies�that�results�in�increased�gasprices�could�have�important�implications,�particularly�with�regard�tofuel�poverty,�where�higher�costs�could�increase�the�number�ofpeople�who�are�unable�to�afford�to�heat�their�homes�adequately(DTI�2006a).2
Gas�infrastructureThere�are�three�major�pipelines�to�import�foreign�gas�into�the�UK:the�Belgian�interconnector�and�new�pipelines�from�the�Netherlandsand�the�Norwegian�Ormen�Lange�gas�field.�This�new�import�capacitycould�potentially�supply�35�per�cent�of�annual�UK�gas�consumption(DTI�2006d).�There�is�currently�only�one�LNG�terminal,�on�the�Isle�ofGrain,�north�Kent,�which�has�the�potential�to�deliver�up�to�17�mcmper�day�(approximately�4�per�cent�of�the�averaged�national�supply)(DTI�2006d).�However,�three�more�are�under�construction,�two�inMilford�Haven,�South�Wales�and�one�on�Teeside;�several�others�havebeen�proposed�and�are�awaiting�planning�decisions�(Ofgem�2006a,JESS�2006).
The�UK�currently�has�about�4300�mcm�of�gas�storage�capacity�(DTI2006d).�A�new�gas�storage�facility�was�recently�completed�inHampshire,�which�has�a�capacity�of�315�mcm.�Two�more�are�underdevelopment�and�at�least�four�more�are�proposed,�subject�toplanning�(Ofgem�2006a,�JESS�2006).
Future�gas�production�and�useThe�UK�will�become�more�dependent�on�imports�to�meet�its�gasdemand�in�the�future.�In�its�Energy�Review,�the�Department�ofTrade�and�Industry�(DTI)�projected�that�up�to�80-90�per�cent�of�theUK’s�gas�would�be�imported�by�2020.�Most�of�this�is�expected�tocontinue�to�come�from�Norway�along�with�LNG�from�Algeria�andQatar.�In�the�long�term,�Russia,�the�Caspian�Sea�region�and�Nigeriaare�also�likely�to�become�important�providers�of�gas�to�the�UK�(DTI2006a).
Reliance�on�NorwayAs�we�have�seen,�most�of�the�UK’s�oil�and�gas�imports�come�fromNorway.�It�is�expected�that�Norwegian�gas�and�oil�will�continue�tomeet�the�UK’s�fossil�fuel�needs�in�the�immediate�future,�as�UKproduction�decreases.�Projections�from�the�Norwegian�PetroleumDirectorate�anticipate�a�total�of�4.7�billion�m3 oil�equivalent�to�beproduced�from�Norwegian�fields�over�the�next�20�years.�Oilproduction�is�expected�to�peak�in�2008,�but�gas�sales�are�predictedto�rise�to�around�120�billion�m3 per�year�in�2011�(NorwegianPetroleum�Directorate�2005).�
Coal�–�keeping�the�lights�onThe�amount�of�coal�mined�in�the�UK�has�steadily�declined�since�the1970s�(with�a�sharp�drop�in�production�in�1984�due�to�industrialaction).�Figure�7�(below)�shows�the�trends�in�production�andconsumption�of�coal�over�the�last�few�decades.�
Despite�having�relatively�large�reserves�of�coal,�the�UK�is�a�netimporter;�more�than�70�per�cent�of�demand�was�met�by�imports�in2005�(JESS�2006).�The�reasons�for�this�are�primarily�economic;�mostUK�reserves�are�either�low-quality�or�occur�in�narrow�seams�that�areexpensive�to�produce.�Estimations�of�UK�coal�reserves�for�existingmines�show�70�million�tonnes�remaining�in�deep�mines�by�2020�andreserves�in�surface�mines�being�depleted�between�2010�and�2020.Around�another�400�million�tonnes�of�recoverable�coal�is�thought�toexist�in�the�UK,�but�this�would�require�new�mines�to�be�built�orsignificant�investment�in�existing�mines�(DTI�2006a).�To�put�thesefigures�in�context,�total�inland�coal�consumption�of�coal�in�the�UK�in2005�was�61.9�thousand�tonnes�(DTI�2007a).�However,�it�is�worthreiterating�that�the�figures�for�the�estimated�remaining�coal�reservesare�price-dependent.
2.�According�to�the�UK�Government’s�definition,�a�household�is�said�to�be�in�fuel�poverty�if�it�needs�to�spend�more�than�10�per�cent�of�its�income�on�fuel�to�maintain�asatisfactory�heating�regime�(usually�21�degrees�for�the�main�living�area,�and�18�degrees�for�other�occupied�rooms)�(DTI�2007c).
30%
2%
8%
1%
13%
33%
8%
2%
2%
1%
Electricity generation
Heat generation
Energy industry use*
Losses
Industry
Domestic
Public administrationand commercial
Agriculture
Miscellaneous
Non energy use
Figure�6:�UK�use�of�natural�gas,�2005
Source:�DTI�2006c*excluding�electricity�generation
-
20,000
40,000
60,000
80,000
100,000
120,000
140,000
160,000
180,000
1970
1973
1976
1979
1982
1985
1988
1991
1994
1997
2000
2003
Year
Thou
sand
ton
nes
Totalproduction
Imports
Exports
Total coalstocks
Figure�7:�UK�production�and�consumption�of�coal
Source:�DTI�2007a
ippr�|�Energy�Security�in�the�UK:�an�ippr�FactFile9
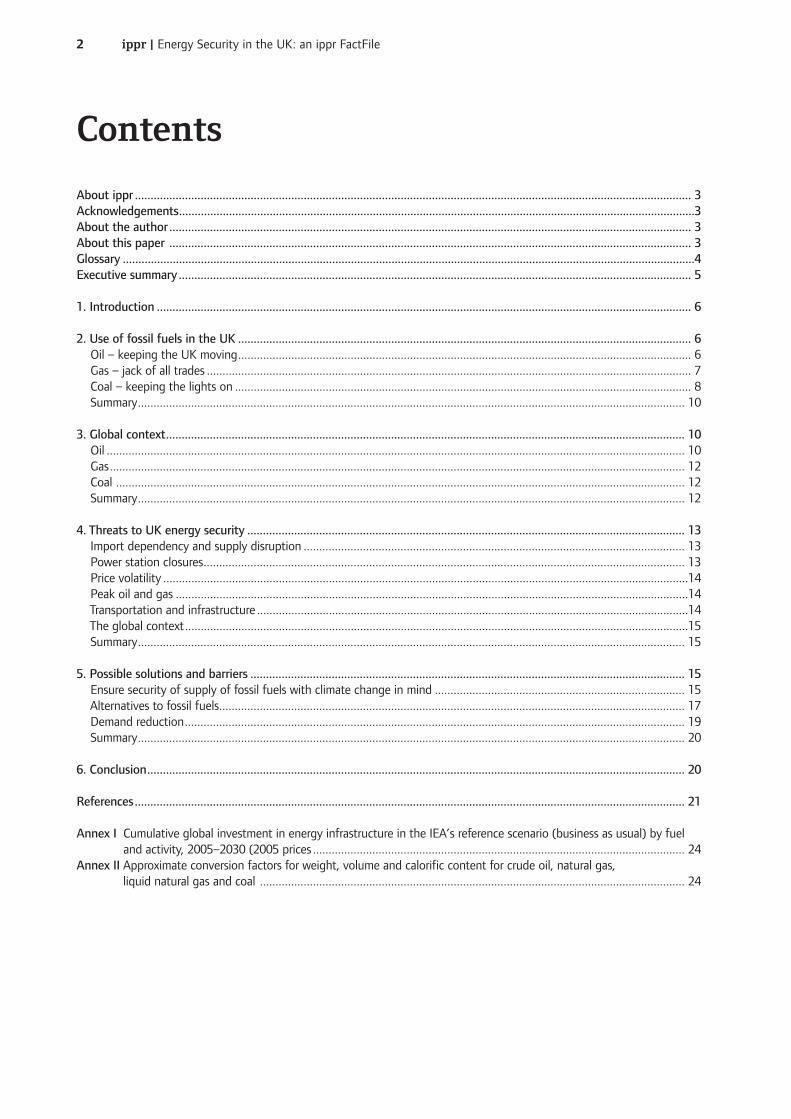
In�2004,�coal�was�imported�from�a�diverse�mix�of�countries,�with�thelargest�proportions�coming�from�Russia�and�South�Africa�(depictedin�Figure�8).
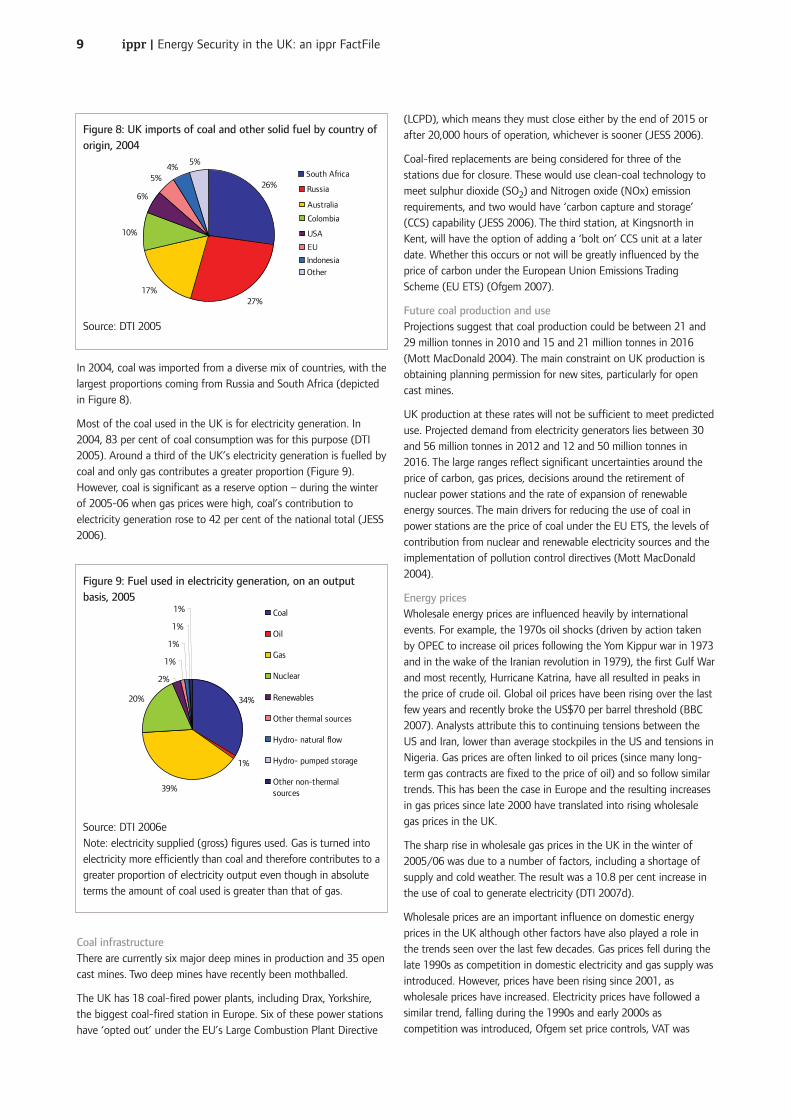
Most�of�the�coal�used�in�the�UK�is�for�electricity�generation.�In2004,�83�per�cent�of�coal�consumption�was�for�this�purpose�(DTI2005).�Around�a�third�of�the�UK’s�electricity�generation�is�fuelled�bycoal�and�only�gas�contributes�a�greater�proportion�(Figure�9).However,�coal�is�significant�as�a�reserve�option�–�during�the�winterof�2005-06�when�gas�prices�were�high,�coal’s�contribution�toelectricity�generation�rose�to�42�per�cent�of�the�national�total�(JESS2006).
Coal�infrastructureThere�are�currently�six�major�deep�mines�in�production�and�35�opencast�mines.�Two�deep�mines�have�recently�been�mothballed.
The�UK�has�18�coal-fired�power�plants,�including�Drax,�Yorkshire,the�biggest�coal-fired�station�in�Europe.�Six�of�these�power�stationshave�‘opted�out’�under�the�EU’s�Large�Combustion�Plant�Directive
(LCPD),�which�means�they�must�close�either�by�the�end�of�2015�orafter�20,000�hours�of�operation,�whichever�is�sooner�(JESS�2006).�
Coal-fired�replacements�are�being�considered�for�three�of�thestations�due�for�closure.�These�would�use�clean-coal�technology�tomeet�sulphur�dioxide�(SO2)�and�Nitrogen�oxide�(NOx)�emissionrequirements,�and�two�would�have�‘carbon�capture�and�storage’(CCS)�capability�(JESS�2006).�The�third�station,�at�Kingsnorth�inKent,�will�have�the�option�of�adding�a�‘bolt�on’�CCS�unit�at�a�laterdate.�Whether�this�occurs�or�not�will�be�greatly�influenced�by�theprice�of�carbon�under�the�European�Union�Emissions�TradingScheme�(EU�ETS)�(Ofgem�2007).
Future�coal�production�and�useProjections�suggest�that�coal�production�could�be�between�21�and29�million�tonnes�in�2010�and�15�and�21�million�tonnes�in�2016(Mott�MacDonald�2004).�The�main�constraint�on�UK�production�isobtaining�planning�permission�for�new�sites,�particularly�for�opencast�mines.
UK�production�at�these�rates�will�not�be�sufficient�to�meet�predicteduse.�Projected�demand�from�electricity�generators�lies�between�30and�56�million�tonnes�in�2012�and�12�and�50�million�tonnes�in2016.�The�large�ranges�reflect�significant�uncertainties�around�theprice�of�carbon,�gas�prices,�decisions�around�the�retirement�ofnuclear�power�stations�and�the�rate�of�expansion�of�renewableenergy�sources.�The�main�drivers�for�reducing�the�use�of�coal�inpower�stations�are�the�price�of�coal�under�the�EU�ETS,�the�levels�ofcontribution�from�nuclear�and�renewable�electricity�sources�and�theimplementation�of�pollution�control�directives�(Mott�MacDonald2004).�
Energy�pricesWholesale�energy�prices�are�influenced�heavily�by�internationalevents.�For�example,�the�1970s�oil�shocks�(driven�by�action�takenby�OPEC�to�increase�oil�prices�following�the�Yom�Kippur�war�in�1973and�in�the�wake�of�the�Iranian�revolution�in�1979),�the�first�Gulf�Warand�most�recently,�Hurricane�Katrina,�have�all�resulted�in�peaks�inthe�price�of�crude�oil.�Global�oil�prices�have�been�rising�over�the�lastfew�years�and�recently�broke�the�US$70�per�barrel�threshold�(BBC2007).�Analysts�attribute�this�to�continuing�tensions�between�theUS�and�Iran,�lower�than�average�stockpiles�in�the�US�and�tensions�inNigeria.�Gas�prices�are�often�linked�to�oil�prices�(since�many�long-term�gas�contracts�are�fixed�to�the�price�of�oil)�and�so�follow�similartrends.�This�has�been�the�case�in�Europe�and�the�resulting�increasesin�gas�prices�since�late�2000�have�translated�into�rising�wholesalegas�prices�in�the�UK.
The�sharp�rise�in�wholesale�gas�prices�in�the�UK�in�the�winter�of2005/06�was�due�to�a�number�of�factors,�including�a�shortage�ofsupply�and�cold�weather.�The�result�was�a�10.8�per�cent�increase�inthe�use�of�coal�to�generate�electricity�(DTI�2007d).
Wholesale�prices�are�an�important�influence�on�domestic�energyprices�in�the�UK�although�other�factors�have�also�played�a�role�inthe�trends�seen�over�the�last�few�decades.�Gas�prices�fell�during�thelate�1990s�as�competition�in�domestic�electricity�and�gas�supply�wasintroduced.�However,�prices�have�been�rising�since�2001,�aswholesale�prices�have�increased.�Electricity�prices�have�followed�asimilar�trend,�falling�during�the�1990s�and�early�2000s�ascompetition�was�introduced,�Ofgem�set�price�controls,�VAT�was
26%
27%17%
10%
6%
5%4%
5%
South Africa
Russia
Australia
Colombia
USA
EU
IndonesiaOther
Figure�8:�UK�imports�of�coal�and�other�solid�fuel�by�country�oforigin,�2004
Source:�DTI�2005
34%
1%
39%
20%
2%
1%
1%
1%
1% Coal
Oil
Gas
Nuclear
Renewables
Other thermal sources
Hydro- natural flow
Hydro- pumped storage
Other non-thermalsources
Figure�9:�Fuel�used�in�electricity�generation,�on�an�outputbasis,�2005
Source:�DTI�2006eNote:�electricity�supplied�(gross)�figures�used.�Gas�is�turned�intoelectricity�more�efficiently�than�coal�and�therefore�contributes�to�agreater�proportion�of�electricity�output�even�though�in�absoluteterms�the�amount�of�coal�used�is�greater�than�that�of�gas.

ippr�|�Energy�Security�in�the�UK:�an�ippr�FactFile10
reduced�and�the�New�Electricity�Trading�Arrangements�wereintroduced.�Electricity�prices�have�risen�again�since�2003,�driven�bywholesale�prices�(DTI�2007d).
Domestic�gas�prices�rose�by�18�per�cent�between�2003�and�2005and�electricity�prices�increased�by�13�per�cent.�Industrial�gas�pricesrose�by�57�per�cent�and�electricity�prices�by�36�per�cent�over�thesame�period�(DTI�2006f).�While�many�consumers�have�been�able�toafford�these�price�increases,�the�number�of�people�living�in�‘fuelpoverty’�has�risen.�Estimations�for�England�show�an�additional�onemillion�people�living�in�fuel�poverty�in�2006�compared�to�2004�(FuelPoverty�Advisory�Group�2007).�
Heating�oil�prices�have�tended�to�follow�crude�oil�prices.�This�hasalso�been�true�in�the�past�for�diesel�and�petrol�prices�–�for�example,the�price�peaks�seen�as�a�result�of�the�oil�shocks�in�the�1970s�andthe�first�Gulf�War�in�1991�–�but�during�the�1990s�the�gradualincreases�in�diesel�and�petrol�prices�in�the�UK�were�mainlyattributable�to�increasing�levels�of�duty.�In�2001�prices�fell�in�realterms,�before�beginning�to�rise�again�in�2003.
Summary• Fossil�fuel�uses�vary�according�to�type.�Oil�is�used�mainly�fortransport,�coal�for�electricity�generation�and�gas�for�a�mixtureof�heating�and�electricity�production.
• The�UK�is�a�net�importer�of�coal�and�gas�and�is�likely�tobecome�a�net�importer�of�oil�by�around�2010.
• Norway�provides�most�of�the�UK’s�gas�and�oil�imports�and�islikely�to�remain�a�key�supplier�in�the�future.�Coal�is�importedfrom�a�more�varied�range�of�countries�but�Russia�and�SouthAfrica�together�account�for�over�half�of�the�UK’s�imports.
• Gas�and�oil�use�remain�sensitive�to�price�increases.�Coal�priceshave�risen�less�sharply�than�oil�and�gas�and�its�future�use�ismore�likely�to�be�constrained�by�restrictions�on�emissions�onCO2 such�as�a�high�carbon�price�under�the�EU�ETS.
3.�Global�context
As�the�UK�becomes�increasinglydependent�on�imports�of�fossilfuels,�it�is�important�to�considerthe�global�context�in�which�thisis�occurring.�This�section�looksat�trends�of�energy�use�andproduction�around�the�worldand�describes�where�demandfor�and�supply�of�different�fuelsis�likely�to�come�from�in�thefuture.
Oil�DemandGlobal�primary�consumption�ofoil�in�2005�was�approximately84�million�barrels�per�day�(IEA2006).�The�greatest�demand�(of20.6�million�barrels�per�day)
was�from�the�USA,�followed�by�Developing�Asia�and�OECD�Europewho�used�14.6�and�14.4�million�barrels�per�day�respectively�(IEA2006).
Forecasts�expect�demand�to�continue�to�grow;�the�InternationalEnergy�Agency�(IEA)’s�2006�World�Energy�Outlook�projects�thatunder�a�business-as-usual�scenario�we�will�require�116�millionbarrels�per�day�globally�in�2030�(although�others�have�producedlower�estimates�than�this;�see,�for�example,�Drollas�2006).�Demandin�all�regions�will�increase,�but�the�greatest�rise�will�be�fromdeveloping�countries�and�in�particular�from�China�(IEA�2006).
Uses�of�oil�are�mixed.�Unlike�the�UK�and�Europe,�where�most�of�theoil�consumed�is�in�fuel�transportation,�uses�of�oil�across�the�worldare�much�more�varied�and�include�residential,�commercial�andindustrial�uses�as�well�as�power�generation�(Mitchell�2006).
Oil�reserves�are�concentrated�in�only�a�few�locations�around�theworld�which�means�that�most�countries�are�dependent�on�importsfor�their�oil�supply.�In�absolute�terms,�the�USA�imports�the�most�oil(Table�1).�However,�since�that�country�also�produces�a�substantialamount�of�oil,�it�is�not�the�most�dependent�on�oil�imports.�Table�1shows�the�world’s�top�10�oil-importing�countries�and�the�extent�towhich�they�are�dependent�on�these�imports�to�meet�their�needs.�Asa�region,�OECD�Europe�is�the�second�most�dependent�in�the�worldwith�imports�accounting�for�over�half�of�the�oil�consumed�in�2004.This�dependency�is�predicted�to�increase�sharply�to�80�per�cent�by2030�(IEA�2006)�
SupplyCountries�that�belong�to�OPEC�(Organization�of�the�PetroleumExporting�Countries)�produce�just�under�half�of�the�world’s�crudeoil.�Of�member�countries,�the�largest�producer�is�Saudi�Arabia,�whichin�2005�produced�more�than�double�the�amount�of�crude�oil�thanthe�next�largest�producer,�Iran�(OPEC�2006,�IEA�2006).�OutsideOPEC,�Russia�is�the�largest�producer�and�in�2005�supplied�roughlythe�same�amount�of�crude�oil�as�Saudi�Arabia.�Global�production�ofcrude�oil�in�2005�was�approximately�71–72�million�barrels�per�day(IEA�2006,�OPEC�2006).�If�natural�gas�liquids�and�non-conventional
Table�1:�Top�10�oil�importing�countries�in�2005
2005�oil�imports� 2005�oil�consumption� Import�dependency�as�(million�bbl/day) (million�bbl/day) percentage�of�consumption
USA 13.5 20.7 65%
Japan 5.2 5.4 97%
PR�China 3.4 7.3 47%
Germany 2.6 2.6 100%
South�Korea 2.3 2.3 100%
France 1.9 2.0 97%
Italy 1.8 1.8 100%
India 1.7 2.5 68%
Spain 1.6 1.6 99%
The�Netherlands 1.1 1.1 100%
Sources:�World�Coal�Institute�2006,�BP�2006
ippr�|�Energy�Security�in�the�UK:�an�ippr�FactFile11
sources�of�oil�are�also�included,�the�total�oil�supply�in�2005�wasaround�84�million�barrels�per�day�(IEA�2006).
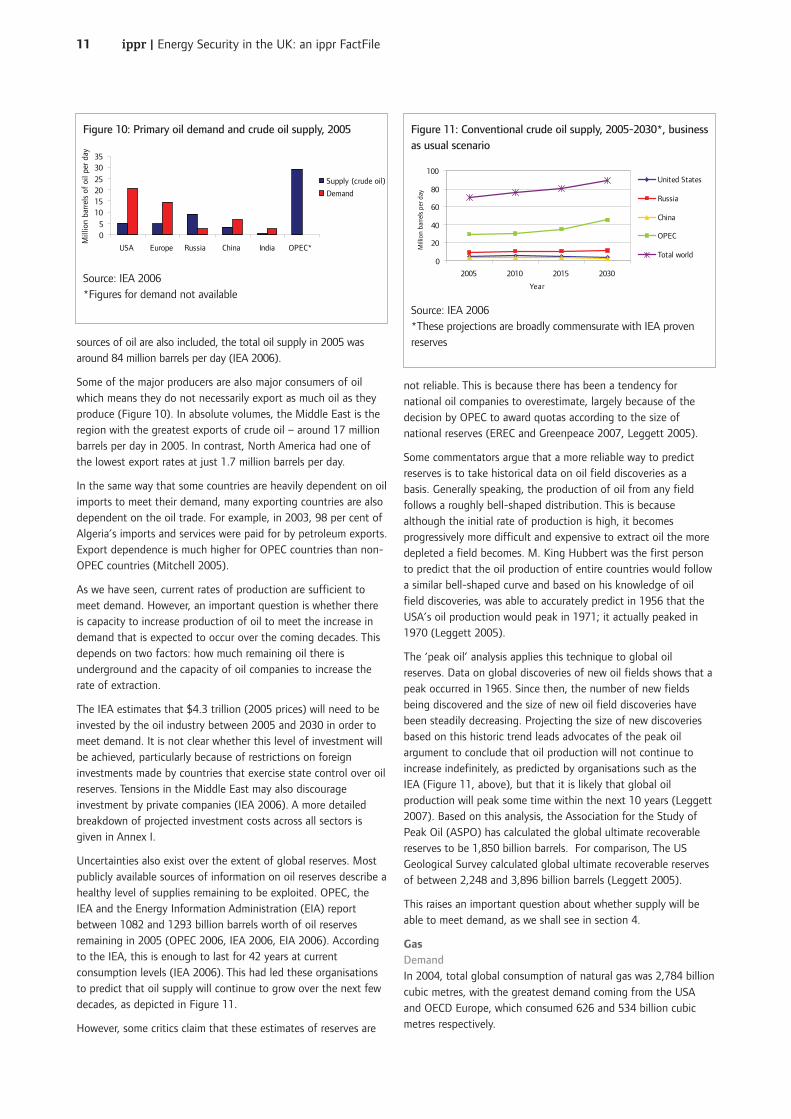
Some�of�the�major�producers�are�also�major�consumers�of�oilwhich�means�they�do�not�necessarily�export�as�much�oil�as�theyproduce�(Figure�10).�In�absolute�volumes,�the�Middle�East�is�theregion�with�the�greatest�exports�of�crude�oil�–�around�17�millionbarrels�per�day�in�2005.�In�contrast,�North�America�had�one�ofthe�lowest�export�rates�at�just�1.7�million�barrels�per�day.�
In�the�same�way�that�some�countries�are�heavily�dependent�on�oilimports�to�meet�their�demand,�many�exporting�countries�are�alsodependent�on�the�oil�trade.�For�example,�in�2003,�98�per�cent�ofAlgeria’s�imports�and�services�were�paid�for�by�petroleum�exports.Export�dependence�is�much�higher�for�OPEC�countries�than�non-OPEC�countries�(Mitchell�2005).
As�we�have�seen,�current�rates�of�production�are�sufficient�tomeet�demand.�However,�an�important�question�is�whether�thereis�capacity�to�increase�production�of�oil�to�meet�the�increase�indemand�that�is�expected�to�occur�over�the�coming�decades.�Thisdepends�on�two�factors:�how�much�remaining�oil�there�isunderground�and�the�capacity�of�oil�companies�to�increase�therate�of�extraction.
The�IEA�estimates�that�$4.3�trillion�(2005�prices)�will�need�to�beinvested�by�the�oil�industry�between�2005�and�2030�in�order�tomeet�demand.�It�is�not�clear�whether�this�level�of�investment�willbe�achieved,�particularly�because�of�restrictions�on�foreigninvestments�made�by�countries�that�exercise�state�control�over�oilreserves.�Tensions�in�the�Middle�East�may�also�discourageinvestment�by�private�companies�(IEA�2006).�A�more�detailedbreakdown�of�projected�investment�costs�across�all�sectors�isgiven�in�Annex�I.
Uncertainties�also�exist�over�the�extent�of�global�reserves.�Mostpublicly�available�sources�of�information�on�oil�reserves�describe�ahealthy�level�of�supplies�remaining�to�be�exploited.�OPEC,�theIEA�and�the�Energy�Information�Administration�(EIA)�reportbetween�1082�and�1293�billion�barrels�worth�of�oil�reservesremaining�in�2005�(OPEC�2006,�IEA�2006,�EIA�2006).�Accordingto�the�IEA,�this�is�enough�to�last�for�42�years�at�currentconsumption�levels�(IEA�2006).�This�had�led�these�organisationsto�predict�that�oil�supply�will�continue�to�grow�over�the�next�fewdecades,�as�depicted�in�Figure�11.
However,�some�critics�claim�that�these�estimates�of�reserves�are
not�reliable.�This�is�because�there�has�been�a�tendency�fornational�oil�companies�to�overestimate,�largely�because�of�thedecision�by�OPEC�to�award�quotas�according�to�the�size�ofnational�reserves�(EREC�and�Greenpeace�2007,�Leggett�2005).
Some�commentators�argue�that�a�more�reliable�way�to�predictreserves�is�to�take�historical�data�on�oil�field�discoveries�as�abasis.�Generally�speaking,�the�production�of�oil�from�any�fieldfollows�a�roughly�bell-shaped�distribution.�This�is�becausealthough�the�initial�rate�of�production�is�high,�it�becomesprogressively�more�difficult�and�expensive�to�extract�oil�the�moredepleted�a�field�becomes.�M.�King�Hubbert�was�the�first�personto�predict�that�the�oil�production�of�entire�countries�would�followa�similar�bell-shaped�curve�and�based�on�his�knowledge�of�oilfield�discoveries,�was�able�to�accurately�predict�in�1956�that�theUSA’s�oil�production�would�peak�in�1971;�it�actually�peaked�in1970�(Leggett�2005).�
The�‘peak�oil’�analysis�applies�this�technique�to�global�oilreserves.�Data�on�global�discoveries�of�new�oil�fields�shows�that�apeak�occurred�in�1965.�Since�then,�the�number�of�new�fieldsbeing�discovered�and�the�size�of�new�oil�field�discoveries�havebeen�steadily�decreasing.�Projecting�the�size�of�new�discoveriesbased�on�this�historic�trend�leads�advocates�of�the�peak�oilargument�to�conclude�that�oil�production�will�not�continue�toincrease�indefinitely,�as�predicted�by�organisations�such�as�theIEA�(Figure�11,�above),�but�that�it�is�likely�that�global�oilproduction�will�peak�some�time�within�the�next�10�years�(Leggett2007).�Based�on�this�analysis,�the�Association�for�the�Study�ofPeak�Oil�(ASPO)�has�calculated�the�global�ultimate�recoverablereserves�to�be�1,850�billion�barrels.��For�comparison,�The�USGeological�Survey�calculated�global�ultimate�recoverable�reservesof�between�2,248�and�3,896�billion�barrels�(Leggett�2005).
This�raises�an�important�question�about�whether�supply�will�beable�to�meet�demand,�as�we�shall�see�in�section�4.
Gas�DemandIn�2004,�total�global�consumption�of�natural�gas�was�2,784�billioncubic�metres,�with�the�greatest�demand�coming�from�the�USAand�OECD�Europe,�which�consumed�626�and�534�billion�cubicmetres�respectively.
05
10152025
3035
USA Europe Russia China India OPEC*
Mill
ion
barr
els
of o
il pe
r da
y
Supply (crude oil)
Demand
Figure�10:�Primary�oil�demand�and�crude�oil�supply,�2005
Source:�IEA�2006*Figures�for�demand�not�available
0
20
40
60
80
100
2005 2010 2015 2030
Year
Mill
ion
barre
ls p
er d
ay
United States
Russia
China
OPEC
Total world
Figure�11:�Conventional�crude�oil�supply,�2005-2030*,�businessas�usual�scenario
Source:�IEA�2006*These�projections�are�broadly�commensurate�with�IEA�provenreserves

ippr�|�Energy�Security�in�the�UK:�an�ippr�FactFile12
In�the�IEA�reference�(business-as-usual)�scenario,�natural�gasdemand�grows�to�4,663�billion�cubic�metres�per�year�by�2030.Demand�for�gas�grows�fastest�in�Africa,�the�Middle�East�anddeveloping�Asia,�especially�China�(IEA�2006).�
Although�OECD�Europe’s�gas�consumption�is�not�predicted�to�growas�quickly�as�other�regions,�falling�levels�of�production�within�theregion�mean�that�to�sustain�levels�of�consumption,�it�will�becomemore�dependent�on�imports.�Imports�are�predicted�to�rise�from�40per�cent�of�inland�consumption�in�2004�to�63�per�cent�in�2030�(IEA2006).
Europe�currently�receives�most�of�its�gas�supplies�from�Russia�(127bcm�in�2004).�However,�it�is�uncertain�whether�Russia�has�thecapacity�to�meet�Europe’s�increasing�levels�of�demand�and�whetherit�will�be�able�to�raise�production�levels�sufficiently.�The�IEA�predictsthat�the�biggest�supplier�of�gas�to�Europe�in�2030�will�be�Africa,followed�by�Russia�and�the�Middle�East,�with�additional�LNGsupplies�from�Latin�America�(IEA�2006).
SupplyThe�region�that�exported�the�most�gas�in�2005�was�the�Middle�East(exporting�around�17�million�barrels�per�day).�Eastern�Europe,�Africaand�Latin�America�were�also�significant�suppliers,�exporting�7.5,�6.5and�5.6�million�barrels�per�day�respectively�(OPEC�2006).�Gasmarkets�are�currently�constrained�to�a�great�extent�by�the�ability�totransport�gas�from�producer�to�customer.�For�this�reason,�they�havetended�to�operate�on�a�regional�basis�via�gas�pipelines�in�the�past.This�picture�is�changing�slowly�as�more�gas�is�shipped�in�the�form�ofLNG.�Imports�of�LNG�to�the�USA�are�expected�to�grow�the�most�inthe�next�few�years�(IEA�2006).�
Over�half�of�the�world’s�gas�reserves�are�located�in�just�threecountries:�Russia,�Iran�and�Qatar�(IEA�2006).�The�IEA�states�thatproven�reserves�at�the�end�of�2005�were�around�180�trillion�cubicmetres,�enough�to�last�for�40�years�under�the�IEA’s�‘business-as-usual’�growth�scenario�(IEA�2006,�OPEC�2006).
The�IEA�forecasts�that�investment�of�$3.9�trillion�will�be�neededbetween�2005�and�2030�in�order�for�gas�demand�to�be�met.�It�isnot�at�all�clear�whether�this�will�be�achieved,�particularly�because�ofthe�situation�in�the�Middle�East.�There�are�also�questions�overwhether�the�Russian�state-controlled�energy�company�Gazprom�willinvest�sufficient�money�in�Russian�gas�infrastructure�(IEA�2006).�
CoalCoal�consumptionIn�2004,�the�two�major�consumers�of�coal�were�China�(1,881�milliontonnes)�and�the�USA�(1,006).�Total�global�consumption�was�5,558million�tonnes.
The�IEA�projects�that�coal�demand�will�increase�to�8,858�milliontonnes�in�2030.�Forecasts�have�been�revised�upwards�in�recent�yearsbecause�of�the�increase�in�gas�prices,�making�coal�more�competitive,particularly�for�power�generation�(IEA�2006).�Most�of�the�increasein�demand�will�come�from�China�and�India,�both�of�which�haveabundant�supplies�of�coal.�Demand�is�predicted�to�fall�in�Europe,the�price�of�carbon�established�through�the�EU�ETS�playing�a�role�inits�demise.
The�USA�has�large�reserves�but�is�still�heavily�reliant�on�importsbecause�much�of�its�own�coal�is�more�expensive�to�extract.�For�thisreason,�the�USA�is�expected�to�become�a�net�importer�of�coalbetween�2015�and�2030.�OECD�Europe�is�already�a�net�importer�ofcoal�and�will�be�the�largest�global�importer�of�hard�coal3 in�2030.This�is�in�spite�of�the�prediction�that�coal�use�in�Europe�is�set�todecline�and�production�rates�are�set�to�fall�even�faster�(IEA�2006).
Unlike�oil�and�gas,�where�a�country’s�status�as�an�importer�orexporter�is�mostly�determined�by�its�endowment�of�reserves,�thecoal�market�is�driven�much�more�by�economic�factors.�The�costs�ofproducing�coal�depend�on�a�number�of�factors�such�as�geology,technology,�infrastructure�and�labour�costs�(IEA�2006).
Coal�productionTotal�global�production�of�coal�in�2004�was�equivalent�to�5,559million�tonnes.�This�is�expected�to�rise�to�8,858�million�tonnes�by2030�(IEA�2006).
Proven�reserves�of�coal�are�estimated�to�be�909�billion�tonnes,which�is�equivalent�to�164�years�at�the�current�production�rate�(BPStatistical�review�of�world�energy�2006�cited�in�IEA�2006).
Coal�reserves�are�more�evenly�distributed�globally�than�oil�and�gasfields,�but�China,�the�USA,�India,�Russia,�Australia�and�South�Africabetween�them�account�for�over�80�per�cent�of�the�reserves;�seeFigure�12�(IEA�2006).�
The�IEA�estimates�that�a�total�of�$563�billion�of�investment�will�beneeded�by�2030�under�a�business-as-usual�scenario.
Summary• Under�a�business-as-usual�scenario,�Europe�will�becomeincreasingly�dependent�on�energy�imports.�By�2030,�Europewill�be�the�world’s�biggest�importer�of�coal�and�will�rely�onimports�to�meet�80�per�cent�of�its�oil�needs�and�63�per�cent�ofgas�demand.
• OPEC�countries�account�for�around�half�of�the�world’s�oil�andgas�exports.�OPEC�members’�economies�are�generally�moredependent�on�these�exports�than�those�of�non-OPECexporters.
3%4%
4%
5%
8%
9%
10%
13%
17%
27%
Kazakhstan
EU
Ukraine
South Africa
Rest of world
Australia
India
China
Russia
USA
Figure�12:�Global�coal�reserves�by�country,�2005
Source:�IEA�2006
3.�Hard�coal�is�a�primary�coal�from�which�other�fuels,�such�as�coking�coal�and�steam�coal,�are�derived.

ippr�|�Energy�Security�in�the�UK:�an�ippr�FactFile13
• Challenges�for�future�oil�supplies�include�a�lack�of�investmentopportunities�for�private�oil�companies,�geopolitical�tensions�inthe�Middle�East�and�uncertainty�about�the�size�of�remainingreserves,�with�some�commentators�warning�that�global�oilproduction�will�peak�in�the�next�decade.
4.�Threats�to�UK�energy�security
The�issue�of�energy�security�has�become�much�more�prominent�inthe�UK�over�the�past�two�years.�This�has�been�driven�by�a�numberof�factors�including�high�oil�and�gas�prices,�international�eventsinvolving�Russia�and�the�Ukraine�and�pressing�decisions�aboutpower�stations�that�are�coming�to�the�end�of�their�lifetimes.
Despite�this,�energy�security�is�difficult�to�define;�there�is�no�singlemetric�to�measure�the�level�of�security�of�the�UK’s�energy�supply�orthe�level�of�public�good�it�delivers.�This�makes�it�difficult�to�comparewith�other�policy�objectives�(Mabey�2006).�The�Government’s�JointEnergy�Security�of�Supply�Working�Group�uses�a�set�of�indicators�ofsecurity�of�supply�based�on�supply�and�demand�forecasts�andmarket�signals�(forward�prices).�The�indicators�do�not�include�factorssuch�as�diversity�of�supply,�import�dependency�as�a�proportion�ofconsumption�or�likelihood�of�interruption�of�supply�of�importedfuels�(JESS�2006).�Woodman�and�Mitchell�(2006:�2)�set�out�fiveelements�that�contribute�to�energy�security:
• A�secure�fuel�supply�from�diverse�sources
• Sufficient�generation�to�compensate�for�unforeseen�plantclosures
• Diverse�means�of�generation
• Reliable�energy�infrastructures
• Flexibility�in�use�(to�reduce�demand�if�necessary�or�use�analternative�form�of�energy)
This�section�outlines�the�most�widely-perceived�threats�to�domesticenergy�supply.�However,�it�should�be�noted�that�the�risks�are�rootedin�different�causes�and�are�therefore�difficult�to�compare�in�terms�ofthe�likelihood�of�occurring.�
Import�dependency�and�supply�disruptionIt�is�clear�that�the�UK�is�becoming�increasingly�dependent�onimports�of�fossil�fuels�to�meet�its�energy�needs.�It�is�already�a�netimporter�of�coal�and�gas�and�will�become�a�net�importer�of�oilwithin�the�next�few�years.�This�shift�away�from�a�position�ofrelative�self-sufficiency�towards�one�of�import-dependency�hasfocused�attention�on�the�issue�of�energy�security�for�the�UK.�
The�UK�receives�most�of�its�gas�imports�from�Norway�anddisruption�to�this�supply�is�unlikely.�As�Figure�5�showed,�however,a�significant�proportion�of�the�UK’s�gas�comes�via�the�Belgiuminterconnector.�The�UK�relies�on�this�route�to�import�gas�frommainland�Europe�to�meet�demand�at�peak�times�such�as�duringparticularly�cold�weather�in�winter.�This�means�there�is�a�risk�ofshort-term�supply�disruption�if�this�gas�is�not�received.�
The�situation�was�highlighted�in�the�winter�of�2005/06�when�gassupply�from�Europe�was�not�sufficient�to�meet�peak�demand.�Thisscarcity�pushed�up�gas�prices�and�the�result�was�that�electricity-
generating�companies�switched�to�the�cheaper�option�of�coal�toprevent�power�cuts�(DTI�2006d).�Domestic�gas�customers�also�feltthe�squeeze;�the�high�prices�are�estimated�to�have�led�to�anadditional�one�million�people�living�in�fuel�poverty�in�2006compared�to�2004�(DTI�2006f,�Fuel�Poverty�Advisory�Group2007).�
There�are�a�number�of�theories�as�to�why�the�supply�did�notarrive,�ranging�from�a�shortage�of�gas�owing�to�a�cold�winter�inmainland�Europe�and�problems�arising�from�the�current�networkof�interconnectors,�which�meant�it�was�difficult�to�move�the�gasaround�the�grid�from�areas�where�it�was�plentiful�to�make�upscarce�supplies�in�the�UK.�Another�explanation�points�to�the�roleof�public�service�obligations�in�some�European�countries,�whichprevented�the�release�of�gas�from�storage�facilities�that�couldhave�made�up�the�shortfall.�Most�extreme�of�all,�somecommentators�suggest�that�market�abuse�could�have�taken�place.The�failure�of�gas�to�be�supplied�to�the�UK�despite�gas�pricesbeing�higher�than�in�the�rest�of�Europe�highlights�the�fact�thatgas�markets�in�Europe�are�not�responding�to�price�signals�as�theywould�if�they�were�fully�liberalised.
Elsewhere�in�Europe,�energy�security�was�hitting�the�headlines�as,during�a�dispute�over�gas�prices,�Russia�temporarily�turned�off�itssupply�of�gas�to�the�Ukraine�and�to�Belarus�a�year�later.Recognising�that�the�UK�is�at�the�end�of�the�pipeline,�this�ledsome�commentators�to�claim�that�the�UK’s�exposure�to�Russia�asa�gas�supplier�remains�the�greatest�short-term�threat�to�gassupplies.
Oil�supplies�are�similarly�subject�to�the�same�kinds�of�geopoliticalpressures.�Once�again,�the�UK�is�most�dependent�on�Norway�for�itsimports,�hence�is�unlikely�to�face�any�unexpected�shortage�ofphysical�supply.�In�terms�of�global�oil�supplies,�potentialconfrontation�and�sanctions�in�Iran�over�its�continued�use�ofuranium�enrichment�facilities�and�the�2007�elections�in�Nigeriacould�slow�production�in�these�countries.�Equally,�therenationalisation�of�Venezuela’s�oil�companies�could�mean�lessaccess�for�foreign�investment�and�therefore�reduced�productionrates�(Mitchell�2006).�Threats�to�pipelines�in�the�Middle�East�couldalso�disrupt�supply.�While�this�would�not�affect�the�physical�supplyof�oil�to�the�UK�–�since�very�little�oil�is�imported�from�thesecountries�–�it�could�affect�the�UK’s�oil�supply�indirectly,�throughincreased�oil�prices.�This�is�discussed�in�more�depth�below.
It�is�difficult�to�predict�where�the�UK’s�future�oil�supplies�will�comefrom�as�this�will�depend�on�the�market.�However,�it�is�likely�thatimports�from�Russia,�the�Caspian�Sea�region,�West�Africa,�NorthAfrica�and�the�Middle�East�will�increase�(JESS�2006).�Oil�productionin�Norway�is�forecast�to�peak�in�2008�(Norwegian�PetroleumDirectorate�2005).
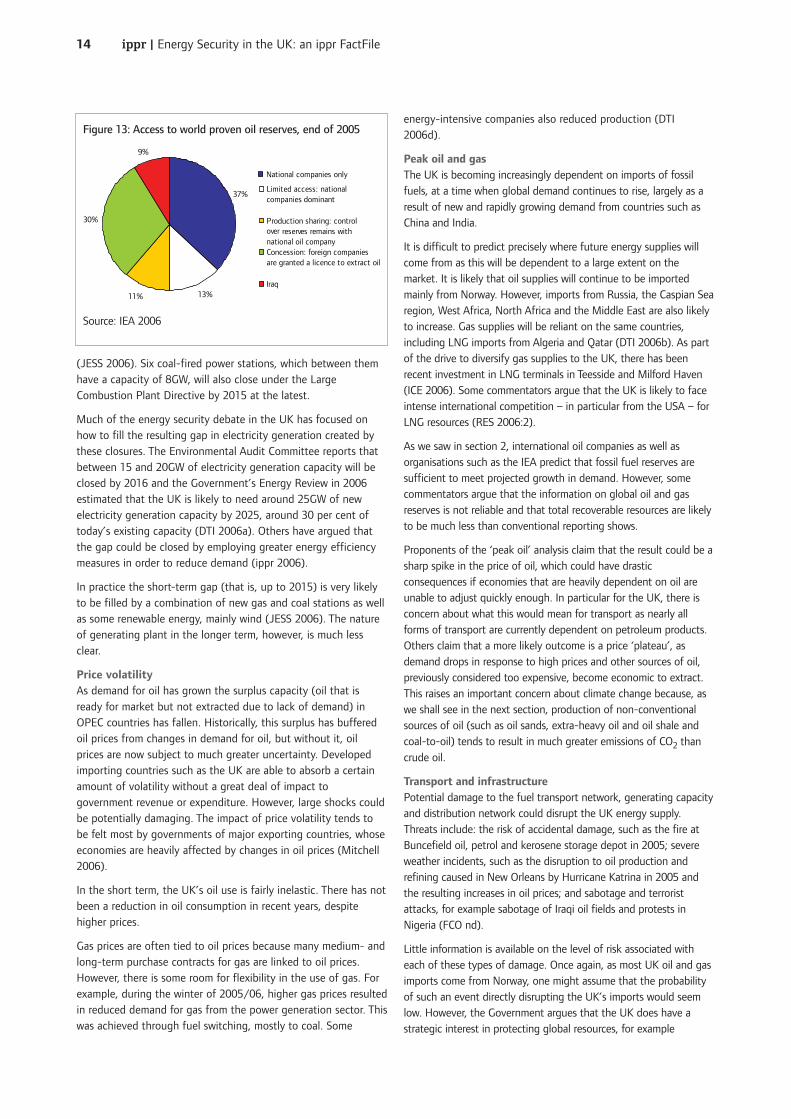
Opportunities�for�UK�companies�to�invest�in�new�projects�are�limitedbecause�access�to�most�of�the�world’s�oil�reserves�is�restricted�tostate-owned�oil�companies,�as�shown�in�Figure�13�(IEA�2006).�
Power�station�closuresSeveral�UK�electricity�power�plants�are�scheduled�for�closure�duringthe�next�few�years.�A�total�of�eight�nuclear�power�stations�will�cometo�the�end�of�their�lifetimes�during�the�next�10�years.�Of�theremaining�stations,�the�last�–�Sizewell�B�–�is�due�for�closure�in�2035
ippr�|�Energy�Security�in�the�UK:�an�ippr�FactFile14
(JESS�2006).�Six�coal-fired�power�stations,�which�between�themhave�a�capacity�of�8GW,�will�also�close�under�the�LargeCombustion�Plant�Directive�by�2015�at�the�latest.
Much�of�the�energy�security�debate�in�the�UK�has�focused�onhow�to�fill�the�resulting�gap�in�electricity�generation�created�bythese�closures.�The�Environmental�Audit�Committee�reports�thatbetween�15�and�20GW�of�electricity�generation�capacity�will�beclosed�by�2016�and�the�Government’s�Energy�Review�in�2006estimated�that�the�UK�is�likely�to�need�around�25GW�of�newelectricity�generation�capacity�by�2025,�around�30�per�cent�oftoday’s�existing�capacity�(DTI�2006a).�Others�have�argued�thatthe�gap�could�be�closed�by�employing�greater�energy�efficiencymeasures�in�order�to�reduce�demand�(ippr�2006).
In�practice�the�short-term�gap�(that�is,�up�to�2015)�is�very�likelyto�be�filled�by�a�combination�of�new�gas�and�coal�stations�as�wellas�some�renewable�energy,�mainly�wind�(JESS�2006).�The�natureof�generating�plant�in�the�longer�term,�however,�is�much�lessclear.�
Price�volatilityAs�demand�for�oil�has�grown�the�surplus�capacity�(oil�that�isready�for�market�but�not�extracted�due�to�lack�of�demand)�inOPEC�countries�has�fallen.�Historically,�this�surplus�has�bufferedoil�prices�from�changes�in�demand�for�oil,�but�without�it,�oilprices�are�now�subject�to�much�greater�uncertainty.�Developedimporting�countries�such�as�the�UK�are�able�to�absorb�a�certainamount�of�volatility�without�a�great�deal�of�impact�togovernment�revenue�or�expenditure.�However,�large�shocks�couldbe�potentially�damaging.�The�impact�of�price�volatility�tends�tobe�felt�most�by�governments�of�major�exporting�countries,�whoseeconomies�are�heavily�affected�by�changes�in�oil�prices�(Mitchell2006).
In�the�short�term,�the�UK’s�oil�use�is�fairly�inelastic.�There�has�notbeen�a�reduction�in�oil�consumption�in�recent�years,�despitehigher�prices.
Gas�prices�are�often�tied�to�oil�prices�because�many�medium-�andlong-term�purchase�contracts�for�gas�are�linked�to�oil�prices.However,�there�is�some�room�for�flexibility�in�the�use�of�gas.�Forexample,�during�the�winter�of�2005/06,�higher�gas�prices�resultedin�reduced�demand�for�gas�from�the�power�generation�sector.�Thiswas�achieved�through�fuel�switching,�mostly�to�coal.�Some
energy-intensive�companies�also�reduced�production�(DTI2006d).�
Peak�oil�and�gasThe�UK�is�becoming�increasingly�dependent�on�imports�of�fossilfuels,�at�a�time�when�global�demand�continues�to�rise,�largely�as�aresult�of�new�and�rapidly�growing�demand�from�countries�such�asChina�and�India.
It�is�difficult�to�predict�precisely�where�future�energy�supplies�willcome�from�as�this�will�be�dependent�to�a�large�extent�on�themarket.�It�is�likely�that�oil�supplies�will�continue�to�be�importedmainly�from�Norway.�However,�imports�from�Russia,�the�Caspian�Searegion,�West�Africa,�North�Africa�and�the�Middle�East�are�also�likelyto�increase.�Gas�supplies�will�be�reliant�on�the�same�countries,including�LNG�imports�from�Algeria�and�Qatar�(DTI�2006b).�As�partof�the�drive�to�diversify�gas�supplies�to�the�UK,�there�has�beenrecent�investment�in�LNG�terminals�in�Teesside�and�Milford�Haven(ICE�2006).�Some�commentators�argue�that�the�UK�is�likely�to�faceintense�international�competition�–�in�particular�from�the�USA�–�forLNG�resources�(RES�2006:2).
As�we�saw�in�section�2,�international�oil�companies�as�well�asorganisations�such�as�the�IEA�predict�that�fossil�fuel�reserves�aresufficient�to�meet�projected�growth�in�demand.�However,�somecommentators�argue�that�the�information�on�global�oil�and�gasreserves�is�not�reliable�and�that�total�recoverable�resources�are�likelyto�be�much�less�than�conventional�reporting�shows.�
Proponents�of�the�‘peak�oil’�analysis�claim�that�the�result�could�be�asharp�spike�in�the�price�of�oil,�which�could�have�drasticconsequences�if�economies�that�are�heavily�dependent�on�oil�areunable�to�adjust�quickly�enough.�In�particular�for�the�UK,�there�isconcern�about�what�this�would�mean�for�transport�as�nearly�allforms�of�transport�are�currently�dependent�on�petroleum�products.Others�claim�that�a�more�likely�outcome�is�a�price�‘plateau’,�asdemand�drops�in�response�to�high�prices�and�other�sources�of�oil,previously�considered�too�expensive,�become�economic�to�extract.This�raises�an�important�concern�about�climate�change�because,�aswe�shall�see�in�the�next�section,�production�of�non-conventionalsources�of�oil�(such�as�oil�sands,�extra-heavy�oil�and�oil�shale�andcoal-to-oil)�tends�to�result�in�much�greater�emissions�of�CO2 thancrude�oil.�
Transport�and�infrastructurePotential�damage�to�the�fuel�transport�network,�generating�capacityand�distribution�network�could�disrupt�the�UK�energy�supply.Threats�include:�the�risk�of�accidental�damage,�such�as�the�fire�atBuncefield�oil,�petrol�and�kerosene�storage�depot�in�2005;�severeweather�incidents,�such�as�the�disruption�to�oil�production�andrefining�caused�in�New�Orleans�by�Hurricane�Katrina�in�2005�andthe�resulting�increases�in�oil�prices;�and�sabotage�and�terroristattacks,�for�example�sabotage�of�Iraqi�oil�fields�and�protests�inNigeria�(FCO�nd).
Little�information�is�available�on�the�level�of�risk�associated�witheach�of�these�types�of�damage.�Once�again,�as�most�UK�oil�and�gasimports�come�from�Norway,�one�might�assume�that�the�probabilityof�such�an�event�directly�disrupting�the�UK’s�imports�would�seemlow.�However,�the�Government�argues�that�the�UK�does�have�astrategic�interest�in�protecting�global�resources,�for�example
37%
13%11%
30%
9%
National companies only
Limited access: national companies dominant
Production sharing: control over reserves remains with national oil companyConcession: foreign companiesare granted a licence to extract oil
Iraq
Figure�13:�Access�to�world�proven�oil�reserves,�end�of�2005
Source:�IEA�2006
ippr�|�Energy�Security�in�the�UK:�an�ippr�FactFile15
protecting�the�interests�of�British�oil�companies�or�the�protection�ofoil�infrastructure�in�Iraq.
The�global�contextThis�section�has�focused�on�threats�to�the�UK’s�energy�supply�but�itwould�be�wrong�not�to�acknowledge�the�wider�global�context.Energy�security�is�clearly�not�a�concern�that�stops�at�the�shores�ofthe�UK�and�our�growing�dependency�on�imported�fuels�highlightsthis�fact.�However,�the�issue�of�energy�security�goes�beyond�directthreats�to�our�own�energy�supply.�As�a�part�of�the�global�economy,the�UK�is�also�susceptible�to�disruptions�to�global�energy�markets�asthey�could�have�a�major�impact�on�the�global�economy�andtherefore�be�felt�indirectly�by�the�UK.�
Although�this�aspect�of�the�energy�security�debate�is�an�extremelyimportant�one,�it�is�beyond�the�scope�of�this�paper�to�go�into�moredetail�here.
Summary• The�UK�is�becoming�more�dependent�on�imports�of�fossil�fuels.Already�a�net�importer�of�coal�and�gas,�the�UK�will�soon�alsobe�a�net�importer�of�oil.
• In�the�short�term,�imports�of�gas�from�mainland�Europe�presenta�risk�of�supply�disruption.�Exposure�to�Russian�gas�inparticular�is�considered�a�problem.
• In�the�longer�term,�there�are�concerns�that�Europe�might�beover-reliant�on�Russian�gas�and�that�a�lack�of�investment�couldmean�that�Russia�is�not�able�to�meet�future�demand.
• Planned�closure�of�nuclear�and�coal�electricity-generating�plantover�the�next�decade�has�heightened�concerns�about�‘keepingthe�lights�on’�and�raised�questions�about�how�this�capacity�willbe�replaced.
• Loss�of�surplus�oil�production�capacity�worldwide�has�resultedin�a�much�greater�uncertainty�for�oil�prices.�In�most�cases,�gasprices�are�tied�to�oil�prices�through�long-term�contracts.��
• An�early�‘peak’�in�global�production�of�oil�could�jeopardiseclimate�security�if�production�of�non-conventional�oils�becomesan�economically�feasible�option.
5.�Possible�solutions�and�barriers
This�section�outlines�some�of�the�ways�in�which�energy�securitycould�be�improved�and�highlights�barriers�to�change.�It�begins�byidentifying�ways�to�secure�supply�of�fossil�fuels,�before�looking�atoptions�to�reduce�their�use,�through�alternative�fuels�and�demandreduction.
Ensure�security�of�supply�of�fossil�fuels�with�climate�changein�mindTransparencyThe�Government�has�identified�data�transparency�as�a�key�barrier�toeffective�energy�markets.�It�will�continue�to�support�the�Joint�OilData�Initiative�in�an�effort�to�improve�this�(DTI�2006a).�The�Joint�OilData�Initiative�is�a�collaboration�between�six�internationalorganisations�(Asia-Pacific�Economic�Cooperation�[APEC],EUROSTAT,�IEA/OECD,�Organizacion�Latinoamericana�de�Energia[OLADE],�OPEC�and�the�United�Nationals�Statistics�Division
[UNSD])�to�improve�the�transparency�of�oil�data.
OilAs�we�have�seen,�future�production�of�crude�oil�is�likely�to�dependon�a�number�of�factors:�physical�capacity�to�extract�and�refine�oil,geopolitical�tensions�and�the�absolute�volume�of�remaining�oilreserves.
According�to�the�International�Energy�Agency�(IEA),�most�oilcompanies�currently�make�investment�decisions�based�on�anassumed�price�of�crude�oil�of�$25–$35�per�barrel�(IEA�2006)�despiteprices�rising�to�over�$50�a�barrel�in�recent�years.
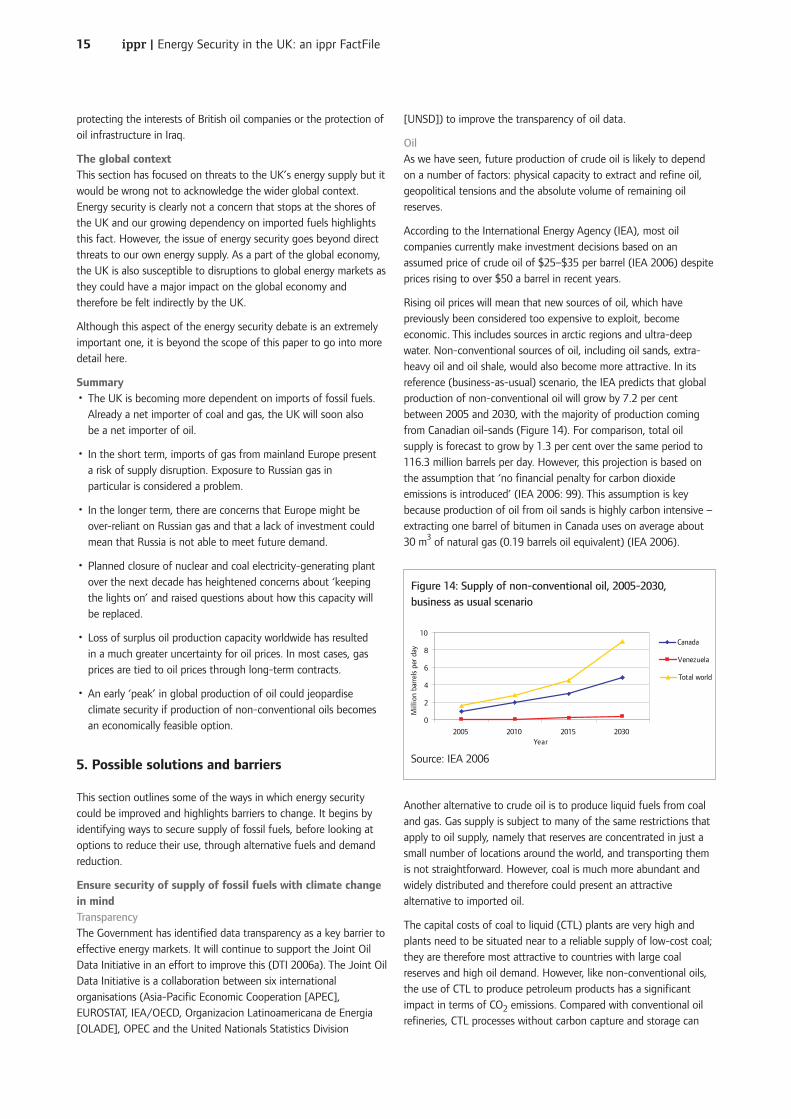
Rising�oil�prices�will�mean�that�new�sources�of�oil,�which�havepreviously�been�considered�too�expensive�to�exploit,�becomeeconomic.�This�includes�sources�in�arctic�regions�and�ultra-deepwater.�Non-conventional�sources�of�oil,�including�oil�sands,�extra-heavy�oil�and�oil�shale,�would�also�become�more�attractive.�In�itsreference�(business-as-usual)�scenario,�the�IEA�predicts�that�globalproduction�of�non-conventional�oil�will�grow�by�7.2�per�centbetween�2005�and�2030,�with�the�majority�of�production�comingfrom�Canadian�oil-sands�(Figure�14).�For�comparison,�total�oilsupply�is�forecast�to�grow�by�1.3�per�cent�over�the�same�period�to116.3�million�barrels�per�day.�However,�this�projection�is�based�onthe�assumption�that�‘no�financial�penalty�for�carbon�dioxideemissions�is�introduced’�(IEA�2006:�99).�This�assumption�is�keybecause�production�of�oil�from�oil�sands�is�highly�carbon�intensive�–extracting�one�barrel�of�bitumen�in�Canada�uses�on�average�about30�m3 of�natural�gas�(0.19�barrels�oil�equivalent)�(IEA�2006).�
Another�alternative�to�crude�oil�is�to�produce�liquid�fuels�from�coaland�gas.�Gas�supply�is�subject�to�many�of�the�same�restrictions�thatapply�to�oil�supply,�namely�that�reserves�are�concentrated�in�just�asmall�number�of�locations�around�the�world,�and�transporting�themis�not�straightforward.�However,�coal�is�much�more�abundant�andwidely�distributed�and�therefore�could�present�an�attractivealternative�to�imported�oil.
The�capital�costs�of�coal�to�liquid�(CTL)�plants�are�very�high�andplants�need�to�be�situated�near�to�a�reliable�supply�of�low-cost�coal;they�are�therefore�most�attractive�to�countries�with�large�coalreserves�and�high�oil�demand.�However,�like�non-conventional�oils,the�use�of�CTL�to�produce�petroleum�products�has�a�significantimpact�in�terms�of�CO2 emissions.�Compared�with�conventional�oilrefineries,�CTL�processes�without�carbon�capture�and�storage�can
0
2
4
6
8
10
2005 2010 2015 2030Year
Mill
ion
barr
els
per
day
Canada
Venezuela
Total world
Figure�14:�Supply�of�non-conventional�oil,�2005-2030,business�as�usual�scenario
Source:�IEA�2006
ippr�|�Energy�Security�in�the�UK:�an�ippr�FactFile16
result�in�seven�to�ten�times�more�CO2 emissions�(IEA�2006).
Economic�factors�remain�a�major�barrier�to�the�growth�of�CTL.�Theseinclude�volatility�of�and�uncertainty�about�oil�prices�as�well�as�thehigh�capital�costs�of�building�CTL�plants.�However,�some�countrieshave�already�established�a�CTL�industry.�One�example�is�SouthAfrica,�which�established�CTL�plants�as�a�result�of�sanctions�in�the1970s�and�80s;�around�30�per�cent�of�domestic�petrol�and�dieseldemand�is�produced�from�indigenous�coal.�A�number�of�other�CTLprojects�are�underway�around�the�world.�China,�the�USA�andAustralia�are�currently�leading�in�this�regard�(World�Coal�Institute2006).�Estimates�show�that�a�long-term�oil�price�of�around�$50�perbarrel�would�make�oil�from�coal�competitive.�Without�carbonpricing,�higher�oil�prices�would�lead�to�a�significant�increase�in�theuse�of�these�fuels�(Anderson�2007).
GasWhile�oil�price�volatility�remains�the�biggest�risk�in�terms�of�oilsecurity�for�the�UK,�for�gas�supplies,�the�greatest�risk�is�associatedwith�short-term�disruptions�to�supply�of�imported�gas,�as�discussedin�section�4.
The�UK�has�liberalised�its�energy�markets�and,�compared�to�therest�of�Europe,�has�enjoyed�cheaper�electricity�and�gas�prices�onaverage�as�a�result.�The�UK�was�in�a�position�to�do�this�becauseof�its�relative�self-sufficiency�in�energy�supplies.�Liberalisationhas�not�occurred�to�the�same�extent�in�mainland�Europe.�Thefollowing�of�a�‘national�champion�model’�has�led�to�the�rise�ofthree�‘super�companies’�(EDF,�E.ON�and�RWE),�which�means�thatachieving�genuine�competition�is�difficult�particularly�as�suchvertically�integrated�companies�present�a�barrier�to�new�entrantsin�the�market�(DTI�2006a).�
The�UK�continues�to�push�for�greater�liberalisation�as�a�methodof�achieving�increased�energy�security.�The�problem�with�thisapproach�is�that�while�the�UK�was�able�to�liberalise�while�priceswere�low,�liberalisation�for�some�EU�members�where�energy�pricesare�being�held�artificially�low�could�result�in�price�increases�andtherefore�represents�a�politically�difficult�option.
There�is�no�doubt�that�the�UK�needs�to�work�with�the�rest�ofEurope�to�secure�its�gas�supplies.�The�EU�has�a�greater�‘clout’when�it�comes�to�dialogue�with�potential�suppliers,�such�asRussia,�and�competitors,�such�as�China.�It�is�also�cheaper�toaddress�gas�security�issues�on�a�European�level�than�on�a�nationby�nation�basis�when�considering�the�physical�infrastructurethrough�which�competition�takes�place.
Of�particular�interest�is�the�desire�to�reduce�Europe’s�dependenceon�Russia�as�an�energy�supplier.�This�desire�is�mutually�held�as�itis�also�in�Russia’s�interest�not�to�be�overly�dependent�onexporting�to�European�gas�markets.�There�are�questions�over�theextent�to�which�this�is�likely�to�be�achieved�(Mitchell�2006).Commentators�are�sceptical�about�the�chances�of�Russia�signingthe�Energy�Charter�Treaty�–�an�international�agreement�that�aimsto�establish�a�legal�framework�for�international�cooperationbetween�European�countries�and�other�industrialised�countries�inthe�energy�sector.
CoalAs�we�saw�in�section�2,�there�are�abundant�coal�reserves�worldwide.
Prices�are�less�volatile�than�gas�and�oil;�in�fact,�coal�is�becoming�anincreasingly�attractive�option�as�oil�and�gas�prices�remain�high.�Themajor�problem�is�the�additional�emissions�of�air�pollutants�and�CO2that�go�along�with�increased�coal�use.�Compared�to�oil�and�gas,�coal-fired�electricity�generation�produces�the�most�CO2 per�unit�of�energydelivered.�CTL�processes�also�generate�large�quantities�of�CO2.
Various�technologies�are�available�to�clean�flue�gasses�of�airpollutants�such�as�SO2,�NOx�and�particulates,�although�there�arecosts�associated�with�all�of�these.�Carbon�Capture�and�Storage�(CCS)has�been�proposed�as�one�solution�for�reducing�CO2 emissions.�CCSinvolves�capturing�the�CO2 emitted�from�burning�coal�andpreventing�its�release�into�the�atmosphere�by�pumping�it�into�asecure�depository.�There�are�a�number�of�ways�that�this�could�bedone�–�by�pumping�into�appropriate�geological�formations,�injectioninto�the�sea�or�by�converting�it�into�a�solid�mineral�through�achemical�reaction.�The�different�capture�and�storage�technologiesare�at�different�stages�of�development,�the�most�advanced�are�post-combustion�and�pre-combustion�capture�methods�and�geologicalstorage�(IPCC�2005).�
Studies�have�shown�that�around�20–40�per�cent�of�global�emissions(mainly�from�point�sources�such�as�fossil�fuel-fired�power�stationsand�heavy�industrial�emitters�of�CO2)�could�be�suitable�for�captureby�2050�although�these�installations�may�not�necessarily�be�near�toa�suitable�storage�site�(IPCC�2005).�A�power�station�with�afunctioning�CCS�facility�still�remains�to�be�demonstrated�on�acommercial�scale�(DTI�2006a).�However,�initial�steps�are�being�takentowards�achieving�this�goal.�For�example,�in�September�2005,�theEU�and�China�signed�an�agreement�to�develop�technology�optionsfor�CCS�with�the�potential�to�establish�a�demonstration�project�inChina�between�2010�and�2015�(Defra�2007).�The�EuropeanCommission’s�Zero�Emissions�Fossil�Fuel�Technology�Platform�(ZEP)also�recommends�a�network�of�10�to�12�integrated,�large-scaledemonstration�projects�across�Europe�(European�TechnologyPlatform�for�Zero�Emission�Fossil�Fuel�Power�Plants�2007).
Economics�remain�a�barrier�to�the�development�and�deployment�ofCCS.�The�Intergovernmental�Panel�on�Climate�Change�(IPCC)estimates�that�for�CCS�to�reach�its�economic�potential,�severalhundreds�to�thousands�of�plants�will�have�to�be�installed�around�theworld�over�the�next�century�(IPCC�2005).�If�oil�and�gas�prices�remainhigh,�coal-fired�power�stations�will�become�a�more�favourableoption.�However,�whether�or�not�these�are�fitted�with�CCS�facilitieswill�depend�to�a�large�extent�on�the�price�of�carbon�under�the�EUETS.�Some�commentators�remain�sceptical�that�prices�will�risesufficiently�to�incentivise�investment�in�CCS.
Adopting�CCS�would�also�require�changes�to�current�legal�andregulatory�frameworks.�Issues�such�as�property�rights,�liability�in�thecase�of�leakage,�international�agreements�in�the�case�of�injectioninto�the�sea�and�accounting�of�greenhouse�gas�emissions,�whereCO2 is�stored�in�a�different�country�to�the�one�in�which�is�wasproduced,�will�need�to�be�addressed�(IPCC�2005).
UK�supply-side�optionsFor�the�UK,�supply-side�options�are�fairly�limited.�Investment�in�theUK�Continental�Shelf�(UKCS)�could�increase�the�total�amount�of�oiland�gas�that�is�recoverable�from�North�Sea�reserves�(since�extractingoil�and�gas�grows�more�expensive�as�fields�become�depleted)�and

ippr�|�Energy�Security�in�the�UK:�an�ippr�FactFile17
therefore�slow�the�decline�in�production.�To�some�extent,investment�will�be�driven�by�oil�prices.�However,�the�UKGovernment�aims�to�maximise�investment,�using�its�regulatorypowers�if�necessary,�irrespective�of�oil�prices�(DTI�2006a).
There�are�considerable�economic�and�environmental�barriers�toincreasing�coal�production,�although�the�Government�has�conveneda�‘Coal�Forum’�to�secure�a�‘long-term�future�of�coal-fired�generationand�UK�coal�production’�(DTI�2006a:�91).�Coal�currently�receivessubsidies�and�a�lower�carbon�price�via�the�climate�change�levy(CCL).�Some�have�argued�that�the�implementation�of�the�EU�ETShas�actually�encouraged�the�use�of�coal-fired�power�stations(despite�their�higher�CO2 emissions).�By�allocating�a�greater�numberof�free�carbon�allocations�to�plant�fitted�with�Flue�GasDesulphurisation�(FGD),�the�allocation�plan�has�effectivelyincentivised�the�retrofitting�of�FGD�to�coal�plant�with�the�result�thatthey�will�run�longer�than�would�otherwise�be�expected�(IPA�Energy&�Water�Consulting�2006).�
A�new�coal-fired�power�station�is�being�planned�by�E.ON,�partly�as�aresult�of�high�gas�prices.�The�plant�will�not�be�built�with�CCScapacity,�although�there�will�be�an�option�to�‘bolt�on’�a�CCS�plant�ata�later�date�if�economic�conditions�prove�favourable.�There�are�twoother�potential�projects�to�build�new�power�stations�with�CCScapability:�at�Ferrybridge,�in�West�Yorkshire�and�at�Tilbury�in�Essex,although�these�are�still�at�the�stage�of�feasibility�studies�(JESS2006).�CCS�can�also�be�used�on�gas-fired�plants,�although�thecapture�process�is�more�expensive�than�for�coal.
Depleted�oil�and�gas�fields�in�the�North�Sea�could�act�as�potentialstorage�sites�for�CO2 and�so�CCS�could�potentially�be�an�importantway�for�the�UK�to�reduce�its�emissions�to�the�atmosphere.�Thedevelopment�of�CCS�will�depend�on�whether�it�is�economicallyviable,�environmentally�sound�and�on�changes�to�the�regulatoryframework,�in�particular�to�the�London�and�OSPAR�conventions�onthe�marine�environment�and�reporting�of�CO2 emissions�under�theKyoto�Protocol�(since�emissions�captured�in�CCS�facilities�are�notcurrently�reflected�in�reporting).�
CCS�could�provide�an�economic�opportunity�for�the�UK,�takingadvantage�of�existing�skills�from�the�oil�and�gas�industry.�Therewould�also�be�opportunities�to�use�such�expertise�in�projects�indeveloping�countries�(DTI�2006a,�Foresight�2001).
The�Government�has�called�for�demonstration�projects�on�keycomponents�of�carbon�abatement�technologies�and�has�establisheda�CCS�Regulatory�Task�Force�(DTI�2006a).�If�CCS�can�make�the�gradein�terms�of�environmental�integrity�and�economic�viability,�then�coalmay�be�an�important�component�of�maintaining�a�secure�electricitysupply�for�the�UK.�
Alternatives�to�fossil�fuelsTurning�to�alternative�sources�of�energy�would�obviously�reducedependency�on�fossil�fuels�and�therefore�could�contribute�to�greaterenergy�security.�Here�they�are�discussed�according�to�use.
ElectricityAs�section�3�described,�much�of�the�concern�over�security�ofelectricity�supply�has�been�driven�by�the�impending�closure�ofgenerating�plant�over�the�next�decade�as�nuclear�power�stationscome�to�the�end�of�their�working�lives�and�coal-fired�power�stations
are�closed�under�the�LCPD.
As�we�have�seen,�the�resulting�‘generation�gap’�is�expected�to�bearound�15–20GW�by�2016�(House�of�Commons�EnvironmentalAudit�Committee�2006)�and�the�Government�estimates�that�a�totalof�25GW�of�new�capacity�will�be�needed�by�2025�(DTI�2006a).
The�potential�‘gap’�in�generation�capacity�coupled�with�concernsabout�the�security�of�gas�supplies�has�prompted�interest�inalternatives�sources�of�fuel�for�electricity�generation�to�ensure�the‘lights�do�not�go�out’.
There�are�essentially�two�alternative�non-fossil�sources�of�electricity:renewables�(encompassing�a�whole�range�of�different�technologies;for�convenience,�energy�from�waste,�landfill�gas�and�sewage�sludgedigestion�are�included�here)�and�nuclear�power.�Each�of�these�willbe�addressed�in�turn.
RenewablesThe�UK�is�endowed�with�significant�renewable�resources.�Indeed,within�the�UK�the�available�wind�resources�alone�could�provide�thecountry’s�electricity�demand�several�times�over�(Anderson�2006).However,�many�other�factors�play�a�role�in�determining�the�extentto�which�technologies�are�taken�up.�These�include�technologicalcapability�to�harness�resources,�the�accessibility�of�resources,integration�with�current�energy�distribution�networks,�publicacceptability�and�costs,�which�in�turn�depend�in�part�on�world�pricesof�oil,�gas,�coal�and�carbon,�as�well�as�the�proportion�of�eachtechnology�in�the�energy�mix�(Boyle�2004,�Anderson�2006).
In�2005,�4.6�per�cent�of�the�UK’s�electricity�production�was�fromrenewables,�equivalent�to�16,919�GWh�of�electricity�(DTI�2006b).This�is�still�some�way�short�of�the�Government’s�target�for�10�percent�of�electricity�to�be�generated�from�renewable�sources�by�2010.
A�number�of�studies�have�been�carried�out�into�the�potential�forrenewables�in�the�UK.�Based�on�an�assessment�of�the�existing�data,the�Sustainable�Development�Commission�concluded�that�the�totalpracticable�resource�is�at�least�334TWh/year,�which�is�around�87�percent�of�current�electricity�production.�If�price�restrictions�are�takeninto�account,�the�practicable�resource�reduces�to�around258TWh/year�(approximately�59�per�cent�of�current�production)(SDC�2006a).
It�is�not�clear�when�this�level�of�renewable�electricity�is�likely�tobecome�available.�Different�technologies�are�at�different�stages�ofdevelopment�–�on-shore�and�off-shore�wind�farms�are�already�inoperation,�but�other�technologies,�such�as�photovoltaics�and�wavepower�are�not�likely�to�be�a�significant�part�of�the�UK’s�energy�mixuntil�around�2025�(Watson�et�al 2002).�
The�main�barriers�to�renewable�energy�sources�are�economic�ratherthan�technical.�Obtaining�planning�permission�and�publicacceptability�also�present�problems.�In�terms�of�microgeneration,market�rules�and�network�regulation�also�present�barriers�to�uptake(Ofgem�2006b).�There�are�also�concerns�about�intermittency�ofsupply�from�renewable�sources�of�electricity.�For�example,�ifelectricity�generation�was�more�dependent�on�wind�turbines�and�thewinds�were�to�drop�at�a�peak�time�of�use,�it�might�not�be�possibleto�meet�demand.�Investigations�are�being�carried�out�into�exactlyhow�much�of�a�problem�this�might�present�and�possible�ways�toalleviate�the�problem�(Ofgem�2007).�One�potential�solution�is�the

ippr�|�Energy�Security�in�the�UK:�an�ippr�FactFile18
use�of�demand-side�responses,�such�as�incentivising�large�energy-users�not�to�use�electricity�at�times�when�demand�is�especially�high,or�by�incorporating�‘dynamic�demand’�devices�into�householdelectrical�goods�(Dynamic�Demand�2007).
The�Government’s�Renewables�Obligation�(RO)�has�created�anincentive�for�investment�in�renewable�sources.�Onshore�wind�andlandfill�gas�have�been�the�main�beneficiaries�of�the�policy�to�datebut�it�is�recognised�that�more�could�be�done�to�drive�innovation�andfoster�emerging�technologies�(DTI�2006a).�At�the�time�of�writing,�aconsultation�on�reforming�the�RO�is�being�carried�out.�Proposalsinclude�the�introduction�of�a�system�of�banding�which�wouldencourage�less�well�established�technologies�such�as�offshore�windand�photovoltaic�solar�panels�(DTI�2007e).
NuclearFollowing�the�Government’s�Energy�Review�in�2006,�interest�in�theidea�of�building�new�nuclear�power�stations�in�the�UK�has�enjoyed�aresurgence.�The�2007�Energy�White�Paper�suggests�that�a�new�fleetof�nuclear�power�stations�would�contribute�to�the�twin�goals�ofimproving�energy�security�and�reducing�CO2 emissions�(DTI�2007f).The�rationale�for�improved�energy�security�is�based�on�four�factors:
• Reducing�reliance�on�imports�of�fossil�fuels
• Providing�a�diverse�mix�of�technologies�used�to�generateelectricity,�reducing�reliance�on�any�one�technology
• Sourcing�fuel�from�a�greater�geographical�spread�of�countries(in�contrast�to�gas�and�oil,�which�tend�to�be�concentrated�in�afew�countries)
• Providing�greater�resistance�to�fuel�price�fluctuations�than�forfossil-fuel-based�power�stations.
Beyond�these�security�of�supply�issues�is�a�set�of�wider�securityconcerns�related�to�the�use�of�nuclear�power.�The�Governmentconcludes�that�the�risk�of�a�serious�accident�is�low�and�that�theexisting�security�regime�is�robust�and�effective�enough�to�protectagainst�a�terrorist�attack�on�nuclear�power�stations.�It�is�also�arguedthat�the�risk�posed�by�diverting�nuclear�materials�from�powerstations�is�low�(DTI�2007f).
However,�critics�claim�that�this�view�of�energy�security�is�too�narrowand�should�take�wider�security�concerns�into�account.�In�its�2006review�of�nuclear�power,�the�Sustainable�Development�Commission(SDC)�argued�that�if�nuclear�power�proves�part�of�the�solution�toreducing�CO2 emissions�in�the�UK,�then�it�will�be�considered�a�viablesolution�for�all�countries�(SDC�2006b).�If�nuclear�technologiesbecome�more�widespread�globally,�it�could�become�more�difficult�tomonitor�compliance�with�international�treaties�and�control�thespread�of�nuclear�weapons.�It�could�also�increase�opportunities�fornuclear�terrorism�(both�attacks�on�nuclear�installations�and�the�useof�stolen�fissile�material�for�the�manufacture�of�nuclear�explosives)(SDC�2006b,�Barnaby�and�Kemp�2007).�These�wider�securityconcerns�will�be�considered�in�greater�detail�as�part�of�the�work�ofippr’s�Commission�on�Security�in�the�21st�Century�(for�moreinformation,�see�ippr�2007).
Closer�to�home,�concerns�have�been�raised�recently�about�thevulnerability�of�nuclear�power�stations�–�which�must�be�built�withgood�access�to�cooling�water�–�to�sea�level�rise�and�increased�storm
surge�as�a�result�of�climate�change.�Greenpeace�carried�out�anassessment�of�four�proposed�new-build�sites�and�concluded�that�atleast�three�of�them�faced�such�a�threat�over�the�next�200�years(Greenpeace�2007).�
The�second�reason�for�adopting�nuclear�power�–�that�it�will�helpreduce�CO2 emissions�–�is�also�subject�to�some�criticisms.�Althoughnuclear�is�a�low-carbon�technology,�it�will�not�deliver�CO2 reductionsin�the�short�to�medium�term,�since�planning,�development�andconstruction�of�any�new�station�is�likely�to�take�many�years.�TheGovernment�acknowledges�that�new�nuclear�will�not�bring�anybenefits�in�terms�of�emission�reductions�until�2020�(DTI�2007f).Several�commentators�have�expressed�concerns�that�new�nuclearbuild�will�lock�the�UK�into�a�centralised�energy�system,�reducing�theopportunities�for�developing�more�efficient�decentralised�energysystems�(SDC�2006b,�Greenpeace�2006).�There�are�also�concernsthat�political�attention�will�be�diverted�away�from�increasing�the�useof�renewable�energy�and�improving�energy�efficiency�measures(SDC�2006b).
The�Government’s�2006�Energy�Review�concluded�that�the�marketshould�deliver�new�nuclear�stations,�but�that�government�shouldremove�regulatory�barriers,�particularly�planning�regulations,�whichcan�significantly�lengthen�the�amount�of�time�taken�to�construct�anew�station�(DTI�2006a).�The�2007�Energy�White�Paper�asserts�thatnew�nuclear�power�stations�would�bring�economic�benefits�to�theUK,�in�the�context�of�reducing�CO2 emissions�and�increasing�energysecurity.�The�full�costs�of�the�construction,�operation,decommissioning�and�waste�management�would�be�bourne�byprivate�sector�companies.�However,�some�commentators�maintainthat�the�nuclear�power�industry�still�benefits�from�indirect�subsidiesin�the�form�of�caps�on�insurance�liability.
In�May�2007,�the�Government�launched�a�consultation�on�nuclearpower�and�whether�the�private�sector�should�be�allowed�to�buildnew�nuclear�power�stations.�The�consultation�closes�in�October2007�with�the�intention�that�a�decision�will�be�taken�later�in�theyear�on�whether�to�allow�new�nuclear�build.
TransportThere�are�four�main�alternative�fuels�for�road�transport.�These�are:�
• electricity
• mineral�gases�such�as�Liquid�Petroleum�Gas�(LPG)�andCompressed�Natural�Gas�(CNG)
• hydrogen
• biofuels.�
Electricity�is�restricted�to�battery-driven�or�hybrid�vehicles.�Mineralgases�require�engine�modifications�in�order�to�run�and�are�subject�tothe�same�security�of�supply�concerns�that�apply�to�gas�supplied�forheat�and�electricity�generation.�Hydrogen�used�for�fuel�cell�vehiclesis�not�a�viable�short-term�solution,�although�it�could�play�animportant�part�in�the�future�(Fergusson�et�al 2006).
Biofuels�can�be�blended�with�conventional�petroleum�products�andused�in�conventional�combustion�engines.�Under�the�RenewableTransport�Fuel�Obligation,�the�Government�has�set�a�target�that�5per�cent�of�transport�fuel�supplied�must�be�from�renewable�sourcesby�2010/11.�However,�there�is�still�a�vigorous�debate�around�the

ippr�|�Energy�Security�in�the�UK:�an�ippr�FactFile19
use�of�biofuels.�From�an�environmental�point�of�view,�there�arequestions�about�the�actual�level�of�greenhouse�gas�reductions�oncethe�total�lifecycle�emissions�of�growing�and�transporting�the�cropsare�taken�into�account.�There�are�also�important�questions�aboutthe�protection�of�biodiversity,�which�have�yet�to�be�fully�addressed(for�example,�see�UN-Energy�2007).
There�are�no�real�alternatives�to�kerosene�for�aviation�fuel�in�theshort�or�medium�term.�Electricity�and�biofuels�can�be�used�for�railtransport�and�biofuels�and�wind�can�be�used�for�shipping:�a�numberof�projects�are�developing�high-tech�aerofoil�sails�and�kites�topropel�ships�and�tankers�(Fergusson�et�al 2006,�Hamer�2005).�
HeatAs�discussed�in�section�2,�most�of�the�UK’s�heating�requirementsare�met�by�gas�supplied�through�the�national�grid.�Currently,�themain�alternative�source�of�heat�is�electric�heaters,�which�account�foraround�8�per�cent�of�heat�needs�nationally�(DTI�2006a).�Clearly�theway�in�which�the�electricity�is�generated�will�determine�the�securityof�supply�for�this�alternative,�as�has�been�discussed�previously.
Aside�from�electricity,�the�other�main�alternative�fuel�for�heatgeneration�is�biomass�–�this�can�be�used�to�fuel�dedicated�heat�orcombined�heat�and�power�(CHP)�plants.�It�is�also�used�in‘distributed’�heat�generation,�for�example�in�wood-fired�stoves�andboilers.�Other�alternatives�to�fossil�fuels�for�heat�generation�includesolar�water�heating,�geothermal�heating�and�heat�pumps�–�groundsource�heat�pumps�in�particular�are�gaining�prominence�at�themoment�(DTI�2006a).
Barriers�to�increasing�use�of�renewable�sources�of�heat�include�highcapital�costs�and�uncertainties�about�long-term�demand,�which�inturn�deter�investment.�The�Biomass�Task�Force,�in�its�2005�report�toGovernment,�recommended�that�the�best�way�to�overcome�suchinvestment�uncertainties�would�be�to�introduce�streamlined�capitalgrant�support�rather�than�using�market-based�incentives�such�as�aRenewable�Heat�Obligation�(Biomass�Task�Force�2005).
Barriers�to�the�use�of�CHP�are�discussed�further�below.�
Demand�reductionReducing�demand�is�an�obvious�way�to�improve�energy�security.However,�it�is�difficult�to�point�to�countries�that�have�successfullyreduced�energy�demand�while�simultaneously�maintaining�economicgrowth�(DTI�2006a).�This�can�make�demand�reduction�seem�like�anunappealing�option.�Nevertheless,�some�studies�have�argued�that�itwould�be�possible�to�halve�the�UK’s�total�energy�use�by�2050(Cooperative�Bank�et�al 2006).�
Looking�first�at�electricity:�energy�efficiency�measures�can�be�takenat�a�number�of�points�along�the�supply�chain,�by�ensuring�the�mostefficient�use�of�fuel,�minimising�transmission�and�distribution�lossesand�taking�measures�to�reduce�consumption�by�the�end�user.
A�decentralised�energy�system�of�gas-fired�CHP�plants�could�reduceoverall�demand�for�gas�because�both�the�electricity�and�heatgenerated�by�the�plants�are�used�(as�opposed�to�centralised�gasplants,�where�the�heat�is�generally�lost�to�the�atmosphere)�therebyreducing�the�total�amount�of�gas�used.�Losses�from�transmissionand�distribution�are�also�reduced�because�the�electricity�is�generatedclose�to�the�point�of�use�(Greenpeace�2006).�Woodman�andMitchell�(2006)�argue�that�a�more�decentralised�energy�system�will
bring�a�number�of�other�benefits�to�energy�security,�includingincreased�system�flexibility�and�greater�reliability�(owing�to�reducedreliance�on�long-distance�transmissions�lines�and�because�faults�insmaller�plants�affect�fewer�people).�
The�barriers�to�distributed�energy�include:�
• A�lack�of�awareness�among�developers�and�planning�authorities
• Difficulties�obtaining�planning�permissions
• Problems�around�selling�electricity�back�to�the�grid�(both�interms�of�process�and�the�price�offered�by�electricity�companies)�
• The�higher�costs�of�these�technologies�compared�toconventional�technologies�(DTI�2006a).�
In�terms�of�consumption�by�the�end�user,�two�areas�where�energyefficiency�could�be�particularly�important�are�domestic�heating�andtransport.�As�described�in�section�1,�the�biggest�consumer�of�gas�inthe�UK�is�the�domestic�sector.�The�vast�majority�of�this�is�used�forheating�space�and�water.�Likewise,�transport�accounts�for�around�80per�cent�of�UK�consumption�of�petroleum�products.
It�is�interesting�that,�in�the�UK�at�least,�much�of�the�informationavailable�on�the�impact�of�energy�efficiency�measures�tends�to�focuson�the�reduction�in�carbon�emissions�rather�than�the�energy�saved.For�example,�the�Energy�Saving�Trust�reported�that�the�absolutecost-effective�carbon�abatement�opportunity�for�space�and�waterheating�in�the�domestic�sector�would�reduce�carbon�emissions�by�20per�cent�(EST�2005).�Fergusson�et�al (2006)�report�that�if�all�UKdrivers�switched�to�the�most�fuel-efficient�model�in�their�class,greenhouse�gas�emissions�would�be�reduced�by�32�per�cent.�Thesefigures�give�some�indication�of�the�size�of�demand�reduction�thatcould�be�made�through�efficiency�measures.�The�Government’s�Planfor�Action�on�Energy�Efficiency�calculated�that�total�energy�usecould�be�reduced�by�around�30�per�cent�over�the�next�two�decadesthrough�energy�efficiency�measures�(ippr�2006).
There�are�three�main�ways�in�which�energy�use�could�be�reduced�inthe�transport�sector:�using�more�fuel-efficient�vehicles,�using�fuelmore�efficiently�through�changing�driving�habits�or�switching�topublic�transport,�and�by�reducing�the�overall�amount�of�transport(Fergusson�et�al 2006).�In�terms�of�heat�efficiency�in�our�homes,energy�can�be�saved�through�better�insulation�and�draught-proofing.�
Even�though�installing�energy�efficiency�measures�may�be�the�mostcost-effective�option,�there�are�other�reasons�why�people�do�nottake�these�measures.�These�are:�
• ‘Hidden’�costs,�such�as�the�time�spent�researching�options�ortaken�to�install�measures�and�the�hassle�and�inconvenience�ofinstalling�measures
• Lack�of�access�to�relevant�information
• Lack�of�capital�to�pay�upfront�costs
• Difficulty�in�breaking�habitual�behaviours�or�going�againstsocial�and�institutional�norms�and�the�‘invisibility’�of�manyefficiency�measures
• The�misperception�that�people�cannot�reduce�their�energy�usefrom�current�levels

ippr�|�Energy�Security�in�the�UK:�an�ippr�FactFile20
• Split�incentives�between�landlords�and�tenants�in�the�privaterented�sector.�(Stern�2006,�Retallack�et�al 2007)
Summary• The�UK�continues�to�push�market�liberalisation�within�Europeas�the�way�to�secure�energy�supplies.
• Coal�security�is�tied�to�environmental�objectives�since�toughpolicies�on�carbon�dioxide�emissions�would�penalise�the�use�ofcoal.�CCS�could�offer�one�solution.
• The�short-term�gap�in�electricity�created�through�plant�closureswill�most�likely�be�met�through�new�coal-�and�gas-firedstations.
• Renewable�sources�of�energy�could�provide�a�large�proportionof�the�UK’s�electricity�needs.�Without�price�restrictions,�thetotal�practicable�resource�is�at�least�334TWh/year,�which�isaround�87�per�cent�of�current�electricity�production.�
• Nuclear�power�could�increase�energy�security�throughdiversifying�the�mix�of�fuels�used�for�electricity�generation,�butthere�are�concerns�that�its�use�might�lead�to�increased�securityrisks�associated�with�nuclear�proliferation�and�nuclear�terrorism.�
• Alternatives�to�oil�include�biofuels�in�the�short�term�andhydrogen�in�the�long�term.
• Demand�reduction�could�be�particularly�important�for�reducingreliance�on�gas�(through�better�insulation)�and�oil�(particularlyfrom�improved�vehicle�efficiency).
6.�Conclusion
OilWithout�oil,�the�UK’s�transport�system�would�rapidly�grind�to�a�halt.Clearly,�this�would�have�a�huge�impact�on�almost�every�aspect�oflife.�The�UK’s�own�oil�reserves�are�in�decline�and�so�we�are�rapidlybecoming�dependent�on�other�countries�to�meet�our�needs.�There�isalso�uncertainty�around�the�future�price�of�oil,�both�as�a�result�ofthe�loss�of�surplus�capacity�in�OPEC�countries�and�as�a�potentialconsequence�of�peak�oil�(see�section�4�above).�Demand�is�relativelyinelastic�in�the�short�term,�as�we�have�seen�in�recent�years�as�risingoil�prices�have�not�resulted�in�fewer�cars�on�the�road,�but�there�isthe�possibility�that�peak�oil�could�cause�significant�disruptionthrough�sharp�price�increases.�
The�main�near-term�options�available�are�to�increase�the�use�ofalternative�fuels�(which�the�Government�is�already�beginning�to�dothrough�the�Renewable�Transport�Fuel�Obligation)�and�to�encouragethe�use�of�more�efficient�and�alternatively-fuelled�vehicles�that�arealready�on�the�market.�Medium-term�options�include�improving�theenergy�efficiency�of�the�UK�car�fleet�(efforts�targeted�at�the�supplyside�will�probably�require�cooperation�at�a�European�level)�andincreasing�the�use�of�alternative�fuels�(this�will�involve�changes�tothe�fuel�distribution�network).�In�the�long�term,�hydrogen�maybecome�a�viable�fuel�source�and�this�would�require�significantchanges�to�fuel�distribution.�Demand�reduction�through�reducingthe�need�to�travel�or�through�switching�from�private�cars�to�publictransport�becomes�more�viable�through�improvements�in�planningand�interventions�such�as�road�pricing.
GasIn�the�short�term,�gas�supplies�face�a�threat�of�shortages�and�pricedisruptions,�as�a�result�of�an�increasing�reliance�on�gas�imports.�Ashortage�of�gas�supplies�in�recent�winters�has�led�to�electricity-generating�companies�switching�from�gas-�to�coal-fired�electricitygeneration.�Further�threats�to�gas�supplies�are�likely�to�lead�togreater�use�of�coal�for�electricity�production.�Without�CCS,�this�willlead�to�an�increase�in�CO2 emissions�from�this�sector.�
It�is�also�important�to�remember,�however,�that�most�of�the�UK’sgas�supply�is�used�for�heating.�In�the�short�term,�energy�efficiencymeasures�to�improve�insulation�for�space�and�water�heating�couldcontribute�significantly�to�reducing�reliance�on�imported�gas.�
In�the�medium�to�long�term,�there�is�a�risk�of�supply�not�being�ableto�meet�demand.�Alternative�sources�of�energy�could�help�to�reducedependence�on�gas,�for�example,�CHP�and�electric�heatingcombined�with�alternative�sources�of�electricity�generation.Investment�in�efficiency�measures�would�help�to�tackle�both�energysecurity�and�climate�change�objectives.
CoalSecurity�of�supply�is�less�of�a�problem�for�coal,�although�it�shouldbe�recognised�that�the�UK�is�likely�to�remain�dependent�on�importsto�meet�its�projected�demand�levels.�Attempts�to�limit�theenvironmental�impact�of�burning�coal�are�likely�to�pose�a�biggerrestraint�to�the�use�of�coal.�
Coal�is�used�mainly�to�generate�electricity.�In�the�‘merit�order’�ofgenerators,�coal�stations�are�used�to�respond�to�peaks�in�electricitydemand�throughout�the�day,�while�nuclear�and�gas�stations�providea�constant�‘base-load’.�The�reasons�behind�this�are�principallyeconomic�–�when�gas�prices�were�high�during�the�winter�of2005/06,�the�roles�of�gas-�and�coal-fired�stations�essentiallyswitched�and�coal�stations�provided�more�of�the�base�load.�A�short-to�medium-�term�solution�could�therefore�be�to�work�with�heavyusers�of�electricity�(for�example�heavy�industry)�to�even�outelectricity�demand�throughout�the�day.�Long-term�options�includereplacing�coal-fired�generation�plant�with�alternatively-fuelledgenerators�(nuclear�or�renewables)�or�to�develop�carbon�captureand�storage�capacity.
It�will�not�be�possible�to�reduce�the�UK’s�dependency�on�fossil�fuelsovernight�and�so�it�is�important�to�secure�supplies�to�provide�forshort-�and�medium-term�energy�needs.�This�will�be�achieved�mosteffectively�by�working�with�the�EU�in�negotiations�with�large�globalenergy�players,�such�as�Russia�and�China.�However,�a�responsibleenergy�policy�must�ensure�that�energy�security�for�the�UK�or�eventhe�EU�must�not�come�at�the�expense�of�other�countries’�ownenergy�security�or�the�security�of�the�climate.�
There�are�many�ways�in�which�energy�security�and�climateobjectives�align:�switching�to�alternative�(low-carbon)�fuels�andimplementing�energy�efficiency�measures�will�clearly�also�reduceCO2 emissions.�Risks�to�the�climate�arise,�however,�from�turning�tocoal�as�a�more�secure�source�of�energy�than�gas�or�oil�without�theuse�of�CCS.�Similarly,�using�non-conventional�sources�of�oil�wouldhave�a�serious�impact�on�greenhouse�gas�emissions.
This�is�a�critical�time�for�determining�the�future�energy�security�ofthe�UK�as�decisions�about�new�infrastructure�made�in�the�next�few

ippr�|�Energy�Security�in�the�UK:�an�ippr�FactFile21
years�will�determine�the�course�of�energy�use�for�the�next�two�orthree�decades.�The�Government’s�own�Foresight�programmeconcluded�that�a�radical�shift�was�needed�towards,�‘an�economythat�uses�much�less�energy�and�towards�energy�sources�not�basedon�carbon,�or�to�novel�ways�of�capturing�and�using�carbon’,�andhighlighted�the�fact�that�this�could�not�be�delivered�by�incrementalchange�(Foresight�2001:28).�For�a�government�committed�to�amarket-based�approach�to�deliver�energy�goals,�the�most�importantquestion�will�be�whether�the�policy�and�regulatory�framework�issufficient�to�deliver�such�a�radical�shift.
References
Note:�web�references�correct�June�2007
Anderson�D�(2006)�Costs�and�finance�of�abating�carbon�emissionsin�the�energy�sector London:�Imperial�College�London,�available�at:www.hm-treasury.gov.uk/media/8A3/32/stern_review_supporting_technical_material_dennis_anderson_231006.pdf�
Anderson�D�(2007)�Energy�Industry�Markets�and�Climate�Changepaper�for�the�Commission�on�Environmental�Markets�and�EconomicPerformance (forthcoming)
Barnaby�F�and�Kemp�J�(Eds)�(2007)�Secure�energy?�Civil�nuclearpower,�security�and�global�warming London:�Oxford�ResearchGroup,�available�at:�www.oxfordresearchgroup.org.uk/publications/briefing_papers/pdf/secureenergy.pdf�
BBC�(2007)�Global�worries�push�oil�above�$70,�Online�article,published�23�May,�available�at:http://news.bbc.co.uk/1/hi/business/6684745.stm�
Biomass�Task�Force�(2005)�Report�to�Government�Biomass�TaskForce,�available�at:�www.defra.gov.uk/farm/crops/industrial/energy/biomass-taskforce/pdf/btf-finalreport.pdf�
Boyle�G�(2004)�Renewable�energy�Power�for�a�sustainable�future,second�edition�Oxford:�Oxford�University�Press
BP�(2006) BP�Statistical�review�of�world�energy�June�2006,�availableat:�www.bp.com/productlanding.do?categoryId=6848&contentId=7033471
BP�(2007)�BP�Statistical�Review�of�World�Energy�2007,�ConversionFactors�webpage,�available�at:www.bp.com/extendedsectiongenericarticle.do?categoryId=9017944&contentId=7033505�
Cooperative�Bank,�Friends�of�the�Earth,�The�Big�Ask�(2006)�Thefuture�starts�here:�the�route�to�a�low-carbon�economy,�available�at:www.foe.co.uk/resource/reports/low_carbon_economy.pdf
Department�for�Business,�Enterprise�and�Regulatory�Reform�(DBERR)(2007)�Energy�Statistics:�explanatory�notes�webpage,�available�at:www.dti.gov.uk/energy/statistics/source/notes/page18916.html�
Department�for�the�Environment,�Food�and�Rural�Affairs�(Defra)(2007)�Working�with�developing�countries�–�China�webpage,available�at:�www.defra.gov.uk/environment/climatechange/internat/devcountry/china.htm�
Department�for�Transport�(DfT)�(2006)�Transport�statistics�GreatBritain�2006�edition London:�The�Stationery�Office,�available�at:www.dft.gov.uk/pgr/statistics/datatablespublications/tsgb/�
Department�of�Trade�and�Industry�(DTI)�(2005)�Digest�of�UnitedKingdom�energy�statistics�2005 London:�DTI,�available�atwww.dti.gov.uk/files/file10737.pdf
Department�of�Trade�and�Industry�(2006a)�The�Energy�Challenge.Energy�Review�Report 2006�London:�TSO
Department�of�Trade�and�Industry�(2006b)�Digest�of�UK�EnergyStatistics available�at:�www.dti.gov.uk/energy/statistics/source/gas/page18525.html�
ippr�|�Energy�Security�in�the�UK:�an�ippr�FactFile22
Department�of�Trade�and�Industry�(2006c)�Energy�Statistics�onlineresource,�DUKES�table�4.1�available�at:www.dtistats.net/energystats/dukes4_1.xls
Department�of�Trade�and�Industry�(2006d)�Understanding�gassupply�this�winter,�London:�DTI,�available�at:www.dti.gov.uk/files/file27821.pdf�
Department�of�Trade�and�Industry�(2006e)�Energy�Statistics�onlineresource,�DUKES�table�5.6,�available�at:www.dtistats.net/energystats/dukes5_6.xls
Department�of�Trade�and�Industry��(2006f)�Energy:�its�impact�on�theenvironment�and�society�2006 London:�DTI,�available�at:www.dti.gov.uk/energy/environment/energy-impact/page29982.html�
Department�of�Trade�and�Industry�(2007a)�Energy�statistics�websitewww.dti.gov.uk/energy/statistics/index.html�
Department�of�Trade�and�Industry�(2007b)�Personal�communicationwith�Clive�Evans,�19�January
Department�of�Trade�and�Industry�(2007c)�Web�page�on�fuelpoverty,�available�at�www.dti.gov.uk/energy/fuel-poverty/index.html�
Department�of�Trade�and�Industry�(2007d)�Quarterly�energy�pricesMarch�2007 London:�DTI,�available�at:www.dti.gov.uk/files/file38655.pdf�
Department�of�Trade�and�Industry�(2007e)�Reform�of�therenewables�obligation London:�DTI,�available�at:www.dti.gov.uk/files/file39497.pdf�
Department�of�Trade�and�Industry�(2007f)�Meeting�the�EnergyChallenge�a�White�Paper�on�Energy�Norwich:�TSO,�available�at:www.dti.gov.uk/files/file39387.pdf�
Drollas�L�(2006)�‘The�oil�market�–�key�questions’,�presentationgiven�to�Cantor�Index�Forum,�29�June,�available�at:www.cges.co.uk/pub/LDrollasCantor290606.pdf�
Dynamic�Demand�(2006)�Dynamic�Demand�website:www.dynamicdemand.co.uk/the_technology.htm
Energy�Saving�Trust�(EST)�(2005)�‘Household�Sector�Final�report,report�for�the�Energy�Efficiency�Innovation�Review’,�presentationavailable�at:�www.est.org.uk/uploads/documents/aboutest/EEIR_Household_summary_Dec_05.pdf�
Energy�Information�Administration�(EIA)�(2006)�Annual�energyreview�2005,�available�at:�www.eia.doe.gov/emeu/aer/contents.html
European�Technology�Platform�for�Zero�Emission�Fossil�Fuel�PowerPlants�(2007)�European�technology�Platform�for�Zero�Emission�fossilFuel�Power�plants�(ZEP)�Strategic�Overview Report�prepared�onbehalf�of�the�Advisory�Council�of�the�European�Technology�Platformfor�Zero�Emission�fossil�Fuel�Power�Plants,�available�at:�www.zero-emissionplatform.eu/website/docs/ETP%20ZEP/ZEP%20Concepts%20Final%20V2.pdf�
European�Renewable�Energy�Council�and�Greenpeace�(2007)�Energy[r]evolution available�at:�www.energyblueprint.info/fileadmin/media/documents/energy_revolution.pdf�
Fergusson�M,�Mackay�E�and�Skinner�I�(2006)�Over�a�barrel:reducing�the�UK�and�Europe’s�oil�dependency.�Report�by�theInstitute�for�European�Environmental�Policy�for�Greenpeace�UK.London:�Greenpeace,�available�at:�www.greenpeace.org.uk/contentlookup.cfm?ucidparam=20061207111604�
Foreign�and�Commonwealth�Office�(FCO)�(nd)�UK�internationalpriorities�the�energy�strategy London:�FCO,�available�at:www.fco.gov.uk/Files/kfile/Energy_Report_281004.pdf
Foresight�(2001) Energy�for�Tomorrow�Powering�the�21st�CenturyLondon:�DTI,�available�at:�http://vizyon2023.tubitak.gov.tr/teknolojiongorusu/paneller/enerjivedogalkaynaklar/kaynaklar/FC4tomorrow.pdf
Fuel�Poverty�Advisory�Group�(For�England)�(2007)�Fifth�annualreport London:�DTI,�available�at:�www.dti.gov.uk/files/file38873.pdf�
Greenpeace�(2006)�Decentralising�UK�energy:�cleaner,�cheaper,more�secure�energy�for�the�21st�century London:�Greenpeace
Greenpeace�(2007)�The�impacts�of�climate�change�on�nuclear�powerstations�sites�London:�Greenpeace,�available�at:www.greenpeace.org.uk/files/pdfs/nuclear/8179.pdf�
Hamer�M�(2005)�‘The�new�age�of�the�sail’�New�Scientist,�26February�
House�of�Commons�Environmental�Audit�Committee�(2006)�Keepingthe�lights�on:�nuclear,�renewables�and�climate�change.�Sixth�reportof�session�2005–06,�volume�1,�London:�The�Stationery�Office�
ILEX�(2006)�The�balance�of�power�Reducing�CO2�emissions�fromthe�UK�power�sector�A�report�for�WWF-UK�by�ILEX�EnergyConsulting,�Surrey:�WWF,�available�atwww.wwf.org.uk/filelibrary/pdf/ilex_report.pdf�
Intergovernmental�Panel�on�Climate�Change�(IPCC)�(2005)�IPCCSpecial�Report�Carbon�Dioxide�Capture�and�Storage,�Summary�forPolicymakers available�at:�www.mnp.nl/ipcc/pages_media/SRCCS-final/ccsspm.pdf�
International�Energy�Agency�(IEA)�(2006)�World�Energy�Outlook2006�Paris:�IEA
Institute�of�Civil�Engineers�(2006)�The�state�of�the�nation�2006London:�ICE�
Institute�for�Public�Policy�Research�(ippr)�(2006)�‘Energy�efficiencycould�solve�‘security�of�supply’�anxiety’�Press�release,�8�July,available�at�www.ippr.org/pressreleases/?id=2207�
Institute�for�Public�Policy�Research�(2007)�Commission�on�NationalSecurity�in�the�21st�Century�webpage,�available�at:www.ippr.org/security�
IPA�Energy�&�Water�Consulting�(2006)�UK�power�sector�emissions�–targets�or�reality?�Report�to�WWF-UK Edinburgh:�IPA�Energy�&Water�Consulting,�available�at:www.wwf.org.uk/filelibrary/pdf/ipareport.pdf�
Joint�Energy�Security�of�Supply�(JESS)�working�group�(2006)�JESSLong-term�security�of�energy�supply�December�2006�report,available�at:�www.dti.gov.uk/files/file35989.pdf�
Leggett�J�(2005)�Half�gone:�Oil,�gas,�hot�air�and�the�global�energy

ippr�|�Energy�Security�in�the�UK:�an�ippr�FactFile23
crisis,�London:�Portobello�Books�Ltd
Mabey�N�(2006)�‘Beyond�zero�sum�politics:�frameworks�fordelivering�energy�and�climate�security�in�the�Asia�Pacific�region.’Presentation�at�‘Energy�security�in�the�Asia-Pacific�region:�conflictpotential�and�possible�solutions’,�East-West�Institute�and�MadariagaEuropean�Foundation,�Brussels,�September�27�
Mitchell�J�(2005)�Producer�–�consumer�dialogue:�what�can�energyministers�say�to�one�other? London:�Chatham�House,�available�at:www.chathamhouse.org.uk/pdf/research/sdp/Nov05energy.pdf�
Mitchell�J�(2006i)�(2006)�A�new�era�for�oil�prices�London:�ChathamHouse,�available�at:�www.chathamhouse.org.uk/pdf/research/sdp/Oilprices0806.pdf�
Mott�MacDonald�(2004)�UK�coal�production�outlook:�2004-16�Finalreport�for�the�Department�of�Trade�and�Industry.�Brighton:�MottMacDonald,�available�at:�www.dti.gov.uk/files/file14151.pdf
Norwegian�Petroleum�Directorate�(2005)�The�petroleum�resourceson�the�Norwegian�continental�shelf Stavanger:�NorwegianPetroleum�Directorate,�available�at:�www.npd.no/English/Emner/Ressursforvaltning/Ressursregnskap_og_-analyse/Ressursrapport_2005/ressrapp05.htm�
Ofgem�(2006a)�Securing�Britain’s�gas�supply.�Ofgem�factsheet�32,available�at:�www.ofgem.gov.uk/Media/FactSheets/Documents1/15916-sosgasupdatenov06.pdf
Ofgem�(2006b) Ofgem’s�commitment�to�sustainable�development.Ofgem�factsheet�65.�available�at:�www.ofgem.gov.uk/Media/FactSheets/Documents1/15911-susdevfactsheet.pdf
Ofgem�(2007)�Personal�communication�with�Sonia�Brown,�Directorof�Wholesale�Markets,�Ofgem,�28�February
OPEC�(2006)�Annual�Statistical�Bulletin�2005 Vienna:�OPEC,available�at�www.opec.org/library/Annual%20Statistical%20Bulletin/pdf/ASB2005.pdf�
Renewable�Energy�Systems�(2006)�Plugging�the�gap:�a�survey�of
the�world�fuel�resources�and�their�impact�on�the�development�ofwind�energy Kings�Langley:�RES,�available�at:�www.gwec.net/uploads/media/RESGWEC-Plugging_the_Gap_report_01.09.06.pdf�
Retallack�S,�Lawrence�T�with�Lockwood�M�(2007)�Positive�Energy:Harnessing�people�power�to�prevent�climate�change London:�ippr
Stern�N�(2006)�Stern�review�on�the�economics�of�climate�changeLondon:�HM�Treasury
Sustainable�Development�Commission�(SDC)�(2006a)�Reducing�CO2emissions�–�nuclear�and�the�alternatives. Paper�2�of�the�SDC�nuclearevidence�base�London:�SDC
Sustainable�Development�Commission�(2006b)�The�role�of�nuclearpower�in�a�low�carbon�economy London:�SDC,�available�at:�www.sd-commission.org.uk/publications/downloads/SDC-NuclearPosition-2006.pdf�
UN-Energy�(2007)�Sustainable�Bioenergy:�A�Framework�for�DecisionMakers�UN-Energy,�available�at:�http://esa.un.org/un-energy/pdf/susdev.Biofuels.FAO.pdf�
UK�Petroleum�Industry�Association�Limited�(2006)�Statistical�review2006�London:�UKPIA
Watson�J,�Hertin�J,�Randall�T�and�Gough�C�(2002)�Renewableenergy�and�combined�heat�and�power�resources�in�the�UKManchester:�Tyndall�Centre�for�Climate�Change�Research,�availableat:�www.tyndall.ac.uk/publications/working_papers/wp22.pdf�
World�Coal�Institute�(2006)�Coal:�liquid�fuels London:�World�CoalInstitute,�available�at:�www.worldcoal.org/assets_cm/files/PDF/wci_coal_liquid_fuels.pdf�
Woodman�B�and�Mitchell�C�(2006)�Real�energy�security�and�thetransition�to�a�decentralised�energy�system Warwick:�Centre�forManagement�Under�Regulation,�Warwick�Business�School.�Availableat:�www.carolinelucasmep.org.uk/publications/pdfs_and_word/EnergySecurityBridget_Jun06.pdf�

ippr�|�Energy�Security�in�the�UK:�an�ippr�FactFile24
Annex�I
Annex�IIThe�following�tables�give�approximate�conversion�factors�for�weight,�volume�and�calorific�content�for�crude�oil,�natural�gas,�liquid�naturalgas�and�coal.
Cumulative�global�investment�in�energy�infrastructure�in�the�IEA’s�reference�scenario�(business�as�usual)�by�fuel�and�activity,2005–2030�(2005�prices)
Fuel Activity Investment�(US$)
Electricity Power�generation 5.2Transmission�and�distribution 6.1
Coal Mining 0.5Shipping�and�ports 0.1
Gas Exploration�and�development 2.2LNG�chain 0.3Transmission�and�distribution 1.4
Biofuels 0.1
Oil Exploration�and�development 3.1Refining 0.8Other 0.4
Total 20.2
Source:�IEA�2006�
Energy�units
To:
Thousand�tonnes�of� Terajoules�(TJ) Gigawatt�hours�(GWh) Million�thermsoil�equivalent�(toe)
From:� Multiply�by:
Thousand�tonnes�of� 1 41.87 11.63 0.3968oil�equivalent�(toe)
Terajoules�(TJ) 0.02388 1 0.2778 0.009478
Gigawatt�hours�(GWh) 0.08598 3.6 1 0.03412
Million�therms 2.52 105.5 29.31 1
Crude�oil
To:
Tonnes�(metric) Kilolitres Barrels US�gallons
From: Multiply�by:
Tonnes�(metric) 1 1.165 7.33 307.86
Kilolitres 0.8581 1 6.2898 264.17
Barrels 0.1364 0.159 1 42
US�gallons 0.00325 0.0038 0.0238 1

ippr�|�Energy�Security�in�the�UK:�an�ippr�FactFile25
Coal
1.5�tonnes�of�hard�coal�is�approximately�equivalent�to�one�tonne�of�oil�equivalent.
Sources:�DBERR�2007,�BP�2007.
Natural�gas�(NG)�and�Liquid�Natural�Gas�(LNG)
To:�
Billion�cubic� Billion�cubic� Million�tonnes�oil� Million�tonnes�LNG Million�barrels�oilmetres�NG feet�NG equivalent equivalent
From: Multiply�by:
Billion�cubic�metres�NG 1 35.3 0.90 0.73 6.29
Billion�cubic�feet�NG 0.028 1 0.026 0.021 0.18
Million�tonnes�oil�equivalent 1.111 39.2 1 0.805 7.33
Million�tonnes�LNG 1.38 48.7 1.23 1 8.68
Million�barrels�oil�equivalent 0.16 5.61 0.14 0.12 1