ENERGY POLICIES OF IEA COUNTRIES · PDF fileENERGY POLICIES OF IEA COUNTRIES New Zealand ......
235
ENERGY POLICIES OF IEA COUNTRIES New Zealand 2017 Review Together Secure Sustainable
Transcript of ENERGY POLICIES OF IEA COUNTRIES · PDF fileENERGY POLICIES OF IEA COUNTRIES New Zealand ......

ENERGYPOLICIES OF IEACOUNTRIES
New Zealand2017 Review
Together
SecureSustainable

ENERGYPOLICIES OF IEACOUNTRIES
New Zealand2017 Review
INTERNATIONAL ENERGY AGENCY
The International Energy Agency (IEA), an autonomous agency, was established in November 1974. Its primary mandate was – and is – two-fold: to promote energy security amongst its member
countries through collective response to physical disruptions in oil supply, and provide authoritative research and analysis on ways to ensure reliable, affordable and clean energy for its 29 member countries and beyond. The IEA carries out a comprehensive programme of energy co-operation among its member countries, each of which is obliged to hold oil stocks equivalent to 90 days of its net imports. The Agency’s aims include the following objectives:
n Secure member countries’ access to reliable and ample supplies of all forms of energy; in particular, through maintaining effective emergency response capabilities in case of oil supply disruptions.
n Promote sustainable energy policies that spur economic growth and environmental protection in a global context – particularly in terms of reducing greenhouse-gas emissions that contribute to climate change.
n Improve transparency of international markets through collection and analysis of energy data.
n Support global collaboration on energy technology to secure future energy supplies and mitigate their environmental impact, including through improved energy
efficiency and development and deployment of low-carbon technologies.
n Find solutions to global energy challenges through engagement and dialogue with non-member countries, industry, international
organisations and other stakeholders.IEA member countries:
Australia Austria
Belgium Canada
Czech RepublicDenmark
EstoniaFinland
FranceGermany
GreeceHungary
Ireland Italy
JapanKoreaLuxembourgNetherlandsNew Zealand NorwayPolandPortugalSlovak RepublicSpainSwedenSwitzerlandTurkey
United KingdomUnited States
The European Commission also participates in
the work of the IEA.
Please note that this publication is subject to specific restrictions that limit its use and distribution.
The terms and conditions are available online at www.iea.org/t&c/
© OECD/IEA, 2017
International Energy Agency Website: www.iea.org
Together
SecureSustainable

3
FOR
EWO
RD
Foreword
The International Energy Agency (IEA) has been conducting in-depth country reviews since 1976. A core activity, the process of review by peers not only supports member countries’ energy policy development and mutual learning, but also encourages exchange of international best practice and experience. In short, by seeing what has worked – or not – in the “real world,” these reviews help to identify policies that achieve objectives and bring results.
In 2016, the IEA decided to modernise the reviews by shifting their focus to key energy security challenges in fast changing global energy markets and to the transition to a clean energy system.
This report on New Zealand is the first review under this modernised structure. It analyses oil, gas and electricity security, the competition in energy markets and offers pragmatic policy advice on how to design energy and climate policies for the energy transition. New Zealand’s power markets are fundamental to the energy system transformation and to the decarbonisation of the economy at large. Therefore, the spotlight of this review is on the electricity sector.
The new format of the review offers insights into two special focus areas, which were chosen by the New Zealand government, renewable energy integration and electricity distribution.
The special focus chapter on renewable energy evaluates opportunities and challenges for increasing the share of renewable energy in the power sector and beyond, in industrial heat and transport, while ensuring their continuous system and market integration.
Electricity distribution networks and retail markets are at the heart of the energy system transformation, with more digitalisation, higher shares of electric vehicles, battery storage and growing decentralised and intermittent renewable energy. The report reviews the structure, governance and regulation of the electricity distribution service sector in New Zealand and provides recommendations for network regulation and retail market reforms.
The primary aim of this report is to support New Zealand in its quest for a secure, affordable and environmentally sustainable transformation of its energy sector and economy. It is my hope that the country reviews will guide our member governments in their energy transition and contribute to a cleaner, more sustainable and secure global energy system.
Dr. Fatih Birol
Executive Director
International Energy Agency
© O
ECD
/IEA,
201
7

5
TABL
E O
F C
ON
TEN
TS
THE ENERGY SYSTEME AT A GLANCE
Foreword 3
1. Executive summary 13
Progress and challenges 13
Energy system transformation 14
Special focus 1: Renewable electricity towards 90% 15
Special focus 2: Electricity distribution development 16
Energy security 18
Key recommendations 19
2. The energy system at a glance 23
Country overview 23
Institutional framework 24
Changes in supply and demand 26
Changes in emissions 29 References 31
PART I. ENERGY SECURITY
Summary of Part I 33
3. Natural gas 35
Overview 35
Supply and demand 35
Gas regulatory framework 38
Gas infrastructure 39
Gas market structure 42
Gas security policy 43
Gas prices and taxes 44
Assessment 45
Recommendations 47 References 47
© O
ECD
/IEA,
201
7

6
4. Oil 49
Overview 49
Supply and demand 49
Oil regulatory framework 52
Oil infrastructure 54
Oil retail market structure 56
Oil security 57
Oil prices and taxes 58
Assessment 59
Recommendations 60 References 60
5. Electricity 61
Overview 61
Institutions and regulatory oversight 61
Wholesale market 63
Retail market 73
Electricity networks 83
Regulatory framework 87
Security of electricity supply overview 89
Reliability of electricity supply 89
Generation diversity 91
Generation resource adequacy 92
Generation availability and flexibility 93
Security of supply legal framework 95
Network adequacy 99
Assessment 101
Recommendations 107 References 108
6. Special Focus 1: Renewable electricity towards 90% 109
Overview 109
Introduction 109
© O
ECD
/IEA,
201
7

7
TABL
E O
F C
ON
TEN
TS
Supply and demand 110
Potential and prospects for increased renewable generation 112
Conclusions on prospects for growth and resulting priorities 113
Power system context for renewables integration 114
Priority 1: System operation at high shares of variable generation 117
Priority 2: Resource adequacy with higher shares of renewable energy 120
Priority 3: Market design ensuring economic efficiency and robust price signals 121
Assessment 123
Recommendations 124 References 124
7. Special Focus 2: Electricity distribution development 127
Overview 127
Electricity distribution sector 127
Regulatory framework 133
Emerging policy issues 139
Strengthening the governance framework 141
Assessment 160
Recommendations 162 References 163
PART II. ENERGY SYSTEM TRANSFORMATION
Summary of Part II 165
8. Energy system transformation overview 167
Energy system trends 167
Carbon intensity 168
Energy intensity 169
Renewable energy supply/demand 171
Energy strategies 173
GHG targets 174
Energy and climate scenarios 174
© O
ECD
/IEA,
201
7

8
Mitigation and adaptation 175
Energy RD&D strategy 178
Assessment 180
Recommendations 184 References 184
9. Electricity and heat 187
Overview 187
Supply and demand 187
Heat supply and demand 191
Policies and measures 192
Assessment 193
Recommendations 195 References 195
10. Industry 197
Overview 197
Energy consumption and efficiency 197
Policies and measures 201
Case study: The changing role of coal 201
Assessment 206
Recommendations 208 References 208
11. Transport 209
Overview 209
Energy consumption and efficiency 209
Policies and measures 212
Case study: Electrification of the transport sector 213
Assessment 216
Recommendations 218 References 218
12. Residential and commercial 219
Overview 219
© O
ECD
/IEA,
201
7

9
TABL
E O
F C
ON
TEN
TS
Energy consumption and efficiency 219
Policies and measures 221
Assessment 224
Recommendations 226 References 227
PART III. ANNEXES
ANNEX A: Organisation of the review 229 ANNEX B: Energy balances and key statistical data 232 ANNEX C: International Energy Agency “Shared Goals” 236 ANNEX D: Glossary and list of abbreviations 238
© O
ECD
/IEA,
201
7

10
LIST OF FIGURES, TABLES AND BOXES
Figures 2.1 Map of New Zealand ...................................................................................................... 22 2.2 TPES, 1973-2015 ........................................................................................................... 26 2.3 Breakdown of TPES in IEA member countries, 2015 .................................................... 27 2.4 Energy production by source, 1973-2015 ...................................................................... 28 2.5 TFC by sector, 1973-2014.............................................................................................. 28 2.6 New Zealand’s greenhouse gas emissions by sector, 1990 and 2014. ......................... 30 2.7 New Zealand’s greenhouse gas emissions by gas, 1990 and 2014. ............................. 30 2.8 CO2 emissions by sector, 1973-2014 ............................................................................. 31 2.9 CO2 emissions by fuel, 1973-2014 ................................................................................. 31 3.1 Natural gas supply by source, 1973-2015...................................................................... 36 3.2 Natural gas demand by sector, 1973-2014 .................................................................... 37 3.3 Map of New Zealand’s high-pressure natural gas infrastructure ................................... 40 3.4 Map of New Zealand‘s natural gas distribution infrastructure ........................................ 41 3.5 Retail market shares ...................................................................................................... 43 3.6 Gas prices in New Zealand and in selected IEA member countries, 1985-2015 ........................................................................................................... 44 3.7 Gas prices in IEA member countries, 2015.................................................................... 45 4.1 Crude oil supply by source, 1973-2015 .......................................................................... 50 4.2 Crude oil imports by source, 1978-2015 ........................................................................ 50 4.3 Oil production forecast by field in New Zealand to 2050 ................................................ 51 4.4 Oil demand by sector, 1973-2014 .................................................................................. 52 4.5 Oil consumption by product, 2015 .................................................................................. 52 4.6 Map of New Zealand’s oil infrastructure ......................................................................... 55 4.7 Fuel prices in IEA member countries, first quarter 2016 ................................................ 58 5.1 Evolution of market concentration (HHI) and retail competition (ICP count) ................. 67 5.2 Market concentration (HHI) and retail competition (ICP count) ..................................... 68 5.3 Wholesale electricity monthly average prices, North Island and South Island,
2009-16 ............................................................................................................... 71 5.4 Wholesale electricity weekly average prices and actual energy cost,
1998-2010 ........................................................................................................... 71 5.5. Hedge market products and their volume, 2009-14 ....................................................... 73 5.6 Evolution of retail market shares of gentailers and small retailers ................................. 74 5.7 Electricity prices in New Zealand and in other selected IEA member countries,
1980-2015 ........................................................................................................... 75 5.8 Trends and composition of electricity prices, 2004-15 ................................................... 75 5.9 Industry electricity prices in IEA member countries, 2014 ............................................. 76 5.10 Household electricity prices in IEA member countries, 2015 ......................................... 77 5.11 Trends in retailer switching rates in New Zealand, 2004-16 .......................................... 80 5.12 Monthly HVDC transfers between North Island and South Island ................................. 84 5.13 Map of New Zealand’s electricity transmission network ................................................ 85 5.14 Map of New Zealand’s electricity distribution companies .............................................. 86 5.15 Unserved energy due to transmission outages, 1991 to 2013....................................... 90 5.16 Quality of supply of distribution networks (non-normalised SAIFI, 2011-15) ................. 90 5.17 Quality of supply of distribution networks (non-normalised SAIDI, 2011-15) ................. 91 5.18 Installed versus available capacity in New Zealand ....................................................... 91 5.19 Stress tests: Net capacity margins for the North Island (NI), South Island (SI)
and New Zealand (NZ) in three scenarios (2015 base year) .............................. 93
© O
ECD
/IEA,
201
7

11
TABL
E O
F C
ON
TEN
TS
5.20 Availability of electricity supplies from different renewable energy sources during the year ................................................................................................... 95
5.21 Controlled hydro storage and risk curves, 2010-18 ...................................................... 96 5.22 South Island controlled storage, 2012 versus 2008 ...................................................... 97 5.23 Planned and historic transmission grid investment, 1995/96 to 2019/20 .................... 100 5.24 Change in average capital expenditure relative to historic average (%) ..................... 101 6.1 Electricity generation from renewable sources as a percentage of all
generation in New Zealand and in IEA member countries, 2015 .................... 110 6.2 Share of VRE generation in 2014 for selected OECD countries................................. 115 6.3 The integration challenge ............................................................................................ 115 6.4 Installed generating capacity in Brazil, 2015 ............................................................... 123 7.1 Distributors’ nominal internal rate of return, 2013-15 .................................................. 136 7.2 Rate of growth in revenues, 2013-15 .......................................................................... 136 7.3 Percentage change in distributors’ average annual expenditure
between 2008‐12 and 2013‐15 ........................................................................ 137 7.4 Trends in the frequency and duration of distribution system interruptions ................. 138 7.5 EER model for allocating roles and functions among distribution sector
participants ...................................................................................................... 147 7.6 Regulated (non-exempt) distributors, distribution sector and economy
TFP indices, 1996-2014 ................................................................................... 149 8.1 Trends in the New Zealand energy system transformation, 1990-2014 ..................... 168 8.2 Energy-related CO2 emissions per unit of GDP in New Zealand and in other
selected IEA member countries, 1973-2014 .................................................... 168 8.3 CO2 emissions and main drivers in New Zealand, 1990-2014 ................................... 169 8.4 Energy intensity in New Zealand and in other selected IEA member
countries, 1973-2015 ....................................................................................... 170 8.5 TPES per capita in IEA member countries, 2015 ....................................................... 170 8.6 Total TFC broken down into activity, structural changes and
energy intensity, 2014 ...................................................................................... 171 8.7 Energy savings in total final consumption from energy efficiency
improvements by sector, 1990-2014 ................................................................ 171 8.8 Renewable energy as a percentage of TPES, 1973-2015 .......................................... 172 8.9 Renewable energy as a percentage of TPES in New Zealand and IEA
member countries, 2015 .................................................................................. 172 8.10 Historic and projected CO2 emissions in New Zealand .............................................. 175 8.11 Government energy RD&D spending as a ratio of GDP in IEA
member countries, 2014 .................................................................................. 179 8.12 Government energy RD&D spending, including demonstration, 1987-2015 .............. 180 9.1 Electricity generation by source, 1973-2014 ............................................................... 188 9.2 Electricity generation by source in IEA member countries, 2015 ............................... 189 9.3 Electricity consumption by sector, 1973-2014 ............................................................ 190 9.4 Heat supply and demand in New Zealand, 2014 ........................................................ 192 10.1 TFC by source in the industry sector, 1973-2014 ....................................................... 198 10.2 TFC by source in the agriculture sector, 1973-2014 ................................................... 198 10.3 Energy consumption in selected industries and agriculture, 1990-2014 .................... 199 10.4 Energy intensity in selected industries, 1990-2014 ..................................................... 200 10.5 Industry TFC broken down into activity, structural changes and
energy intensity, 2014 ...................................................................................... 200 10.6 Heat demand and supply in industry, 2014 ................................................................. 201 10.7 Coal supply by source, 1973-2015 .............................................................................. 202 10.8 Coal net exports by country source, 1990-2015 ......................................................... 203 10.9 Coal demand (in terms of TPES) by sector, 1973-2014 ............................................. 204
© O
ECD
/IEA,
201
7

12
10.10 Coal mines in New Zealand ........................................................................................ 205 11.1 TFC by source in the transport sector, 1973-2014 ...................................................... 210 11.2 Transport energy by subsector and vehicle type, 2014 ............................................... 210 11.3 Passenger transport by means of transport (indexed 1990), 1990-2014 .................... 211 11.4 Vehicle fuel intensities in selected IEA member countries, 2000-13 ........................... 211 11.5 Freight transport TFC broken down into activity, structural changes and energy
intensity, 1990-2014 .......................................................................................... 211 11.6 Passenger transport TFC broken down into activity, structural changes and
energy intensity, 2014 ....................................................................................... 212 11.7 Global electric vehicle fleet per country, 2005-15 ........................................................ 215 12.1 TFC by source in the residential and commercial sectors, 1973-2014 ........................ 220 12.2 Residential TFC broken down into activity, structural changes and energy
intensity, 2014 ................................................................................................... 220 12.3 Energy intensity by user group in the residential sector, 1990-2014 ........................... 223 12.4 Lighting intensities in the residential sector in selected IEA member
countries, 2000-13 ............................................................................................ 224
Tables 5.1 New Zealand’s big five gentailers, 2015 .......................................................................... 64 5.2 Evolution of the market share of the big five gentailers, 2005, 2010 and 2015 ............... 65 5.3 Percentage change of transmission, distribution and total lines component,
2011-16 ................................................................................................................... 76 6.1 Renewable electricity generating capacity, 1990-2014 (MW) ........................................ 111 7.1 Key features of New Zealand’s electricity distribution sector ......................................... 129 8.1 Sector objectives and targets ......................................................................................... 173 11.1 Summary of benefits and barriers for EV market development .................................... 214
Boxes
5.1 Quantitative overview of demand response in New Zealand .......................................... 79 5.2 The Swedish power reserve ............................................................................................ 98 6.1 Case study: Ireland ....................................................................................................... 119 6.2 Case study: Brazil ......................................................................................................... 122 7.1 Changing business and regulatory models for distribution system operators
(DSOs) ................................................................................................................... 146 7.2 An overview of the RIIO performance-based regulatory framework ............................. 158 8.1 The Paris Agreement .................................................................................................... 176 8.2 Review of the New Zealand Emissions Trading Scheme (NZETS) .............................. 178 12.1 Energy and air pollution................................................................................................. 221
© O
ECD
/IEA,
201
7

13
EXEC
UTI
VE S
UM
MAR
Y AN
D K
EY R
ECO
MM
END
ATIO
NS
1. Executive summary
Progress and challenges
The energy markets and policy environment in New Zealand have seen rapid changes during the six years since the IEA presented the last in-depth review in 2010. New Zealand has an effective energy-only market. It is a world leading example of a well-functioning electricity market, which continues to work effectively. Amid concerns of price spikes and reliability of supply during the 2000s, the government has implemented a series of reforms to strengthen competition and security of supply in the electricity market following the Ministerial Review of 2010. It has adopted a national energy strategy for 2011-21 and related energy efficiency strategy. It issued a national statement on renewable energy in 2011. It revised the petroleum and minerals regulatory and royalty regime in 2013 to enhance resource development. All these actions contributed to a more reliable, affordable and environmentally sustainable energy system in New Zealand.
The country is endowed with a diverse range of energy sources, notably renewables. Among IEA member countries, New Zealand has the highest penetration of geothermal energy and a significant contribution from hydro. Without any direct subsidies or public support, their share in electricity and heat supply has grown in recent years, as a result of cost-competitive geothermal and hydro and very good conditions for wind power. This performance is a world-class success story among IEA member countries.
Greater market efficiency was expected from the partial privatisation of the three main state-owned generator-retailers (referred to as “gentailers”), and the virtual asset swaps between these corporations, including the sale of Tekapo A&B stations in the South Island (from Meridian Energy to Genesis Energy). The reforms included the renewal of the regulatory framework for the electricity sector. The Electricity Industry Act 2010 established the Electricity Authority (EA) as the regulator of the electricity markets with a mandate to promote competition, reliable supply and the efficient operation of the electricity sector for the long-term benefit of consumers. Improvements derive from market facilitation actions to encourage consumers to switch supplier, to reduce market barriers through continuous reviews of the Electricity Industry Participation Code. The Electricity Authority supports the development of financial markets by introducing financial transmission rights (FTRs) and encouraging cap products. All of these measures, including new spot-price derivative products with the Australian Stock Exchange (ASX future contracts) improve market-based risk management against high spot prices.
In recent years, the market has been able to ensure security of supply and avoid major price spikes during years of lower hydro storage levels, as in 2012. Information provided by Transpower’s adequacy assessments facilitated the conclusion of commercial
© O
ECD
/IEA,
201
7

14
1. EXECUTIVE SUMMARY AND KEY RECOMMENDATIONS
agreements by market participants to ensure adequacy in future years. In 2010, the government decided to abolish its reserve mechanism and introduced a new mechanism which requires all retailers to compensate their customers in the advent of a public conservation campaign in a dry year.
Energy system transformation
Besides electricity market reforms, the government has adopted a number of new energy policy initiatives. Since the last IEA in-depth review in 2010, a key development has been the release of the New Zealand Energy Strategy (NZES) (2011-21) and the New Zealand Energy Efficiency and Conservation Strategy (NZEECS) (2011-16). These strategies provide a clear set of overall policy priorities, and some specific targets, which complement the New Zealand Emission Trading Scheme (NZETS). In 2016, New Zealand adopted an electric vehicle programme which targets the doubling of the electric vehicles (EVs) fleet every year to reach around 64 000 EVs by the end of 2021.
Market liberalisation, relatively low international fuel prices, decarbonisation and rapid technological change are precipitating the transformation of the economy. New Zealand’s energy sector is still dependent on the use of oil, natural gas and coal, is already facing a number of challenges in terms of the future use of fossil fuels in the economy, amid low international fuel prices and the commitments made to reduce emissions under the Paris Agreement. Domestic hard coal production is on the decline, mines are being closed, the coal industry is restructuring amid low international coal prices.
The electricity system is experiencing significant shifts including the decreasing use of fossil fuels and a higher contribution from hydro, geothermal and, increasingly, wind and solar photovoltaics (PV). Over the past decade, the energy intensity of the economy remained stable, despite solid GDP growth. This, however, hides changes across the sectors. Energy savings in the residential sector were offset by growing energy intensity in the industry sector and stable efficiencies in the transport sector. The largest increase in greenhouse gas (GHG) emissions stems from energy-related carbon dioxide (CO2) emissions that grew by 40% between 1990 and 2014, primarily from transport and electricity and heat.
New Zealand’s 2021-30 target is to reduce GHG emissions to 30% below 2005 levels by 2030, curbing an increase in emissions in the recent past. Under the Kyoto Protocol, the NZETS has been the main tool to reach this target. The government is currently reviewing the NZETS in order to strengthen carbon pricing. In May 2016, the government passed legislation to phase out the “one-for-two” transitional measure which up to now allows non-forestry businesses to pay for one emission unit for every two tonnes of carbon dioxide-equivalent emissions. However, the carbon price alone is unlikely to be the sole driver of the energy sector transformation, notably in transport. Half the light fleet consists of vehicles imported second-hand and there are no blending requirements for alternative fuels nor vehicle fuel economy or emission standards outside vehicle exhaust emission rules.
Next to changes in the fuel mix of the sectors and the role of different fuels, New Zealand will have to address energy system challenges in the course of its energy transition. These include the longer-term prospect of electrified transport, the increase in geothermal energy, or the greater use of bioenergy in the industry and power sectors.
© O
ECD
/IEA,
201
7

1. EXECUTIVE SUMMARY AND KEY RECOMMENDATIONS
15
EXEC
UTI
VE S
UM
MAR
Y AN
D K
EY R
ECO
MM
END
ATIO
NS
The use of natural gas and coal in power generation has declined, largely replaced by geothermal. Conversely, residential gas use has seen a strong increase. Geothermal has doubled its share of the energy mix, however, its related (for some reservoirs significant) GHG emissions may bring about new challenges. New Zealand’s farming industry strongly relies on coal use (domestic lignite) for process heat, and current carbon prices do not encourage biomass co-firing or the switch to solid biomass in agriculture.
Looking ahead to 2030, New Zealand has yet to adopt additional policies required for the investment in decarbonising the economy up to 2030 and beyond, towards 2050. Current energy efficiency targets and carbon price policies are not sufficient.
With a view to implement the Paris Agreement, the government should reassess its policies and adopt sectoral energy action plans, notably for the transport, built environment and industry sectors. New technology choices in the energy system (solar PV, electric vehicles, smart grids and storage) may have implications for electricity demand and system operation. In 2016, the government is preparing a refreshed NZEECS and new energy targets, which will need to be consistent with the Paris Agreement and the trends in efficiency and GHG emissions.
Special focus 1: Renewable electricity towards 90%
An electricity system based more and more on renewables will be at the heart of the energy system transformation. Over the past years, the share of renewable electricity has further increased in the power mix and reached 80.2% in 2015. New Zealand ranked second after Norway among IEA member countries and has ambitions to expand the contribution from renewable energy sources to 90% by 2025. Target achievement is likely to rely on a stable contribution with small additions from hydro generation (with inevitable variations in rainfall levels); further expansion in geothermal generation; investment in generation from wind; and perhaps also a continued growth of the residential solar PV market.
New Zealand’s power system can accommodate further renewables in meeting the 90% target without raising issues of power system security. If growth relies predominantly on geothermal and hydropower, operational impacts will be limited as both provide baseload generation. To date, New Zealand’s market design and operation of an energy-constrained system offer a high degree of operational variability, and the system has managed peak and seasonal demand variability successfully for decades. The transmission system operator Transpower is experienced and adept at managing supply and demand adequacy, and the power system demonstrates considerable flexibility and resilience. Other IEA member countries could learn from this experience.
The seasonal electricity demand profile and the negative correlation of many relevant variable renewable energy (VRE) resources with demand make the integration of VRE challenging, despite some good correlation of wind and hydro. However, the distribution of generation between the two interconnected islands, and significant uncertainties around future supply and demand patterns can create challenges. New Zealand has had a lack of long-term visibility of natural gas production for many years. The main backup Huntly coal- and gas-fired power plant is reaching the end of its lifetime and New Zealand’s aluminium smelter, which currently takes 15% of total electricity demand, has an option to end its contract and presence.
© O
ECD
/IEA,
201
7

1. EXECUTIVE SUMMARY AND KEY RECOMMENDATIONS
16
New Zealand’s power system is well placed to accommodate more variable renewable energy sources (RES) but, as IEA experience suggests, more substantial market shares may have implications for efficient market operation and maintaining power system security.
With growing shares of wind and solar power, as well as electric vehicles, the transmission system operator (TSO), distribution companies, regulators and policy makers have to manage the impact on the operational security of the power system, including in dry years, and notably at electricity distribution levels. They have to enhance the market design to maximine the energy security benefits from seasonal availability of the renewable electricity portfolio and that load management can contribute to alter load patterns to meet supply. This can be facilitated by market rules that are suitable to the variable dispatch, by efficient transmission pricing, shorter gate closures, full participation of wind generators to bidding for dispatch and ancillary services market, as well as by the flexibility required from retail demand-side response.
With higher shares of variable renewable energies in a small, energy-constrained and isolated energy system, like New Zealand, the market design of the electricity retail and distribution sectors and electricity security will need to be kept under review.
Special focus 2: Electricity distribution development
New Zealand’s electricity distribution sector is facing a period of rapid change, following the widespread deployment of advanced interval metering and the emergence of new technologies (electric vehicles, battery storage, and rooftop solar PV). These developments provide an opportunity to consider more efficient, innovative, cost-effective and responsive electricity markets throughout New Zealand, which can deliver a range of benefits for all electricity consumers. However, these developments also have the potential to radically transform the distribution system use and power flows, making the systems far more dynamic and complex to manage in an efficient and secure manner.
Distribution businesses will be at the forefront of managing these challenges. At present the distribution sector has 29 separate businesses − some large, some very small – with a range of ownership structures, including private companies, local governments and many consumer- or community-owned trusts; 17 of the 29 distributors are regulated under a price-quality path regulation by the Commerce Commission. The other 12 are exempt but have to publish performance information annually, which is evaluated by the Commerce Commission.
Concerns have been raised about the financial, technical and managerial capability of the distribution sector to respond effectively to this challenge. No evaluation has been made with regard to the productivity of the distribution companies and their capacity to efficiently and cost-effectively invest in the monitoring, management and control systems required to maintain reliability as distribution systems become more complex and subject to more dynamic real-time power flows. Concerns have also been raised about the governance and decision-making capability of the distributors and their capacity to manage this potentially complex transition in an efficient and timely manner that will help to realise the potential benefits for consumers. Recent independent audits conducted by the Auditor General have revealed several examples of investment decisions that appear inconsistent with prudent management practices. The wide range of managerial
© O
ECD
/IEA,
201
7

1. EXECUTIVE SUMMARY AND KEY RECOMMENDATIONS
17
EXEC
UTI
VE S
UM
MAR
Y AN
D K
EY R
ECO
MM
END
ATIO
NS
approaches and governance arrangements, as well as connection agreements applied within the distribution sector, are reflected in a myriad of different operational and investment practices, which may reduce sector efficiency and unduly increase the cost of co-ordinating investment and operational activities. Emerging technologies and sector consolidation change the nature of competitive and regulated activities, posing challenges to the current regulatory approach.
In view of these concerns, it would be prudent for the government to examine opportunities to improve the investment and operational incentives governing the performance of the distribution sector. For instance, opportunities may exist to harness economies of scale, to invest more cost-effectively and to improve the quality of management through more integrated regional operation and management of distribution networks.
A range of options could be considered, including:
regional service and management agreements between distributors
formation of joint ventures to manage and operate distribution assets on behalf of distributors
amalgamation of distributors.
The government should encourage the development of more efficient structural arrangements by the distribution sector in close consultation with other key stakeholders. The New Zealand Productivity Commission could be well placed to review the electricity distribution sector, with a view to identifying opportunities to improve the sector’s productivity, flexibility and its capacity to more effectively respond to the challenges. Such a review should examine the sector’s structure, governance and options for encouraging the sector to develop a more integrated regional management, operation and the development of distribution networks. In addition, the Commerce Commission has the role of analysing the performance of electricity distributors.
As distribution activities increase, there is also an opportunity to review the scope and nature of the price-quality path regulation to ensure more consistent and comprehensive incentive-based regulation of the distribution sector. The introduction of more effective management across the sector may serve to reinforce the incentives for more efficient performance through price-quality path regulation.
Regulation of distribution will need to take account of the new investment and operational environment to make sure that it does not create undue regulatory risks or costs for distributors. In particular, the government should ensure that sufficient flexibility is provided to accommodate timely and prudent investment in “smart grid” and related network control technologies in the context of the current review of price-quality path input methodologies. There may also be opportunities to complement the existing price-quality path framework with innovative performance-based incentives, including initiatives to encourage the procurement of demand response, energy efficiency, distributed generation and other local network management resources where it is efficient and cost-effective to do so.
© O
ECD
/IEA,
201
7
1. EXECUTIVE SUMMARY AND KEY RECOMMENDATIONS
18
Potential barriers to the development of more cost-reflective, real-time distribution pricing, including various forms of peak pricing and capacity charging should also be examined in the context of the various reviews currently under way. Consideration should also be given to the future of the low fixed-charge tariff/regulation, especially as more flexible and efficient products for harnessing demand response and energy efficiency begin to emerge. Consistent application of the regulatory regime would also allow for the simplification of existing distribution arrangements, especially those relating to distribution charges and connection agreements. This may help to remove a potentially significant barrier to entry for new retailers, and to strengthen effective retail competition, customer choice and access to a range of more innovative products and services. The Electricity Authority is currently reviewing distribution pricing and has recently proposed to extend the distribution sector regulatory framework through a default distribution use-of-system agreement. This proposal seeks to standardise such agreements by updating and making mandatory an existing set of model terms and conditions.
Energy security
Natural gas in New Zealand is 100% domestic, a by-product of oil exploration. The country does not have a liquefied natural gas (LNG) terminal for imports but it has now a gas storage facility and its two pipeline systems are now owned and operated by one company. The role of natural gas has grown in the residential/commercial sector, power generation, and industry (methanol production). For decades, the long-term availability of natural gas reserves has not been publicly known beyond 3 to 5 years, and no major finds were made in recent years. This continues to have significant implications for the future of industry and residential demand.
Domestic oil reserves are declining fast and the country is relying on global product markets. The refining and downstream market is in the process of consolidation, with fewer players present, while international oil companies have decreased their investments in New Zealand’s upstream sector, amid a low oil-price environment. All of New Zealand’s oil stocks are held on a commercial basis with the country having no strategic oil stocks and not placing any stockholding obligation on industry. The commercial stocks alone are not sufficient to meet the countries’ 90-day obligation under the IEA rules and the government resolved this issue a decade ago by purchasing “ticket” contracts with oil stockholders in other IEA countries, which are now financed by a levy on oil users.
New Zealand’s energy system is unique in many respects: Its geographical remoteness and low population density, and isolation from the global energy markets supply chain mean that it must be robust against sudden changes in energy supply/demand, which impact New Zealand’s economy and its globally competing energy-intensive industries (steel, aluminium and agriculture). Specific structural issues remain, notably the market dominance of the five major vertically integrated generator-retailers (gentailers), three of which remain majority state-owned enterprises. New Zealand’s hydro resources have limited storage and cannot ensure multi-seasonal water management due to low storage - an average of around 6 to 10 weeks in New Zealand. Hydropower is largely situated in the South Island and
© O
ECD
/IEA,
201
7

1. EXECUTIVE SUMMARY AND KEY RECOMMENDATIONS
19
EXEC
UTI
VE S
UM
MAR
Y AN
D K
EY R
ECO
MM
END
ATIO
NS
transported along the thin transmission grid through the high-voltage direct current link to the North Island, where most demand is located.
New Zealand’s power system brings about a unique set of challenges for maintaining security of supply. The market-based and market facilitation measures may not provide a timely or effective response in all circumstances. All recent supply crises involved hydro storage levels falling to the defined emergency thresholds and resulted in price spikes on the spot market, triggered major government reform programmes. In the past decade, security of supply crises were narrowly averted by timely rainfall. Despite recent improvements in the market design, the IEA believes that security of supply cannot be taken for granted at all times, and will need to be carefully monitored. Depending on the emerging technology and sector changes, the government may wish to adopt an additional safety-net mechanism, taking inspiration from solutions adopted in other IEA jurisdictions, like for instance the Swedish strategic energy reserve, which is market-based and includes demand-side bids.
Key recommendations
The government of New Zealand should:
Drive decarbonisation of the economy through a suite of integrated actions, including an enhanced New Zealand Emission Trading Scheme and sectoral energy action plans, especially for the transport and industry sectors, with performance-based targets which should be aligned with energy and climate goals and provide a long-term and stable framework for energy investments.
Continue to foster well-functioning wholesale and retail electricity markets, power system flexibility and thus security of supply by:
> accelerating steps towards a liquid and deep financial market as means of efficient risk management for wholesale and retail market participants
> ensuring efficient transmission pricing
> adapting the market design for the market integration of greater shares of variable renewable electricity, including wind and solar PV
> considering adopting, as a market-based safety net, a strategic reserve auction for dry years, as part of the reliability monitoring and response of the system operator.
Conduct a systematic and detailed review of likely scenarios for a portfolio of wind, solar and geothermal resources and assess impacts on grid and system reliability in a detailed integration study of the operational and system stability.
© O
ECD
/IEA,
201
7

1. EXECUTIVE SUMMARY AND KEY RECOMMENDATIONS
20
Direct the New Zealand Productivity Commission to review the electricity distribution sector, with a view to identifying opportunities to improve the sector’s productivity, flexibility and its capacity to more effectively respond to the challenges posed by the potential transformation of the sector, including by examining the sector’s structure, governance and options for encouraging the sector to develop more integrated regional management, operation and development of distribution networks.
Extend the price-quality path regulation to all distributors where it is cost-effective to do so. This would be facilitated through regional integration, starting with enforcement of reliability standards, and would enhance the regulation of all distribution services.
© O
ECD
/IEA,
201
7

21
THE
ENER
GY
SYST
EM A
T A
GLA
NC
E
General informationCountry size 269 000 km2 14th compared to IEA countriesPopulation (2015) 4.458 million 0.3% of IEA populationGDP (2015) 150.425 billion USD (PPP)
Energy system transformationSupply and demand 2015
Electricity generation: 44.2 TWh80% renewables (IEA average :24%)
Fuel shares compared to IEA averageFuel TPES IEA average Ranking in IEA Electricity IEA average Ranking in IEACoal 7% 18% 23 4% 30% 24Oil 33% 36% 19 0% 2% 28Gas 20% 26% 17 16% 25% 15Hydro 10% 2% 5 55% 13% 5Nuclear 0% 10% 17 0% 19% 17Biofuels 6% 6% 17 1% 3% 22Wind 1% 1% 11 5% 5% 15Geothermal 23% 1% 1 18% 0% 1Solar 0% 0% 18 0% 2% 22
*Consumption data are from 2014
Key energy indicator development, 1990-2014
New Zealand IEA averageTPES/Capita (Mtoe/Million) 4.61 4.48Electricity consumption/Capita (MWh/capita) 9.12 8.72CO2 emission/Capita (MtCO2/Million) 7.01 10.07
Energy securityProduction and self sufficiency 2015
Fuel Import countryCrude Oil Qatar (20.7%)
Russian Federation (15.91%)Oil Products Singapore (52.48%)
Korea (31.97%)Natural gas -
-
Coal - -
ELECTRICITYImports -Exports -
New Zealand - Energy System Overview
Intensity
New Zealand
TPES: 20.4 Mtoe, 41% renewables (IEA average 10%)
(Source: IEA energy balances 2016)
0
100
200
300
400
500
600
Carbon intensity (CO2/GDP)(tCO2 /USD PPP)
Max (Estonia)
IEA median
Min (Sw itzerland)
New Zealand 207.671
0
20
40
60
80
100
120
140
160
180
200
Energy intensity (TPES/GDP)(toe/USD PPP)
Min (Sw itzerland)
Max (Canada)
IEA median
New Zealand136.70
Coal4%
Gas16%
Biofuels & waste1%
Hydro56%
Geothermal18%
Wind5%
Renewables
0
0.2
0.4
0.6
0.8
1
1.2
1.4
1.6
0
1
2
3
4
5
6
7
Crude oil Natural gas Coal
Self s
uffici
ency
Mtoe
Production
TPES
SelfsufficiencyIEA average
80
100
120
140
160
180
200
220
1990 1993 1996 1999 2002 2005 2008 2011 2014
Index
(199
0=10
0)
Population
TPES
TFC
GDP (USDPPPs)CO2emissions
0
5
10
15
20
25
Production TPES TFC (fuel supply)* TFC (consumption)*
Mtoe
Heat
Electricity
OtherrenewableGeothermal
Natural Gas
Oil
Coal
Residential
Transport
Industry
Commercial
Imports Exports, transformation and other losses
© O
ECD
/IEA,
201
7

2. THE ENERGY SYSTEM AT A GLANCE
22
Figure 2.1 Map of New Zealand
© O
ECD
/IEA,
201
7

23
THE
ENER
GY
SYST
EM A
T A
GLA
NC
E
2. The energy system at a glance
Key data (2015 estimated)
Energy production: 16.4 Mtoe (geothermal 29.1%, natural gas 24.7%, oil 13.1%, hydro 12.8%, coal 11.8%, biofuels and waste 7.0%, wind 1.2%, solar 0.3%), +27.9% since 2005
TPES: 20.4 Mtoe (oil 32.6%, geothermal 23.4%, natural gas 20.1%, hydro 10.3%, coal 6.7%, biofuels and waste 5.7%, wind 1.0%, solar 0.2%), +20.7% since 2005
TFC (2014): 14.3 Mtoe (oil 42.4%, electricity 23.2%, natural gas 21.1%, biofuels and waste 6.9%, coal 4.3%, geothermal 2%, solar 0.1%), +8.3% since 2004
Consumption by sector (2014): industry 43.3%, transport 32.9%, commercial and public services and including agriculture 13.8%, residential 10.0%
GHG emissions with LULUCF*: 56.7 MtCO2-eq, +53.6% since 1990
CO2 emissions from fuel combustion**: 31.2 MtCO2 (oil 57.6%, natural gas 24.2%, coal 18.2%), +43.7% since 1990
CO2 emissions by sector**: transport 45.0%, industry 21.8%, power generation 18.3%, commercial 7.9%, other energy industries 5.4%, residential 1.7%
New Zealand Dollar: On average in 2015, NZD 1.434 = USD 1
* New Zealand Ministry for the Environment (2016), New Zealand’s Greenhouse Gas Inventory 1990-2014, Wellington. **IEA (2016), CO2 Emissions from Fuel Combustion 2016, www.iea.org/statistics/.
Country overview
With a population of 4.5 million and a long and narrow area of 268 021 km2, New Zealand (Aotearoa in Māori) is an island state, located in the Pacific Ocean, around 1 500 km east of Australia. Its two main islands, North Island and South Island, are separated by the Cook Strait, and other smaller islands. The remoteness of the country has given rise to a distinctive biodiversity. New Zealand has also a distinct geology and a varied topography, as it is located along a major fault line. The capital Wellington is located in the North Island, and so is the largest city, Auckland, which attracts a growing population. An earthquake destroyed large parts of the city of Christchurch in the South Island in 2011.
New Zealand is a constitutional monarchy – Elizabeth II is the Queen of New Zealand and the head of state. The Queen is represented by the Governor-General, Sir Patsy
© O
ECD
/IEA,
201
7

2. THE ENERGY SYSTEM AT A GLANCE
24
Reddy, appointed in September 2016. Since 2016, Hon. Bill English is the Prime Minister. The government is formed from an elected House of Representatives and advises the head of state, who is the source of all executive legal authority in New Zealand and acts on the advice of the government. The next parliamentary general election is scheduled for 2017. The country is divided into 16 regions, each of which has its own council.
New Zealand’s relative geographical isolation from the global supply chain of energy markets creates particular challenges to supply security. New Zealand has abundant domestic fossil fuel resources, compared to most IEA countries. Wind and bioenergy are abundant. Hydro and coal are key resources in the South Island, while the North Island has a wider variety of resources that include natural gas, oil, hydroelectricity, geothermal, coal and wind. Resource development has supported an export industry, created skilled jobs, and substantial royalty and tax revenues. The dairy industry, one of the coal consuming sectors, is the heart of a competitive agriculture sector that accounted for 4% of New Zealand’s gross domestic product (GDP) in 2015. Around 40% of the country’s GDP comes from exports and industry has a very competitive position.
New Zealand has seen a period of robust economic growth and macroeconomic stability with annual real growth rates of around 3%. The economy has performed well in recent years, and business investment, employment and well-being are high. In 2015, the World Bank ranked New Zealand as the easiest place in the world to start a business and the world’s second-easiest country to do business in general. New Zealand has a high foreign debt position which reflects low private savings and low income inequality above the OECD average. Recent welfare reforms facilitated the transition of beneficiaries into employment. The country’s economic growth is projected to continue to be solid in the coming years (OECD, 2015). However, there are constraints in housing and urban infrastructure arising from high population growth, inequalities in living standards, health care access for the disadvantaged and rising environmental pressures, including high greenhouse gas (GHG) emissions from agriculture, threats to indigenous biodiversity from invasive pests and the deteriorating water quality linked to expansion of intensive dairy farming and urban land use (OECD, 2015).
Since 2012, New Zealand has been implementing the Business Growth Agenda (BGA) along six priorities: boosting export markets; innovation; infrastructure; skilled and safe workplaces; natural resources; and capital growth. Based on the BGA, the government put forward an initiative on natural resources in 2015 for the transition to a lower-emission economy, using measures to improve economic productivity, reduce emissions through greater energy efficiency and increasing the use of renewable energy.
Institutional framework
The Ministry of Business, Innovation and Employment (MBIE) was formed in July 2012 by bringing together the Ministry of Economic Development, the Ministry of Science and Innovation, the Department of Labour and the Department of Building and Housing. MBIE is the government department in charge of energy policy and energy legislation. This responsibility spans supply- and demand-side responses, including advice on energy efficiency policy and practice. Since 2012, the Building Performance Group which is part of MBIE, is responsible for implementing the Building Act and the New Zealand
© O
ECD
/IEA,
201
7

2. THE ENERGY SYSTEM AT A GLANCE
25
THE
ENER
GY
SYST
EM A
T A
GLA
NC
E Building Code (for residential and commercial buildings). MBIE also monitors the activities of the regulatory bodies, the Crown entities.
There are 17 regional government authorities (11 regional councils, six unitary councils) which are required to provide a regional policy statement, including on natural resources.
The Electricity Authority (EA) is an Independent Crown entity set up under the Electricity Industry Act. It administers the electricity market – rules and compliance. EA also oversees the operation of the electricity retail market, controls retail market rules and provides arrangements for the protection of consumers.
The Commerce Commission (CC) is the independent Crown entity under the Commerce Act which administers competition law and regulates monopoly revenue of the electricity distribution companies and Transpower.
The Energy Efficiency and Conservation Authority (EECA) is the Crown agency responsible for energy efficiency programmes. It was established under the Energy Efficiency and Conservation Act 2000 and subject to the Crown Entities Act 2004. EECA’s role, as defined in its enabling legislation, is “To encourage, promote, and support energy efficiency, energy conservation, and the use of renewable sources of energy”. Since 2012, EECA is also in charge of the electricity efficiency programmes in the electricity sector. In 2014, it had 83 staff and an annual budget of NZD 55 million.
The Ministry for the Environment (MfE) is the government agency responsible (among other things) for ensuring New Zealand transitions to a lower-emission economy that is resilient to climate change impacts. Because many of the country’s energy efficiency policies and programmes have the co-benefit of reducing GHG emissions, MBIE, MfE and EECA work together on a number of climate change issues.
Transport policy is the responsibility of the Ministry of Transport and of the New Zealand Transport Agency. Both are responsible for transport policy, including energy efficiency policy. In collaboration with the ministry, EECA manages a number of transport-related energy efficiency programmes such as the Fuel Economy Labelling for Motor Vehicles; the Heavy Vehicle Fuel Efficiency Programme; and the Fuel-Efficient Tyre Programme.
Under the Public Finance (Mixed Ownership Model) Amendment Act 2012, the Treasury carried out partial privatisation of three large generators to become state-owned enterprises (SOEs) with a mixed ownership where the state retains a majority stake (51% to 61%). Transpower is the only 100% state-owned energy sector company.
A new Energy and Climate Strategy Group has been established to discuss the intersection between energy and climate policies. The Group is composed of senior officials from the Ministries of Business, Innovation and Employment; Environment; Transport; Primary Industries; the Treasury; the Energy Efficiency and Conservation Authority; and the Department of Prime Minister and Cabinet.
© O
ECD
/IEA,
201
7

2. THE ENERGY SYSTEM AT A GLANCE
26
Changes in supply and demand
Supply
Energy supply in New Zealand has followed an upward trend for the last four decades, but with a slow-down during 2000-07 (Figure 2.2). Total primary energy supply (TPES)1 was 20.4 million tonnes of oil-equivalent (Mtoe) in 2015, representing an increase of 20.7% from 16.9 Mtoe in 2005.
Fossil fuels accounted for 59.4% of TPES in 2015, which is the sixth-lowest share of fossil fuels in TPES among IEA members (Figure 2.3) and was made up of oil (32.6%), natural gas (20.1%) and coal (6.7%). This share has decreased from 68.2% in 2005; however, oil continues to dominate in New Zealand’s TPES. There has been a relatively rapid decrease in the shares of coal and oil, which were 13.0% and 36.2% respectively in 2005. The share of gas in TPES increased modestly, from 19.1% in 2005 to 20.1% in 2015. Natural gas and oil are increasingly replaced by geothermal energy (in electricity generation).
Renewable energy sources accounted for 40.6% of TPES: geothermal (23.4%), hydro (10.3%), biofuels and waste (5.7%), wind (1.0%) and solar (0.2%). Renewable energy production grew by 54.1% over the ten years to 2015. Geothermal doubled its share in indigenous production. The rapid increase in renewable energy’s share of TPES over the last decade has been driven by increased electricity generation from geothermal energy in replacement of electricity generated from coal, which will come to an end by 2018.
Figure 2.2 TPES, 1973-2015
0
5
10
15
20
25
1973 1976 1979 1982 1985 1988 1991 1994 1997 2000 2003 2006 2009 2012 2015
Mtoe
Oil
Coal
Natural gas
Biofuels and waste
Hydro
Geothermal
Solar*
Wind*
* Negligible. Source: IEA (2016a), Energy Balances of OECD Countries,.www.iea.org/statistics/.
Of all IEA member countries, in 2014, New Zealand had second-highest contribution of renewable energy to TPES behind Norway (44.4%). Geothermal share in TPES is by far the highest among IEA countries, representing a wide gap with Italy 3.6%, Switzerland 1.4% and Turkey 1.2%. New Zealand does not have nuclear energy.
1. TPES is made up of production plus imports minus exports minus international marine bunkers minus international aviation bunkers plus/minus stock changes. This equals the total supply of energy that is consumed domestically, either in transformation (for example refining) or in final use.
© O
ECD
/IEA,
201
7

2. THE ENERGY SYSTEM AT A GLANCE
27
THE
ENER
GY
SYST
EM A
T A
GLA
NC
E
Domestic energy production accounts for 16.4 Mtoe, a 3.5% decrease from the previous year. Overall, New Zealand’s total energy self-sufficiency was 81% in 2015. Self-sufficiency peaked in 2010 at 92% thanks to a combination of historically high domestic oil, gas and coal production while a minimum self-sufficiency of 76% was reached in 2005. The country’s extensive natural resources in coal and natural gas, and a surge in domestic production from geothermal energy sustain its stable energy security.
Energy production in New Zealand in 2015 consisted of geothermal (29.1%), natural gas (24.7%), coal (11.8%), hydro (12.8%), oil (13.1%), biofuels and waste (7.0%), wind (1.2%) and solar (0.3%) (Figure 2.4). In 2005, natural gas and coal accounted for 25.1% and 24.6% of energy production, with the remainder made up of hydro (15.6%), geothermal (15.4%), biofuels and waste (10.0%), oil (8.4%), and wind and solar together 0.9%. Notably since 2005, geothermal has increased by 141.3%, pushing up the share of renewable electricity in production from 41.9% to 50.5% in 2015. In 2015, energy imports amounted to 7.8 Mtoe (crude oil and refinery feedstock 69.6%, oil products 27.6%, coal 2.8%) with 3.0 Mtoe of exports (crude oil 59.5%, coal 32.0% and oil products 8.5%). Imports have increased by 5.6% since 2005 with exports by 22.5%. The strongest increase in exports came from crude oil (183.3% since 2005) and oil products (41.3%), while coal exports declined by 41.6%.
Figure 2.3 Breakdown of TPES in IEA member countries, 2015
0% 20% 40% 60% 80% 100%
SwedenFranceFinland
SwitzerlandNorway
New ZealandSlovak Republic
AustriaDenmarkCanadaHungary
SpainCzech Republic
PortugalGermanyBelgium
ItalyUnited Kingdom
Estonia*Korea
United StatesTurkeyGreecePolandIreland
NetherlandsLuxembourg
AustraliaJapan
Oil Coal Peat Natural gas Nuclear Hydro Biofuels and waste Wind Solar Geothermal
New Zealand
* Estonia’s coal represents oil shale. Source: IEA (2016a), Energy Balances of OECD Countries, www.iea.org/statistics/.
© O
ECD
/IEA,
201
7

2. THE ENERGY SYSTEM AT A GLANCE
28
New Zealand meets all of its natural gas needs through indigenous production, with no gas transaction activity with other countries. It is a net importer of oil, while most of the domestically produced oil is exported. This is because the country’s crude oil is very high quality with low density and low-sulphur content, which has a premium price advantage on the international market. Thus, cheaper foreign oil and oil products are imported to be refined. On the other hand, New Zealand is a net exporter of coal. High-quality coking coal is exported from the West Coast of the South Island and is mostly shipped to Asia for steel manufacturing.
Figure 2.4 Energy production by source, 1973-2015
0
2
4
6
8
10
12
14
16
18
1973 1976 1979 1982 1985 1988 1991 1994 1997 2000 2003 2006 2009 2012 2015
Mtoe
Oil
Coal
Natural gas
Biofuels and waste
Hydro
Geothermal
Solar*
Wind*
* Negligible. Source: IEA (2016a), Energy Balances of OECD Countries, www.iea.org/statistics/.
Demand
New Zealand’s total final consumption (TFC) reached 14.3 million tonnes of oil-equivalent (Mtoe) in 2014, marking a historic peak in demand. The previous record of 13.5 Mtoe dates back to 2002, closing on three decades of consecutive growth. In 2013, energy demand dropped by 5.1%, followed by a period of relatively consistent TFC with moderate volatility, averaging 12.8 Mtoe.
Figure 2.5 TFC by sector, 1973-2014
0
2
4
6
8
10
12
14
16
1973 1976 1979 1982 1985 1988 1991 1994 1997 2000 2003 2006 2009 2012
Mtoe
Industry*
Transport
Residential
Commercial**
* Industry includes non-energy use, and agriculture, forestry and fishing. ** Commercial includes commercial and public services. Source: IEA (2016a), Energy Balances of OECD Countries, www.iea.org/statistics/.
© O
ECD
/IEA,
201
7

2. THE ENERGY SYSTEM AT A GLANCE
29
THE
ENER
GY
SYST
EM A
T A
GLA
NC
E
Industry accounted for 43.3%, transport for 32.9%, commercial and public services and including agriculture for 13.8%, and residential for 10%. driven by the reduced energy consumption in industry, particularly during 2005-09 because of the economic slow-down, while demand from transport, households and commercial sectors remained rather stable (see Figure 2.5). All sectors have increased their consumption from historic levels, but show large variations in the way they use energy sources.
Changes in emissions
Greenhouse gas emissions (GHG)
In 2014, New Zealand’s total GHG emissions without land use, land-use change and forestry (LULUCF) were 81.1 million tonnes of carbon dioxide-equivalent (MtCO2-eq), 23.2% more than the 65.8 MtCO2-eq in the base year 1990. From 1990 to 2014, the average growth of GHG emissions without LULUCF was approximately 0.9% per year. With LULUCF, the 2014 GHG emissions were 56.7 MtCO2-eq, or 53.6% more than the base year.
Compared to Annex I2 Parties of the UNFCCC, New Zealand ranks fourth-highest in total GHG emissions at 23.2% during 1990-2014, after Malta (49%), Iceland (27%) and Australia (25%).
The UNFCCC’s data show that New Zealand’s agriculture sector accounted for 48.8% of total GHG emissions in 2014, 15.2% more than its 1990 level. The energy sector is the second-largest source of emissions, contributing 39.8%. The industrial process and waste sector accounted for 6.4% and 5.0% respectively (Figure 2.6).
The proportions of GHG emissions have changed since 1990 (Figure 2.7). In 1990, methane (CH4) contributed the largest portion, 49%, of the country’s total emissions, followed by carbon dioxide (CO2) at 39%. In 2014, CH4 (43% of total emissions) and CO2 (44%) contributed a nearly equal proportion. The remainder was made up of nitrous oxide (N2O, 11%) and hydrofluorocarbons (HFCs, 2%) with negligible perfluorocarbons (PFCs) and sulphur hexafluoride (SF6). This shift is related to the relatively high increase in emissions from the energy sector, which mainly emits CO2, compared to the agricultural sector, which is the main emitter of CH4.
The largest increase in GHGs stems from CO2 emissions that grew by 40% during 1990 to 2014 (Figure 2.7), driven by increases in the energy and industry sectors (Figure 2.6).
The energy sector (including transport), represented 87.3% of total CO2 emissions in 2014, with the remainder mainly from industrial processes and product use (largely metal industry) and a small part in the agricultural sector. The highest contribution of emissions in the energy sector is from road transportation.
2. Annex I Parties include the industrialised countries that were members of the OECD (Organisation for Economic Co-operation and Development) in 1992, plus countries with economies in transition (the EIT Parties), including the Russian Federation, the Baltic States, and several Central and Eastern European States. Annex II Parties consist of OECD members of Annex I, but not EIT Parties.
© O
ECD
/IEA,
201
7

2. THE ENERGY SYSTEM AT A GLANCE
30
The agricultural sector emitted 85.7% of total CH4 emissions (mostly from enteric fermentation) and 95% of N2O (mostly from agricultural soils) in 2014. The largest part of agricultural emissions came from dairy cattle, non-dairy cattle, sheep and deer.
Figure 2.6 New Zealand’s greenhouse gas emissions by sector, 1990 and 2014.
0
5
10
15
20
25
30
35
40
45
Energy Industry Agriculture Waste
Mt CO2
-eq.
1990
2014
+0%
+36%
+45%
+15%
36% 40% 5% 6% 52% 49% 6% 5%
Note: Numbers inside the columns show the sector’s contribution to total GHG emissions. Source: Ministry for the Environment (2016), New Zealand’s Greenhouse Gas Inventory 1990-2014.
Figure 2.7 New Zealand’s greenhouse gas emissions by gas, 1990 and 2014.
0
5
10
15
20
25
30
35
40
CO2 CH4 N2O Others*
Mt CO2
-eq.
1990
2014
CO2 CH4 N2h
+74%
+40% +8%
+24%
39% 44% 11%43%49% 1%11% 2%
* Others include HFCs, PFCs and SF6 . Note: Numbers inside the columns show gas’s contribution to the total GHG emissions. Source: Ministry for the Environment (2016), New Zealand’s Greenhouse Gas Inventory 1990-2014.
Sources of CO2 emissions
According to IEA data, energy-related CO2 emissions from fuel combustion are estimated at 31.2 million tonnes (Mt) in 2014, which is 43.7% more than in 1990 (21.7 Mt). Emissions peaked at 33.7 Mt in 2005 and decreased by 7.3% since (see Figure 2.8). Compared to 2004, the level of CO2 emissions from fuel combustion declined by 3.7%.
The largest CO2 emitting sector is transport, representing 45% of the total in 2014. Power generation and the manufacturing industries sectors accounted for 18.3% and 21.8% energy-related CO2 emissions in 2014, respectively. Other energy industries, including transformations and energy own-use, emitted 5.4% of total energy-related CO2 emissions in 2014. Emissions from the commercial (including agriculture) and residential
© O
ECD
/IEA,
201
7

2. THE ENERGY SYSTEM AT A GLANCE
31
THE
ENER
GY
SYST
EM A
T A
GLA
NC
E
sectors accounted for 7.9% and 1.7%, respectively. CO2 emissions from the transport and industry sectors have increased by 4.3% and 16.6% between 2004 and 2014 respectively, while emissions from the power sector have declined by 33.0% in the same decade.
Figure 2.8 CO2 emissions by sector, 1973-2014
0
5
10
15
20
25
30
35
40
1973 1976 1979 1982 1985 1988 1991 1994 1997 2000 2003 2006 2009 2012
MtCO₂
Power generation
Other energy industries*
Manufacturing industriesand construction
Transport
Residential
Commercial**
* Other energy industries include other transformations and energy own-use. ** Commercial includes commercial and public services, agriculture/forestry and fishing. Source: IEA (2016b), CO2 Emissions from Fuel Combustion 2016, www.iea.org/statistics/.
Figure 2.9 CO2 emissions by fuel, 1973-2014
0
5
10
15
20
25
30
35
40
1973 1976 1979 1982 1985 1988 1991 1994 1997 2000 2003 2006 2009 2012
MtCO₂
Oil
Coal
Natural gas
Source: IEA (2016b), CO2 Emissions from Fuel Combustion 2016, www.iea.org/statistics/.
References IEA (International Energy Agency) (2016a), Energy Balances of OECD Countries, OECD/IEA, Paris, www.iea.org/statistics/.
IEA (2016b), CO2 Emissions from Fuel Combustion, OECD/IEA, Paris, www.iea.org/statistics/.
Ministry for the Environment (2016), New Zealand’s Greenhouse Gas Inventory 1990-2014, Wellington.
OECD (Organisation for Economic and Co-operation Development) (2015), OECD Economic Surveys: New Zealand 2015, OECD Publishing, Paris, http://dx.doi.org/10.1787/eco_surveys-nzl-2015-en.
© O
ECD
/IEA,
201
7

33
PAR
T I.
ENER
GY
SEC
UR
ITY
Summary of Part I New Zealand has a vast resource base, including renewable energies, oil, gas and coal. However, no major discoveries of new oil/gas fields have been made since the last IEA review in 2010. Unlike a decade ago, when exports of oil and coal were on the rise, in recent years the role of fossil fuels has changed and their contribution to the economy is on the decline, while the importance of renewable energy (RE) in power generation has increased. While current RE growth comes from baseload capacity (geothermal), future increase is expected from intermittent wind and solar power. The greater shares of variable RE (VRE) and electric vehicles have implications for the country’s security of supply.
Low international fossil-fuel prices have weakened the case for New Zealand’s production and exports of oil/gas and coal. Investment in the exploration of new fields has decreased, despite the modernised upstream regulation and new royalties regime adopted by the government in 2009. With international hard-coal prices at rock bottom, the economics of mining hard coal for export have also come under pressure and many mines have been closed. No major new findings have been made in new oil and gas fields, apart from some enhanced recovery, reducing the long-term availability of natural gas for the economy and for domestic use. Conversely, the use of domestic lignite in industrial process heat (dairy products) and natural gas for methanol production have been on the rise in recent years in the domestic market.
An increasing amount of renewable energy is used in the electricity sector, accounting for 80% in the mix in 2015, thanks to favourable economics and uncertainties around future fossil fuel availability. In addition to an increase in geothermal, solar power has recently grown, too; however, the pace of growth remains uncertain. Wind power is a growing market with many projects in the pipeline.
To date, the power system and market rules are designed to offer high levels of flexibility to balance seasonal changes of capacity from hydro, and increasingly from geothermal. Towards 90% of renewable sources in the electricity mix, limited additions of variable renewables (wind, solar PV) in the electricity mix can be expected. There is no issue for system integration of variable renewables at a share of 5%-10%. New Zealand has completed the roll-out of advanced smart meters and demand response, and plans the greater deployment of electric vehicles (one measure to reduce emissions and oil use in the transport sector). However, opportunities aboud to develop a smart grid with more decentralised resources on the distribution networks. Electricity distribution networks are at the forefront of the energy system transformation.
The main challenge for electricity security continues to be linked to the unavailability of water reserves during dry years. In the light of the further decline in the use of fossil fuels, notably in the power sector, and the climate and energy goals of New Zealand, the case for a strategic reserve could be made so as to back up hydro capacity.
© O
ECD
/IEA,
201
7

35
PAR
T I.
ENER
GY
SEC
UR
ITY
3. Natural gas
Key data (2015)
Natural gas production: 5.0 bcm, +20.5% since 2005
Net imports: nil
Share of natural gas: 20.1% of TPES and 15.5% of electricity generation
Consumption by sector (2014): 4.4 Mtoe (industry 58.7%, power generation 28.1%, other energy 5.1%, commercial and public services and agriculture 4.9%, residential 3.1%)
Overview
New Zealand has an isolated natural gas market limited to the North Island, without import or exports. All gas produced is consumed domestically, given the limited gas storage. Household gas prices are high and rising, while industry prices are competitive, and among the lowest in IEA member countries, close to prices in Canada and the United States. New Zealand opened its first underground storage, created a trading platform and saw the consolidation of the gas transmission network operations into one system operator, FirstGas.
Natural gas use in the residential sector has been on the rise. However, there is no long-term outlook for natural gas beyond 10 years, but production has fluctuated between 4 billion cubic metres (2006) and 6 bcm (2001), depending on the consumption swings of the main gas users, the methanol production and power generation.
The government considers the development of New Zealand’s petroleum, natural gas and mineral resources as a key element in wider economic growth policies, and as part of the energy policy (New Zealand Energy Strategy, the National Infrastructure Plan and Business Growth Agenda). The New Zealand Energy Strategy 2011-2021 (NZES) and the New Zealand Energy Efficiency and Conservation Strategy 2011-2016 identify gas as an important feedstock for electricity generation and an important direct source of energy in industry and homes.
Supply and demand
Supply
New Zealand meets all of its natural gas needs through indigenous production as it has no gas trade with other countries. All gas supply is domestically produced from around 15 fields in the Taranaki region; the large fields (Pohukura and Maui) are located
© O
ECD
/IEA,
201
7

3. NATURAL GAS
36
offshore. The country does not have liquefied natural gas (LNG) import or export terminals, but imports-exports liquefied petroleum gas (LPG).
In 2015 natural gas accounted for 20.1% of total primary energy supply (TPES) and 15.5% of electricity generation. Supply amounted to 4.1 million tonnes of oil-equivalent (Mtoe) or around 5.0 billion cubic metres (bcm). This is 20.5% higher than in 2005 and 3% higher than in 2010.
Gas supply had peaked at 6.4 bcm in 2001 and experienced a sharp drop over the years 2004 to 2006, when the redetermination of the dominant Maui gas field saw domestic supply fall to 3.9 bcm in 2006. The new Pohokura field was constructed in 2006. It is now the largest gas-producing field. It began production in 2007 and in 2014 covered 38% of total production, against the Maui field (22%) and the Kupe field (12.2%). Gas supply has been on the rise since.
New Zealand’s remaining gas reserves (P50) in producing fields have been comparatively stable over the period 2007 to 2015, fluctuating between 1 952 petajoules (2007) and 2 642PJ (2014) and providing a consistent reserves/gross production ratio of between 10 and 13 years ahead. Unconventional gas resources are not firm enough to be included in the reserves.
Figure 3.1 Natural gas supply by source, 1973-2015
-2
0
2
4
6
8
1973 1976 1979 1982 1985 1988 1991 1994 1997 2000 2003 2006 2009 2012 2015
bcm
Stock changes
Indigenousproduction
Inlandconsumption
Note: 2015 data are estimates. Source: IEA (2016a), Natural Gas Information (database), www.iea.org/statistics/.
Demand
Demand patterns have changed in the last five years. Gas use by industry leads in gas consumption after it overtook the power generation sector’s share in 2012, for the first time since 2004. Power generation is the second-largest consumer (Figure 3.2).
Industry was the main consumer of natural gas in 2014 and accounted for 58.7% of total demand, up from 47.8% in 2004. This is the result of increasing demand from petrochemical industry (mainly for the production of methanol, ammonia and urea), accounting for 77.3% of industrial use of gas. Transformation of feedstock gas into methanol has a variety of uses such as for blending into transport fuels, adhesives or
© O
ECD
/IEA,
201
7

3. NATURAL GAS
37
PAR
T I.
ENER
GY
SEC
UR
ITY
production of chemicals. Methanex1 has returned to full three-train methanol production capability after a period of reduced methanol production. Petrochemical production accounts for about 50% of annual gas use. Demand from food, beverages and tobacco industries, which is 12.9% of industry use, also increased by 38% while demand from paper, pulp and wood products industry decreased.
Power generation accounted for 28.1% of total consumption in 2014. Demand from this sector contracted by 32.8% over the past decade. Higher shares of hydro and geothermal generation reduced the share of gas-fired electricity generation. Other transformations (including energy own-use) consumed 5.1% while the commercial and public services (including agriculture, fishing and forestry) consumed 4.9%, households 3.1% and transport 0.02%.
Amid increasing geothermal capacity, gas use in power generation declined with a trend away from baseload to more efficient modern peaker plants (one 200 megawatts and one 100 MW peaker plants have been constructed, while gas-fired baseload stations in Auckland (Otahuhu B and Southdown) were closed in the second half of 2015). A new 100 MW peaker plant is currently under consideration.
Figure 3.2 Natural gas demand by sector, 1973-2014
0
1
2
3
4
5
6
1973 1975 1977 1979 1981 1983 1985 1987 1989 1991 1993 1995 1997 1999 2001 2003 2005 2007 2009 2011 2013
Mtoe
Heat and powergenerationOther energy*
Industry
Residential
Commercial**
Transport***
* Other energy includes petroleum refineries and energy own-use. ** Commercial includes commercial and public services, agriculture/fishing and forestry. *** Negligible. Source: IEA (2016b), Energy Balances of OECD Countries 2015, www.iea.org/statistics/.
1. The Motunui methanol plant was opened in 1986 as the largest in the world at the time of construction. The process became uneconomic in the late 1990s as a result of falling oil prices. The production of methanol ceased in 2004 as the approaching depletion of the Maui gas field raised gas prices. In 2005, an unmanned production station for the new offshore Pohokura oil/gas field was constructed immediately west of the Motunui plant. This began commercial production in September 2006. In 2008, methanol train No.2 was recommissioned followed by train No.1 in 2012.
© O
ECD
/IEA,
201
7

38
3. NATURAL GAS
Gas regulatory framework
Upstream
Upstream regulations are set out in the Crown Minerals Act 1991. In 2009, the government (the department New Zealand Petroleum and Minerals within the Ministry of Business, Innovation and Employment, MBIE) presented the Petroleum Action Plan with a view to assist upstream investment with a new block offer regime. The Crown Minerals Act 1991 was amended to improve data availability and transparency of New Zealand’s oil and gas reserves.
The Crown Minerals Amendment Act of 2013 allows the MBIE to collect and publish more information on natural gas reserves, including P10 (also referred to as 3P) reserves, and 2C contingent resources for natural gas and LPG (previously LPG reserves had been included in natural gas reserve numbers). These amendments also allow MBIE to collect and publish data on system deliverability of natural gas from installed infrastructure by field.
The Business Growth Agenda of 2015 confirmed the promotion of New Zealand’s oil and gas reserves as a long-term benefit for the economy and that the development of exploration and deep-water activities and unconventional petroleum resources are economical to extract when oil prices rebound.
Downstream
In the downstream sector, New Zealand has had a market-led approach since 2003. The legal basis for the functioning of the natural gas market is provided by Part 4A of the Gas Act 1992 and by the Government Policy Statement on Gas Governance 2008, which set the basis for a co-regulatory model with regard to regulation of the gas wholesale and retail markets, processing facilities, transmission and distribution of natural gas, involving the government (MBIE) and the Gas Industry Company Limited (GIC). Established in 2004, GIC is the industry body and, together with the government, the co-regulator of the gas sector. Its role is to:
develop arrangements, including regulations where appropriate, which improve theoperation of gas markets, access to infrastructure, and consumer outcomes
develop these arrangements with the principal objective to ensure that gas is deliveredto existing and new customers in a safe, efficient, reliable, fair and environmentallysustainable manner
oversee compliance with, and review such arrangements.
Since 2013, the Commerce Commission (CC) has implemented economic regulation of transmission and distribution pipeline businesses and their prices. Before 2013, the Commission also partially regulated the sector through the authorisation regime of the two former transmission pipeline companies, Vector and Powerco. Today, the Commerce Commission regulates one transmission company (FirstGas, emerged after the transactions bringing together Vector and Powerco under one owner) and four distribution companies’ prices (not the third-party access to individual pipelines) worth NZD 1.6 billion in assets and revenues of NZD 300 million/year under Section 52A of the Commerce Act 1986.
© O
ECD
/IEA,
201
7

3. NATURAL GAS
39
PAR
T I.
ENER
GY
SEC
UR
ITY Part 4 of the Commerce Act 1986 subpart 10 provides that suppliers of gas pipeline
services (transmission and distribution) are subject to default/customised price-quality regulation and information disclosure. Businesses have to disclose their capital contribution policy, asset management plans, peak flow, standard and non-standard contracts, price-quality, pricing methodology, and tariffs.
Gas infrastructure
Transmission
New Zealand has two transmission pipeline systems, now owned and operated by FirstGas Limited:
309 km Maui pipeline from Oaonui, in southwest Taranaki, near the Huntly power station. The associated Maui Pipeline Operating Code is based on a common carriage system.
2 288 km former Vector pipeline system transports gas more widely throughout the North Island to which power plants and other industrial customers are connected. The associated Vector Transmission Code is based on a contract carriage system.
In recent years, the access codes of both pipelines have been converging and a single new code is being developed by FirstGas and GIC.
Distribution
A total network of 17 500 km of open-access gas distribution is owned by four distribution companies (FirstGas, Vector, Powerco and GasNet). Nova has a small network of non-open access distribution pipelines. FirstGas operates more than 4 800 km of gas distribution networks across the North Island.
Underground storage
New Zealand has one natural gas storage facility, the Ahuroa facility in Taranaki, owned by Contact Energy, which is a depleted gas field that came online in 2011, with a storage working-gas volume capacity of up to 17 PJ of gas, corresponding to about 8% of annual 2014 demand (203 PJ). The facility is not open-access.
Liquefied natural gas
There are no existing or planned LNG facilities in New Zealand. Any future LNG development is most likely to be driven by the export of any major offshore gas discovery. Grants under the Block Offer Regime have included several prospects that could fall into this category. However, LNG imports are also theoretically possible when domestic supplies become scarce.
© O
ECD
/IEA,
201
7

3. NATURAL GAS
40
Figure 3.3 Map of New Zealand’s high-pressure natural gas infrastructure
© O
ECD
/IEA,
201
7

3. NATURAL GAS
41
PAR
T I.
ENER
GY
SEC
UR
ITY
Figure 3.4 Map of New Zealand‘s natural gas distribution infrastructure
© O
ECD
/IEA,
201
7

3. NATURAL GAS
42
Gas market structure
Wholesale market
New Zealand’s wholesale market is small and concentrated, involving a small number of producers and wholesalers, relying on mainly bilateral contract arrangements, which by nature lack market transparency of trading terms (prices or other information, such as volume or trading).
The wholesale market is emerging after the creation of an industry-led spot market platform in 2013 when emsTradepoint, a subsidiary of the electricity system operator Transpower, established a formal wholesale gas trading platform. In 2015, this was expanded to provide for trading of balancing gas for the first time. Energy risk-management options are being further developed, as the emsTradepoint and the Australian Stock Exchange (ASX) have jointly launched the ASX New Zealand Gas Futures, using emsTradepoint’s indices as the reference price for the new monthly and quarterly gas futures.
Traded volumes at emsTradepoint are still low but increasing. On 30 September 2015, emsTradepoint had reported trades totalling 1.75 PJ (or 0.49 TWh) with a traded value of USD 6.7 million. On 20 April 2016, trade doubled to reach 3.87 PJ (or 1 TWh) at a value of USD 14.8 million. Prices ranged from USD 2.44 to USD 5.58/GJ.
Retail market
New Zealand has a competitive gas retail market which has continuously grown since 2010, largely building on the developments in electricity retail competition. The main players in the market are electricity generators and their retail arms, and a few independent gas retailers. In 2015, there were 11 retail brands competing in the market (listed by market share as in Figure 3.5): Genesis Energy, Contact Energy, Mercury Energy (formerly Mighty River), Nova Energy (a subsidiary of Todd Corporation), TrustPower Limited, Energy Direct NZ (a subsidiary of Trustpower), Energy Online (a subsidiary of Genesis), Pulse Energy, On Gas (part of Vector), Greymouth Gas and Switch Utilities. Greymouth Gas and On Gas supply only commercial and industrial users, and are the only two not also engaged in selling electricity. Rates of consumers switching supplier were at 19% in 2016 with around 80% of switches being carried out in three business days.
In recent years, Gas Industry Co has presented a variety of retail-market sector guidance to foster the transparency of retailers’ supply arrangements with small consumers, after concerns by the government and market of too high prices. A retail contract evaluation scheme and a suite of other market enhancements benefiting small consumers have included a switching regime to enable consumers to efficiently change their retail supplier. A formal consumer complaints scheme was implemented through the Electricity and Gas Complaints Commissioner.
© O
ECD
/IEA,
201
7

3. NATURAL GAS
43
PAR
T I.
ENER
GY
SEC
UR
ITY
Figure 3.5 Retail market shares
0.01%0.01%0.1%0.6%
1.8%4.2%
5.6%11.2%
15.6%22.6%
38.1%
0% 5% 10% 15% 20% 25% 30% 35% 40% 45%
Switch UtilitiesGreymouth Gas
On GasPulse Energy
Energy OnlineEnergy DirectTrust PowerNova Energy
Mighty River EnergyContact EnergyGenesis Energy
Source: GIC (2015), The New Zealand Gas Story (Section 10.4. Figure 35).
Gas security policy
Gas supply/demand adequacy
New Zealand’s gas market is isolated. The country’s natural gas security of supply relies on domestic gas production from around 15 fields in Taranaki (North Island). In the absence of an LNG terminal, New Zealand relies on the new gas storage facility and an increasingly transparent gas downstream sector. LPG imports/exports add some supply diversification, notably for the South Island which does not have natural gas reserves. Since the development of the Pohokura field in 2006 no new major fields were commissioned (the country relies on the Taranaki field and its small fields), which limits the long-term viability of the sector. Contracts are therefore largely short-term in nature (typically around three years). The current low oil price environment has not stimulated any new discoveries and points to a future tight supply situation up to 2027 with higher gas prices (GIC, 2015). New gas discoveries may also exceed domestic market needs (flexible power generation, methanol production or direct use in the residential market) and therefore project options for major new finds could include also an LNG export facility.
Gas network adequacy
The National Energy Infrastructure Plan of 2015 reaffirms that gas transmission capacity is generally sufficient for the short to medium term given current supply and demand scenarios. No new investment is required.
Gas emergency response
The industry’s response to serious supply interruptions is governed by the Gas (Critical Contingency Management) Regulations of 2008, administered by GIC. The Regulations impose a number of requirements on industry participants, including TSOs, retailers and consumers. The Regulations provide for the appointment of a “critical contingency operator”, the preparation of Critical Contingency Management Plans, roles for retailers and other industry participants, approval of designations giving priority access to gas during critical events, and annual exercises. Since 2014, the Core Group has been the critical contingency operator (approved by the GIC). There are no mandated gas reserves to be held for emergency purposes. In practice, during a critical contingency,
© O
ECD
/IEA,
201
7
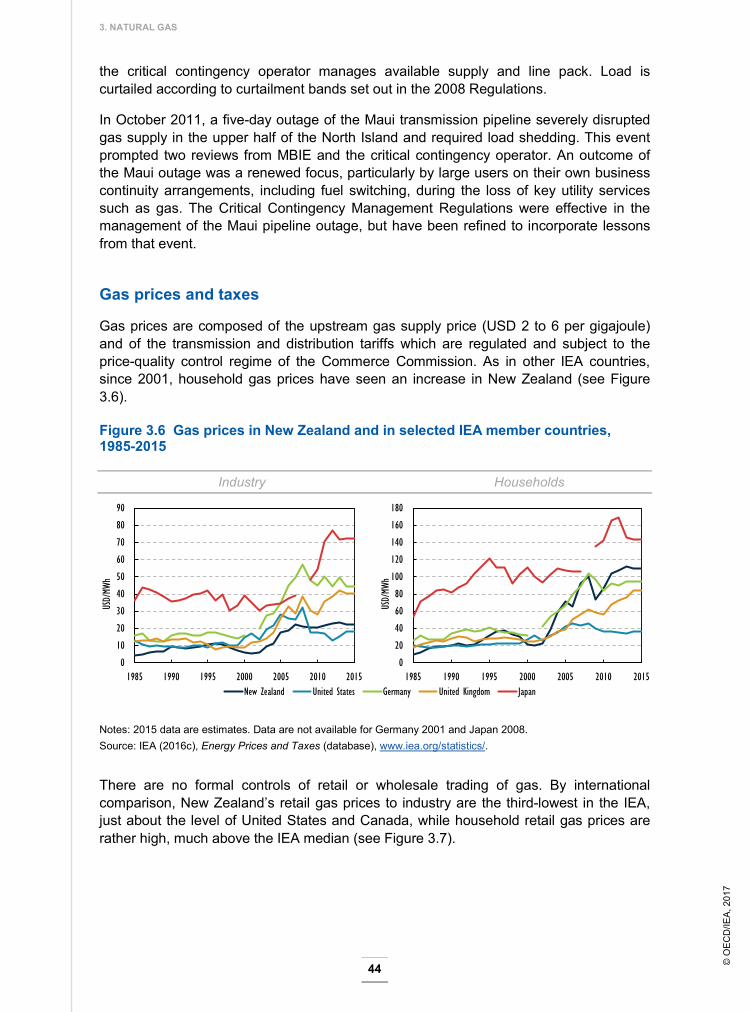
3. NATURAL GAS
44
the critical contingency operator manages available supply and line pack. Load is curtailed according to curtailment bands set out in the 2008 Regulations.
In October 2011, a five-day outage of the Maui transmission pipeline severely disrupted gas supply in the upper half of the North Island and required load shedding. This event prompted two reviews from MBIE and the critical contingency operator. An outcome of the Maui outage was a renewed focus, particularly by large users on their own business continuity arrangements, including fuel switching, during the loss of key utility services such as gas. The Critical Contingency Management Regulations were effective in the management of the Maui pipeline outage, but have been refined to incorporate lessons from that event.
Gas prices and taxes
Gas prices are composed of the upstream gas supply price (USD 2 to 6 per gigajoule) and of the transmission and distribution tariffs which are regulated and subject to the price-quality control regime of the Commerce Commission. As in other IEA countries, since 2001, household gas prices have seen an increase in New Zealand (see Figure 3.6).
Figure 3.6 Gas prices in New Zealand and in selected IEA member countries, 1985-2015
Industry Households
0
10
20
30
40
50
60
70
80
90
1985 1990 1995 2000 2005 2010 2015
USD/
MWh
New Zealand United States Germany United Kingdom Japan
0
20
40
60
80
100
120
140
160
180
1985 1990 1995 2000 2005 2010 2015
USD/
MWh
Notes: 2015 data are estimates. Data are not available for Germany 2001 and Japan 2008. Source: IEA (2016c), Energy Prices and Taxes (database), www.iea.org/statistics/.
There are no formal controls of retail or wholesale trading of gas. By international comparison, New Zealand’s retail gas prices to industry are the third-lowest in the IEA, just about the level of United States and Canada, while household retail gas prices are rather high, much above the IEA median (see Figure 3.7).
© O
ECD
/IEA,
201
7

3. NATURAL GAS
45
PAR
T I.
ENER
GY
SEC
UR
ITY
Figure 3.7 Gas prices in IEA member countries, 2015
Industry
01020304050607080
USD/
MWh
Tax component
Note: Data not available for Australia, Denmark, Italy and Norway.
Households
020406080
100120140160
USD/
MWh
Tax component
Note: Data not available for Australia, Finland, Italy and Norway. * Tax information not available. Source: IEA (2016c), Energy Prices and Taxes (database), www.iea.org/statistics/.
Assessment
New Zealand’s natural gas market is isolated, limited to the North Island, without import/exports; all gas produced is consumed domestically, given the very limited gas storage capacity. The first underground storage, the Ahuroa gas storage facility, came online in 2011, covering about 8% of annual gas demand. This implies that gas has to be consumed as it is produced, and vice versa. Over the last years, natural gas production has fluctuated between 4 and 6 bcm, depending on the consumption swings of the main gas users, the methanol production and power generation. Some 50% of consumption currently stems from Methanex, the methanol producer of the country. Its consumption varies, depending on the availability of gas and on the international prices of methanol, as most of its products are exported. Gas demand for power generation declined over the last years, as some larger gas-fired power plants were mothballed and replaced by smaller peaker-type plants.
© O
ECD
/IEA,
201
7

3. NATURAL GAS
46
New Zealand does not have any long-term gas production outlook; about 10.5 years of domestic consumption can be covered with current gas reserves. Gas production remains concentrated in the Taranaki basin, with most of the production coming from the Pohokura field. The Maui gas field has been in decline (like for oil) and over the years new gas discoveries in small fields have by and large compensated for this decline. But no new major field discoveries were made over the last few years. The uncertainty over future gas supplies could act as a break on the future development of gas demand, notably in the electricity sector, where gas-fired power generation serves as backup for the large share of renewable energy in the power mix.
Access rules to the pipelines system are agreed by pipeline customers with requests for changes to the Maui Pipeline access rules being reviewed and agreed by Gas Industry Company (GIC). The GIC is the market co-regulation body, which is also responsible for critical contingency management, wholesale market development, supplier switching, compliance and enforcement, and consumer outcomes. As a major change since the last in-depth review, the Commerce Commission now regulates the revenues of the two transmission and four distribution pipeline companies since 2013.
Since the last IEA review, gas wholesale trading is developing; a first spot gas platform has been established at Transpower’s emsTradepoint and futures products. To date, the wholesale market has been concentrated, without much price transparency. In 2016, an Australian investor acquired Vector Gas limited and assets from Maui Development Limited. As a result, the two transmission pipeline systems are now owned and operated by FirstGas, which offers an opportunity to harmonise the access regulations of both pipeline systems, to the benefit of its users. FirstGas is now the owner and operator of New Zealand’s gas transmission system (Maui and Vector systems) and the access codes are being harmonised.
The gas retail market is developing fast, as electricity retailers have expanded their regional customer base to gas retailing. Demand in the residential sector is relatively small, and concentrated to winter heating. There are four distribution companies operating some 17 500 km of distribution pipelines, including FirstGas; Nova Gas has also some gas distribution pipelines. Eight companies (operating 11 brands) are active in the retail sector, with Genesis Energy, Contact Energy and Mercury Energy (formerly Mighty River Energy) and Nova Energy as the largest retailers. Supplier switching is easy (around 80% of switches are completed within three business days) and switching rates are high; in the residential sector it was 19% in 2016.
Natural gas prices are not directly connected to global market trends, as there are no imports and exports. Prices did not rise that much, when Japanese demand increased fiercely after the 2011 Fukushima accident; nor did they decrease in recent years, when the global market experienced a gas glut stemming from unconventional gas production in the United States and new LNG supplies coming on stream. Household gas prices are consistently high and on the rise, while industry prices are among the lowest in IEA member countries, close to those of Canada and the United States, a clear indication of competitiveness.
Security of gas supply provisions were set in 2008 under the Gas Regulations and improvements in preparedness have been achieved through the joint work of the GIC on transmission capacity access and pricing. Since 2014, a Taranaki-based firm, Core Group, is the contingency operator and implements a load-shedding regime set out in the
© O
ECD
/IEA,
201
7

3. NATURAL GAS
47
PAR
T I.
ENER
GY
SEC
UR
ITY
Regulations. In the light of the new ownership structure of the transmission/distribution pipelines and changing gas demand patterns, it is critical that the 2008 Regulations be reviewed. Electricity, petrochemical and industrial users may also need access to flexible gas storage from the new private Ahuroa facility to deal with a potential gas emergency.
Recommendations
The government of New Zealand should:
Take advantage of the recent acquisition of the two transport companies by one single owner and arrange for a uniform access regime to the pipelines of these companies.
Review the guidelines and measures, roles and responsibilities and test emergency preparedness in the event of a natural gas supply crisis, given the change in ownership of the pipeline companies.
References GIC (Gas Industry Company Limited) (2015), The New Zealand Gas Story.
IEA (International Energy Agency) (2016a), Natural Gas Information, www.iea.org/statistics/.
IEA (2016b), Energy Balances of OECD Countries 2015, www.iea.org/statistics/.
IEA (2016c), Energy Prices and Taxes, OECD/IEA, Paris, www.iea.org/statistics/.
© O
ECD
/IEA,
201
7

49
PAR
T I.
ENER
GY
SEC
UR
ITY
4. Oil
Key data (2015)
Crude oil and NGLs production: 2.0 Mt, +96% since 2004
Crude oil and NGLs net imports: 3.6 Mt, -14.2% since 2005 (imports 5.3 Mt, exports 1.7 Mt)
Oil products net import: 1.8 Mt (Imports 2.1 Mt, exports 0.2 Mt)
Share of oil: 32.6% of TPES and 0.002% of electricity generation
Supply by sector (2014): 6.5 Mtoe (transport 73.5%, industry 12.0%, commercial 8.6%, other energy 4.8%, residential 1.1%)
Overview
The government of New Zealand has taken several measures to foster security of oil supply. In 2013, changes to the petroleum regulatory regime were made to attract investments, including a streamlined exploration permit procedure, a new approach to allocate permits based on competitive tenders, and changes to the royalty regime. Following the review of the oil security policy settings in 2012, the government decided to maintain its ticketing policy, but to introduce in 2016 a levy on domestic fuels to fund the procurement of tickets. However, the collapse in international oil prices has lowered investment in new upstream sources and encouraged greater consolidation, which risk reducing competition in the oil markets (refining, retail) in New Zealand.
Supply and demand
Supply
Oil is the largest energy source in New Zealand, representing 32.6% of total primary energy supply (TPES). Oil supply reached a record-high 6.6 million tonnes of oil-equivalent (Mtoe) in 2015, which is 1.9% higher than the previous year. Overall, oil supply was 8.7% higher in 2015 than ten years earlier in 2005. Exports have evolved in line with new field developments, notably from enhanced oil recovery.
Crude oil New Zealand is a net importer of crude oil; domestic oil production accounts for around 35% of domestic demand. All petroleum production comes from fields located in the Taranaki Basin, on the West Coast of the North Island. The Maui field has been the
© O
ECD
/IEA,
201
7

4. OIL
50
major domestic producer of oil but, as this field depletes, more diverse sources of oil (and gas) have been found. Production is located offshore in five fields with a further 12 smaller producing fields located onshore. Remaining reserves go up to 2035 (see Figure 4.3).
In 2015, New Zealand produced 1.9 million tonnes (Mt) of crude oil while imports and exports stood at 5.1 Mt and 1.7 Mt, respectively. Compared to 2005, crude oil production was 112% higher in 2015, surging over the mid-2000s thanks to considerable exploration activities and new oilfield discoveries and peaking at 2.7 Mt in 2008. Imports were 14% higher in 2015 than in 2005, growing consistently to a peak of 5.3 Mt in 2012. Exports surged during the late 2000s along with production, peaking at 2.5 Mt in 2008, exports of 2015 were 179% higher than in 2005. The country produced marginal natural gas liquids (NGLs) (206 kilotonnes) in 2015 and imported 205 kt of refinery feedstocks.
Almost all oil (including crude oil and NGLs) produced in New Zealand is exported to other countries because New Zealand’s crude oil is light and sweet while the country’s sole refinery is geared to process sour crude. Of total exports in 2015, 91% went to Australia and the rest was exported to Malaysia (4%), Singapore (3%) and Korea (2%).
Figure 4.1 Crude oil supply by source, 1973-2015
-4
-2
0
2
4
6
8
1973 1976 1979 1982 1985 1988 1991 1994 1997 2000 2003 2006 2009 2012 2015
Mt
Stock changes
Import
Indigenous production
Exports
Inland consumption
Note: 2015 data are estimates. Source: IEA (2016a), Oil information (database), www.iea.org/statistics/.
Figure 4.2 Crude oil imports by source, 1978-2015
0
1
2
3
4
5
6
1978 1980 1982 1984 1986 1988 1990 1992 1994 1996 1998 2000 2002 2004 2006 2008 2010 2012 2014
Mt
AustraliaKuwaitIndonesiaSaudi ArabiaUnited Arab EmiratesMalaysiaRussian FederationBrunei DarussalamQatarOther
Note: 2015 data are estimates. Source: IEA (2016a), Oil Information (database), www.iea.org/statistics/.
© O
ECD
/IEA,
201
7

4. OIL
51
PAR
T I.
ENER
GY
SEC
UR
ITY
Imported crude oil and refinery feedstocks were sourced from a large number of countries: Qatar (21%), Brunei Darussalam (16%), Russia (16%), Malaysia (15%), United Arab Emirates (10%), Saudi Arabia (9%), Indonesia (5%), Kuwait (4%), Australia (2%) and others (Figure 4.2).
Figure 4.3 Oil production forecast by field in New Zealand to 2050
0
2
4
6
8
10
12
14
16
2016 2018 2020 2022 2024 2026 2028 2030 2032 2034 2036 2038 2040 2042 2044 2046 2048 2050
mmbb
l
Other*
Turangi
Cheal
Mangahewa
Tui
Maui
Kupe
Maari
Pohokura
* Other includes Kapuni, Kowhai, Ngatoro, McKee, Copper Moki, Waihapa-Ngaere, Radnor, Surrey, Rimu and Moturoa. Source: MBIE, 2016.
Oil products Crude oil, NGLs and feedstocks are refined domestically and produced into a wide array of petroleum products. In 2015, imports of oil products totalled 2.1 Mt and exports 0.2 Mt. The majority of New Zealand’s oil products imports came from Singapore (52%) followed by Korea (32%), the United States (7%), Japan (3%) and Australia (2%). Most oil products exports were destined to Australia (47%) and Singapore (39%).
Demand
Transport has been the largest oil-consuming sector, accounting for 73.5% of total demand in 2014 while Industry accounted for 12% (Figure 4.4). The remaining 14.5% was made up of commercial services including agriculture (8.6%), other energy use (4.8%) and a small share of households (1.1%). Oil is seldom used in power generation.
Demand for oil in transport has increased by 4.8% during 2004-14, reaching a record high of 4.8 Mt in 2014, and is consumed in road transport. Oil consumption in industry was 6.4% higher than in 2004. Demand from commercial and public services (including agriculture) declined by 11.6% in that period. Household demand was 7.3% higher than in 2004, albeit marginal in total demand. Other energy use, including energy own-use and reprocessing of oil products, grew by 54.4% during 2004-14, increasing its share in total demand from 3.3% in 2004 to 4.8% in 2014.
Gas and diesel oil is widely used in New Zealand, making up 41% of total oil products consumption (Figure 4.5). Motor gasoline represents 34% while kerosene-type jet fuel accounts for 17%. The remainder is made up of LPG, fuel oil, aviation gasoline, other kerosene and other non-specified oil products. In total, 6.8 Mt oil products were consumed in 2015. The proportion of diesel vehicles in the light-duty fleet grew from 11.7% in 2000 to 17% in 2014.
© O
ECD
/IEA,
201
7

4. OIL
52
Figure 4.4 Oil demand by sector, 1973-2014
0
1
2
3
4
5
6
7
1973 1975 1977 1979 1981 1983 1985 1987 1989 1991 1993 1995 1997 1999 2001 2003 2005 2007 2009 2011 2013
Mtoe
Power generation
Other energy*
Industry**
Transport
Commercial***
Residential
Note: TPES by consuming sector. * Other energy includes refineries and energy own-use.** Industry includes non-energy use.*** Commercial includes commercial and public services, agriculture/fishing and forestry.Source: IEA (2016b), Energy Balances of OECD Countries 2015, www.iea.org/statistics/.
Figure 4.5 Oil consumption by product, 2015
41%
34%
17%
2%6% Gas and diesel oil
Motor gasoline
Kerosene-type jet fuel
LPG
Other*
6.8 Mt
* Other includes petroleum coke, fuel oil, aviation gasoline, other kerosene and non-specified oil products.Note: Data are estimates.Source: IEA (2016a), Oil Information (database), www.iea.org/statistics/.
Oil regulatory framework
Upstream
The Crown owns all petroleum resources and associated hydrocarbons. A permit is required to prospect, explore or mine petroleum whether in-ground, in the Exclusive Economic Zone or in the continental shelf. The Ministry of Business, Innovation and Employment (MBIE) is the government agency responsible for administering the permit regime under the Crown Minerals Act 1991. Petroleum exploration and production are regulated by this Act, and by the Minerals Programme for Petroleum 2013.
The Petroleum Action Plan (2009) had provided for a more proactive role of the government in supporting exploration and development of petroleum resources and is a review of the regulatory regime in order to attract investment. Amendments to the Crown Minerals Act 1991 and the Minerals Programme for Petroleum and associated regulations came into force on 24 May 2013, which sets out policies and procedures for
© O
ECD
/IEA,
201
7

4. OIL
53
PAR
T I.
ENER
GY
SEC
UR
ITY
granting petroleum exploration and mining permits. The Crown Minerals (Royalties for Petroleum) Regulations 2013 cover royalties and royalty reports for mining permits granted after 24 May 2013. Changes to the upstream petroleum regulatory regime in 2013 include:
a streamlined exploration permit procedure
a new approach to allocate permits based on competitive tenders
changes to the royalty regime.
A more streamlined permit regime was introduced to reduce the time required to obtain exploration permits for less complex and lower-risk projects, and improvements were made in the co-ordination with health, safety and environment regulators in the allocation of permits.
Before 2012, petroleum permits were allocated either via "priority in time" (PIT) or competitive tender. PIT permit allocation was removed in 2012 and since then all petroleum exploration permits are allocated via the so-called Competitive Block Offer Regime. The ministry publishes annual block offers, making available a number of blocks for competitive tender. The new system has obligations for operators to start exploration once blocks are awarded. Operators sign up to an agreed minimum work programme on being awarded a permit. Failure to adhere to this minimum work programme can result in revocation or a poor compliance history that will be taken into account in future applications. Appetite for new exploration is going down rapidly in a period of low oil prices. All in all, the production outlook for the country is rather limited.
A competitive tax and royalty regime is in place to attract investment to the petroleum sector. Exploration-related expenditures are deducted for royalty purposes in the year they are incurred. Non-resident offshore rig operators and seismic vessels are exempted from paying tax on their profits. This temporary measure since 2005, extended twice, is due to expire on 31 December 2019. The Crown Minerals (Royalties for Petroleum) Regulations 2013 applying to companies that obtained a permit after 24 May 2013, pay either an ad valorem royalty or an accounting profits royalty, whichever is higher, in any given year. A review of the fees regime for petroleum and minerals is under way.
Downstream
Deregulation of the oil industry in 1988 removed price controls, government involvement in the refinery, licensing of wholesalers and retailers, and restrictions on imports of refined products.
The distribution of oil products across New Zealand is a challenging task, as the country is large and its population density low. The four oil companies that have a processing agreement with the refinery arranged a system by which they allow access to each other’s storage facilities and products across the country. If a company is short of storage in a specific region, it can make an accounting swap with products in another region where there is much storage. There is a lack of transparent third-party commercial terms and conditions of access, which weakens the business case for other companies to enter the fuel distribution market of New Zealand.
© O
ECD
/IEA,
201
7

4. OIL
54
Oil infrastructure
Refining
New Zealand has one refinery, Refining NZ, which is located at Marsden Point Whangarei Harbour, at the north of the North Island. The refinery is owned and operated by Refining NZ since 1964 and supplies the Auckland area and airport by pipeline. An upgrade to a new continuous catalyst regeneration platform was completed at the end of 2015, involving a NZD 365 million expansion project which will allow the refinery to process a wider range of crudes and produce more petrol.
Refining NZ operates the refinery as a tolling operation (referred to as a “toll refiner”), that is, it charges a toll on each litre of fuel produced. It processes crude on behalf of refinery users (who are also shareholders), the refinery does not own the crude or the products.
This toll is based on the difference between the value of initial feedstocks and final products, according to reported regional refining margins (Singapore prices), and stands at 70% of the gross refining margin. The gross refining margin is benchmarked off Singapore’s quoted prices and international freight rates with a quality premium applied to reflect New Zealand’s tighter fuel specifications. It is normally cheaper to supply regional ports in this manner than importing products, even from much larger refineries in the Asia-Pacific region.
As of 2016, three oil majors (BP, Mobil and Z-Energy) own 65% of the refinery after the Chevron sold its refinery stake to general investors (Z-Energy acquired Chevron’s processing contract with the refinery); 35% are owned by the public. The three majors are the only companies entitled to take products from the refinery owing to a processing agreement signed when the refinery was first built. Each company manages the planning of its own crude slate and product off-take. Capacity allocation is not related to shareholding but subject to the market share, the latter being calculated on a three-year rolling average. Z-Energy’s acquisition of Chevron business in New Zealand (all except refining stake), which received clearance by the Commerce Commission in April 2016, reduced the number of oil companies with access to the refining capacity, which in turn has increased concentration in the oil industry.
Ports and pipelines
New Zealand has 13 terminal locations (including the refinery), of which 11 are seaboard terminals. The three major import terminals are Mount Maunganui, Wellington and Lyttelton. The Refinery-to-Auckland Pipeline (RAP), owned by Refining NZ, transports batched refined products to bulk storage facilities at Wiri in South Auckland. From here, the product is transported across the greater Auckland region and the northern Waikato which accounts for around 40% of New Zealand’s demand and is the country’s major petroleum market. The pipeline has a capacity of 55.8 thousand barrels per day (kb/d). About half of the refinery’s production is distributed via the RAP pipeline. Jet fuel is transported to the Auckland airport from Wiri via a 6.9 km, six-inch pipeline with a capacity of 24.2 kb/d.
© O
ECD
/IEA,
201
7

4. OIL
55
PAR
T I.
ENER
GY
SEC
UR
ITY
Figure 4.6 Map of New Zealand’s oil infrastructure
This map is without prejudice to the status of or sovereignty over any territory, to the delimitation of international frontiers and boundaries, and to the name of any territory, city or area.
© O
ECD
/IEA,
201
7

4. OIL
56
Storage
Because of the country’s geography, ports and storage are closely intertwined, as products are primarily transported around the country by ship. New Zealand’s storage capacity is all commercial capacity located at the country’s 11 port terminals (including Marsden Point refinery).
The oil majors use a system that enables each company to draw products from any location subject to having access arrangements with a specific storage provider. This system offers a great deal of flexibility and efficiency to the domestic supply chain. The system works on an accounting system in which stock volumes are credited to companies on the basis of a combination of refinery production as it accrues to the individual company processing at the refinery and as supplemented by periodic imports. A company’s ability to draw stock from the system is subject to having a positive stock balance. The ownership system is monitored by Coastal Oil Logistics Limited on behalf of the majors. Other oil companies have no access to the system and have to arrange oil distribution across New Zealand themselves.
Oil retail market structure
Wholesale market
There are now three oil majors in the New Zealand wholesale market, with a fourth independent wholesaler, Gull, that imports products into its one terminal at Mount Maunganui. Until recently, the wholesale market had been dominated by four oil majors (BP, Caltex, Mobil and Z-Energy). Concentration has increased in the oil-refining and wholesale segment. In April 2010, Shell sold New Zealand’s downstream assets to Z-Energy. In July 2015, Z-Energy announced it would acquire the assets of Chevron New Zealand, notably the Caltex and Challenge retail brands, but excluding the 11.4% stake in Refining NZ, which was sold to general investors. Z-Energy did acquire Chevron’s processing contract with the refinery. The acquisition has been approved by the Commerce Commission in April 2016 subject to several conditions, notably the obligation for Z-Energy to divest some retail sites. A sign of rising concentration is that importer cost for diesel and petrol has gone down but importer margins have been on a steep rise since 2011.
Retail market
There are approximately 1 200 retail service stations in New Zealand. The retail market is slightly more competitive with different types of ownership and operating arrangements (supermarkets, companies, independents, etc). There has been significant growth in retail loyalty and discount programmes. Two supermarket discount schemes are operated by New Zealand’s two major supermarket chains – Foodstuffs and Progressive Enterprises. Standard supermarket discounts are typically 4 cents per litre, but special offers up to 40 cents are available at times. The bulk of the discount is borne by the supermarkets.
There are at least 15 branded networks and a rising number of unbranded sites. Collectively, these smaller networks account for over 15% of the retail market. Gull is the biggest independent retailer, with a market share of 2% to 3%, but the company has
© O
ECD
/IEA,
201
7

4. OIL
57
PAR
T I.
ENER
GY
SEC
UR
ITY found its retail scope geographically limited to the northern half of the North Island
because its only storage terminal is located in Mount Maunganui.
The motor fuel market is however also becoming more and more concentrated, after Shell NZ sold its transport fuels distribution business in 2010 and Chevron its retail brands Caltex and Challenge in 2016 to Z-Energy. The latter company supplies almost 50% of the transport fuel market. Z-Energy is also the only fuel retailer associated with New Zealand’s largest loyalty programme Fly Buys. The Commerce Commission therefore required Z-Energy to divest 19 retail sites and one truck stop in locations where the Commission considers competition would be substantially reduced as a result of the merger.
Oil security
New Zealand’s oil emergency response policy is based on an escalating series of measures ranging from the release of oil stock “tickets” to voluntary demand restraint measures, which is likely to be used as a last resort. New Zealand places no minimum stockholding obligation on industry and, until 2007, the country relied on the industry’s normal stockholding practices to meet the country’s 90-day net import obligation as a member of the IEA. Since 1 January 2007, the government has routinely acquired “ticket” reservations for stocks held in other IEA member countries (316 000 tonnes in 2016) to supplement the country’s domestically held commercial stocks to ensure that it meets its 90-day obligation. All tickets are held directly by the government, rather than through an agency on the government's behalf.
In 2012, the government reviewed the country’s oil security, including risks to domestic oil security and New Zealand’s contribution to global oil security, including consideration of alternative stockholding options. On the basis of the results of the review, the administration is implementing various measures to strengthen oil security arrangements in the retail, infrastructure and co-ordination process during an oil crisis. The government decided to maintain its existing ticketing policy, and to put it on a secure financing basis by putting a levy on domestic fuels to fund the procurement of tickets. The levy came into effect in 2016.
The fuel specification regulations were amended in 2011 to relax unnecessarily restrictive fuel parameters, to reflect technological advances, to better align New Zealand with overseas specifications. New Zealand’s fuel specifications are broadly aligned with the Asia-Pacific region but there is no single benchmark standard and countries are continuously looking to tighten their fuel specifications to enable new vehicle technology and improve environmental and public health outcomes. The government is looking to tighten parameters in some areas (e.g. sulphur in petrol in line with the timing of other countries in the Asia-Pacific) and relax other parameters in others (e.g. total oxygen, methanol, biodiesel blend limits). A proposal to further tighten sulphur limits for petrol is currently being considered, but it is not expected to raise supply security concerns, particularly from 2017 when China, Singapore, the United Arab Emirates, Saudi Arabia and the United States will all have adopted a 10 parts per million (ppm) sulphur limit.
© O
ECD
/IEA,
201
7

4. OIL
58
Oil prices and taxes
The prices of petroleum products, particularly prices at the pump, are set freely. The retail price for diesel and gasoline are determined by their various components: crude price, gross refining margin, gross retail margin, excise duties and value-added tax. Outside taxes, oil product prices in New Zealand are very high, much above the IEA median and above prices in Norway, Greece, or Japan.
Figure 4.7 Fuel prices in IEA member countries, first quarter 2016
Automotive diesel
0.0
0.5
1.0
1.5
2.0
2.5
USD/
L
Tax component
0
Premium unleaded gasoline (95 RON)
0.0
0.5
1.0
1.5
2.0
2.5
USD/
L
Tax component
0
Note: Data not available for Japan. Source: IEA (2016c), Energy Prices and Taxes 2015, www.iea.org/statistics/.
However, thanks to low taxation levels, final gasoline and diesel prices in New Zealand are much below the IEA median. Diesel prices are the second-lowest among the IEA, as diesel only pays the road charge but no excise duties. Funding for development and maintenance of the road network is from a combination of road-user charges and excise duties on relevant engine fuels. Petrol, LPG and natural gas are subject to excise duties. Diesel is not subject to excise duty, but all diesel vehicles using the road pay road-user charges. Heavy electric vehicles also pay road-user charges. Light plug-in electric vehicles are, in principle, subject to road user-charges, but are currently exempt until 2020.
© O
ECD
/IEA,
201
7

4. OIL
59
PAR
T I.
ENER
GY
SEC
UR
ITY
Assessment
Since the last IEA review, a new upstream regulatory regime with block offers and revised royalties has come into force as of 2013. The block tenders attracted attention from many international players, but results in terms of new discoveries are limited, owing to the current low oil price environment and because some companies exited the upstream or relinquished permits, including ExxonMobil and Anadarko.
New Zealand produces crude oil from the Taranaki Basin, on the West Coast of the North Island and its 17 fields (5 offshore and 12 onshore). The historic Maui field is in decline but other fields came on line, the Pokohura field is now the largest producer. More could be done on implementing enhanced oil recovery techniques to prolong the lifetime of the fields. There are no clear rules for the decommissioning of fields, which adds to the uncertainties industry is confronted with. Investors’ confidence could be enhanced by clarifying those rules.
New Zealand produces some 2 Mt of oil per year (40 thousand barrels per day), most of it is exported. For domestic use, the country imports some 5 Mt (100 kbd) of heavier and more sour crudes that can be refined at a higher margin at the sole refinery at Marsden Point (upgraded in 2015).
The downstream market concentration is on the rise, as Shell and Chevron have sold their downstream assets in New Zealand in recent years. The refinery is now owned by only three oil companies (BP, Mobil and Z-Energy) and institutional investors, after Chevron’s processing contract for the refinery was purchased by Z-Energy in 2016 and the Chevron 11.4% stake in the refinery sold to general public investors. The Commerce Commission has neither challenged the wholesale sector nor the distribution sector impacts from the recent takeover. A processing agreement is maintained whereby all offtake from the refinery is allocated to the three major oil companies. In recent years, gross retail margins had already doubled. Other distributors of oil products cannot make use of this refinery and have to import their oil products. Gull is the only distributor of oil outside this system. As only Gull has a terminal on the North Island, it is not involved in distribution on the South Island.
Equally, the retail market has also seen rising concentration. Z-Energy obtained also conditional permission from the Commerce Commission to acquire the downstream assets of Chevron in New Zealand, following the previous purchase of the Shell distribution assets in 2010 and, as of 1 June 2016, Z-Energy will have a market share of close to 50% in downstream oil. Supermarkets and independent retailers have entered the fuel retail business. They source their products from the major companies and offer discounts to their customers. The government should review access conditions and consider options of introducing regulated access to distribution.
All of New Zealand’s oil stocks are held on a commercial basis with the country having no strategic oil stocks and not placing any stockholding obligation on industry. The commercial stocks alone are not sufficient to meet the countries’ 90-day obligation towards the IEA and the government resolved this issue a decade ago by purchasing “ticket” contracts with oil stockholders in other IEA countries. As domestic oil production declines and net imports are on the rise, the shortfall towards the 90-day obligation has risen and will – in the absence of new domestic oilfield developments – continue to rise. Consequently the need for ticket contracts will continue to grow. Commendably, the
© O
ECD
/IEA,
201
7

4. OIL
60
government has addressed the financial consequence of this trend by introducing a levy on petrol and diesel to finance these ticket contracts, while in the past they were paid directly from the government budget. As the ticket contracts can be called upon during an IEA collective action, they do contribute to global oil security, and in the event of a prolonged disruption, there are procedures in place to repatriate these stocks for use in New Zealand’s domestic market if needed. However, as the repatriation of these stocks would take a number of weeks owing to the geographical distances and consequent shipping times involved, it does not serve the country for short-term domestic resilience towards local disruptions.
Recommendations
The government of New Zealand should:
Develop options to encourage enhanced oil recovery in existing fields.
Review the permitting system for new blocks to assess whether this system can better encourage companies to conduct timely and efficient exploration.
Investigate whether third-party access to the oil majors’ shipping and storage arrangements should be regulated to ensure entry for smaller independents in light of the anticipated consolidation of the market.
Continue monitoring oil market developments to ensure continuous compliance with the IEA obligation and sufficient resilience in the event of a domestic supply disruption. Conclude bilateral stockholding agreements with a wider range of countries, notably those in the Asia-Pacific region where the closer geographical proximity of bilateral stocks will help to improve New Zealand’s domestic security of supply.
References IEA (International Energy Agency) (2016a), Oil Information 2016, OECD/IEA, Paris, www.iea.org/statistics/.
IEA (2016b), Energy Balances of OECD Countries 2016, OECD/IEA, Paris, www.iea.org/statistics/.
IEA (2016c), Energy Prices and Taxes 2016, Q1, OECD/IEA, Paris, www.iea.org/statistics/.
© O
ECD
/IEA,
201
7

61
PAR
T I.
ENER
GY
SEC
UR
ITY
5. Electricity
Key data (2015)
Total electricity generation: 44.2 TWh, +2.9% since 2005.
Electricity generation mix: hydro 55.5%, geothermal 17.8%, natural gas 15.5%, wind 5.3%, coal 4.3%, biofuels and waste 1.4%, solar 0.2%).
Total length of distribution lines: Nearly 172 000 circuit kilometres
Total number of distribution consumers: 2.38 million installation control points
Total volume of electricity throughput: 31.3 TWh
Total sector asset value: NZD 10.25 billion
Total regulated income: NZD 2.34 billion
Total sector capital and operating expenditure: NZD 1.34 billion
Overview
While the power sector is largely decarbonised, it is the electricity supply that will be the key sector to drive the energy transformation. The way the sector is regulated and markets function will determine not only the success of New Zealand’s decarbonisation but, importantly, the security of electricity supply. Following the 2010 Ministerial Review, the government has implemented a series of reforms to foster market-based security of supply responses. Future challenges relate to the distribution sector regulation, the consumer engagement in retail markets and the way the reserve capacity is structured in a low-carbon system during dry years.
Institutions and regulatory oversight
The Ministry of Business, Innovation and Employment (MBIE) is the governmental department in charge of energy policy and energy legislation. MBIE also monitors the activities of several regulatory bodies and a promotion and delivery agency. The Electricity Authority and the Commerce Commission oversee the regulation of the sector, while the Energy Efficiency and Conservation Authority (EECA) has the task of promoting and managing electricity efficiency programmes.
The Commerce Commission (CC) is New Zealand's primary competition and economic regulatory agency. As an independent Crown entity established under Section 8 of the Commerce Act 1986, the CC regulates the total revenue of the transmission network and
© O
ECD
/IEA,
201
7

5. ELECTRICITY
62
its information disclosure requirements, the information disclosure requirements for all distribution networks, as well as the revenue and quality standards for 17 of the 29 distribution networks. (The remaining 12 distribution networks are fully consumer-owned, relatively small, and exempt from revenue and quality regulation; see also the distribution section and Figure 5.14 below.) The CC does not set rules on how electricity distributors set customer pricing or the methods they use to set pricing, but requires pricing methodologies to be disclosed. The CC also regulates gas pipelines, airports, telecoms, and the dairy industry.
The Electricity Authority (EA) is an Independent Crown entity established under the Electricity Industry Act 2010, as part of the reforms following the 2009 Ministerial Review of the Electricity Market and the subsequent Ministerial Decision of 2010. The statutory objective of the EA is to promote competition in, the reliable supply by, and the efficient operation of the electricity industry for the long-term benefit of consumers. Under the Electricity Industry Act (EIA) 2010, the EA sets the framework for the regulation of the electricity industry, including security of supply provisions. The Act empowers EA to manage this industry under a set of rules known as the Electricity Industry Participation Code (the Code). Parliament approves the annual budget which is financed by a levy on electricity purchases.
The former Electricity Commission was restructured into the EA. Some competences moved to EECA (technical electricity efficiency) and MBIE (demand and scenario modelling for transmission), and to CC (approval of transmission investment). The CC oversees the revenue requirements for transmission and distribution businesses whereas the EA oversees the allocation of those revenue requirements among their customers. For distribution investment, CC evaluates the expenditure made and added to the regulated asset base (RAB) and recovered over time.
EECA is a Crown (government) entity established under the Energy Efficiency and Conservation Act 2000. EECA’s role, as defined in its enabling legislation, is “to encourage, promote and support energy efficiency, energy conservation and the use of renewable sources of energy”. EECA runs a number of programmes to that end. EECA also provides advice to MBIE on operationally linked policy issues affecting the uptake of energy efficiency and renewable energies. EECA’s role is to work for improvements in electric efficiency in the electricity sector.
The EA regulates the technical operation of the electricity industry and markets (wholesale and retail) in accordance with the Electricity Industry Act (EIA) and government energy policy. The EA focuses on the distribution of the charges that form the revenue agreed by the CC and guides the transmission and distribution pricing methodologies for the allocation of network costs between different network users. The transmission pricing methodology (TPM) has to be approved by the EA. The EA can set the TPM if Transpower’s proposed TPM does not obtain the EA’s approval. Distribution pricing methodologies are all voluntary.
Both the EA and CC are Independent Crown entities. Independence, transparency and objectivity are critical to ensure that market participants have trust and confidence in the regulatory framework. As the government is a market participant with controlling shares in three electricity generator-retailers (in New Zealand these generators are involved in retailing and are referred to as “gentailers”), such independence is crucial. Crown entities are not subject to direct instruction either from their reporting minister of the Crown or
© O
ECD
/IEA,
201
7

5. ELECTRICITY
63
PAR
T I.
ENER
GY
SEC
UR
ITY from the ministry. The minister may give EA instructions vis-à-vis the gentailers through a
government policy statement. However, the EA only has to take into account the statement and can deviate from it. The EA is funded by electricity levies while CC is 50% Crown-funded but their respective budgets are approved through the normal government budget cycle process. This does potentially provide scope for relevant ministers and ministries to influence future EA work programmes. Given their shared areas of interest, the CC and EA have a memorandum of understanding in place since 2010 that describes how they should co-ordinate their respective roles. The government may always choose to propose new legislation to alter the roles of the entities, as it has done in the past.
New Zealand’s electricity transmission network is owned and operated by Transpower, which is also the designated system operator as created by the Electricity Industry Act 2010. The Electricity Authority is the market administrator whose role is to oversee the operation of the wholesale electricity market through service providers. Transpower, as system operator, is responsible for matching offers with system load and bids in real-time, market-based secure dispatch. Currently, the New Zealand Stock Exchange is responsible for registration of wholesale offers and bids, ex post final pricing, clearing, and matching settlement reconciliation. Energy Market Services, a subsidiary of Transpower, manages the financial transmission rights market. All services, apart from the system operator service, are selected via a competitive process and performed in line with the regulation imposed by the EA.
There are 29 distributors in New Zealand with different ownership and network topography structures (see Figure 5.14).
Wholesale market
Market structure
The restructuring of the New Zealand Electricity Market in the 1990s saw the split of the Electricity Corporation of New Zealand (ECNZ) into two large generators, ECNZ and Contact Energy, in 1996, with the remainder of ECNZ assets being split into three state-owned enterprises (SOEs), Genesis Energy, Meridian Energy and Mighty River Power in 1999 (renamed into Mercury). Contact Energy was fully privatised. Under the Electricity Industry Reform Act of 1998 (EIRA), New Zealand adopted ownership separation of electricity generation and retail operations from the distribution network. There was a prohibition on the cross-ownership by electricity distribution companies of connected electricity retail and/or generation assets/businesses.
However, the regime was relaxed in 2010, allowing distributors back into retailing and generation (distributed/small renewable energy) under certain conditions in order to advance competition. The EIRA Act was repealed in 2010 and supplanted by the Electricity Industry Act 2010 (EIA), enforcement of which is now within the remit of the EA. Part 3 of the EIA restricts involvement in both a distributor and a retailer (or a distributor and a generator) under certain cases. There are thresholds in the EIA, which require arm's-length provisions. The current retail cross-ownership threshold is an annual generation of 75 gigawatt hours (GWh) (increased from 5 GWh in EIRA). Moreover, the CC also has to assess whether merger and acquisitions (cross-ownership) could substantially lessen competition and breach section 47 of the Commerce Act 1986.
© O
ECD
/IEA,
201
7

5. ELECTRICITY
64
The EA has a role in considering exemptions from Part 3. The EA will grant an exemption under section 90 of the EIA, if it is satisfied that the proposed prohibited involvement will either promote, or will not inhibit, competition in the industry and that the exemption will not permit an involvement in a distributor and a generator or retailer that may create incentives and opportunities to inhibit competition in the electricity industry.
A major reform was the partial privatisation of three of the big five gentailers in 2013. Mighty River Power, Genesis Energy and Meridian Energy were partly privatised, through three initial public offerings (IPOs), into a mixture of small shareholders and larger fund owners and converted to public-private companies; the government retained a 51% controlling stake. The partial sale of the three gentailers was carried out under the Public Finance (Mixed Ownership Model) Amendment Act 2012, which allowed for the partial privatisation of up to 49% of the SOEs. The share of the state in the gentailer structure has come down after partial privatisation but remains significant (controlling, 51%) in three companies. Meridian Energy is the largest generator by installed capacity and generated volume as well as by revenue, followed by Contact Energy and Genesis Energy (see Table 5.1). Trustpower is the only private, and the smallest, player among the five gentailers. Over the past ten years, New Zealand’s electricity market has largely maintained this market structure with five vertically integrated businesses. In 2015, the three partly state-owned gentailers controlled 64% of the generation and 59% of the retail market, as illustrated in Table 5.2. In 2015, the five gentailers accounted for 91% of New Zealand’s electricity generation and supplied 93% of consumers. By comparison, in 2005 they held 93% of generation and 99% of retail business.
Table 5.1 New Zealand’s big five gentailers, 2015
Company Ownership Capacity (MW)
Generation (GWh)
Revenue (NZD million) Employees Customers
Contact Energy Private 2 022 9 514 2 443 1 160 429 556
Genesis Energy Mixed ownership model (public/private) 1 942 6 699 2 098 931 531 011
Meridian Energy Mixed ownership model (public/private) 2 654 13 332 2 904 820 279 616
Mercury Energy (formerly Mighty River Power)
Mixed ownership model (public/private) 1 556 6 563 1 678 800 390 999
TrustPower Private 593 2 216 993 628 258 118
In recent years, the market share of independent producers in the generation segment grew slowly from 8% in 2005 to 10% in 2015, which includes smaller independent power producers (including distributed generation) and combined heat and power plants. The share of independent retailers grew from 1% in 2005 to 7% in 2015, as can be seen in Table 5.2. More retailers are competing in more regions and many companies operate several brands with tailored service products for specific markets. The market shares of the big five gentailers have seen very slight reductions for both generation and retail; because of small changes in electricity generation investment, some thermal stations have been closed (Genesis Energy, Contact Energy), while investment in renewable energy increased.
© O
ECD
/IEA,
201
7

5. ELECTRICITY
65
PAR
T I.
ENER
GY
SEC
UR
ITY
Table 5.2 Evolution of the market share of the big five gentailers, 2005, 2010 and 2015
Generation market share (by GWh) Retail market share (by customer number)
2005 2010 2015 2005 2010 2015
Mercury Energy* 14% 16% 16% 18% 21% 19%
Genesis Energy 18% 22% 19% 29% 27% 26%
Meridian Energy 29% 22% 29% 12% 13% 14%
Contact Energy 26% 24% 21% 28% 24% 21%
Trustpower 6% 5% 6% 12% 11% 13%
Other 8% 11% 10% 1% 4% 7%
* Formerly Mighty River Power.
Policy and market reform
The Ministry of Economic Development initiated an Electricity Market Review in April 2009. The review concluded that consumers had paid higher prices than justified by the cost of new generation and that the New Zealand electricity supply system was widely perceived as being fragile and vulnerable to frequent crises with price spikes. With the objective to improve the performance of the electricity market, its institutions and its governance arrangements, the review aimed at ensuring that the electricity sector contributes to economic growth by providing for security of supply and efficient fair prices.
Since 2010, key recommendations have been implemented and measures adopted to improve governance, competition, security of supply and financial hedge liquidity. These measures included:
The restructuring of the Electricity Commission into the Electricity Authority with a narrowed focus on the rules and efficiency of the electricity market, including transfer of broader regulatory functions to other agencies.
The Commerce Commission to review and approve grid expenditure plans by Transpower as part of the overall regulation of its revenue requirements and expenditure under Part 4 of the Commerce Act.
The Energy Efficiency and Conservation Authority (EECA) to absorb the Electricity Commission’s electricity efficiency programmes.
Measures to improve retail competition, including virtual asset swaps (cross hedging) between state-owned generators and the sale of a hydro scheme from Meridian Energy to Genesis Energy.
Measures to improve security, including abolishing the reserve energy scheme because it risked reducing incentives for market participants to manage their own supply risks.
Transpower to undertake emergency management and provision of information and forecasting on security of supply, subject to rules set by the EA.
© O
ECD
/IEA,
201
7

5. ELECTRICITY
66
In addition to reforms prescribed in the law (section 42 of the Electricity Industry Act 2010), the EA has adopted a comprehensive work programme (EA, 2016a) with many new measures under its competence to review and update the Electricity Industry Participation Code (the Code), including a requirement to facilitate and improve the market for hedge products and consumer participation, such as:
Improve prudential and security requirements for clearing and settlement (reduced prudential security required to trade in the wholesale market while at the same time reducing the risk of default).
Introduce trading conduct provisions to reduce opportunities for generators to use market power during transmission-constrained periods. Since July 2014, there are safe harbour provisions under Clause 13.5 A of the Code which require generators and ancillary service agents to observe a high standard of trading conduct in relation to offers and reserve offers.
Facilitate more effective locational risk management by establishing an FTR market.
Encourage retail competition and supplier switching by the “What’s my number” campaign, promoting a voluntary default use of system agreement for the connection to distribution networks and requiring retailers to provide consumers their consumption data the for last two years, if a consumer or her agent requests the data.
Market power
In 2009, the CC conducted an investigation in the market power of the gentailers and found that four of them used their market power to make profits in periods of hydro storage scarcity but did not engage in anti-competitive behaviour. On the basis of the Ministerial Review of 2009, several measures were adopted with the objective to improve competition in the retail market and foster security of supply.
First, virtual asset swaps (VAS) – 15-year hedge contracts − between the three state-owned gentailers were created to reduce the regional focus of these generators and increase competition in incumbent regions. Secondly, Tekapo A&B generating stations in the South Island were transferred from Meridian Energy to Genesis Energy. The addition of a physical generation asset in the South Island was designed to increase the number of hydro generation decision-makers in the South island.
The partial privatisation and VAS have not altered the generation market or the national retail market shares of the five gentailers significantly, as shown in Tables 5.1 and 5.2. The actual impact of VAS on prices and the behaviour of three of the big gentailers cannot be generalised for all market situations, as they strongly depend on the transmission constraints and the cost of hydropower generation, which is very different in dry and wet years.
The 2009 Ministerial Review of the Electricity Market also considered the issue of vertical integration (Appendix 20), but rejected the option of enforcing the separation of retailing and generation for the following reasons: first, vertical integration may facilitate risk management efficiencies that are difficult to achieve via contracts; secondly, separation may increase total costs as it increases the risk for separated retail and generator businesses; and thirdly, integrated gentailers may provide long-term security for investment in generation, reducing the cost of capital. The Ministerial Review believed that it was not clear that separation would actually improve hedge market and retail
© O
ECD
/IEA,
201
7

5. ELECTRICITY
67
PAR
T I.
ENER
GY
SEC
UR
ITY competition in practice. However, experience in other IEA jurisdictions, notably in the
United Kingdom and Germany, shows the possible negative impact that vertical integration of several large gentailers can have on competition, transparency and innovation, including:
undermining development of a more competitive physical market
limiting the scope for new entrants
undermining timely and efficient financial market development
limiting the degree of innovation, especially in products and services
reducing the degree to competitive pass-through of efficiency gains
reducing the effectiveness of consumer choice and market participant behaviour.
On the positive side, the concentration in the retail market (as measured by the Herfindahl-Hirschman Index or HHI) has come down from 4000 in 2011 to below 3000 in 2015. Electricity markets with HHI indices of above 2500 are considered highly concentrated. Noteworthy is the change of the HHI positions between North and South Islands, which occurred in 2011, resulting in a higher HHI in the North Island than in the South Island. The retail market share (ICP count) held by the large gentailers has remained stable with a small decline. Since the reforms of 2010, the market size of smaller retailers has increased more than threefold albeit from a very low base, indicating that the retail market is very dynamic, and concentration is becoming lower. New Zealand is moving towards more competitive wholesale and retail markets (see Figure 5.1 and Figure 5.2).
Figure 5.1 Evolution of market concentration (HHI) and retail competition (ICP count)
0
50
100
150
200
250
300
350
400
450
Dec-0
3
Jun-04
Dec-0
4
Jun-05
Dec-0
5
Jun-06
Dec-0
6
Jun-07
Dec-0
7
Jun-08
Dec-0
8
Jun-09
Dec-0
9
Jun-10
Dec-1
0
Jun-11
Dec-1
1
Jun-12
Dec-1
2
Jun-13
Dec-1
3
Jun-14
Dec-1
4
Jun-15
Dec-1
5
Index (D
ec 20
03 =
100
)
ICP indexed others
ICP indexed 5 largest
HHI indexed
Note: ICP = Installation Control Point; HHI = The Herfindahl-Hirschman Index or HHI is a measure for industry concentration taking into account the size of firms in relation to the industry. It is calculated by adding the sum of the squares of the percentage market shares of each market participant. For example, a market consisting of five competing firms, each with a 20% share of the market would have an HHI score of 2 000 (i.e. 202 x 5). HHI is typically used to help assess the degree of market dominance and potential for market power abuse. Views vary on the interpretation of HHI scores. This study uses the scale developed by the European Union, with scores of 750‐1 800 considered indicative of moderate concentration; scores of 1 800 to 5000 indicative of high levels of concentration and scores above 5 000 indicative of very high concentration consistent with the presence of substantial potential market power. Source: EA (2016b), EMI database (market statistics and tools), www.emi.ea.govt.nz/.
© O
ECD
/IEA,
201
7
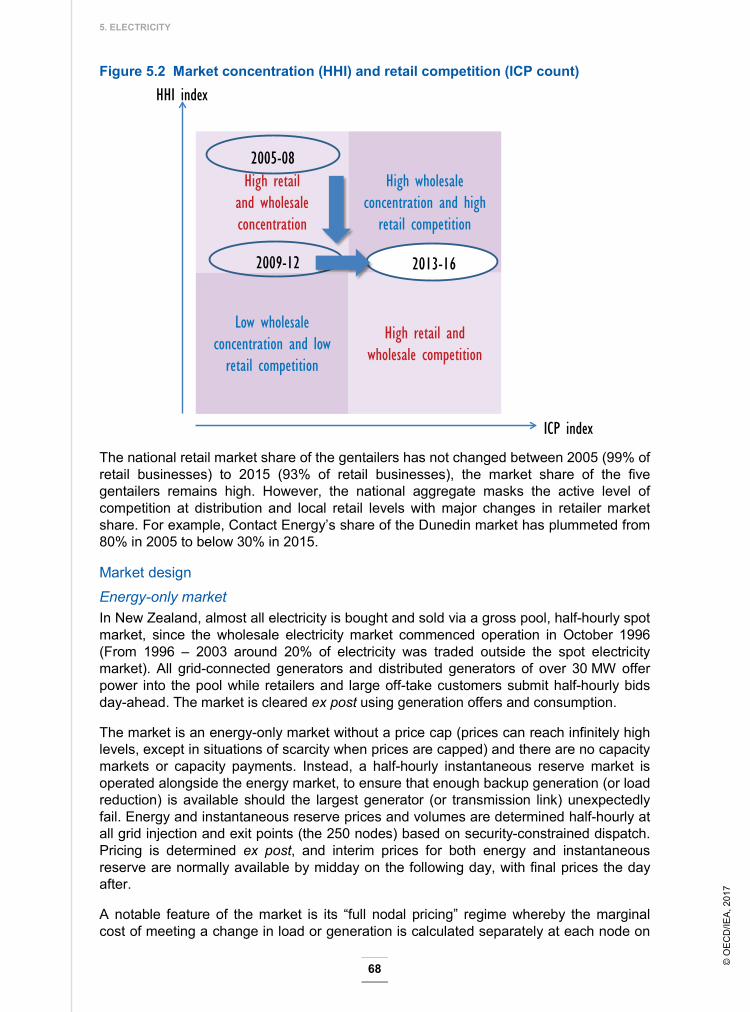
5. ELECTRICITY
68
Figure 5.2 Market concentration (HHI) and retail competition (ICP count)
High retail and wholesale concentration
Low wholesale concentration and low
retail competition
High retail and wholesale competition
High wholesale concentration and high
retail competition
ICP index
HHI index
2009-12 2013-16
2005-08
The national retail market share of the gentailers has not changed between 2005 (99% of retail businesses) to 2015 (93% of retail businesses), the market share of the five gentailers remains high. However, the national aggregate masks the active level of competition at distribution and local retail levels with major changes in retailer market share. For example, Contact Energy’s share of the Dunedin market has plummeted from 80% in 2005 to below 30% in 2015.
Market design Energy-only market In New Zealand, almost all electricity is bought and sold via a gross pool, half-hourly spot market, since the wholesale electricity market commenced operation in October 1996 (From 1996 – 2003 around 20% of electricity was traded outside the spot electricity market). All grid-connected generators and distributed generators of over 30 MW offer power into the pool while retailers and large off-take customers submit half-hourly bids day-ahead. The market is cleared ex post using generation offers and consumption.
The market is an energy-only market without a price cap (prices can reach infinitely high levels, except in situations of scarcity when prices are capped) and there are no capacity markets or capacity payments. Instead, a half-hourly instantaneous reserve market is operated alongside the energy market, to ensure that enough backup generation (or load reduction) is available should the largest generator (or transmission link) unexpectedly fail. Energy and instantaneous reserve prices and volumes are determined half-hourly at all grid injection and exit points (the 250 nodes) based on security-constrained dispatch. Pricing is determined ex post, and interim prices for both energy and instantaneous reserve are normally available by midday on the following day, with final prices the day after.
A notable feature of the market is its “full nodal pricing” regime whereby the marginal cost of meeting a change in load or generation is calculated separately at each node on
© O
ECD
/IEA,
201
7

5. ELECTRICITY
69
PAR
T I.
ENER
GY
SEC
UR
ITY the electricity network. The differences in prices between the nodes reflect the costs of
half-hourly transmission losses and constraints (congestion). Nodal prices represent the change in the total cost (as represented by market participants’ bids and offers) of meeting the system’s energy requirements after a change in load or generation at each node. This locational value of energy includes the cost of the energy and the cost of delivering it, i.e. transmission losses and congestion. It represents that marginal cost of the final unit of supply that meets the system’s demand – the locational marginal price. In the wholesale market, nodal prices incorporate the effects of generation offers, demand bids, and transmission losses and constraints on the total cost of meeting the system’s load requirements.
Nodal prices are also affected by the price of instantaneous reserves. This is a result of the trade-off between the cost of energy and instantaneous reserves arising from the co-optimisation of energy and instantaneous reserve markets. As the nodal spot prices signal the marginal cost of delivered energy at each node, this can lead to significant local price fluctuations that can create substantial financial risk exposures for market participants.
Electricity retailers and a small number of customers (generally large industrial users) purchase from retailers under contracts that give them some exposure to spot prices. As electricity spot prices can vary significantly across nodes, on a half-hourly, weekly and seasonal basis, these parties will typically also enter into financial hedges or futures contracts which allow them to manage the volatility associated with locational marginal pricing. Risk management through financial hedging or vertical business integration is therefore essential for generators and purchasers.
The system operator Transpower dispatches generation in accordance with generator offers subject to network security constraints, in order to ensure that supply and demand balance in real time. Before real time, it produces half-hourly schedules of expected volumes and prices, for information purposes only.
The instantaneous reserve market is split into the “fast” (six-second reaction) and “sustained” (sixty-second) reserve markets. Providers of these services must be registered with Transpower and offers to provide the service are submitted in the same way as in the energy market. The dispatch model does not prefer one type of instantaneous reserve over another. Instantaneous reserve prices are calculated at the same time as the energy spot prices. As instantaneous reserve prices typically reflect the opportunity cost of generating, they are often higher than the energy spot price when supply is low. Instantaneous reserve (IR) price cannot exceed the energy price. The cost of instantaneous reserves procured through the market is set by reference to the generating station (or the high-voltage direct-current link) that is setting the need for instantaneous reserve, being the largest unit(s) operating on the system at that point in time – known as the largest contingent event. Costs are pro rata allocated to all generating units above a de minimis.
Demand response (DR) New Zealand has developed incentive-based DR mechanisms, including interruptible load, Transpower’s DR programme, demand-side bidding and forecasting, dispatchable demand as well as ripple control. An overview of the actual amounts of demand response is given in Box 5.1 below.
Interruptible load is a form of instantaneous reserve, and is shed automatically by frequency-controlled relays when the grid frequency falls below 49.2 hertz (Hz).
© O
ECD
/IEA,
201
7

70
5. ELECTRICITY
Interruptible load, currently around 20% to 40% of offers into the instantaneous reserve market, is provided by industrial and commercial end-users (steel, paper and pulp, meat and food processing) who receive payments either directly or from an aggregator, or by distribution network companies controlling domestic water-heating load (so-called hot water ripple control). Most distributors still use ripple control to regulate their system peaks, but it has reduced in significance.
Transpower offers grid support DR contracts, primarily to reduce the need to invest in transmission. In the 2015 annual security assessment of Transpower, the peak demand projections in the North Island were reduced by 176 MW to account for projected demand response at peak times. Participants curtail their demand when called upon, and receive a call payment. At present, the use of this DR has been low and limited. However, Transpower has an active demand-response trial programme to prepare itself and the market for future operational use.
As a rule, demand side does not opt to bid into the pool (unless submitting a voluntary difference bid) and load is centrally forecast by Transpower. Large users may choose to bid their load. Dispatchable demand allows them to submit nominated bids at the grid entry point from which they consume and subject their load to dispatch for each half-hour trading period, in a manner similar to a generator. Demand-side bidding allows purchasers’ price-response intentions to be factored into forward-looking schedules. Two schedules are produced, one with the bids taken into account (the price-responsive schedule), and one without (non-response schedule). This provides information on the sensitivity of forecast price to demand reduction, assisting parties to respond appropriately to the nodal price.
Purchasers can reduce their demand in response to forecast half-hourly spot-price trading periods and to indicative five-minute prices published close to real time. However, only a few large purchasers can use this in practice, small and medium-sized businesses have limited physical access to the wholesale physical market and have very low load to shift. This is why aggregators usually support their participation. As the only aggregator active in New Zealand to date, Enernoc, a US-based company, has been aggregating smaller demand to be able to offer products into the wholesale market and to offer automated demand response.
Ripple control has been in place for decades and allowed the retailers to control load in real time by the use of frequency-sensitive relays triggering the circuit breakers (ripple control) through electric hot-water heaters and time of use pricing (night/day tariff). The growing deployment of smart meters is expected to encourage price-based demand response (through time of use, real-time and peak pricing to users).
Price trends Spot market The spot market is uncapped and prices are allowed to freely increase or decrease to reflect marginal value and scarcity levels, except for scarcity events when the price is capped and administered to a range of between NZD 10 000 and NZD 20 000/MWh. Electricity wholesale prices fluctuate in line with seasonal hydropower availability. During 2012-13, price fluctuations and spikes were much higher than in previous years, notably in the South Island at the end of the summer when storage levels were low. Since 2014, monthly average wholesale prices have seen less volatility and have fluctuated moderately between NZD 50 and NZD 100 per MWh (Figure 5.3). During 2009-11 monthly average wholesale prices had reached as low as NZD 10 per MWh, reflecting
© O
ECD
/IEA,
201
7

5. ELECTRICITY
71
PAR
T I.
ENER
GY
SEC
UR
ITY
falling demand for the first time in several decades, combined with high hydro inflows and completion of new generating plants. Historic average monthly price spiked up to NZD 350 per MWh during the supply crises of July 2001, April 2003 and June 2008 (see Figure 5.4) and created concerns for the security of supply.
Figure 5.3 Wholesale electricity monthly average prices, North Island and South Island, 2009-16
0
50
100
150
200
250
Jul-09 Jan-10 Jul-10 Jan-11 Jul-11 Jan-12 Jul-12 Jan-13 Jul-13 Jan-14 Jul-14 Jan-15 Jul-15 Jan-16
USD/
MWh
NorthIsland
SouthIsland
Source: EA (2016b), EMI database (market statistics and tools), www.emi.ea.govt.nz/.
Figure 5.4 Wholesale electricity weekly average prices and actual energy cost, 1998-2010
0
50
100
150
200
250
300
350
Jan-97 Jan-98 Jan-99 Jan-00 Jan-01 Jan-02 Jan-03 Jan-04 Jan-05 Jan-06 Jan-07 Jan-08 Jan-09 Jan-10
USD/
MWh
Spot monthly avgerage(Haywards)
Contract annual baseload(Energyhedge)
Actual Energy Cost(Pulp & Paper NZSIC code)
Source: IEA based on data by MBIE, 2016.
Financial markets Efficient and cost-effective risk management can occur either physically (through vertically integrated entities) or financially (through a liquid, deep financial and derivatives market). In its early years, the main risk management product available in the electricity market in New Zealand was a bilateral financial hedge, or over-the-counter contract for difference (OTC CFD), sold by generators to other generators or retailers. Market liquidity was generally poor as generators were inclined only to sell sufficient hedge products to cover the generation portfolio of their own firm, less their internal retail commitments.
New Zealand’s hedge market was created only recently, based on the 2010 electricity market reforms with a view to improve the competitive environment for generators, which
© O
ECD
/IEA,
201
7

5. ELECTRICITY
72
is a very positive development. The government has the aim to stimulate competitive new entry of non-physical financial market participants in order to reduce reliance on physical wholesale markets to supply forms of hedging products. However, it does not yet seem to function in an optimal manner. The current financial market is relatively new and still lacks liquidity and depth. It does not create sufficient incentives that are needed to support efficient and cost-effective risk management by retailers to sustain competitive, new independent retail entrants.
Under the current spot market arrangements, the risk management of the gentailers (physical hedging strategy) is driven by the ownership and the vertically integrated structure rather than seasonal price fluctuations during a dry year; the high prices in the spot market benefit the generation business at the expense of the retail segment; when spot prices are low, the loss of profits on the generation side is offset by increased profits in the retail arm. This risk management approach also works on the basis of the alignment of the retail and generation businesses in geographic locations. Meridian Energy's generation assets are in the South Island, where its retail stronghold is also located. Mercury's generation assets are exclusively in the North Island, and their retail customer base is also primarily in the North Island.
In the nodal price system, exposure to high price fluctuations will usually occur at points of persistent congestion where price separation is common. At times of high transmission constraints and losses, fragmentation of the market can occur with consequent price separation. The generation ownership and limited transmission capacity in New Zealand means that there can be potential for market power abuse at congested nodes. The Electricity Participation Code has provisions to mitigate such market power, through the “pivotal supplier” and “undesirable trading situation”. Given that the major generators are also retailers, the requirement to purchase risk management from a competitor was one of the factors limiting new retail entrants that the Ministerial Review of 2009 had identified. The resulting ownership change where Tekapo A&B generating stations in the South Island were sold from Meridian Energy to Genesis Energy, provides Genesis with a physical generation asset, an incentive for retail presence and “ownership” of hydro values in the South Island. Similarly, virtual asset swaps between Genesis, Meridian and Mercury gave Mercury a virtual South Island generator, and Meridian a virtual North Island generator to complement its existing wind assets.
In recent years the Electricity Authority has facilitated an increase of interest and activity in the futures market. A financial transmission rights product was established in 2013 at Benmore and Otahuhu, and three more nodes were introduced in 2014. Financial transmission rights provide a means to manage the price separation risks associated with network congestion. The radial nature of the transmission system is likely to accentuate the need for a nodally priced system that clearly highlights points of persistent congestion. It was hoped that the listing of a baseload electricity futures product for two reference nodes (Benmore and Otahuhu) in 2009 by the Australian Stock Exchange ASX, would improve market liquidity. However, for a few years, only small volumes were traded (below 2 500 GWh).
The financial market operated by the Australian Stock Exchange is moderately concentrated with an HHI of 2000, lower than the wholesale market. The higher HHIs in later years reflect thin trading of hedges for periods far into the future. The volumes of ASX futures and options increased in late 2011 after the EA encouraged market making on the ASX by the large gentailers. Total traded volumes of ASX futures contracts almost
© O
ECD
/IEA,
201
7

5. ELECTRICITY
73
PAR
T I.
ENER
GY
SEC
UR
ITY
doubled between 2012 and 2015, as shown in Figure 5.5, starting from a low level, but largely replacing over-the-counter contracts for difference (OTC CFDs). However, the overall volume of available hedge products has remained stable during 2011-14.The unmatched open interest (UOI) for ASX futures contracts increased at the same time as trading volumes.
Figure 5.5. Hedge market products and their volume, 2009-14
0
5 000
10 000
15 000
20 000
25 000
30 000
35 000
40 000
2009 2010 2011 2012 2013 2014
GWh
OTC options
ASX futures and options
Fixed price
OTC CFDs
Source: EA (2016b), EMI database (market statistics and tools), www.emi.ea.govt.nz/.
Despite growing traded volumes, leading to the emergence of an increasingly robust forward curve, the financial market’s actual hedge liquidity remains relatively low. New Zealand’s power system has only low hydro storage levels (13 weeks) which give little certainty about futures contracts.
In 2016, the EA consults on the introduction of a cap product. However, it may not have sufficient liquidity and depth initially to provide an adequate risk management during a scarcity event. Given the potential for an infinite price in an energy-only spot market (in the events of scarcity) without an effective demand response (which is the case in New Zealand at present), it is likely that the risk exposure would greatly limit the number (and volume) of counterparties willing to enter into such contracts (essentially to those gentailers who are able to physically hedge their exposures). And it could be expected to inflate the price of the product.
Retail market
Market structure
Since the 2010 reforms, the government and the Electricity Authority focused their efforts not only at increasing competition in the retail market, ensuring efficient price signals, reducing barriers for new retailers to enter and expanding the market, but also at reducing information barriers for consumer participation and retailer switching. Most consumers buy electricity on contract from retailers, who, in turn, purchase electricity on the wholesale market. The retailer is responsible for the installation of appropriate metering, meter reading, billing and payment collection, including network charges. Distributors can now also retail under certain conditions, unless they reach the threshold of 75 GWh per year which prohibits cross-ownership. As an example, in 2016, distributor Buller Electricity purchased retail company Pulse Energy.
© O
ECD
/IEA,
201
7

5. ELECTRICITY
74
The majority of New Zealand’s retail market is served by the retail business of the five major gentailers (Genesis Energy, Contact Energy, Mercury Energy, Meridian Energy and TrustPower). Their consumer base has remained relatively stable for over a decade, except TrustPower which was able to grow its retail business to the level of small retailers, since 2012.
A number of new retailers have commenced operations in New Zealand, reaching about 20 in 2016. Retail market growth has come from a growing number of retail arms of incumbent gentailers (Todd Energy’s Nova, Meridian Energy’s Powershop). Since 2010, actual growth comes from small independent retail companies (see Figure 5.6) with innovative pricing strategies (Pulse Energy) but without their own generation portfolio (Flick Electric, Payless Energy, Hunet Energy, Electric Kiwi, Prime Energy, Simply Energy.
Instead of traditional power purchase contracts with a set price for the energy used, companies offer discounted rates for specific volumes (Powershop), or even more innovatively, paying the wholesale spot price plus a margin (Flick Electric). Customer bases for these innovative retailers have grown rapidly. The level of retail competition varies across the country, but generally all customers have a choice of retailer, in some parts of New Zealand there are ten or more competing retailers. The entry of new retailers has improved; however some small independent retailers have expressed concerns about their capacity to develop their businesses in a marketplace dominated by large gentailer incumbents.
Figure 5.6 Evolution of retail market shares of gentailers and small retailers
0
100
200
300
400
500
600
Dec-0
3
Jun-04
Dec-0
4
Jun-05
Dec-0
5
Jun-06
Dec-0
6
Jun-07
Dec-0
7
Jun-08
Dec-0
8
Jun-09
Dec-0
9
Jun-10
Dec-1
0
Jun-11
Dec-1
1
Jun-12
Dec-1
2
Jun-13
Dec-1
3
Jun-14
Dec-1
4
Jun-15
Dec-1
5
ICP Cou
nt (th
ousan
d)
Mighty River Power
Contact Energy
Genesis Energy
Meridian Energy
TrustPower
Small retailers
Source: EA (2016b), EMI database (market statistics and tools), www.emi.ea.govt.nz/.
Price trends
After the liberalisation, electricity prices saw a constant upward acceleration during 2004-11, linked to rising thermal fuel costs (especially natural gas) which set the marginal price, increasing maintenance costs for ageing plants, and rising cost of new builds, but also to the increase in the goods and services tax (GST).
The 2009 electricity market investigation by the Commerce Commission and the Electricity Market Review by the Ministry of Economic Development expressed concern about this upward trend, the fragility of security and the continuity of supply (particularly the dry winter event of 2008) and proposed several market reforms in 2010 (see also section on security of electricity supply). As shown in Figure 5.7, the first 2000 decade was marked by a general increase in electricity retail prices in many IEA jurisdictions.
© O
ECD
/IEA,
201
7

5. ELECTRICITY
75
PAR
T I.
ENER
GY
SEC
UR
ITY Figure 5.7 Electricity prices in New Zealand and in other selected IEA member
countries, 1980-2015
Industry Households
0
20
40
60
80
100
120
140
160
180
1980 1985 1990 1995 2000 2005 2010 2015
USD/
MWh
New Zealand Norway Portugal Canada Switzerland
0
50
100
150
200
250
300
350
1980 1985 1990 1995 2000 2005 2010 2015
USD/
MWh
Note: Gaps show years when data were not available. Source: IEA (2016), Energy Prices and Taxes, www.iea.org/statistics/.
Figure 5.8 Trends and composition of electricity prices, 2004-15
80
90
100
110
120
130
140
150
2004 2005 2006 2007 2008 2009 2010 2011 2012 2013 2014 2015 2016
Index (2
004)
Linescomponent
Energy andother component
Note: Real prices calculated with consumer price index from Q1-2016 and indexed at 100 for 2004 prices. The data series do not include inflation, as it is an index relative to the first data point. Source: IEA based on EA (2014a) and MBIE, 2016.
In New Zealand, the increase coincided with the establishment of the gentailing structure; the acceleration during 2009 to 2014 for residential customers is significant. Looking at the drivers of more recent price increase since 2009, it can be observed that mainly network costs had an impact while the energy component has remained steady since 2010. The regulated lines component has increased because of the investment made in network expansion (see section on network adequacy below), largely reflecting transmission augmentation and upgrades to the high-voltage direct-current system, and less so distribution networks. Table 5.3 shows the annual percentage changes in the transmission, distribution and total lines component indices.
Electricity prices in New Zealand are unregulated with the exception of transmission and distribution charges which fall under the jurisdiction of the CC under Part 4 of the Commerce Act 1986. One exception is that retailers are required to provide low fixed-charge tariff options for low-energy users of no more than 30 cents per day under the
© O
ECD
/IEA,
201
7

5. ELECTRICITY
76
(Low Fixed Charge Tariff Option for Domestic Consumers) Electricity Regulations 2004 which were amended in 2008. Low energy-users are defined as domestic consumers using less than 8 000 kilowatts hours (kWh) per year, or 9 000 kWh per year for consumers in the lower South Island (Christchurch and below, excluding the West Coast). The tariff options are monitored and enforced by the Electricity Authority. Distribution companies are also obliged to offer low fixed-charge tariff options (to retailers or directly to consumers) at a maximum of 15 cents per day.
Table 5.3 Percentage change of transmission, distribution and total lines component, 2011-16
Year ending May Percentage change
Transmission Distribution Total lines
2011 10.3% 3.4% 5.0%
2012 23.6% 5.1% 9.6%
2013 1.9% 2.2% 2.1%
2014 10.7% 5.4% 6.9%
2015 4.6% -1.0% 0.6%
2016 4.0% 1.7% 2.4%
Note: The table compares data (May to May), as the changes in the total lines component occur on 1 April Source: MBIE, 2016.
By international comparison, household electricity prices in New Zealand have grown from low levels much faster than in other IEA countries. Household prices were well above the IEA average in 2014, while industrial prices are below the IEA average (Figures 5.9 and 5.10).
Figure 5.9 Industry electricity prices in IEA member countries, 2014
0
50
100
150
200
250
300
350
USD/
MWh
Tax component
* Tax information not available for the United States. Note: Data not available for Australia, Korea and Spain. Source: IEA (2016), Energy Prices and Taxes, www.iea.org/statistics/.
© O
ECD
/IEA,
201
7

5. ELECTRICITY
77
PAR
T I.
ENER
GY
SEC
UR
ITY
Figure 5.10 Household electricity prices in IEA member countries, 2015
0
100
200
300
400US
D/MW
hTax component
* Tax information not available for Australia, Korea and United States. Note: Data not available for Spain. Source: IEA (2016), Energy Prices and Taxes, www.iea.org/statistics/.
Consumer engagement
International experience suggests that empowering consumers and increasing their participation is critical to building transparent and competitive retail markets, including:
Increasing customer exposure to real‐time pricing, with protection of vulnerable consumers addressed through targeted transfers that do not unduly distort efficient price formation.
A competitive, dynamic retail market to encourage the development of innovative products and services that can harness demand response effectively and at least cost.
Ready access to detailed, real‐time customer information, while ensuring privacy, to help stimulate competition, facilitate competitive entry, support the emergence of innovative business responses, and improve customer choice.
A knowledgeable and well‐informed customer base that has the capability and opportunity to take full advantage of available choices.
Market processes for contracting, switching and billing that are as simple and seamless as possible to keep transaction costs to a minimum.
Legal and regulatory governance frameworks that reduce uncertainty, establish clearly specified rights, responsibilities and obligations on contracting parties, promote greater harmonisation of standards and functionality specifications, and maximise scope for participation among potential service providers and customers.
Enabling technologies that provide cost‐effective, real‐time metering information, verification and control capability to support the introduction of real‐time pricing, the development of a wider range of innovative demand response products, and more effective customer choice.
The following section analyses how the New Zealand retail market performs against these criteria.
© O
ECD
/IEA,
201
7

5. ELECTRICITY
78
Demand response (retail) Before liberalisation, demand-side management was using automated ripple control and blunt time-of-use pricing to extract limited flexibility from electricity users. Such forms of demand-side management have reduced in prominence with the advent of unbundling and the growth of more innovative products to support the development of customer-driven demand response. However, the current volume of new types of demand response available in New Zealand is still behind stated policy goals.
To date, aggregators cannot directly aggregate load over several retailers or several grid exit points (GXPs), the points of connection where electricity flows out of the national grid to local networks or directly to consumers.
Liberalisation combined with the spread of advanced metering infrastructure offers the potential for a new range of more innovative products and services to emerge which can help to harness more efficient, flexible and cost-effective demand response. For example, some retailers have started offering residential time-of-use tariffs to customers with smart meters, including some products linked directly to the wholesale price (Flick). During periods of low peak prices, the product offering is attractive, but it can be quite expensive in periods of high peak prices. This encourages some residential consumers to engage in active demand management at home. Larger commercial and industrial customers have had time-of-use metering for some time, affording the opportunity for them to respond to price for many years.
Some distributors operate congestion pricing with higher variable network charges (fixed component stays stable) at times of actual or forecast network congestion, sending signals to reduce peak demand to avoid the need for expensive incremental investment in peak capacity; and conversely, low- or zero-use of system charges at off-peak times to encourage load to be moved to these periods. The transmission pricing methodology, which recovers the costs of the national grid from distributors and directly connected to large industrial users, also includes a peak pricing component. This should encourage demand response (including the use of local, small generation) by larger users and distributors; however, these charges are almost never reflected in retail tariffs of smaller users and aggregators.
Supplier switching Customers can switch between retailers. The switching process takes about 24 hours but should not take longer than 12 days and any party can be an electricity retailer provided the minimum requirements are met.
The Electricity Authority (EA) successfully carried out the “What's My Number” campaign to help inform and educate consumers about retail market opportunities. The campaign was very successful initially, resulting in a near doubling of switching rates during 2009-12. Since then, rates stabilised at healthy levels of between 17% and 20% before reaching the record high in 2016 at 21% (Figure 5.11).
© O
ECD
/IEA,
201
7

5. ELECTRICITY
79
PAR
T I.
ENER
GY
SEC
UR
ITY
Box 5.1 Quantitative overview of demand response in New Zealand Demand response available in the New Zealand electricity market amounts to around 4 600 MW thanks to several demand management actions in residential, commercial and industry sectors (total annual electricity demand is 40 000 GWh or 4 600 MW).
Residential 32% = 12 800 GWh or 1 500 MW
Spot market price response initiated by the customer (11 000 residential customers on spot-based tariff for 0.3 kW load per residential customer demand responsive) = 0.025 GWh or 3 MW (these volumes are increasing rapidly).
Electric water-heating control (avoid transmission charging, defer investment, offered as instantaneous reserve) = 2 600 GWh (300 MW).
Extended reserves (automatic under frequency load shedding) = 90% of residential load nominated for AUFLS = 1 312 MW (load is very rarely interrupted).
Total = 2 600 GWh (303 MW) (excludes extended reserves because a mandatory requirement and load are very rarely interrupted).
Commercial 24% = 9 600 GWh or 1 100 MW
Spot market price response initiated by the customer (number of commercial customers on spot-based tariff x load per commercial customer demand responsive) = 480 GWh (55 MW).
Extended reserves (automatic under frequency load shedding) = 7% of commercial load nominated for AUFLS = 75 MW (very rarely interrupted).
Demand aggregator initiatives (schemes to encourage load shedding, offering load as instantaneous reserves) = 87 GWh (10 MW).
Transpower’s Demand Response Scheme (to avoid/defer transmission investment) = 87 GWh (10 MW).
Total = 654 GWh (75 MW) (excludes extended reserves because of a mandatory requirement; load very rarely interrupted).
Industrial 44% = 17 600 GWh or 2 000 MW
Spot market price response initiated by the customer (as signalled with bids) = 480 GWh (55 MW).
Dispatchable demand (Norske Skog set up as a dispatch-capable load station) = 526 GWh (60 MW).
Extended reserves (automatic under frequency load shedding) 4% of industrial load nominated for AUFLS 650 GWh (74 MW) (the majority of industrial loads have been granted an exemption).
Demand aggregator initiatives (schemes to encourage load shedding, offering load as instantaneous reserves) = 87 GWh (10 MW).
Transpower’s demand response scheme (to avoid/defer transmission investment) = 788 GWh (90 MW).
Total = 1 883 GWh (215 MW) (excludes extended reserves because of a mandatory requirement; load very rarely interrupted).
© O
ECD
/IEA,
201
7

5. ELECTRICITY
80
Figure 5.11 Trends in retailer switching rates in New Zealand, 2004-16
0
5
10
15
20
25
Jan-05 Jan-06 Jan-07 Jan-08 Jan-09 Jan-10 Jan-11 Jan-12 Jan-13 Jan-14 Jan-15 Jan-16
%
Note: 12-month rolling rate. Source: EA (2016b), EMI database (market statistics and tools), www.emi.ea.govt.nz/.
New Zealand has an online price comparison tool, the Consumer Powerswitch, which was created by a consumer advocacy group, NZ Consumer. It allows consumers to compare power companies’ products and prices in their region. Powerswitch has created a new tool to allow customers to obtain customised information about the best deal for them, depending on their consumption profile. Despite the overall success of the tool, its level of transparency and scope in a market that is changing fast is challenged. What’s My Number continues to run annually, and the EA has made a number of changes to retail data and transparency. Going forward, EA and NZ Consumer should consider annual switching campaigns and continue improving consumers’ access to retail data and the general transparency on prices and offers from companies on their website/portals. This portal could provide a market transparency platform.
The retail market remains fragmented. There are barriers for actual supplier switching that relate to retailers’ inability to manage their relationships with distributors in an effective manner across the domestic market. To date, distributors use different distribution agreements and terms of connection as well as charges, which make it difficult to enter and expand in the retail market and which involve high costs of doing business. In September 2013, a model use of system agreement was published as a voluntary model. The EA is currently considering introducing a default distribution agreement, which would provide a regulated default to be incorporated into the Electricity Participation Code to support voluntary compliance and to provide a regulatory fall-back option if voluntary compliance is unsuccessful.
The EA has also commenced a project to improve distribution pricing to foster uptake of new services and emerging technologies. This could lead to increased use of storage and demand response services that will reduce overall pressures on the network. It should enable distribution companies to fully benefit from energy efficiency and distributed generation where it reduces capacity constraints or counterbalances future increases in demand, for example from take-up of electric vehicles or heat pumps, and make smart grids a real success story.
© O
ECD
/IEA,
201
7

5. ELECTRICITY
81
PAR
T I.
ENER
GY
SEC
UR
ITY
Smart meters and smart grids New Zealand has relied on a market-based roll-out of smart meters by the retailers with no regulated cost recovery or incentives. By 2016, more than 50% of the old meters have been replaced by advanced smart meters and another 500 000 meters have been contracted. Smart meters now make up 62% of the residential market. In general, they measure consumption at least every 30 minutes, but some have more or less functionality.
In 2014, the Ministry of Business, Innovation and Energy, with the support of the Electricity Networks Association, established the Smart Grid Forum, which brings together business, scientific and academic representatives, along with policy makers, regulators and consumers. The Forum reviewed the market-led investment in smart metering (and ripple control upgrades) to identify lessons for future smart grid technologies. In its July 2015 report to the Minister of Energy, the Forum concluded that in the domain of fast-changing technology, a market-led approach relying on market participants and customers choosing if and when to invest is likely to be the most dynamic and efficient approach. However, it also recognised that there are potential co-ordination challenges between different appliances and equipment standards and the risk of customer benefits being delayed or compromised. The application of standards especially in relation to interoperability, along with access to clear and simple information to educate consumers about the benefits of smart technology solutions, would be desirable.
Vulnerable consumers There is no legal protection of vulnerable consumers in New Zealand. Voluntary guidelines of the EA define rules to assist vulnerable domestic consumers through alternative payment options, credit control, bonds and standards for disconnections following non-payment. The EA is responsible for ensuring that companies comply with these guidelines. It defines a low-income consumer as a domestic consumer for whom "it is genuinely difficult to pay his or her electricity bills because of severe financial insecurity, whether temporary or permanent.” Vulnerable consumers are consumers for whom, “for reasons of age, health or disability, disconnection of electricity presents a clear threat to their or a member of their household’s health or well-being”. As a rule, vulnerable consumers should not be disconnected for an unpaid bill – unless a power retailer has exhausted all reasonable attempts to contact the consumer and organise another method of repaying outstanding debt.
The retailer of last resort There is no universal supply obligation in place in the New Zealand electricity market, and there is no statutory obligation for any retailer to supply any customer or to ensure continuous supply to their customers. There are no regulated standards for customer contracts but there are also no guarantees in place for those consumers who choose a spot price contract and face higher financial exposure to return to a basic contract with a last-resort supplier.
However, there are arrangements to deal with a situation where a retailer enters default. These arrangements were reviewed through a consultation process conducted over 2012-14 and revised arrangements became effective in July 2014 which provide for three phases of activity: i) an initial phase where the defaulting retailer can resolve its default or assign its customers to another retailer, ii) a second phase (if required) where affected
© O
ECD
/IEA,
201
7

5. ELECTRICITY
82
consumers are given notice of the situation and given seven days to find an alternative retailer of their own choice, and iii) a final phase where the EA steps in to allocate any remaining consumers to other retailers. This last stage involves three sub-steps: an initial tender; another tender if the first one does not allocate all remaining customers; and then a direct pro rata allocation to retailers if the second tender fails to allocate all remaining customers. This approach has been developed to find a balance between the needs of consumers and the risk for generators and distributors to see their financial losses increase as the default progresses.
The arrangements require retailers to include provisions in their customer contracts that will allow the EA to assign the contracts to other retailers in the event of default. This is the only aspect of customer contracts with retailers that is regulated by the EA. Retailers are encouraged to align their contracts with the EA’s principles and minimum terms and conditions for domestic contracts for delivered electricity. Reviews of retailer contracts have shown that there is a high degree of alignment between these contracts and EA’s recommended terms and conditions.
In practise, such a multi-phase market-based approach may take too much time and not swiftly address the security of supply concerns of consumers. The EA process requires the defaulted retailer and the newly assigned supplier to agree on terms of transfer which may be difficult to achieve quickly in practice. It may also be difficult to find sufficient retail capacity to absorb a large number of consumers at short notice. There is no financial incentive to voluntarily take on new load, particularly during periods of water scarcity when the spot price is rising fast and retailers are likely to come under greatest financial pressure. The experience in 2001 was that retailers stopped accepting new customers shortly into the crisis. In the second stage, the tender may be sensitive to how the reserve price is set, as buying retailers do not need to make a competitive offer and bid a high value, given that consumers need to be served and not many are interested in taking up clients. During the allocation by the EA, public notice is given about the default of the supplier and eventually consumers will find their new supplier. During the major historic price spikes of 2001, 2003, 2005 and 2008, the actual energy cost stayed rather low and annual baseload contracts did not rise at all.
The absence of an ex ante last-resort mechanism can be problematic for those consumers who cannot switch, as they purchase all of their supplies from the wholesale market, or for those who have no active retailer because the old retailer or distributor disconnects them. For those cases, a vulnerable consumer’s protection mechanism should be explored through legal provisions or an amendment to the EA guidelines for vulnerable consumers.
Consumer participation The EA has an ambitious work programme to support technology innovation and retail market development, consistent with the key principles for the successful competitive retail market development outlined above. The EA aims to strengthen price signals through revised dispatch/gate closure rules, encouraging more real-time pricing, to improve trading liquidity and risk management through a new cap product, and new transmission and distribution pricing methodologies. In addition, the forthcoming 2016/17 EA work programme has a strong consumer and retail focus with the objectives of improving access to retail data for all market participants, and for retailers, reducing barriers to entry and expansion into distribution networks by considering a proposal to
© O
ECD
/IEA,
201
7

5. ELECTRICITY
83
PAR
T I.
ENER
GY
SEC
UR
ITY
introduce a default distribution agreement by regulation, and by fostering the uptake of innovative technologies (battery storage, solar PVs, electric vehicles and internet) and consumer activation and participation (EA, 2016).
Consumers' Institute of New Zealand (Consumer NZ) is the main consumer advocacy organisation; it hosts a website with price comparison and retailer switching tools. The Electricity and Gas Complaints Commission (EGCC) provides independent dispute resolution services for individual electricity and gas complaints. The EA involves consumer representatives in their work through the retail advisory group (8 members). The interests of large electricity consumers are represented by the Major Electricity User Group, and household consumers by the Domestic Electricity Users Group.
Despite its mandate to secure consumers’ interests, the EA has a strong focus on wholesale markets (incumbents) and the Electricity Industry Participation Code through annual reviews. The nature of the growing Code reviews and the many new rules under discussion, with major impact on consumers, require the government to revisit consumer involvement and engagement in the context of market development. The Smart Grid Forum has been a platform for a broad societal discussion. However, it does not have any formal mandate to provide input into the changes of the Code or the government’s legal proposals. After smart meters, the Forum is going to focus its activities on the adoption rates of innovative smart technologies and future demand/supply scenarios, and on the adequacy of regulations to encourage their uptake.
In light of the energy system transformation, IEA member governments, notably in the European Union, have expanded the consumers’ protection work of their regulatory authorities by creating separate consumer boards or consumer functions at the regulator. In Australia, which has a similar governance and regulatory framework, the Council of Australian Governments established a separate, independent consumer advocacy body – Energy Consumers Australia – to provide input and advice on national energy market matters of strategic importance for energy consumers, with the aim of promoting the long-term interests of energy-users with respect to the price, quality, safety, reliability and security of supply of energy services.1 At European Union level, the European Commission launched the Citizens Energy Forum in London in 2007 to discuss and create competitive, energy-efficient and fair retail markets for consumers. The Forum covers the full range of strategic policy issues such as vulnerable consumers, price transparency, and consumers as energy market agents.
Electricity networks
Transmission
The national grid extends from Kaitaia in the North Island to Tiwai in the South Island (Figures 5.13 and 5.14) and comprises two alternating current island power systems connected by a 1 200 MW high-voltage direct current (HVDC) link. It links over 50 power stations to distribution areas and major industrial users. The transmission system is owned and operated by Transpower, which is a state-owned enterprise that is run on a (regulated monopoly) commercial basis. Transpower is responsible for all 1. Further information can be obtained from the Energy Consumers Australia website at: www.energyconsumersaustralia.com.au.
© O
ECD
/IEA,
201
7

5. ELECTRICITY
84
aspects of the transmission system management, including network planning and construction, maintenance and system operation.
New Zealand has an isolated electricity system and, unlike many other countries, cannot import or export electricity; most HVDC transfers are from South to North except during periods of low water storage levels, as illustrated in Figure 5.12.
Figure 5.12 Monthly HVDC transfers between North Island and South Island
- 300
- 200
- 100
0
100
200
300
400
500
600
Jan-10
Apr-1
0
Jul-10
Oct-1
0
Jan-11
Apr-1
1
Jul-11
Oct-1
1
Jan-12
Apr-1
2
Jul-12
Oct-1
2
Jan-13
Apr-1
3
Jul-13
Oct-1
3
Jan-14
Apr-1
4
Jul-14
Oct-1
4
Jan-15
Apr-1
5
Jul-15
Oct-1
5
Jan-16
Apr-1
6
GWh
Northward atHaywards
Southward atBenmore
Source: EA (2016b), EMI database (market statistics and tools), www.emi.ea.govt.nz/.
The transmission network is long, thin and radial, with the main source of hydro generation (and storage) located in the South Island a long way from the demand centres in the North Island. When South Island storages reach their seasonal low during the peak winter season, power flows switch with the North Island supplying the South Island. Consequently, large amounts of electricity need to be transmitted long distances between the two islands, resulting in average losses of between 3% and 7% of power transmitted. By international comparison, these losses are not very high considering the long and radial network and the low population density of New Zealand.
Distribution
New Zealand has 29 electricity distributors or so-called lines companies (see Figure 5.14). By international comparison, New Zealand has a large number of companies relative to its size (Australia has 16 and the United Kingdom 13), and the vast majority of them are very small in size (21 of the 29 have fewer than 50 000 connections).
Over the past decades, there has been growing consolidation, with the number of distributors going down from 61 local electricity authorities in 1990s to 29 distributors who sell their services to retailers who manage the electricity supply agreements with end-consumers. The 29 distributors exclude some very small distributors that are too small to be included in the Commerce Commission’s economic regulation (for instance, Stewart Island/Rakiura, and the Chatham Islands).
© O
ECD
/IEA,
201
7

5. ELECTRICITY
85
PAR
T I.
ENER
GY
SEC
UR
ITY
Figure 5.13 Map of New Zealand’s electricity transmission network
© O
ECD
/IEA,
201
7

5. ELECTRICITY
86
Figure 5.14 Map of New Zealand’s electricity distribution companies
© O
ECD
/IEA,
201
7

5. ELECTRICITY
87
PAR
T I.
ENER
GY
SEC
UR
ITY
Regulatory framework
Transmission
Since April 2011, Transpower has been regulated by the Commerce Commission under Part 4 of the Commerce Act 1986 using an individual price-quality path regulatory framework. The CC approves Transpower’s revenue in forward 5-year Regulatory Control Periods for each pricing year, with the paths being reset every five years. Within those periods, Transpower is required to deliver certain quality of service levels (Electricity Authority also sets minimum quality standards in the Code) with some revenue at risk should they not be met. Under this regulation, Transpower can recover the full economic costs (its regulated revenue requirement as assessed by the CC) associated with providing electricity transmission services, including capital, maintenance, operating and overhead costs in accordance with its Transmission Pricing Methodology (TPM). The individual price-quality path was reset for the 2015-20 regulatory period on 1 April 2015.
The TPM is included in the Electricity Industry Participation Code (the Code). Total annual transmission charges are around NZD 1 billion, including NZD 159 million per year for the HVDC lines and NZD 630 million per year for the interconnection assets. The Rio Tinto aluminium smelter alone currently pays around NZD 63 million. Over the past decade, transmission charges have increased. To date, TPM recovers the following costs:
Connection assets: the costs associated with connection assets are recovered from both off-take and injection customers on the basis of their maximum demand and any time maximum injection, respectively. The boundary between connection and interconnection is defined in the TPM. The definition is geographically based and can be described as a deep definition of connection, as it covers all the costs associated with the provision of transmission backbone services and the connection to the transmission backbone.
Interconnection assets: the costs associated with interconnection assets (transmission backbone, thus all assets not defined as connection or HVDC) are recovered solely from offtake customers, with the allocation based on their contribution to the average regional coincident peak demand in four separate pricing regions or periods.
HVDC assets: the costs associated with HVDC assets are recovered from South Island injection customers on the basis of their historic any time maximum injection (HAMI). The charge payable by a given generator is a function of both the postage-stamped DC rate (DCR) of NZD/kW, and its 12-peak injections over a historical period.
Significant changes to the TPM are being discussed which may substantially change the allocation of transmission costs between electricity stakeholders and are not without controversy. The EA has been consulting on the methodology for years and is currently developing a new proposal which is expected to be revealed by end of 2016.
The EA suggests moving towards a cost-reflective service-based pricing model, abolishing peak pricing and determining charges along the beneficiary-pays-principle (area of benefit) with three components:
© O
ECD
/IEA,
201
7

5. ELECTRICITY
88
Connection charge (access charge): existing connection charge plus possible inclusion of additional components.
Area-of-benefit charge (access charge): applied to both load and generation in proportion to their share of benefits (unless not practicable for some customers).
Residual charge (broad-base low-rate charge): applied to end users only.
The EA’s Electricity Industry Participation Code 2010 requires electricity distributors to pay distributed generators for reductions in transmission and distribution costs that arise from connecting to their network. In recent years, a majority of distributors calculate their avoided cost of transmission (ACOT) payments according to the transmission charges they avoid (as a result of the operation of distributed generation on their network) rather than on the basis of the economic costs avoided. De facto, many distributed generators do not reduce transmission costs, while consumers are paying for something in exchange of which they receive no benefit. This may have distorted the true value that distributed generation has on the system and may have resulted in uneconomic distributed generation being installed. The EA is investigating whether this is the case and may revise the ACOT payment system depending upon its findings. It is expected that revised ACOT payments will be phased in once the new TPM takes effect. Current distribution connection service charges mean distributed generation does not contribute to common costs. Distributed generation pays a maximum of incremental cost of distribution services and consumers pay their own share of common costs plus the distributed generation owners’ share. This anomaly can create a “death spiral” (see Chapter 7 Special Focus 2 on electricity distribution development).
Distribution The 29 electricity distribution businesses (EDBs) have a varied ownership and operate in geographically defined local areas, not by territorial franchise (see Figure 5.14). Only two companies are fully privately owned (Wellington Electricity and Powerco), the majority are consumer owned (trusts) or owned by the local authorities/municipalities and funds (see Table 7.1 in the Special Focus 2 chapter). Out of 29 distribution companies, 17 are regulated with price and quality limits under Part 4 of the Commerce Act 1986; 16 of these are under default price-quality regulation; and 1 is under a customised price-quality path. Twelve EDBs are exempt from regulation under the provisions for consumer-owned businesses of the Commerce Act and 8 companies are also exempt from public audit by the Office of the Auditor General.
The default-customised price-quality regulation, which was set in 2010 and implemented in 2012, follows a building-block approach with price-quality paths. There is also an option to adopt the customised price-quality paths. To date, only Orion has chosen a customised price path, reflecting the unique issues arising in the wake of the Christchurch earthquakes. Orion will return to a default path after 2018. In addition, all EDBs have to comply with information disclosure requirements and publish information on their financial performance, pricing and how prices are set, composition of the network, quality and reliability outcomes, asset management and planned investment. The Commerce Commission publishes summaries and analyses of this information. The regulation of the exempted companies is less stringent with regard to the cost they incur and charge to final users. The Controller and Auditor-General evaluate exempt distributors’ investment performance on an ad hoc basis. Mergers can be achieved under existing legislation as they entail no lessening of competition (if they involve two geographically separated businesses). The CC has both an enforcement and adjudication role in relation to mergers and acquisitions under the Commerce Act.
© O
ECD
/IEA,
201
7

5. ELECTRICITY
89
PAR
T I.
ENER
GY
SEC
UR
ITY Security of electricity supply overview
IEA in-depth reviews focus on the adequacy dimension of electricity security. Adequacy in this context refers to a power system’s capability to meet changes in aggregate power requirements in the present and over time, through timely and flexible investment, operational and end-use responses.
New Zealand is an isolated and relatively small power system which is dominated by hydro generation, and is energy-constrained during droughts. Hydropower is largely located in the South Island and transported along the thin transmission grid through the high-voltage direct current (HVDC)-link to the North Island, where most demand comes from. New Zealand’s hydro resources have limited storage and cannot ensure multi-seasonal water management with an average of around six to ten weeks of storage.
Security of electricity supply has been one of the key drivers of the electricity market reforms in New Zealand. In particular, the dominance of hydro generation with limited storage reduces the system’s capacity to face periods of low rainfall, while the inability to import electricity means that the system needs to have sufficient demand flexibility and resource adequacy available to deploy at short notice and to manage any contingency caused by energy constraints. The challenge is magnified by the relatively small size of the system and the radial nature of the network, increasing the exposure to potential critical infrastructure constraints or failures among key components of the generation fleet and transmission network such as the HVDC cables linking the North and South Islands power systems. As a result, adequacy needs to be maintained on a sub-national basis with due consideration given to the resilience and responsiveness of the power system to demand- or supply-related adequacy challenges which may emerge at regional and local levels.
The small, isolated and energy-constrained nature of New Zealand’s power system raises challenges with regard to incentives for sufficient, timely investment in incremental generating capacity that may be needed to maintain adequacy over time. This includes the uncertainty associated with incremental generation and network investment in an environment where plenty of excess capacity exists under normal rainfall conditions. Investment risks could be magnified in an environment where demand growth is moderate, as has been the case in New Zealand since the global financial crisis. Uncertainty over the ongoing need for major consumers like the Rio Tinto smelter on the South Island only adds to the weak signals for incremental investors in the medium term.
These circumstances create a complex challenge for policy makers as they seek to determine how best to complement and reinforce incentives for efficient, timely and cost-effective market-based responses to address adequacy requirements and to ensure continuity of supply now and into the future.
Reliability of electricity supply
To measure the security of electricity supply, the levels of unserved energy, the number and length of interruptions are critical. Since 2006, reliability shows great year-on-year variations with more significant outages, mainly transmission outages, caused by events such as storms, snow, forest fires, human errors, and earthquakes, resulting in unserved energy of up to 350 gigawatts per hour (GWh) in 2005/06. Grid emergencies and
© O
ECD
/IEA,
201
7

5. ELECTRICITY
90
outages at the transmission level tend to have a greater impact on levels of unserved energy than at the distribution level, reflecting the volume of electricity transported and the relatively “thin” and radial nature of the transmission system.
Figure 5.15 Unserved energy due to transmission outages, 1991 to 2013
0
50
100
150
200
250
300
350
400
GWh
Significantevents
Underlyingevents
Source: EA (2014a), Electricity Market Performance.
Over the past decade, distribution outages across New Zealand have fluctuated around a mean of 90 minutes, according to the System Average Interruption Duration Index (SAIDI) under a normalised national average. Another indicator for reliability is the System Average Interruption Frequency Index (SAIFI) which indicates how many interruptions have occurred.
National wide values are within the range of international comparisons. However, national averages hide large differences in the performance of the different distribution companies. Depending on the topography, topology and consumer base of the distributors, the average duration of interruptions (SAIDI) varied between 41 and 722 minutes per connection per year; and the average number of interruptions (SAIFI) varied between 0.7 and 5.6 interruptions per connection per year.
Figure 5.16 Quality of supply of distribution networks (non-normalised SAIFI, 2011-15)
0 1 2 3 4 5 6
Welling
ton E
lectricit
y
Electr
icity
Inverc
argill
Nelso
n Ele
ctricity
Orion
NZ
Netw
ork W
aitak
i
Scanp
ower
WEL
Netw
orks
Vecto
r Line
s
Auror
a En
ergy
Netw
ork Tasm
an
Alpine
Energy
Electr
a
Marlb
orou
gh Line
s
Waip
a Ne
twork
Uniso
n Ne
twork
s
MainP
ower
NZ
Buller E
lectricit
y
Electr
icity
Ashb
urton
Horiz
on E
nergy
Powe
rco
Coun
ties P
ower
North
powe
r
West
powe
r
OtagoN
et
The Po
wer C
ompa
ny
Centr
alines
Eastlan
d Ne
twork
The Lin
es Co
mpan
y
Top
Energ
y
Numb
er of
interr
uptio
ns
Default price-quality path Information disclosure only Customised price-quality path
Source: Commerce Commission (2016), Profitability of Electricity Distributors Following First Adjustments to Revenue Limits, Wellington.
© O
ECD
/IEA,
201
7

5. ELECTRICITY
91
PAR
T I.
ENER
GY
SEC
UR
ITY
Figure 5.17 Quality of supply of distribution networks (non-normalised SAIDI, 2011-15)
0
200
400
600
800
Electr
icity
Inverc
argill
Nelso
n Ele
ctricity
Netw
ork W
aitak
i
Welling
ton E
lectricit
y
WEL
Netw
orks
Scanp
ower
Electr
a
Auror
a En
ergy
Coun
ties P
ower
Uniso
n Ne
twork
s
Netw
ork Tasm
an
Waip
a Ne
twork
Centr
alines
Horiz
on E
nergy
Orion
NZ
North
powe
r
Vecto
r Line
s
The Po
wer C
ompa
ny
Marlb
orou
gh Line
s
Powe
rco
West
powe
r
The Lin
es Co
mpan
y
Alpine
Energy
Eastlan
d Ne
twork
OtagoN
et
Electr
icity
Ashb
urton
MainP
ower
NZ
Top
Energ
y
Buller E
lectricit
y
Minu
tes
Default price-quality path Information disclosure only Customised price-quality path
Source: Commerce Commission (2016), Profitability of Electricity Distributors Following First Adjustments to Revenue Limits.
Generation diversity
New Zealand has an abundance of available renewable resources (hydro, wind and geothermal have high availability, for instance high-quality wind capacity factors up to 45%) with favourable economics relative to thermal options. The South Island is supplied nearly 100% by hydro and the HVDC link can be critical to support adequacy of the North Island, importantly during dry years, or the other way round, depending on the dry year situation.
Figure 5.18 Installed versus available capacity in New Zealand
0
1 000
2 000
3 000
4 000
5 000
6 000
Installed Available Installed Available
North Island South Island
MW
Geothermal
Wind
Hydro
Thermal
Source: IEA calculations based on Transpower New Zealand (2016), Security of Supply Annual Assessment.
Available capacity is comfortable in comparison to installed capacity in the South Island, slightly less so in the North Island. New Zealand is self-sufficient in natural gas use for thermal power stations, and has sufficient reserves for operating all of the existing thermal stations. However, access to sufficient coal and gas reserves may not be certain in the future, as coal can be imported but not natural gas. In the absence of a large new gas-field discovery, the available volume of forecast gas reserves is insufficient to provide long-term contract certainty for new thermal plants (gas contracts are signed for three years), making major expansion of the thermal fleet a more risky investment. Coal production in the North Island is declining with many mines closing in response to the
© O
ECD
/IEA,
201
7
5. ELECTRICITY
92
international collapse in coal prices and reduced demand from the remaining coal power station at Huntly. Outside electricity production, coal mining in the South Island has increased in the dairy industry for milk powder production.
Generation resource adequacy
In 2015, New Zealand had a net capacity margin of around 18%, but this overall margin hides the fact that the situation differs across the two islands. The net capacity margin is very tight in the North Island (1.6%) while the South Island has comfortable levels (52%).
Comparing net capacity margins under different stress tests, as illustrated in Figure 5.19, it becomes evident that any changes in the North Island’s thermal capacity will have an immediate impact and will then require higher capacity and power flows from the South Island, provided that the HVDC link is available. However, it is uncertain that the situation will remain stable with the growing increase of variable renewable energy or the further reduction of thermal power capacity.
Generation adequacy is sufficient for the coming years with the current and committed generation. Transpower’s 2016 Security of Supply Annual Assessment (Transpower, 2016), covering the years 2015 to 2025, confirms that New Zealand’s capacity margin will remain above its security standard with current and committed generation through to the winter 2018. However, in recent years, a number of thermal power stations have been permanently closed. In 2015, two gas-fired thermal stations closed (Southdown 140 MW and Otahuhu B 400 MW) and a third coal/gas fired thermal station (Huntly 500 MW) announced that closure will occur in 2018. Closure of these plants, particularly Otahuhu B, was brought about largely because of replacement by geothermal renewable generation. Huntly coal/gas-fired power station was originally a 1 000 megawatts (MW) station with four 250 MW units. Two of these units have already closed leaving the plant with only 500 MW capacity. The power station owner (Genesis Energy) announced its intention to fully close the plant in 2018 as it was not forecast to be sufficiently used to recover costs of maintenance. This announcement was made before the retirement of Otahuhu B. Recently, supply contracts signed between Genesis and the other gentailers have prompted Genesis to defer decommissioning of the Huntly plant by at least three years.
Transpower is investigating the longer-term impacts of lower thermal power backup capacity on the adequacy situation and system operation. In 2015, Transpower evaluated the impact of the Huntly closure. As of 2019, the system would fall below its three security standards if Huntly Rankine units were decommissioned already in 2018 and no additional investment would come forward (which has been the case for the recent years). In April 2016, Genesis Energy announced it would continue to operate the Huntly Rankine units until 2022. This should provide sufficient capacity and energy to respond to demand, and could possibly create emergency situations in dry years into the medium term, unless there is a rapid change to either supply or demand. After 2022 the share of coal used for grid-supplied electricity could disappear completely and gas should decrease further. However, coal use will not completely disappear as a significant volume is used in on-site generation and for steam production in milk-processing by firms such as Fonterra.
© O
ECD
/IEA,
201
7

5. ELECTRICITY
93
PAR
T I.
ENER
GY
SEC
UR
ITY
Another factor of uncertainty comes from potentially substantial changes to electricity demand by energy-intensive industry. As from 1 January 2017 the Rio Tinto smelter will have an option to terminate its contracts with Meridian Energy with one year’s notice. While there is no indication to date that the smelter intends exercising this option, continued low prices for aluminium in the world commodity markets add to the uncertainty over the smelter’s long-term future. Should the smelter leave New Zealand, it will free up around 500 MW of hydro generation for sale into the electricity market. The entry of such a volume of low-cost hydro energy into the market would be expected to put downward pressure on wholesale prices and suppress investment in new generation for many years. The risk of the sudden arrival of 500 MW of surplus capacity on the market at short notice is expected to greatly reduce generators’ appetite for large-scale investments.
Figure 5.19 Stress tests: Net capacity margins for the North Island (NI), South Island (SI) and New Zealand (NZ) in three scenarios (2015 base year)
-9.0% -9.0%1.6%
52.0%
18.4%
52.0%
11.2%
74.8%
18.8%
0
2 000
4 000
6 000
8 000
10 000
NI SI NZ NI SI NZ NI SI NZ
Base case Huntly coal power closed Huntly and aluminium smelter closed
MW Capacity*
Peak load**
* Capacity is defined as total available capacity in 2015 and the capacity margin is shown in percentage levels in the chart. ** Peak load is defined as the H100 value (average 100 peak hours in a year) for 2015. Source: IEA calculations based on data from Transpower New Zealand (2016), Security of Supply Annual Assessment.
Generation availability and flexibility
The government expects that electricity output will grow over the medium term to reach around 48 terawatt hours (TWh) by 2040. This is an annual growth rate of 1.1% and is in a scenario of moderate growth mainly met by renewables. A high-growth scenario has also been modelled with 1.3% growth per year, although it is noted that this is a lower growth rate than the 2% per year experienced up to 2004. The reason for relatively low electricity growth, even in a high-growth scenario, is that over 80% of growth is forecast in areas of lower energy intensity combined with significant savings resulting from continued energy efficiency improvements.
Substantial capacity additions – over 2 000 MW (mainly wind and geothermal) – are possible under the Resource Management Act and ready to be constructed when the supply/demand balance and economics are adequate.
There is likely to be significant investments in geothermal generation over the next 30 years. In all the supply scenarios modelled, geothermal generation’s share in total electricity generation increases from 14% in 2012 to between 21% and 29% in 2040. The
© O
ECD
/IEA,
201
7

94
5. ELECTRICITY
positive news is that geothermal growth is focused in the central North Island where the highest-quality and lowest-cost geothermal resource exists and where most of New Zealand’s demand is located.
Hydro generation continues to be important for New Zealand, but without major growth expected. While there remains a significant number of potential (both small- and large-scale) hydro generation developments that are technically feasible, very few of these are likely to be developed. This is due to a combination of the high capital cost of major hydro development, compared to other alternatives, and also because of changing resource management regulations and fresh-water policy that have significantly raised the compliance costs of major hydro developments in recent years. Although the majority of installed capacity is renewable energy, much of it is dispatchable (geothermal, most of hydro) and therefore readily available to support power system adequacy. However, because of the mismatch between availability and limited hydro storage, coal- and gas-fired thermal plants are needed for backup during dry years. Hydroelectricity output is subject to strong variations due to meteorological conditions affecting rainfall and limited storage. The hydro share changes significantly from one year to another. For instance, while hydro capacity was relatively unchanged total electricity generation ranged from 65% in 2004 to 52% in 2008 and 57% in 2014. This change from year to year reflects both inter-year variation in hydro inflows coupled with increased demand being met by geothermal and wind investment rather than hydro.
New Zealand has a small number of large-scale wind farms located at coastal wind areas and elevated terrains, providing one of the most consistent wind energy resource in the world; at some sites wind farms can operate at net capacity factors of 45% to 50%. There are many projects in the pipeline but the risk/reward profile of the market is currently discouraging investment. While New Zealand still has a number of excellent wind sites available with high potential load factors by international standards, the cost-effectiveness of wind investment is very sensitive to the international price of wind turbines and the value of the current exchange rate. From a security of supply perspective, wind generation is seasonal and reaches its peaks in October to January and April to July, and is correlated with hydro storage fluctuations (during periods of low hydro storage levels in May and August, there is also low wind availability). Investment in wind power will therefore add diversity, but not lead to greater resource adequacy of the generation portfolio. The coincident seasonal nature of wind production means that wind cannot necessarily balance hydropower seasonality. It requires new rules for forecasting, system operation and dispatch as well as backup as it exhibits a much lower availability than hydropower, which is further examined in Chapter 6 Special focus 1.
Solar energy is growing fast in New Zealand and has a strong seasonality which cannot cover winter peak demand, as it is correlated with wind rather than with hydropower. Unlike in many countries, where solar photovoltaic (PV) can have positive impacts on local grid stability and help to reduce the need for investment in incremental transmission and distribution network, in New Zealand this effect is limited because peak supply and demand occur in opposite seasons. Sunlight levels are much lower than, for instance, in Australia. Demand on most distribution feeders peaks at night when there is no solar PV production. Solar PV can result in reverse power flows and voltage rise which may increase rather than reduce the need for incremental network investment.
Geothermal is a new baseload which can support well the seasonality of generation. However, geothermal is not very flexible. Variability in hydro generation has to be met by flexible gas-fired plants and to a smaller extent by coal. The recent closure of thermal power stations (gas and coal) will reduce this flexibility.
© O
ECD
/IEA,
201
7

5. ELECTRICITY
95
PAR
T I.
ENER
GY
SEC
UR
ITY
Figure 5.20 Availability of electricity supplies from different renewable energy sources during the year
0
0.2
0.4
0.6
0.8
1
1.2
1.4
January February March April May June July August September October November December
Wind
Solar
Hydro (historical)
Geothermal
Demand
Sources: IEA based on data by MBIE and Transpower, 2016.
Security of supply legal framework
The Electricity Industry Act (2010) established Transpower as the system operator, with the obligation to provide information and short- to medium-term forecasts on all aspects of security of supply; manage supply emergencies and maintain Security of Supply Forecasting and Information Policy (SOSFIP), Emergency Management Policy (EMP) and a System Operator Rolling Outage Plan (SOROP).
The Electricity Industry Participation Code requires Transpower to provide a System Security Forecast (SSF) to the Electricity Authority (EA) every two years that identifies risks to its ability to meet the principal performance obligations over the ensuing period of not less than 36 months, and to indicate how those risks can be managed. The SSF takes into account the capabilities of the grid and connected assets based on information known to the system operator who is able to disclose it, Under Part 7 of the Code, Transpower also carries out a Security of Supply Annual Assessment which contains detailed supply, demand and security of supply forecasts for the next ten years. Part 7 of the Code defines three reliability standards expressed as winter capacity and winter energy margins, because New Zealand’s power system is peaking in winters.
A winter energy margin (WEM) of 14% to 16% for New Zealand and 25.5% to 30% for the South Island.
A winter capacity margin (WCM) of 630 to 780 MW for the North Island.
As part of the security of supply and emergency policy, Transpower is required to monitor hydro storage and publish assessments of short-term security by comparing hydro storage against hydro risk curves. By using a range of likely inflows and taking into account any transmission constraints and current storage against the probability of shortage based on historical inflow sequences since 1932, these assessments reflect the risk of future electricity shortages. A minimum hydro storage zone is defined (Emergency Zone at 10% risk, see Figure 5.21) which, if storage reaches this level, triggers a number of emergency responses, including an Official Conservation Campaign and, if storage continues to decline, rolling outages.
© O
ECD
/IEA,
201
7

5. ELECTRICITY
96
Figure 5.21 Controlled hydro storage and risk curves, 2010-18
0
0.5
1
1.5
2
2.5
3
3.5
4
4.5
2010 2011 2012 2013 2014 2015 2016 2017 2018
TWh
Nominal full
Controlled storage
Mean (last 20 yrs)
10% risk
1% risk
Source: EA (2016), EMI database (market statistics and tools), www.emi.ea.govt.nz/.
New Zealand has no capacity market. But it had an energy reserve scheme until it was repealed in 2010. The scheme had enabled the Electricity Commission to contract for reserve generation and demand responses, and to recover the costs through a levy on all consumers. During its use, the only reserve generator contracted was the 155 MW diesel-powered Whirinaki station, which was commissioned in 2004 and owned by the government. Operated by Contact Energy, its operating costs were largely covered by spot revenue, but its fixed costs were recovered by an industry levy. The design of the strategic reserve was not suitable to New Zealand’s special circumstances and not in line with market-based mechanisms.
New Zealand’s reliance on hydro, combined with low storage capacity (six to ten weeks at peak demand usage levels), requires careful management of yearly and seasonal variations. Unlike Norway, New Zealand is not able to manage water storage across several seasons and deal with intra-seasonal variations through regional trade. Dry years happen every five to ten years and may result in supply crises spanning several months. Generation output in the North Island is significantly less than its demand and the balance is largely met by South Island hydro supplied via a HVDC link. In May 2008, storage levels passed into the 1% risk on the hydro risk curve. Meridian Energy and Genesis Energy engaged in a bidding war which drove prices up to levels beyond their scarcity value. Efficient price formation was further hampered by Meridian’s efforts to limit hydro production. Security of supply was finally ensured by the unseasonal rainfall that replenished water reserves just in time to avert regulatory intervention. This experience raised questions about the effectiveness of the security of supply arrangements. In response, the government put in place a series of measures. The 2010 Electricity Market Review examined options to avoid opportunistic bidding behaviour and to ensure that hydro generators have stronger incentives to more effectively manage water levels during periods of drought. The virtual asset swaps and the reallocation of Tekapo A&B were carried out. Figure 5.22 illustrates that in 2012, the South Island storage levels were less exhausted than during the 2008 drought and therefore year 2012 is not considered a supply crisis. In fact the emergency thresholds were not reached. In 2015 the storage levels came close to 2012 levels again.
© O
ECD
/IEA,
201
7

5. ELECTRICITY
97
PAR
T I.
ENER
GY
SEC
UR
ITY Figure 5.22 South Island controlled storage, 2012 versus 2008
0
500
1 000
1 500
2 000
2 500
3 000
3 500
Jan Feb Mar Apr May Jun Jul Aug Sep Oct Nov Dec
GWh
90th PC
Nominal full
Total storage 2008
Total storage 2012
Mean storage all years
Source: EA (2014b), 2014 Winter Grid Emergencies.
New market-based security of supply rules
Following the recommendations of the 2010 Ministerial Review, a number of measures to improve security of supply were adopted in legislation as directives for the Electricity Authority (EA) to be achieved within a three-year time frame, including:
rules clarifying the responsibilities in managing security of supply
rules on how and when public conservation campaigns will be triggered during a hydroshortage
rules requiring retailers to compensate consumers during a conservation campaignwith a payment of NDZ 10.50 per week to each consumer in the event an officialcampaign to conserve energy is activated
a requirement for a minimum floor on spot prices during some supply emergencies
a “stress testing” regime which requires certain participants in the wholesale electricitymarket to apply a set of standard stress tests to their market position, and report theresults to their board and to an independent registrar appointed by the regulator
security and Reliability Council to act as an independent advisory body on securityissues
financial transmission rights (transmission hedges) have been established acrossmajor nodes to facilitate the management of transmission congestion risks for marketparticipants
the inter-island HVDC link has been upgraded to 1 200 MW and a significant upgradeacross the majority of the high-voltage alternating current backbone has improvedreliability and system security.
The customer compensation scheme was introduced to help manage security of supply, during dry years as an incentive for market participants to take greater responsibility for managing the risks associated with business continuity in a drought-prone power system. It is imposed on all retailers, large or small. The default NZD 10.50 payment was designed to be cost-neutral for retailers on average; it represents the value to retailers of their qualifying customers’ saving effort, of avoided purchases at high spot market prices,
© O
ECD
/IEA,
201
7

5. ELECTRICITY
98
and the coupled price-depressing effect of reduced demand. The administration notes that a purpose for this scheme was to reduce lobbying by retailers who chose not to hedge but call for a public conservation campaign. However, such regulatory intervention could undermine the development of cost-effective demand response and energy efficiency, flexibility and the way markets manage scarcity events.
Reflecting on the past experience in dry years, security of supply cannot be taken for granted in an isolated, small and energy-constrained power system. Security of supply is a public good and markets can be expected to undersupply, reflecting the free-rider problem. The challenge is to intervene in a manner that complements efficient market responses and the monitoring of market functioning and emergency margins need to be ensured and surveyed over time. Following the 2001, 2003 and 2008 droughts, the government adopted major reforms of the rules governing the electricity market.
The initial response in 2003 was the government’s decision to invest in a diesel-powered station and develop a “reserve energy scheme” and to fundamentally change the market governance arrangements by creating the Electricity Commission to supervise, among other things, security of supply (previously the responsibility of the industry owned and managed. The 2010 response included interventions to asset ownership and a penalty payment in an attempt to reinforce incentives for market responses (and to reduce incentives for pressuring the government to intervene). It also included abolishing the reserve energy scheme because it was deemed to exacerbate the free-rider and related incentive problems. Other IEA jurisdictions have a strategic reserve, for instance Sweden, which also includes demand-side response and is determined through competitive auctions (see Box 5.2).
Box 5.2 The Swedish power reserve The power reserve includes the following capacities for the time horizon to 2020: 2011-13: 1 750 MW with a 25% demand reduction 2013-15: 1 500 MW with a 50% demand reduction 2015-17: 1 000 MW with a 75% demand reduction 2017-19: 750 MW with a 100% demand reduction. Svenska Kraftnät, the Swedish transmission system operator, can procure up to 2 000 MW via auctions for the winter periods between 16 November to 15 March on the basis of commercial bids on the Nord Pool Elspot, the day-ahead market. Owners of reduction bids are required to offer their bids to the market. If not traded, they have to place the bids on the intraday market. The reserve price can range between the highest commercial bid plus EUR 0.10 per MWh (the smallest price step on Nord Pool) and the minimum of the average variable cost plus start-up cost. The price is communicated to the market through Urgent Market Messages (UMM) on Nord Pool. Svenska Kraftnät recently changed the management of the demand reduction of the power reserve as a result of the new legislation. The procurement of consumption reductions will only cover bidding on the balancing market and the management of the consumption reduction resources shall also permit plant owners to make their own bids for the resource to the Elspot market. If the resource is not activated on the spot market, it will remain at the disposal of the balancing power market. As resources are made available as bids on the spot market, they participate in the price formation.
Source: IEA (2013), Energy Policies of IEA Countries - Sweden.
© O
ECD
/IEA,
201
7

5. ELECTRICITY
99
PAR
T I.
ENER
GY
SEC
UR
ITY
Network adequacy
Transmission
The backbone of the national grid was built in the 1950s and 1960s. For several reasons there was low investment in the grid between 1995 and 2005 (below NZD 100 million per year). During the 1990s, Transpower followed the so-called glide path strategy and minimised grid investment; it also expected the fast growth of distributed energy which would reduce required transmission networks. However, in the early 2000s, several blackouts highlighted the need for a major upgrade of transmission capacity. Transpower undertook a major grid upgrade programme to cater for predicted growth over the next 40 years, the connection of a diverse range of new sources of generation and the replacement of ageing grid components.
Figure 5.23 shows historic and planned transmission investment from 1995/96 to 2019/20. Between 2009 and 2014, over NZD 3 billion was invested by Transpower. A major upgrade in the order of NZD 0.2 billion for the integration of more renewable energies was postponed in 2013. Major projects carried out to upgrade the national grid included:
North Island Grid Upgrade Project (NIGUP). Transpower built a new transmission line between Whakamaru and Auckland. This is one of the largest transmission projects to be undertaken in New Zealand since the 1960s.
North Auckland and Northland Grid Upgrade (NAaN) project. Transpower reinforced the transmission network through Auckland and into North Auckland with new underground cables. This also created a transmission ring through Auckland, significantly enhancing reliability.
HVDC Inter-Island Link project. Transpower installed new alternating current/direct current converter equipment at Benmore (South Island) and Haywards (North Island) substations to increase the capacity of the HVDC inter-island link to 1 200 MW.
Wairakei to Whakamaru Replacement Transmission Line project. Transpower built a new double-circuit transmission line between Wairakei and Whakamaru to help connect more renewable generation being built in the area.
Major enhancements to the grid are now complete. Transpower is focused on improving its asset management practices to ensure that the replacement of ageing assets is undertaken efficiently. Future renewable energy growth will need to be supported by resilient transmission networks and possibly even higher HVDC capacity as well as different transmission pricing regimes.
At a first glance, higher transmission investment would be a win-win situation to better integrate increasing shares of wind and geothermal energy across the North and South Islands. However, in reality, North Island adequacy is supported by thermal backup or, lately, co-located geothermal, and some North Island wind energy. There may be a business case for wind to match the hydro storage fluctuations in the South Island during dry years. Newly expanded transmission capacity is sufficient to support wind power flows (in the absence of hydro flows) to the North Island. At the same time, higher HVDC capacity and flexibility facilitate better sharing of flexible, dispatchable generating resources, reducing the need for additional thermal backup plants in each of the islands.
© O
ECD
/IEA,
201
7

5. ELECTRICITY
100
Figure 5.23 Planned and historic transmission grid investment, 1995/96 to 2019/20
0 100 200 300 400 500 600 700 800 900
1 000US
D mi
llion
* Planned investments. Source: Commerce Commission (2016), Profitability of Electricity Distributors Following First Adjustments to Revenue Limits.
Given the network topography and the power system characteristics, New Zealand’s transmission system has to cope with situations of congestion and price spikes. Despite congestion prices being capped, during winter months this physical congestion can lead to grid emergencies. The evaluations of grid emergencies in May and August 2014 by Transpower and the Electricity Authority (EA, 2014b) showed that there are several structural changes in the New Zealand electricity market which have impacted transmission system operation in recent years. The current transmission charging does not support grid security, as it does not encourage generators and industrial demand to respond adequately to peak events and periods of congestion. Inaccurate forecasts of spot prices result in little incentive for participants to react in a timely manner to help alleviate grid congestion.
Among the structural changes are i) the substantial increase in transmission charges over recent years, ii) the increase in HVDC capacity, iii) good average hydrological conditions bringing energy prices down, so reducing the economics of gas-fired power plants in North Island, iv) increasing baseload from geothermal generation in the North Island, and v) the retirement of large North Island thermal plants, and national peak demand in decline since 2007. In addition, a large South Island hydro plant was on prolonged maintenance over the winter of 2014.
Distribution
New Zealand’s distribution assets are valued at around NZD 10 billion. After a period of increased investment during 2005-09, capital expenditure declined in the subsequent period up to 2012. Relative to historic levels, during 2011-15, distribution network investment increased (CC, 2016). In this period, 16 regulated distributors have invested around NZD 1.5 billion – 18% more than the historic average. The increases in capital expenditure were equivalent to around NZD 97 million per year of additional investment over the three years (2015 prices). Five out of 16 distributors have invested between up to 20% more than historic averages, and for eight distributors, investment increased by more than 20%. Sixteen distributors are under default price-quality regulation, and one is under a customised price-quality path. Under the former regulation, distribution companies received a range in nominal returns of between 5.33% and 8.37% per year over the regulatory period (1 April 2012 to 31 March 2015).
© O
ECD
/IEA,
201
7

5. ELECTRICITY
101
PAR
T I.
ENER
GY
SEC
UR
ITY
When comparing SAIDI/SAIFI data to distributor’s investment, no particular correlation between high investment and high reliability is visible, with some exceptions. In line with the Commerce Act, in 2015, the CC introduced an energy efficiency and demand-side management scheme for distributors, which compensates distributors for foregone revenues. The cap would otherwise have reduced distributors’ revenues and penalised them for carrying out energy efficiency. Discussion has started as to whether the current regulatory model encourages investment in the emerging technologies, including innovative services, solar PV, battery storage and electric vehicles. In 2016, the CC is reviewing the price-quality path input methodologies to identify the risk of stranded assets, which parts of the services should be regulated and which not, and whether investment incentives are adequate to support the required investment in the future smart grids.
Figure 5.24 Change in average capital expenditure relative to historic average (%)
- 100- 50 0
50 100 150 200 250 300 350 400
%
Note: Percentage change in annual average between 2008-12 and 2013-15. Source: Commerce Commission (2016), Profitability of Electricity Distributors Following First Adjustments to Revenue Limits.
Distributors across IEA member countries are at the forefront of a major transformation in electricity system operation and use, which is occurring as a result of the combination of liberalisation, decarbonisation policies and the rapid development and deployment of innovative distributed generation and storage technologies. This transformation is raising a range of new challenges for maintaining power system security and reliability, with distributors increasingly being required to manage a much more complex operating environment with more dynamic and far less predictable real-time power flows. This requires investment in adequacy, innovative system operation and regulatory clarity. These issues are further discussed in Chapter 7 Special Focus 2 on electricity distribution development.
Assessment
New Zealand’s electricity system is unique. New Zealand was among the first IEA members to introduce unbundling and competition in its electricity market. The country has an effective energy-only market based on financial transmission rights and locational nodal pricing – it is a leading example of a well-functioning electricity market design among IEA member countries, and continues to work effectively, thanks to appropriately
© O
ECD
/IEA,
201
7
5. ELECTRICITY
102
targeted government intervention. Despite being an energy-constrained system, investment signals have been good and could encourage new geothermal generation, which has boomed in recent years. Specific structural issues remain, arising from its resource, island and legacy situation, notably the market dominance of the five major vertically integrated generators and retailers (gentailers), three of which remain majority state-owned enterprises. In recent years, the market has been able to deal with price spikes, however, security of electricity supply issues in an energy-constrained and energy-only market with a hydro-based power system need to be kept under review.
Market reforms
Since the last IEA in-depth review in 2010, New Zealand has been implementing the recommendations of the Ministerial Review of the Electricity Sector of 2010.
First, the government has sought to address issues around the market dominance of gentailers by promoting the development of more competitive wholesale and retail markets, addressing the IEA recommendations from the 2010 review. Greater retail market competition was expected from the partial sale of the three main state-owned gentailers and related virtual asset swaps between these corporations, including the sale of Tekapo A&B stations in the South Island (from Meridian Energy to Genesis Energy). Competition will also be facilitated through market improvements, including by actions to promote consumer switching and reduce market barriers.
Secondly, the governance of the regulatory framework for the electricity sector has been reformed. The Electricity Industry Act 2010 established the Electricity Authority as the regulator of the electricity industry and markets through reviews of the Electricity Industry Participation Code with a mandate to promote competition in the electricity sector, reliable supply, and its efficient operation for the long-term benefit of consumers.
Thirdly, the EA has promoted the development of the financial markets by supporting the creation of a range of new hedging products with the Australian Stock Exchange (ASX futures contracts), by introducing financial transmission rights (FTRs) on major nodes. EA currently consults on the introduction of a cap product which should provide a market-based insurance management against high spot prices.
Despite these reforms, it should be noted that in 2015, the big five gentailers accounted for 91% of New Zealand’s electricity generation and supplied 93% of consumers. By comparison, in 2005, they held 93% of the generation and 99% of retail business. This could raise concerns of competitive price formation and behaviour, and hinder the efficient and innovative development of electricity markets. Competitive pressure is coming from the entry of a large number of independent retailers or distributors who do not own generation. Their share in the retail segment grew from 1% in 2005 to 7% in 2015.
The government sees contestability as a major driver of efficiency and innovation, and supports competition from new entrants, including from distributors after the relaxing of unbundling rules, which put competitive pressure on larger retailers at the margin. While entry is possible for small companies, independent retailers have limited possibilities to expand their business. Ensuring a level playing field for new entrants and mitigating the ongoing dominance of the big five gentailers remains a key challenge for the government. While small independent retailers have emerged, offering a range of innovative products and services, they need to have better access to financial markets.
© O
ECD
/IEA,
201
7

5. ELECTRICITY
103
PAR
T I.
ENER
GY
SEC
UR
ITY
Financial markets are emerging in New Zealand; however, the overall liquidity and product range remain limited and cannot ensure the signals needed for backup capacity or demand response. Commendably, New Zealand put in place FTRs to improve market functioning and reduce the risks associated with North-South Islands transactions and strengthen competition (liquidity and depth) in wholesale markets and some demand response, but its scope still remains limited. Augmenting the liquidity and depth of the financial market, unlocking demand response at wholesale and retail levels and adopting real-time pricing in electricity markets will ensure that pricing signals and market efficiencies are continuously strengthened. Enhancing the efficiency of these emerging markets will also be the best guarantee for the security of electricity supply over time.
Wholesale markets
Policy makers and regulators will need to closely monitor the performance of the energy-only market and be prepared to make timely adjustments to ensure that it continues to deliver effective outcomes as markets evolve. Three main opportunities support further strengthening market-based solutions to ensure greater security of supply in dry years, to enhance competition and to ensure longer-term price signals for investors: i) strengthening liquidity and depth of the emerging financial markets, ii) strengthening rules to bring real-time pricing and dispatch closer, which could also support more effective integration of greater shares of variable renewable energy (notably wind power), as explained in Chapter 6 Special Focus 1 on the integration of renewables, and iii) fostering the development of innovative products and services at local and regional levels by creating opportunities for distributed generation, innovative services (storage, electric vehicles, among others) and demand response, including through aggregators, and by distributors operating as neutral facilitators of innovative retail services.
First, liquidity and depth of the financial (hedge) market could be enhanced by addressing market dominance to ensure that all retailers use this market. The financial market can effectively moderate incumbent gentailers’ behaviour and encourage them to look to more efficient means to manage their risk exposures rather than to physically hedge their positions. Around 90% of the financial market is locked up because of the dominant position of the gentailers in the market, a barrier to the development of more liquidity. Today, scarcity pricing applies whenever there is island-wide load shedding and the spot price is administered to a range of between NZD 10 000 and NZD 20 000/MWh. During normal times, setting an ex ante value of lost load (VoLL) price cap – at least for an interim period while the cap product develops sufficient liquidity and depth – would help to moderate the infinite price exposure risk, to increase the number of counterparties (beyond the gentailers) and keep prices at reasonable levels. The VoLL expresses the average willingness to pay to avoid an additional hour without power.
If the VoLL is set at a sensible level (i.e. well above the USD 1 000 MWh that originally applied in the US North-East markets), the missing money “problem” ceases to be an issue. A VoLL cap around the levels currently applied in the Australian NEM would be more than sufficient (around USD 16 800), as demonstrated by the exceptional investment outcomes achieved between 1999 and 2007. Experience in other jurisdictions with island operations such as Ireland (USD 17 800), Australia, Philippines (USD 3 000), Midwest ISO (USD 4 400) suggests that finding the adequate level of VoLL cap may depend on a number of factors, including its usage (linked to constraint violation penalties, capacity payments, regulated transmission investment, market price for energy, or others) and that the level needs to be carefully considered.
© O
ECD
/IEA,
201
7

5. ELECTRICITY
104
Moreover, the 2010 package of electricity reforms included a compensation scheme that requires retailers to compensate consumers in case of a conservation campaign by introducing a NZD 10.50 per week penalty to be paid to their consumers. This scheme could, in practice, work as a regulatory barrier for the entry of smaller retailers (who have much smaller margins than incumbents), and hinders demand-side response and hedging in financial markets. The IEA advises the government to review the charge.
Secondly, generators of wind energy in New Zealand are currently not able to bid into the market. They have a mandatory update from persistence forecast hours before gate closure. Reducing gate closure times would also allow dispatched generators to respond more efficiently to fluctuations in wind output and demand. Final spot prices used for settlement are published at least two days after the day on which trading occurs. Plans are under preparation to move to a closer to real-time gate closure. The Electricity Authority is currently consulting on new rules to introduce real-time pricing in the spot market. It has acknowledged this and has proposed to reduce gate closure times for all generators, including wind, to one hour and less. If gate closure times were reduced below one hour and as far as practicable, this would enable wind energy to play a larger role in the electricity market without jeopardising the security of supply outcome. Wind generators would need to be allowed to bid into the market, however.
Thirdly, an efficiently operated transmission system, that delivers the right price signals to ensure efficient outcomes, is a requirement for efficient market development and security of supply. The EA is undertaking a review of the transmission pricing methodology. Changes in the methodology could have significant influence on future generator investments and wealth transfers. Transmission charges have increased in recent years along with the frequency of grid emergencies, with many significant events since 2006. The continuous debate on the pricing methodology during recent years has created considerable uncertainty, and still does, among market participants. The government should swiftly adopt a transmission pricing system that reinforces commercial incentives for more efficient, innovative and timely responses to improve the flexible operation and development of the system.
Retail markets
New Zealand’s retail market is evolving, with significant potential for emerging technologies, including solar PV, battery storage and electric vehicles that bring security of supply benefits from greater end-use flexibility. Moreover, there is room for more efficiency, competition, innovative products/services and choice for consumers. New Zealand already has an excellent starting basis with the broad availability of smart meters, the emerging new pricing and product offers by retailers and distributors. High switching rates prove the dynamics in the market.
To date, however, consumers have not fully benefited from the emerging opportunities and technologies because of technical, regulatory, competition and information barriers. These include for instance the fact that distribution charges are not generally reflective of the time and volumes of electricity and capacity used. It takes 48 hours for consumers to receive their consumption data from the retailer. While this is an improvement, it is still far from real-time demand response. To date, the Code does not allow aggregators to participate to the wholesale market. Ensuring an equal footing between large retailers and smaller companies, but also access of new entrants and new players, including energy service companies, distributors and aggregators, remains a challenge that needs to be addressed. The use of different distribution connection agreements may be a
© O
ECD
/IEA,
201
7

5. ELECTRICITY
105
PAR
T I.
ENER
GY
SEC
UR
ITY
barrier for future market growth and the roll-out of innovative technologies. The EA’s work in this direction to provide for a legal framework under the Code is a welcome step.
New Zealand has potential for various types of aggregators (or innovative retailers); provided the market offers sufficient commercial incentive (and supporting information/infrastructure). Also, distributors could facilitate this development through purchasing distributed generation and demand-response services to support the development of local ancillary service markets. As “neutral facilitators” distribution companies could make a valuable contribution to accelerating the evolution of the market in this direction. These issues are the subject of Chapter 7 Special Focus 2 on electricity distribution developments. More focused recommendations are included in the chapter.
Developing innovative real-time products and services, including smart grids, to harness demand response and distributed generation requires real-time pricing and access to accurate and real-time consumption information. It also requires transparency of retail data as well as a standardised default distribution agreement and clarity around the role of distribution companies in emerging retail markets.
The EA has set out an ambitious work programme and has placed a strong focus on all these areas, including the review of distribution pricing methodologies towards making pricing more service-based and cost-reflective. It also includes work on a default distribution agreement, and retail data and consumer information. The EA expects distributors, and other stakeholders, to take account of the impacts on consumers as part of the implementation process, and supports an industry-led approach. However, there are potential negative impacts in relation to access to information, technologies and quality of supply, which may impact low-income and vulnerable consumers. The IEA considers that consumer empowerment should be a focal point for the government and the EA in the coming years. This includes evaluating the quality of supply and retail market outcomes and regulatory adjustments through the Code review (switching campaigns, definition of retailer of last resort, review of distributor’s performance, distribution pricing and retail market data transparency).
The EA also has the task to ensure that consumers can benefit from the Code changes in which they can participate through EA’s retail advisory group. The Smart Grid Forum involved a broad range of stakeholders, including academia and industry, with the focus on the development and deployment of smart grid and smart meter devices. Going forward, the government should strengthen consumer engagement with an independent forum and a dedicated consumer authority, building on the work of the Smart Grid Forum, and on the experience in other IEA member countries. Greater harmonisation of distribution agreements, standards for new technologies, transparency of retail consumption data and consumer information will help in building competitive retail markets and in empowering consumers.
Security of supply and adequacy
New Zealand relies on market-driven responses to ensure security of electricity supply. The 2010 Ministerial Review has provided for several initiatives to support this market-based approach, including the removal of the administrative regulatory “safety net” capacity reserve, and the introduction of rules clarifying and strengthening the role of the system operator Transpower in relation to monitoring and maintaining security of supply. New initiatives also include the creation of the Security and Reliability Council as an independent review body; rules for demand restraint programmes; stress tests for market generators, and the obligation for retailers to compensate consumers for loss of power
© O
ECD
/IEA,
201
7

5. ELECTRICITY
106
during official conservation campaigns. The compensation scheme requires all retailers (including those that do not have hydropower) to compensate consumers for loss of power in case of a conservation campaign being activated by introducing a NZD 10.50 per week penalty to be paid to the consumers affected. This scheme could in practice work as a regulatory barrier for smaller retailers and, therefore, the EA is invited to review the scope and structure of the charges.
Major investments in the transmission system, in particular the upgrade of the inter-island HVDC line to 1 200 MW, can be expected to greatly improve market resilience and flexibility. These electricity market reforms, undertaken in 2010, have made a positive contribution to increase security of supply and can be expected to improve market operation during scarcity events. Transpower’s adequacy forecast and monitoring of reliability margins under different grid situations has alerted the market of shortages ahead in 2018/19. In 2015, Transpower informed that it would not be able to maintain reliability margins if the Huntly coal plant were to close in 2018. The recent agreement, facilitated by Transpower’s assessment, between market participants to keep the Huntly plant operating until 2022 helps to address medium-term generation adequacy. However, it does not resolve the longer-term issue of whether the market will be able to deliver sufficient dispatchable flexibility and backup security to ensure supply in a situation of 90% (or more) renewable electricity.
Structural issues remain along with changes in the electricity mix, which may require a new safety net approach. Future challenges for maintaining power system security and reliability relate to the three key transformations. First, the uncertainty of the longer-term availability of the thermal power plants which face the end of their economic lifetime and when there are low incentives for new generation investment in the wholesale market. Secondly, there is uncertainty about the continuity of water supply and the mismatch between variable renewables (wind, solar) and peak demand. And thirdly, a major transformation in electricity system operation is required in light of a stronger growth of variable renewable energies; the rapid development and deployment of innovative distributed generation; and storage technologies, impacting distributors’ operations. In addition to flat demand, considerable uncertainty is also remains about the possible closure of the Rio Tinto aluminium smelter in the South Island.
Future capacity growth is coming from renewable energy and may provide a new entry in a still highly concentrated market thanks to a strong number of projects (250 MW of geothermal and 2 500 MW of wind) and good endowment. Renewables made up 80% of total electricity generation in 2015, the second-highest share among IEA members (after Norway) thanks to legacy hydro (56 %) and new geothermal capacity (18%). Located along the Pacific “Ring of Fire”, the country has world-class geothermal resources, close to major load centres, to which they provide baseload power. Generation costs are very competitive with other sources and the market is developing. Wind power also experienced robust growth at 19.9% per year, but deployment has slowed in recent years. Electricity generation from solar has grown fast, from a low basis, while biofuels and waste remained low but stable.
New Zealand’s power system brings about a unique set of challenges for maintaining security of supply. A purely market-based solution may not provide a timely or effective response in all circumstances, reflecting the public good characteristics of security of supply and the relatively small, isolated and energy-constrained nature of the power system. All recent supply crises, with hydro storage levels reaching emergency thresholds and resulting in price spikes on the spot market, triggered major government
© O
ECD
/IEA,
201
7

5. ELECTRICITY
107
PAR
T I.
ENER
GY
SEC
UR
ITY
reform programmes. In 2012, a security of supply crisis was narrowly averted by timely rainfall. Security of supply cannot be taken for granted and will need to be carefully monitored. The government may revisit the safety-net mechanism, taking inspiration from solutions adopted in other IEA countries, such as the Swedish strategic energy reserve, which is market-based and includes demand-side bids.
Recommendations
The government of New Zealand should:
Continue to foster well-functioning wholesale and retail electricity markets to ensure efficient and innovative outcomes, to deliver security of supply and to more effectively integrate growing shares of variable renewable energy by:
> Accelerating steps towards a liquid and deep financial market to support power system flexibility and efficient risk management for wholesale and retail market participants. Considering the introduction of an ex ante value-of-lost-load price cap in the spot market, until the financial market develops appropriate cost-effective products and services.
> Ensuring that transmission pricing provides sufficient incentive to encourage flexible operation and development of the system to meet reliability requirements, and to deliver efficient and timely market development, including efficient demand response and investment in capacity.
> Encouraging the development of power system flexibility through distributed generation, energy efficiency, smart grids, demand response, demand aggregation and other innovative services based on market signals, by moving towards real-time pricing in the spot and retail markets. In this context, review the scope and structure of the NZD 10.50 charge with regard to potential barriers for new entrants.
Ensure that market rules empower consumers’ choice and participation while addressing the needs of vulnerable households by:
> Ensuring efficient retail and distribution pricing, appropriate monitoring and evaluation of retail market outcomes and distribution companies’ performance, simple and timely switching processes, ready access to consumption data while protecting privacy, and effective retailer of last-resort provisions.
> Strengthening consumer participation and representation in market activities, either through the Electricity Authority or an independent new consumer body. Creating an inclusive stakeholder forum to discuss the development and implementation of rules for incorporating emerging new technologies in competitive and effective retail markets, building on the work of the Smart Grid Forum.
As a market-based safety net, considering a strategic reserve auction for dry years, as part of reliability monitoring and response of the system operator.
© O
ECD
/IEA,
201
7

5. ELECTRICITY
108
References CC (Commerce Commission) (2016), Profitability of Electricity Distributors Following First Adjustments to Revenue Limits, Commerce Commission New Zealand, Wellington.
EA (Electricity Authority) (2016a), 2016/17 Work Programme.
EA (2016b), EMI database, 2016, www.emi.ea.govt.nz/.
EA (2014a), Electricity Market Performance, 2014 Year in Review, Electricity Authority, Wellington, https://www.ea.govt.nz/monitoring/year-in-review/2014-review-of-electricity-market-performance/.
EA (2014b), 2014 Winter Grid Emergencies, Market Performance Enquiry, Electricity Authority, Wellington, https://www.ea.govt.nz/monitoring/enquiries-reviews-and-investigations/2014/grid-emergency-on-19-august/.
IEA (International Energy Agency) (2013), Energy Policies of IEA Countries - Sweden, OECD/IEA, Paris.
IEA (2011), Empowering Customer Choice in Competitive Electricity Markets, OECD/IEA, Paris.
IEA (International Energy Agency) (2016), Energy Prises and Taxes, OECD/IEA, Paris.www.iea.org/statistics/.
Transpower (2016), Security of Supply Annual Assessment, www.transpower.co.nz/sites/default/files/bulk-upload/documents/SoS%20Annual%20Assessment%202016.pdf.
© O
ECD
/IEA,
201
7

109
PAR
T I.
ENER
GY
SEC
UR
ITY
6. Special Focus 1: Renewable electricity towards 90%
Overview
In 2008, the New Zealand government introduced a target of 90% renewable electricity generation by 2025. It remains an energy policy objective of the national government which receives broad public support. The government expects that the target is likely to be met from the country’s very favourable renewable resources base given the attractive economics of renewables resources compared to thermal options. There is no direct government intervention or financial support to help achieve the 90% renewable electricity target for 2025. The government expects that the market should be able to deliver the needed renewable generation capacity without financial support as renewables can provide some of the least-cost options for new generation.
In this special focus chapter, the most likely scenario for reaching this target is considered, based on an assessment of the potential and cost of different renewable energy (RE) resources in New Zealand. In addition, the energy market and energy security implications of reaching the target are discussed with a particular emphasis on the role of wind and solar power. The following analysis draws on IEA analysis of renewable electricity integration in many other countries, gained in particular through the Grid Integration of Variable Renewables (GIVAR) programme.
Introduction
In 2015, renewable energy made up 80.2% of electricity generation, the second-highest share in all IEA member countries (after Norway, see Figure 6.1). Despite annual fluctuations of hydro availability (because of changes in rainfall patterns, the contribution of hydro has decreased in recent years), the proportion of renewable electricity has increased in the past ten years, up from 72.1% of total generation. The high levels of renewables are largely based on a legacy of hydro investment and development, and recent rapid growth in geothermal generation (where New Zealand leads other IEA countries with 15% of generation and 1 137 megawatts (MW) of capacity), which has displaced baseload natural-gas and coal plants. This has been accompanied by low levels of wind and biomass generation, and recently by a small increase in distributed solar photovoltaic (PV).
The additional renewable energy needed to meet the target will depend on growth rates of electricity demand between now and 2025 (currently taken to be some 1% per year for planning purposes), although this depends heavily on the further evolution of the industrial sector, in particular the New Zealand aluminium smelter (NZAS). Current renewable generation levels would need to increase by some 20%, from the current level of 36 terawatt hours (TWh) to around 43 TWh, to reach the target percentage taking into
© O
ECD
/IEA,
201
7

6. SPECIAL FOCUS 1: INTEGRATION OF 90% RENEWABLES
110
account anticipated growth in demand. The capacity needed to produce this extra renewables generation would depend on the technologies deployed but it could be provided for example by some 1.3 gigawatts (GW) of additional geothermal capacity or 1.8 GW wind (at typical current capacity factors).
Supply and demand
Renewable energy accounted for 8.3 million tonnes of oil-equivalent (Mtoe) or 40.6% of New Zealand’s total primary energy supply (TPES) in 2015. Geothermal is the main renewable source with 4.8 Mtoe or 23.4% of TPES in 2015, with hydro energy (2.1 Mtoe or 10.3%), biofuels and waste (1.2 Mtoe or 5.7%), wind (0.2 Mtoe or 1.0%) and marginal use of solar (0.05 Mtoe or 0.2%).
Renewable energy has gradually increased over the past decade, with the share in TPES up from 31.8% in 2005. This surge was mainly driven by robust growth in the use of geothermal, which grew at an annualised rate of 9.2% from 2005 to 2015. Its share in TPES increased from 11.7% to 23.4% over the same period. Hydro energy, one of the major energy sources of the country, increased by 5.1% from 2005 to 2015, but decreased in terms of share of TPES, from 11.8% in 2005 to 10.3% in 2015. Biofuels and waste energy was 10.1% lower in 2015 than in 2005 while wind energy increased by 283%, stepping up from a negligible level, although still at 1.0% of TPES in 2015.
Figure 6.1 Electricity generation from renewable sources as a percentage of all generation in New Zealand and in IEA member countries, 2015
0%
20%
40%
60%
80%
100%
Biofuels and waste Solar Geothermal Wind HydroNote: Data are estimated. Source: IEA (2016a), Energy Balances of OECD Countries, www.iea.org/statistics/.
Among IEA member countries, New Zealand has the third-highest contribution of renewable energy to TPES at 40.6%,1 behind Sweden (47.1%) and Norway (45.3%), owing to the high contribution of geothermal and hydro for electricity generation. New Zealand has the highest share of geothermal among IEA member countries (23%). Its share of hydro and wind energy is the fifth- and eleventh-highest respectively. The share of biofuels and waste ranked seventeenth-highest, and solar ranked eighteenth, slightly below a median level (see Figure 8.1).
1 2015 estimates.
© O
ECD
/IEA,
201
7

6. SPECIAL FOCUS 1: INTEGRATION OF 90% RENEWABLES
111
PAR
T I.
ENER
GY
SEC
UR
ITY
Renewables are widely used in power generation (84.4%), industries (12.7%), households (1.9%) and commercial sectors (0.9%), while demand in transport is still marginal at 0.1%.2
Electricity from renewable sources amounted to 35.5 terawatt hours (TWh) in 2015, or 80.2% of total generation. Renewables in electricity generation include hydro (24.5 TWh or 55.5%), geothermal (793 TWh or 17.8%), wind (2.4 TWh or 5.3%), biofuels and waste (0.6 TWh or 1.4%) and solar (0.1 TWh or 0.2%). Electricity from renewable sources has increased by 28.1% the past ten years, up from 37.7 TWh in 2005 or 64.4% of total generation. Hydropower in electricity increased by 5.1% while geothermal power boomed at 9.5% per year over the same period, increasing its share from 7.4%. Wind power also experienced robust growth at 14.4% per year over the same period, while electricity from solar and biofuels and waste remained rather stable. However, solar PV is increasing its role with additions of 1 MW per month, and some solar thermal is used for water heating in residential and commercial applications throughout New Zealand. It accounts for 0.3% of households and commercial demand.
Geothermal energy is mostly consumed for electricity generation (94.2%), most of which generated from the high-temperature fields. The potential of the lower-temperature resources for direct heat uses, or binary cycle electricity generation, is recognised but not yet developed fully. Another 4.2% of geothermal energy is consumed for industry such as paper and pulp production, while 1.6% is for the commercial, agriculture and forestry sector.
Table 6.1 Renewable electricity generating capacity, 1990-2014 (MW)
Technology 1990 2000 2005 2010 2011 2012 2013 2014
Hydro 4 619 5 193 5 346 5 253 5 253 5 253 5 262 5 263
Hydro-1 MW 0 3 7 9 9 9 9 9
Hydro 1-10 MW 0 112 89 98 98 98 107 107
Hydro 10+ MW 0 5 078 5 250 5 146 5 146 5 146 5 146 5 147
Geothermal 261 418 433 731 731 731 813 979
Wind 0 36 168 524 623 623 623 683
Solid biofuels 57 68 81 77 77 77 77 77
Biogases 19 17 33 38 38 41 41 44
Solar photovoltaic 0 0 0 0 0 4 7 19
Total capacity 4 956 5 732 6 061 6 623 6 722 6 729 6 823 7 065
Solar collectors surface (1 000 m2) 0 0 96 128 128 128 128 128
Capacity of solar collectors (MWth)* 0 0 67 90 90 90 90 90
* Converted at 0.7 kWth/m2 of solar collector area, as estimated by the IEA Solar Heating & Cooling Programme. Source: IEA (2016b), Renewables Information, www.iea.org/statistics/.
2 Latest available data for demand per sector are for 2014.
© O
ECD
/IEA,
201
7

6. SPECIAL FOCUS 1: INTEGRATION OF 90% RENEWABLES
112
Among IEA member countries, New Zealand has the second-highest share of renewables in electricity generation (Figure 6.1). Its share of geothermal in electricity generation is the highest among the IEA members, hydro and wind power are fifth- and fifteenth-highest, respectively, while solar, and biofuels and waste power are eighth-lowest.
Potential and prospects for increased renewable generation
New Zealand has sufficient renewable energy (RE) potential to achieve and even exceed the 90% target, and still has significant unexploited potential for each of the main renewable sources. However, under current market conditions, only geothermal has been growing its capacity significantly in the last few years, along with a recent acceleration in PV capacity from a low base.
Hydro
A number of new medium-scale hydro projects were under consideration in the 2009/10 IEA in-depth review and since then several received the necessary permits, but none of these projects has proceeded owing to the current supply situation, which undermined the economic case for development. There is little prospect of further significant hydro expansion, and some concerns are expressed about the compatibility of current use levels with new water management and water quality initiatives, which could constrain hydro generation to some extent.
Geothermal
Geothermal, which can provide a fixed output of electricity, is a baseload supply and has been growing steadily without financial support. The estimated potential for additional geothermal capacity is 1 000 MW, i.e. a potential doubling of the current contribution. There is a current wealth of projects of 250 MW under development, although some of those will be needed to replace older plants which are reaching the end of their lifetime. Because of its flat output, geothermal shows no particular correlation with demand or any of the other RE resources.
Wind
New Zealand has sites with some of the most favourable wind regimes in the world, with some having capacity factors of 45% to 50%. Wind generation is reliably available to some degree to meet peak demand; the capacity credit for new projects is estimated at 38% by the grid operator (Transpower, 2016). There are currently 19 wind farms with a combined capacity of 690 MW providing 5% of New Zealand’s electricity generation. This capacity was developed rapidly between 2003 and 2011 but little new capacity has been added since. Many projects are in the pipeline, with the required permits in place (2 500 MW) but the current balance between returns on investments and risks is not considered attractive enough by developers to merit investment. Wind shows the lowest seasonality among hydro, wind and solar resources. Its availability is somewhat lower during the high-demand season when hydro generation can be constrained, but it can still make a useful contribution during these periods.
© O
ECD
/IEA,
201
7

6. SPECIAL FOCUS 1: INTEGRATION OF 90% RENEWABLES
113
PAR
T I.
ENER
GY
SEC
UR
ITY
Biomass
Biomass-based power generation is currently constrained to using woody biomass residues for co-generation at a number of wood-processing factories and also from biogas produced from waste digestion at wastewater treatment plants, and at some landfill sites. Scope for additional cost-competitive biomass generation is limited.
Solar PV
Solar PV has been developing significantly in the New Zealand context: 15 MW of solar PV capacity was added during December 2014 to December 2015, which equals to a growth rate of around 1 MW/month, principally in residential applications. Investment is increasingly attractive given falling solar-PV costs and current retail electricity prices, with some consumers also seeking increased independence from incumbent producers. This trend is likely to accelerate as PV costs continue to fall and as affordable storage becomes available.
The continuing growth of this market is likely to be of significant scale within the domestic electricity market and can have an impact on the business models of retailers and distribution companies, and possibly on investment needs in the distribution system. There is not yet consensus in New Zealand about these impacts or on the need for a regulatory response to these developments; a more detailed consideration, taking into account the particular national circumstances, would be timely.
Solar power shows a pronounced seasonal variability: winter output is approximately 60% of annual average. Solar shows a high correlation with wind power on a seasonal level, and a negative correlation with demand. No data could be obtained for this analysis to investigate if solar power availability is systematically higher during periods of drought.
The impacts of greater shares of distributed generation and the regulation of the distribution systems are further studied in Chapter 7 Special Focus 2 on electricity distribution development.
Conclusions on prospects for growth and resulting priorities
Given the above considerations, meeting the 90% target for 2025 is likely to rely on:
maintaining hydro generation at close to current levels (with inevitable variation depending on rainfall levels) which may be sensitive to water management and water quality initiatives, with some incremental investment
further expansion in geothermal generation
smaller additions in generation from wind, provided that an appropriate market framework is in place
continuing growth of the residential solar PV market.
As the share of variable renewable energy increases, with solar PV and wind power additions, the wholesale electricity market design can be further enhanced by providing incentives for flexibility.
© O
ECD
/IEA,
201
7

6. SPECIAL FOCUS 1: INTEGRATION OF 90% RENEWABLES
114
To date, wind generation is treated in the wholesale market as any other generator except that it is required to offer output at zero or one cent per MWh and to provide a forecast of day-ahead output. Those generators must run dispatch auction for when too much zero-price generation is offered. Wind generation shuts down sometimes intentionally at times when market spot prices are very low. Generators are required to provide to the system operator real-time SCADA (Supervisory Control and Data Acquisition) information.
New Zealand’s baseload power system has no integration issues in meeting the 90% target. If growth relies predominantly on geothermal and hydropower, operational impacts will be more limited as both provide baseload generation. The market design and system operator today are geared towards a baseload energy-only market. However, with growing shares of wind and solar power, the transmission operator, regulators and policy makers will have to assess the following questions:
First, increasing the share of variable resources by a substantial amount may raisequestions regarding the operational security of the power system.
Secondly, from a longer-term energy security perspective, there is the question onhow seasonal availability of the RE portfolio can be optimised and/or how efficiencyand load management can contribute to alter load patterns to better meet supply.
Thirdly, further raising the share of variable generation resources may challenge theexisting market design more fundamentally, raising the question of what market rulesare best suited to improve efficiency of dispatch and a least-cost and secure mix ofresources.
The remainder of this chapter will discuss these three points in turn, based on a discussion of the basic grid integration context of New Zealand, drawing on international experience.
Power system context for renewables integration
The current renewable energy generation mix in New Zealand consists mainly of dispatchable generation from hydro and geothermal. Only 5% of generation comes from variable renewable electricity (VRE) sources. As discussed above, meeting or exceeding the 90% RE target is likely to involve more geothermal, possibly hydro and some additional generation from wind and solar. The future share of VRE could reach somewhere between below 10% up to about 15% by 2025.
By international standards, this is an above-average but not very high share of VRE. In 2014 Denmark had the largest national VRE share: wind and solar PV, in fact, counted for 41% of total generation (Figure 6.2). Well interconnected with neighbouring countries via the Nord Pool market, Denmark relies on a mix of international interconnections, combined with flexible thermal generation − increasingly flexible gas CHP (combined production of heat and power systems − to integrate wind. By contrast, Portugal, Spain and Ireland are much less interconnected but also had VRE levels above 15% of total annual generation. Ireland has a target to reach 37% of wind generation in the annual mix by 2020. In these countries, a mix of flexible thermal generation (predominantly combined-cycle gas turbine plants) and, in the case of Portugal and Ireland, interconnection with larger systems (Spain and the United Kingdom), respectively, pumped hydro storage facilities are also relevant providers of flexibility.
© O
ECD
/IEA,
201
7

6. SPECIAL FOCUS 1: INTEGRATION OF 90% RENEWABLES
115
PAR
T I.
ENER
GY
SEC
UR
ITY
Figure 6.2 Share of VRE generation in 2014 for selected OECD countries
0%
5%
10%
15%
20%
25%
30%
35%
40%
45%Share wind
Share PV
Source: Adapted from IEA (2015), Medium-Term Renewable Energy Market Report, OECD/IEA, Paris.
The difficulty (or ease) of increasing the share of variable generation in a power system depends on the interaction of two main factors:
First, the properties of wind and solar PV generation: these include the constraints that weather and daylight patterns have on where and when they can generate. It is also relevant that VRE power plants are often smaller in scale than conventional generation and deployed in a more dispersed fashion. Finally, VRE connects to the grid by using power converter technologies, which are different from conventional generators and lead to important integration effects.
Secondly, the flexibility of the power system into which VRE is integrated, the characteristics of the system’s electricity demand and climatic conditions. For example it is easier to integrate large shares of VRE where there is a good match with demand, and where solar PV shows less seasonal fluctuation in countries that have constant daylight hours during the entire year. Flexibility is defined as the ability of a power system to respond to rapid swings in the supply-demand balance, expected or otherwise. It can be provided by four fundamental resources: demand-side resources, electricity storage, grid infrastructure and flexible generation.
Policy, market and regulatory frameworks have a critical impact on the way these two factors interact. The frameworks determine how the power system is actually operated and hence what is technically possible, both practically achievable and economically attractive for stakeholders, in the electricity system (Figure 6.3).
Figure 6.3 The integration challenge
The interaction between the two factors differs from system to system as a result of technical variation as well as the influence of policy and market frameworks. However, a growing body of experience across a diverse range of power systems shows a common
© O
ECD
/IEA,
201
7
6. SPECIAL FOCUS 1: INTEGRATION OF 90% RENEWABLES
116
pattern of challenges. This allows the development of best practice principles for policy and market frameworks – principles that can be applied in a wide range of circumstances.
Measures to increase the flexibility of the system or to reduce the impact of VRE on the system include:
Optimise system and market operations: better system operations can lead to a more flexible and reactive market, able to deal with high shares of VRE. Schedule updates close to real time and short dispatch intervals are the first measures to make the market more reactive to VRE variability.
Deploy VRE in a system-friendly way: appropriate VRE deployment maximises their value to the overall system. VRE additions have to be aligned with overall system deployment. Moreover, appropriate location and technology mix ease the inclusion of additional VRE. Policies, regulations and grid codes can play a role in the deployment of the right technology at the right moment in the right location.
Improve the flexibility of dispatchable generation: dispatchable generators are the main source of flexibility; their contribution may be increased by retrofitting the existing asset, decreasing the minimum output thresholds of the power plants, increasing the ramp rates and reducing the start-up time of the power plants. Rewarding flexible operations, adjusting payments to reward the benefits for the system use, not just energy production, may trigger investments.
Encourage demand-side management and energy storage: consumers may be engaged into the power market, so as to follow power generation, including via aggregators. Policies can be enacted to make consumers more proactive in finding a way to consume energy when it is more convenient for the power system, for example adopting energy storage options. Storage can also be done in a centralised way, e.g. in pumped hydro storage facilities.
Improve grid infrastructures: grid infrastructures aggregate distant resources and bring important portfolio and scaling benefits to the power system. Relevant improvements to the grid infrastructures include smart meters and smart grids, additional control and management equipment, the elimination of grid bottlenecks, among others.
These measures can be thought of as a tool-box of options to address grid integration challenges. The most relevant tools and the way they are used in practice depend on system specific circumstances.
In the case of New Zealand, there are a number of factors that may shape the grid integration context. These include:
the isolated island location of New Zealand combined with a relatively small power system
large availability of reservoir hydro but with low levels of storage, and periodic drought conditions
high levels of baseload geothermal generation and significant potential to extend them
© O
ECD
/IEA,
201
7

6. SPECIAL FOCUS 1: INTEGRATION OF 90% RENEWABLES
117
PAR
T I.
ENER
GY
SEC
UR
ITY a strong seasonal electricity demand profile with a negative correlation of many
relevant VRE resources with demand (solar, hydro and wind)
the distribution of generation between the two islands and a limited degree ofinterconnection, which is also non-synchronous
significant uncertainties around future supply and demand patterns, in particular theremaining operating life of the Huntly coal-fired plant, the unclear future of thealuminium smelter, which takes 15% of total current electricity demand, and a lack ofvisibility of additional gas production in New Zealand.
These factors will be considered in the discussion of the three priorities.
Priority 1: System operation at high shares of variable generation
In many European countries (Denmark, Germany, Ireland, Italy, Spain), reaching double-digit shares of VRE generation has been facilitated predominantly by improved operation of existing power system assets. This is the main issue discussed in this section. Issues relating to ensuring that appropriate assets are present in the system are addressed in the Priority 2 section on resource adequacy. The main idea behind changing system and market operations to efficiently accommodate large shares of VRE is to move operational decisions closer to real time and to dispatch the system at short-time intervals.
Operations of the New Zealand power system are determined largely through bids in the spot market. Its organisation as a mandatory gross pool (all generators must bid into the market) provides a good basis for VRE integration, since all power plants report their availability to the system operator. In addition, market prices are calculated for each node in the transmission system, providing locational signals. This has the advantage of managing transmission grid congestion directly through the spot market; it also helps to signal the value of electricity, depending on location. However, a number of design characteristics appear to show room for improvement.
The market design has a quite simplistic representation of operating reserves. The only remunerated reserve is instantaneous reserve; its price can be higher than the electricity market real-time price (see Chapter 5 on electricity). The cost of this reserve is allocated to the largest generating units operating. This can be problematic from the point of VRE integration for several reasons. First, this system provides few incentives for VRE generators to report accurate forecasts. In fact, the same goes for electricity suppliers, because demand is centrally forecast by the system operator. This arrangement may limit incentives to optimise forecast accuracy.
As previous studies on New Zealand and a vast body of international analyses have shown, accurate VRE forecasts are critical for efficient VRE integration. Currently, wind generators with a capacity of more than 30 MW are required to bid their generation into the pool. They must report schedules 36 hours ahead of operations and revise schedules two hours ahead of real-time operations based on a persistence forecast (or some other methodology approved in writing by the Electricity Authority). A persistence-based methodology is one that is based on the current output of the wind farm. The two-hour lead time for the final update appears very long compared to international benchmarks.
© O
ECD
/IEA,
201
7

6. SPECIAL FOCUS 1: INTEGRATION OF 90% RENEWABLES
118
Moreover, under the existing arrangements, the cost of balancing forecast errors (for both demand and VRE) will likely be absorbed into the overall energy price. This can mask the true value of flexibility and may lead to an under-remuneration of more flexible assets as well as few incentives to develop additional flexible resources.
Looking further ahead, a number of operational challenges associated with higher levels of VRE generation merit in-depth analysis. The latest systematic integration study for the system was done in 2008 (ICL, 2008) which found that 20% of VRE would not pose a problem to system stability and market operation. The study assessed resource adequacy (see Priority 2 below) as well as operational issues. The study is based on assumptions of wind turbine technology that is no longer state of the art. Wind was assumed not to be able to contribute to reserve provision. In particular during possible periods of over-generation in summer (strong availability of hydro, wind and solar) using excess wind power as a fast-acting reserve is likely to be more cost-effective than relying on thermal plant operation (which is the solution assumed in the study).
In addition, the study did not investigate issues relating to power system stability, such as possible issues during times when VRE covers a large share of demand. A rough estimate suggests that, at a VRE penetration of 10% in annual generation, there will be no situation where wind covers more than 50% of power demand. This 50% threshold was established by the Irish system operator to deal with operational impacts of wind power (Box 6.1). Ireland is currently implementing measures to bring this level up to 75%. The results from Ireland cannot be directly applied to the New Zealand context. However, it is safe to conclude that a detailed investigation into the maximum system non-synchronous penetration associated with higher shares of VRE capacity and possible related issues would be timely. Notably, the segmentation of the New Zealand power system into two non-synchronously connected parts may give rise to challenges at lower levels of deployment, if VRE capacity is located sub-optimally. As such, impacts on the operability of the system should inform the siting of a future VRE plant.
Finally, the ramping capability of the system, i.e. the ability to adjust generation or demand rapidly to deal with expected or unexpected swings in the supply balance, should be systematically assessed. This includes an investigation in demand-side response potential, including a possible augmentation of the New Zealand Aluminium Smelters. Smelters have been retrofitted, for instance in Germany (Trimet), in order to provide additional flexibility to the power system.
At a system level, a programme of integration studies has been initiated by Transpower and are recurrently under way, investigating the impact of high levels of solar PV on the overall system as part of studies on emerging technologies, including batteries. The approach is to identify the levels of PV that would result in an inability to meet performance objectives for power system operation to help identify the range of mitigations – technical, market and regulatory − that could be required. At a distribution level, the Electricity Networks Association (ENA) is reviewing the operational impacts of technologies such as solar PV, demand response, electric vehicles (EV) and others.
© O
ECD
/IEA,
201
7

6. SPECIAL FOCUS 1: INTEGRATION OF 90% RENEWABLES
119
PAR
T I.
ENER
GY
SEC
UR
ITY
Box 6.1 Case study: Ireland Ireland has a number of geographical features which are similar to those of New Zealand, a small island system with limited (although not absent) interconnection. It has experienced a strong growth in wind generation which now accounts for almost 20% of Ireland’s electricity mix. This share is expected to rise to 37% by 2020. In order to establish an appropriate wind target, the Irish system operator EirGrid conducted a set of detailed studies (EirGrid, 2008). They found that the main operational challenges were experienced during low load and high wind generation conditions. This led to the adoption of a comprehensive programme to upgrade the Irish power system and adapt the market design. A core objective of the reform is to increase the amount of wind power – or more precisely the allowable system non-synchronous penetration – from currently 50% to 75%. The most relevant measures include (per category):
Frequency regulation: demonstration projects which serve to test new concepts and standards of performance, both for renewable energy equipment (which can translate into more ambitious grid codes) and supportive grid infrastructure.
Voltage control: setting reactive power standards for all generators; co-ordinated voltage control by transmission system operator and district system operator, and tailored procurement for system services that support voltage stability.
System services: review of the effectiveness of existing services and payment structures; development/definition of new services and new/revised payment structures (discussed in more detail below). Introduction of interim “harmonised ancillary services” (HAS) contracts with eligible service providers.
Load shaping: definition of strategic demand-response programme; inclusion in grid code revision.
Grid codes: focus on renewable plant performance standards, ROCOF (rate of change of frequency) standards, and demand-side response.
Unlike New Zealand, Ireland does have an international interconnection which does provide some flexibility to export power at times of high VRE generation. However, because of its implementation as a DC connection, Ireland is an island in terms of power system inertia. The rising deployment of wind in Ireland provoked new innovative ways to procure system services. These include both “traditional” and more recently defined system services:
existing system services new system services
primary operating reserve synchronous inertial response
secondary operating reserve fast frequency response
tertiary operating reserve 1 fast post-fault active power recovery
tertiary operating reserve 2 ramping margin 1
replacement reserve – synchronised ramping margin 3
replacement reserve – de-synchronised ramping margin 8
reactive power dynamic reactive response
© O
ECD
/IEA,
201
7

6. SPECIAL FOCUS 1: INTEGRATION OF 90% RENEWABLES
120
In order to ascertain which is the most suitable procurement method, EirGrid needed to first establish the degree of competition for each system service and, where necessary, for specific regions of the grid. In cases where there was a sufficient number of suppliers (i.e. those system services that are deemed sufficiently competitive), the system operator organised competitive tenders to procure certain system services from private parties. If there was insufficient competition, procurement was arranged on the basis of bilateral contracts, concluded for up to several years and subject to periodic revision.
Priority 2: Resource adequacy with higher shares of renewable energy
The dominant issue of resource adequacy faced by New Zealand is the irregular shortage of hydropower inflows without being able to obtain energy from other sources. This issue is compounded by the fact that hydro shortages tend to occur in winter, when demand reaches its seasonal maximum. The need to consider water availability is reflected in the system adequacy assessment by the operator. In addition to the firm capacity contribution of each resource, the secured energy contribution during periods of low hydro availability is assessed.
Ideally, the build-out of variable renewable energy (VRE) resources would complement the availability of hydropower and/or correlate very well with power demand. However, no resource – renewable or fossil – naturally does so (see Chapter 5 on electricity). Wind and solar both show reduced availability when load is highest in winter months and show limited complementarity. Only geothermal generally provides a flat output throughout the year. Dedicated thermal plants can be built and run only when other resources are insufficient to meet demand, but this is associated with carbon and other emissions alongside costs for plants and fuel.
Existing analysis has shown regional differences in the availability of RE resources – for example wind resources in Northland, Auckland and Taranaki offer a production profile almost independent from winter hydro inflows (Bull, 2010). Adding wind capacity in those areas, therefore, will reduce system stress during a “dry winter” season. No data were made available during the IEA review that investigated the extent to which solar energy tends to show higher availability during periods of low wind or hydro availability. Taken together, it seems very timely to conduct a systematic analysis of the technology mix (wind and solar power, as well as geothermal and bioenergy) and of suitable locations that are most adequate in combination with existing hydro plants to meet demand.
Given that VRE resources show the highest availability in the summer, any VRE heavy mix that guarantees security of supply during dry winters will likely lead to abundant and possibly surplus supply during the summer. Consequently, a detailed understanding of the opportunities to reduce demand during winters would be very valuable in shaping demand to better fit available low-cost and environment-friendly supply. Energy efficiency improvements have a key role to play in this context and a functional demand-side response is therefore vital in the electricity market design from a medium- to longer-term security of supply point of view.
Conversely, any services that are provided predominantly in summer months and that are currently met with fossil fuels could be targeted for electrification. Electrification of other
© O
ECD
/IEA,
201
7

6. SPECIAL FOCUS 1: INTEGRATION OF 90% RENEWABLES
121
PAR
T I.
ENER
GY
SEC
UR
ITY
sectors, including transport, may also be instrumental in reaching not only an ambitious RE target for the power sector, but also a more fundamental transformation of the energy system more generally.
The hydro-based power system of New Zealand has the inherent feature of regular droughts which result in price peaks at low hydro-storage levels. New Zealand had a reserve mechanism which was phased out in 2010. Today, the system operator Transpower, through its adequacy assessment, alerts to adequacy concerns at times of low backup capacity. Despite the electricity market ensuring sufficient transactions between market participants in the medium term to purchase backup capacity, in light of the higher shares of VRE, it cannot be taken for granted that an energy-only market and the emerging financial market will secure investment in baseload backup generating capacity at all times (from renewable or fossil sources) or will be able to alleviate longer-term security of supply concerns about industrial demand. A strategic reserve similar to the one implemented in the Nordic market could help to support Transpower’s function in providing incentives for the market to adjust to shortage periods (see Chapter 5 on electricity).
Finally, ensuring adequate and co-ordinated expansion of the transmission grid is a crucial area of consideration. New Zealand has already made progress in this regard, for example by greatly increasing the interconnection capacity between the two sub-systems. Going forward, integrating transmission and generation planning will be critical to deliver an overall least-cost system. Examples from other jurisdictions, such as the Competitive Renewable Energy Zones in Texas,3 show how integrated planning of the grid can go hand-in-hand with a competitive, market-based investment in generating capacity.
Priority 3: Market design ensuring economic efficiency and robust price signals
Under normal operating conditions, there is adequate capacity to meet market needs and so the case for additional generation is not very strong. On the other hand, there are concerns that, in times of drought, there could be supply shortages, exacerbated by the location of other than hydro capacity in the North Island and transmission constraints between the islands. Therefore, New Zealand’s power system has weak incentives which, together with current market uncertainties, impact the investment climate for new power generation. However, the recent increase in baseload geothermal power has proven that the electricity market remains attractive, despite large uncertainties.
The recent decision to keep the Huntly coal-fired plant in business until 2022 addresses short-term concerns of generation adequacy at times of constrained hydro generation. However, it reduces the short-term need for additional capacity while not resolving the longer-term issue of security of supply. If the Huntly plant were to close in 2022, it would reduce generation by around 5%, potentially opening a market opportunity for additional renewable generation.
3 Construction of new transmission lines to connect distant resources may face a chicken-and-egg problem. New generation is only likely to be built if transmission is available. Conversely, transmission will only be built if there is generation. To overcome this problem, the Public Utility Commission of Texas (PUCT) established Competitive Renewable Energy Zones (CREZ). Grid infrastructure to connect projects in these zones was ordered by the Texas Commission. The project was planned to transmit more than 18 GW of wind power from West Texas and the Panhandle to densely-populated metropolitan areas of the state (ERCOT, 2013).
© O
ECD
/IEA,
201
7

6. SPECIAL FOCUS 1: INTEGRATION OF 90% RENEWABLES
122
Another uncertainty is the possible closure of the Rio Tinto aluminium smelter, located at the bottom of the South Island. From 1 January 2017 the smelter has an option to terminate its contract with the electricity provider Meridian Energy with one year notice. The risk is that a sudden 500 MW surplus of hydro generation could cause an oversupply situation and a strong reduction in wholesale market prices, thus lowering the appetite for new investments in generation.
New Zealand has found an innovative way to encourage generators to give guarantees of sufficient hydro storage levels. In order to guarantee available capacity during periods of shortage, the current market system includes a penalty to be paid by all electricity retailers during a public conservation campaign in drought periods. This penalty (paid directly to consumers) is applied to all retailers, and requires them to pay the consumer a compensation of NZD 10.50 per week, which is a unique tool to avoid that hydro generators run down the reservoirs too low and thereby oblige them to contribute to meet demand during tight supply conditions. The rationale for this policy is that the penalty will encourage retailers to contract with generators for sufficient risk cover, which in turn will facilitate investment in generation and better management of hydropower reservoir. However, the penalty is applied to all retailers, whether they have hydro capacities or not. An issue for consideration would be whether applying this measure to non-hydro gentailers and to non-generating retailers is efficient or whether it should be more focused on hydro generators only. As explained in Chapter 5 on electricity, the Electricity Authority should review the scope and structure of the compensation charge to check its value, cost and benefits, and notably its impact on new entrants to the market.
In essence, this penalty payment is the reverse premium system for firm energy. Such a mechanism was adopted systematically in Brazil after the 2001 rationing crisis (Box 6.2).
Box 6.2 Case study: Brazil Brazil has a level of renewable generation (82% in 2015) and a power system dominated by hydropower resources similar to those of New Zealand, with other renewable generation provided principally by biomass and an increasing capacity of wind and solar. An important difference with New Zealand is the absolute size of the power system and the larger size of reservoir storage capacity. Over the past two decades, Brazil has implemented different measures to ensure the long-term resource adequacy of its power system. These are principally focused on protecting against the risk of drought while minimising the total cost of the overall power system. In 1996, the Brazilian electricity sector moved away from the then prevailing state-owned, regionally controlled model or power supply towards a liberalised generation sector. It was expected that long-term, bilateral contracts – informed by short-term market price signals – between developers of new hydro projects on the one hand and suppliers and large industrial consumers on the other would ensure sufficient investment levels. However, prices during the late 1990s were insufficient to trigger adequate investments. When a drought hit the country in the years before 2001, the system was structurally short of energy which led to a rationing crisis. A comprehensive reform of the power sector was implemented in 2004. The main change of the reform was to mandate that commercial contracts be always backed by a sufficient quantity of “physical guarantees”. This quantity basically reflects the ability of a generation resource to meet demand reliably during periods of tight water availability.
© O
ECD
/IEA,
201
7
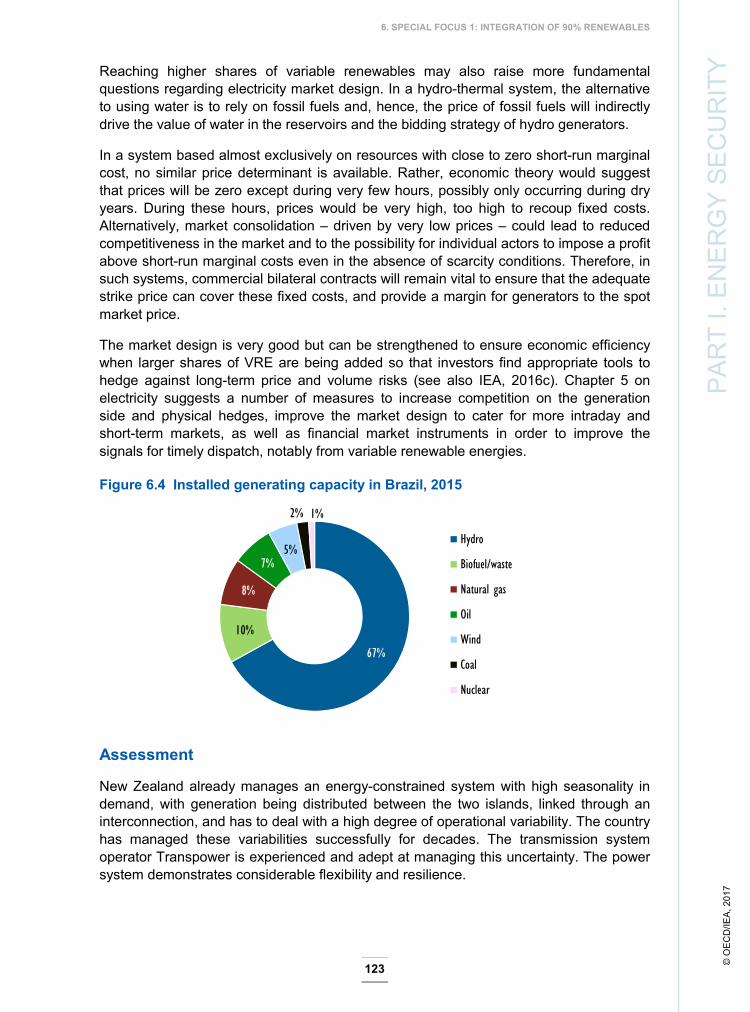
6. SPECIAL FOCUS 1: INTEGRATION OF 90% RENEWABLES
123
PAR
T I.
ENER
GY
SEC
UR
ITY Reaching higher shares of variable renewables may also raise more fundamental
questions regarding electricity market design. In a hydro-thermal system, the alternative to using water is to rely on fossil fuels and, hence, the price of fossil fuels will indirectly drive the value of water in the reservoirs and the bidding strategy of hydro generators.
In a system based almost exclusively on resources with close to zero short-run marginal cost, no similar price determinant is available. Rather, economic theory would suggest that prices will be zero except during very few hours, possibly only occurring during dry years. During these hours, prices would be very high, too high to recoup fixed costs. Alternatively, market consolidation – driven by very low prices – could lead to reduced competitiveness in the market and to the possibility for individual actors to impose a profit above short-run marginal costs even in the absence of scarcity conditions. Therefore, in such systems, commercial bilateral contracts will remain vital to ensure that the adequate strike price can cover these fixed costs, and provide a margin for generators to the spot market price.
The market design is very good but can be strengthened to ensure economic efficiency when larger shares of VRE are being added so that investors find appropriate tools to hedge against long-term price and volume risks (see also IEA, 2016c). Chapter 5 on electricity suggests a number of measures to increase competition on the generation side and physical hedges, improve the market design to cater for more intraday and short-term markets, as well as financial market instruments in order to improve the signals for timely dispatch, notably from variable renewable energies.
Figure 6.4 Installed generating capacity in Brazil, 2015
Assessment
New Zealand already manages an energy-constrained system with high seasonality in demand, with generation being distributed between the two islands, linked through an interconnection, and has to deal with a high degree of operational variability. The country has managed these variabilities successfully for decades. The transmission system operator Transpower is experienced and adept at managing this uncertainty. The power system demonstrates considerable flexibility and resilience.
© O
EC
D/IE
A, 2
017
67%
10%
8%
7%5%
2% 1%
Hydro
Biofuel/waste
Natural gas
Oil
Wind
Coal
Nuclear

124
6. SPECIAL FOCUS 1: INTEGRATION OF 90% RENEWABLES
New Zealand’s power system is well placed to accommodate growing VRE, but IEA experience suggests that more substantial market shares may have implications for efficient market operation and maintaining power system security.
Policy makers may want to consider experience across IEA countries and the implications that higher volumes of variable RES may have for efficient market operation (price formation) and maintaining system security over time. However, the situation in New Zealand faces a unique situation and the experience gained in other IEA countries could be difficult to apply. New Zealand is the first of its kind.
To date, New Zealand operates a predominately baseload energy-only market. There is a negative correlation of many relevant VRE resources with demand (solar, hydro and wind) which can also have local impacts. There are also uncertainties around future supply and demand patterns. The main backup Huntly coal/gas-fired power plant is reaching the end of its lifetime and New Zealand’s aluminium smelter, which currently takes 15% of total electricity demand, has an option to end its contract and presence. As mentioned, there is a lack of visibility of additional gas production in New Zealand.
Recommendations
The government of New Zealand should:
Conduct systematic, detailed review of likely scenarios for a portfolio of wind, solar and geothermal resources, and impacts on grid and system reliability. Such an assessment should consider state-of-the-art wind and solar PV technology and optimise the location of wind and solar PV generation.
Conduct a detailed study on the integration of the operational and system stability consequences of the new wind and solar PV technologies.
Examine options to enhance system flexibility in the future with greater shares of distributed generation, energy efficiency, smart grids, demand response, demand aggregation and other innovative services.
Take advantage of changes being considered by the Electricity Authority, including reducing gate closure times and moving to real-time pricing. Review the forecasting bidding rules for wind and potential to provide ancillary services.
Consider the need for adjusting the market design as higher shares of variable renewable energy come online, with a view to provide market participants with a possibility to hedge against market uncertainties.
References Bull, B. (2010), Correlation between wind generation output and hydro inflows, Auckland.
EirGrid (2008), All Island Grid Study, Eirgrid, Dublin.
© O
ECD
/IEA,
201
7

6. SPECIAL FOCUS 1: INTEGRATION OF 90% RENEWABLES
125
PAR
T I.
ENER
GY
SEC
UR
ITY
ERCOT (2013), “Lessons Learned in Wind Integration in ERCOT”, presentation at the National Conference of State Legislatures (NCSL), Energy Program Webinar, 25 April, www.ncsl.org/documents/energy/Woodfin-4-25-13.pdf.
ICL (Imperial College Lon don) (2008), The System Impacts and Costs of Integrating Wind Power in New Zealand, Meridian Ltd, New Zealand.
IEA (International Energy Agency) (2016a), Energy Balances of OECD Countries, OECD/IEA, Paris.
IEA (2016b), Renewables Information, OECD/IEA, Paris, www.iea.org/statistics/.
IEA (2016c) Re-Powering Markets, OECD/IEA, Paris.
IEA (2015), Medium-Term Renewable Energy Market Report 2015, OECD/IEA, Paris.
Transpower (2016), Security of Supply Annual Assessment 2016, www.transpower.co.nz/sites/default/files/bulk-upload/documents/SoS%20Annual%20Assessment%202016.pdf.
© O
ECD
/IEA,
201
7
127
PAR
T I.
ENER
GY
SEC
UR
ITY
7. Special Focus 2: Electricity distribution development
Overview
A combination of market liberalisation, decarbonisation policies and rapid technological change is precipitating a fundamental transformation of electricity sectors across IEA member countries.
Distribution systems are at the forefront of this transformation, with a range of new technologies emerging which are supporting the development of innovative products and services that have the potential to fundamentally change the way distribution systems are used, operated and developed. At the same time, this transformation has the potential to fundamentally change the business and regulatory models that have traditionally underpinned distribution activities, raising questions about the ongoing financial viability of distributors and their capacity to meet new operational and investment challenges, especially those associated with this emerging transformation.
The New Zealand government has asked the IEA to undertake a special examination of the distribution sector as part of this in-depth review, with a focus on the sector’s ability to respond in a timely, efficient and cost-effective manner to these emerging challenges.
Electricity distribution sector
In 2015 New Zealand’s distribution sector operated nearly 172 000 circuit kilometres of distribution lines with a total asset value of around USD 7.1 billion. On average the sector delivered around 31 terawatt hours (TWh) of electricity to a little over 2.3 million accounts (customers) annually between 2013 and 2015, with an average annual income for the sector of around USD 1.6 billion.
The sector is managed by 29 distributors. They are geographically diverse, with most serving rural and regional consumers (see Figure 5.14). Their service areas generally reflect their local authority origins. Most are owned and operated by community-owned trusts or local authorities. This is reflected in their regulatory status, with most of the smaller community-owned trusts exempted from economic regulation or enforcement of reliability standards.1
It is also reflected in the nature and scope of their distribution activities. Most distributors are relatively small. On average, they managed around 5 900 circuit kilometres of distribution lines in 2015, served around 80 000 customers and delivered around 1.0 TWh of electricity annually between 2013 and 2015. Only four distributors managed more than 10 000 circuit kilometres of distribution lines, representing over half the total 1 This exemption is examined further in the section below on emerging policy issues.
© O
ECD
/IEA,
201
7

7. SPECIAL FOCUS 2: ELECTRICITY DISTRIBUTION DEVELOPMENT
128
circuit kilometres under sector management in 2015. While only six served more than 100 000 customers and between them delivered over two-thirds of the average total energy delivered annually to all customers between 2013 and 2015. The 17 regulated distributors operated around three-quarters of all distribution lines. They also served nearly 80% of the customer base and delivered nearly 80% of the electricity supplied through the distribution network.
Many distributors serve a geographically dispersed, but mostly urban, customer base with relatively low per-capita consumption. Only seven distributors served more than the average number of customers or delivered more than the average volume of electricity annually between 2013 and 2015. The dispersed nature of the demand is reflected in relatively low levels of connection and delivered energy density, with a sector average of less than 14 connection points and around 182 megawatt hours (MWh) of electricity delivered per circuit kilometre in 2015.
Sector expenditure totalled a little over USD 0.87 billion on average per year between 2013 and 2015, representing around 12.4% of the value of the sector asset base over the period. Average annual operating expenditure was around 0.35 billion, representing nearly 40% of total expenditure over the period. Capital expenditure represented the remaining 60% of total expenditure at around USD 0.53 billion over the period. The 17 regulated distributors controlled a little over three-quarters of total sector assets and were responsible for a similar share of total expenditure in 2015.
Annual average income in the distribution sector totalled around USD 1.63 billion between 2013 and 2015, and around 23% of the value of the sector asset base. An annual average regulatory income for the 17 regulated distributors totalled around USD 1.28 billion between 2013 and 2015, or nearly 80% of total sector income over the period.
Distribution prices currently represent around 26.2% of the typical residential bill.2 Charges as a proportion of the typical residential bill have grown moderately over the last five years. This is largely the result of a substantial fall in the share of the wholesale energy component since 2010, rather than a rapid growth in distribution network charges. However, the Electricity Authority (EA) has noted that distribution prices have contributed significantly to price growth over the last decade, serving to largely offset the recent energy price reductions.3
In 2015, the distribution sector had the following features:
total length of distribution lines: nearly 172 000 circuit kilometres
total number of distribution consumers: 2.38 million installation control points
total volume of electricity throughput: 31.3 TWh
total sector asset value: USD 7.15 billion
total regulated income: USD 1.63 billion
total sector capital and operating expenditure: USD 0.93 billion. 2 See Electricity Authority’s breakdown of residential changes available online at www.ea.govt.nz/consumers/my-electricity-bill/. 3 See Electricity Authority (2016a, 2014 and 2015) for further discussion.
© O
ECD
/IEA,
201
7

7. SPECIAL FOCUS 2: ELECTRICITY DISTRIBUTION DEVELOPMENT
129
PAR
T I.
ENER
GY
SEC
UR
ITY
Table 7.1 Key features of New Zealand’s electricity distribution sector
© O
EC
D/IE
A, 2
017
Dis
trib
utio
n
com
pan
y G
ove
rnan
ce
and
ow
ner
ship
ar
ran
gem
ents
Reg
ula
tory
su
per
visi
on
Net
wo
rk
len
gth
(c
ircu
it
kms)
a
Ave
rag
e n
um
ber
of
con
nec
tio
ns
(IC
Ps)
b
Co
nn
ecti
on
den
sity
(I
CP
s/km
) c
Vo
lum
e o
f en
erg
y d
eliv
ered
(G
Wh
pa.
) d
Vo
lum
e d
ensi
ty
(MW
h/km
) e
Ass
et
valu
e (U
SD
000
) f
Inve
stm
ent
exp
end
itu
re
(US
D 0
00 p
a.)
g
Op
erat
ing
exp
end
itu
re
(US
D 0
00 p
a.)
h
Tota
l in
com
e (U
SD
000
p
a.)
i
Alp
ine
Ene
rgy
Loca
l aut
horit
y an
d tru
st
Eco
nom
ic re
gula
tion
and
info
rmat
ion
disc
losu
re
4 21
8 31
721
7.
58
733
185.
86
$166
,321
$2
1,87
4 $1
3,79
8 $4
3,83
2
Aur
ora
Ene
rgy
Loca
l aut
horit
y E
cono
mic
regu
latio
n an
d in
form
atio
n di
sclo
sure
6 03
5 87
173
14
.62
1 25
1 21
4.65
$3
30,5
97
$20,
908
$21,
522
$88,
877
Bul
ler
Ele
ctric
ity
Trus
t In
form
atio
n di
sclo
sure
70
6 5
101
7.19
58
84
.66
$28,
540
$1,9
56
$3,5
77
$7,3
55
Cen
tralin
es
Trus
t E
cono
mic
regu
latio
n an
d in
form
atio
n di
sclo
sure
2 01
0 8
709
4.34
10
5 53
.89
$54,
680
$2,8
73
$3,9
95
$11,
485
Cou
ntie
s P
ower
Tr
ust
Info
rmat
ion
disc
losu
re
3 16
3 38
492
12
.43
522
171.
85
$228
,249
$1
9,40
7 $1
0,47
6 $4
3,31
5
Eas
tland
N
etw
ork
Trus
t E
cono
mic
regu
latio
n an
d in
form
atio
n di
sclo
sure
4 16
8 28
357
6.
42
282
70.8
0 $1
39,1
64
$9,7
89
$7,7
03
$32,
427
Ele
ctra
Tr
ust
Info
rmat
ion
disc
losu
re
2 33
7 42
974
17
.58
404
178.
33
$146
,671
$7
,858
$9
,778
$3
5,93
5
Ele
ctric
ity
Ash
burto
n C
o-op
erat
ive
Eco
nom
ic re
gula
tion
and
info
rmat
ion
disc
losu
re
3 28
3 19
661
6.
12
563
206.
88
$226
,349
$1
9,05
0 $8
,333
$3
7,38
7
Ele
ctric
ity
Inve
rcar
gill
Loca
l aut
horit
y E
cono
mic
regu
latio
n an
d in
form
atio
n di
sclo
sure
828
21 6
30
26.1
8 26
0 38
9.84
$7
4,18
8 $5
,696
$4
,784
$1
8,67
0

7. SPECIAL FOCUS 2: ELECTRICITY DISTRIBUTION DEVELOPMENT
130 © O
EC
D/IE
A, 2
017
Dis
trib
utio
n
com
pan
y G
ove
rnan
ce
and
ow
ner
ship
ar
ran
gem
ents
Reg
ula
tory
su
per
visi
on
Net
wo
rk
len
gth
(c
ircu
it
kms)
a
Ave
rag
e n
um
ber
of
con
nec
tio
ns
(IC
Ps)
b
Co
nn
ecti
on
den
sity
(I
CP
s/km
) c
Vo
lum
e o
f en
erg
y d
eliv
ered
(G
Wh
pa.
) d
Vo
lum
e d
ensi
ty
(MW
h/km
) e
Ass
et
valu
e (U
SD
000
) f
Inve
stm
ent
exp
end
itu
re
(US
D 0
00 p
a.)
g
Op
erat
ing
exp
end
itu
re
(US
D 0
00 p
a.)
h
Tota
l in
com
e (U
SD
000
p
a.)
i
Hor
izon
Tr
ust a
nd p
ublic
E
cono
mic
regu
latio
n an
d in
form
atio
n di
sclo
sure
2 97
2 34
706
9.
93
517
205.
89
$113
,283
$7
,901
$7
,568
$3
0,80
1
Mai
nPow
er
Trus
t In
form
atio
n di
sclo
sure
5
297
42 3
43
8.71
57
2 12
3.23
$2
31,6
74
$30,
100
$11,
592
$49,
205
Mar
lbor
ough
Li
nes
Trus
t In
form
atio
n di
sclo
sure
4
057
27 9
39
7.30
37
0 11
1.32
$2
17,5
15
$13,
073
$12,
163
$32,
845
Nel
son
Ele
ctric
ity
Mar
lbor
ough
Li
nes
and
Net
wor
k Ta
sman
Eco
nom
ic re
gula
tion
and
info
rmat
ion
disc
losu
re
361
11 4
13
31.6
8 14
2 48
1.15
$4
1,66
9 $6
,373
$2
,154
$1
0,07
1
Net
wor
k Ta
sman
Tr
ust
Info
rmat
ion
disc
losu
re
3 57
9 37
708
10
.65
594
166.
04
$161
,816
$9
,447
$8
,930
$4
0,32
4
Net
wor
k W
aita
ki
Trus
t In
form
atio
n di
sclo
sure
2
015
12 9
75
6.51
24
7 14
1.29
$7
4,25
6 $6
,674
$3
,943
$1
4,70
1
Nor
thpo
wer
Tr
ust
Eco
nom
ic re
gula
tion
and
info
rmat
ion
disc
losu
re
6 39
8 59
796
9.
58
976
168.
42
$242
,199
$1
4,31
8 $1
5,71
8 $6
1,05
6
Orio
n Lo
cal a
utho
rity
Eco
nom
ic re
gula
tion
and
info
rmat
ion
disc
losu
re
14 2
98
244
901
17.2
7 3
062
284.
64
$907
,756
$7
7,20
4 $4
9,91
1 $2
31,2
32
Ota
goN
et
The
Pow
er
Com
pany
and
E
lect
ricity
In
verc
argi
ll
Eco
nom
ic re
gula
tion
and
info
rmat
ion
disc
losu
re
4 70
4 14
893
3.
19
403
88.1
5 $1
63,6
42
$11,
023
$7,3
15
$33,
645

7. SPECIAL FOCUS 2: ELECTRICITY DISTRIBUTION DEVELOPMENT
131
PAR
T I.
ENER
GY
SEC
UR
ITY
© O
EC
D/IE
A, 2
017
Dis
trib
utio
n
com
pan
y G
ove
rnan
ce
and
ow
ner
ship
ar
ran
gem
ents
Reg
ula
tory
su
per
visi
on
Net
wo
rk
len
gth
(c
ircu
it
kms)
a
Ave
rag
e n
um
ber
of
con
nec
tio
ns
(IC
Ps)
b
Co
nn
ecti
on
den
sity
(I
CP
s/km
) c
Vo
lum
e o
f en
erg
y d
eliv
ered
(G
Wh
pa.
) d
Vo
lum
e d
ensi
ty
(MW
h/km
) e
Ass
et
valu
e (U
SD
000
) f
Inve
stm
ent
exp
end
itu
re
(US
D 0
00 p
a.)
g
Op
erat
ing
exp
end
itu
re
(US
D 0
00 p
a.)
h
Tota
l in
com
e (U
SD
000
p
a.)
i
Pow
erco
P
ublic
E
cono
mic
regu
latio
n an
d in
form
atio
n di
sclo
sure
30 5
70
355
970
11.7
6 4
448
160.
71
$1,4
76,7
17
$111
,377
$6
6,22
8 $3
40,1
72
Sca
npow
er
Trus
t In
form
atio
n di
sclo
sure
1
055
6 71
8 6.
34
78
72.5
6 $3
5,88
1 $2
,144
$2
,167
$8
,080
The
Line
s C
ompa
ny
Trus
t E
cono
mic
regu
latio
n an
d in
form
atio
n di
sclo
sure
5 20
0 28
317
5.
45
315
75.6
8 $1
77,2
15
$9,7
37
$10,
164
$36,
838
The
Pow
er
Com
pany
Tr
ust
Info
rmat
ion
disc
losu
re
9 15
6 36
136
3.
98
696
79.7
9 $3
25,1
46
$23,
120
$13,
792
$54,
098
Top
Ene
rgy
Trus
t E
cono
mic
regu
latio
n an
d in
form
atio
n di
sclo
sure
5 10
2 38
174
7.
73
325
80.5
9 $2
16,7
22
$25,
724
$12,
804
$37,
659
Uni
son
Trus
t E
cono
mic
regu
latio
n an
d in
form
atio
n di
sclo
sure
10 9
13
132
551
12.1
7 1
564
171.
24
$538
,909
$4
0,68
5 $3
4,07
4 $1
27,8
46
Vec
tor
Trus
t and
pub
lic
Eco
nom
ic re
gula
tion
and
info
rmat
ion
disc
losu
re
22 1
71
623
020
29.8
4 8
335
461.
64
$2,6
56,4
16
$169
,340
$1
04,6
69
$605
,241
Wai
pa
Net
wor
ks
Trus
t In
form
atio
n di
sclo
sure
2
251
25 7
16
11.6
2 35
2 16
7.99
$9
1,20
9 $7
,080
$4
,848
$2
2,16
6
Wel
lingt
on
Ele
ctric
ity
Che
ung
Kon
g In
frast
ruct
ure
Ltd
Eco
nom
ic re
gula
tion
and
info
rmat
ion
disc
losu
re
7 38
3 12
5 09
3 16
.37
1 20
3 22
8.00
$4
86,8
46
$52,
757
$18,
399
$97,
122

7. SPECIAL FOCUS 2: ELECTRICITY DISTRIBUTION DEVELOPMENT
132 © O
EC
D/IE
A, 2
017
Dis
trib
utio
n
com
pan
y G
ove
rnan
ce
and
ow
ners
hip
ar
ran
gem
ents
Reg
ula
tory
su
per
visi
on
Net
wor
k le
ngt
h (c
ircu
it
kms)
a
Ave
rag
e n
umb
er o
f co
nn
ectio
ns
(IC
Ps)
b
Co
nn
ecti
on
den
sity
(I
CP
s/km
) c
Vo
lum
e o
f en
erg
y d
eliv
ered
(G
Wh
pa.
) d
Vo
lum
e d
ensi
ty
(MW
h/km
) e
Ass
et
valu
e (U
SD
000
) f
Inve
stm
ent
exp
end
itu
re
(US
D 0
00 p
a.)
g
Op
erat
ing
exp
end
iture
(U
SD
000
pa.
) h
Tota
l in
com
e (U
SD
000
pa
.) i
WE
L N
etw
orks
Tr
ust
Info
rmat
ion
disc
losu
re
5 07
0 17
8 80
1 35
.38
2 37
2 49
9.44
$5
86,6
89
$32,
631
$27,
822
$169
,039
Wes
tpow
er
Trus
t In
form
atio
n di
sclo
sure
2
547
14 7
77
5.89
26
8 11
7.82
$1
12,4
20
$3,0
13
$8,5
11
$20,
153
Ind
ustr
y to
tal
171
846
2 33
5 76
5 13
.85
31 0
15
182.
17
$10,
252,
739
$763
,131
$5
06,7
36
$2,3
41,5
79
Eco
nom
ic r
egul
atio
n a
nd in
form
atio
n d
iscl
osu
re to
tal
130
130
61
866
087
14.5
8 24
482
18
9.30
$8
,012
,672
$6
06,6
29
$389
,137
$1
,844
,361
Info
rmat
ion
disc
losu
re to
tal
41 2
33
469
678
11.5
5 6
532
159.
57
$2,2
40,0
67
$156
,502
$1
17,5
99
$497
,217
Not
es:
a. T
otal
dis
tribu
tion
lines
circ
uit l
engt
h fo
r sup
ply
in 2
015.
b. IE
A e
stim
ate
of th
e av
erag
e an
nual
num
ber o
f ins
talla
tion
cont
rol p
oint
s (IC
Ps) s
erve
d be
twee
n 20
13 a
nd 2
015.
c. A
vera
ge a
nnua
l num
ber o
f IC
Ps p
er c
ircui
t kilo
met
re fo
r sup
ply
in 2
015.
d. A
vera
ge a
nnua
l tot
al e
nerg
y de
liver
ed to
all
ICP
s be
twee
n 20
13 a
nd 2
015.
e. A
vera
ge a
nnua
l tot
al e
nerg
y de
liver
ed to
ICPs
per
circ
uit k
ilom
etre
for s
uppl
y in
201
5.
f. To
tal c
losi
ng b
alan
ce fo
r the
ass
et b
ase
in 2
015.
g. A
vera
ge a
nnua
l tot
al c
apita
l exp
endi
ture
bet
wee
n 20
13 a
nd 2
015.
h. A
vera
ge a
nnua
l tot
al o
pera
ting
expe
nditu
re b
etw
een
2013
and
201
5.
i. Av
erag
e an
nual
tota
l reg
ulat
ory
inco
me
betw
een
2013
and
201
5.
Sour
ce: C
omm
erce
Com
mis
sion
(201
5).

7. SPECIAL FOCUS 2: ELECTRICITY DISTRIBUTION DEVELOPMENT
133
PAR
T I.
ENER
GY
SEC
UR
ITY
SUM
MAR
Y
Regulatory framework
Electricity distributors are subject to either default or customised price-quality path regulation and information disclosure under Part 4 of the Commerce Act 1986 (the Act). Distributors that meet the consumer ownership criteria under Section 54D of the Act are subject to information disclosure regulation only.
Information disclosure
Information disclosure requirements aim to ensure that sufficient information is readily available for stakeholders to assess whether the long‐term benefit of consumers in markets where there is little or no competition is being met. Distributors are required to disclose a range of information including:
the nature and composition of network infrastructure and use
pricing, including how prices are formed
financial performance, including actual and forecast operational and capital expenditures, revenues, profitability, asset values and return on investment
asset management and planned investment
quality and reliability performance
activities to promote energy-efficient operation of networks, including consideration of non-network solutions such as distributed generation and demand-side management.
The Commerce Commission publishes this information annually.
Price-quality path regulation
Seventeen electricity distributors are subject to price-quality path regulation under Part 4 of the Act. This is a form of incentive-based economic regulation whereby the Commerce Commission (CC) establishes the revenue envelope for the five-year regulatory period for each regulated distributor, with annual increases governed by a CPI-X methodology (Consumer Price Index minus X-efficiency factor). The combination of these variables defines the pricing “path” that sets the maximum average prices each regulated distributor can charge over the regulatory period.
All regulated distributors are subject to a default price path using a standard methodology to help reduce compliance and assessment costs. Regulated distributors can propose a customised price path if it better meets their needs. At present one distributor is subject to a customised price path.
Under the default price path regime, the revenue envelope is set using input methodologies specified by the Commerce Commission that apply to the key inputs, including: asset valuation, cost allocation, tax treatment, cost of capita, pricing, rules and processes governing incentive schemes, and evaluation criteria.1 The price path is 1 The Commerce Commission is currently conducting a review of its input methodologies to ensure that they remain effective in promoting the long-term benefit for consumers. A key focus of the Review was to examine the potential regulatory implications of emerging technologies and to develop potential responses.
© O
ECD
/IEA,
201
7

134
7. SPECIAL FOCUS 2: ELECTRICITY DISTRIBUTION DEVELOPMENT
established either by using prices rolled over from the previous regulatory period, or by using a simplified “building block” methodology.2 The Act forbids the use of benchmarking methodologies in this context.
During the regulatory period, distributors bear the risk that costs and demand differ from forecast levels. The price-quality path regime aims to strengthening the financial incentive on all regulated distributors to improve their efficiency. Under this approach, distributors are rewarded with higher profits if they can control their expenditure. At the end of the regulatory period, the benefits of any efficiency gains are shared with consumers, principally through lower prices.
The price-quality path regime also includes a quality-incentive scheme. Under this scheme, revenue is automatically linked to reliability performance as measured by changes in the average frequency and duration of interruptions compared to predetermined minimum standards. If reliability is better than the standard, then future revenues will increase. Likewise, if reliability is below the standard, then future revenue will be reduced. The maximum risk and reward is limited to 1.0% of regulated revenue. Distributors are deemed to be non-compliant if they fail to meet the reliability performance standard in two out of three consecutive years.
Under the price-quality path regime, the CC is required to introduce incentives or avoid disincentives for distributors to promote energy efficiency and demand-side management under Section 54Q of the Act. In line with the Commerce Act, in 2015, the CC introduced an energy efficiency and demand-side management scheme for distributors, which compensates distributors for foregone revenues. The cap would otherwise have reduced the distributor’s revenues and penalised it for carrying out energy efficiency.
Connection of distributed generation
The connection of distributed generation was originally regulated in the Electricity Governance (Connection of Distributed Generation) Regulations and became effective in August 2007 to facilitate the connection of distributed generation. These regulations have since been incorporated in the Electricity Participation Code (the Code) maintained by the Electricity Authority (EA). Part 6 of the Code now provides regulated terms for the relationship between a distributor and a distributed generator (DG). The Regulations mandate the application and approval process between the prospective generator and the distribution company. The Regulations also provide default terms of connection, dispute resolution processes and pricing principles, though all these can be set aside by mutual agreement of the parties.
Distribution services use
New connections are made in accordance with a distributor’s connection policies. These are not regulated. However, there are connection arrangements within the scope of the Code. Most distributors use an interposed model, whereby the distributor contracts with the retailers trading on its network. The retailer contracts with end-consumers. Most connected consumers have no relationship with the distributor. The EA has in place a model (voluntary) use-of-system agreement (UoSA, interposed). Certain provisions of the UoSA are mandated in the Code. Distributors generally contract directly with large
2 See Economic Insights (2014) for an overview of the “building block” methodology.
© O
ECD
/IEA,
201
7

7. SPECIAL FOCUS 2: ELECTRICITY DISTRIBUTION DEVELOPMENT
135
PAR
T I.
ENER
GY
SEC
UR
ITY
SUM
MAR
Y
consumers for distribution services. The large consumer will often separately contract with a retailer for energy services. Two distributors use a conveyance model, whereby they contract with the end-consumer for distribution services. Distributors are required under the Code to negotiate a use-of-system agreement with retailers in good faith. That is, they are required to be willing to make an agreement.
In addition, the EA has recently proposed to extend the distribution sector regulatory framework through a default distribution use-of-system agreement. This proposal seeks to standardise such agreements by updating and making mandatory an existing set of model terms and conditions. The aim is to reduce entry barriers, transaction costs, and potential for distributors to use their use-of-system agreements to stifle retail competition and innovation. The proposal has a default set of core conditions which establish the standard terms and conditions that must be included in each distributor’s agreement with retailers. It also incorporates customised operational requirements that reflect each distributor’s business arrangements and operating practices.3
Recent performance trends
Figure 7.1 shows that the nominal rate of return4 achieved by distributors between 2013 and 2015 varied considerably from between 2.64% and 8.70%. Real returns for regulated distributors were generally within 1.0 per cent of forecast returns. Returns for exempt distributors were comparable to those achieved by regulated distributors, though the range of returns achieved was narrower for regulated entities over the period. The Commerce Commission (CC) notes that consumer ownership can be expected to exert some discipline on exempt distributors’ revenues and profits, and that this is reflected in the results (Commerce Commission, 2016a).
Figures 7.1 and 7.2 show that all distributors achieved growth in nominal lines revenue between 2013 and 2015, with a much larger range of revenue growth of between 3.0% and 31.5%. The dispersion of results suggests that exempt distributors may have achieved higher rates of growth in revenues than regulated distributors. Two-thirds of the exempt distributors (8 out of 12) recorded growth in revenues above the median of 10.8%, while nearly two-thirds of the regulated distributors (11 out of 17) recorded growth in revenues below or equal to the median performance over the period.
These results also reflect a reset of the regulatory parameters for some distributors to address the potential for excess profits and losses. Overall, it appears that revenues and returns have been sufficient to underwrite effective operational and investment outcomes over the period.5
Figure 7.3 shows the rate of change in distributors’ annual operating and capital expenditures between 2008-12 and 2013-15. Most distributors recorded an increase in operating and capital expenditures over the period, including some very substantial increases.
3 See Electricity Authority (2016a) for further details. 4 Commerce Commission (2016a) notes that the nominal returns for each distributor reflect the real return plus compensation for inflation in the form of asset revaluations. 5 See Commerce Commission (2016a) for further discussion of the 2012 regulatory reset.
© O
ECD
/IEA,
201
7

7. SPECIAL FOCUS 2: ELECTRICITY DISTRIBUTION DEVELOPMENT
136
Figure 7.1 Distributors’ nominal internal rate of return, 2013-15
0123456789
10
Scanp
ower
Electr
a
Netw
ork Tasm
an
Alpine
Energy
Welling
ton E
lectricit
y
Nelso
n Ele
ctricity
MainP
ower
NZ
Coun
ties P
ower
OtagoN
et
Orion
NZ
Powe
rco
Vecto
r Line
s
Electr
icity
Ashb
urton
Waip
a ne
twork
Uniso
n Ne
twork
s
Electr
icity
Inverc
argill
Horiz
on E
nergy
Auror
a En
ergy
WEL
Netw
orks
North
powe
r
Eastlan
d Ne
twork
Top
Energ
y
Centr
alines
The Lin
es Co
mpan
y
The Po
wer C
ompa
ny
Buller E
lectricit
y
Netw
ork W
aitak
i
West
powe
r
Marlb
orou
gh Line
s
% p
.a.Customised price-quality pathInformation disclosure onlyDefault price-quality path
Note: The nominal internal rate of return for all distribution businesses calculated over the 3-year period from 2013 to 2015. Sources: Commerce Commission (2016a), Profitability of Electricity Distributors Following First Adjustments to Revenue Limits; Commerce Commission (2015), Electricity Distributors Information Disclosures – 2013-2015.
Figure 7.2 Rate of growth in revenues, 2013-15
0
5
10
15
20
25
30
35
Alpine
Energy
Netw
ork W
aitak
i
Uniso
n Ne
twork
s
Orion
NZ
Electr
icity
Ashb
urton
MainP
ower
NZ
Coun
ties P
ower
Centr
alines
Marlb
orou
gh Line
s
OtagoN
et
Welling
ton E
lectricit
y
Netw
ork Tasm
an
Scanp
ower
Electr
a
Powe
rco
The Po
wer C
ompa
ny
The Lin
es Co
mpan
y
Nelso
n Ele
ctricity
Electr
icity
Inverc
argill
North
powe
r
Top
Energ
y
WEL
Netw
orks
Auror
a En
ergy
Buller E
lectricit
y
Waip
a ne
twork
Horiz
on E
nergy
Eastlan
d Ne
twork
West
powe
r
Vecto
r Line
s
%
Customised price-quality pathInformation disclosure onlyDefault price-quality path
Notes: The rate of growth in total line charge revenues between 2013 and 2015. Sources: Commerce Commission (2016a), Profitability of Electricity Distributors Following First Adjustments to Revenue Limits; Commerce Commission (2015), Electricity Distributors Information Disclosures – 2013-2015.
The Commerce Commission6 notes that after accounting for changes in input prices, the variances relating to capital and operating expenditure appear relatively modest at an industry level, though the range of outcomes recorded among individual distributors was considerable. The largest increases in capital expenditure were recorded for smaller distributors, reflecting the capital-intensive nature of the sector and the proportionally greater impact of once-off capital expenditures on their overall expenditure. In some cases the difference reflects the timing of the investment. The annual average level of capital and operating expenditure rose between 2013 and 2015, with seven regulated distributors recording an increase in operating expenditure above 25%, while eight also recorded an increase in capital expenditure of significantly more than 25% over the period.
Distributors are increasingly investing in a range of non-core activities, including commercial property, agricultural assets (e.g. vineyards), and security services to 6 See Commerce Commission (2016a) for further discussion of these issues.
© O
ECD
/IEA,
201
7

7. SPECIAL FOCUS 2: ELECTRICITY DISTRIBUTION DEVELOPMENT
137
PAR
T I.
ENER
GY
SEC
UR
ITY
SUM
MAR
Y
diversify and grow their revenue base. Some exempt distributors are branching into electricity retailing with Buller Electricity’s acquisition of retailer Pulse Energy as a leading example.7 At the same time, some distributors are also beginning to invest in emerging technologies focusing on improving real-time communications and asset management capabilities.8
Figure 7.3 Percentage change in distributors’ average annual expenditure between 2008‐12 and 2013‐15
Operating expenditure
-30-20-100
1020304050
The Lin
es Co
mpan
y
OtagoN
et
Centr
alines
Electr
icity
Ashbu
rton
Eastlan
d Ne
twork
Alpine
Energy
Uniso
n Ne
twork
s
Buller E
lectricit
y
MainP
ower
NZ
Netw
ork W
aitak
i
The Po
wer C
ompa
ny
Vecto
r Line
s
Electr
a
Auror
a En
ergy
Orion
NZ
Westp
ower
Netw
ork Tasm
an
WEL Ne
twork
s
Nelso
n Ele
ctricity
Electr
icity
Inverc
argill
Powe
rco
Scanp
ower
Horiz
on E
nergy
Top
Energ
y
Coun
ties P
ower
Waipa
netw
ork
North
powe
r
Wellin
gton
Electr
icity
Marlb
oroug
h Lin
es
%
Customised price-quality pathInformation disclosure onlyDefault price-quality path
Capital expenditure
-100-500
50100150200250300350400
Nelso
n Ele
ctricity
MainP
ower
NZ
Top
Energ
y
Netw
ork Tasm
an
Eastlan
d Ne
twork
Scanp
ower
Coun
ties P
ower
Orion
NZ
Electr
icity
Inverc
argill
Horiz
on E
nergy
Alpine
Energy
North
powe
r
Waip
a ne
twork
Netw
ork W
aitak
i
OtagoN
et
Buller E
lectricit
y
WEL
Netw
orks
The Po
wer C
ompa
ny
Powe
rco
Electr
icity
Ashb
urton
Vecto
r Line
s
The Lin
es Co
mpan
y
Uniso
n Ne
twork
s
Welling
ton E
lectricit
y
Electr
a
Auror
a En
ergy
Marlb
orou
gh Line
s
Centr
alines
West
powe
r
%
Customised price-quality pathInformation disclosure onlyDefault price-quality path
Note: Operating expenditure includes pass through and recoverable costs. Source: Commerce Commission (2016a), Profitability of Electricity Distributors Following First Adjustments to Revenue Limits.
Between 2010 and 2015, the average number of interruptions experienced by distributors ranged between 0.7 and 5.6 interruptions per connection per year, while their average duration ranged from 41 to 722 minutes per connection per year. More detailed information on the frequency and duration of interruptions for each distributor over the period is presented in the Chapter 5 on electricity (Figure 5.16 and Figure 5.17).
7 See Pulse Energy (2015) for further details. 8 See Auditor General (2016) for further discussion of these investment trends.
© O
ECD
/IEA,
201
7

7. SPECIAL FOCUS 2: ELECTRICITY DISTRIBUTION DEVELOPMENT
138
Figure 7.4 Trends in the frequency and duration of distribution system interruptions
Percentage change in SAIFI between 2003-10 and 2011-15a
-40
-20
0
20
40
60
80Or
ion N
Z
MainP
ower
NZ
Wellin
gton
Electr
icity
Scanp
ower
Buller E
lectricit
y
Westp
ower
Horiz
on E
nergy
Eastlan
d Ne
twork
Electr
icity
Ashbu
rton
Nelso
n Ele
ctricity
Alpine
Energy
Coun
ties P
ower
Netw
ork Tasm
an
Electr
icity
Inverc
argill
Auror
a En
ergy
Top
Energ
y
OtagoN
et
The Lin
es Co
mpan
y
Uniso
n Ne
twork
s
The Po
wer C
ompa
ny
Vecto
r Line
s
Electr
a
North
powe
r
Powe
rco
WEL Ne
twork
s
Netw
ork W
aitak
i
Marlb
oroug
h Lin
es
Centr
alines
Waipa
netw
ork
%
Customised price-quality pathInformation disclosure onlyDefault price-quality path
Percentage change in SAIDI between 2003-10 and 2011-15b
-100
-50
0
50
100
150
200
250
Buller E
lectricit
y
MainP
ower
NZ
Orion
NZ
Welling
ton E
lectricit
y
Vecto
r Line
s
Top
Energ
y
West
powe
r
Electr
icity
Inverc
argill
Auror
a En
ergy
The Po
wer C
ompa
ny
Coun
ties P
ower
Alpine
Energy
Scanp
ower
Horiz
on E
nergy
Netw
ork Tasm
an
Eastlan
d Ne
twork
Uniso
n Ne
twork
s
WEL
Netw
orks
Powe
rco
Marlb
orou
gh Line
s
OtagoN
et
Waip
a ne
twork
Nelso
n Ele
ctricity
Centr
alines
North
powe
r
The Lin
es Co
mpan
y
Electr
icity
Ashb
urton
Electr
a
Netw
ork W
aitak
i
%
Customised price-quality pathInformation disclosure onlyDefault price-quality path
Notes: a. The System Average Interruption Frequency Index (SAIFI) represents the average number of all planned and unplanned outages per year per customer. Results have not been normalised to account for major events beyond the control of a distributor such as outages due to major storms, floods or earthquakes. The figure shows the percentage change in the annual average number of interruptions per connection between 2003‐10 and 2011‐15. b. The System Average Interruption Duration Index (SAIDI) represents the average number of minutes lost per year per customer from all planned and unplanned outages. Results have not been normalised to account for major events beyond the control of a distributor such as outages due to major storms, floods or earthquakes. The figure shows the percentage change in the annual average number of minutes lost per connection between 2003‐10 and 2011‐15. Source: Commerce Commission (2016a), Profitability of Electricity Distributors Following First Adjustments to Revenue Limits.
Figure 7.4 shows trends in the frequency and duration of service interruptions among distributors as measured by changes in the System Average Interruption Frequency Index (SAIFI) and System Average Interruption Duration Index (SAIDI)9 recorded during 2003-10 and 2011-15.
9. SAIFI measures the average number of unplanned interruptions a distribution system experiences per customer per year, while SAIDI measures the average number of minutes a power system will experience loss of supply due to unplanned interruptions per customer per year.
© O
ECD
/IEA,
201
7

7. SPECIAL FOCUS 2: ELECTRICITY DISTRIBUTION DEVELOPMENT
139
PAR
T I.
ENER
GY
SEC
UR
ITY
SUM
MAR
Y
Eighteen distributors experienced fewer interruptions, while only four experienced a significant increase in the frequency of interruptions over the period. There were no discernible systemic differences in the frequency of interruptions between regulated and exempt distributors over the period. Conversely, 19 distributors experienced an increase in the duration of interruptions, with four experiencing substantial increases of between 100% and 200% over the period. Again, there were no discernible systemic differences in the duration of interruptions between regulated and exempt distributors.
It should be noted that Orion NZ’s performance reflects the operational challenges it has faced in the wake of the earthquakes that devastated Christchurch and the Canterbury region in 2010 and 2011. Many of the observed variations in reliability performance may reflect underlying differences in the characteristics of each network, which are a function of variations in network design, network topography and the composition of consumer connections. As a result, it would be problematic to draw more substantive comparisons between distributors on the basis of this information. That said, the Commerce Commission has concluded that the reliability of regulated distributors was similar to the past, with changes in average reliability generally consistent with natural variability (Commerce Commission, 2016a).
Five regulated distributors failed to meet their reliability performance standards in two out of three consecutive years between 2010 and 2015. Warning letters were issued in three cases, while the response to the remaining two cases is yet to be determined.
Emerging policy issues
Electricity distribution has traditionally been a relatively passive activity, characterised by very predictable, unidirectional power flows from remotely located generators to local loads, and by stable business and operational relationships typically involving no more than a few retailers, the transmission system operator (TSO) and the regulator. The role of distributors has been clearly understood within this framework, focusing on efficient and reliable local distribution system management and related network planning and investment. However, the combination of market liberalisation and decarbonisation policies have given rise to a range of innovative technologies, products and services which have the potential to fundamentally transform the nature of distribution and the role of distributors.
Liberalisation has encouraged the development of more innovative products and services, including various forms of real-time pricing, retail aggregators, demand response and more efficient energy use, which has the potential to fundamentally change the nature of power flows on distribution systems. In particular, these developments could result in more dynamic real-time power flows, creating new operational challenges for distributors. Rapid deployment of advanced interval metering and the emergence of energy management systems and other controllable devices could serve to accelerate this trend.
At the same time policies to promote decarbonisation across IEA member countries are for the first time bringing forward the large-scale deployment of various technologies at the distribution level, including distributed generation such as rooftop solar photovoltaic power systems, battery storage and electric vehicles. The deployment of these technologies has the potential to greatly complicate the management and operation of distribution systems while magnifying the real-time volatility of power flows at the distribution level.
© O
ECD
/IEA,
201
7

7. SPECIAL FOCUS 2: ELECTRICITY DISTRIBUTION DEVELOPMENT
140
In addition, these technologies, products and services have the potential to fundamentally change the business and regulatory models that have traditionally underpinned distribution activities. In particular, evidence is emerging of a potential “death spiral” associated with traditional volumetric-based pricing models which may result in under-recovery of regulatory revenues where substantial volumes of distributed generation are present.10 This raises concerns about the capability of distributors to maintain their financial viability as the transition develops. It also raises concerns regarding the capacity of distributors to meet new operational and investment challenges, especially those associated with this emerging transformation. No existing distribution system has been designed to be used in this way or to accommodate the innovative products and services that may result from the deployment of these technologies. IEA experience suggests that most distributors are generally not well prepared to respond to these challenges.
Some of the key preconditions for the transformation of the distribution sector are beginning to emerge in New Zealand. These include the rapid deployment of advanced interval metering, the development of innovative retail products and services, and rapid growth in rooftop solar photovoltaic generation, albeit from a very low base.11 If IEA experience is any guide, then New Zealand could expect to experience similar challenges as this transformation progresses. Several distributors have registered growing concern about the revenue and cost risks posed by distributed generation,12 with one distributor responding by increasing connection charges for all new residential rooftop solar systems and batteries installed within its service area from 1 April 2016.13
Policy makers have an opportunity at this early stage of the transition to consider how best to address these challenges and to prepare for the potential changes that may occur, for example; and to assess whether change is needed in legal/regulatory frameworks. 10 The “death spiral” phenomenon refers to the diminishing capacity of distributors to recover regulated returns as the volume of distributed generation increases. As consumers switch to distributed generation, fewer remain from which distributors can recover regulated revenues. Distributors have typically responded by increasing average distribution charges, which has encouraged more customers to invest in distributed generation, resulting in further increases in distribution charges for the remaining customers and an ever dwindling customer base from which to recover regulated revenues – the death spiral. This phenomenon has been observed in Europe, North America and Australia in distribution systems where large volumes of distributed generation have been deployed. See Costello (2016), Borenstein and Bushnell (2015) and Simshauser (2014) for further discussion. 11 See Electricity Authority (2015) for further information on advanced interval metering deployment, and the Electricity Authority dashboard for the current status of rooftop solar photovoltaic deployments in New Zealand, which can be viewed at (www.emi.ea.govt.nz/Reports/Dashboard?reportName=5YPBXT&categoryName=Retail&reportDisplayContext=Dashboard). See the Consumer Powerswitch website for further information on the range of retail products and services emerging in the New Zealand electricity market (www.powerswitch.org.nz/powerswitch). 12 Auditor General (2016) notes that distributors “remarked on their concern about the effects of disruptive technologies, particularly consumer solar generation, on their activities and especially on their revenue and operating costs. In particular, they noted that the costs of maintaining connections to on-site solar generation users are greater than those for regular connections, because the overall network electricity usage of on-site consumers was lower” (p. 23). 13 Unison Energy announced extra connection charges would apply to all new rooftop solar photovoltaic systems and batteries installed in its service area from 1 April 2016, noting that its current residential network service costs are around NZD 900 per year per customer and that customers with rooftop solar systems typically reduce their distribution use of system payments by around NZD 300 per year, leaving other customers to pay the additional costs. Unison Energy is considering raising residential distribution charges by around NZD 150 per year per customer for the remaining customer base to help cover the shortfall. For further details see Unison Energy (2016) which is available for download at: www.unison.co.nz/tell-me-about/news/article/2016/03/31/unison-s-new-dg-price-category-ensures-fairness-for-all-customers, and Radio New Zealand (2016) which is available for downloaded from www.radionz.co.nz/news/regional/300397/new-solar-panel-charge-kicks-in.
© O
ECD
/IEA,
201
7

7. SPECIAL FOCUS 2: ELECTRICITY DISTRIBUTION DEVELOPMENT
141
PAR
T I.
ENER
GY
SEC
UR
ITY
SUM
MAR
Y
Distributors will need to respond to these challenges in a timely and effective manner if a successful transition is to be achieved. An incentive structure that encourages distributors to respond in a timely and efficient way to the business, investment and operational challenges and opportunities as they emerge during the transition will be crucial for success. This will require a comprehensive and integrated policy and regulatory approach that aims to reinforce commercial incentives for efficient, timely, cost-effective and innovative operational and investment decisions. New Zealand has a substantial and effective policy, institutional and regulatory arrangements in place, and should look to build on this foundation. Key areas for further consideration include:
ensuring that the governance framework adequately reflects the changing nature of distribution and role of distributors as the transition progresses
strengthening the incentives for timely and efficient organisational and structural development of the distribution sector
ensuring that the regulatory framework can adapt in a timely and effective manner so that it can continue to complement and reinforce incentives established by the governance and structural arrangements for timely, innovative, efficient, prudent and cost-effective distributor responses.
Strengthening the governance framework
Effective incentives will be required to encourage distributors to respond in a timely and efficient manner to the emerging challenges. Successful incentive structures are built on sound governance principles that clearly align responsibilities and accountabilities with the role and function of each party, so that those parties that are best able to manage a risk or function at least cost have the authority, means and incentive to act, and are held accountable for their actions.
As previously noted, liberalisation and decarbonisation policies are stimulating the deployment of an array of new products, services and technologies which have the potential to fundamentally change the nature of distribution system operation, use and development. These changes also have the potential to transform the role and function of distributors, with a greatly increased focus on real-time, active system management and operation. They also raise a range of challenges for distributors, and for policy makers, around the nature of their evolving role and the extent to which they can and should participate in the emerging product and service markets associated with this transition, especially given their natural monopoly nature and the public good characteristics of some of the services they provide.
In general terms, two distinct business models appear to be emerging:14
The value-adding services model whereby utilities seek to exploit new and emerging technologies to provide additional revenue streams to supplement their regulated cash flows. Examples include distributors branching into ownership of rooftop solar panels, energy efficiency, retailing and electric vehicle plug-in stations.
14 See Costello (2016) for further discussion.
© O
ECD
/IEA,
201
7

7. SPECIAL FOCUS 2: ELECTRICITY DISTRIBUTION DEVELOPMENT
142
The platform for services model whereby distributors act as neutral facilitators providing the information, system operation, network infrastructure and management functions necessary to support the development and delivery of reliable and innovative products and services by competitive retailers and aggregators.
New Zealand’s decision to physically unbundle distribution and retailing activities in the late 1990s created a distribution sector structure that had the potential to efficiently and cost-effectively transit into a platform for services model. However, the 2010 policy changes which, among other things, introduced the potential for limited reintegration of retail and distribution activities appear to signal a fundamental policy shift in relation to distribution and retail unbundling that could result in a sectoral structure more consistent with the value-adding services model. This policy shift could have significant implications for the evolution of distributor roles and functions, and for the timely and efficient development of the distribution and retail sectors as the transition progresses.
Concerns have been raised about the competitive neutrality implications of the value-adding services model, and its potential to unduly distort timely and efficient retail market development. In particular, allowing distributors to compete to provide retail products and services without effective regulatory constraints could open the way for abuse of their natural monopoly position, possibly reflected in various forms of discrimination, market foreclosure and cost-shifting. It could also slow and limit the degree of retail-level innovation given the generally weaker incentives for natural monopolies to pursue potentially risky business activities.
There are emerging concerns with regulated distribution businesses being able to compete in unregulated parts of the sector. The most obvious is battery technologies, which enable a distributor to defer/avoid line investment but can also be used to sell electricity into the wholesale and ancillary services market. There is potential here to create an “unlevel” playing field and undermine competition, which in the case of New Zealand could have serious ramifications. In particular, rapid technology change and uptake problems in this regard could be exploited rapidly and it may be hard to “turn back the clock”.
By comparison, the platform for services model could support more efficient and transparent transactions between multiple market participants, thereby increasing competition and innovation, reducing transaction costs, and facilitating greater harnessing of benefits resulting from the more effective integration of a diverse range of suppliers and new technologies. Furthermore, it maintains a more effective separation of contestable and natural monopoly functions, resulting in a more coherent set of commercial incentives for distributors consistent with the principles of sound governance and efficient delivery of their core functions. It is also likely to strengthen the effectiveness of the regulatory regime and simplify its ongoing application and development.15.
As a result, the Council of European Energy Regulators (CEER) has concluded that distributors should focus on becoming “neutral facilitators” of transparent and competitive retail markets that can bring forward innovative products, services and technologies in a
15 See EC Think (2013) and CEER (2014) for further discussion of the issues associated with the evolving role and function of distributors.
© O
ECD
/IEA,
201
7

7. SPECIAL FOCUS 2: ELECTRICITY DISTRIBUTION DEVELOPMENT
143
PAR
T I.
ENER
GY
SEC
UR
ITY
SUM
MAR
Y
timely and cost-effective manner16. This conclusion has been strongly supported by the European Commission in the context of the next phase in the development of the European Union’s internal electricity market design.17
To date, most European industry stakeholders have registered in-principle support for the neutral facilitator model.18 New Zealand policy makers are encouraged to carefully consider the longer-term implications of weakening distribution and retail unbundling for timely, efficient and cost-effective development of the distribution and retail sectors, and especially for the likely evolution of distributors’ roles and functions as the transition progresses.
Implementation of the platform for services model can be expected to raise a range of challenges, including: ensuring efficient and timely information management and access; developing the infrastructure, resources and expertise needed to successfully function as an active distribution system operator; developing an effective framework for managing multiple retailers and aggregators, potentially including “prosumers”; and developing effective operational co-ordination and communication with the transmission system operator, and other distribution system operators as required.
Governance arrangements will need to be able to accommodate any fundamental structural and market changes that may occur in a manner that delivers appropriately co-ordinated operation and development of a more efficient, resilient and flexible distribution system. They also need to support the timely development of standards and practices, which reflect changes in the pattern of investment, operation and end-use, including supporting the integration of new technologies, such as distributed renewable generation and “smart grid” infrastructure where it is prudent and cost-effective to do so.
Addressing these challenges raises a range of legal, regulatory and structural issues. It also raises questions about the nature, development and application of rules and standards governing distribution system operation and development, and how regulatory arrangements and markets can be better integrated to help support a more effective transition at least cost.
IEA experience highlights the failings of poorly defined governance arrangements and the importance of clarifying roles, responsibilities and accountabilities within a legal framework that provides comprehensive coverage and enables effective enforcement. Policy makers are encouraged to closely monitor and review the operation of the legal and regulatory framework governing the distribution sector to ensure that it continues to support timely and efficient outcomes as the transition progresses. Key elements to consider include the degree to which it continues to:
clarify individual and shared responsibilities for distribution system operation and development
align accountabilities with the new functional responsibilities resulting from the transformation
16 See CEER (2014 and 2015) for further discussion. 17 See European Commission (2015) consultation on the new market design. 18 See European Commission (2016) for a summary of preliminary results from the initial public consultation on electricity market design, including initial industry responses to the neutral facilitator concept.
© O
ECD
/IEA,
201
7

7. SPECIAL FOCUS 2: ELECTRICITY DISTRIBUTION DEVELOPMENT
144
ensure that the boundaries of authority to act are specified for each party, and that parties have sufficient legal authority to undertake their responsibilities within those boundaries
provide strong incentives for effective co-ordination and information exchange, reflecting the shared nature of responsibility for aspects of distribution system operation and development in an unbundled electricity system
encourage transparency and objective decision making to help improve management of system operation, and to help strengthen responses to regulatory and price-based signals for efficient, timely and innovative investment, operation and end-use over time
strengthen coverage, accountability and enforcement, where necessary, to help reinforce incentives for timely and efficient responses among all key distribution sector participants
appropriately balance market requirements for distribution services with system security and operational requirements to ensure a continuation of access to reliable and affordable electricity services.
Policy makers and regulators face the challenge of how to respond to these new and evolving roles and activities as they emerge within distribution systems. There are considerable risks associated with adapting the legal and governance framework, given the substantial uncertainty around the nature and timing of this transformation. Hence an incremental and proportional approach may be the most appropriate way to proceed. As roles and functions change, or new ones emerge, it will be important to ensure that they are appropriately allocated among distribution sector participants.
CEER has undertaken extensive research and stakeholder consultation into these matters over the last couple of years, culminating in the development of a conceptual framework to assist policy makers and regulators to determine how to allocate roles and functions among distribution sector participants in a coherent and effective manner that can support timely and efficient sector development as the transition progresses.19
The key principles proposed to guide decision makers in this context include:
Distributors should operate in a way which reflects the reasonable expectations of network users and other stakeholders, including new entrants, and in relation to new business models, now and in the future.
Distributors must act as neutral market facilitators in undertaking core functions.
Distributors must act in the public interest, taking account of the costs and benefits of different activities.
Consumers own their data and this should be safeguarded by distributors when handling data.
Figure 7.5 summarises the decision-making model proposed by CEER. The model divides roles and functions into three main categories: i) core regulated activities; ii) activities allowed with justification subject to conditions; and iii) competitive activities from which distributors should be excluded. 19 See CEER (2014 and 2015) for further details.
© O
ECD
/IEA,
201
7

7. SPECIAL FOCUS 2: ELECTRICITY DISTRIBUTION DEVELOPMENT
145
PAR
T I.
ENER
GY
SEC
UR
ITY
SUM
MAR
Y
Generally, potentially competitive activities are not allocated to distributors under this model, reflecting the desire to maintain an effective separation of competitive and monopoly functions. The model allows for the allocation of contestable functions to distributors where there is a clear justification, possibly based on benefit-cost analysis, and strong conditions or regulator controls such as transparency requirements, and rules limiting the nature, scope and period of involvement. Conditions imposed should ensure that distributors cannot abuse their monopoly position to delay or foreclose the development of competitive product and service markets.
CEER notes that there may be cases where allocating a role or function to a distributor for a transitional period may provide the most cost-effective option for helping to accelerate efficient market development (CEER, 2015). There may also be some aspects of particular activities undertaken by other parties where distributors will continue to have some input to ensure the integrity of network and system operations. The model has been designed to help policy makers and regulators deal with emerging “grey areas for distributor participation, including energy efficiency advice, demand response, distributed generation and storage services, and engagement with end consumers, including data management.20 CEER considers that the more distributors are involved in non-core activities, the greater the need for regulatory control or structural separation. As markets develop, CEER envisages that distributors’ participation in potentially contestable activities should diminish.
Distributors could play a catalytic role in helping to accelerate the development of markets for some of these services. However, care needs to be exercised to ensure that this does not occur at the expense of efficient, competitive and innovative wholesale/retail/ancillary services market operation. One option, consistent with the CEER approach, would be to permit distributors to be purchasers rather than providers of these services. This could be achieved by introducing performance-based incentives that encourage distributors to purchase these products as part of their ancillary services procurement where it is prudent and cost-effective to do so. The price-quality path framework incorporates provisions requiring distributors to consider energy efficiency and demand-side management options, which could be enhanced to support innovative ancillary services procurement.
The European Union has embarked on a substantial policy and regulatory process to develop the Union’s internal electricity market design, which includes investigating the evolving roles and functions of distributors as electricity markets decarbonise, and further developing the neutral facilitator concept. At this stage, the next round of publications is expected to be released by the end of 2016.21 New Zealand policy makers could consider adopting an approach similar to that proposed by CEER to help inform their decision making around the evolving role and function of distributors as the transition progresses, especially in relation to “grey” areas such as demand response, energy efficiency, distributed generation, storage and data management.
20 See Meeus and Hadush (2016) for further discussion of these issues. 21 See https://ec.europa.eu/energy/en/consultations/public-consultation-new-energy-market-design for further information on the European Commission market design program, and CEER (2015) for the key priorities and milestones reflected in CEER’s Distribution Working Group’s forward work programme.
© O
ECD
/IEA,
201
7

7. SPECIAL FOCUS 2: ELECTRICITY DISTRIBUTION DEVELOPMENT
146
Box 7.1 Changing business and regulatory models for distribution system operators (DSOs) Sweden has around 170 distribution system operators of which around three-quarters are municipality-owned, while the other DSOs are owned by large utilities who own both the retail and distribution companies (which are legally unbundled). The main three DSOs — Vattenfall, E.ON and Ellevio (previously Fortum) — supply over half of the Swedish customers. The municipality-owned DSOs are usually small and do not fall under the EU legal obligation to unbundle legally and functionally (de minimis rule). However, all Swedish DSOs are legally unbundled. Their main business is the distribution network operation and some small retail activity in their distribution region. Following deregulation in Sweden and the introduction of legal unbundling of generation/supply and network operations, the number of DSOs had come down from about 250 by the time of deregulation (1996) to 170 today. Many local DSOs have merged for reasons of geography of network coverage, and mergers and acquisitions of distribution companies are still ongoing. Recently, some of the larger utilities have decided to become more specialised. Fortum sold all its DSO business in Sweden to Ellevio which now has become a large DSO, next to Vattenfall. On the contrary, E.ON decided to manage renewable generation, and electricity distribution in one company and traditional generation in another. The market is in flux and the industry is working on new market models adjusting to a new electricity market design. Across the Nordic market, regulators have been working on a common retail market for several years. The model is based on the supplier (not the DSO), who should act as an interface with all the customers and the DSO. The supplier will be responsible for billing also the DSO charge and all information will be gathered at a country-wide data hub to which the supplier notifies consumer switches, moving, etc. The DSO has to submit the consumer data to the hub and cannot access any retail information. Denmark has introduced the common data hub, while Norway is preparing the introduction in early 2017 and Sweden tentatively in 2018.
Market share of the DSOs in Sweden, 2014
0%
10%
20%
30%
40%
50%
60%
70%
80%
90%
100%
Market share
Others
E.ON
Vattenfall
Ellevio
© O
ECD
/IEA,
201
7

7. SPECIAL FOCUS 2: ELECTRICITY DISTRIBUTION DEVELOPMENT
147
PAR
T I.
ENER
GY
SEC
UR
ITY
SUM
MAR
Y
In the “Clean Energy Package for All”, the European Commission presented in November 2016 a comprehensive package of measures for a new market design in the EU (European Commission, 2016). The proposals make a strong push in favour of scarcity pricing, and the phase-out of price retail regulation, in line with effective energy and carbon markets. National capacity remuneration mechanisms (CRMs) are brought under common principles, an EU wide assessment of generation adequacy. This is a major improvement from previously nationally determined approaches and can hopefully reduce market distortions in the EU internal energy market in the coming decade.
The EC defines a new role for active consumers and distribution system operators as neutral market facilitators, which also can support energy efficiency action. The vison of an active consumer is clearly enforced through the proposed EU rules. The consumer receives the right to generate, store, consume, and sell self-produced electricity to organised markets, either individually or through aggregators. This will require a significant reform of distribution tariffs and the creation of a regulatory regime for technology neutral storage (through the collaboration among national regulators) which does not exist in the EU.
Figure 7.5 CEER model for allocating roles and functions among distribution sector participants
DSO: distribution system operator. Source: CEER (2015)
Facilitating efficient organisational and structural development
IEA experience suggests that effective organisational and structural arrangements can help to reinforce incentives for timely and efficient commercial behaviour established by the legal and regulatory regime. Organisational and structural arrangements should aim to combine roles and functions in a manner that improves transparency and minimises potential conflicts of interest, especially those that could unduly influence distribution system operation and management, leading to more expensive and less secure outcomes. Effective separation of system operation and network functions from
© O
ECD
/IEA,
201
7
7. SPECIAL FOCUS 2: ELECTRICITY DISTRIBUTION DEVELOPMENT
148
contestable functions has proven to be a key foundation for strengthening incentives for more transparent, non-discriminatory and commercially prudent behaviour.
Organisational and structural arrangements may substantially influence the performance and development of the distribution sector in New Zealand as it enters a period of potentially fundamental change. At present, New Zealand’s distribution sector has a relatively large number of small distributors, many of which are constituted as community-owned trusts. The Controller and Auditor General recently concluded that those responsible for governing distributors generally possess the appropriate skills and experience to manage their core activities (Auditor General, 2016).
However, the nature of ownership and organisational governance, and the degree of fragmentation of the sector, have given rise to a range of concerns about its capacity to deliver timely and efficient outcomes. In particular, concerns have been raised about the sector’s capacity to effectively harness efficiencies associated with economies of scale, and to quickly and effectively respond to the fundamental sector transformation which may result from the deployment of distributed generation technologies and changing patterns of network use.
These concerns have been magnified by recent investments in non-core assets by some community-owned trusts and local authority-owned distributors. For example, in July 2015 Marlborough Lines announced its purchase of an USD 62 million (80%) stake in the Yealands Wine Group, which is the largest wine producer in the Marlborough region and a major wine exporter. The Chairman of the Marlborough Electricity Power Trust described the investment as fitting “well with the objectives of Marlborough Lines for the future: to make long-term investments which will produce income which can be returned to the consumers of Marlborough Lines.”22 Similarly, the Controller and Auditor General’s report into the failed commercial property investments undertaken by Delta Utility Services Limited (a business unit of Aurora Energy) revealed significant failures of corporate governance and an imprudent investment strategy which had resulted in losses estimated at around USD 6.1 million.23 The Controller and Auditor General recently concluded that distributors are increasingly investing in non-core activities in an effort to increase cash flows and profitability, and that these activities potentially expose distributors to substantial business risks which many may be ill-equipped to manage.24
Recent research on aggregate productivity growth in the sector between 1996 and 2014 indicates that larger privately-owned and regulated distributors experienced greater productivity growth than the sector average, with total factor productivity (TFP) growth increasing by around 0.2% per year over the period, compared to zero growth for the industry as a whole.25 Figure 7.6 summarises the results.
These findings may suggest that larger, privately-owned distributors are more efficient, which might lend some weight to the concerns raised to date. However, the analysts did not consider the difference to be material.26 There are likely to be several other factors 22 See Marlborough Line (2015) for further details. 23 See Auditor General (2014) for further details. 24 See Auditor General (2016) for further discussion of the nature and scale of non-core investments. 25 See Economic Insights (2014) for further details. 26 Economic Insights (2014) notes that “The non-exempt EDBs (electricity distribution businesses) in aggregate have thus exhibited marginally stronger TFP and partial productivity growth across each of the three time periods examined – 1996 to 2014, 1996 to 2004 and 2004 to 2014 – than has the distribution industry as a whole. However,
© O
ECD
/IEA,
201
7

7. SPECIAL FOCUS 2: ELECTRICITY DISTRIBUTION DEVELOPMENT
149
PAR
T I.
ENER
GY
SEC
UR
ITY
SUM
MAR
Y
that could help to account for the observed differences, including the condition of assets, the growth in new connections, and the geographic characteristics of each network. These issues would need to be more carefully examined before drawing any more definitive conclusions. The IEA understands that further work may be commissioned to investigate these matters. However, concerns remain over whether the sectors’ organisational and structural arrangements provide the most effective foundation for tackling the emerging challenges. It is likely that substantial new investment will be required, especially in “smart grid” technologies, to support more active real-time monitoring and management of distribution systems. This could potentially include substantial investments in data acquisition and management infrastructure, real-time systems analysis capability and a range of other operational resources required to effectively function as a distribution system operator.
Figure 7.6 Regulated (non-exempt) distributors, distribution sector and economy TFP indices, 1996-2014
0.9
1
1.1
1.2
1.3
1996 1997 1998 1999 2000 2001 2002 2003 2004 2005 2006 2007 2008 2009 2010 2011 2012 2013
Index
EDB Industry TFP#1
Non-exempt EDB TFP#1
SNZ Economy MFP
Non-exempt EDB TFP#4
EDB Industry TFP#4
Notes: EDB: electricity distribution business. MFP: Multifactor Productivity. SNZ: Statistics New Zealand. TFP: total factor productivity. Non-exempt and industry TFP uses a two-output specification: Customer numbers (46%); circuit length (54%), output cost shares are in brackets. Input specification: operating expenditure; overhead lines; underground cables; transformers; and other capital. Sources: Economic Insights (2014); Statistics New Zealand (2014).
In addition, new business management systems may be required to support the increased level of engagement with distribution system users, including an increasing number of retailers, aggregators and possibly “prosumers”27 with a greater range of products and services. Real-time co-ordination and communication capabilities may need to be enhanced, especially with the transmission system operator and possibly with other distributors, reflecting the more dynamic and increasingly multidirectional nature of power flows within and between distribution systems and the transmission system. As a result, more effective and coordinated real-time system planning and management is likely to be required to ensure that reliable and secure electricity services are maintained at the distribution level over time. The EA has started work and is investigating these issues as part of its work programme (Electricity Authority, 2016).
the difference in growth rates is not large and decisions regarding the setting of the X factor and what opex partial productivity growth rate to use in forming opex forecasts for the next regulatory period should be relatively robust to whether results for the industry as a whole or non-exempt EDBs in aggregate are used” (p. 29). 27 “Prosumers” refer to distributed generators who both consume grid-supplied electricity and produce electricity which is subsequently supplied to other consumers through a distribution (and potentially a transmission) system.
© O
ECD
/IEA,
201
7
7. SPECIAL FOCUS 2: ELECTRICITY DISTRIBUTION DEVELOPMENT
150
These changes may happen rapidly and may require a quick and substantial response. Distributors may need to secure substantial investment capital and be able to deploy it in a timely and efficient manner to meet the emerging challenges. They may also need to be able to respond quickly and effectively to a rapidly evolving commercial environment. The nature and potential magnitude of this disruption can be expected to place substantial pressure on the resources of distributors and on their financial, technical and managerial capability.
One response would be to pursue a programme of amalgamations. Fewer, larger distributors may be better placed to harness potential economies of scale to achieve more efficient investment and operational outcomes. They are likely to possess greater access to financial resources and stronger cash flows, enabling them to undertake the necessary operational and capital expenditure in a more timely and cost-effective manner. Larger organisations may be able to more efficiently and cost-effectively deploy “smart grid” technologies.
Amalgamation may bring forward more effective management, operating within a more transparent and accountable corporate governance framework that reinforces incentives for more efficient and innovative commercial practice. In particular, larger organisations may be able to consolidate functions in a manner that reduces the costs associated with co-ordinating network management activities with users and other network operators. They may also be able to achieve more effective deployment of limited technical expertise to facilitate more timely, orderly and effective responses to manage potentially rapidly changing patterns of distribution system use.28 Ultimately, a more consolidated distribution sector would lend itself to more comprehensive and effective regulatory supervision, which prima facie would be in the public interest.
However, no official empirical analysis has been undertaken on economies of scale in New Zealand’s distribution businesses, and there is little evidence that small firms are less innovative or perform less well than large ones.
In addition, a programme of sponsored amalgamations is likely to be highly contentious and problematic to implement in practice. The trust model was originally envisaged as a transitional step in a process of moving from local government ownership towards a more corporatised sector structure largely based on private ownership. However, with few exceptions, this transition did not progress beyond community trust ownership. Community-owned trusts appear to have strong support throughout the community, especially in rural areas. Unilateral moves to corporatise and privatise are therefore likely to be strongly resisted and potentially counterproductive at this time.29
An alternative to sector rationalisation could involve adopting more flexible options to improve efficiency and operational performance. For instance, opportunities may exist to extract economies of scale, and to improve investment and operational outcomes through more co-ordinated management and delivery of distribution services. This could be facilitated through regional service and management agreements between distributors. The Controller and Auditor General notes that around a quarter of all 28 Auditor General (2016) notes that “Retaining staff, particularly engineers and technicians, can be difficult for smaller or more remote companies. There can be a high demand for operational and planning expertise in the main centres and, to a lesser extent, further afield.” (p. 21). 29 See ISCR (2012) and Ozbugday (2012) for further discussion.
© O
ECD
/IEA,
201
7

7. SPECIAL FOCUS 2: ELECTRICITY DISTRIBUTION DEVELOPMENT
151
PAR
T I.
ENER
GY
SEC
UR
ITY
SUM
MAR
Y
distributors have subsidiaries that undertake network maintenance, construction and development operations, and that several of these companies also subcontract to other distributors. Perhaps these existing agreements could provide a foundation for developing a more comprehensive approach over time.
Similarly, there may be scope for some distributors to enter into joint-venture arrangements with a designated operating entity formed to manage the assets on behalf of the owners. New Zealand policy makers should encourage the development of more efficient organisational and structural arrangements by the distribution sector in consultation with other key stakeholders as the transition progresses.
It may also be beneficial to consider options to improve community-owned distributors’ governance arrangements, especially around how investment decisions are taken, with a view to making them more transparent and accountable. The Controller and Auditor General recently concluded that distributors need to pay close attention to investment decision making and risk management, particularly in relation to non-core activities. Corporate governance and management arrangements need to be robust, taking into account the diversity of business interests and potential for conflict of interest; while decision makers and managers need to possess appropriate experience and expertise (Auditor General, 2016).
Independent scrutiny of community-owned distributors by the Controller and Auditor General is welcome. However, it only occurs on an ad hoc basis at present. Regular auditing has the potential to improve transparency and accountability, which would help to strengthen incentives for good corporate governance, especially among the community-owned trusts which are exempted from price-quality path regulation. Regular independent auditing by the Controller and Auditor General could also allow it to draw on its considerable expertise to support the development of more effective and responsive corporate governance among community-owned distributors, and to support a culture of continuous improvement which has the potential to significantly improve outcomes for beneficial owners and for consumers in general over time. This could provide a practical alternative to price-quality path regulation in the short term, while helping to prepare community-owned distributors for the transition to a more uncertain and dynamic business and operating environment. Accordingly, policy makers are encouraged to direct the Controller and Auditor General to undertake regular independent audits of all community-owned distributors that are exempt from price-quality path regulation.
The Commerce Commission’s role in analysing and benchmarking performance across the distribution sector is a statutory function which has not been fulfilled to date, but the Commission intends to take it up in the future.
Enhancing regulatory arrangements
Effective regulation is essential for monitoring and enforcing compliance with the rules and standards governing the operation and development of the distribution sector, reflecting the monopoly nature of system operation and network service delivery, and the public-good nature of some of the quality and reliability services that distributors provide. Effective regulatory supervision can assure competing market participants that each distributor’s decisions in relation to system operation and development within their service area are objective, non-discriminatory and comply with relevant rules and standards. This will become increasingly important as localised electricity markets
© O
ECD
/IEA,
201
7

7. SPECIAL FOCUS 2: ELECTRICITY DISTRIBUTION DEVELOPMENT
152
emerge and develop at the distribution level, given that distributors’ investment and operating decisions have substantial commercial consequences for competing market participants, including the potential to adversely affect their behaviour and to compromise efficient, innovative market development.
Regulation of New Zealand’s electricity sector has evolved considerably over the last 20 years into one of the more robust, objective, transparent and effective regulatory regimes among IEA member countries. However, the potentially fundamental changes emerging at the distribution level raise some serious concerns about the ongoing effectiveness of traditional forms of economic regulation and about whether they will continue to deliver efficient, reliable outcomes consistent with public expectations. Opportunities may exist to build on this impressive regulatory regime to improve its capacity to flexibility respond to the challenges that may emerge as the transition progresses. Particular issues that may merit further consideration include: regulatory coverage; the flexibility and responsiveness of economic regulation; and approaches to network pricing.
Regulatory coverage Currently 17 of New Zealand’s 29 distributors are subject to price-quality path regulation, which includes information disclosure requirements, incentive-based economic regulation using a “building block” approach and enforceable quality standards. These are based on performance measured against predetermined system average interruption frequency and duration benchmarks.
The remaining 12 distributors are not subject to economic regulation or enforceable quality standards as they qualify for an exemption as “community–owned” entities under Section 54D of the Commercial Act. A distributor is deemed to be ‘community-owned’ under the Act if it meets all of the following criteria:
all equity in the distributor is held by one or more customer-owned trusts, community-owned trusts or customer-owned co-operatives
the trustees or community shareholders are elected by the distributor’s consumers
at least 90% of the distributor’s customers benefit from income distributions that the distributor or its related trust(s) or co-operative(s) may make from time to time
the distributor serves less than 150 000 installation control points.
Some analysts have suggested that distributors have little incentive to exploit their market power when their owners are also their consumers, and that community ownership may therefore provide a more cost-effective means of regulating distributor behaviour than independent economic regulation, especially for smaller distributors. This may also help to explain the predominance and longevity of community ownership across New Zealand’s distribution sector.30
However, this outcome is critically dependent on the quality and effectiveness of trustee supervision and management, which is likely to reflect the knowledge, expertise, objectivity and independence of the individuals involved. This ownership 30 See ISCR (2012) and Ozbugday (2012) for further discussion.
© O
ECD
/IEA,
201
7

7. SPECIAL FOCUS 2: ELECTRICITY DISTRIBUTION DEVELOPMENT
153
PAR
T I.
ENER
GY
SEC
UR
ITY
SUM
MAR
Y
model is exposed to a range of risks which may result in less timely and efficient responses. For instance, the multiple and disparate objectives of many owners may unduly complicate and weaken corporate governance, leading to inertia or operational and investment decisions that are not consistent with the timely and efficient provision of distribution services to meet the long-term interests of consumers or the wider economy at least cost..31 These risks could be magnified where board members are appointed with little relevant expertise or for reasons other than merit. As previously discussed, recent investment in non-core activities may have exposed some distributors to business risks that they are ill-equipped to manage, reinforcing concerns about the ongoing effectiveness of a corporate governance model based on community ownership.
Although the community-owned trust model may have worked adequately to date, it is not clear that it will continue to provide timely, efficient and effective outcomes as the transformation of the distribution sector progresses. A fundamental transformation of the business environment and more dynamic use of distribution networks associated with such a transformation could quickly expose any associated managerial or corporate governance weaknesses, leading to delayed or ineffective responses that jeopardise reliability and efficient sector development.
Extending regulation to cover all distributors, including currently exempt community-owned trusts, could be considered to ensure more effective application of the regulatory framework to help complement and reinforce incentives for timely and efficient responses given these potentially rapidly changing circumstances. Although this may involve some additional administrative and compliance costs, those costs need to be weighed against the risks to the community from a potentially delayed or ineffective sector response.
An incremental approach to implementation could be adopted to reduce the potential risks and costs, possibly commencing with extending enforcement of reliability standards. Economic regulation could follow once the nature and magnitude of potential sector transformation become clearer and where it makes economic sense to proceed. In the interim, regular independent audits by the Controller and Auditor General could be implemented to help strengthen transparency, accountability and corporate governance. Industry-driven consolidation of sector structures or functions may support timely and cost-effective implementation, and should be carefully considered in this context. Policy makers are encouraged to prepare for the possible extension of economic and reliability regulation to all distributors to facilitate a more consistent, reliable, timely, efficient, innovative and cost-effective response to the potential challenges facing the distribution sector.
Approaches to include innovation in economic regulation Transformation of the distribution sector has the potential to fundamentally change the nature and complexity of the investment and operating environment for distributors. Economic regulation needs to be sensitive to these emerging challenges. In particular, it needs to be able to adapt quickly and efficiently to new operational and business requirements to ensure that it continues to provide effective incentives for timely, efficient and cost-effective management and development of the distribution network. 31 See Productivity Commission (2013) for further discussion of these issues in the context of government ownership.
© O
ECD
/IEA,
201
7

7. SPECIAL FOCUS 2: ELECTRICITY DISTRIBUTION DEVELOPMENT
154
For instance, innovative investment in smart grid technologies is generally defined by regulatory frameworks as an operating expenditure rather than a capital expenditure. At the same time, investments in smart grid technologies can alleviate the need for investment in conventional network assets. As a result, smart grid investment may increase the overall weighting towards operating expenditure over capital expenditure in the cost structure of distributors. This raises some new challenges for regulators around how to determine the rate of return on smart grid investments, given that operating expenditures typically are not ascribed a rate of return, and around determining the related payback period for such investments. Typically, these investments are characterised as having shorter economic lives than traditional lines investments, which does not necessarily fit well with traditional regulatory payback periods and can lead to serious lags between incurring an investment cost and recovering that cost through the regulated tariff.32
Furthermore, regulatory rate setting typically obliges network companies to abide by the regulatory laws and economic scrutiny, and provides little incentives for risky investment into future innovation, but rather discourages to accommodate distributed generation and other potentially socially desirable products or services, such as demand response or energy efficiency, which may reduce their sales volumes. Traditional regulation also tends to base revenues on past costs rather than on the value of activities that underlie those costs, and in some cases sets prices based on average cost rather than incremental cost, distorting price signals to consumers (Costello, 2016).
Such issues have given rise to a range of broader questions about the likely ongoing efficacy of the current cost- and revenue-based economic regulation of the distribution sector, and how well suited it is to the kind of transformation which is emerging among IEA member countries. Related questions are being raised in New Zealand. The Commerce Commission recently identified several potential challenges for regulators associated with the emergence of innovative distributed generation technologies and related products and services, including:33
the risk of stranded network assets resulting in less than full capital recovery
the adequacy of investment incentives where investments:
deliver benefits that are split along the value chain
deliver savings beyond the regulatory period
may involve new or untested technology deployment
the degree of flexibility regarding cost allocation and what is or is not regulated
the relationship with efficient pricing.
The Commerce Commission considered these issues in the context of its Input Methodologies Review and has initially concluded that there is insufficient evidence to justify any potentially risky and costly changes to the regulatory framework at this time (Commerce Commission, 2016b). A prudent and incremental response may well be warranted given the highly uncertain nature, timing and magnitude of this potential
32 See CEER (2015) for further discussion of this and other related issues. 33 See Commerce Commission (2016b) for more detailed discussion.
© O
ECD
/IEA,
201
7

7. SPECIAL FOCUS 2: ELECTRICITY DISTRIBUTION DEVELOPMENT
155
PAR
T I.
ENER
GY
SEC
UR
ITY
SUM
MAR
Y
transformation and its likely impact on the distribution sector operation and development in New Zealand.34 The Controller and Auditor General’s proposed examination of distributors’ assets management practices, focusing on how they intend to incorporate emerging technologies, could provide a valuable input for subsequent consideration of these matters (Auditor General, 2016).
However, as previously discussed, these circumstances could change rapidly and substantially. New Zealand’s policy makers and regulators are encouraged to examine some of the more innovative responses to these challenges which are emerging among IEA member countries. It is welcome that the EA is addressing these challenges by focusing on dynamic efficiency to make sure that barriers to participation and innovation are removed to the extent possible, and by using a regulatory approach that is technology-neutral and business model-neutral as appropriate in an environment that could change rapidly and substantially.
Regulators have responded to the emerging transformation by introducing a range of measures to help improve flexibility, certainty and the overall effectiveness of existing forms of incentive regulation. For instance, some regulators have introduced a total expenditure framework that does not distinguish between operating expenditures and capital expenditures, with a view to improving managerial flexibility and reducing undue regulatory risks or barriers to the efficient deployment of innovative technologies such as smart-grid devices. A total expenditure approach may provide distributors with greater capacity to adapt their operating and capital expenditure strategies to a rapidly changing business environment, while also providing greater flexibility to respond to evolving regulatory targets in an efficient, innovative and least-cost manner. In some cases, regulators have also extended the regulatory period to provide greater capacity for distributors to recover capital and realise efficiencies associated with the deployment of innovative technologies and operating practices. A longer regulatory period also reduces the risks associated with more innovative capital and operational expenditures, helping to strengthen incentives for distributors to deploy new technologies and innovate in response to changing business conditions.
Benchmarking is also increasingly being used among IEA regulators to support more effective application of incentive regulation.35 Typically, benchmarking has been applied to distribution networks and used to create incentives for more efficient operating expenditures. It is increasingly being used to inform capital expenditure analysis and to support regulation of transmission networks. Procuring sufficient, high-quality data to effectively implement benchmarking has proven to be a substantial practical challenge. However, New Zealand is developing a comprehensive range of time series data on distributor performance which could provide an ideal basis for implementing an effective benchmarking methodology to complement the existing price-quality path regulatory regime, where appropriate. Unfortunately, the application of benchmarking methodologies is explicitly precluded under Section 53P of the Act. Policy makers could consider the merits of repealing this restriction, or allowing for its more limited use, to 34 See Costello (2016) and Rochlin (2016) for further discussion of the uncertainties. 35 Regulatory benchmarking focuses on comparing the performance of a regulated entity to some representative benchmark of performance. Benchmarks for performance could include: comparison of performance over time; the average performance of the regulated sector; or comparison to an ideal firm or best-practice entity, in order to measure, and (potentially) encourage, greater efficiency in the regulated entity. A wide range of benchmarking methodologies and performance indicators has been employed by regulators across IEA jurisdictions.
© O
ECD
/IEA,
201
7

7. SPECIAL FOCUS 2: ELECTRICITY DISTRIBUTION DEVELOPMENT
156
give regulators the flexibility to deploy benchmarking methodologies where it is prudent to do so, and to support the development of more effective incentive regulation in response to the potential transformation of the distribution sector.
More radical performance-based approaches are also being implemented in some IEA jurisdictions. One of the most advanced examples is the United Kingdom’s Revenue = Incentives + Innovation + Outputs (RIIO) model. RIIO focuses on the delivery of a specified range of outcomes for customers, which it encourages distributors to achieve through a regime of incentives with rewards and penalties to encourage efficient and cost-effective delivery of the specified services. It also provides opportunities for distributors to profit from innovation and incorporating third parties in the delivery of energy services. RIIO is being used to facilitate the delivery of public policy outcomes in relation to reliability, vulnerable customers and the environment. Box 7.2 summarises the key features of the RIIO framework. Performance-based regulatory regimes may provide an effective way to promote timely and efficient investment and innovation that benefits consumers while providing distributors with the ability to respond more effectively to an increasingly complex business environment. However, CEER notes that it can be difficult to set effective output targets, particularly in the context of driving innovation and smart-grid investment. CEER suggests that a range of factors should be carefully considered including: the conditions for effective application of a performance-based methodology; the selection and calibration of the relevant performance metric; the period needed between undertaking investment and delivering the target outcome; and the need to avoid overlap with other regulatory incentives.36
Innovative network pricing and efficient access arrangements Network tariffs should provide crucial signals and incentives for efficient, timely and innovative investment, operation and use within distribution systems. More efficient, transparent and cost-reflective network tariffs can be expected to support smoother, more timely and cost-effective responses to the potentially transformational challenges facing the distribution sector. They are also critical for underwriting the financial viability of distributors as they progress through this transition.
Most distributors in New Zealand and across IEA member countries recover the majority of their revenues through volumetric charges. Concerns have been raised about this practice with the increasing volume of distributed generation and policy initiatives to drive greater energy efficiency at the small commercial and residential levels starting to threaten some distributors’ ability to recover their regulated revenues.
Undue reliance on volumetric network charges may also encourage increasing levels of uneconomic bypass, which has the potential to substantially distort efficient distribution system investment, operation and use, at the expense of all consumers. In a worst case, reliance on volumetric pricing could potentially initiate a cascading “death spiral”. Some evidence of uneconomic bypass is already emerging in New Zealand with rapidly
36 See CEER (2015) for further discussion of these issues.
© O
ECD
/IEA,
201
7

7. SPECIAL FOCUS 2: ELECTRICITY DISTRIBUTION DEVELOPMENT
157
PAR
T I.
ENER
GY
SEC
UR
ITY
SUM
MAR
Y
growing volumes of rooftop solar photovoltaic generation being installed, even though such investments appear to make little economic sense in most cases at this time.37
Distribution pricing has to adapt to the changing nature and volume of power flows resulting from new more dynamic patterns of distributed generation and consumption. In particular, the balance between fixed and incremental charges may need to be adjusted as the transformation of the distribution sector progresses, with increasing weighting given to fixed charges and capacity-related charges. Incremental charges are the ones that are charged to cover the costs associated with supplying total energy throughput. According to economic theory, these costs should be recovered through some form of marginal cost pricing and not through fixed charges.
Efficient pricing in this context should reflect nodal elements, like locational and time factors and reflect periods of congestion and peak demand. Time-of-use can be expected to increasingly determine the value and cost of providing distribution services as more sophisticated products and services create more dynamic patterns of distribution system use. Accordingly, efficient, cost-reflective network pricing will need to more accurately reflect time-of-use. CEER’s analysis has highlighted the capacity-driven nature of distribution network costs and the opportunity this presents for more refined time-of-use tariff structures that could encourage consumers to reduce consumption at local peak times or during periods of local congestion. More dynamic pricing would send clearer signals for more efficient and economic investment, operation and use of distribution networks (CEER, 2015).
A range of innovative distribution tariff structures are emerging among IEA member countries in response to the changing nature of the distribution system use, including: multi-part tariffs with a demand charge for residential consumers; various forms of real-time pricing; multi-year rate plans with price caps; surcharges for innovations; creation of a separate rate for distributed generation customers; cost-based standby rates for distributed generators; and performance-based rates for utilities.
However, there are several risks associated with more dynamic time-of-use distribution pricing. CEER notes that care needs to be taken to ensure that network tariffs do not compromise timely and efficient development of retail markets, especially the development of innovative products and services designed to harness demand response. Tariff structures also need to be flexible enough to accommodate changing consumption patterns without jeopardising efficient, competitive price formation, or compromising incentives for timely and efficient consumption responses or revenue recovery (CEER, 2015).
New Zealand’s distributors have considerable experience with traditional forms of time-of-use pricing, such as peak and off-peak pricing for water heating. Some distributors are also applying more refined congestion pricing to encourage a demand response during periods of peak use and congestion, with a view to encouraging more efficient network use and reducing the need for new capacity investments. The current transmission pricing methodology also employs a peak pricing component. Opportunities may exist to build on this positive foundation. 37 Research undertaken by the Electric Power Engineering Centre, University of Canterbury, estimates the levelised cost of electricity generated by a 5.25 kW rooftop solar photovoltaic system at between NZD 0.16 and 0.24 per kWh, representing a gain or loss in net present value terms of up to NZD 3 000 for an average residential customer.
© O
ECD
/IEA,
201
7

7. SPECIAL FOCUS 2: ELECTRICITY DISTRIBUTION DEVELOPMENT
158
Box 7.2 An overview of the RIIO performance-based regulatory framework RIIO (revenue = incentives + innovation + outputs) is the United Kingdom’s Office of Gas and Electricity Markets’ (Ofgem, 2010) new performance-based framework for setting price controls for regulated energy businesses. The new regulatory period for distributors commenced in 2015. RIIO encourages distributors to: i) put stakeholders at the heart of their decision-making process; ii) invest efficiently to ensure continued safe and reliable services; iii) innovate to reduce network costs for current and future consumers; and iv) play a full role in delivering a low-carbon economy and wider environmental objectives. Key elements of the regime include:
Eight-year regulatory period: extended regulatory period provides more regulatory stability and encourages longer-term focus.
Upfront (ex ante) assessment: sets base revenues and basis for changes in revenues over the subsequent eight-year period with limited possible reopeners providing a high level of certainty for regulated distributors.
Cost-sharing mechanism: if the distributor spends less than the target set, the savings are shared between the distributor and customers. This produces strong incentives to outperform. Conversely, if the distributor overspends, the extra costs are shared between the distributor and its customers the same way. This mitigates the impact of cost overruns.
Weighted average cost of capital approach: reimburses debt and equity investors at an appropriate level. The cost of debt is updated annually, which reduces financing risk to distributors and risk of overcompensation to consumers.
Comprehensive quality outputs: distributors’ business plans need to be informed by and tailored to their customers’ needs, e.g. level of network reliability, availability and environmental impacts.
Regulatory asset value (RAV) approach: revenues for long-term investments are recovered over their lifetime as a return on the RAV so the costs are shared between all the customers who benefit from the investment.
Totex approach: assesses total expenditure (totex), taking operational expenditure (opex) and capital expenditure (capex) together. This provides the company with incentives to choose the most economic option when deciding between opex and capex solutions.
Uncertainty mechanisms: limited provisions to manage specific cases of uncertainty risk through possible revenue changes during the period, e.g. extra revenues for providing greater network capacity.
Promoting innovation: encourages distributors to consider different ways to achieve greater cost savings or increase the scope of future delivery.
Under RIIO, Ofgem asks distributors to submit business plans detailing how they intend to meet the RIIO objectives, established by Ofgem in the strategy. RIIO places a strong emphasis on stakeholder engagement and distributors must obtain stakeholders’ input and demonstrate its use in the plans. Ofgem reviews the plans to determine the level of scrutiny. Where a distributor’s business plan is considered high-quality, its new price control settlement may be fast-tracked.
© O
ECD
/IEA,
201
7

7. SPECIAL FOCUS 2: ELECTRICITY DISTRIBUTION DEVELOPMENT
159
PAR
T I.
ENER
GY
SEC
UR
ITY
SUM
MAR
Y
For instance, as noted in Chapter 5, avoided cost of transmission payments are currently calculated by distributors in a manner that may result in inefficient over-investment in distributed generation, which can create equity issues associated with the related cross-subsidies while also potentially establishing the preconditions for the “death spiral”. Similar concerns have been raised about the potential price distortions and equity effects associated with the low fixed charge programme.38 Most fundamentally, this can create competition concerns between distributed and grid-connected generation.
A range of reviews are under way into distribution-pricing arrangements, notably the distribution-pricing review (DPR) by the Electricity Authority, including other reviews examining and removing any distortions associated with avoided cost of transmission payments and the low fixed-charge programme.39 Policy makers and regulators are also encouraged to take the opportunity afforded by these reviews to consider the potential for more innovative, cost-reflective and dynamic distribution network pricing options, and to help strengthen incentives for more efficient distribution-sector investment, operation and use.
More innovative use of the distribution system also raises issues around the efficacy of connection agreements and other access arrangements. Such arrangements could be used by distributors to create a barrier to entry for certain innovative products and services, or service providers, especially where they may threaten distribution revenues as a result of reducing the volume of electricity transmitted. Products and services associated with harnessing demand response, energy efficiency or distributed generation and storage are all potentially exposed to this risk. This has the potential to delay and distort timely, efficient and innovative electricity sector development, especially at the retail level.
Efficient forms of dynamic distribution pricing could help to more closely align distributors’ commercial incentives with those of emerging innovative service providers, which may help to reduce the incentive for this kind of behaviour. However, pricing reforms alone may not be sufficient.
Policy makers can support the efficient and timely emergence of innovative products and services at the retail and distribution level by ensuring that all participants have access to distribution networks on fair and reasonable terms and conditions. Policy makers and regulators in New Zealand have recognised the importance of this issue and are in the process of developing model connection agreements and default distribution use of system agreements to help reduce transaction costs and provide greater transparency for negotiation of access on fair and reasonable terms.40 Policy makers and regulators are encouraged to closely monitor these issues to ensure that they do not emerge as a barrier to efficient and timely new entry or to the development of innovative products and services that can support efficient market operation and development.
38 See RAG (2015 and 2013) and NZIER (2015) for further discussion of issues associated with the low fixed charge programme. 39 Other examples include: the Commerce Commission’s input methodologies review; the Electricity Authority’s distribution pricing review; the Electricity Authority’s work to develop a default distribution use of system agreement; and the Electricity Authority’s review of distributed generation pricing principles. In addition, the Electricity Authority’s 2016-17 work programme gives priority to reducing barriers to the development and use of emerging technologies and business models across the value chain, and to more efficient pricing for monopoly services. 40 For example see RAG (2016) and EA (2016b).
© O
ECD
/IEA,
201
7

7. SPECIAL FOCUS 2: ELECTRICITY DISTRIBUTION DEVELOPMENT
160
Assessment
New Zealand’s distribution sector is facing a period of rapid change. Liberalisation supported by the widespread deployment of advanced interval metering has brought more innovative forms of competition to retail markets. At the same time, a range of new distributed forms of renewable energy generation such as rooftop solar photovoltaics are beginning to be deployed across the distribution network. Potential technological developments, including the deployment of battery storage and electric vehicles, have the potential to greatly accelerate this transformation in the medium term. These developments provide an exceptional opportunity to create more efficient, innovative, cost-effective and responsive electricity markets throughout New Zealand which can deliver a range of benefits for all electricity consumers. However, they also have the potential to radically transform the distribution system and power flows, making the systems far more dynamic and complex to manage in an efficient and secure manner.
Distribution businesses will be at the forefront of managing these challenges. At present the distribution sector has 29 separate businesses which are responsible for managing the secure and reliable delivery of power throughout the distribution network. There are a range of ownership structures, including companies and local governments, but most are operated as community-owned trusts. Most have relatively few customers and are small businesses; they may not be able to extract potential economies of scale or have access to corporate management practices of listed companies.
Twelve of the 29 distributors are currently exempt from price-quality path regulation by the Commerce Commission. All distribution businesses, including those deemed to be community-owned and therefore not subject to economic regulation, are required to submit performance information to the Commerce Commission which is published annually.
Concerns have been raised about the financial, technical and managerial capability of the distribution sector to respond effectively to this challenge. The relatively small size of some distributors may limit their capacity to efficiently and cost-effectively invest in the monitoring, management and control systems required to maintain reliability as distribution systems become more complex and subject to more dynamic real-time power flows.
Concerns have also been raised about the governance and decision-making capability of some distributors and their capacity to manage this potentially complex transition in an efficient and timely manner that will help to realise the potential consumer benefits. Recent independent audits conducted by the Controller and Auditor-General of some distributors have revealed several examples of investment in non-core activities that could expose distributors to business risks that they may be ill-equipped to manage. The wide range of managerial approaches and governance arrangements applied within the distribution sector are reflected in a variety of operational and investment practices, which may reduce the sector’s efficiency and unduly increase the cost of co-ordinating investment and operational activities.
In view of these concerns, it would be prudent for the government to examine opportunities to improve the investment and operational incentives governing the performance of the distribution sector.
© O
ECD
/IEA,
201
7

7. SPECIAL FOCUS 2: ELECTRICITY DISTRIBUTION DEVELOPMENT
161
PAR
T I.
ENER
GY
SEC
UR
ITY
SUM
MAR
Y
For instance, opportunities may exist to harness economies of scale, to more cost-effectively invest and to improve performance through more integrated regional operation and management of distribution networks. A range of options could be considered, including:
regional services and management agreements between distributors
formation of joint ventures to manage and operate distribution assets on behalf of distributors
amalgamation of distributors.
The New Zealand government should encourage the distribution sector to develop more efficient structural arrangements in close consultation with other key stakeholders.
An increase in the effective scale of distribution activities may also provide an opportunity to extend the price-quality path regulation to all distribution activities; this would provide a way to ensure a more consistent and comprehensive incentive-based regulation of the distribution sector. The development of more effective management across the distribution sector may serve to encourage more efficient and timely behavioural responses to the incentives created by price-quality path regulation.
Consistent application of the regulatory regime would also allow for the simplification of existing distribution arrangements, especially those relating to distribution charges and connection agreements. The IEA notes that the Electricity Authority is in the process of incorporating an improved default distribution use of system agreement into the Code. This may help to remove a potentially significant barrier to entry for new retailers, helping to strengthen effective retail competition, customer choice and access to a range of more innovative products and services.
Regulation of distribution activities will need to take account of the rapidly changing investment and operational environment to ensure that it does not create undue regulatory risks or costs for distributors as they seek to respond to the new transformation-related challenges. In particular, the government, through the Commerce Commission and EA, should ensure that sufficient flexibility is provided to accommodate timely and prudent investment in “smart grid” and related network control technologies. The IEA notes that this issue is being considered in the context of the Commerce Commission’s review of the price-quality path input methodologies. The Controller and Auditor-General’s proposed review of distributor asset management practices in relation to the deployment of emerging technologies would be a welcome complement to this review.
Further opportunities may exist to augment the existing price-quality path framework with innovations such as a total expenditure framework, longer regulatory periods and more flexible methodologies. In particular, the government should consider relaxing the ban on the use of benchmarking methodologies where it has the potential to enhance efficient and cost-effective regulatory supervision. More radical approaches incorporating output-based methodologies could also be considered as the transition progresses. Consideration could also be given to encouraging the procurement of demand response, energy efficiency, distributed generation and other local resources to support distribution system management where it is efficient and cost-effective to do so, and where it
© O
ECD
/IEA,
201
7

7. SPECIAL FOCUS 2: ELECTRICITY DISTRIBUTION DEVELOPMENT
162
accelerates efficient and innovative market development. The EA has started to investigate those issues, which is a welcome development.
Potential barriers to the development of more cost-reflective, real-time distribution pricing, including various forms of peak pricing and capacity charging should also be examined in the context of the various reviews currently under way. The IEA notes that discussions are ongoing in relation to the pricing policy of low fixed distribution charges. The government should review the need for the low fixed charge product, especially as more flexible and efficient products for harnessing demand response and energy efficiency begin to emerge.
Recommendations
The New Zealand government should: Direct the New Zealand Productivity Commission to review the electricity distribution
sector, with a view to identifying opportunities to improve its productivity, flexibility and its capacity to more effectively respond to the challenges posed by the potential transformation of the sector. This includes examining the sector’s structure, governance and options to encourage the development of more integrated regional management, operation and development of distribution networks.
Extend price-quality path regulation to all distributors where it is cost-effective to do so, which would be facilitated through regional integration, starting with enforcement of reliability standards.
Enhance the regulation of all distribution services, including:
> Implementing the proposed reforms to the distribution pricing and strengthening the legal framework for the use of system agreement, and improving operational arrangements, including in relation to co-ordination, communication and data management as appropriate.
> Introducing regular independent audits of all price-quality path exempt distributors by the Controller and Auditor-General.
> Removing any undue regulatory uncertainty or barriers to timely and prudent investment in “smart grid” and related network control infrastructure.
> Further developing incentives for the procurement of demand response, energy efficiency services, distributed generation and other local network management resources, where it is prudent and cost-effective to do so and where it may serve to accelerate the development of an efficient and innovative retail sector.
> Identifying and removing any undue barriers to the introduction of more cost-reflective, real-time network pricing.
© O
ECD
/IEA,
201
7
7. SPECIAL FOCUS 2: ELECTRICITY DISTRIBUTION DEVELOPMENT
163
PAR
T I.
ENER
GY
SEC
UR
ITY
SUM
MAR
Y
References
Auditor General (2016), Energy Sector: Results of the 2014/15 Audits, Controller and Auditor General of New Zealand, Wellington, June.
Auditor General (2014), Inquiry into Property Investments by Delta Utility Services Limited at Luggate and Jacks Point, Controller and Auditor General of New Zealand, Wellington, March.
Borenstein, S. and Bushnell, J. (2015), The U.S. Electricity Industry after 20 Years of Restructuring, Energy Institute at Hass, Working Paper 252, May.
CEER (2015), The Future Role of DSOs: A CEER Conclusions Paper, Council of European Energy Regulators, Ref: C15-DSO-16-03, Brussels, July.
CEER (2014), The Future Role of DSOs: A CEER Public Consultation Paper, Council of European Energy Regulators, Ref: C14-DSO-09-03, Brussels, December.
Commerce Commission (2016a), Profitability of Electricity Distributors Following First Adjustments to Revenue Limits, New Zealand Commerce Commission, Project no. 14.20/15546, Wellington, June.
Commerce Commission (2016b), Input Methodologies Review Draft Decisions: Topic Paper 3 – The Future Impact of Emerging Technologies in the Energy Sector, New Zealand Commerce Commission, Project no. 17.01/15081, Wellington, June.
Commerce Commission (2015), Electricity Distributors Information Disclosures – 2013-2015, New Zealand Commerce Commission, Wellington, October.
Commerce Commission (2014), Default Price-Quality Paths for Electricity Distributors from 1 April 2015 to 31 March 2020: Main Policy Paper; New Zealand Commerce Commission, Project #14.07/14118, Wellington, November.
Commerce Commission (2012), Information disclosure for Electricity Distribution Businesses and Gas Pipeline Businesses: Final Reasons Paper, New Zealand Commerce Commission, Project #14.09:15.03/12163:11568, Wellington, October.
Costello (2016), “Ways for utility regulation to grapple with new developments in the U.S. Electric Industry”, The Electricity Journal, Volume 29, Issue 2, pp. 50-58.
Economic Insights (2014), Electricity Distribution Industry Productivity Analysis: 1996–2014, Report prepared for the New Zealand Commerce Commission, Eden, October.
EC Think (European Commission) (2013), From Distribution Networks to Smart Distribution Systems: Rethinking the Regulation of European Electricity DSOs, European Commission FP7 project THINK, Topic 12, Final Report, Brussels, June.
Electricity Authority (2016a), Default agreement for distribution services: consultation paper, New Zealand Electricity Authority, Wellington, January.
Electricity Authority (2016b), Work Programme 2016/17, Wellington, August 2016.
Electricity Authority (2015), Electricity Market Performance: 2015 Year in Review, New Zealand Electricity Authority, Wellington.
Electricity Authority (2014), Electricity Market Performance: 2014 Year in Review, New Zealand Electricity Authority, Wellington.
European Commission (2016), Clean Energy Package for All, European Commission, Brussels. http://ec.europa.eu/energy/en/news/commission-proposes-new-rules-consumer-centred-clean-energy-transition.
European Commission (2015), Communication from the Commission to the European Parliament, The Council, The European Economic and Social Committee and the
© O
ECD
/IEA,
201
7

7. SPECIAL FOCUS 2: ELECTRICITY DISTRIBUTION DEVELOPMENT
164
Committee of the Regions: Launching the Public Consultation Process on a New Energy Market Design, European Commission, COM(2015) 340 final, SWD(2015) 142 final, Brussels, July.
ISCR (New Zealand Institute for the Study of Competition and Regulation Inc.) (2012), New Zealand’s Electricity Lines Companies: An Ownership Analysis, Wellington, June.
Marlborough Lines (2015), “New Investment in Yealands: a win for Marlborough”; Marlborough Lines press release of 2 July 2015, www.marlboroughlines.co.nz/News/2015/New-investment-in-Yealands-a-win-for-Marlborough.aspx.
Meeus, L. and Hadush, S. (2016), “The emerging regulatory practice for new businesses related to distribution grids”, Policy Brief, Issue 2016/02, Florence School Regulation, Florence, March.
NZIER (New Zealand Institute of Economic Research) (2015), Comments on Review of RAG paper “Research project: Effects of low fixed charges, Wellington, October.
Ofgem (Office of Gas and Electricity Markets) (2014), “Regulatory regimes in GB – a high level summary”, United Kingdom, London, October.
Ofgem (2013), “Price controls explained, United Kingdom Office of Gas and Electricity Markets, Fact Sheet, 117, London, March.
Ofgem (2010), “RIIO: A new way to regulate energy networks – Final Decision, United Kingdom, Reference: 128/10, London, October.
Ozbugday (2012), “Empirical essays on ex post evaluations of competition and regulatory authorities' decisions and policy reforms”, Doctor of Philosophy dissertation, University of Tilburg, the Netherlands, November.
Pulse Energy (2015), “Buller Electricity wins takeover of Pulse Energy as directors agree to sell”, Pulse Energy Press Release of 31 December 2015, www.pulseenergy.co.nz/customer-hub/community/news/column-1/buller-electricity-wins-takeover-of-pulse-energy-as-directors-agree-to-sell.
Productivity Commission (2013), “Electricity network regulatory frameworks”, final report, Australian Productivity Commission, Canberra, April.
Radio New Zealand (2016), “New solar panel charge kicks in”, Radio New Zealand transcript of 1 April 2016, www.radionz.co.nz/news/regional/300397/new-solar-panel-charge-kicks-in.
RAG (Retail Advisory Group) (2016), “Review of domestic contracting arrangements: Issues paper”, Wellington, April.
RAG (2015), “Research project: Effects of low dixed charges”, Wellington, October.
RAG (2013), “Review of domestic contracting arrangements: Issues paper”, Wellington, April.
Rochlin (2016), “Distributed renewable resources and the utility business model”, The Electricity Journal, Volume 29, Issue 1, pp. 7-12.
Simshauser (2014), “From first place to last: The national electricity market’s policy-induced ‘energy market death spiral’”, The Australian Economic Review, Vol. 47, No. 4, pp. 540–62.
Unison Energy (2016), “Unison’s new DG price category ensures fairness for all customers”, press release of 1 April 2016, www.unison.co.nz/tell-me-about/news/article/2016/03/31/unison-s-new-dg-price-category-ensures-fairness-for-all-customers.
© O
ECD
/IEA,
201
7
165
PAR
T II.
EN
ERG
Y SY
STEM
TR
ANSF
OR
MAT
ION
Summary of Part II New Zealand is experiencing significant shifts in its energy system with decreasing use of fossil fuels towards higher shares of renewable energy, thanks to its abundant resource base (hydropower, wind and geothermal). The government targets a share of renewable energy of 90% in electricity by 2025 and is well on track to achieve this. The move towards a sustainable energy economy has much broader implications for the energy (and industry) sectors in terms of economic growth, competitiveness, environmental performance and security of supply.
New Zealand’s 2021-30 target is to reduce greenhouse gas (GHG) emissions to 30% below 2005 levels by 2030. The largest increase in GHG emissions stems from energy-related CO2 emissions that grew by 44% from 1999 to 2014. Despite the largely decarbonised power generation, the industry is still largely based on the use of oil, natural gas and coal and will be facing a number of challenges in terms of the future use of fossil fuels, notably with a view to mitigating CO2 emissions in the follow-up to the Paris Agreement. To date, New Zealand’s Emission Trading Scheme is the main tool to achieve the target. However, looking ahead to 2030, the government has not yet adopted additional policies for decarbonising the energy sector or made the investments required to meet targets up to 2030 and beyond towards 2050.
Natural gas demand is on the rise; it is increasingly used in the residential/commercial sector, power generation and industry (methanol production), but there is no long-term availability. Natural gas reserves are not secure in the longer term, which has significant implications for the future outlook for industry and residential demand. Natural gas use in the power sector has declined, largely replaced by geothermal. Geothermal has doubled its share of TPES; however, its lower energy efficiency and related GHG emissions (for some reservoirs significant) may bring about new challenges.
The transport sector is fully dependent on the use of oil (99%), while New Zealand’s agriculture and industry rely strongly on coal use for process heat. Coal use (domestic lignite) in agriculture is increasing; while hard coal production for exports is on the decline and the coal industry is under severe financial constraints because of the low international hard-coal prices.
Chapters 8 to 12 will explore challenges for each sector in more detail. These include the longer-term prospect of electrified transport, the increase in renewable energy beyond electricity, notably, geothermal energy, or the greater use of bioenergy in the industry and power sectors.
New technology choices made in the energy system (solar PV, electric vehicles, smart grids and storage) may have implications for electricity demand. A more and more renewables-based energy system will be at the heart of the energy system transformation.
© O
ECD
/IEA,
201
7

167
PAR
T II.
EN
ERG
Y SY
STEM
TR
ANSF
OR
MAT
ION
8. Energy system transformation overview
Key data (2015)
Energy intensity: 0.13 toe/USD 1 000 PPP (IEA average: 0.11), -2.2% since 2005
TPES per capita: 4.5 toe (IEA average: 4.5 toe), +11.2% since 2005
TPES per GDP: 0.12 toe/USD 1 000 PPP (IEA average: 0.11 toe/USD 1 000 PPP)
Emission target 2008-12 target under the Kyoto Protocol: reduce GHG emissions to 1990 levels on average over the five-year commitment period. This target was met with a surplus of units
Emission target 2020: -5% GHG emissions on 1990 levels
Government spending on energy R&D: NZD 21.9 million
Share of GDP (2015 estimate): 0.09 units of GDP per USD 1 000 (IEA median of 16 member countries in 2014: 0.4), R&D per capita: NZD 4.9
Energy system trends
The energy system transformation analyses trends in how efficiently energy is used in the economy and examines the changing fuel mix, the importance of fossil fuels in the different sectors, the share of renewables in energy supply and the trends in CO2 emissions in the country.
As the data overview in Chapter 2 on the energy system at a glance illustrated, the sectoral contributions of the energy system to final energy consumption and carbon emissions in 2014 were as follows:
The transport sector was responsible for 33% of final energy consumption and 45% of energy-related CO2 emissions.
The industrial processes accounted for about 21% of New Zealand’s total energy-related carbon emissions and 43% of total final consumption. The power generation sector alone accounted for 18.3% of CO2 emissions, largely stemming from one coal-fired power plant and two large combined-cycle gas turbine plants.
The residential sector accounted for 10% of final energy consumption and 1.7% of CO2 emissions.
The commercial and public services accounted for 14% of final energy consumption and 8% of energy-related CO2 emissions.
© O
ECD
/IEA,
201
7

8. ENERGY SYSTEM TRANSFORMATION OVERVIEW
168
Between 2004 and 2014, CO2 emissions from the transport and industry sectors have increased by 4.3% and 16.6% respectively, while emissions from the power sector have declined by 33.0% in the same decade.
New Zealand’s energy intensity is lower than during the 1990s (Figure 8.1). The levels have largely remained stable over two decades, with only a small decline, despite a growing economy. Energy intensity in terms of total energy supply per capita has even increased by 11% from 2005 to 2015. CO2 emissions have remained stable, despite growing population and energy use, thanks to the share of renewable energy in the total energy supply, which has increased by 29% within ten years.
Figure 8.1 Trends in the New Zealand energy system transformation, 1990-2014
40
60
80
100
120
140
160
1990 1993 1996 1999 2002 2005 2008 2011 2014
Index (1
990=
100)
CO2 emissions
Share of renewablesin TPES
TPES/population
Energy intensity(TPES/GDP PPP)
CO2 emissions
Note: CO2 data are not available for 2015. Source: IEA (2016a), Energy Balances of OECD Countries, www.iea.org/statistics/.
Carbon intensity
New Zealand’s carbon intensity, measured as CO2 emissions by real gross domestic product adjusted for purchasing power parity (GDP PPP), amounted to 0.21 tonnes of CO2 per USD 1 000 PPP (tCO2/USD 1 000 PPP) in 2014. New Zealand has the thirteenth-highest level of carbon intensity within the IEA, around the median, but lower than the IEA average (0.26 tCO2/USD 1 000 PPP). The country’s carbon intensity has been much more stable than in other IEA members, comparable to Japan (Figure 8.2).
Figure 8.2 Energy-related CO2 emissions per unit of GDP in New Zealand and in other selected IEA member countries, 1973-2014
0.0
0.1
0.2
0.3
0.4
0.5
0.6
0.7
1973 1976 1979 1982 1985 1988 1991 1994 1997 2000 2003 2006 2009 2012
tCO₂/U
SD 1
000
GDP
PPP
Australia
Japan
IEA29
Germany
New Zealand
00
Source: IEA (2016b), CO2 Emissions from Fuel Combustion 2016, www.iea.org/statistics/.
© O
ECD
/IEA,
201
7

8. ENERGY SYSTEM TRANSFORMATION OVERVIEW
169
PAR
T II.
EN
ERG
Y SY
STEM
TR
ANSF
OR
MAT
ION
New Zealand’s carbon intensity has been declining since 2000. In 2014 the carbon intensity was 26.6% lower than in 1990 (0.28 tCO2/USD 1 000 PPP) and 22% lower than in 2004 (0.27 tCO2/USD 1 000 PPP). The average carbon intensity in the 29 IEA members has come down fast. It was 35.2% lower in 2014 than in 1990 (0.40 tCO2/USD 1 000 PPP) and 20% lower than in 2004 (0.32 tCO2/USD 1 000 PPP).
Rising population and solid GDP growth have been the main drivers in increasing energy supply. CO2 emissions have been stable, and largely decoupled from GDP growth, with the exception of a dip in 2008-09.
Figure 8.3 CO2 emissions and main drivers in New Zealand, 1990-2014
80.0
100.0
120.0
140.0
160.0
180.0
200.0
1990 1993 1996 1999 2002 2005 2008 2011 2014
Index (1
990=
100)
Population
TPES
GDP (USD 2010prices and PPPs)
CO2 emissions
00
CO2 emissions
Sources: IEA (2016b), CO2 Emissions from Fuel Combustion, www.iea.org/statistics/.
Energy intensity
Energy intensity1 is a measure of the energy efficiency and energy productivity of a nation's economy. Higher intensities indicate a high cost of converting energy into GDP. Energy intensity in New Zealand was 0.13 tonnes of oil-equivalent per USD 1 000 adjusted for purchasing power parity (toe/USD 1 000 PPP) in 2015, above the IEA average of 0.11 toe/USD 1 000 PPP.
New Zealand’s energy intensity ranks seventh-highest among IEA member countries behind Canada, Estonia, Korea, Finland, the Czech Republic and the United States (see Figure 8.4). Energy intensity has declined from a 1992 peak of 0.18 toe/USD 1 000 PPP to the current level but has remained stable since 2005. A further indicator for international comparison is energy consumption per capita (see Figure 8.5). New Zealand’s rate of 4.5 toe per capita per year is tenth-highest among IEA countries.
Under the New Zealand Energy Efficiency and Conservation Strategy (NZEECS), the government’s energy efficiency target was to achieve a rate of energy intensity improvement of 1.3% per year. So far this target has not been met; the energy intensity level in 2015 was the same as in 2011.
1 Energy intensity is measured as the ratio of total primary energy supply (TPES) per unit of real gross domestic product adjusted for purchasing power parity (GDP PPP).
© O
ECD
/IEA,
201
7

8. ENERGY SYSTEM TRANSFORMATION OVERVIEW
170
Figure 8.4 Energy intensity in New Zealand and in other selected IEA member countries, 1973-2015
0.00
0.05
0.10
0.15
0.20
0.25
0.30
0.35
1973 1975 1977 1979 1981 1983 1985 1987 1989 1991 1993 1995 1997 1999 2001 2003 2005 2007 2009 2011 2013 2015
toe/U
SD 1
000
GDP
PPP
United States
New Zealand
Australia
IEA29
Norway
Italy
00
New Zealand
Note: Data are estimated for 2015. Source: IEA (2016a), Energy Balances of OECD Countries, www.iea.org/statistics/.
Figure 8.5 TPES per capita in IEA member countries, 2015
7.86.8 6.6
5.9 5.8 5.5 5.5 5.1 4.7 4.5 4.2 4.2 3.9 3.8 3.8 3.7 3.43.0 3.0 2.9 2.8 2.8 2.6 2.5 2.5 2.4 2.2 2.1
1.7
0123456789
toe/ca
pita
Note: Data are estimated. Source: IEA (2016a), Energy Balances of OECD Countries, www.iea.org/statistics/.
Changes in total final consumption (TFC) can be decomposed into effects from the total activity, structural changes and changes to energy intensity. The country’s activity is made up of economic growth in industry, population growth in the residential sector and increased transport use. These effects will all increase TFC as they grow. Structural effects account for economic change in the industry sector, floor area per person in the residential sector and modal shift in the transport sector.
Energy intensity changes come from energy efficiency measures. Structural and intensity effects tend to make TFC decrease. New Zealand’s activity increased by 75% in 1990-2014, which drove an increase in TFC of around 40%. Energy intensity started to decline during 2002-05, but remained stable for almost a decade. Despite structural changes from 2005 onwards, when large industries left the country, intensity levels since 2012 started to gently climb again, in line with population and consumption growth.
Overall energy efficiency has improved by around 13% since 1990 (see Figure 8.6).
© O
ECD
/IEA,
201
7

8. ENERGY SYSTEM TRANSFORMATION OVERVIEW
171
PAR
T II.
EN
ERG
Y SY
STEM
TR
ANSF
OR
MAT
ION
Figure 8.6 Total TFC broken down into activity, structural changes and energy intensity, 2014
0.60
0.80
1.00
1.20
1.40
1.60
1.80
1990 1992 1994 1996 1998 2000 2002 2004 2006 2008 2010 2012 2014
Index
Activity index
TFC index
Structure index
Intensity index
00
Note: Parts of TFC that cannot be decomposed, such as non-specified residential consumption and non-energy consumption, are not included. Source: IEA (2016c), Energy Efficiency Indicators: Highlights, www.iea.org/statistics/.
This can be broken down into significant efficiency achievements in the transport sector (freight and passenger transport improvements accounted for 40% of the total share), in industry (40%), and in the residential sector (20%), as illustrated in Figure 8.7.
Figure 8.7 Energy savings in total final consumption from energy efficiency improvements by sector, 1990-2014
20%
14%
26%
40%
Residential
Freight transport
Passenger transport
Industry & services
Source: IEA (2016c), Energy Efficiency Indicators: Highlights, www.iea.org/statistics/.
Renewable energy supply/demand
Renewables are widely used in power generation (80.2%), in industries (12.7%), in households (1.9%) and in commercial sectors (0.9%), while demand in transport is still marginal at 0.1%.2 Renewable energy accounted for 8.3 million tonnes of oil-equivalent (Mtoe) or 40.6% of New Zealand’s total primary energy supply (TPES) in 2015. Geothermal is the main renewable source with 4.8 Mtoe or 23.4% of TPES in 2015, with hydro energy (2.1 Mtoe or 10.3%), biofuels and waste (1.2 Mtoe or 5.7%), wind (0.2 Mtoe or 1.0%) and marginal use of solar (0.05 Mtoe or 0.2%) (Figure 8.8).
2 Latest available data for demand per sector are from 2014.
© O
ECD
/IEA,
201
7

8. ENERGY SYSTEM TRANSFORMATION OVERVIEW
172
Renewable energy has gradually increased over the past decade, with its share in TPES up from 31.8% in 2005. This surge was mainly driven by robust growth in the use of geothermal, which grew at an annualised rate of 9.2% from 2005 to 2015. Its share in TPES increased from 11.7% to 23.4% over the same period. Hydro energy, one of the major renewable energy sources, increased by 5.1% from 2005 to 2015, but decreased in terms of its share of TPES, from 11.8% in 2005 to 10.3% in 2015. Energy from biofuels and waste was 10.1% lower in 2015 than in 2005 while wind energy increased by 283%, stepping up from a negligible level, although still at 1.0% of TPES in 2015.
Figure 8.8 Renewable energy as a percentage of TPES, 1973-2015
0%
5%
10%
15%
20%
25%
30%
35%
40%
45%
1973 1976 1979 1982 1985 1988 1991 1994 1997 2000 2003 2006 2009 2012 2015
Biofuels and waste
Hydro
Solar*
Geothermal
Wind
* Negligible. Source: IEA (2016a), Energy Balances of OECD Countries, www.iea.org/statistics/.
Among IEA member countries, New Zealand had the third-highest contribution of renewable energy to TPES at 40.6% in 2015, behind Sweden (47.1%) and Norway (45.3%), owing to the high contribution of geothermal and hydro to electricity generation (see Figure 8.9). Its share of hydro and wind energy is the fifth- and eleventh-highest among IEA members, respectively. The share of biofuels and waste ranked seventeenth-highest, and solar ranked eighteenth, slightly below the IEA median level.
Figure 8.9 Renewable energy as a percentage of TPES in New Zealand and IEA member countries, 2015
0%5%
10%15%20%25%30%35%40%45%50%
Biofuels and waste Solar Geothermal Wind Hydro
Note: Data are estimated. Source: IEA (2016a), Energy Balances of OECD Countries, www.iea.org/statistics/.
© O
ECD
/IEA,
201
7

8. ENERGY SYSTEM TRANSFORMATION OVERVIEW
173
PAR
T II.
EN
ERG
Y SY
STEM
TR
ANSF
OR
MAT
ION
Energy strategies
The main energy policy statements are the New Zealand Energy Strategy 2011-21 (NZES), the government’s ten-year plan for the energy sector and the related five-year New Zealand Energy Efficiency and Conservation Strategy 2011-16 (NZEECS) and 2017-22 NZEECS (under consultation).
New Zealand’s Energy Efficiency and Conservation Act (2000) provides the legal basis for energy efficiency actions taken by the Energy Efficiency and Conservation Authority’s (EECA). The law requires a five-year national energy efficiency and conservation strategy (the NZEECS). NZEECS guides EECA’s work on energy efficiency, conservation and renewable energy. Under the 2011-16 NZEECS, the government’s energy efficiency target was to achieve a rate of improvement in energy intensity of 1.3% per year. The NZEECS expired on 30 August 2016 and the government published for consultation a new NZEECS “Unlocking our energy productivity and renewable potential”. The NZES and the NZEECS set targets for the different sectors which are presented in Table 8.1.
Table 8.1 Sector objectives and targets
Sector Objectives Targets
Transport A more energy-efficient transport system, with a greater diversity of alternative fuels and technologies.
By 2016: the efficiency of light vehicles entering the fleet has further improved over 2010 levels. By 2022: increase the share of electric vehicles to 2% of the vehicle fleet (registrations to double each year until 2021).
Industry Enhanced business growth and competitiveness from energy intensity improvements.
By 2016: an improvement in the commercial and industrial sectors’ energy intensity level (GJ/USD 1 000 of GDP). By 2025: to utilise up to 9.5 PJ per year of energy from woody biomass or direct-use geothermal in addition to that used in 2005. By 2022: increase renewable and efficient use of process heat to decrease in industrial emissions intensity of 1.0% by year on average during 2017-22 (Process Heat Action Plan).
Residential Warm, dry and energy-efficient homes with improved air quality to avoid ill-health and lost productivity.
By 2013: insulate 188 500 homes. By 2016: insulate 46 000 homes with health risk for their occupants under the New Warm Up NZ: Healthy Homes Programme in addition to the 241 000 houses insulated under the Warm Up NZ: Heat Smart Programme (2009-14).
Appliances/ products
Greater business and consumer uptake of energy-efficient products.
By 2016: extend minimum energy performance standards, labelling and Energy Star product coverage to remain in line with major trading partners.
Electricity
An efficient, secure, renewable electricity system supporting New Zealand's global competitiveness.
By 2025: 90% of electricity from renewable energy sources.
Public sector
Greater value for money from the sector through increased energy efficiency.
By 2016: improve energy use per full-time staff member compared to the 2010 baseline.
Note: GJ = gigajoule; PJ = petajoule.
© O
ECD
/IEA,
201
7

8. ENERGY SYSTEM TRANSFORMATION OVERVIEW
174
GHG targets
Under the Kyoto Protocol’s first commitment period, New Zealand’s target was to reduce emissions to 1990 levels over the period 2008-12. Despite a strong increase in emissions from the energy sector and agriculture, the overall target was overachieved thanks to the offsetting effects of forestry and use of international markets. New Zealand did not commit itself under the second commitment period of the Kyoto Protocol. However, the government has tabled an unconditional target under the United Nations Framework Convention on Climate Change (UNFCCC) to reduce emissions to 5% below 1990 levels by 2020. The government intends to meet this target through a combination of domestic emissions reductions, removal of carbon dioxide by planting forests, participation in international carbon markets, but also taking account of the surplus achieved during the first commitment period of the Kyoto Protocol. Because New Zealand did not take a target under the second commitment period, the government’s ability to trade in Kyoto Protocol markets has been limited. The government also has a long-term carbon target of reducing net GHG emissions to 50% below 1990 levels by 2050.
In July 2015, New Zealand presented its Intended Nationally Determined Contribution (INDC) to reducing its GHG emissions by 30% by 2030 below 2005 levels (equivalent to an 11% reduction from 1990 GHG levels). In the context of ratifying the Paris Agreement, the government made the INDC provisional, as it is seeking clarity over the global accounting rules on forestry. The country aims to rely on the forestry sector as a major carbon sink as well as on international carbon markets to supplement domestic action to meet its 2030 ambitions.
New Zealand ratified the Paris Agreement on 4 October 2016 and the government intends to prepare a mid-century low carbon strategy, including a technology outlook.
Energy and climate scenarios
Gross emissions of the economy of New Zealand are expected to remain stable with a slight increase (see Figure 8.10), despite the continuous decarbonisation of the power sector. In electricity, the large Huntly coal-fired power plant has already shut half of its capacity and the continued operation of the remaining 500 megawatts (MW) by end of 2022 remains uncertain. The share of renewable energy is targeted to rise to 90% by 2025. The main increase in GHG emissions is projected to come from agriculture and emissions are expected to remain high in the transport sector, as growth in population drives energy consumption, which makes the sector an area of present and future concern (UNFCCC, 2016).
The Royal Society of New Zealand and the Business Energy Council have presented a low-carbon scenario analysis with different mitigation pathways across the economy which assesses key energy changes in the coming decade (RSNZ, 2016).
Besides GHG emissions and cost modelling, the data from government and industry on producing mitigation and technology pathway are limited. To date, New Zealand has developed energy efficiency indicators and monitoring/sector modelling system, the EECA’s Energy End Use Database (EEUDb) and OPENZ, which is an EECA-managed model designed to select from a wide range of technologies (about 500) to optimise the supply of end-use (usable) consumer energy in terms of energy efficiency, costs or
© O
ECD
/IEA,
201
7

8. ENERGY SYSTEM TRANSFORMATION OVERVIEW
175
PAR
T II.
EN
ERG
Y SY
STEM
TR
ANSF
OR
MAT
ION
emissions, through to 2050. The scope of the modelling system covers over 63 energy end-use categories (lighting, heating, transport, among others) in all sectors of the New Zealand energy market. Principal outputs are energy, emissions and cost savings compared to present technologies. A GHG marginal abatement cost curve is currently being incorporated into the model.
Figure 8.10 Historic and projected CO2 emissions in New Zealand
* IPPU = industrial processes and products use.Source: Ministry for the Environment (2015a).
The Paris Agreement sets a further collective aim to keep global temperature rise “well below 2°C” which, in IEA modelled scenarios, would require a near-decarbonisation of the global energy sector by around 2060 (see Box 8.1). The achievement of the 2050 goal (and certainly a more rapid decarbonisation in line with the global “well below 2°C” ambition) will require greater attention to targets and policies that put energy-sector emissions onto a firmly falling path and will require substantial investment in technological change in the core emission-intensive sectors.
Mitigation and adaptation
New Zealand relies on a mix of several policies to support mitigation efforts. This includes a price on carbon, through the New Zealand Emissions Trading Scheme (NZETS), action to improve energy efficiency and use of renewable energy as well as transport policies and agricultural research and development (R&D).
Adaptation
Projections by the Intergovernmental Panel on Climate Change (IPCC) suggest that the sea around New Zealand will rise by about 30 centimetres in the next 50 years. New Zealand is an island nation and most cities are within a few kilometres of the coast. Importantly, energy import terminals, such as ports and oil storage facilities are also located in coastal areas. At the same time, the country relies on hydropower to produce the lion’s share of its electricity. Recurring droughts represent one of the biggest risks to electricity security.
New Zealand’s planning framework is devolved to local authorities, who are required under the Resource Management Act to consider the effects of climate change in their planning decisions. This is supported by both information and guidance provided by the
0
10
20
30
40
60
70
80
90
100
1990 1995 2000 2005 2010 2015 2020 2025 2030
MtCO
-eq.
2
50
Waste
Agriculture
IPPU*
Transport
Energy excludingtransport
Historic data Projected data
© O
ECD
/IEA,
201
7

8. ENERGY SYSTEM TRANSFORMATION OVERVIEW
176
central government, for example on coastal issues, potential temperature and rainfall changes on a regional basis. New Zealand’s research institutions and power companies have also conducted research to understand the effects of climate change on New Zealand’s hydroelectric resources. However, to date New Zealand does not have a specific adaptation plan or strategies to assess the resilience of the energy sector to climate change impacts.
In 2015, the Parliamentary Commissioner for the Environment presented recommendations to the government to address the critical issue of rising sea levels (PCE, 2016), including the evaluation, planning and data gathering on rising sea levels, the assessment of coastal hazards, and the elaboration of coastal plans with the local communities.
Box 8.1 The Paris Agreement Under French Presidency of the 21st Conference of the Parties (COP21) negotiations of the United Nations Framework Convention on Climate Change (UNFCCC), the Paris Agreement on climate change was reached in December 2015 by 197 Parties, marking a milestone in global climate change efforts. The Paris Agreement is the first-ever global climate deal with obligations for all Parties. It is based on several key elements:
overall objective to limit the global average temperature rise to well below 2°C andpursuit of efforts to limit the temperature increase to 1.5°C
aim to reach global peaking of GHG emissions as soon as possible and to undertakerapid reductions thereafter, so as to achieve a balance between emissions andremovals in the second half of this century
self-determined actions by Parties to reduce emissions outlined in their nationallydetermined contributions (NDCs) and a commitment to review the NDCs every 5 years
common framework (with flexibility for countries that need it) to track progress towardand achievement of NDCs for all countries on the basis of a robust transparency andaccountability system
periodic collective stocktaking of progress toward the long-term aims of theAgreement.
Other outcomes of COP21 besides the adoption of the Paris Agreement were:
launch of Mission Innovation and the Breakthrough Energy Coalition and support foraccelerating technology innovation
highlighting the roles of cities, regions and local authorities, and of non-governmentalstakeholders in supporting climate change mitigation and adaptation
encouraging countries to develop long-term low-emissions development strategies.
With the signature of the Agreement in New York in April 2016, parties began joining the Agreement according to their own legal systems (through ratification, acceptance, approval, or accession). New Zealand ratified the Paris Agreement on 4 October 2016. On 4 November 2016, the Agreement entered into force, after the threshold was reached of at least 55 Parties which together represent at least 55% of global GHG emissions joining. As of 30 November 2016, 115 Parties had deposited their instruments of ratification, acceptance or approval.
© O
ECD
/IEA,
201
7

8. ENERGY SYSTEM TRANSFORMATION OVERVIEW
177
PAR
T II.
EN
ERG
Y SY
STEM
TR
ANSF
OR
MAT
ION
Mitigation
To meet its international obligations under the Kyoto Protocol, the government set up the New Zealand Emissions Trading Scheme (NZETS) in 2008, as the first non-EU country and OECD member. The scheme was designed to cover all gases and all sectors with different entry times (agriculture has not yet entered the scheme), including transport, forestry and energy, industrial processes and waste sectors. It currently covers half the country’s emissions.
Under the Climate Change Response Act 2002 (the Act), and the subsequent Climate Change (Emissions Trading) Amendment Act of 2008, all fossil fuel extraction companies have to pay for the carbon emissions associated with fossil fuel combustion.3
The NZETS did not initially have any quantitative limits on NZETS participants’ use of international units, as it was designed to ensure that the carbon price in New Zealand was the same as the international carbon price. When the price of international units collapsed from late 2011 onwards, the carbon price in New Zealand followed suit. From June 2015, the NZETS became a domestic-only scheme as participants can no longer surrender international units.
There are however still transitional measures in place that limit NZETS costs on participants, such as non-forestry participants only having to surrender one unit for two tonnes of emissions, and the NZD 25 fixed price option that limits the maximum unit price they are likely to face to NZD 25 or EUR 8.50 per tonne of CO2-equivalent (tCO2-eq).
New Zealand has an unconditional target to reduce emissions by 5% below 1990 levels by 2020, taken under the UNFCCC rather than the Kyoto Protocol. Since 2013 New Zealand has been largely excluded from the Kyoto market (maintaining access to primary CDM). The NZ ETS became a domestic scheme in 2015.
After a first statutory review under the Act in 2011, the NZETS legislation was amended in 2012. This Climate Change Response (Emissions Trading and Other Matters) Amendment Act 2012 was to allow the introduction of auctioning of units within an overall cap on non-forestry sectors (not yet implemented) and the transitional measures were extended.
As a result of the second statutory review of the Emissions Trading Scheme in 2015/16 (see Box 8.2), which is still ongoing, the government announced the phase-out of the one-for-two transitional measure. But other issues remain under consideration at the second stage of the review, including the unit supply (including forestry, international units and auctioning), managing price stability, future free allocation, operational and technical issues as well as addressing barriers to the uptake of low-emission technology.
The NZETS will need to evolve to assist the government in meeting its 2030 target and INDC, as well as to go through operational and technical improvements. The decarbonisation of the agriculture sector would require the best policy instrument available in the sector, which is not necessarily the NZETS. In August 2016, the 3 The Stationary Energy and Industrial Process (SEIP) sectors have been obliged to pay for carbon emissions under the Emissions Trading Scheme since 1 July 2010.
© O
ECD
/IEA,
201
7

8. ENERGY SYSTEM TRANSFORMATION OVERVIEW
178
government announced the establishment of a Biological Emissions Reference Group that will collaborate with Government to build the evidence base for reducing biological GHG emissions.
Outside carbon pricing, New Zealand uses exemptions or rebates from the road-user charge and the electricity levy as main tax incentives to stimulate energy efficiency or low-carbon sources.
Box 8.2 Review of the New Zealand Emissions Trading Scheme (NZETS) In 2015, the government started consultation for the second statutory NZETS review with two stages of the review. This review may result in several reforms to both the Climate Change Response Act 2002 (CCRA) and associated regulations. In May 2016, the government passed legislation to phase out the one-for-two transitional measure which allows up to now non-forestry businesses to pay one emission unit for every two tonnes of carbon dioxide-equivalent emissions. The Climate Change Response (Removal of Transitional Measure) Amendment Act 2016 phases out the one-for-two transitional measure gradually over three years from 1 January 2017. The gradual approach will allow the industry to plan and adjust, and support a more stable market. The 50% surrender obligation will increase to 67% from 1 January 2017, to 83% from 1 January 2018, and to a full surrender obligation from 1 January 2019 for all sectors in the NZETS. The removal of the “one-for-two” measure is expected to reduce the large number of units held by market participants, which will have two main effects: i) it will increase the carbon price and incentives to reduce emissions; and ii) it will bring the supply of units in the NZETS more into alignment with New Zealand’s 2030 target. The results of the second stage of the review may end in further amendments, to both the overarching legislation (the CCRA 2002), as well as to associated regulations.
Energy RD&D strategy
The New Zealand Energy Strategy (NZES, 2011-2021) prioritises public research funding to areas based on New Zealand’s resource strengths, and where there is commercial potential, such as bioenergy, marine, geothermal, petroleum resources, smart electricity network technologies and energy efficiency – for supply, infrastructure and demand.
The long-term framework strategy for the science system is the National Statement of Science Investment (NSSI, 2015-2025) which was released in October 2015 and contains an energy component. The NSSI, released in October 2015, sets the government’s long-term vision for the science system, and a strategic redirection to guide future investment. MBIE is responsible for administering the eleven National Science Challenges and annual funding, together with Crown Research Institutes (CRIs), Callaghan Innovation and private companies. New Zealand focuses more on the commercialisation of research results and innovation. The creation of a new Crown entity, Callaghan Innovation, in 2013 shows the ambition of the government to accelerate innovation in the country’s economy.
© O
ECD
/IEA,
201
7

8. ENERGY SYSTEM TRANSFORMATION OVERVIEW
179
PAR
T II.
EN
ERG
Y SY
STEM
TR
ANSF
OR
MAT
ION
In December 2016, the government presented in 2016 the Energy Innovation Bill - an omnibus bill amending the Electricity Industry Act 2010, the Energy (Fuels, Levies, and References) Act 1989, the Land Transport Act 1998, and the Road User Charges Act 2012.
Programmes and funding
Public spending on energy RD&D peaked in 2009 at USD 24 million. Since then, funding has been stable at about USD 16 million. By international comparison, New Zealand ranked among the IEA countries with the lowest level of public spending in 2014.
Figure 8.11 Government energy RD&D spending as a ratio of GDP in IEA member countries, 2014
0.0
0.2
0.4
0.6
0.8
1.0
1.2
1.4
Share
of G
DP (s
pend
ing p
er 1
000
GDP
units)
Nuclear
0
Notes: Includes demonstration. Data are not available for Greece, Hungary, Ireland, Korea, Luxembourg and Turkey. Source: IEA (2015), "RD&D Budget", IEA Energy Technology RD&D Statistics (database), www.iea.org/statistics/.
Up to 2015, the total RD&D budgets consisted of USD 152 million per year invested across six sector‐specific research funds: Biological Industries (USD 66 million), High‐Value Manufacturing and Services (USD 41 million), Environment (USD 23 million), Health and Society (USD 4 million excluding health research administered by the Health Research Council), Energy and Minerals (USD 8 million), and Hazards and Infrastructure (USD 11 million). In energy, the focus areas are in line with research priorities, and included renewable energies and energy efficiency but also fossil fuels. Until 2015, MBIE directly invested in a variety of sector-specific research projects via the annual contestable funding dedicated to energy, but this structure has been reformed in 2015.
In 2016, the funding moved from six separate, sector-specific funds to a single fund for excellent, impact-driven science, which no longer contains ring-fenced energy programmes. Budget 2016 adopted the Innovative New Zealand package, providing a total of NZD 410.5 million in operating funding up to 2020. The package included a reshaped MBIE Contestable Fund, the so-called Endeavour Fund (with NZD 113.8 million up to 2020).
© O
ECD
/IEA,
201
7

8. ENERGY SYSTEM TRANSFORMATION OVERVIEW
180
Figure 8.12 Government energy RD&D spending, including demonstration, 1987-2015
0
5
10
15
20
25
1987 1989 1991 1993 1995 1997 1999 2001 2003 2005 2007 2009 2011 2013 2015
USD
millio
nEnergy efficiency
Fossil fuels
Renewables
Nuclear
Hydrogen and fuel cells
Other power andstorage technologiesOther0
Notes: Data are not available for 1988, 1989 and 1992. Data are estimated for 2015. Source: IEA (2015), "RD&D Budget", IEA Energy Technology RD&D Statistics (database), www.iea.org/statistics/.
Innovation
In 2013, the government created the Ministry of Business, Innovation and Employment, bringing policies for innovation, science and economic and natural resources under one ministry. A new entity, Callaghan Innovation commenced its operations in February 2013 with the objective of supporting science- and technology-based innovation and its commercialisation by businesses, primarily in the manufacturing and service sectors, in order to improve their growth and competitiveness. Callaghan Innovation administers more than USD 98 million per year in business R&D grants. This comprises USD 67 million in 2014/15 for R&D growth grants, to support investment in firms with a track record in R&D, and USD 31 million in 2014/15 in targeted business R&D funding to support R&D investment. Callaghan Innovation also administers the USD 10 million repayable grants for start‐ups, which supports business incubator and accelerator activities.
Assessment
Since the IEA presented the last in-depth review in 2010, a key development has been the release of the New Zealand Energy Strategy (2011-21) and related New Zealand Energy Efficiency and Conservation Strategy (2011-16) and the upcoming new EECS for 2017-22. These strategies provide a clear set of overall policy priorities for the government, and some specific targets such as diversified resource development, strengthened environmental responsibility, efficient use of energy, and secure and affordable energy.
New Zealand has continued its very impressive progress in the use of renewable energy in the electricity sector, moving above 80%, of electricity production, closer to the target of 90% by 2025. The energy industry environment in New Zealand has seen rapid changes since the last in-depth review, including in the role of coal and natural gas across the sectors, as well as new fuels, like geothermal energy, becoming more important.
© O
ECD
/IEA,
201
7

8. ENERGY SYSTEM TRANSFORMATION OVERVIEW
181
PAR
T II.
EN
ERG
Y SY
STEM
TR
ANSF
OR
MAT
ION
Under the Paris Agreement, New Zealand announced a target to reduce GHG emissions by 30% below 2005 levels by 2030, and ratified the Paris Agreement on 4 October 2016. However, the path to achieve this target is not yet agreed. By 2050, the government aims to achieve a 50% reduction in GHG emissions below 1990 levels, and will need to consider deeper reductions in the energy sector in line with the global aim to keep a temperature rise “well below 2°C”. New Zealand's proposed 2030 INDC target could be achieved with strong reliance on international markets and forestry credits, but this is not necessarily consistent with the achievement of longer-term goals, which will possibly require the decarbonisation of the energy sector. Climate change response is an area where enhanced government involvement will be required. The government should seize the opportunity of developing a low-carbon strategy towards 2030-50 to set out the emission targets for sub-sectors, including the energy sector, industry, transport and agriculture.
Despite its almost decarbonised power generation, New Zealand’s carbon intensity is around the IEA average. Between 1990 and 2014, CO2 emissions from fuel combustion increased by 44% and current national projections indicate that emissions in the energy sector are to remain stable up to 2030 and in agriculture are to rise.
Around half the national emissions are from the agriculture sector, which is not included in the Emissions Trading Scheme (NZETS) and for which abatement pathways are unclear. The purchase of international emissions reduction units is currently expected to provide a substantial contribution to meeting climate targets. While there are some opportunities for forestry, which are funded through the ETS, the energy sector will need to achieve a greater percentage of domestic abatement than its share of emissions would suggest. By not moving strongly to a lower carbon footprint and designing adequate policies for decarbonisation, New Zealand may miss out on opportunities for innovation in energy systems and may run risks to its image as a clean and green producer.
The NZETS has not delivered sufficient incentives for changing investment or behavioural decisions in the energy system. Because of previously unlimited international reduction units, the collapse in the international carbon price, and the “two-for-one” surrender requirements, unit prices under the ETS remain low compared to levels that would drive significant decarbonisation of the energy sector, at around USD 13 per tonne CO2. As part of the ETS review in 2016, it has been decided to phase out the two-for-one credit system over three years from 1 January 2017. It is not clear how market forces will deliver on the energy transformation challenge.
Significant emissions improvements in the future will require more attention to other sectors, especially industry and transport, where many opportunities remain. While climate change is a major driver for considering such approaches, there are multiple economic and social benefits from pursuing these opportunities. New Zealand does not use carbon taxes to drive emissions reductions, but uses the electricity levy to finance energy efficiency programmes. Apart from the NZEECS, no detailed action plan has been adopted with milestones or benchmarks to implement the strategies and goals, to evaluate progress and to provide confidence to industry with regard to the future course of policy action. While the government has chosen to adopt this non-prescriptive approach, an action plan with clear milestones could help to provide an indication of realistic outcomes, and promising actions which show how the government is willing to
© O
ECD
/IEA,
201
7
8. ENERGY SYSTEM TRANSFORMATION OVERVIEW
182
work to deliver the goals, notably in the context of the energy transformation for the period 2020-30.
Under the NZEECS, the government’s energy efficiency target was to achieve a rate of energy intensity improvement of 1.3% per year. So far, this target has not been met; the energy intensity level in 2015 was the same as in 2011. New Zealand’s energy intensity is largely above the IEA average. Energy use in the services sector is on the rise (notably in buildings); industry/agriculture and transport are the largest consumers of energy. Energy demand in the residential sector, notably growth in electricity use, has stalled. Given different energy and emission profiles of end-user sectors, tailor-made energy policies would assist in giving investors long-term certainty and better end-user outcomes. Driving future energy intensity reductions could require a change in the energy efficiency strategy, and energy productivity targets by sector could effectively target the agriculture and transport sectors. The main energy efficiency framework is set under the Energy Efficiency and Conservation Act 2000 and the latest related Strategy which expired on 30 August 2016 and should be replaced by a new five-year strategy. In December 2016, the government presented for public consultation a replacement Strategy “Unlocking our energy productivity and renewable potential”.
New Zealand’s energy system is unique in many respects: Its geographical remoteness and relatively small size mean it must be robust against sudden changes in supply and demand of energy, which may depend on decisions about individual industrial plants. Its isolation from the global energy markets’ supply chain creates particular challenges to supply security. Low population density can both increase costs of providing energy services and increase the demand for distribution services. The country is endowed with a diverse range of energy sources, including competitive, zero-emission sources. Among IEA countries, New Zealand has the highest penetration of geothermal energy and a significant contribution of hydro. Without any direct subsidies or public support, the share of renewable electricity has grown in recent years, as geothermal, hydro and wind are cost-competitive. This performance is a world-class success story among IEA member countries. However, the match between locations of energy resources and energy demand is not perfect; the large hydro resources are susceptible to rapid and unpredictable effects from drought.
Besides abundant renewable energy, New Zealand has large reserves of coal and some reserves of natural gas and oil. Oil and coal are significant export industries for New Zealand, but low global energy prices have strongly impacted the upstream and mining sector. All natural gas consumed is domestically produced. Despite streamlined procedures and competitive regimes under the revised Minerals Act and Petroleum Action Plan whose aim is to encourage investment in mining and oil/gas exploration, because of the low energy price environment, no major finds have been made, and upstream investment has decreased strongly. Many coal mines are being closed.
New Zealand continues to implement a light-handed approach to government involvement in achieving outcomes in the energy sector where regulation allows considerable flexibility within an approach to managing monopoly elements, including a large and diverse range of distribution companies. Building on the Ministerial Review of 2010, the electricity market rules (the Electricity Industry Participation Code) are subject to continuous review and development. Energy markets in New Zealand are undergoing considerable change, leading to consolidation in oil and gas markets and to the creation of new retail electricity companies. The light-handed regulatory approach has led to a
© O
ECD
/IEA,
201
7

8. ENERGY SYSTEM TRANSFORMATION OVERVIEW
183
PAR
T II.
EN
ERG
Y SY
STEM
TR
ANSF
OR
MAT
ION
low-cost government overlay that continues to deliver reliable energy to all users. The energy market regulatory system has continued to adjust as needed to address emerging issues and explore areas for improvement. Since the last in-depth review, prices for natural gas have been relatively stable but margins for transport fuels and electricity prices have seen moderate but steady real growth for residential and industrial customers.
The government’s approach to energy efficiency has changed from direct financial support to a greater focus on information and partnerships. The framework is set under the Energy Efficiency and Conservation Act 2000 and the latest Strategy which expired on 30 August 2016. The government presented for public consultation a new Strategy to replace the NZEEC Strategy, a new five-year strategy with focus on energy productivity and renewable energy potentials. Within the context of the refreshed Strategy, the government is considering energy productivity targets, a renewable energy target across the total energy supply and greater alignment to the climate change agenda under the Paris Agreement. The review team sees considerable opportunities for the government to adopt actions to support the uptake of multiple benefits from energy efficiency, notably for health and the environment, fuels import dependence, affordability and energy security.
Whether a light-handed approach will deliver all key elements of the National Energy Strategy and NZEECS over time will depend largely on how it can accommodate future changes in the energy markets and the energy system, and on how carbon reductions in the energy sector are placed within New Zealand’s climate change strategy. Markets can most effectively deliver when investors and other participants have clear guidance on the government’s direction to help set priorities and reduce regulatory and commercial risks. Given the comprehensive and cross-cutting nature of the energy sector involving several ministries, the government is well placed to consult with the public and adopt and publish an overarching energy policy agenda of future actions, including the revised Emissions Trading Scheme review, steps to implement the electric vehicles package, a geothermal heat strategy, and electricity market reforms (for more details, see Chapter 9 on electricity and heat).
Following recent changes to R&D funding and innovation systems in New Zealand, delivering the right priorities when transforming the energy sector and developing the future of energy R&D is a challenge. Despite a 70% increase in funding for science and innovation during the period 2008-15, public spending on energy R&D peaked in 2009-10 and has declined since to about USD 15 million per year. Public spending is split into contestable funding and core funding, which is directly provided to the Crown Research Institutes to support basic R&D. Among the IEA countries, New Zealand ranks at the lowest level of public spending on energy R&D. In 2015, all contestable funds were merged into a single fund to support excellence and impact-driven science, in replacement of the dedicated energy and minerals research fund. With the new National Statement of Science Investment (2015-20) and the 11 National Science Challenges, the government no longer pursues a dedicated energy RD&D policy, but relies on the competitive market to identify the best technologies, alongside core funding to Crown Research Institutes and applied energy research, and commercialisation by the new Callaghan Innovation.
Commendably, the Energy Innovation Bill proposes important changes to improve the energy-related business model for emerging energy technologies, notably for electric
© O
ECD
/IEA,
201
7

8. ENERGY SYSTEM TRANSFORMATION OVERVIEW
184
vehicles, battery storage and electricity networks. The Bill is supporting the Government’s Electric Vehicles Programme, fosters the EV deployment with a new road user charge exemption for heavy electric vehicles until they make up two per cent of the fleet and amends the law so that Road Controlling Authorities can allow electric vehicles in special vehicle lanes, using best practise from Norway and California. The Bill also amends the levy funding of EECA and clarifies how electricity industry legislation applies to secondary networks.
New Zealand has been leading in areas of renewable energy, including bioenergy and geothermal. In the future, the country will be a technology taker in many areas. However, when assessing competitive technology projects, the government needs to develop an understanding of areas where it is a leader or where research is required. Developing an energy R&D strategy will help in assessing technology priorities, disruptive breakthrough technologies will need to be researched today if they should be deployed by 2030. The government should therefore review energy research priorities in collaboration with industry, academia and research institutes to ensure they are well aligned with the energy policy goals, including the decarbonisation of the energy sector.
Recommendations
The government of New Zealand should:
Drive decarbonisation of the economy through a series of integrated actions, including a low-carbon strategy and carbon budgets, an enhanced Emissions Trading Scheme and sectoral energy action plans, with a focus on transport and industry sectors.
In accord with the energy strategies, develop action plans and related policies with performance-based targets aligned with energy and climate goals through transparent consultation to provide a long-term and stable framework for energy investments.
Develop an energy technology R&D strategy to support energy and climate change goals, in collaboration with industry, academia, and Crown entities. Assess projects for core and contestable funding against the priorities of the energy sector R&D strategy.
References IEA (International Energy Agency) (2016a), Energy Balances of OECD Countries, OECD/IEA, Paris.www.iea.org/statistics/.
IEA (2016b), CO2 Emissions from Fuel Combustion, OECD/IEA, Paris.www.iea.org/statistics/.
IEA (2016c), Energy Efficiency Indicators: Highlights, OECD/IEA, Paris. www.iea.org/statistics/.
© O
ECD
/IEA,
201
7

8. ENERGY SYSTEM TRANSFORMATION OVERVIEW
185
PAR
T II.
EN
ERG
Y SY
STEM
TR
ANSF
OR
MAT
ION
IEA (2015), “RD&D Budget”, IEA Energy Technology RD&D Statistics (database). www.iea.org/statistics/.
Ministry for the Environment (2015a), New Zealand’s Second Biennial Report under the United Nations Framework Convention on Climate Change, Ministry for the Environment, Wellington.
Ministry for the Environment (2015b), New Zealand’s Greenhouse Gas Inventory 1990-2013, Wellington.
PCE (Parliamentary Commissioner for the Environment) (2016), Preparing New Zealand for Rising Seas: Certainty and Uncertainty, Wellington.
RSNZ (The Royal Society of New Zealand) (2016), Transition to a Low-Carbon Economy for New Zealand, Wellington
UNFCCC (United Nations Framework Convention on Climate Change), National Inventory Submissions 2015, accessed on 10 March 2016.
© O
ECD
/IEA,
201
7

187
PAR
T II.
EN
ERG
Y SY
STEM
TR
ANSF
OR
MAT
ION
9. Electricity and heat
Key data (2015)
Total electricity generation: 44.2 TWh, +2.9% since 2005.
Electricity generation mix: hydro 55.5%, geothermal 17.8%, natural gas 15.5%, wind 5.3%, coal 4.3%, biofuels and waste 1.4%, solar 0.2%).
Electricity consumption: industry 35.4%, residential 31.5%, commercial and other services 31.4%, other energy 0.2%, transport 0.2%.
Heat supply: 4.65 Mtoe (fossil fuels 73%, bioenergy 21%, geothermal 6%)
Overview
New Zealand has a largely decarbonised power generation and is among the IEA’s leading members in terms of renewable energy share in total primary energy supply (TPES), thanks to the success of geothermal energy. The renewables share in electricity was the second-highest behind Norway.
Heat is mainly used in the industry sector (80% of the total process heat) and agriculture. However, these sectors still use fossil fuels, mainly coal and gas for their chemical/petrochemical and agricultural processes, and have challenges to further switch to cleaner fuels, amid record-low coal prices in the absence of a strong carbon price. Renewable heat, including geothermal is developing fast and offers new opportunities. The government expects the efficiency of the industrial sector’s use of process heat could be raised by 12% during 2010-30.
Supply and demand
Generation
New Zealand’s electricity generation was 44.2 terawatt-hours (TWh) in 2015, which is 2.9% higher than in 2005. During 2010-15, total generation fell slightly by 1.5% after peaking at 44.9 TWh in 2010, ending years of continuous growth since 1973 (Figure 9.1).
Over the past decade, electricity generated from renewable energy sources increased by 28%, while their share of the total rose from 64.4% in 2005 to 80.2% in 2015, thanks to higher hydro and geothermal generation. Notably, growing baseload geothermal energy has reduced electricity generated from natural gas or coal.
© O
ECD
/IEA,
201
7

9. ELECTRICITY AND HEAT
188
In 2015, New Zealand produced most of its electricity from zero- or low-emission sources – hydro (55.5% of total generation) and geothermal (17.8%) in particular, with smaller additions from wind (5.3%), biofuels and waste (1.4%) and solar (0.2%). This is the highest annual share of electricity generated from renewables since 1995. On average, geothermal grew by 10% per year over the ten years from 2005 to 2015, while wind grew by 15% and biofuels and waste by around 2% per year. Solar power has been growing from a very low baseline, and recently growth has accelerated to reach around 1 MW per month.
Electricity from renewable sources amounted to 35.5 TWh in 2014, or 80.2% of total generation. Renewable sources include hydro (24.5 TWh or 55.5%), geothermal (793 TWh or 17.8%), wind (2.4 TWh or 5.3%), biofuels and waste (0.6 TWh or 1.4%) and solar (0.1 TWh or 0.2%). Electricity generated from renewables has increased by 28.1% over the past ten years, up from 37.7 TWh in 2005 or 64.4% of total generation. Hydropower in electricity increased by 5.1% while geothermal power boomed at 9.5% per year over the same period, increasing its share from 7.4%. Wind power also experienced robust growth at 14.4% per year over the same period, while electricity from solar and biofuels and waste remained relatively low.
Figure 9.1 Electricity generation by source, 1973-2014
0
5
10
15
20
25
30
35
40
45
50
1973 1976 1979 1982 1985 1988 1991 1994 1997 2000 2003 2006 2009 2012 2015
TWh
Oil*
Coal
Natural gas
Biofuels and waste
Hydro
Solar
Wind
Geothermal
* Negligible. Source: IEA (2016a), Energy Balances of OECD Countries, www.iea.org/statistics/.
Hydropower is the primary source for electricity production in New Zealand. For the last two decades, electricity generated from hydro maintained an average of 24 TWh per year but its availability was highly volatile year-on-year. In 2015, it accounted for 55.5% of electricity generation (or 24.5 TWh), down from 76.3% in 1995 but up from 54.3% in 2005. Consistent hydro inflows in 2015 resulted in a 1% increase in hydropower supply compared to 2014. In years of lower hydro availability, electricity demand has been supported also by generation from natural gas and geothermal power which is a competitively dispatchable generation source. New Zealand’s annual water storage capacity is limited, at around 3 600 gigawatt hours (GWh), equivalent to approximately ten weeks of winter demand (or six weeks, depending on the reference year); therefore, hydro generation is sensitive to the level of water inflows from rainfall and melting snow. For this reason, when inflows are low for a sustained period, thermal energy sources have replaced hydro generation.
© O
ECD
/IEA,
201
7

9. ELECTRICITY AND HEAT
189
PAR
T II.
EN
ERG
Y SY
STEM
TR
ANSF
OR
MAT
ION
Geothermal continued to grow in 2015, staying ahead of gas generation for the second consecutive year. Geothermal capacity increased by 82 megawatts (MW) in 2013 and by 166 MW in 2014, which has reduced natural gas use. Geothermal energy is mostly consumed for electricity generation, which accounts for 94.2% of total geothermal energy, most of which is generated from high-temperature fields. These fields are partially constrained for development owing to preservation requirements for scientific and tourism uses, but the government and developers recognise that geothermal electricity generation is one of the lower-cost options. The potential of the lower-temperature resources for direct heat uses or binary-cycle electricity generation is recognised but not yet developed fully. Another 4.2% of geothermal energy is consumed for industry such as paper and pulp production, while 1.6% is for commercial, and for the agriculture and forestry sector.
Figure 9.2 Electricity generation by source in IEA member countries, 2015
0% 20% 40% 60% 80% 100%
SwitzerlandNorwaySwedenFranceCanada
Slovak RepublicNew Zealand
FinlandAustria
HungaryDenmarkBelgium
SpainPortugal
United KingdomGermany
Czech RepublicItaly
LuxembourgUnited States
TurkeyKoreaGreeceIrelandJapan
NetherlandsEstonia*Poland
Australia
Oil Coal Peat Natural gas Nuclear Biofuels and waste Hydro Wind Solar Geothermal
New Zealand
Note: Data are estimated. * Estonia’s coal represents oil shale. Source: IEA (2016a), Energy Balances of OECD Countries, www.iea.org/statistics/.
Wind energy has seen a continuous but small growth since 2005, accounting for a total of 690 MW (more than coal-fired capacity). However, deployment slowed down in recent years. Solar energy is used, though not yet widely, for water heating in residential and commercial applications and increasingly for electricity production throughout New Zealand. It accounts for 0.3% of households and commercial demand. Bioenergy generation is principally based on solid biomass consumed at co-generation plants located at wood-processing factories and on biogas produced from wastewater treatment
© O
ECD
/IEA,
201
7

9. ELECTRICITY AND HEAT
190
plants and landfills. New Zealand makes use of bioenergy as substitutes for coal or gas in process heat, and for coal, gas or electricity in the residential sector. In 2014, biofuel supplied 13.7% of industry demand and 4.2% of households’ and commercial sector’s demand; 73.5% of total biofuel demand was from industries such as wood processing while 13.7% was used for electricity generation, 11.9% for direct heating in households and 0.4% for commercial and public services. Biomass is made from crops or animal by-products, but these release no net emissions when used carbon is absorbed and stored as crops grow. On the other hand, the road transport sector began utilising biofuels in 2007 although still at a negligible level. New Zealand particularly sees its further potential in transport, with growing competitiveness of prices based on the country’s climate and agricultural history.
Natural gas accounted for 15.5% of total generation in 2015 (or 6.9 TWh). Along with an increase in geothermal capacity, there has been a noticeable decrease in gas generation. It reached a local peak of 11.8 TWh in 2007 and by 2015 had fallen by 42%. Coal accounted for 4.3% of electricity generation and is being progressively phased-out. Over the past years, electricity generated from coal fell by 68% during 2005-15. The last coal-fired power plant (Huntly, operated by Genesis Energy) announced in 2016 to maintain its generating capacity up to 2022. Oil in diesel-fired peaking capacity has successfully been phased-out from electricity generation, with a minor share of 0.002% in 2015.
In comparison to other IEA member countries, New Zealand’s share of fossil fuels in electricity generation was seventh-lowest in 2015 (Figure 9.2), with the sixth-lowest share of coal use and virtually no use of oil.
Demand
New Zealand’s electricity consumption amounted to 39.2 TWh in 2014, 3.3% up from 2004. Consumption has been relatively stable during the past decade, at an average 39 TWh, after reaching its peak of 39.4 TWh in 2006-07. During 2008-09, demand fell by 1.6% in the wake of the global financial crisis followed by a 2.7% recovery in 2010, and remained constant since (Figure 9.3).
Figure 9.3 Electricity consumption by sector, 1973-2014
0
5
10
15
20
25
30
35
40
45
1973 1975 1977 1979 1981 1983 1985 1987 1989 1991 1993 1995 1997 1999 2001 2003 2005 2007 2009 2011 2013
TWh
Industry
Transport*
Energy**
Residential
Commercial***
Note: Breaks in the series exist in residential and commercial consumption between 2007 and 2008 because of revisions of the NACE classifications. * Negligible. ** Energy includes coal mining, oil and gas extraction, and refining. *** Commercial includes commercial and public services, agriculture, fishing and forestry. Source: IEA (2016b), Electricity Information, www.iea.org/statistics/.
© O
ECD
/IEA,
201
7

9. ELECTRICITY AND HEAT
191
PAR
T II.
EN
ERG
Y SY
STEM
TR
ANSF
OR
MAT
ION
Industry is the largest electricity-consuming sector, accounting for 35.4% of total demand (or 13.9 TWh). Demand peaked in 2005 at 15.3 TWh (39.9% of total) and has been falling since, representing a 9.4% decrease. The Rio Tinto aluminium smelter in Invercargill, located at the bottom end of the South Island, comprises around 15% of New Zealand’s electricity demand and about half the South Island’s demand. Its electricity is supplied from the national grid, although annual demand is roughly equivalent to the annual output of the nearby 850 MW Manapouri hydro station. Demand from the smelter has been decreasing and while Rio Tinto has a fixed price contract for much of its volume, it has an option to terminate this contract in the coming years if it wishes to cease production. During the last five years, the iron and steel sector saw the largest decrease in demand, followed by a decline in coal mining, resulting in an 11.8% fall. Demand by the wood, wood products and paper sector continued to fall in 2014, 26.7% down from 2009, recording its lowest level since 1987.
The residential sector and the commercial and public services (including agriculture) account for 31.5% and 31.4% of demand, respectively. Demand from households has increased by a marginal 0.5% over the past years. An increase in the commercial and public services sector is noticeable at 22.7% for the last decade.
Consumption in the agriculture and forestry sector increased by 41.5% as more land is required for bigger herds. And dry soil conditions have increased demand for irrigation in the last few years.
Demand for electricity in the energy sector (mainly for petroleum refining, coal mining and oil and gas extraction) amounted to 0.2% of total demand. Although it is small, it still increased by 21.4% for the last decade, the main drivers being oil and gas extraction and refining processes.
Transport consumed another 0.2% in 2014 and demand is relatively unchanged, at 62 GWh.
Heat supply and demand
In 2014, New Zealand had 4.65 Mtoe of heat supply: 73% stemmed from non-renewable sources (fossil fuels), 21% from bioenergy and 6% from geothermal. Heat was mainly used in industry (73%) and agriculture and fishery (11%), besides residential buildings (8%) and commercial and public buildings (8%).
New Zealand has excellent geothermal potential. Geothermal power generation (26.13 petajoules) exceeds direct use for heat (11.66 PJ), with heat applications primarily industry-based. For example, the Kawerau geothermal field has provided process steam to timber mills, and pulp and paper manufacturing since 1957 (Carey et al., 2015). In 2010, supply was expanded to a tissue manufacturing facility. Before 2013, the Kawerau site accounted for half New Zealand’s direct geothermal heat use and used half the world’s total direct geothermal industrial energy. However, with lower global consumption of newsprint, one of the two paper production lines was closed at the beginning of 2013, significantly reducing direct use at that site.
The government set a target in its Energy Efficiency Strategy for business to use by 2025 up to 9.5 PJ per year of energy from woody biomass or the direct use geothermal
© O
ECD
/IEA,
201
7

9. ELECTRICITY AND HEAT
192
additional to that used in 2005. Between 2005 and 2014 (the latest data available), growth in the direct use of geothermal was only 2.26 PJ, while the use of biomass actually declined. If present growth rates continue, this target is unlikely to be achieved. There are no financial support mechanisms or other incentives to stimulate the market. The new strategy under consultation provides for the increase of renewables and efficient use of process heat, with the objective to decrease industrial emissions by 1% per year on average during 2017-22.
Significant new development is taking place in Christchurch where the central business district is being rebuilt after major earthquake damage. This includes several energy nodes to provide heating and cooling to large commercial and service facilities. The systems will include heat pumps using the local aquifer as a low-grade heat source. As the rebuilding continues over the next five or so years, these systems will come into operation. New Zealand has around 600 000 residential heat pumps – a roughly 30% market penetration.
Figure 9.4 Heat supply and demand in New Zealand, 2014
73%
8%
8%
11%
Industry
Residential buildings
Commercial + public buildings
Agriculture, fisheries, other
73%
6%
21%
Non-renewables
Geothermal
Bioenergy
Total heat4.65 Mtoe
Source: IEA (2016a), Energy Balances of OECD Countries, www.iea.org/statistics/.
Policies and measures
The New Zealand Energy Strategy 2011-21 defined a target of 90% renewable electricity by 2025. The growth has been strong over the past decade. Over the next one, the government expects significant growth in geothermal and wind generation. In 2011, the government introduced the National Policy Statement for Renewable Electricity Generation 2011 (NPSREG). The NPSREG is intended to promote a more consistent approach to balancing the competing values associated with the development of New Zealand’s renewable energy resources when local authorities take decisions on resource consent applications. The NPSREG is expected to give greater certainty to renewable energy projects, and help New Zealand achieve the government’s target of 90% electricity from renewable sources by 2025. The NPSREG applies to all types of renewable electricity generation activities (hydro, wind, geothermal, solar, biomass and marine) at any scale. The NPSREG was expected to have a positive net quantifiable benefit of approximately NZD 5.6 million. The government is currently undertaking an evaluation of the outcomes of the NPSREG.
There are no subsidies provided to renewable energy production in New Zealand. The main factors promoting renewables are their favourable economics. This is a result of good renewable resources, uncertainty over long-term thermal fuel supply contracts, and future carbon price risk. The government is committed to ensuring that the Resource
© O
ECD
/IEA,
201
7

9. ELECTRICITY AND HEAT
193
PAR
T II.
EN
ERG
Y SY
STEM
TR
ANSF
OR
MAT
ION
Management Act (RMA) provides greater certainty for communities to plan for, and meet, their area’s needs in a way that reduces costs and delays. The Resource Legislation Amendment Bill has been adopted in 2016 and should achieve:
better alignment and integration across the resource management system
proportional and adaptable resource management processes
robust and durable resource management decisions.
The electricity sector is likely to be at the forefront of the energy system transformation. The government has taken strong actions since the 2010 Ministerial Review of the Electricity Market to ensure security of supply through market measures during dry years and low hydro basins (see Chapter 5 on electricity). Beyond reform and system adequacy, future policy action towards the transformation of the energy system will have to address questions related to the energy system, including the provision of backup capacity in dry years in the light of decreasing fossil fuel availability but increasing shares of renewables and assess the impacts on the electricity distribution sector. Those two special focus areas are subject to dedicated chapters 6 and 7 in Part I.
Assessment
New Zealand has a largely decarbonised electricity generating system. It is well endowed with renewable energy sources; in 2015, they represented 80.2% of total electricity generation, the second-highest among IEA member countries (after Norway) thanks to legacy hydro (which provides 58% of supply) and new geothermal investments. While there is some further development of hydro, there are significant remaining resources from geothermal, wind, biomass and solar sources which could be used to achieve the current 90% renewables target and potentially contribute to emission reductions and higher efficiencies in process heat used in industry and agriculture.
High levels of renewable energy growth have been achieved without specific renewable support schemes since generation has been cost-competitive within the electricity system, given the extremely favourable resource conditions. As geothermal capacity has continued to expand, wind capacity has stalled, notably because New Zealand’s electricity demand is going through a period of low to zero growth in demand. Other countries with similar (or worse) wind resources have seen more extensive deployment of wind, and at lower costs, than in New Zealand, but have achieved this through competition for generation via long-term power purchase agreements. The grid integration of wind power, the way wind generators can participate to the dispatch and short-term balancing markets should be reviewed to improve market signals for wind power investment, as explained in more detail in the Chapter 5 on electricity. The Electricity Authority is reviewing the gate closure times, which is a welcome step in the right direction.
Distributed solar PV has been growing rapidly (in the context of the electricity supply system), adding 1 MW per month as this is an increasingly attractive option for households. This rapid growth may pose some issues for distribution companies and may need some further work to identify these issues, including consumer information and the appropriate regulatory responses.
© O
ECD
/IEA,
201
7

9. ELECTRICITY AND HEAT
194
Despite the high levels of renewable generation, and the replacement of some gas generating capacity with geothermal, fossil fuel capacity still plays an important role. Currently the Huntly coal-fired power plant has served as main backup plant in the North Island in addition to several gas-fired power plants, and this capacity plays an important role for electricity security, especially in dry years.
In addition to weak investment signals in an energy-constraint system, there are considerable uncertainties with regard to future electricity demand and supply which complicate the prospects for future investment in electricity supply. These uncertainties include:
the potential relocation of globally competitive energy-intensive industries (such as the Rio Tinto aluminium smelter which accounts for 15% of national electricity demand)
the availability of the Huntly coal-fired capacity after 2022
the longer-term availability of hydro resources amid water quality concerns, possible climate change impacts hydrologic patterns as well as increases in consumer demand for distributed generation
the shortfall in discoveries of exploitable new offshore resources and uncertainty over long-term gas supplies
future risk of carbon pricing
the system limits imposed by the thin and stringy transmission network which carries risk of significant physical disruption and cost.
The government recognises that there are emerging challenges to ensure a continuous level of security of supply. The recent agreements among market participants to keep the Huntly plant in business until 2022 help to address possible short-term concerns about generation adequacy but do not resolve the longer-term issue of whether the market will be able to deliver sufficient backup security of supply in a situation of 90% (or more) renewable energy. (Electricity security and implications of moving beyond 90% renewable electricity are discussed further in Part I, Chapter 5 and Chapter 6).
The regulatory framework takes hydropower into consideration, notably in the freshwater regulation, where the continued supply of freshwater for use in primary production and tourism is included (see New Zealand’s National Policy Statement on Renewable Electricity Generation 2011 and the National Policy Statement on Freshwater Management 2014). However, water usage limits should reflect the importance of hydropower for security of supply.
New Zealand also has extensive renewable resources that could be used to produce heat in the industrial and housing markets, notably from geothermal and biomass. There has been some development of geothermal for these purposes, but progress in developing renewable heat is slow because of competition from low-cost coal in the industry sector (for example in milk drying), and because of institutional and locational problems. Given that heat production is a significant source of energy-related CO2 emissions, these renewable options could play an important role alongside energy efficiency in their reduction. (These opportunities and barriers are discussed further in the following sections dealing with the different end-use sectors.).
© O
ECD
/IEA,
201
7

9. ELECTRICITY AND HEAT
195
PAR
T II.
EN
ERG
Y SY
STEM
TR
ANSF
OR
MAT
ION
Recommendations
The government of New Zealand should:
Ensure the continued growth of renewable electricity through a series of measures:
> Take the strategic role of hydropower and security of supply aspects fully into account when setting new limits for water usage in dry periods.
> Consider appropriate measures to unlock cost-effective generation from the extensive set of wind projects, notably through revised rules for the integration of wind power in the grid and markets.
> Undertake a detailed evaluation of solar photovoltaic and its role in the energy system to ensure cost-effective growth in the market.
Encourage the development of system flexibility through distributed generation, energy efficiency, smart grids, demand response, demand aggregation and other innovative services.
Consider and encourage a greater contribution from renewable heat in the industrial, agricultural and buildings sectors.
References
Carey et al. (2015), 2010-2015 New Zealand Country Update: Proceedings World Geothermal Congress 2015, Melbourne, Australia, 19-25 April, 2015.
IEA (International Energy Agency) (2016a), Energy Balances of OECD Countries, OECD/IEA, Paris, www.iea.org/statistics/.
IEA (2016b), Electricity Information, OECD/IEA, Paris,. www.iea.org/statistics/.
© O
ECD
/IEA,
201
7
10. INDUSTRY
197
PAR
T II.
EN
ERG
Y SY
STEM
TR
ANSF
OR
MAT
ION
10. Industry
Key data (2015)
Energy consumption in industry: 6.2 Mtoe (natural gas 42.7%, electricity 19.2%, biofuels and waste 13.7%, oil 12.3%, coal 8.8%, geothermal 3.2%), +15% since 2004
Share of total final consumption*: 49%
Share of total CO2 emissions*: 22%
*Excluding the agriculture sector.
Overview
New Zealand has several energy-intensive industries, including important metal manufacturing, petrochemical and agricultural production which benefit from low-cost coal and oil reserves. Consumption in industry is mainly driven by the availability of natural gas and coal for production rather than by global economic cycles. In 2014, for the first time, coal use in industry overtook coal use in power generation, while natural gas use increased for methanol production. The competitiveness of New Zealand’s industry depends on the cost of fuel. However, the future of industry is also linked to general economic trends in the emerging economies in Asia, one of the key markets for New Zealand export products.
Energy consumption and efficiency
Industry is the largest energy-consuming sector in New Zealand, with final consumption of 6.2 million tonnes of oil-equivalent (Mtoe) in 2014 or 43.3% of total final consumption (TFC). Industry demand peaked at 6.2 Mtoe already in 2002, reaching a record share in TFC of 45.6%. During 2002-09, industry demand contracted by 24.8%, which led to a significant fall in the sector’s share of TFC down to 37% (or 4.6 Mtoe). The sector recovered and increased energy consumption to a new record level in 2014. Consumption increased as industry started using natural gas again for methanol production, thanks to gas finds from small fields at low prices. Over the past five years, growth of industry demand contributed to almost 90% of total growth in TFC, while other sectors showed marginal changes. New Zealand has the fourth-largest share of industry in TFC among IEA member countries.
Power generation and industry sectors accounted for 18.3% and 21.8% energy-related CO2 emissions in 2014, respectively. Other energy industries, including transformations and energy own-use, emitted 5.4% of total energy-related CO2 emission in 2014.
© O
ECD
/IEA,
201
7

10. INDUSTRY
198
Steel and cement manufacturing using coal, oil and electricity are responsible for most of the CO2 emissions, in addition to coal use in industry for generating process heat (as in agriculture).
Agriculture consumed 0.8 Mtoe in 2014, of which included 57% oil, 31% electricity, 5% coal, 5% natural gas and 2% geothermal. Total energy consumption has fluctuated in the sector in the last decade, but with an overall increase of 15% from 2004 to 2014. The largest increase by fuel in the sector is from coal, which more than tripled over the period, despite a fall of 54% from a peak in 2012. However, coal is still a small part of total TFC. Electricity consumption increased by 93% in agriculture in 2004-14.
Figure 10.1 TFC by source in the industry sector, 1973-2014
0
1
2
3
4
5
6
7
1973 1975 1977 1979 1981 1983 1985 1987 1989 1991 1993 1995 1997 1999 2001 2003 2005 2007 2009 2011 2013
Mtoe
Oil
Coal
Natural gas
Biofuels and waste
Electricity
Geothermal
Note: Including non-energy use, excluding agriculture. Source: IEA (2016a), Energy Balances of OECD Countries, www.iea.org/statistics/.
Figure 10.2 TFC by source in the agriculture sector, 1973-2014
0
0.1
0.2
0.3
0.4
0.5
0.6
0.7
0.8
0.9
1973 1975 1977 1979 1981 1983 1985 1987 1989 1991 1993 1995 1997 1999 2001 2003 2005 2007 2009 2011 2013
Mtoe
Oil
Coal
Natural gas
Electricity
Geothermal*
*Negligible. Source: IEA (2016a), Energy Balances of OECD Countries, www.iea.org/statistics/.
Consumption breakdown
Industry sector’s fuel consumption is made up of natural gas (42.7% of the total), electricity (19.2%), biofuels and waste (13.7%), oil (12.3%), coal (8.8%) and geothermal (3.2%). Over the past decades, natural gas consumption has varied significantly, from 45% of total energy demand in 2000 to just over 20% in the years 2005-08, and then
© O
ECD
/IEA,
201
7

10. INDUSTRY
199
PAR
T II.
EN
ERG
Y SY
STEM
TR
ANSF
OR
MAT
ION
back up to 43% in 2014. Natural gas is a flexible fuel, responding to changes in total energy demand in the industry sector. Other energy sources show less variation, with levels of coal (around 0.5 Mtoe), oil (around 0.8 Mtoe) and electricity (around 1.2 Mtoe) being relatively constant. Biofuels and waste energy increased steadily from being introduced as a fuel in the 1970’s to 1.0 Mtoe in 2005, and has since been rather stable around that level. Use of geothermal energy is increasing and has replaced electricity for direct-use heat applications in various industries. However, geothermal energy only contributes to around 3% of total energy consumption in the industry sector.
Over 60% of total energy consumption in New Zealand’s industry is consumed in three sectors: wood and wood products consuming 1.0 Mtoe in 2014, food and tobacco 0.9 Mtoe, and chemical and petrochemical industry 0.8 Mtoe (see Figures 10.3). These industries together have increased by 33% from 2004 to 2014. If one includes agriculture in the industry sector, it represents the fourth-largest consuming industry (0.8 Mtoe). Energy intensity in these industry sectors has increased between 1% and 12% from 1990 to 2014. This indicates that there is room for energy efficiency improvements in the industry sector (see Figure 10.4).
Figure 10.3 Energy consumption in selected industries and agriculture, 1990-2014
0
1
2
3
4
5
6
1990 1993 1996 1999 2002 2005 2008 2011 2014
Mtoe
Agriculture*
Other industry sectors**
Chemical and petrochemical
Wood and wood products
Food and tobacco
* Agriculture includes forestry and fishing. ** Other industries includes: iron and steel, non-ferrous metals, non-metallic minerals, machinery and transport equipment, mining and quarrying, paper, pulp and print, construction, textile and leather, and other non-specified industries. Source: IEA (2016a), Energy Balances of OECD Countries, www.iea.org/statistics/.
The breakdown of the industry sector’s energy consumption shows that a large part of the decoupling between energy use (TFC index) and economic activity stems from structural changes in industry, like the relocation and change in production processes and innovation.
Figure 10.5 illustrates the decomposition of the decoupling of energy consumption development (TFC index) from economic growth into the three key components: the changes in production (activity index), processes (structural index) and actual energy efficiency (intensity index).
© O
ECD
/IEA,
201
7

10. INDUSTRY
200
Figure 10.4 Energy intensity in selected industries, 1990-2014
0
0.2
0.4
0.6
0.8
1
1.2
1.4
Chemical and petrochemical Wood and wood products Food and tobacco Agriculture, forestry and fishing
Energ
y int
ensity ind
ex (1
990=
1)1990
2002
2014
Note: Energy intensity measured as MJ/USD PPP, indexed for 1990. Source: IEA (2016b) Energy Efficiency Indicators: Highlights, www.iea.org/statistics/.
Figure 10.5 Industry TFC broken down into activity, structural changes and energy intensity, 2014
0.60
0.80
1.00
1.20
1.40
1.60
1.80
2.00
1990 1992 1994 1996 1998 2000 2002 2004 2006 2008 2010 2012 2014
Index
Activity index
TFC index
Intensity index
Structure index
00
Note: Excluding agriculture. Source: IEA (2016b) Energy Efficiency Indicators, www.iea.org/statistics/.
The use of process heat in industry accounts for 165 petajoules (PJ) per year in final energy demand and only a third is based on renewable energy (geothermal and bioenergy), as illustrated in Figure 10.6.
There are key opportunities for renewable sources to make a contribution to energy supply, carbon reductions and economic benefits, such as the use of biomass from the forestry sector for heating (South Island) and the use of high-temperature geothermal heat for industrial heating (North Island). Current coal prices and the low energy content of biomass compared to coal have been obstacles for the switching of large industrial users in the South Island to biomass. At the same time, biomass has also considerable greenhouse gas (GHG) emissions and cannot be seen as low-carbon in a lifecycle analysis.
© O
ECD
/IEA,
201
7

10. INDUSTRY
201
PAR
T II.
EN
ERG
Y SY
STEM
TR
ANSF
OR
MAT
ION
Figure 10.6 Heat demand and supply in industry, 2014
73%
8%
8%
11%
Industry
Residential buildings
Commercial + public buildings
Agriculture, fisheries, other
78%
4%
18%
Non-renewables
Geothermal
Bioenergy
Total heat4.65 Mtoe
Industry heat3.37 Mtoe
Source: IEA (2016a), Energy Balances of OECD Countries, www.iea.org/statistics/.
Policies and measures
Substantial efforts are made to develop energy management in industry and bioenergy for industrial heat processes, notably through the Energy Efficiency and Conservation Authority (EECA) partnerships with the top 60 and the top 200 largest energy-using businesses. In 2015-16, these partnerships resulted in a combined annual energy savings of 0.6 petajoules, annual cost savings of NZD 12.5 million, and carbon reductions of 37 000 tonnes (EECA, 2016), covering almost 40% of industrial demand.
EECA partners with five industry groups that provide services to large and medium energy users – the Sustainable Business Council, the Energy Management Association of New Zealand, Target Sustainability (Christchurch City Council), the Facilities Management Association of New Zealand, and the Bioenergy Association. EECA is in the process of changing its role to one of facilitator, leaving the specific management of energy reduction plans to industry and energy-services providers. Companies are encouraged to fulfil agreements once these have been signed with government. To date, 74 agreements have been signed with industry.
A 9.5-PJ target for renewable heat by 2025 was established under the New Zealand Energy Efficiency and Conservation Strategy (NZEECS). There have been programmes to examine the greater use of biomass in agriculture. Wood-based heating is not cost-effective when coal and carbon prices are low, and users are not yet confident that a reliable supply chain for wood fuel can be established. EECA and Venture Southland are helping by funding (NZD 1.5 million over 3 years, 2014-17) feasibility studies for conversion to wood, and to help develop clusters of suppliers and users to organise sustainable supply chains. A stronger carbon price in New Zealand could provide a more important incentive to switch for industrial users.
Case study: The changing role of coal
Supply
New Zealand has extensive coal resources and has been a net exporter of hard coal for the past four decades. However, coal supply decreased by 37.6% between 2005 and 2015, from 2.2 Mtoe to 1.4 Mtoe or 6.7% of total primary energy supply (TPES) in 2015, owing to the fast growth in natural gas, geothermal and wind energy in power generation and the general collapse of hard-coal mining in the country. Hard-coal net exports
© O
ECD
/IEA,
201
7

10. INDUSTRY
202
amounted to 1.3 million tonnes (Mt) in 2015, with 1.3 Mt of exports and marginal imports, while brown-coal net imports amounted to 0.4 Mt, but marginal exports. Coal net exports in 2015 were 25% lower than in 2005.
Historically, during 2002-05, coal supply increased by 93%, reaching its record-high 2.2 Mtoe in 2005, replacing decreasing gas supply in power generation. Despite a 25% recovery of coal supply during 2010-12, coal use in power generation has been on a downward trend again in the recent four years (Figure 10.7).
Figure 10.7 Coal supply by source, 1973-2015
-4
-2
0
2
4
6
8
1973 1976 1979 1982 1985 1988 1991 1994 1997 2000 2003 2006 2009 2012 2015
Mt
Stock changes
Import
Indigenous production
Exports
Inland consumption
Source: IEA (2016c), Coal Information, www.iea.org/statistics/.
New Zealand’s coal resources are largely located in the Waikato and Taranaki regions of the North Island and on the West Coast, and in Otago and Southland regions of the South Island (see Figure 10.10). North Island coals are all sub-bituminous. All of New Zealand's bituminous resources are on the West Coast of the South Island, which also has some sub-bituminous deposits. Otago and Southland also have sub-bituminous deposits, but principally host New Zealand's extensive lignite resource. National in-ground resources of all coals are over 16 billion tonnes, but 80% of this is South Island lignite. Remaining bituminous and sub-bituminous coal resources are only about 4 billion tonnes. The economically recoverable proportion of the coal that remains is much smaller and is heavily dependent on price. Lignite is New Zealand’s largest known fossil-fuel energy resource. The main deposits are well known. Technically recoverable quantities in the ten largest deposits have been estimated at over 6 billion tonnes, but this does not take account of mining economics and environmental constraints.
New Zealand exports hard coal, all of which is coking coal, mainly to India (58%) and Japan (24%), with smaller quantities going to China (12%) and South Africa (6%). The country’s bituminous coal is internationally recognised for its low-sulphur contents and other characteristics such as high swelling, fluidity and reactivity, which allows blending with other coals for use in the steel industry. Coal imports started in 2000. Imports amount and sources vary year-on-year, although the period 2004-06 exceptionally saw a surge in brown coal imports, from 0.8 Mt to 1.2 Mt, before declining to no imports at all in 2012. In 2014, coal imports rebounded to 0.4 Mt, with brown coal from Indonesia and hard coal from Australia (Figure 10.8).
© O
ECD
/IEA,
201
7

10. INDUSTRY
203
PAR
T II.
EN
ERG
Y SY
STEM
TR
ANSF
OR
MAT
ION
Figure 10.8 Coal net exports by country source, 1990-2015
-3
-2
-1
0
1
2
1990 1995 2000 2005 2010 2015
MtIndia
South Africa
Japan
Chile
Indonesia
China
Australia
Other
Net exports
Imports
Exports
Source: IEA (2016c), Coal Information, www.iea.org/statistics/.
Demand
In 2014, the industry sector as a whole consumed 40.3% of primary coal supply: brown coal mainly for food, beverages and tobacco industries and hard coal for non-metallic minerals industry. The power generation sector accounted for 35.3%, while the rest of the industry sector consumed 19.2%, mainly for steel production. NZ Steel is the largest consumer of coal, ahead of the Huntly coal-fired power plant.
Overall coal demand has declined by 34.6% over the past decade, while all sectors except for industry and agriculture saw a decrease in coal use (Figure 10.9). Demand from the power generation sector decreased remarkably by 60.8%, from a share of 58.9% to 35.3% for the same period. This contributed significantly to the decrease of total coal consumption. Industry use declined by 2.3%, but its share increased from 26.9% to 40.3%, surpassing the share of power generation for the second time since 2002.
In 2014, the consumption of coal in industry for the first time overtook coal use in electricity generation. Energy-intensive industries have increased their coal use (dairy industry) and a large number of small industrial and commercial users have no cost-effective alternative to coal. Genesis Energy shut down 50% of the country’s only coal-fired power plant at Huntly (2 x 250 MW), cancelled its coal import contracts and is running on domestically sourced coal only. With Huntly coal power plant consuming less, NZ Steel is becoming the largest user of coal.
Hard-coal use has been decreasing, while steam coal use in food and beverages industry has continued to increase, in dairy manufacturing in particular, which slowed down the rate of decline. The agricultural sector use has been increasing but is volatile in consumption, representing a 211% increase in 2004-14 despite a recent 54% drop from 2012. Households and the commercial sector consume coal at a marginal level.
© O
ECD
/IEA,
201
7

10. INDUSTRY
204
Figure 10.9 Coal demand (in terms of TPES) by sector, 1973-2014
0
0.5
1
1.5
2
2.5
1973 1975 1977 1979 1981 1983 1985 1987 1989 1991 1993 1995 1997 1999 2001 2003 2005 2007 2009 2011 2013
Mtoe
Power generation
Other energy*
Agriculture**
Industry***
Residential
Commercial****
* Other energy includes energy use in the energy sector, not used for direct energy transformation, including “other transformation” (e.g. conversion losses, for instance in blast furnaces) and ‘’own-use and losses” (e.g. coal mines' own-use of energy, power plants' own consumption (which includes net electricity consumed for pumped storage) and energy used for oil and gas extraction, and also losses in coal transport). ** Agriculture includes forestry and fishing. *** Industry includes non-energy use, including iron and steel production. **** Commercial includes commercial and public services. Source: IEA (2016a), Energy Balances of OECD Countries, www.iea.org/statistics/.
Coal industry
International prices of hard coal have declined sharply in recent years, worsening the economics of hard coal mining for exports. Solid Energy, the state-owned coal mining company, still produces most (75% in 2014) of New Zealand’s coal. Several of its mines have suffered from production and staff cuts (Huntly East mine and Stockton) to save costs, and the Spring Creek mine has been placed into “care and maintenance”. In August 2015, Solid Energy was placed under voluntary administration by its Board of Directors after posting several losses. Solid Energy’s creditors voted in September 2015 and approved a managed sell-down of the company’s assets, which is expected to be completed by the end of 2016. In 2009, Solid Energy and other companies were exploring several unconventional coal projects, including a lignite briquetting project, several coal-seam gas prospects and an underground coal gasification project. None of these projects proved to be commercially viable. Coal resources in the North Island are dwindling and several mines have closed. Mining projects have been deferred with knock-on effects on the local/regional economic development (see Figure 10.10). The Rajah and Huntly East underground coal mines have recently closed. The Pike River mine accident of November 2010 required its sealing. New Zealand made further efforts to ensure coal mining continues to take place in an environmentally acceptable and safe manner. The government also took on all of the environmental liabilities for the closure of the mines from Solid Energy. In the future, the government should ensure that companies take care of remediation and do not shift the responsibility to the state.
On the production side, major changes impact the long-term coal outlook. In 2014, New Zealand produced 4 Mt of coal (3.5 Mt in 2015), down from 5.3 Mt in 2010. In 2014, production consisted of 1.9 Mt of bituminous coal and 1.7 Mt of sub-bituminous coal (all considered to be hard coal). Most of bituminous coal production was produced from opencast mines by Solid Energy and was exported (1.7 Mt in 2014, down from 2 Mt in 2009), as coking coal to India and Japan, but also to China and South Africa.
© O
ECD
/IEA,
201
7

10. INDUSTRY
205
PAR
T II.
EN
ERG
Y SY
STEM
TR
ANSF
OR
MAT
ION
Figure 10.10 Coal mines in New Zealand
© O
ECD
/IEA,
201
7

10. INDUSTRY
206
Coal imports in the North Island have decreased to 0.5 MT in 2014 (from 0.7 MT in 2009), as Huntly cancelled its imports. Conversely, coal production in the South Island has increased to meet growing process heat demand from the dairy industry. Exports of South Island coal are deferred until international prices are up again, to cover the transport costs from the West Coast to the coal terminal located on the East Coast. There are sufficient thermal coal resources in the South Island for domestic use for the foreseeable future. However, South Island domestic supply has so far been disconnected from global trade and dairy industry is now looking for imports.
After the closure of two units, Genesis Energy intended to close the remaining two coal units of the Huntly in 2018. On 28 April 2016 it announced it would maintain operations until 2022. Huntly is the main backup power plant during dry years and droughts, and the system operator will need to evaluate the impact of the planned closure on the system operation and stability. On the other hand, the future shut-down of Huntly and the closure of the mines will also lead to reductions in GHGs. In its projections, MBIE already estimates coal use to be fully phased out in power generation (if Genesis Energy closes the Huntly power plant in 2022) and will remain at its high level for industrial applications (process heat in food processing) and steel and cement manufacturing. As the Climate Change Response Act (2002) and its Climate Change Amendment Act (2008) stipulate, the New Zealand Emissions Trading Scheme (NZETS) obliges coal companies to pay for emissions associated with the combustion of coal and stationary energy. Industrial process sectors are included in the NZETS since 1 July 2010.
The government contributes to international efforts to deploy carbon capture and storage (CCS) technology and coal companies are actively involved in CCS demonstration abroad. The government completed the work on an enabling framework for CSS in New Zealand, including the geological, technical, commercial and legal aspects.
Assessment
Energy consumption has risen in the energy-intensive industry sector, in step with the global demand for New Zealand’s products. Major fuel users include aluminium and steel production, wood, pulp and paper, food processing and chemical businesses. Coal use in power generation has been on the decline for many years. Today, apart from the NZ Steel mill, the dairy industry is a major user of coal for the production of dried milk.
To date, the Energy Efficiency and Conservation Authority (EECA) has concluded 74 voluntary agreements with the 200 largest energy-consuming companies (which together consume 70% of non-transport energy in New Zealand’s business sector), and in the past provided grant funding for business energy-efficiency programmes. These EECA business partnerships cover about 40% of industry demand and resulted in 2015 in combined annual energy savings of 0.6 PJ, in annual cost savings of USD 8.7 million, and annual carbon reductions of 37 000 tonnes (EECA, 2016). EECA is in the process of changing its role to one of facilitator, leaving the specific management of energy reduction plans to industry in partnership with energy services providers. Companies are encouraged to fulfil agreements once they have been signed with the government.
EECA should consider rolling out these agreements across the remaining large energy users, to further increase carbon emission reductions (while encouraging greater industrial competitiveness). In addition, the government should consider benchmarking
© O
ECD
/IEA,
201
7

10. INDUSTRY
207
PAR
T II.
EN
ERG
Y SY
STEM
TR
ANSF
OR
MAT
ION
industries against their international peers, evaluating their performance and publishing best practice and results (because of the country's size, benchmarking may not be sufficiently meaningful at a solely domestic level). This would encourage the sharing of best practices, provide a reputational driver for voluntary adoption of energy efficiency improvements, carry along reductions in carbon emissions, and help improve competitiveness of New Zealand’s industry.
There are several options available to New Zealand as ways of improving the energy and carbon performance of the industry sector through improved efficiency and by using renewable sources of energy for industrial process heat. This would improve the competitive position of these industries at the international competition and improve the reputation of the industry in an increasingly carbon-sensitive world market.
Heat use in industry offers excellent opportunities for further decarbonisation. Despite a target in the Energy Efficiency and Conservation Strategy, the government has not proposed specific actions to achieve the target and challenges remain in establishing reliable data needed to track progress. The new strategy should place a greater focus on the heat sector and propose milestones and actions, based on best practice and technology R&D experience.
The government supported actions to encourage large industrial users located in the South Island to switch from coal (today their only fuel in the absence of gas or geothermal) to biomass, through promotional activities and technical assistance, as well as through grants issued by the EECA. However, current carbon and coal prices do not encourage the switch.
Geothermal is another major resource which could be used for heat in industry. New Zealand has world-class expertise in developing its geothermal resource. Geothermal is already used at a number of industrial sites, including at Kawerau’s pulping plant, the world’s largest geothermal industrial site. Access to low-cost heat can be an incentive for industry to locate close to a source, and can also stimulate local economic development. The principal barriers to wider uptake are the need for co-location of the heat source and heat load, and a lack of user industry’s awareness and knowledge of the opportunities. There is an industry-based geothermal heat strategy and interest/engagement from regional development agencies, but limited central government or agency engagement in this sector. A more proactive government approach could accelerate progress by working with industry to improve data collection, helping industry to improve awareness and knowledge of the opportunities, and in promoting successful projects.
Since the last IEA in-depth review, the coal demand/supply outlook has dramatically changed, impacting New Zealand’s coal producers. Global coking coal prices collapsed and so did coking coal exports. The government contributes to international efforts to deploy CCS and coal companies are actively involved in CCS demonstration abroad. However, the potential contribution of CCS for climate change mitigation in New Zealand may be limited, as there are only a few large-scale CO2 emission sources and collecting and storing them from smaller-scale or distributed sources will be more challenging. The government completed the work on an enabling framework for CSS in New Zealand, including the geological, technical and commercial, and legal aspects. However, to date, no commercial or demonstration plant has been deployed.
© O
ECD
/IEA,
201
7

10. INDUSTRY
208
Recommendations
The government of New Zealand should:
Continue to support energy efficiency improvements in the industry sector, including by a roll-out of energy efficiency and conservation (EECA) partnerships to all large energy users, by implementing international benchmarking together with industry, on the basis of evaluation and publication of best practice and results across the industry sector.
Take a co-ordinating role, working with industry and other bodies to produce a targeted action plan for renewable heat in the industry sector (taking account of both the bioenergy and geothermal potential) and to improve the data required to track progress.
References EECA (Energy Efficiency and Conservation Authority) (2016), Annual Report 2015-16, EECA, Wellington.
IEA (International Energy Agency) (2016a), Energy Balances of OECD Countries, OECD/IEA, Paris.www.iea.org/statistics/.
IEA (2016b), Energy Efficiency Indicators: Highlights, OECD/IEA, Paris, www.iea.org/statistics/.
IEA (2016c), Coal Information, OECD/IEA, Paris, www.iea.org/statistics/.
© O
ECD
/IEA,
201
7

209
PAR
T II.
EN
ERG
Y SY
STEM
TR
ANSF
OR
MAT
ION
11. Transport
Key data (2014)
Energy consumption: 4.7 Mtoe (oil 99.8%, electricity and biofuels 0.1%), +4% since 2004
Share of total final consumption: 33%
Share of total CO2 emissions: 45%
Overview
There is no car manufacturing industry in New Zealand as the country relies on imports of second-hand (50%) and new cars from Asia (50%), notably from Japan. The update of the vehicle fleet is slow and depends on improvements in vehicle fuel economy in Japan and other markets. There are no blending requirements to foster alternative fuels, including biodiesel and bioethanol, and the country does not have vehicle fuel efficiency or emission standards apart from the vehicle exhaust regulation.
The government presented ambitious targets to deploy larger shares of electric vehicles (EVs), through the Government Electric Vehicle Programme and the Energy Innovation Bill under discussion in Parliament. As EVs become cost-competitive in the coming years, New Zealand has a substantial opportunity from weaning its transport sector off oil and improving low-carbon mobility between its larger cities.
Energy consumption and efficiency
New Zealand’s transport sector consumed 4.7 million tonnes of oil-equivalent (Mtoe) in 2014, representing 32.9% of total final consumption (TFC). This share of TFC is the eighth-highest share recorded among IEA member countries. Transport demand has been relatively flat in the past decade, with a 3.8% increase from 2004 to 2014.
Transport is the largest CO2 emitting sector (accounting for 44.6% in 2013). Transport relies on oil for 99.8% of its energy needs. Of the oil products, over 50% is motor gasoline, 42% is diesel oil and 6% is kerosene-type jet fuel, with small additions of fuel oil, liquefied petroleum gases and natural gas, and a lower share of biofuels and waste (0.1%) and electricity (0.1%). Biofuels were only introduced to the transport sector in 2007.
© O
ECD
/IEA,
201
7

11. TRANSPORT
210
Figure 11.1 TFC by source in the transport sector, 1973-2014
00.51
1.52
2.53
3.54
4.55
1973 1975 1977 1979 1981 1983 1985 1987 1989 1991 1993 1995 1997 1999 2001 2003 2005 2007 2009 2011 2013
Mtoe
Oil
Natural gas*
Biofuels and waste*
Electricity*
* Negligible. Note: Coal use ceased in 2011 and biofuels and waste use began in 2007. Source: Source: IEA (2016a), Energy Balances of OECD Countries, www.iea.org/statistics/.
Consumption breakdown
Energy consumption in New Zealand’s transport sector is mainly from road transport, with over 90% of total transport energy demand (Figure 11.2). The rest comes from domestic aviation, domestic navigation and rail transport. Road transport comprises mainly passenger cars and freight trucks.
Figure 11.2 Transport energy by subsector and vehicle type, 2014
Water2%
Air6%
Rail1% Passenger cars
54%
Freight trucks34%Buses
2%
Motorcycles1%
Road91%
Source: IEA (2016b) Energy Efficiency Indicators: Highlights, www.iea.org/statistics/.
Looking at the sector’s energy efficiency, growth in energy demand for transport is closely related to an increase in travelling, while any structural effect of innovation and technology change in the sector has been relatively unchanged (Figures 11.5 and 11.6), unlike other markets. Passenger transport grew significantly during the 1990s (Figure 11.3). Since 2004, the number of passenger cars has stabilised while the total passenger transport has continued to increase, mostly through increases in airline travel.
© O
ECD
/IEA,
201
7
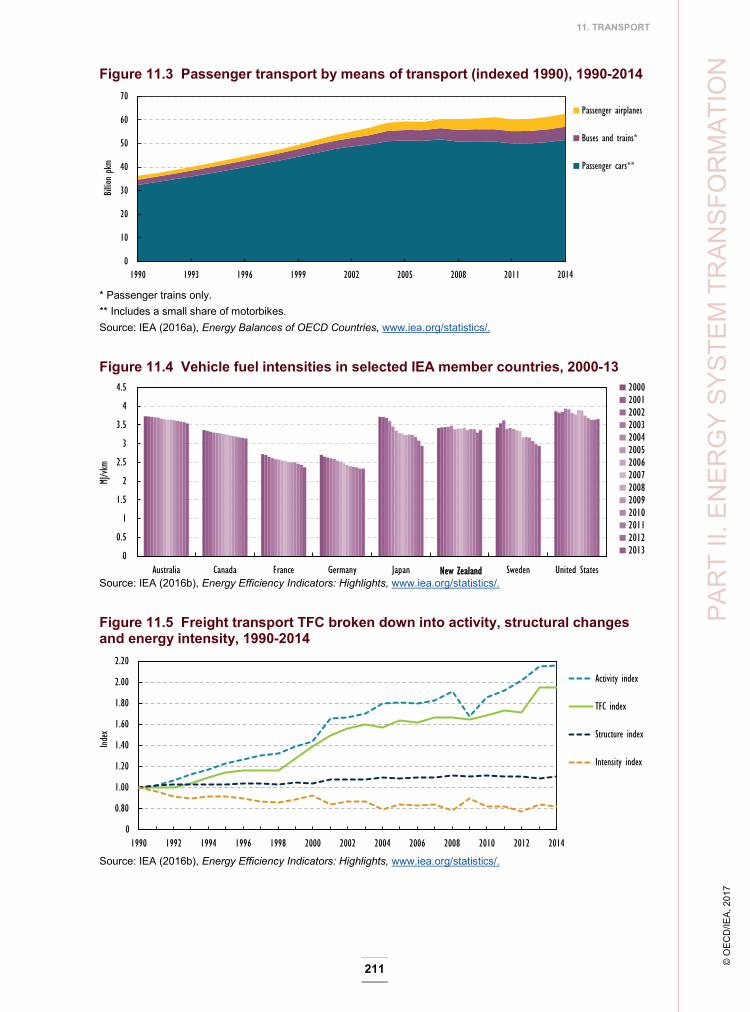
11. TRANSPORT
211
PAR
T II.
EN
ERG
Y SY
STEM
TR
ANSF
OR
MAT
ION
Figure 11.3 Passenger transport by means of transport (indexed 1990), 1990-2014
0
10
20
30
40
50
60
70
1990 1993 1996 1999 2002 2005 2008 2011 2014
Billio
n pk
mPassenger airplanes
Buses and trains*
Passenger cars**
* Passenger trains only. ** Includes a small share of motorbikes. Source: IEA (2016a), Energy Balances of OECD Countries, www.iea.org/statistics/.
Figure 11.4 Vehicle fuel intensities in selected IEA member countries, 2000-13
0
0.5
1
1.5
2
2.5
3
3.5
4
4.5
Australia Canada France Germany Japan New Zealand Sweden United States
MJ/vk
m
20002001200220032004200520062007200820092010201120122013
New Zealand Source: IEA (2016b), Energy Efficiency Indicators: Highlights, www.iea.org/statistics/.
Figure 11.5 Freight transport TFC broken down into activity, structural changes and energy intensity, 1990-2014
0.60
0.80
1.00
1.20
1.40
1.60
1.80
2.00
2.20
1990 1992 1994 1996 1998 2000 2002 2004 2006 2008 2010 2012 2014
Index
Activity index
TFC index
Structure index
Intensity index
00
Source: IEA (2016b), Energy Efficiency Indicators: Highlights, www.iea.org/statistics/.
© O
ECD
/IEA,
201
7

11. TRANSPORT
212
Figure 11.6 Passenger transport TFC broken down into activity, structural changes and energy intensity, 2014
0.60
0.80
1.00
1.20
1.40
1.60
1.80
1990 1992 1994 1996 1998 2000 2002 2004 2006 2008 2010 2012 2014
Index
Activity index
TFC index
Structure index
Intensity index
00
Source: IEA (2016b), Energy Efficiency Indicators: Highlights, www.iea.org/statistics/.
Policies and measures
New Zealand has no domestic car manufacturing and its remote location limits the options for imports which mainly come from the Asian region. By international comparison, New Zealand has one of the highest car ownership rate - 629 passenger vehicles per 1 000 people at the end of 2015 (Ministry of Transport, 2015). The car fleet consists mainly of second-hand foreign cars, re-sold from Japan and the global car market. New Zealand has a relatively old private-vehicle fleet (the average age of the light vehicle fleet was 14 years in 2016). This means that, even with improvements in vehicle technology, and since half the cars entering are seven or more years old, it will take a long time for New Zealand to update its vehicle fleet and make an impact on average fuel consumption.
Depending on the import region, vehicle fuel efficiency in New Zealand should largely follow the technology developments in Japan and other key markets (see Figure 11.4). However, there is no obvious correlation between progress in fuel efficiency in New Zealand and Japan. While Japan has improved fuel efficiency (from 10 to 8 litres/100 vehicle kilometres [vkm]), New Zealand’s fuel efficiency levels remained stable at 10 litres/100 vkm. And although car use has increased, fuel efficiency is not rewarded by tax incentives. To date, New Zealand applies a vehicle exhaust regulation (through the Land Transport Rule: Vehicle Exhaust Emissions 2007) and mandatory fuel economy labelling, which was introduced in 2008 and has a voluntary heavy-vehicle fuel efficiency programme, launched in 2012. Air quality levels for cars equal Euro 5 level for new cars and Euro 4 for imported second-hand cars. New Zealand also allows US, Japanese or ADR (Australian Design Rule) standards.
Outside of vehicle exhaust regulation, New Zealand has no mandatory vehicle fuel efficiency standards and no vehicle emission standards, which would require new legislation. Rather than introducing new legislation, the government currently pursues an approach to tighten existing exhaust and fuel-quality standards.
Transport is included under the national Emissions Trading Scheme and bioethanol is exempted. Aside from those actions, the government has no particular targets or
© O
ECD
/IEA,
201
7

11. TRANSPORT
213
PAR
T II.
EN
ERG
Y SY
STEM
TR
ANSF
OR
MAT
ION
subsidies for biodiesel/ethanol, as the introduction of mandatory blending requirements failed. Instead, fuel-quality specifications address those standards.
New fuel-quality standards were presented in December 2016, amending the Engine Fuel Specifications Regulations of 2011. The changes include reducing the sulphur allowed in petrol from 50 to 10 parts per million; introducing a total oxygen limit, which potentially allows a wider range of fuel blends; and raising the biodiesel blend limit in diesel from five to seven per cent. However, the reduction in sulphur in petrol from 50 parts per million (ppm) to 10 ppm will not take place until 1 July 2018. Ethanol is exempt from excise duty but biodiesel is subject to road-user charges. All other things being equal, this favours ethanol over biodiesel. However, the uptake of ethanol has been tiny and the only planned new biofuel plant in the country is biodiesel – Z Energy’s 20 million litre tallow to biodiesel plant, which opened in July 2016. The current business case for biodiesel is low, and so are incentives to switch from diesel use to alternative uses.
Biofuels-related policies include the zero-rating of biofuels under the New Zealand Emission Trading Scheme and the exemption of bioethanol from excise tax. Between 1 July 2009 and 30 June 2012, the government implemented the Biodiesel Grants Scheme. The scheme discontinued because the government shifted its focus from subsidising first-generation biofuels to research and development into more advanced biofuels.
Crown research institutes, such as SCION and NIWA, are involved in bioenergy-related research, while the Energy Efficiency and Conservation Authority (EECA) works with the Bioenergy Association of New Zealand to undertake activities that support the development of the bioenergy market. The government also provided funding for biofuels research projects. A biofuel roadmap is under preparation by SCION and the Ministry of Business, Innovation and Employment (MBIE). The private sector also plays an important role by showing leadership in the development of biofuels. For example, Z Energy built a plant in South Auckland to convert meat waste into biodiesel, which is expected to produce 20 million litres of biodiesel per year. Z Energy has also partnered with Norske Skog to work on the biofuel modification and optimisation to produce petrol and diesel that meet New Zealand’s fuel quality specifications. DB Breweries and Gull have entered into a partnership to launch a new biofuel made from a beer by-product.
Case study: Electrification of the transport sector
Progress in battery technology and stronger support mechanisms have recently enabled a rapid growth in electric vehicles (EV), with different policy approaches resulting in large variations worldwide. New Zealand has shown rapid uptake in EVs off a low base, going from around 1 000 vehicles at the end of 2015 to around 2 500 at the end of 2016. By international comparison, New Zealand has a small EV market today, but offers excellent conditions for the further electrification of the car fleet. With renewable energy providing 80% of electricity, electrification of the transport sector can ensure an important part of the transformation and decarbonisation of the energy system. The government announced its support for EV market development in a new Electric Vehicle Programme.
© O
ECD
/IEA,
201
7

11. TRANSPORT
214
Benefits and challenges for EVs
Transport uses on average one-third of total energy consumption in IEA member countries and the sector is a main producer of greenhouse gas (GHG) emissions globally. EVs are more energy-efficient than internal combustion engine vehicles (ICV) and enable low-carbon emissions if the electricity is supplied by renewable energy sources. Furthermore, EVs can reduce local air pollution and noise levels in urban areas. For oil-importing countries with high reliance on fossil fuels in the transport sector, EVs can also provide improved energy security.
Table 11.1 Summary of benefits and barriers for EV market development
Benefits Barriers
Low GHG emissions High investment cost
Improved local air quality Limited driving range
Reduced noise levels Lack of infrastructure
Increased energy security Lack of consumer confidence
Despite the potential benefits of EVs, development of the market has been slow. Important barriers to growth in the EV market are high capital costs for the vehicles, limited driving range, lack of charging infrastructure and lack of confidence in the technology from consumers (IEA, 2016a). The driving range is mainly a technical challenge that can be met by improved battery technology, while other challenges need policies for EVs to be more competitive.
EV markets worldwide
The global EV car fleet has grown rapidly in the last five years, with a hundredfold increase from 12.5 thousand in 2010 to 1.26 million in 2015 (see Figure 11.7). The United States had the largest number of EVs with 404 000 in 2015, followed by China, which tripled its EV fleet in one year to 312 000. Norway had the fifth-largest EV fleet with 71 000 cars, and by far the highest share of EVs per capita.
Policies implemented to support EV market development can be divided into regulatory measures, financial incentives and other instruments. Tailpipe emission and fuel economy standards, such as the Euro classification in Europe, are regulatory measures used by most countries. Financial incentives can be either investment support such as an exemption from the value-added tax (VAT), or incentives to lower the cost of owning the car, such as exemption from annual or circulation taxes. Incentives can target EVs directly or be based on emission standards, enabling other low-carbon technologies to utilise the system. Other support instruments can be non-financial support such as waivers on access restrictions, providing EV drivers access to bus lanes or specific parking spaces. Many countries also support investment in charging infrastructure.
Norway has adopted a comprehensive support system, including investment support through large tax exemption (VAT and registration tax), discount on road tolls and access to bus lanes. EVs represented 23% of all new cars sold in Norway in 2015, far more than in any other country. Norway makes an interesting comparison to New Zealand, since
© O
ECD
/IEA,
201
7

11. TRANSPORT
215
PAR
T II.
EN
ERG
Y SY
STEM
TR
ANSF
OR
MAT
ION
the two countries resemble each other in terms of population density, stringy electricity network and the large share of renewables in electricity generation.
Figure 11.7 Global electric vehicle fleet per country, 2005-15
0
200
400
600
800
1 000
1 200
1 400
2005 2006 2007 2008 2009 2010 2011 2012 2013 2014 2015
Thou
sand
cars
Others*
Germany
United Kingdom
France
Norway
Netherlands
Japan
China
United States
Note: Both battery electric vehicles (BEV) and plug-in hybrid electric vehicles (PHEV) are included. *Others include Canada, India, Italy, Korea, Portugal, Spain and Sweden with more than 2 000 EVs, and another 25 countries with smaller shares. Source: IEA (2016c), Global EV Outlook 2016, OECD/IEA, Paris.
EV market development in New Zealand
New Zealand has suitable conditions for large-scale EV implementation. The high share of renewable energy in electricity generation would enable a low-carbon transport sector and at the same time provide reduced oil imports. Most car owners in New Zealand have access to off-street parking in a garage or carport and research on driving patterns indicate that 90% of vehicles are parked overnight at private residences. This allows good charging possibilities, even before having access to an extensive public charging infrastructure system. Commuters also travel relatively short distances, suitable for EVs with a limited driving range (CAENZ, 2010).
Despite this, EV market development is slow and, with a low turnover of cars, any changes to the car fleet take time. To drive the longer-term transformation of the transport sector, essential infrastructure and policies will need to be developed and implemented. In May 2016, the government presented the Electric Vehicle Programme, which sets a target of doubling the number of EVs every year to reach approximately 64 000 by end of 2021. The government aims to promote EVs by extending the Road User Charges exemption on light EVs and introducing a Road User Charges exemption for heavy EVs until they make up 2% of the fleet. An information campaign with USD 0.7 million per year over five years will address public awareness and uncertainty over EV performance, and the government will set up a contestable fund of up to USD 4.2 million per year over five years to promote low-emission vehicle innovation. In addition to allowing electric vehicles in bus lanes and high-occupancy vehicle lanes on the state highway network and local roads, a review of taxation is also proposed. The package aims to address barriers to the uptake of EVs, including the limited availability of models in New Zealand, lack of awareness and misconceptions about electric vehicles, and a lack of widespread public charging infrastructure (Ministry of Transport, 2016).
Experience from other countries points to the benefits of other policy options, including emission regulations and new subsidy schemes, or the public sector leading by example
© O
ECD
/IEA,
201
7

11. TRANSPORT
216
in the EV fleet. New Zealand stands out as one of few countries without regulation of vehicle fuel efficiency (Barton and Schütte, 2015). Fuel economy or emissions standard regulation can further be linked to an investment subsidy or a feebate1 type system, which other countries have found necessary to drive a substantial scale-up of EVs. A fee-bate system has the benefit of being self-funded, while a subsidy scheme, such as the tax exemptions used in Norway, requires governmental funding. The creation of special lanes for electric vehicles has been a success in Norway and California and New Zealand is going to implement this system, next to changes in the electricity distribution networks under the Energy Innovation Bill which should enter into force on 1 July 2017.
Electric vehicles are likely to be used by commuters to and in and between the large cities in the North Island. This will require the electricity distribution system to be adapted to the larger use of EVs and to battery charging during the peak/off-peak hours. To date, New Zealand’s power system is baseload, relying on hydro and geothermal. Increasing shares of variable renewables, including solar PV and wind power, may have impacts on the local system operation in some areas. In the past, the vertically integrated companies used the ripple-control water heating for balancing the system. Electric vehicles could play a new demand-side management function if the distribution regulation and network operators support the roll-out and operation of these private and public charging points (see also Chapter 7 Special Focus 2 on electricity distribution development).
Assessment
Energy intensity in transport has barely improved over recent decades, in contrast to other IEA countries which saw strong improvements.
To drive the longer-term transformation of the transport sector, the IEA review team encourages the government to adopt a portfolio of options and to direct its action and support to areas where business opportunities may lie in both the short and longer term.
The government has provided significant investment in sustainable transport options, including USD 230 million for cycle lanes, plus major public transport upgrades in Auckland. The government should ensure it continues to consider the energy and carbon impact of its strategic investment in the transport sector and review policies which do not encourage optimal low-carbon strategies.
The car market in New Zealand is up to 50% based on imports of second-hand cars, mostly from Japan. The country’s authorities only regulate pollutants from motor vehicles, in accordance with the Land Transport Rule: Vehicle Exhaust Emissions 2007. International practice indicates that improving vehicle fuel efficiency and vehicle emissions standards are the most effective measures available. The government is introducing improved fuel quality standards from 2016 onwards. This provides also an opportunity to introduce increased vehicle emissions standards for
1 Feebate refers to a bonus/malus system, in which those who perform badly pay a fee that is rebated to the better performers. A bonus/malus system is currently being considered by the Swedish government.
© O
ECD
/IEA,
201
7
11. TRANSPORT
217
PAR
T II.
EN
ERG
Y SY
STEM
TR
ANSF
OR
MAT
ION
all imported (new and used) vehicles. In addition, the government could review its current taxation policy and adopt a coherent, comprehensive and efficient system of fuel and vehicle charges, including vehicle registration, road charges, and excise duties geared to low-carbon mobility.
Several attempts to stimulate the market for biofuels since 2008 have failed, including the proposal for blending mandates, abolishing the differential excise duty relief of ethanol versus biodiesel and EECA grants. Fuel quality limits allow retail blends of up to 10% ethanol in gasoline and 5% of bio-content in diesel (with a possible move to 7% in the near term) and commercial diesel users can use higher biodiesel shares. There is no blending obligation for either fuel, and uptake is low. Currently, ethanol users benefit from an exemption of excise duty on the fuel, while diesel users (including biodiesel) are subject to a mileage rather than fuel-based road user charge (no excise duty on diesel). The commercial case for domestic growth in ethanol production is limited, and there is capacity to produce domestic biodiesel from tallow, but as an internationally traded product, domestically produced, that will need to be competitive with imported biodiesel. The government should consider encouraging biodiesel use through a financial incentive or rebate, or by introducing an excise duty on diesel, commensurate to that for ethanol, and should consider the gradual introduction of mandatory minimum biofuel standards as part of fuel specifications or new mandates. SCION and MBIE are producing a biofuels roadmap which is a welcome step.
Fuels produced from the readily available wastes, residues and by-products from the forestry sector could be another alternative. These will need to be produced by advanced biological or thermochemical processes, currently under development. New Zealand has considerable industrial and academic expertise in these fields and could play a leading role in their development and commercialisation, both in New Zealand and abroad.
In a country with a largely decarbonised power sector, using EVs represents a major opportunity to reduce transport emissions in the medium term. So far, the uptake of EVs in New Zealand is very limited (around 1 800 vehicles) and growing slowly. EVs are still more expensive than gasoline- or diesel-fuelled vehicles. Since 2016, the government has been deploying a package of measures to promote EVs. The exemption of EVs from road tax and special lanes provide some incentive to users, but their widespread adoption in the short term and at the current stage of global development is unlikely without some further support. New Zealand should learn from other countries, which have adopted feebate systems, like the bonus/malus system for car purchases and registration. The 2016 EV Package of the government will assist in developing the market and infrastructure and prepare for a mass roll-out in the coming decade. To facilitate this process, the government should lead by example and commit to the purchase of EVs for a proportion of its own fleet, which would also provide a strong signal to the transport industry and the public, and gradually spread the uptake of EVs through the second-hand market to other consumers.
The NZETS is not enough to drive the decarbonisation of the transport sector. The government should therefore produce a comprehensive range of actions to promote low-carbon mobility, building on the EV package, the Energy Innovation Bill, the biofuel roadmap and new engine fuel specifications, and set out how it intends to encourage a low-carbon transport sector.
© O
ECD
/IEA,
201
7

11. TRANSPORT
218
Recommendations
The government of New Zealand should:
Promote the carbon performance and fuel efficiency of the transport sector through a coherent, comprehensive and efficient system of fuel and vehicle charges, including vehicle registration, road charges, and excise duties.
Examine the introduction of fuel efficiency and emission standards for new and second-hand imported vehicles.
Develop a suite of actions to promote low-carbon mobility, including actions to foster the deployment of electric vehicles, biofuels - notably biodiesel - and others to provide investment certainty for the industry
References Barton and Schütte (2015), Electric Vehicle Policy: New Zealand in a Comparative Context, Centre for Environmental, Resources and Energy Law, University of Waikato, Hamilton.
CAENZ (2010), Electric Vehicles Impacts on New Zealand’s Electricity System, Christchurch.
EECA (Energy Efficiency and Conservation Authority) (2016), Annual Report 2015-16, EECA, Wellington.
IEA (International Energy Agency) (2016a), Energy Balances of OECD Countries, OECD/IEA, Paris. www.iea.org/statistics/.
IEA (2016b), Energy Efficiency Indicators: Highlights, OECD/IEA, Paris, www.iea.org/statistics/.
IEA (2016c), Global EV Outlook 2016, OECD/IEA, Paris.
Ministry of Transport (2015), Annual fleet statistics 2015, Wellington.
Ministry of Transport (2016), Electric Vehicles Programme Overview, Wellington.
© O
ECD
/IEA,
201
7

219
PAR
T II.
EN
ERG
Y SY
STEM
TR
ANSF
OR
MAT
ION
12. Residential and commercial
Key data (2014)
Energy consumption: 2.6 Mtoe (electricity 71.4%, natural gas 12.4%, oil 6.9%, biofuels and waste 5.4%, geothermal 2.3%, coal 1.2%, solar 0.3%), -0.1% since 2004
Share of total final consumption*: 18.5%
Share of total CO2 emissions*: 9.6%
*Includes the agriculture sector, otherwise presented in the Chapter 10 on industry.
Overview
Despite New Zealand’s growing population, energy use has remained stable in the sector for almost a decade. This indicates that energy intensity has significantly declined, thanks to energy efficiency improvements in water and space heating, and cooking. However, energy use of appliances and products has increased, despite technological developments towards more efficient products.
The government has chosen a light-handed approach towards regulation in that sector; it drives energy efficiency by minimum performance standards on appliances or by phasing out old and inefficient products. Government subsidies have focused on health benefits and retrofitting of the housing stock.
Energy consumption and efficiency
The residential sector accounted for 10.0% of total final consumption (TFC) or 1.4 million tonnes of oil-equivalent (Mtoe) in 2014. This is the only sector that saw decreasing demand over the past decade, representing a 1.7% decrease from 2004. The commercial and public services sector represented 8.5% of TFC in 2014. Demand from this sector grew by 2.0% from 2004 to 2014.
The residential and commercial sectors together consume mostly electricity (71.4%), oil (6.9%) and natural gas (12.4%). Biofuels and waste (5.4%), geothermal (2.3%), coal (1.2%) and solar (0.3%) make up the rest of the demand.
The main trend since the 1970s is a large increase in electricity consumption and a shift from oil and coal towards electricity and natural gas. In the last decade, energy demand has remained relatively stable in both sectors.
© O
ECD
/IEA,
201
7

12. RESIDENTIAL AND COMMERCIAL
220
Figure 12.1 TFC by source in the residential and commercial sectors, 1973-2014
0
0.5
1
1.5
2
2.5
3
1973 1975 1977 1979 1981 1983 1985 1987 1989 1991 1993 1995 1997 1999 2001 2003 2005 2007 2009 2011 2013
Mtoe
Oil
Coal
Natural gas
Biofuels and waste
Electricity
Solar*
Geothermal
* Negligible. Note: Agriculture is not included in the commercial sector (see Chapter 10 on industry). Source: IEA (2016a), Energy Balances of OECD Countries, www.iea.org/statistics/.
Consumption breakdown
Space heating and water heating represent over half the total energy consumption in the residential sector. Energy demand for heating has been relatively stable between 35 and 40 petajoules (PJ), despite population growth in the country. The energy intensity measured as heating per square metre of floor area has decreased by over 40% since 1990 for space and water heating together.
Total energy consumption in the residential sector has increased by 6% from 1990 to 2014 as a result of a growing population and an increase in floor area per person.. However, the intensity index has declined by over 30% during the same period, indicating energy efficiency improvements (Figure 12.2).
Figure 12.2 Residential TFC broken down into activity, structural changes and energy intensity, 2014
0.00
0.20
0.40
0.60
0.80
1.00
1.20
1.40
1.60
1990 1992 1994 1996 1998 2000 2002 2004 2006 2008 2010 2012 2014
Index
Activity index
Structure index
TFC index
Intensity index
00
Source: IEA (2016b), Energy Efficiency Indicators 2016: Highlights, www.iea.org/statistics/.
Air quality
In 2014, emissions from the commercial and residential sectors accounted for 7.9% and 1.7%, respectively. While residential emissions are relatively small, air pollution has been a concern in New Zealand. Domestic wood use and transport sector pollutants are the
© O
ECD
/IEA,
201
7

12. RESIDENTIAL AND COMMERCIAL
221
PAR
T II.
EN
ERG
Y SY
STEM
TR
ANSF
OR
MAT
ION
main sectors which cause air quality issues, including indoor air when cold, damp and mouldy houses present major health risks. Total social costs associated with anthropogenic air pollution are estimated to be NZD 4.28 billion per year, of which 56% are due to domestic fires. This is more than the air pollution resulting from motor vehicles, which accounted for 22% of the total in 2012.
Air quality monitoring in large cities and adjusted traffic regulations and actions at local city level should be encouraged. The current national environmental standard for air quality is under review and it is likely that domestic wood use (based on international standards) will be more limited.
At an international level, New Zealand is a leader in addressing those concerns and other multiple benefits of energy efficiency initiatives; however it still has the highest rate of respiratory illnesses in the OECD.
Box 12.1 Energy and air pollution Each year an estimated 6.5 million deaths are caused by air pollution. This number is set to increase significantly in coming decades unless the energy sector takes greater action to curb emissions. No country is immune as a staggering 80% of the population living in cities that monitor pollution levels are breathing air that fails to meet the air quality standards set by the World Health Organization. Energy production and use – mostly from unregulated, poorly regulated or inefficient fuel combustion – are the most important man-made sources of key air pollutant emissions: 85% of particulate matter and almost all of the sulphur oxides and nitrogen oxides. They are released into the atmosphere from factories, power plants, cars, trucks, as well as from the 2.7 billion people still relying on polluting stoves and solid fuels for cooking (mainly wood, charcoal and other biomass). The IEA calls for government action in three key areas:
Setting an ambitious long-term air quality goal, to which all stakeholders can subscribe and against which the efficacy of the various pollution mitigation options can be assessed.
Putting in place a package of clean air policies for the energy sector to achieve the long-term goal, drawing on a cost-effective mix of direct emission controls, regulation and other measures, giving due weight to the co-benefits for other energy policy objectives.
Ensuring effective monitoring, enforcement, evaluation and communication: keeping a strategy on course requires reliable data, a continuous focus on compliance and on policy improvement, and timely and transparent public information.
Source: IEA (2016c), World Energy Outlook, Special Report on Energy and Air Quality, OECD/IEA, Paris.
Policies and measures
Buildings codes and ratings
The Building Code is contained in regulations implemented under the Building Act 2004. New commercial and residential buildings in New Zealand must comply with the New Zealand Building Code (NZBC), and its minimum performance requirements (without
© O
ECD
/IEA,
201
7

12. RESIDENTIAL AND COMMERCIAL
222
prescribing design or quantitative targets), as administered by the Ministry of Business, Innovation and Employment (MBIE).
For residential buildings, a minimum thermal performance is required from the building envelope, since 2007/08 higher insulation levels for walls and ceilings are needed and minimum insulation requirements were introduced for windows (double-glazing).
For commercial buildings, the minimum insulation requirements are outdated; they were last updated in 2000. However, NZBC energy efficiency requirements for artificial lighting in commercial buildings were revised in 2007. Water-heating energy efficiency requirements were introduced into the NZBC in 2000 and have not changed since. At the same time, new minimum energy performance standards (MEPS) for appliances were set by the Energy Efficiency and Conservation Authority (EECA, see more detail below). Only water-heating systems that supply sanitary facilities and appliances must comply; there are no requirements for commercial/industrial process water-heating in NZBC, but space-heating, ventilation and air conditioning (HVAC) systems have to be energy-efficient.
In 2013 EECA, in collaboration with the New Zealand Green Building Council, introduced a voluntary rating programme for the energy performance of commercial buildings (the NABERSNZ), building on Australia’s similar scheme (the National Australian Built Environment Rating System, NABERS). Up to now, about 600 self-assessments have been completed, 29 certified ratings processed in total. Reasons for the low uptake of the voluntary ratings in the commercial segment are yet to be examined. However, the Building Code for commercial buildings is not up to date and voluntary action has not proven effective.
In the public sector, EECA provides Crown loans of USD 1.4 million per year for government organisations (public sector, health and local government) targeting action in energy efficiency, technology or renewable energy.
The government has tackled residential insulation and largely met the targets of the New Zealand Energy Efficiency and Conservation Strategy (NZEECS). EECA provided subsidies to private housing through the Warm Up New Zealand: Heat Smart (WUNZ-HS) programme during 2009-13, with a budget of USD 225 million. The programme provided consumers with information on home insulation, grants for ceiling and underfloor insulation installed through approved service providers, and clean heating devices in homes built before 2000. The grants were for 60% of the cost of insulation and clean heating (heat pumps, approved wood burners) with 40% third-party funding for low-income households. The successor programme, Warm Up New Zealand: Healthy Homes (WUNZ-HH) ran from 2013 to 2016 with a budget of USD 70 million. The aim was to insulate 46 000 homes and the programme targeted low-income households, particularly those with high health needs – which included children, the elderly, and people at risk of cold-related illnesses. In June 2016, 52 800 houses (more than the programme target of 46 000 homes) had been insulated under the Warm Up New Zealand: Healthy Homes. This meant that by 30 June 2016, nearly 300 000 homes had been insulated under these programmes. By end of 2016, about 20% of the housing stock of 1.7 million houses had been renovated as a result (EECA, 2016).
Despite great success of the programmes, the residential insulation has not accelerated private-sector funding much beyond regional council loans and did not extend deep
© O
ECD
/IEA,
201
7

12. RESIDENTIAL AND COMMERCIAL
223
PAR
T II.
EN
ERG
Y SY
STEM
TR
ANSF
OR
MAT
ION
refurbishment beyond simple retrofit measures for ceilings and heating. The WUNZ-HH1 and the new Residential Tenancies Act2 were passed into law in 2016 with a focus on health benefits for low-income households, but did not provide any mechanisms or tools for general-income households to improve the energy efficiency of the existing building stock. This leaves a large segment of the building stock (80%) without incentives for retrofitting, as building codes date back to 2004.
Appliances and products
The total growth of energy consumption in the residential and commercial sectors comes mainly from an increased use of household appliances, such as home computers and dish washers. Even though energy intensity of each unit is improving with energy-efficient technological development, total energy use of appliances has almost doubled since 1990; however, it has been declining in recent years, as water heating, cooking and total residential energy intensity have improved (Figure 12.3)
Figure 12.3 Energy intensity by user group in the residential sector, 1990-2014
0.40
0.60
0.80
1.00
1.20
1.40
1.60
1.80
1990 1992 1994 1996 1998 2000 2002 2004 2006 2008 2010 2012 2014
Energ
y int
ensity (in
dex 19
90)
Lighting (GJ/dw)
Total appliances (GJ/dw)
Total residential (GJ/dw)
Cooking (GJ/dw)
Water heating (GJ/dw)
Space heating CC (GJ/m2)(GJ/m2)
Note: dw stands for dwelling. Source: IEA (2016b), Energy Efficiency Indicators 2016: Highlights, www.iea.org/statistics/.
Energy demand for lighting has doubled from 1990 to 2014; energy intensity in lighting increased by almost 50% until 2009, but has decreased thereafter. This happened despite technology advances in energy-efficient lighting and earlier programmes for efficient lighting put in place by the Electricity Commission and taken over by EECA. New Zealand has not adopted new lighting standards to phase out incandescent bulbs.
Over the past decade, the EnergyStar programme (20 product categories) has stimulated significant market transformation in the energy efficiency of appliances. By
1 In 2016 the government allocated NZD 18 million over two years for an extension of the Warm Up New Zealand: Healthy Homes programme specifically focused on rented housing. The extension provides new funding to deliver insulation to low-income rental households with high health needs (particularly households occupied by children and/or elderly people as they face the highest health risk from cold and damp housing). This extension will focus on housing rented by low-income tenants and/or by low-income tenants referred by the health sector with conditions related to cold and damp housing. The aim is to insulate about 20 000 homes. 2 The Residential Tenancies Amendment Act came into force on 1 July 2016. The Act makes a number of changes, including requirements relating to insulation. The new insulation requirements in the Act apply to social housing from 1 July 2016 and all other rentals from 1 July 2019. Since1 July 2016, landlords must include in all tenancy agreements from 1 July 2016 a declaration of the level of insulation under the floor, in walls and in the ceiling, and all insulation installed from must be to the 2008 standards.
© O
ECD
/IEA,
201
7

12. RESIDENTIAL AND COMMERCIAL
224
international comparison, New Zealand has followed the same trends as in Sweden, Japan or Korea and less the developments in Australia or Canada, despite using the same EnergyStar label (Figure 12.4). The New Zealand government should review the MEPs and update them to align their standards to modern appliances, expanding the EnergyStar programme and others.
Figure 12.4 Lighting intensities in the residential sector in selected IEA member countries, 2000-13
0
0.01
0.02
0.03
0.04
Australia Canada France Germany Japan Korea New Zealand Sweden United States
GJ/m
2
20002001200220032004200520062007200820092010201120122013
New Zealand
Note: Methodologies for the calculation of intensities can differ and depend on the calculations used to estimate lighting consumption and occupied dwellings areas, with some countries having bigger average surfaces per house for the same consumption. Source: IEA (2016b), Energy Efficiency Indicators 2016: Highlights, www.iea.org/statistics/.
Assessment
The residential sector is a key area of focus for the government because of the relatively poor quality of New Zealand’s homes, the cool and wet climate in many parts, and the resultant health impacts. Cold, “leaky”3 and damp wooden houses are the norm, partly owing to the abundance of woods and forests and the historic risk of building masonry and stone buildings on a fault line. New Zealand has the highest rate of respiratory illnesses in the OECD (one in four people suffer from asthma), and 40 000 hospital admissions per year could be avoided. Although there is no official indicator for fuel poverty, academic research conducted in 2011 suggested that levels could be as high as 20% to 25% (Keall et al., 2012). Fuel poverty has not been officially defined or measured by the government of New Zealand.
Commendably, the government has adopted strong action on the basis of detailed studies into the relationship between energy efficiency and health outcomes – New Zealand is a world leader in this type of research – which provided the impetus for significant government action in the residential sector through public funding, voluntary targeted rates, awareness-raising campaigns and voluntary labelling.
Warm Up New Zealand: Heat Smart 2009-13 was a grant scheme that provided a partial subsidy to insulate the floors and ceilings of 240 000 homes at a cost to government of
3 New Zealand’s building stock has to cope with insufficient weather and water tightness of its houses.
© O
ECD
/IEA,
201
7

12. RESIDENTIAL AND COMMERCIAL
225
PAR
T II.
EN
ERG
Y SY
STEM
TR
ANSF
OR
MAT
ION
USD 244 million. Its successor, Warm Up New Zealand: Healthy Homes 2013-16 has insulated a further 54 000 homes for USD 70 million, focused solely on low-income households with health risks (EECA, 2016). It has ended in June 2016 (but an extension specifically focused on rented housing will run for a further two years). Altogether, these programmes will have treated almost 20% of the housing stock. The government has adopted the Residential Tenancies Act which requires landlords to install floor and roof insulation, to cover all tenancies (with specific exemptions) by 2019. Voluntary Targeted Rates enable householders to pay for energy efficiency retrofits by adding the cost to their rate bill and paying it off over a certain period of time (often ten years).
Despite these achievements of improving insulation for about 300 000 homes since 2009, there is still significant further potential in the residential sector. Around 590 000 homes out of 1.7 million remain under- or uninsulated, besides an estimated 150 000 which are “uninsulatable”. The Residential Tenancies Act introduced minimum requirements for ceiling and underfloor insulation in rented social housing from 1 July 2016, which will be extended to private rentals from 1 July 2019.
Research is currently under way to look into the current energy-efficiency settings for new residential buildings. The government will need to consider how to encourage insulation in the untreated homes not covered by the Residential Tenancies Act. The New Zealand Building Code is below the standards required in most other IEA countries with comparable climates, and it would be absurd to have to retrofit newly built homes in the future. The government has focused to date on floor and roof insulation which it considers “low hanging fruit”. It should consider moving beyond this, for example supporting the take-up of efficient heating systems, draught proofing, ventilation and moisture prevention measures, particularly in programmes focused on vulnerable and low-income households. Measures should also be taken to ensure that an effective monitoring and enforcement regime is in place for both the tenancy legislation and Building Code.
Wood heating provides some 12% of heat used in New Zealand’s households. Using wood for heating provides a way of reducing fossil fuel use in the sector. It also can play an important role in reducing electricity load, particularly at times of peak demand (i.e. on cold evenings in winter) so improving security of supply, especially under drought conditions which tend to occur at the same time. New Zealand is endowed with rich forests and timber, and forestry residues could be used to support heat use while developing a rural economic development opportunity. However, in recent years the amount and proportion of wood used for heat in the residential sector has been falling, because of concerns about the emissions from poorly controlled wood combustion and of unsustainable depletion of some forest resources, which have led some authorities to ban or seriously constrain wood combustion.
International experience (in Europe, the United States and recently Japan, for example) shows that when modern appliances and fuels are subject to stringent controls and testing regimes; then wood heating can make a growing and useful contribution to residential energy supply without causing other environmental problems. New Zealand could benefit from examining this experience, standards and testing protocols, and see how they could be adapted to national circumstances. The review of the Environmental Air Standard is a good opportunity to drive policies to enhance air quality in New Zealand.
© O
ECD
/IEA,
201
7

12. RESIDENTIAL AND COMMERCIAL
226
Over the past decade, the EnergyStar and the E3 Trans-Tasman programmes (20 product categories) have stimulated significant market transformation in the energy efficiency of appliances. Compliance is monitored and enforced. Taking the example of the most successful experience with minimum energy performance standards (MEPs) and labelling, the government should update MEPs product categories and review product standards over time to align its products with new international standards.
In terms of commercial and industrial buildings, these should be included in the EECA partnerships (see Chapter 10 on industry). While New Zealand has adopted the National Australian Built Environment Rating System (NABERSNZ), a building assessment tool, this is voluntary, and take-up has been low. The government should review the results and identify the reasons for the low adoption by the commercial sector with a view to adjusting ratings and strengthening them over time. Mandatory energy performance assessments have been adopted widely across other OECD countries in order to correct a perceived market failure such as lack of information on energy performance when purchasing or renting a property, and there is growing evidence that, as a result, energy performance is being priced into the market.
The government is a large stakeholder as it rents commercial buildings and is a major tenant in the market with the ability to set the standards. The government should consider taking the lead in the public sector by making NABERSNZ mandatory for all large public buildings, with a view to a further roll-out of NABERSNZ or alternative assessments across the commercial, industrial and residential sectors over time. This would encourage the market to factor in energy efficiency into property and rental prices.
Recommendations
The government of New Zealand should: Continue the Warm Up New Zealand programme for vulnerable households beyond
2016 and extend the scope to allow for more than basic insulation measures.
Assess effectiveness of and compliance with the existing New Zealand Building Code and Residential Tenancies Act regulations for insulation, and the scope for increasing the minimum energy efficiency-related performance requirements.
Examine international experience, equipment standards and testing protocols for residential wood heating and see if and how they could be adapted to New Zealand’s circumstances.
Review building ratings in the commercial sector and consider taking the lead by making building assessments mandatory for public-sector buildings, with a view to strengthening ratings over time, and make them mandatory for large commercial and industrial buildings in the future.
© O
ECD
/IEA,
201
7

12. RESIDENTIAL AND COMMERCIAL
227
PAR
T II.
EN
ERG
Y SY
STEM
TR
ANSF
OR
MAT
ION
References EECA (Energy Efficiency and Conservation Authority) (2016), Annual Report 2015-16, EECA, Wellington.
Keall et al. (2012), “A measure for quantifying the impact of housing quality on respiratory health: A cross-sectional study”, Environmental Health, Vol. 11, No. 33, 14 May, doi: 10.1186/1476-069X-11-33PMCID: PMC3410778.
IEA (International Energy Agency) (2016a), Energy Balances of OECD Countries, OECD/IEA, Paris, www.iea.org/statistics/.
IEA (2016b), Energy Efficiency Indicators 2016: Highlights, OECD/IEA, Paris, www.iea.org/statistics/.
IEA (2016c), World Energy Outlook, Special Report on Energy and Air Quality, OECD/IEA, Paris.
© O
ECD
/IEA,
201
7

ANNEXES
229
PAR
T III
. AN
NEX
ES
ANNEX A: Organisation of the review
Review criteria
The Shared Goals, which were adopted by the IEA Ministers at their 4 June 1993 meeting in Paris, provide the evaluation criteria for the in-depth reviews conducted by the IEA. The Shared Goals are presented in Annex C.
Review team
The in-depth review team visited Wellington New Zealand from 26 April to 2 May 2016. Over the course of the week, the team met with government officials, regulators, stakeholders in the public and private sectors as well as other organisations and interest groups, each of whom helped the team identify the key challenges facing energy-policy makers in New Zealand.
The report was drafted on the basis of these meetings, the government’s initial submission to the IEA energy policy questionnaire and several updates since the review visit. The main objective of the review is to present to the Ministry of Business, Innovation and Employment (MBIE) an assessment of the country’s energy policy and to provide recommendations based on the IEA Shared Goals as a basis for developing energy policies that can contribute to sustainable economic development. The Shared Goals are of particular relevance for the conduct of the country reviews, as they provide a common yardstick for assessing member countries’ energy policy achievements. The team is grateful for the co-operation and assistance of the many people it met throughout the visit. The team wishes to express its sincere appreciation and gratitude to the hosts at MBIE: Mr. David Smol, Chief Executive, Mr. James Stevenson-Wallace, General Manager and Mr Jamie Kerr. Special thanks to Mr. Mark Pickup for the co-ordination of the review and Mr. Jason Jina for their support during the review week.
The members of the team were:
IEA member countries Mr. Gene McGlynn, Australia (team leader)
Mr. Will Broad, United Kingdom
Mr. Wieger Wiersema, Netherlands
Mr. Douglas Cooke (consultant)
International Energy Agency Mr. Aad van Bohemen
Mr. Adam Brown
Ms Sylvia Beyer (desk officer)
Sylvia Beyer (IEA, desk officer) managed the review and drafted the report with the exception of the Special Focus 1 (Chapter 6, integration of 90% renewables) which was completed by Mr. Adam Brown and Mr. Simon Mueller, and of the Special Focus 2 (Chapter 7 on electricity distribution development)
© O
EC
D/IE
A, 2
017

ANNEXES
230
completed by Mr. Douglas Cooke. Chapters 5 on electricity also benefited from the comprehensive advice and review of Mr. Douglas Cooke.
The report was prepared under the guidance of Mr. Aad van Bohemen, Head of Country Studies Division. Helpful comments were provided by the review team members and the following IEA and NEA staff, including Ms Christina Hood, Mr Manuel Baritaud, Mr. Andrew Robertson, Mr. Jan Bartos, Mr. David Wilkinson, Mr. Simon Müller and Mr. Carlos Fernandez. Special thanks go to the IEA Secretariat with regard to the data, editing and publication. Importantly, the report has received valuable support with timely and comprehensive data from Ms. Roberta Quadrelli, Mr. Remi Gigoux, and Mr. Oskar Kvarnström as well as Ms Yun Ji Suh on the IEA energy statistics and energy balances, including the RD&D and the Energy Efficiency Indicators databases.
Mr. Oskar Kvarnström and Mr. Bertrand Sadin ensured the preparation of the design of figures, maps and tables. The IEA Communication and Information Office (CIO), in particular Ms. Rebecca Gaghen, Ms Astrid Dumond, Ms Isabelle Nonain-Semelin, Mr. Sadin and Mr. Jad Mouawad provided essential support towards the report’s production and launch. The author thanks in particular for the time and dedication of Ms Viviane Consoli, Ms Therese Walsh and Ms Rebecca Gaghen who ensured the editorial finalisation of the report.
Organisations visited Aotearoa Wave and Tidal Energy Association
Bioenergy Association of New Zealand
BP Oil New Zealand
Callaghan Innovation
Coal Association of New Zealand
Commerce Commission (CC)
Consumer New Zealand
Contact Energy
Domestic Electricity Users Group
Electricity Authority (EA)
Electricity and Gas Complaints Commission
Electricity Networks Association (ENA)
Energy Efficiency and Conservation Authority (EECA)
Energy Management Association of New Zealand (EMANZ)
Environmental Defence Society
Environmental Protection Authority (EPA)
EnerNoc
Flick Electric
Gas Association of New Zealand
Gas Industry Company
Genesis Energy
Greenpeace
Institute of Geological and Nuclear Sciences (GNS Science)
Gull Petroleum
LPG Association of New Zealand
Massey
Major Gas Users' Group
© O
ECD
/IEA,
201
7

ANNEXES
231
PAR
T III
. AN
NEX
ES
Meridian Energy
Mercury Energy (formerly Mighty River)
Ministry of Business, Innovation and Employment (MBIE)
Ministry for the Environment (MfE)
Ministry of Transport
New Zealand Climate and Health Council
New Zealand Geothermal Association
New Zealand Refining Company Limited
New Zealand Wind Energy Association
New Zealand Trade and Enterprise (NZTE)
Parliamentary Commissioner for the Environment
Petroleum Exploration and Production Association of New Zealand (PEPANZ)
Powershop
Pioneer Energy
Royal Society of New Zealand Panel on Climate Change Mitigation
SCION
Shell New Zealand
Sustainable Electricity Association of New Zealand (SEANZ)
Sustainable Energy Forum
Treasury
Transpower
Trustpower
University of Canterbury
University of Otago
Vector Limited
Wellington Electricity
Orion
PowerCo
Pulse Energy
Simply Energy
Straterra
Z-Energy
350 Christchurch
© O
ECD
/IEA,
201
7

ANNEXES
232
ANNEX B: Energy balances and key statistical data
Unit: MtoeSUPPLY 1973 1990 2000 2010 2013 2014 2015E
TOTAL PRODUCTION 3.9 11.5 14.3 16.9 16.2 17.1 16.4
Coal 1.2 1.4 2.1 3.1 2.7 2.3 1.9Peat - - - - - - -Oil 0.2 2.0 1.9 2.7 1.9 2.1 2.2Natural gas 0.3 3.9 5.1 3.9 4.0 4.4 4.1Biofuels and w aste1 - 0.8 1.1 1.2 1.1 1.2 1.2Nuclear - - - - - - -Hydro 1.2 2.0 2.1 2.1 2.0 2.1 2.1Wind - - 0.0 0.1 0.2 0.2 0.2Geothermal 1.1 1.5 2.0 3.6 4.2 4.8 4.8
Solar/other2 - 0.0 0.0 0.0 0.0 0.0 0.0TOTAL NET IMPORTS3 4.0 1.3 2.5 1.8 3.4 3.4 3.6Coal Exports 0.0 0.2 1.1 1.7 1.5 1.2 1.0
Imports - 0.0 0.0 0.1 0.3 0.2 0.2Net imports -0.0 -0.2 -1.1 -1.6 -1.2 -1.0 -0.8
Oil Exports - 1.5 1.5 2.6 1.8 2.0 2.1Imports 4.6 3.8 5.9 7.1 7.6 7.6 7.6Int'l marine and aviation bunkers -0.5 -0.8 -0.8 -1.1 -1.2 -1.1 -1.2Net imports 4.0 1.6 3.6 3.4 4.7 4.4 4.3
Natural Gas Exports - - - - - - -Imports - - - - - - -Net imports - - - - - - -
Electricity Exports - - - - - - -Imports - - - - - - -Net imports - - - - - - -
TOTAL STOCK CHANGES -0.0 -0.0 0.3 -0.3 -0.3 0.1 0.4
TOTAL SUPPLY (TPES)4 7.9 12.8 17.1 18.4 19.4 20.6 20.4Coal 1.1 1.2 1.1 1.3 1.4 1.4 1.4Peat - - - - - - -Oil 4.2 3.5 5.7 6.2 6.4 6.5 6.7Natural gas 0.3 3.9 5.1 3.7 4.0 4.4 4.1Biofuels and w aste1 - 0.8 1.1 1.2 1.1 1.2 1.2Nuclear - - - - - - -Hydro 1.2 2.0 2.1 2.1 2.0 2.1 2.1Wind - - 0.0 0.1 0.2 0.2 0.2Geothermal 1.1 1.5 2.0 3.6 4.2 4.8 4.8Solar/other2 - 0.0 0.0 0.0 0.0 0.0 0.0Electricity trade5 - - - - - - -Shares in TPES (%)Coal 14.3 9.2 6.5 7.1 7.4 6.8 6.7Peat - - - - - - -Oil 52.9 27.4 33.4 33.7 33.0 31.7 32.6Natural gas 3.6 30.2 29.6 20.3 20.5 21.4 20.1Biofuels and waste 1 - 5.9 6.5 6.5 5.9 5.6 5.7Nuclear - - - - - - -Hydro 15.6 15.5 12.3 11.6 10.2 10.2 10.3Wind - - 0.1 0.8 0.9 0.9 1.0Geothermal 13.6 11.5 11.4 19.8 21.9 23.2 23.4Solar/other 2 - 0.3 0.3 0.3 0.2 0.2 0.2Electricity trade 5 - - - - - - -0 is negligible, - is nil, .. is not available, x is not applicable. Please note: rounding may cause totals to differ from the sum of the elements.Forecasts are based on the 2015/16 submission.
© O
ECD
/IEA,
201
7

ANNEXES
233
PAR
T III
. AN
NEX
ES
Unit: MtoeDEMAND
FINAL CONSUMPTION 1973 1990 2000 2010 2013 2014 2015E
TFC 5.8 9.7 12.9 12.9 13.3 14.3 ..Coal 0.9 0.7 0.5 0.6 0.6 0.6 ..Peat - - - - - - ..Oil 3.5 4.0 5.3 5.9 5.9 6.1 ..Natural gas 0.1 1.8 3.0 1.8 2.3 3.0 ..Biofuels and w aste1 - 0.6 1.0 1.0 1.0 1.0 ..Geothermal - 0.2 0.2 0.2 0.3 0.3 ..Solar/other2 - - - 0.0 0.0 0.0 ..Electricity 1.4 2.4 2.9 3.4 3.3 3.3 ..Heat - - - - - - ..Shares in TFC (%) Coal 14.7 6.9 4.0 4.7 4.6 4.3 ..Peat - - - - - - ..Oil 59.8 41.4 41.0 45.7 44.5 42.4 ..Natural gas 2.0 18.5 23.3 13.8 16.9 21.1 ..Biofuels and waste 1 - 6.4 7.4 8.0 7.4 6.9 ..Geothermal - 1.7 1.5 0.0 0.0 0.0 ..Solar/other 2 - - - 0.0 0.0 0.0 ..Electricity 23.5 25.0 22.8 26.1 24.7 23.2 ..Heat - - - - - - ..TOTAL INDUSTRY6 2.2 4.2 5.9 5.0 5.4 6.2 ..Coal 0.7 0.5 0.4 0.5 0.5 0.5 ..Peat - - - - - - ..Oil 1.0 0.6 0.6 0.8 0.7 0.8 ..Natural gas 0.0 1.5 2.7 1.5 1.9 2.6 ..Biofuels and w aste1 - 0.5 0.8 0.9 0.8 0.8 ..Geothermal - 0.1 0.1 0.1 0.2 0.2 ..Solar/other2 - - - - - - ..Electricity 0.5 1.0 1.2 1.3 1.2 1.2 ..Heat - - - - - - ..Shares in total industry (%) Coal 31.2 12.9 7.4 10.2 9.3 8.8 ..Peat - - - - - - ..Oil 45.1 14.3 10.9 15.2 13.8 12.3 ..Natural gas 1.5 36.3 45.3 29.1 35.9 42.7 ..Biofuels and waste 1 - 11.1 13.7 17.6 15.7 13.7 ..Geothermal - 2.6 2.3 2.9 3.2 3.2 ..Solar/other 2 - - - - - - ..Electricity 22.2 22.8 20.4 25.1 22.1 19.2 ..Heat - - - - - - ..TRANSPORT4 1.9 3.0 4.1 4.6 4.6 4.7 ..OTHER7 1.7 2.5 3.0 3.3 3.4 3.4 ..Coal 0.2 0.1 0.1 0.1 0.1 0.1 ..Peat - - - - - - ..Oil 0.6 0.5 0.6 0.6 0.6 0.6 ..Natural gas 0.1 0.2 0.3 0.3 0.3 0.4 ..Biofuels and w aste1 - 0.2 0.2 0.1 0.1 0.1 ..Geothermal - 0.1 0.1 0.1 0.1 0.1 ..Solar/other2 - - - 0.0 0.0 0.0 ..Electricity 0.9 1.5 1.7 2.1 2.1 2.1 ..Heat - - - - - - ..Shares in other (%) Coal 10.2 5.2 2.7 2.7 3.3 2.1 ..Peat - - - - - - ..Oil 33.2 20.9 20.5 17.5 18.1 18.1 ..Natural gas 4.9 8.3 11.3 9.3 9.8 10.7 ..Biofuels and waste 1 - 5.9 5.1 4.4 4.3 4.2 ..Geothermal - 2.3 2.0 0.0 0.0 0.0 ..Solar/other 2 - - - 0.2 0.3 0.3 ..Electricity 51.7 57.4 58.4 63.4 61.9 62.4 ..Heat - - - - - - ..
© O
ECD
/IEA,
201
7

ANNEXES
234
Unit: MtoeDEMAND
ENERGY TRANSFORMATION AND LOSSES 1973 1990 2000 2010 2013 2014 2015E
ELECTRICITY GENERATION8
Input (Mtoe) 3.1 4.9 6.3 8.1 8.4 8.7 ..Output (Mtoe) 1.6 2.8 3.4 3.9 3.7 3.7 3.8Output (TWh) 18.5 32.3 39.2 44.9 43.3 43.6 44.2Output Shares (%)Coal 8.5 2.1 3.9 4.6 5.5 4.5 4.3Peat - - - - - - -Oil 6.1 - - - - - -Natural gas 1.4 17.7 24.4 22.1 20.1 16.3 15.5Biofuels and waste 1 - 1.5 1.5 1.3 1.5 1.5 1.4Nuclear - - - - - - -Hydro 77.3 71.9 62.3 55.1 53.3 55.9 55.5Wind - - 0.3 3.6 4.7 5.1 5.3Geothermal 6.7 6.6 7.4 13.1 14.8 16.7 17.8Solar/other 2 - 0.2 0.2 0.1 0.1 0.1 0.2TOTAL LOSSES 2.2 3.1 3.9 5.5 5.9 6.2 -0.0of w hich:Electricity and heat generation9 1.5 2.1 3.0 4.3 4.7 5.0 ..Other transformation 0.3 0.1 0.0 0.1 0.1 0.1 -0.0Ow n use and transmission/distribution losses10 0.4 0.8 0.9 1.1 1.1 1.1 ..Statistical Differences -0.1 0.0 0.2 -0.0 0.1 0.1 ..
INDICATORS 1973 1990 2000 2010 2013 2014 2015E
GDP (billion 2010 USD) 66.79 82.82 111.80 146.58 157.09 162.07 167.57Population (millions) 2.97 3.37 3.87 4.36 4.46 4.46 4.50TPES/GDP (toe/1000 USD)11 0.12 0.16 0.15 0.13 0.12 0.13 0.12Energy production/TPES 0.50 0.90 0.84 0.92 0.84 0.83 0.81Per capita TPES (toe/capita) 2.65 3.80 4.42 4.21 4.34 4.61 4.54Oil supply/GDP (toe/1000 USD)11 0.06 0.04 0.05 0.04 0.04 0.04 0.04TFC/GDP (toe/1000 USD)11 0.09 0.12 0.12 0.09 0.08 0.09 ..Per capita TFC (toe/capita) 1.96 2.88 3.35 2.96 2.99 3.21 ..CO2 emissions from fuel combustion (MtCO2)12 16.7 21.7 29.0 30.4 31.0 31.2 ..CO2 emissions from bunkers (MtCO2)12 1.6 2.4 2.6 3.4 3.6 3.5 ..
GROWTH RATES (% per year) 73-90 90-00 00-10 10-12 12-13 13-14 14-15
TPES 2.9 2.9 0.7 2.2 0.8 6.2 -0.7Coal 0.3 -0.7 1.7 11.8 -12.8 -2.1 -2.1Peat - - - - - - -Oil -1.0 5.0 0.8 2.3 -1.5 2.1 1.9Natural gas 16.6 2.7 -3.0 1.5 3.7 10.4 -6.5Biofuels and w aste1 - 4.0 0.7 0.4 -4.7 0.6 0.5Nuclear - - - - - - -Hydro 2.9 0.5 0.1 -3.7 0.6 5.6 0.8Wind - - 30.3 12.7 -2.8 9.2 6.8Geothermal 1.9 2.8 6.4 3.0 9.7 12.7 0.1Solar/other2 - - 1.1 -16.7 -2.9 - 45.5TFC 3.0 2.9 -0.0 0.1 3.1 7.3 ..Electricity consumption 3.4 2.0 1.3 -0.8 -0.8 1.1 ..Energy production 6.6 2.2 1.7 -2.5 0.9 5.3 -3.5Net oil imports -5.4 8.6 -0.7 11.6 11.4 -5.3 -2.0GDP 1.3 3.0 2.7 2.7 1.6 3.2 3.4TPES/GDP 1.6 -0.1 -2.0 -0.5 -0.7 2.9 -3.9TFC/GDP 1.8 -0.1 -2.7 -2.6 1.6 4.0 ..0 is negligible, - is nil, .. is not available, x is not applicable. Please note: rounding may cause totals to differ from the sum of the elements.
© O
ECD
/IEA,
201
7

ANNEXES
235
PAR
T III
. AN
NEX
ES
Footnotes to energy balances and key statistical data
Biofuels and waste comprises solid biofuels, liquid biofuels, biogases, industrial waste and municipal waste. Data are often based on partial surveys and may not be comparable between countries.
Other includes tide, wave and ambient heat used in heat pumps.
In addition to coal, oil, natural gas and electricity, total net imports also include peat, biofuels and waste and trade of heat.
Excludes international marine bunkers and international aviation bunkers.
Total supply of electricity represents net trade. A negative number in the share of TPES indicates that exports are greater than imports.
Industry includes non-energy use.
Other includes residential, commercial and public services, agriculture/forestry, fishing and other non-specified.
Inputs to electricity generation include inputs to electricity, CHP and heat plants. Output refers only to electricity generation.
Losses arising in the production of electricity and heat at main activity producer utilities and autoproducers. For non-fossil-fuel electricity generation, theoretical losses are shown based on plant efficiencies of approximately 33% for nuclear and solar thermal, 10% for geothermal and 100% for hydro, wind and solar photovoltaic.
Data on “losses” for forecast years often include large statistical differences covering differences between expected supply and demand and mostly do not reflect real expectations on transformation gains and losses.
Toe per thousand US dollars at 2010 prices and exchange rates.
“CO2 emissions from fuel combustion” have been estimated using the IPCC Tier I Sectoral Approach from the 2006 IPCC Guidelines. In accordance with the IPCC methodology, emissions from international marine and aviation bunkers are not included in national totals. Projected emissions for oil and gas are derived by calculating the ratio of emissions to energy use for 2013 and applying this factor to forecast energy supply. Projected emissions for coal are based on product-specific supply projections and are calculated using the IPCC/OECD emission factors and methodology.
© O
ECD
/IEA,
201
7
ANNEXES
236
ANNEX C: International Energy Agency “Shared Goals”
The member countries* of the International Energy Agency (IEA) seek to create conditions in which the
energy sectors of their economies can make the fullest possible contribution to sustainable economic
development and to the well-being of their people and of the environment. In formulating energy
policies, the establishment of free and open markets is a fundamental point of departure, though energy
security and environmental protection need to be given particular emphasis by governments. IEA
countries recognise the significance of increasing global interdependence in energy. They therefore
seek to promote the effective operation of international energy markets and encourage dialogue with all
participants. In order to secure their objectives, member countries therefore aim to create a policy
framework consistent with the following goals:
1. Diversity, efficiency and flexibility within the energy sector are basic conditions for longer-term
energy security: the fuels used within and across sectors and the sources of those fuels should be as
diverse as practicable. Non-fossil fuels, particularly nuclear and hydro power, make a substantial
contribution to the energy supply diversity of IEA countries as a group.
2. Energy systems should have the ability to respond promptly and flexibly to energy emergencies. In some cases this requires collective mechanisms and action: IEA countries co-operate through the
Agency in responding jointly to oil supply emergencies.
3. The environmentally sustainable provision and use of energy are central to the achievement of
these shared goals. Decision-makers should seek to minimise the adverse environmental impacts of
energy activities, just as environmental decisions should take account of the energy consequences.
Government interventions should respect the Polluter Pays Principle where practicable.
4. More environmentally acceptable energy sources need to be encouraged and developed. Clean
and efficient use of fossil fuels is essential. The development of economic non-fossil sources is also a
priority. A number of IEA member countries wish to retain and improve the nuclear option for the future,
at the highest available safety standards, because nuclear energy does not emit carbon dioxide.
Renewable sources will also have an increasingly important contribution to make.
5. Improved energy efficiency can promote both environmental protection and energy security in a
cost-effective manner. There are significant opportunities for greater energy efficiency at all stages of
the energy cycle from production to consumption. Strong efforts by governments and all energy users
are needed to realise these opportunities.
6. Continued research, development and market deployment of new and improved energy technologies make a critical contribution to achieving the objectives outlined above. Energy technology
policies should complement broader energy policies. International co-operation in the development and
dissemination of energy technologies, including industry participation and co-operation with non-member
countries, should be encouraged.
7. Undistorted energy prices enable markets to work efficiently. Energy prices should not be held
artificially below the costs of supply to promote social or industrial goals. To the extent necessary and
practicable, the environmental costs of energy production and use should be reflected in prices.
© O
ECD
/IEA,
201
7

ANNEXES
237
PAR
T III
. AN
NEX
ES
8. Free and open trade and a secure framework for investment contribute to efficient energy markets
and energy security. Distortions to energy trade and investment should be avoided.
9. Co-operation among all energy market participants helps to improve information and
understanding, and encourages the development of efficient, environmentally acceptable and flexible
energy systems and markets worldwide. These are needed to help promote the investment, trade and
confidence necessary to achieve global energy security and environmental objectives.
(The Shared Goals were adopted by IEA Ministers at the meeting of 4 June 1993 Paris, France.)
* Australia, Austria, Belgium, Canada, the Czech Republic, Denmark, Estonia, Finland, France, Germany, Greece, Hungary, Ireland, Italy, Japan, Korea, Luxembourg, the Netherlands, New Zealand, Norway, Poland, Portugal, the Slovak Republic, Spain, Sweden, Switzerland, Turkey, the United Kingdom, the United States.
© O
ECD
/IEA,
201
7

ANNEXES
238
ANNEX D: Glossary and list of abbreviations
In this report, abbreviations and acronyms are substituted for a number of terms used within the
International Energy Agency. While these terms generally have been written out on first mention, this
glossary provides a quick and central reference for the abbreviations used.
Acronyms and abbreviations ACOT
ADRs
ASX
BEV
BGA
CC
CCS
CEER
CO2
CRI
CSP
DG
DPR
DR
DSO
EA
ECNZ
EDB
EECA
EGCC
EMP
EV
FTR
GDP
GDP PPP
GHG
GIC
HVAC
HVDC
ICP
INDC
MBIE
MEPS
avoided cost of transmission
Australian Design Rules
Australian Stock Exchange
battery-electric vehicles
Business Growth Agenda
Commerce Commission
carbon capture and storage
Council of European Energy Regulators
carbon dioxide
Crown Research Institute
concentrated solar power
distributed generator
distribution pricing review
demand response
distribution system operator
Electricity Authority
Electricity Corporation of New Zealand
electricity distribution businesses
Energy Efficiency and Conservation Authority
Electricity and Gas Complaints Commission
Emergency Management Policy
electric vehicle
financial transmission rights
gross domestic product
gross domestic product with purchasing power parity
greenhouse gas
Gas Industry Company
heating, ventilation and air conditioning
high-voltage direct current
installation control points
intended nationally determined contribution
Ministry of Business, Innovation and Employment
minimum energy performance standards
© O
ECD
/IEA,
201
7
ANNEXES
239
PAR
T III
. AN
NEX
ES
MfE Ministry for the Environment
NABERS National Australian Built Environment Rating System
NGL natural gas liquids
NIGUP North Island Grid Upgrade Project
NSSI National Statement of Science Investment
NZAS New Zealand Aluminium Smelter
NZBC New Zealand Building Code
NZD New Zealand Dollar. The average exchange rate in 2015 was 1.434 NZD per USD.
NZEECS New Zealand Energy Efficiency and Conservation Strategy
NZES New Zealand Energy Strategy
NZETS New Zealand Emissions Trading Scheme
PIT priority in time
PPP purchasing power parity
PV photovoltaics
R&D research and development
RD&D research, development and demonstration
RAP Refinery-to-Auckland Pipeline
RAV regulatory asset value
RE renewable energy
RMA Resource Management Act
SAIDI System Average Interruption Duration Index
SAIFI System Average Interruption Frequency Index
SOE state-owned enterprises
SOSFIP Security of Supply Forecasting and Information Policy
SSF System Security Forecast
TFC total final consumption
TPA third-party access
TPES total primary energy supply
TSO transmission system operator
VRE variable renewable energy
Units of measurement b/d barrels per day
bcm billion cubic metres
GW gigawatt
GWh gigawatt hour
Hz hertz
kb/d thousand barrels per day
km kilometre
km2 square kilometre
© O
ECD
/IEA,
201
7

ANNEXES
240
kWh kilowatt hour
m3 cubic metre
mb million barrels
mcm million cubic metres
MJ megajoule
Mt million tonnes
MtCO2 million tonnes of carbon dioxide
MtCO2-eq million tonnes of carbon dioxide-equivalent
Mtoe million tonnes of oil-equivalent
MW megawatt
MWh megawatt-hour
PJ petajoule
toe tonne of oil-equivalent
TWh terawatt hour
W watt
© O
ECD
/IEA,
201
7

Onl
in
e bookshopPDF versions at 20% discount
ww
w.i
ea.o
rg/booksIn
tern
atio
nal
Energy Agency
Secure Sustain
able T
oget
her
World Energy Outlook series
World Energy
Investment series
Energy Statistics series
Energy Policiesof IEA
Countriesseries
Energy Technology
Perspectives series
E-mail: books@
iea.org
Medium-Term Market
Reports series
Oil
Coal
RenewableEnergy
EnergyEfficiency
Market Report
Gas
Global Gas Security series
EnergyPolicies
Beyond IEA Countries
series

This publication reflects the views of the IEA Secretariat but does not necessarily reflect those of individual IEA member countries. The IEA makes no representation or warranty, express or implied, in respect of the publication’s contents (including its completeness or
accuracy) and shall not be responsible for any use of, or reliance on, the publication.
Unless otherwise indicated, all material presented in figures and tables is derived from IEA data and analysis.
This document, as well as any data and any map included herein are without prejudice to the status of or sovereignty over any territory, to the delimitation of international frontiers and boundaries and to the
name of any territory, city or area.
IEA Publications, International Energy Agency
Website: www.iea.org Contact information: www.iea.org/aboutus/contactus
Typeset in France by IEA, February 2017 Cover design: IEA. Photo credits: © PhotoObsession.
IEA/OECD possible corrigenda on: www.oecd.org/about/publishing/corrigenda.htm

ENERGYPOLICIES
OF IEACOUNTRIESNew Zealand
2017 Review
Since the last IEA in-depth review in 2010, New Zealand has further developed its energy policy, as reflected in its energy strategy to 2021 and new rules for more competitive electricity markets.
With its unique resource base, New Zealand is a success story for the development of renewable energy, notably hydro and geothermal, without government subsidies. Geographically isolated, New Zealand has developed robust policies for security of supply. Outside of its largely low-carbon power sector, managing the economy’s energy intensity and greenhouse gas emissions while still remaining competitive and growing remains a challenge.
The IEA review highlights the areas that are critical to the success of the energy policy agenda in New Zealand.
To support sustainable growth in line with the Paris Agreement, the government should facilitate technology opportunities for renewable energy and energy efficiency, in buildings, industrial heat, transport and agriculture.
The government has ambitious plans to boost the share of electric vehicles and renewable energy. The country has a flexible power system, but future growth requires fine-tuning of market rules in favour of even more flexibility, demand response, smart and effective electricity retail and distribution.
While security of supply is well ensured by effective markets, an energy-constraint system can benefit from market-based risk managements tools, including a safety net for dry years as well as access to global LNG markets.
This review analyses the energy policy challenges facing New Zealand and provides recommendations to help guide the country towards a more secure, sustainable and affordable energy future.