Energy, Oil & Gas Industry Update SCOR for Energy, Oil & Gas Forum for Benchmarking and Practices...
23
Energy, Oil & Gas Industry Update SCOR for Energy, Oil & Gas Forum for Benchmarking and Practices Gary Kilponen SCC Director & Treasurer May 21, 2010
-
Upload
marilyn-skaggs -
Category
Documents
-
view
338 -
download
30
Transcript of Energy, Oil & Gas Industry Update SCOR for Energy, Oil & Gas Forum for Benchmarking and Practices...
Energy, Oil & Gas Industry UpdateSCOR for Energy, Oil & GasForum for Benchmarking and Practices
Gary KilponenSCC Director & Treasurer
May 21, 2010

Agenda
• Introductions
• Purpose
• SCC Energy, Oil & Gas Industry Group Update
• Sample Downstream Supply Chain Analysis
• Research Plan
• Industry Group Participation
• Next Steps/Action Plan
2
gk
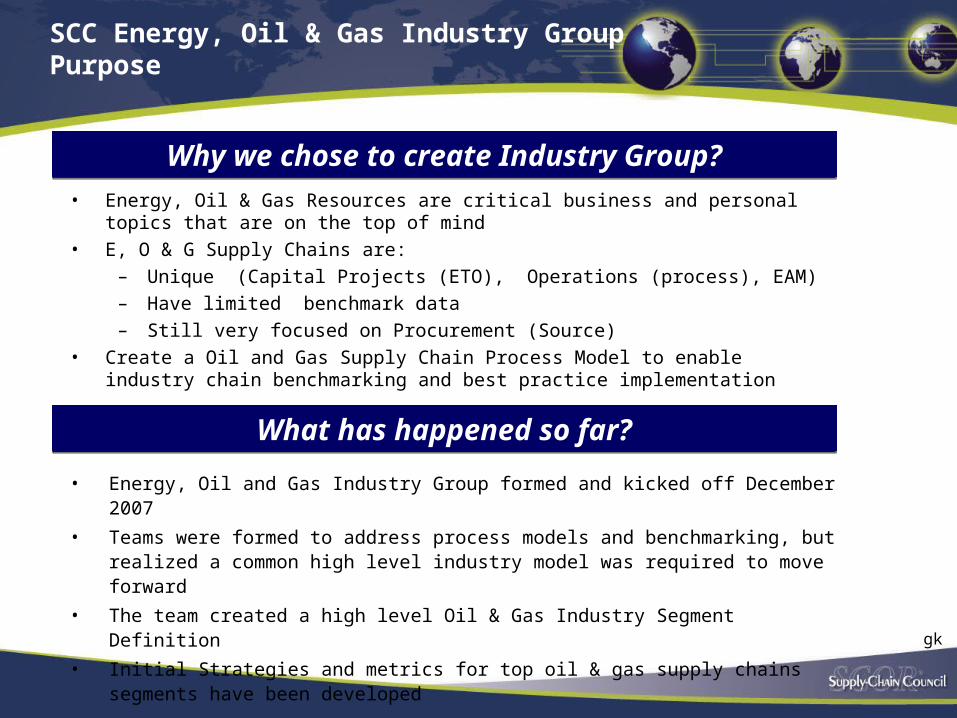
SCC Energy, Oil & Gas Industry Group Purpose
• Energy, Oil & Gas Resources are critical business and personal topics that are on the top of mind
• E, O & G Supply Chains are:– Unique (Capital Projects (ETO), Operations (process), EAM)– Have limited benchmark data– Still very focused on Procurement (Source)
• Create a Oil and Gas Supply Chain Process Model to enable industry chain benchmarking and best practice implementation
Why we chose to create Industry Group?Why we chose to create Industry Group?
What has happened so far?What has happened so far?
• Energy, Oil and Gas Industry Group formed and kicked off December 2007
• Teams were formed to address process models and benchmarking, but realized a common high level industry model was required to move forward
• The team created a high level Oil & Gas Industry Segment Definition
• Initial Strategies and metrics for top oil & gas supply chains segments have been developed
gk

OIL & GAS WORKING GROUP

Oil & Gas Challenge: Supply Chain Excellence
How to facilitate and accelerateImprovements in Oil & Gas Supply Chains
– Completeness: enough reference data to address common Oil & Gas metrics and processes
– Benchmark: Provide a neutral metrics framework for broad industry benchmarking of supply chains
– Practices: What are industry-specific best practices can be added to the SCOR™ framework
– Strategy: Common industry strategies by Oil & Gas supply chain type
– Flows: what do material flows look like for Oil & Gas, and how do they relate to metrics
5
gk

Industry Group Research Phases
• Phase I – Supply Chain Identification and Benchmarking Preparation– Understand the Scope and Extent of the EO&G Supply Chains – Identify Major Supply Chain Types within business segments– Identify Major Supply Chain Strategies– Create a base of reference SCORcard (metrics) for benchmarking
• Phase II – Benchmarking Study and Analysis– Facilitate industry benchmarking process– Analyze and publish results
• Phase III – On-going Activities– Create a base of reference material flows– Create a base of reference best practices related to the Energy, Oil and Gas
supply chains– Identify key supply-chain issues important to Energy, Oil and Gas industry– Educate/Discuss shared learning and findings– Provide forum for Energy, Oil and Gas supply-chain practitioners to network
6
gk

Defined: The Scope of Energy Oil & Gas
• Initial focus on Upstream, Midstream, and Downstream with articulation of some details of the material flow.
• Identified Infrastructure Equipment & Maintenance as common area to all three.
gk

Framework for Benchmarking
• Supply Chain Definition
• Supply Chain Prioritization
• Supply Chain Strategy
• Selecting Metrics
• Sourcing Data
• Creating a Balanced SCORcard™
• Performing Benchmark
8
gk

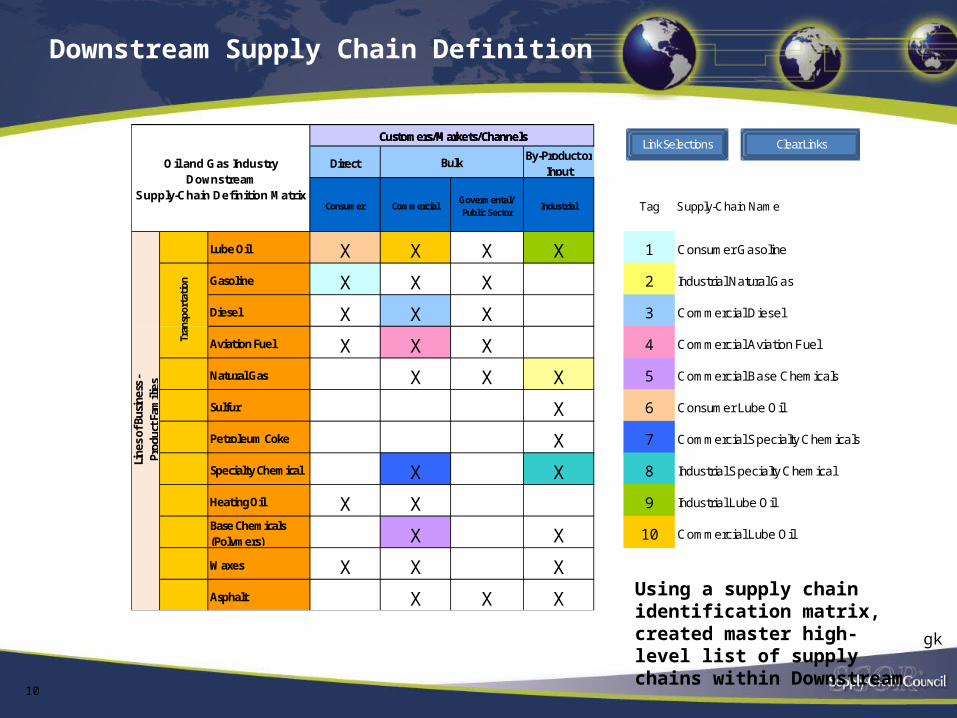
Supply Chain Definition
• Supply Chains are the totality of processes spanning operations from supplier to end-customer, focused on material, work and information flow
• We use a tool called the Supply Chain Definition Matrix to define the Supply Chains within an enterprise
• The Supply Chain Definition (i/o Matrix) Matrix helps determine the number and size of supply chains
– Columns: Customers (Output)
– Rows: Products (Input)
• The intersection of each column and row – if the goods or services flow to the customer – is a supply chain
9
gk
Downstream Supply Chain Definition
10
DirectBy-Product or
Input
Consumer CommercialGovermental/ Public Sector
Industrial Tag Supply-Chain Name
Lube Oil X X X X 11 Consumer Gasoline
Gasoline X X X 2 Industrial Natural Gas
Diesel X X X 3 Commercial Diesel
Aviation Fuel X X X 4 Commercial Aviation Fuel
Natural Gas X X X 5 Commercial Base Chemicals
Sulfur X 6 Consumer Lube Oil
Petroleum Coke X 7 Commercial Specialty Chemicals
Specialty Chemical X X 8 Industrial Specialty Chemical
Heating Oil X X 9 Industrial Lube Oil
Base Chemicals (Polymers) X X 10 Commercial Lube Oil
Waxes X X XAsphalt X X X
Customers/Markets/Channels Customers/Markets/Channels
Oil and Gas IndustryDownstream
Supply-Chain Definition Matrix
Bulk
Tran
spor
tati
on
Line
s of B
usin
ess -
Prod
uct F
amili
esLink Selections Clear Links
Using a supply chain identification matrix, created master high-level list of supply chains within Downstream
gk

Downstream Supply Chain Prioritization
11
Criteria
Weight
Overall Rank Result Rank Result Rank Result Rank Result Rank Result
Consumer Gasoline 1 1 1 0 0 0 0
Industrial Natural Gas 2 2 2 0 0 0 0
Commercial Diesel 3 3 3 0 0 0 0
Commercial Aviation Fuel 4 4 4 0 0 0 0
Commercial Base Chemicals 5 5 5 0 0 0 0
Consumer Lube Oil 6 6 6 0 0 0 0
Commercial Specialty Chemicals 1 0 1 1 0 0 0
Industrial Specialty Chemical 2 0 2 2 0 0 0
Industrial Lube Oil 3 0 3 3 0 0 0
Commercial Lube Oil 4 0 4 4 0 0 0
Unit Volume
100%
NA
0%
NA
0%
Oil and Gas IndustryDownstreamSupply Chains taken from the Definition Matrix
Supply Chain Priority MatrixWhen assigning rank; the highest number should correspond to the highest rank. The supply chain with the highest overall rating takes the biggest priority.
Gross Margin % NA
100% 0%
Light Prioritization for further assessments gk

Supply Chain Strategy
• We use a tool called the Supply Chain Strategy Matrix to Identify priority strategic features or attributes of Supply Chains.
• Each supply chain strategy is indicated by a collection of ranked features:
Reliability On time? Complete? Undamaged?
Responsiveness From Customer Request to final acceptance
Flexibility How long to scale up? How expensive to scale down?
Cost Cost of Processes? Cost of Goods Sold?
Assets Working Capital? Return on Investments?
gk

Comparative Ranking
• We advocate using a simple ranking system for industry comparison
• Each rank corresponds to a specific percentile in industry performance
• We do not use averages or other statistical tests• Our key ranks:
Performance Percentile Choices Interpretation
Superior 90th 1 Need to be “Top 10” performer
Advantage 75th 2 Need to be “Top Half” performer
Parity 50th 2 “Half better/Half worse”
gk

Initial Downstream Strategies
14
RELIABILITY - The performance of the supply chain in delivering: the correct product, to the correct place, at the correct time, in the correct condition and packaging, in the correct quantity, with the correct documentation, to the correct customer.
RESPONSIVENESS - The speed at which a supply chain provides products to the customer.
AGILITY (flexibility, scalability) - The agility of a supply chain in responding to marketplace changes to gain or maintain competitive advantage.
COST - The costs associated with operating the supply chain.
ASSETS - The effectiveness of an organization in managing assets to support demand satisfaction. This includes the management of all assets: fixed and working capital.
Consumer Gasoline
Industrial Natural Gas
Commercial DieselCommercial
Aviation FuelCommercial Base
ChemicalsConsumer Lube Oil
Commercial Specialty Chemicals
Industrial Specialty Chemical
Industrial Lube OilCommercial Lube
Oil
Reliability P P P
Responsiveness P A P
Agility P S P
Cost S P S
Assets A P A
Oil and Gas IndustryDownstream Supply-Chain
Strategy Matrix
External
Internal
Create Columns
• Each unique combination of ratings defines Your Supply Chain Strategy for the channel
• Think of the rating as a desired state, NOT where you want to improve the most
gk

Initial SCORcard Created (Consumer Gasoline)
15
gk

Final Benchmarking Phase
• Used for choosing target performance• Critical to understand Performance in a particular
Demographic• Can be “internal” (competing against other supply chains
in same company)• Aligns Strategy, Performance, and Performance Goals
16
Attribute SAP Metric (level 1) You Parity Adv Superior Gap
Reliability S Perfect Order Fulfillment 97% 92% 95% 98% 1%
Response A Order Fulfillment Cycle Time 14 days 8 days 6 days 4 days 8 Days
Flexibility P Ups. Supply Chain Flexibility 62 days 80 days 60 days 40 days 0
Cost P Supply Chain Mgmt Cost 12.2% 10.8% 10.4% 10.2% 1.4%
Assets A Cash-to-Cash Cycle Time 35 days 45 days 33 days 20 days 2 Days
*Sample Data Onlygk

Industry Group Ongoing Research Plan

Organizational Model
cl
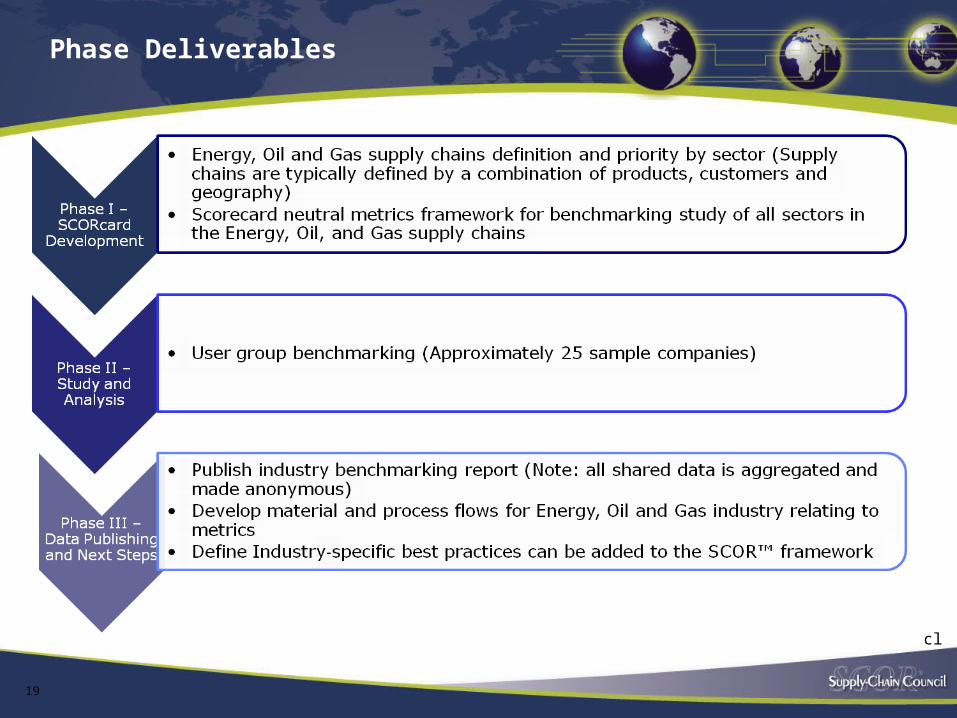
Phase Deliverables
19
cl

Phase I Program Timeline

Opportunities to Participate
• Industry Segment Volunteer– Practitioners/Consultants that can provide useful insight into target supply chains
– Meet bi-weekly via teleconference ( 3-6 hours per month)
– Anticipate 4-6 month initial commitment (Phase I)
– Responsible for identification of Supply Chain and Supply Chain Metrics
• Review Panel– Volunteers who desire to participate but cannot commit to a bi-weekly team
meeting
– Will meet via teleconference at project milestones (no more than once per month)
– Serve as a review panel for the data that is being collected/submitted.
• Team Leader (Segment)– Small group committed to oversee the project
– Will insure integration of all team data into benchmarking that will be useful for the industry as a whole.
– Serve as part of the Steering Committee
21
cl

Oils and Gas Industry Group Next Steps
• Team Development – Email Administrator: [email protected]
• Contact Information• Team
– Upstream– Downstream– Mid stream– Infrastructure Equipment and Maintenance
• Desired capacity to serve. – Development Team– Review Team– Team Leader (Segment)
• Develop project plan for each team• Resources• Timeline
22
cl

Open Discussion

![Crude Assay Report · 15 Vacuum Gas Oil Cuts - Gas Oil [325-370°C] 15 16 Vacuum Gas Oil Cuts - Gas Oil 1[370 - 540°C] 16 17 Vacuum Gas Oil Cuts - Heavy Vacuum Gas Oil [370 - 548°C]](https://static.fdocuments.us/doc/165x107/5e68681c2598ff04995c67bc/crude-assay-report-15-vacuum-gas-oil-cuts-gas-oil-325-370c-15-16-vacuum-gas.jpg)