Energy implications for water supply tanks in high-rise ... · PDF fileEnergy implications for...
14
CIBW062 Symposium 2012 549 Energy implications for water supply tanks in high-rise buildings C.T. Cheung(1), K.W. Mui(2), L.T. Wong(3) 2. [email protected] 3. [email protected] 1,2,3. Department of Building Services Engineering, The Hong Kong Polytechnic University, Hong Kong China. Abstract High-rise housing, a trend in densely populated cities around the world, increases energy use for water supply and corresponding greenhouse gas emissions. This paper presents an energy efficiency evaluation measure for water supply system designs and a mathematical model for optimizing pumping energy through the arrangement of water tanks in a building. To illustrate that the model is useful for establishing optimal design solutions that integrate energy consumption into urban water planning processes which cater to various building demands and usage patterns, measurement data of high-rise residential buildings in Hong Kong are employed. The results show the energy efficiency of many existing high-rise water supply systems is about 0.25 and can be improved up to over 0.3 via water storage tank relocations, corresponding to annual electricity saving up to 0.3% of the total annual electricity consumption in Hong Kong. Keywords Building, water supply, energy efficiency, water consumption, storage tank location 1 Introduction Very tall buildings are a trend in recent developments in Hong Kong, where is a developed city on hilly terrain with limited usable land for buildings. It has been estimated that the current average residential building height in the city is estimated to be 25.8 storeys [1]. For high-rise buildings, gravity storage tanks on building rooftops (or on intermediate mechanical floors) are designed for distributing water through down feed pipes [2] and pressure reducing valves (PRV) with adjustable settings and screwed joints are commonly installed to minimize the problems of water leakage or damage in supply pipes and appliances caused by excessive water pressure on lower floors in low demand situations.
Transcript of Energy implications for water supply tanks in high-rise ... · PDF fileEnergy implications for...
CIBW062 Symposium 2012
549
Energy implications for water supply tanks in high-rise
buildings
C.T. Cheung(1), K.W. Mui(2), L.T. Wong(3) 2. [email protected]
1,2,3. Department of Building Services Engineering, The Hong Kong Polytechnic
University, Hong Kong China.
Abstract
High-rise housing, a trend in densely populated cities around the world, increases
energy use for water supply and corresponding greenhouse gas emissions. This paper
presents an energy efficiency evaluation measure for water supply system designs and a
mathematical model for optimizing pumping energy through the arrangement of water
tanks in a building. To illustrate that the model is useful for establishing optimal design
solutions that integrate energy consumption into urban water planning processes which
cater to various building demands and usage patterns, measurement data of high-rise
residential buildings in Hong Kong are employed. The results show the energy
efficiency of many existing high-rise water supply systems is about 0.25 and can be
improved up to over 0.3 via water storage tank relocations, corresponding to annual
electricity saving up to 0.3% of the total annual electricity consumption in Hong Kong.
Keywords
Building, water supply, energy efficiency, water consumption, storage tank location
1 Introduction Very tall buildings are a trend in recent developments in Hong Kong, where is a
developed city on hilly terrain with limited usable land for buildings. It has been
estimated that the current average residential building height in the city is estimated to
be 25.8 storeys [1]. For high-rise buildings, gravity storage tanks on building rooftops
(or on intermediate mechanical floors) are designed for distributing water through down
feed pipes [2] and pressure reducing valves (PRV) with adjustable settings and screwed
joints are commonly installed to minimize the problems of water leakage or damage in
supply pipes and appliances caused by excessive water pressure on lower floors in low
demand situations.
CIBW062 Symposium 2012
550
According to the expression below, where pumpE
is the energy use for pumping a
volumetric water demand pumpv , and BN (=25.8 storeys) is the average building height
[3], water supply systems in buildings account for approximately 1.6% of the total city
electricity use in the city, for the total annual water consumption of 1200 Mm3 year
1
[4].
60
12.16.3
pumpB
pump
vNE … (1)
An energy efficiency evaluation measure is proposed for water supply system designs in
buildings, with verification measurements in some high-rise residential buildings of
Hong Kong. Energy performance targets for some system designs, together with
estimated energy savings potential are discussed.
2 Energy efficiency of building water supply systems
Figure 1 illustrates two water supply system designs: (a) an elevated water tank that
feeds demands with little height differences (e.g. an elevated water tower over a town);
(b) a roof tank that feeds distributed demands with large height differences (e.g. a roof
tank on top of a building). For a high-rise building, the system design is characterised
by the water lift demand height ratio *
lh given by Equation (2), where 1hhn is the
height difference between the demands at the top and bottom for ni ,...2,1 and 1h is
the water lift height.
l
nl
h
hhh 1* … (2)
The water lift height lh is the sum of the height measured from the tank base to the
tank inlet ch - approximated by the tank volume ,cV the height difference between the
demand n and the tank base ,bh and the height difference between the water surface
(i.e. of the reservoir in design (a) or of the break tank in design (b)) and the top demand
location ,nh 31~; ccnbcl Vhhhhh ... (3)
The water lift demand height ratios for system designs (a) and (b) are 0*
lh and 0*
lh
respectively. For a high-rise building, the ratio 1~*
lh is dominated by the demand
heights nl hh ~ and .ncb hhh
The desired minimum water pressure head oH , say 5m (H2O) in some design practices,
is assumed at the demand point and the friction head required in the upfeed water pipe
fH is taken as a portion of the pipe length (i.e. 10% of lh ) [5],
lfo hHH 1.0;5 … (4)

CIBW062 Symposium 2012
551
Consider the case of uniformly distributed demands along the building height (i.e.
vvvvv ni...21 ), the demand heights ,ih where ,,...2,1 ni for the two designs
(a) and (b) are expressed by,
ffnnl
nl
Chhhhhhh
hhhh
12312*
21*
...:0
...:0 … (5)
,outE (MJ) the potential energy for the water demands at height ih (i.e. „output energy‟
of a design) is given below, where (=1000 kgm−3
) is the water density and g
(=9.81ms−2
) is the gravity,
;hvgE:hi iiout
*
l ni ,...2,1 … (6)
(a) 0*
lh
(b) 0*
lh
Figure 1. Gravity tank systems
Water surface nv nh
oH
Friction head fH
Pressure head oH
Pump
station
fH
oH
Roof tank
Break tank
iv
Building
1v
nv
nh
bh
ch
bh
ch
Water
tower
1h
lh
oH
oH
lh
…
…
CIBW062 Symposium 2012
552
It can be rewritten for both designs,
20
0
1 nout
*
l
nout
*
l
hhgnvE:h
gnvhE:h
… (7)
The „input energy‟ of both designs is the pumping energy of lifting water up to the tank
pumpE (MJ) as defined below, where c is the design overall transmission efficiency,
c
cbnfo
c
lpump
*
l
hhhHHgnvgnvhE:h … (8)
Energy efficiency, which is the „output energy‟ divided by the „input energy‟, is a
measure of pumping energy performance. It can be determined for the water supply
systems using the heights, pipe friction and allowable pressure head,
cbn
cn
l
cbn
cnl
pump
out
hhh
hh
h
hhh
hh
E
E
1.15
2:0
1.15:0
;1
*
*
… (9)
Table 1. Selected number of design parameters for building water supply systems.
Pump efficiency p 0.65
Mechanical transmission efficiency m 0.90
Electric motor efficiency e 0.90
Total water storage tank volume cV (m3) 27
Height between tank base and the last demand location bh (m) 10
Height of the bottom demand location 1h
(m) 1
Height of the top demand location nh (m) ≥10
Height of the tank inlet measured from tank base ch (m) 3
Friction head loss in pipes fH (m) lh1.0
Minimum water pressure head allowed at the outlet oH (m) 5
Occupant area ratio sO (ps m
−2) (public residential)
(private residential)
0.085 (0.03)
0.096 (0.04)
Yearly per-capita water consumption (m3 ps
−1 year
−1) (freshwater)
(seawater)
70 (13)
22 (10)
Standard deviation shown in brackets
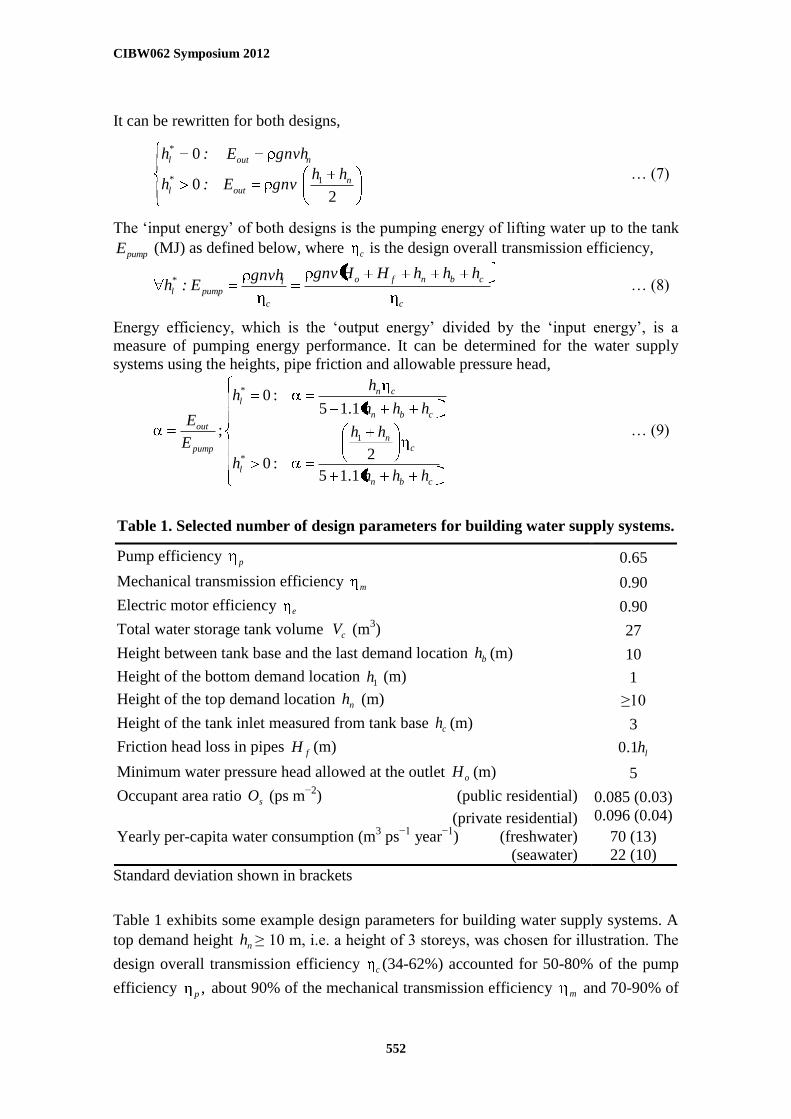
Table 1 exhibits some example design parameters for building water supply systems. A
top demand height nh ≥ 10 m, i.e. a height of 3 storeys, was chosen for illustration. The
design overall transmission efficiency c (34-62%) accounted for 50-80% of the pump
efficiency ,p about 90% of the mechanical transmission efficiency m and 70-90% of

CIBW062 Symposium 2012
553
the electricity motor efficiency e [6]. For simplicity, constant efficiencies are assumed:
,65.0p,9.0m ,9.0e and ,5625.0c
empc … (10)
The values of energy efficiency for water supply system designs of *
lh between 0 and
1 using the design numbers in Table 1 are approaching 0.5 and 0.25 for 0*
lh and
0*
lh respectively with an increased height .nh
n
nc
n
nc
l
n
nc
n
ncl
h
h
h
h
h
h
h
h
hh
2.26.38
1
131.15
2
1
:0
1.13.19131.15:0
*
*
… (11)
25.0~2.2
~:0
5.0~1.1
~:0:
*
*
cl
cl
n
h
hh … (12)
It is noted that for a residential building height of up to 300 m in Hong Kong, the energy
efficiency values are 0.44 and 0.24 for designs (a) and (b). The design parameters
oncb Hhhh ,,, have significant contributions to the energy efficiency.
3 Sample buildings A survey of 5 government-funded residential buildings in Hong Kong (Table 2) was
used to examine the validity and applicability of the proposed water demand model and
the energy efficiency measure. It was noted that the apartments were rented to lower-
income families. The buildings varied from 15 to 33 storeys, with an average height of
22 storeys. Number of apartments, apartment floor area, roof tank volumes and demand
heights of all buildings are summarized in Table 2. Demand distributions in some
buildings were vertically uneven as indicated through the number and size of apartments.
The heights of bottom demand 1h were below 5 m. The data of height difference
between the tank base and the top demand (i.e. bh ) were 10 m or less. Heights between
any two (vertically) consecutive demands were about 2.7 m.
In each of the sampled buildings, water secured from the city mains was stored in a
break tank and transferred through a pair of transfer pumps to the rooftop gravity tanks
for distribution to every floor of the building. There are two separated water supply
networks in Hong Kong – one for fresh water supply and the other for seawater flushing;
only one old building was using freshwater for water closet flushing and had no
separate flushing water tank.

CIBW062 Symposium 2012
554
3.1 Water consumptions
The average daily water consumption on a floor div ,
is determined by Equation (13),
where isN , is the number of occupants on floor ,i dsv ,
is the average daily per-capita
water consumption, isO ,
is the occupant area ratio on floor i and iA is the total
apartment area on floor i [7],
;,,, dsisdi vNv iisis AON ,, … (13)
A number of studies approximated the regional profiles of occupant area ratio sO and
average daily per-capita water consumption dsv ,
in buildings by parametric distribution
functions as shown in Table 1 [8,9]. Parameters dsv ,
and isO ,
in Equation (13) can be
determined via Monte Carlo simulations at percentile 1,0, ,, isds Ov through the
distribution functions dsv ,
~ and ,~
sO where is a random number taken from a pseudo
random number set generated by the prime modulus multiplicative linear congruential
generator [10].
;1,0~,,
,
ds
v
ds dvvds
;1,0~,
s
O
sdOOis
;~,, dsds vv sis OO
~, ... (14)
The total (daily) water consumption is used to calculate the pumping energy input to a
building water supply system,
;1 ,
n
i did vnvc
n
i dil
pump
vghE 1 ,
… (15)
Table 2. Survey of 5 residential buildings in Hong Kong
No. sN
Apart-
ments
per
storey
Apart
-ment
floor
area
Height
Tank
volume cV
(m3)
Measured
daily
pumping
energy
Ed,pump
(MJ day1)
Energy efficiency
(m2) 1h
(m) nh
(m) bh
(m) lh
(m)
Fresh
water
Flush
-ing
water
Roof
tank
only
(I) One
tank per
floor
(II) One
interme-
diate tank
1 36 18 32-49 4.5 99.0 6.5 109 55 27 1422 0.24 0.34 0.27
2 26 17 17-49 4.2 71.7 5.4 80 26 17 516 0.24 0.31 0.26
3 26 15-25 16-49 4.2 71.7 5.4 80 36 12 667 0.23 0.31 0.26
4 40 20 17-42 4.6 109.9 9.0 123 54 27 986 0.24 0.35 0.28
5 17 33 21 3.0 44.7 2.6 50 18 0 230 0.24 0.27 0.24
3.2 Measured pumping energy
In the surveyed buildings, electricity energy use was metered continuously for 24 hours
for all water supply pumps to determine the total daily pumping energy (input energy to
the system) consumption as presented in Table 2. It was noted that a single-day energy
consumption monitoring period might fall between two roof tank filling cycles and the
error of energy required to fill up the tank was doubled. In this study, the probable

CIBW062 Symposium 2012
555
errors of measurement were taken at a half of this error and indicated as error bars in
Figure 2.
Figure 2. Daily pumping energy consumption of 5 residential buildings in Hong
Kong
Figure 3. Energy efficiency I of water supply systems
Figure 2 shows the predicted daily pumping energy consumption against the measured
one for the surveyed buildings. The predictions, which were based on typical pump
efficiency details displayed in Table 1, reasonably agreed with the measurement results.
The predicted average daily water consumption of a floor div , at height ih was used to
100
1000
10000
100 1000 10000
0.2
0.3
0.4
0.5
40 90 140
Measured daily energy Ed,pump (MJ day1)
Sim
ula
ted a
ver
age
dai
ly e
ner
gy
Ed
,pu
mp (
MJ
day
1)
Top demand height nh (m)
Ener
gy e
ffic
ien
cy α
0; *lh
0; *lh
I

CIBW062 Symposium 2012
556
determine the output energy outE (Equation (6)) for the buildings and thus the energy
efficiency of existing roof tank design as shown in Table 2.
Figure 3 plots the energy efficiency against the top demand height, with cases 0*
lh
and 0*
lh shown for comparison. As expected in roof tank designs, energy efficiency
values obtained for the surveyed buildings were close to the lower side of .1~*
lh A few
cases were found below 1~*
lh for demands were unevenly distributed and dominated
by more occupants on lower floors (Building 3).
4 Energy implications of 2 example water tank arrangements The energy efficiency of a high-rise building can be optimized by the proper
arrangement of water storage tank(s). Two example designs are illustrated below:
4.1 (I) One supply tank for each demand height
An individual tank is reserved for every floor ( 0*
lh ) in a building. Based on the data
in Table 1, the energy efficiency I is given by the average energy efficiency of all
individual floors,
nnh
h
h
h
nn
n
n
n
n
n
I hh
hhdh
h
h
hh 11
;)96.13.34ln(93.896.1
1
96.13.34
1~
11
01h
… (16)
It can be expressed in discrete form, assuming a constant floor-to-floor height,ffC ,
;96.13.34
1~
1
n
ii
iI
h
h
n01h … (17)
The calculated values of I for the surveyed buildings using this arrangement are
shown in Table 2 and Figure 3. The arrangement offers energy efficiency improvements
as shown. The energy efficiency improvement (in percentage % ) is expressed by,
;*lhI 0
%*lh
I% 1001
0
… (18)
It is noted that using more riser pipes in this arrangement causes energy loss and energy
may not be saved for top demand height nh < 20 m. However, the improvement
becomes significant for greater hn.
CIBW062 Symposium 2012
557
4.2 (II) One roof tank and one intermediate tank
Demands v at height h in an n -storey building are subdivided on the j -th floor and
zoned vertically into the upper U and lower L zones, where ffC is the floor-to-floor
height,
;v,...v,v,v,...v,vvUnjjLj 2121 UnjjLj h,...h,h,h,...h,hh 2121 … (19)
;11 ffj Cjhh ;1 ffjj Chh ffn Cnhh 11 … (20)
Correspondingly, the energy output outE is,
2
1
2
1
11,
11,
ffn
ji iiUout
ffj
i iiLout
CjnhvjnghvgE
CjhgjvhvgE
… (21)
The water tank size is assumed proportional to the demands and the height of tank inlet
ch is given by,
3,
3,
1 cUc
cLc
Vnjh
njVh … (22)
The energy input pumpE is,
c
bUcffUfo
Upump
c
bLcffLfo
Lpump
hhCnhHHvjngE
hhCjhHHgjvE
,1,
,
,1,
,
1
1
… (23)
The energy efficiency is,
bcffo
ffc
c
bUcffUfo
ff
U
bcffo
ffc
c
bLcffLfo
ff
L
hVnjCnhH
Cjnh
hhCnhHH
Cjnh
hnjVCjhH
Cjh
hhCjhHH
Cjh
31
1
,1,
1
31
1
,1,
1
111.12
12
1
2
1
11.12
12
1
2
1
… (24)
The overall energy demand efficiency is determined by,
njnj ULII 1 … (25)
This arrangement offers some energy efficiency improvements % as exhibited in
Table 2. Figure 4 graphs the energy efficiency ranges of this arrangement for a building
when 1h = 4.2 m, cV = 40 m3, and examples of n = 20 (0.21-0.26) and 80 (0.25-0.3).

CIBW062 Symposium 2012
558
Figure 4. Energy efficiency II
of a water supply system with roof and
intermediate gravity tanks
Figure 5. Annual energy consumption for building water supply systems
As there are additional pipe frictions in the separated piping networks, no significant
energy savings can be achieved when the intermediate tank is close to the roof or the
lowest floor. The optimal height for zoning is about the middle height of the building,
i.e. .2~ nj Figure 5, in which a building height of 25.8 storeys (current average
residential building height in Hong Kong) is highlighted, shows the annual energy
output outaE , for the water demands against building height, and the corresponding
0
0.1
0.2
0.3
0.4
0.5
0 0.2 0.4 0.6 0.8 1
0
0.1
0.2
0.3
0.4
0.5
0 0.2 0.4 0.6 0.8 1
0
1000
2000
3000
4000
5000
6000
0 20 40 60 80
Fractional height nj
Ener
gy e
ffic
ien
cyα
L
U
II
Ener
gy e
ffic
ien
cy α
80n
Fractional height nj
20n
City building height (storeys)
Ener
gy u
se (
TJ
yea
r1)
outaE ,
pumpaE ,
25.0
3.0
35.0
4.0 45.0
Hong Kong
CIBW062 Symposium 2012
559
annual energy input pumpaE ,
for the roof tank systems with energy efficiency values
in between 0.25 and 0.45. It can be seen that energy consumption is proportional to
building height. For the height of 25.8 storeys, outaE ,
is 456 TJ and corresponds to an
energy input of 1822 TJ (1.2% of Hong Kong‟s total electricity consumption (149366
TJ)) at = 0.25. The potential annual energy can be saved through efficiency
improvements ' for Hong Kong is 410 TJ 06.0 if design arrangement (I) is
adopted or 160 TJ 02.0 if design arrangement (II) is taken up.
5 Conclusion Energy efficiency in buildings is a sustainable development strategy in Hong Kong. It is
necessary to develop a method to systematically address energy efficiency with respect
to the optimal design of high-rise water supply systems. This paper presented an energy
efficiency evaluation measure for water supply system designs and developed a
mathematical model for optimizing pumping energy through the arrangement of water
tanks in a building. The model was demonstrated to be useful for establishing optimal
design solutions that integrate energy consumption into urban water planning processes
which cater to various building demands and usage patterns. The results showed that the
energy efficiency of many existing high-rise water supply systems was about 0.25 and
could be improved significantly via water storage tank relocations. The corresponding
annual electricity could be saved was 160-410 TJ, a 0.1-0.3% of the total annual
electricity consumption in the city.
6 Acknowledgement
The work described in this paper was partially supported by a grant from the Research
Grants Council of the HKSAR, China (PolyU533709E).
7 List of symbols
A Area (m2)
C Constant head pressure
E Energy (MJ)
Ea, Ed Annual energy (MJ year1), daily energy (MJ day
1)
g Gravity (=9.81ms−2
)
H Pressure head of water column (m of H2O)
h Height (m) ji, Building floor counts, nji ,...2,1,
N Number count
O Occupant area ratio (ps m−2
)
V Volume (m3)
v Volumetric water demand over a specified period (m3)
Energy efficiency
c Overall transmission efficiency

CIBW062 Symposium 2012
560
e Electric motor efficiency
m Mechanical transmission efficiency
p Pump efficiency
Random number between 0 and 1 Water density (=1000 kgm
−3)
Subscript
0 of reference
n,...2,1 of demands ,,...2,1 n from the bottom floor to the top floor
III , of cases I and II
a of annually
B of building storey
b of water tank base
c of water tank base to inlet
d of daily
f of friction in upfeed water pipe
ff of floor to floor
L of lower zone
l of water lift
o of outlet
out of output pump of water pump
s of occupant
U of upper zone
% of percentage
Superscript
~ of distribution
* of relative
‘ of improvement
8 References
[1] Cheng C.L., Yen C.J., Wong L.T. and Ho K.C., “An evaluation tool of infection risk
analysis for drainage system in high-rise residential buildings”, Building Services Engineering
Research and Technology, Volume 29, Number 3, pp. 233–248, 2008.
[2] Wong L.T. and Mui K.W., “Modeling water consumption and flow rates for flushing water
systems in high-rise residential buildings in Hong Kong”, Building and Environment, Volume
42, Number 5, pp. 2024‒ 2034, 2007.
[3] Cheng C.L., “Study of the inter-relationship between water use and energy conservation for
a building”, Energy and Buildings, Volume 34, Number 3, pp. 261‒ 266, 2002.
[4] Hong Kong Water Supplies Department, „Total water management in Hong Kong: towards
sustainable use of water resources‟, 2008.
[5] Plumbing Services Design Guide, The Institute of Plumbing, England, Hornchurch, 2002.
[6] Kaya D., Yagmur E.A., Yigit K.S., Kilic F.C., Eren A.S. and Celik C., “Energy efficiency in
pumps”, Energy Conversion and Management, Volume 49, Number 5, pp.1662–1673, 2008.
[7] Wong L.T. and Mui K.W., “Epistemic water consumption benchmarks for residential
buildings”, Building and Environment, Volume 43, Number 6, pp.1031–1035, 2008.
CIBW062 Symposium 2012
561
[8] Wong L.T. and Mui K.W., „An epistemic analysis of residential occupant load factor‟,
Proceedings of Zhejiang-Hong Kong Joint Symposium 2007 – Innovative Building Design and
Technology-Challenges of Climate Change, 6-7 Jul, Hangzhou, China, pp. 38–44, 2007..
[9] Wong L.T. and Liu W.Y., “Demand analysis for residential water supply systems in Hong
Kong”, HKIE Transactions, Volume 15, Number 2, pp.24–28, 2008.
[10] Park S.K. and Miller K.W., “Random number generators: good ones are hard to find”,
Communications of the ACM, Volume 31, Number 10, pp.1192–1201, 1988.
9 Presentation of Authors
Mr C. T. Cheung is a PhD student at the Department of Building Services
Engineering, The Hong Kong Polytechnic University.
Dr. L. T. Wong is an associate professor at the Department of Building
Services Engineering, The Hong Kong Polytechnic University.
Dr. K. W. Mui is an associate professor at the Department of Building
Services Engineering, The Hong Kong Polytechnic University.

CIBW062 Symposium 2012
562