energy future holindings _020206b
38
Fourth Quarter and Full Year 2005 Earnings Discussion February 2, 2006
Transcript of energy future holindings _020206b
Fourth Quarter and Full Year2005 Earnings Discussion
February 2, 2006

Safe Harbor StatementThis presentation contains forward-looking statements, which are subject to various risks and uncertainties. Discussion of risks and uncertainties that could cause actual results to differ materially from management's current projections, forecasts, estimates and expectations is contained in the company's SEC filings. In addition to the risks and uncertainties set forth in the company's SEC filings, the forward-looking statements in this presentation could be affected by actions of rating agencies, delays in implementing any future price-to-beat fuel factor adjustments, the ability of the company to attract and retain profitable customers, changes in demand for electricity, the impact of weather, changes in wholesale electricity prices or energy commodity prices, the ability of the company to implement the initiatives that are part of its performance improvement program and growth strategy, and the terms under which the company executes those initiatives, and the decisions made and actions taken as a result of the company’s financial and growth strategies.
Regulation GThis presentation includes certain non-GAAP financial measures. A reconciliation of these measures to the most directly comparable GAAP measures is included in the appendix of the printed version of the slides and the version included on the company’s website at www.txucorp.com under Investor Resources/Presentations.
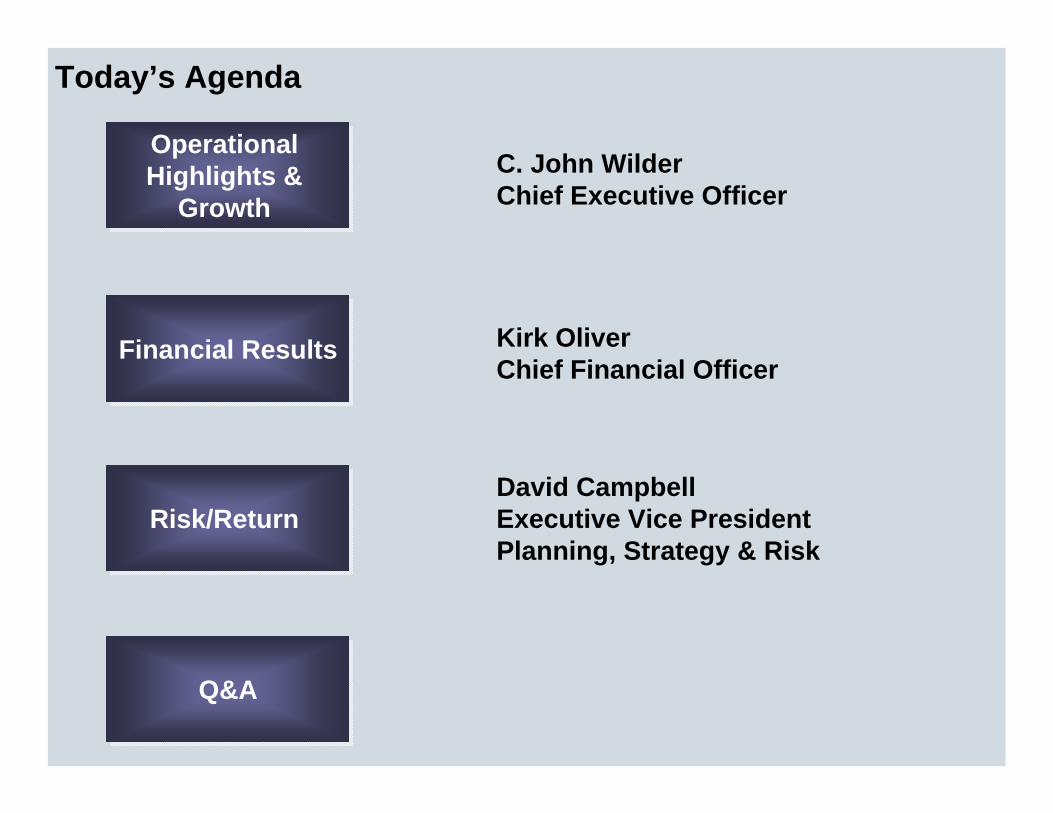
Today’s Agenda
Q&AQ&A
Financial ResultsFinancial Results Kirk Oliver Chief Financial Officer
Operational Highlights &
Growth
Operational Highlights &
Growth C. John WilderChief Executive Officer
Risk/Return Risk/Return David CampbellExecutive Vice PresidentPlanning, Strategy & Risk

Operational Earnings Per Share1
YTD 04 vs. YTD 05; $ per diluted share
Slide 1: TXU’s Earnings And Cash Flow Improved Substantially…
YTD 05YTD 04
2,902
2,042
Normalized OCF2
YTD 04 vs. YTD 05; $ millions
YTD 05YTD 04
1.41
3.33
136%136% 42%42%
1 Results are from continuing operations excluding special items and are split adjusted.2 04 normalized Operating Cash Flow (OCF) excludes special items of $284M; 05 normalized OCF excludes special items of $109M.

TXU Corp. Consolidated
153%153%
Operational Earnings Contribution by SegmentQ4 04 vs. Q4 05; YTD 04 vs. YTD 05; $ per diluted share
TXU Energy Holdings
TXU Electric Delivery
TXU Corp. Consolidated
TXU Energy Holdings
TXU Electric Delivery
190%190%
136%136%
152%152%
60%60%
Slide 2: …Reflecting Solid Performance By Core Businesses
0.34
0.86
Q4 04 Q4 05
1.41
3.33
YTD 04 YTD 05
0.10 0.10
Q4 04 Q4 05
0.30
0.87
Q4 04 Q4 05
0.450.72
YTD 04 YTD 05
1.17
2.95
YTD 04 YTD 05
0%0%

Slide 3: In 2004 We Launched TXU’s Restructuring…
TXU Power
TXU ElectricDelivery
TXU Energy
TXU has 3 structurally advantaged businesses…
…focused on delivering top quartile financial performance
Financial FlexibilityFinancial Flexibility
• EBITDA/Interest• Total debt/EBITDA• Total debt/enterprise
value
• EPS• Cash flow
• ROIC• Total return to
shareholders
Earnings Power
Earnings Power
ReturnsReturns
…enabled by an industrial skill set…
Performance Management
Operational Excellence
Risk/Return Mindset
Market Leadership

5653120$ millionsRetail bad debt expense15582,2665,393no. ofPUC complaints149611268secondsCall answer time13
Market Leadership273,1824,359$ millionsFixed costs312202,2062,773$ millionsSG&A and O&M11
Cost Leadership1291.221.73rateSafety (DART)10
919.317.7TWhNuclear generation28744.041.3TWhLignite generation7
12615.46.8percentROIC4
-1.171.17no. ofSAIFI (non-storm)9
Operational Excellence65
321Financial Performance1Category
3.14.9
1,7982,9023.33
05
4.73.0
8601,8601.01
03
Debt/EBITDAEBITDA/Interest
Normalized FCFNormalized OCFOperational EPS
Metric
34ratio63ratio
109$ millions56$ millions
230$ per share
% ImprovementUnits
Key Metrics03-05; Mixed measures
1 03 Financial Performance and Cost Leadership categories include TXU Gas and TXU Australia in results.2 Nuclear generation refueled both units in 05. 05 results have been adjusted to approximate a single outage year.3 Fixed costs include non-variable SG&A, bad debt, cap ex, operating costs, interest expense, and other cash costs; 03 includes TXU Gas and TXU Australia.
Slide 4: …Which Has Materially Improved Performance Across A Broad Range Of Metrics

Slide 5: As Part Of The Turnaround, TXU Has Significantly Improved Its Risk Profile
Major Business Risks03-05; $ billions and $ per share
December 03
Enterprise value
05 normalized FCF per share
$18.7 billion
$1.26
$27.8 billion
$1.88
$36.1 billion
$3.70
• Underwater gas hedge• Poor financial forecasting• Poor performance management• High fixed costs• Poor customer service• Under-funded capital programs• Weak governance• Uneconomic leases/contracts• Litigation• Unregulated pension costs• Above market OPEB• Substantial bad debt• 05 legislation risk• Single plant nuclear risk• Environmental risk• Gas price/heat rate risk
October 04• Uneconomic leases/contracts• Litigation• Unregulated pension costs• Above market OPEB• Substantial bad debt• 05 legislation risk• Single plant nuclear risk• Environmental risk• Gas price/heat rate risk
• Single plant nuclear risk• Environmental risk• Gas price/heat rate risk
February 06

Slide 6: Focused On Infrastructure And Technology Investments To Improve Reliability And Lower Costs
TXU Electric Delivery
Continue To Redefine Excellence In Texas
Consolidate Regional T&DTo Extract Synergies
Focus on asset management: optimize reliabilityand costsTake advantage of highgrowth market and advantaged business model to invest
Integrate BPL and AMR into grid to redefine service quality
Scale TXU’s asset management capabilities over a larger grid
Take a national role in technology through leading technology consortium and third party infrastructure fund
Progress to DateSettlement = rate certainty through 2008
3 year cap ex plan of over $800M per year; over 75% funded through growth or tracker mechanisms
BPL contract facilitates deployment of “Smart Grid”technologies to deliver top decile costs and reliability by the end of the decade

Slide 7: Focused On Restoring Profitability And Delivering Superior Service And Product Innovations
TXU Energy/Wholesale
Return The North TexasConsumer Franchise
To Profitability
Opportunistically Build Profitable Businesses In
Other Customer Segments
Introduce innovative products and pricing plans that provide sustaining margins
Continue to redefine customer service to distinguish TXU Energy from its competitors
Continue to advocate for a market-based structure that encourages competition
Penetrate South Texas market
Focus on higher margin segments in small, medium, and large commercial business
Continue to drive cost leadership to enhance competitiveness across all segments
Progress to Date
Improved customer service
Margins improving with PTB change
New product launches driving customer loyalty
Improved targeting and streamlined business pricing processes

1 Based on average customer usage of 12,000 kWh/yr with PUC-approved residential load profile; net margin defined as PTB rate – cost of energy– avg. wires cost-SG&A- bad debt – hedging costs and taxes.
North Texas Incumbent Net Margin1
02-05; Percent
-20
-15
-10
-5
0
5
10
15
20
Jan-02 Jun-02 Dec-02 Jun-03 Dec-03 May-04 Nov-04 May-05 Nov-05
Slide 8: Retail Net Margins Were Significantly Higher Upon Market Open
Net margins have deteriorated because of the inability to smoothly pass through commodity price increases.
Net margins have deteriorated because of the inability to smoothly pass through commodity price increases.

Slide 9: Price To Beat Economics And Discounts Vary Significantly Across The State
1 Based on average customer usage of 12,000 kWh/yr. with PUC-approved residential load profile; headroom defined as PTB rate – cost of energy (avg. NYMEX 12 mo. strip x 7.8 heat rate x assumed 25% for load shaping, congestion, line losses and other ancillary costs) – avg. wires cost (based on published TXU Electric Delivery rates, excluding clawback). NYMEX 12-month strip through 1/31/06.
2 PTB prices based on Power to Choose website as of 2/1/2006, prices include expected fuel factor increase in March for CNP and in July for CPL and WTU.
PTB Rates by Region at 12,000 kWh/yr1
Jan 06; $/MWh
Net margin after tax
Estimated incumbent gross margin
PTB price2
$0
$50
$100
$150
$200
TNMP TXU CNP CPL WTU
163177
145
191
150Average competitive discount level
Average competitive discounts exceed after tax margins in the TNMP, TXU, and CNP markets, indicating that attacker economics are negative
Average competitive discounts exceed after tax margins in the TNMP, TXU, and CNP markets, indicating that attacker economics are negative
Cost of goods sold

Slide 10: Driving The Operating System And Pursuing High Value Growth Opportunities
TXU Power
Continue To Strengthen The ERCOT Position
Gain Scale Outside OfERCOT And Build Market
Leader Position
Leverage TXU Operating System to continue to drive increased value from Texas baseload fleet
Take advantage of existing sites (Sandow, Oak Grove) to add new capacity in Texas
Scale TXU Operating System to improve 3rd party assets
Seek partnerships with counterparties who share our vision
Develop deeper multi-market wholesale capabilities
Progress to Date
TXU Operating System: record production
Progressing with Sandow 5 and Oak Grove; 06 milestones include securing air permit and signing EPC contract
Other sites offer similar advantages
Scanning for opportunities to gain scale outside of ERCOT

Slide 11: TXU’s Structural Advantages Create A Superior New Build Investment Thesis
2,000300425
475
750
50
Strong Returns: TXU New Build Economics1
05; $ millions
Value -$/KW 30 300 270475
IRR - percent
It will be difficult for “greenfield” sites to replicate these compelling economics.
It will be difficult for “greenfield” sites to replicate these compelling economics.
Value of new build to generic owner
Compression of build schedule
by 1 year
Reduction in cap ex by $350/KW
Improved operations2
Access to low-cost
fuel
190
Value of TXU new build
1,265
6.3% 4.1% 2.0%4.4% 1.0% 17.8%
1 Based on $45/MWh long-term power.2 5% capacity factor improvement and $15/KW-year non-fuel operating cost improvement.

2.12.0
1.1 1.1
Slide 12: With Its Investment Program, TXU Will Be One Of Texas’ Largest Corporate Investors…
Capital Investment in Texas03-08E; $ billions per year
TXU06E-08E
Entire Texas refining industry
Entire Texas micro-electronics sector
Entire Texas basic chemicals industry
Source: US Department of Commerce (2003); Perryman Group

Slide 13: …Generating Economic Growth And New Jobs Across The State
1 Expressed in constant 2005 dollars.2 Total non-farm jobs for one year
Source: Perryman Group; Texas Multi-regional Impact Assessment System; US Department of Labor (2004)
Economic Impact from TXU Capital Investment1
01-10E; $ billions
Employment creation figures are comparable to the annual job base of Waco, Tyler and Abilene combined. 2
Employment creation figures are comparable to the annual job base of Waco, Tyler and Abilene combined. 2
Employment Created by Investment01-10E; Job-years of employment
290,30020.9
13.5
TXU capital invested
Texas gross state product increase
Employment generated

Operational Earnings Per ShareQ4 04 vs. Q4 05; $ per diluted share
Slide 14: TXU’s Earnings Improved Substantially…Reported Earnings Per ShareQ4 04 vs. Q4 05; $ per diluted share
Q4 05Q4 04
Q4 05Q4 04
Reported Earnings Per ShareYTD 04 vs. YTD 05; $ per diluted share
YTD 05YTD 04Operational Earnings Per ShareYTD 04 vs. YTD 05; $ per diluted share
YTD 05YTD 04
(0.64)
2.50
1.41
3.33
0.34
0.86
153%153% 136%136%
(1.16)
0.74

TXU Corp. Consolidated
153%153%
Operational Earnings Contribution by SegmentQ4 04 vs. Q4 05; YTD 04 vs. YTD 05; $ per diluted share
TXU Energy Holdings
TXU Electric Delivery
TXU Corp. Consolidated
TXU Energy Holdings
TXU Electric Delivery
190%190%
136%136%
152%152%
60%60%
Slide 15: …Reflecting Solid Performance By Core Businesses
0.34
0.86
Q4 04 Q4 05
1.41
3.33
YTD 04 YTD 05
0.10 0.10
Q4 04 Q4 05
0.30
0.87
Q4 04 Q4 05
0.450.72
YTD 04 YTD 05
1.17
2.95
YTD 04 YTD 05
0%0%

Slide 16: Summary Of TXU’s 05 Performance
0.12Q3 05 revision0.30Q1 05 revision
3.25-3.35Revised 05E outlook range
2.82-2.93$/share
05E initial guidance in Q4 04Component
3.3305 operational earnings including hedge ineffectiveness(0.03)Negative impact from hedge ineffectiveness in Q4 05
$/shareComponent

10-200-100-10Estimated net position
> 95> 95> 95Percentage hedged
(140)
(305)
46508E
(115)
(325)
45007E
(70)Forward power and gas sales
(365)Retail “short”position2
445Total “generation long” position
06E
Estimated Natural Gas Position06E-08E; Million MMBtu
Estimated Heat Rate Position06E-08E; Million MWh
~29~25~18Estimated net position
576274Percentage hedged
1
(39)
6708E
2
(43)
6607E
1Forward power and gas sales
(51)Retail “short”position2
68Total “generation long” position1
06E
Slide 17: TXU Has Significantly Reduced Its 3-Year Natural Gas Price Exposure…
TXU has mitigated over 95% of its estimated natural gas exposure from 06-08 while maintaining the majority of its long-term heat rate exposure. Since November 2005, TXU
has also reduced its 2009-2010 natural gas exposure by 50 million MMBtu each year.
TXU has mitigated over 95% of its estimated natural gas exposure from 06-08 while maintaining the majority of its long-term heat rate exposure. Since November 2005, TXU
has also reduced its 2009-2010 natural gas exposure by 50 million MMBtu each year.
1 Includes solid fuel and gas plants.2 Assumes retail position diminishes over time due to competitor activity; acts as a short position while net margin remains at or below sustainable range
of 5% to 10%.

Slide 18: …Significantly Reducing Potential Near-Term Cash Flow Volatility
(1,600)
(800)
-
06E-08E Pre-Hedge Exposure1
$ Millions
1,400(200)$5.00 decline each year from 06-08
700
-
Cash Flow Protection$ Millions
(100)
-
06E-08EPost-Hedge
Exposure1
$ Millions
$2.50 decline each year from 06-08
Baseline - Mean Case
Natural Gas Scenario - Probability
The natural gas hedges for 2006-2008 are likely to provide assurance of economic value of up to $1.5 billion in the event of unlikely downside gas price scenarios.
The natural gas hedges for 2006-2008 are likely to provide assurance of economic value of up to $1.5 billion in the event of unlikely downside gas price scenarios.
Economic Value Assurance from Natural Gas Hedges 06E – 08E; $/MMBtu and $ millions
1 Based on current estimated net open position relative to natural gas prices.

Forward Natural Gas Prices At 10/31/05 and 1/31/06Cal 06 - Cal 10; $/MMBtu
Slide 19: Concurrently, Forward Natural Gas Prices Have Risen Significantly Since Early November 2005…
Cal 06 Cal 07 Cal 08 Cal 09 Cal 10
At October 31, 2005
At January 31, 200611.00
10.239.65
8.497.64
7.05
10.289.64
9.028.44
1 January 31, 2006 value is 12 month strip.
1

Slide 20: …Improving TXU’s Long-Term Growth Outlook
7.00-7.3010E EPS6.2%06E-10E annual growth rate (percent CAGR)
+/- 0.65EPS change with +/-$1/MMBtu in 2010 natural gas1Natural gas sensitivity
0.25Electric Delivery growth
0.57Performance improvements
Capital allocation
Organic growth
Execution
Commodity
5.50-5.75 06E EPS
0.79Debt repurchases and share repurchases1.45Organic growth subtotal
3.9% - 8.6%
0.930.27
(1.30)
06E-10E
06E-10E growth rate with +/- $1/MMBtu in 2010 natural gas (%)
06E-10E commodity impacts and retail churn1
SandowOak Grove
Performance Driver
Over the past three months commodity price moves have increased the 5-year growth rate; at the same time, TXU has further reduced its 1-5 year natural gas price exposure.Over the past three months commodity price moves have increased the 5-year growth rate; at the same time, TXU has further reduced its 1-5 year natural gas price exposure.
TXU Consolidated EPS06E-10E; $ per share, percent
1 Based on forward natural gas prices as of January 31, 2006.

Q & ADiscussion

Appendix –Regulation G Reconciliations

Financial Definitions
Total debt less transition bonds and debt-related restricted cash dividend.Debt
Total debt less transition bonds and debt-related restricted cash divided by EBITDA. Transition, or securitization, bonds are serviced by a regulatory transition charge on wires rates and are therefore excluded from debt in credit reviews. Debt-related restricted cash is treated as net debt in credit reviews. Debt/EBITDA is a measure used by TXU to access credit quality.
Debt/EBITDA (non-GAAP)
Operating revenues (GAAP) less fuel and purchased power costs and delivery fees (GAAP).Contribution Margin
Cash provided by operating activities adjusted for unusual or nonrecurring items. Used by TXU predominantly as a forecasting tool to estimate cash available for capital expenditures, nuclear fuel, dividends, debt reduction and other investments.
Normalized Operating Cash Flow(non-GAAP)
Cash from operating activities, adjusted for unusual or nonrecurring items, less capital expenditures and nuclear fuel. Used by TXU predominantly as a forecasting tool to estimate cash available for dividends, debt reduction, and other investments.
Normalized Free Cash Flow (non-GAAP)
Shares of common stock outstanding multiplied by closing share price as of the balance sheet date. Measures the market value of a company’s equity at a point in time.
Market Capitalization (non-GAAP)
Total debt plus preference stock plus market capitalization less cash and restricted cash.Enterprise Value (non-GAAP)
EBITDA divided by cash interest expense is a measure used by TXU to assess credit quality.EBITDA/Interest (non-GAAP)
Income from continuing operations before interest income, interest expense and related charges, and income tax plus depreciation and amortization and special items. EBITDA is a measure used by TXU to assess performance.
EBITDA (non-GAAP)
Interest expense and related charges less amortization of discount and reacquired debt expense plus capitalized interest. Cash interest expense is a measure used by TXU to assess credit quality.
Cash Interest Expense(non-GAAP)
Capital expenditures.Cap ex
DefinitionMeasure

Financial Definitions – cont.
Per share (diluted) income from continuing operations net of preference stock dividends, excluding special items, the adjustment in 2005 for the cost of the true-up payment on the 52.5 million share accelerated common stock repurchase and the adjustment in 2004 for the dilution effect of the convertible senior notes, the majority of which were repurchased in the fourth quarter of 2004. TXU relies on operational earnings for evaluation of performance and believes that analysis of the business by external users is enhanced by visibility to both reported GAAP earnings and operational earnings.
Operational Earnings per Share (non-GAAP)
Income from continuing operations net of preference stock dividends, excluding special items, the adjustment in 2005 for the cost of the true-up payment on the 52.5 million share accelerated common stock repurchase and the adjustment in 2004 for the dilution effect of the convertible senior notes, the majority of which were repurchased in the fourth quarter of 2004. TXU relies on operational earnings for evaluation of performance and believes that analysis of the business by external users is enhanced by visibility to both reported GAAP earnings and operational earnings.
Operational Earnings (non-GAAP)
Per share (diluted) net income available to common shareholders.Reported Earnings per Share (GAAP)
Long-term debt (including current portion), plus bank loans and commercial paper, plus long-term debt held by subsidiary trusts, plus preferred securities of subsidiaries, including exchangeable preferred membership interests (EPMIs).
Total Debt (GAAP)
Operational earnings (non-GAAP) plus preference stock dividends plus after-tax interest expense and related charges, net of interest income on restricted cash related to debt, divided by the average of the beginning and ending total capitalization less debt-related restricted cash. This measure is used to evaluate operational performance and management effectiveness.
Return on Invested Capital (ROIC) - (non-GAAP)
Unusual charges related to the implementation of the performance improvement program and other charges, credits or gains, that are unusual or nonrecurring. Special items are included in reported GAAP earnings, but are excluded from operational earnings. Special items associated with the performance improvement program include debt extinguishment losses and costs related to severance programs, asset impairments and facility closures.
Special Items
DefinitionMeasure

Table 1: TXU Corp. Operational Earnings Reconciliation Quarter Ended December 31, 2005 and 2004 $ millions and $ per share after tax
--0.1050Extraordinary loss
(0.02)(10)0.028Cum. effect of change in accounting principles
0.02---Effect of share dilution
184
531
(6)
(341)
6
288
(625)
Q4 04
0.86
-
-
0.86
-
-
0.74
Q4 05
0.34414Operational earnings
0.97-Special items
(0.01)-Preference stock dividends
(0.64)414Income from continuing operations
0.01-Preference stock dividends
0.53-Discontinued operations
(1.16)356Net income available for common
Q4 04Q4 05

Table 2: TXU Corp. Operational Earnings Reconciliation Year-To-Date December 31, 2005, 2004 and 2003 $ millions and $ per share after tax
1.41
1.29
(0.04)
0.03
-
0.13
0.04
1.41
(0.02)
(0.03)
(0.63)
(0.64)
YTD 04
887
828
(22)
-
-
81
22
849
(10)
(16)
(378)
(386)
YTD 04
3.33
(0.31)
(0.02)
0.01
1.02
2.63
0.02
-
0.02
0.10
(0.01)
2.50
YTD 05
544
-
(22)
-
-
566
22
-
58
-
(74)
560
YTD 03
0.088Cum. effect of change in accounting principles
--Effect of share dilution/rounding
--Effect of ASR true-up
-50Extraordinary (gain) loss
--Buyback premium on EPMI
0.79
-
(0.03)
0.82
0.03
(0.10)
0.81
YTD 03
1,615Operational earnings
(150)Special items
(10)Preference stock dividends
1,775Income from continuing operations
10Preference stock dividends
(5)Discontinued operations
1,712Net income (loss) available for common
YTD 05

Table 3: TXU Energy Holdings Operational Earnings ReconciliationQuarter Ended December 31, 2005 and 2004 $ millions and $ per share after tax
(0.01)(4)0.028Cum. effect of change in accounting principles
0.0150.85413Net income available for common
0.30165--Special items
167
2
1
Q4 04
0.87
0.87
-
Q4 05
0.30423Operational earnings
-423Income from continuing operations
-2Discontinued operations
Q4 04Q4 05

Table 4: TXU Energy Holdings Operational Earnings ReconciliationYear-To-Date December 31, 2005 and 2004 $ millions and $ per share after tax
0.06340.028Discontinued operations
(0.04)---Effect of share dilution/rounding
747
339
408
(4)
378
YTD 04
2.95
0.01
2.94
0.02
2.90
YTD 05
1.171,436Operational earnings
0.536Special items
0.681,430Income from continuing operations
(0.01)8Cum. effect of change in accounting principles
0.631,414Net income available for common
YTD 04YTD 05

Table 5: TXU Electric Delivery Operational Earnings Reconciliation Quarter Ended December 31, 2005 and 2004 $ millions and $ per share after tax
0.0420--Special items
55
35
(2)
37
Q4 04
0.10
0.10
-
0.10
Q4 05
0.1049Operational earnings
0.0649Income from continuing operations
--Extraordinary gain
0.0649Net income available for common
Q4 04Q4 05
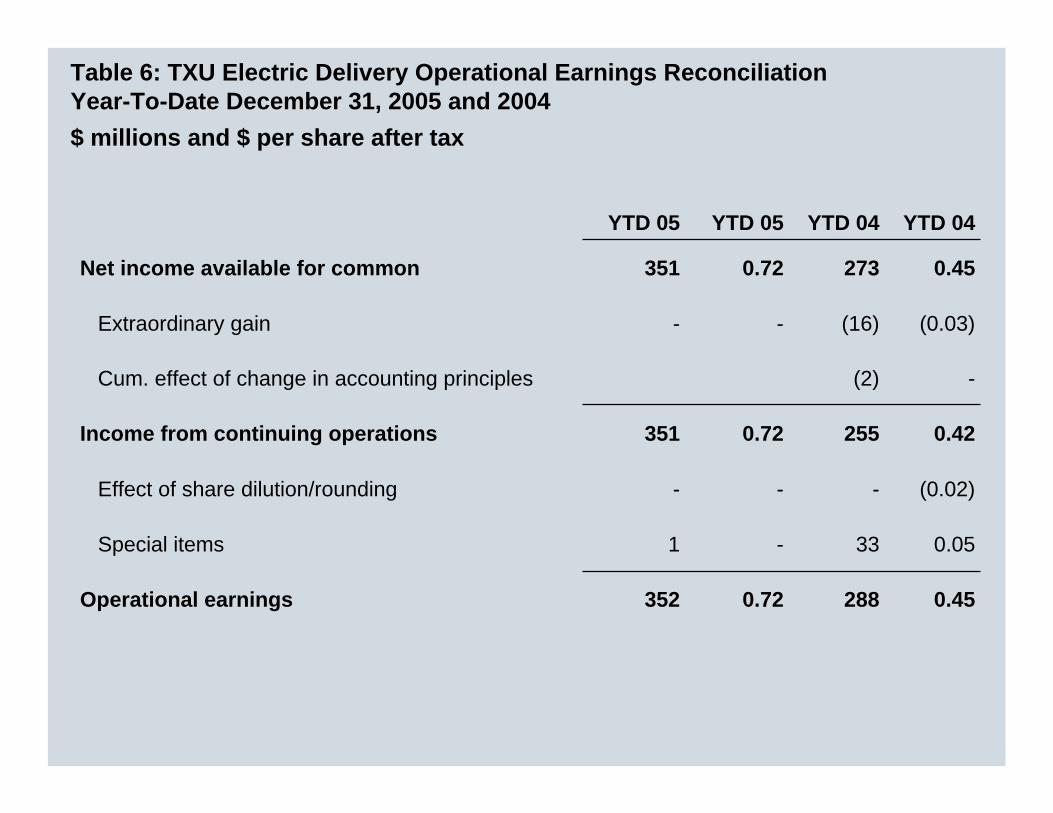
Table 6: TXU Electric Delivery Operational Earnings Reconciliation Year-To-Date December 31, 2005 and 2004 $ millions and $ per share after tax
(0.03)(16)--Extraordinary gain
-(2)Cum. effect of change in accounting principles
(0.02)---Effect of share dilution/rounding
0.0533-1Special items
288
255
273
YTD 04
0.72
0.72
0.72
YTD 05
0.45352Operational earnings
0.42351Income from continuing operations
0.45351Net income available for common
YTD 04YTD 05

Table 7: TXU Corp. Total Debt Years Ended December 31, 2005, 2004 and 2003$ millions
546--Long-term debt held by subsidiary trusts
12,889
38
12,412
229
-
210
12/31/04
39358Commercial paper
12,32411,332All other long-term debt, less due currently
58440Notes payable
759-Preferred securities of subs
14,403
677
12/31/031
13,380Total debt
1,250Long-term debt due currently
Debt
12/31/05
1 03 includes TXU Gas and TXU Australia.

Table 8: TXU Corp. Interest and Debt Coverage RatiosTwelve Months Ended December 31, 2005, 2004 and 2003$ millions unless otherwise noted
7.3
3.6
4.2
4.0
11,631
-
(1,258)
12,889
680
12
(27)
695
2,740
1,190
1,550
760
(28)
695
42
81
(1,677)
1,758
12/31/04
314632Income tax expense
A2,7982,793Cash provided by operating activities
B(2,061)(1,018)Reconciling adjustments from cash flow statement
886776Depreciation and amortization
5.1
4.0
4.7
3.0
13,378
(525)
(500)
14,403
948
12
(39)
975
2,868
-
2,868
(44)
975
737
12/31/031
4.8
4.5
3.1
4.9
12,213
-
(1,167)
13,380
801
17
(18)
802
3,919
(18)
3,937
(48)
802
1,775
12/31/05
EBITDA/interest – ratio (C/D)
Debt/EBITDA – ratio (F/C)
Cash provided by operating activities + cash interest expense/cash interest expense–ratio (A+D/D)
Total debt/cash flow from operating activities – ratio (E/A)
ETotal debt
Interest expense and related charges
FTotal debt less transition bonds and debt-related restricted cash
Debt-related restricted cash
EBITDA
Transition bonds
DCash interest expense
Capitalized interest
Amortization of discount and reacquired debt expense
CEBITDA (excluding special items)
Special Items
Interest income
Interest expense and related charges
Income from continuing operations before taxes and extraordinary items
Ref
1 03 includes TXU Gas and TXU Australia.

Table 9: TXU Corp. Normalized Operating Cash Flow, Normalized Free Cash Flow and Normalized Free Cash Flow Yield Twelve Months Ended December 31, 2005, 2004 and 2003 $ millions, unless otherwise noted
486Avg. diluted shares outstanding (millions)
8601,0431,798Normalized free cash flow (FCF)
$3.70
(57)
(1,047)
2,902
-
-
109
2,793
YTD 05
(44)
(956)
1,860
(337)
(601)
-
2,798
YTD 031
Normalized FCF per share ($/share)
(87)Nuclear fuel
(912)Capital expenditures
2,042Normalized operating cash flow
-2002 collections in 2003
-2003 tax refund
284Special items
1,758Reported cash provided by operating activities
YTD 04
1 03 includes TXU Gas and TXU Australia.

Table 10: TXU Corp. Return On Average Invested Capital CalculationTwelve Months Ended December 31, 2005 and 2003 $millions unless otherwise noted
B1,3952,115Total return (based on operational earnings)
931754Net
(44)(48)Interest income
326264Tax at 35%
605490Net of tax
975802Interest expense
7681,615Operational earnings
6.8
5.7
20,496
605
22
1,165605
560
031
15.4
16.2
13,692
490
10
2,212490
1,722
05
2 After-tax interest expense and related charges net of interest income
Return on average invested capital – based on operational earnings (B/C) (%)1 03 includes TXU Gas and TXU Australia.
Return on average invested capital – based on net income (A/C) (%)
CAverage total capitalization
After-tax interest expense and related charges net of interest income2
Preference stock dividends
ATotal return (based on net income)After-tax interest expense and related charges net of interest income2
Net income (loss)
Ref

2003Debt
Notes payable - Long-term debt due currently 678 Long-term debt held by subsidiary trusts 546 Other long-term debt less due current 10,608 Transition bonds (500) Preferred securities of subsidiaries 759
Total debt less transition bonds 12,091 Preference stock 300 Total debt and preference stock 12,391 Market capitalization
Shares outstanding 648 Price per share 11.86
Total market capitalization 7,685
Cash and restricted cash (1,423)
Enterprise Value 18,653
Table 11: TXU Corp. Enterprise Value Twelve Months Ended December 31, 2003 $ millions, unless otherwise noted