energy future holindings _111704
60
EEI Conference C. John Wilder Chief Executive Officer October 26, 2004
Transcript of energy future holindings _111704

EEI Conference
C. John WilderChief Executive Officer
October 26, 2004

1
This presentation contains forward-looking statements, which are subject to various risks and uncertainties. Discussion of risks and uncertainties that could cause actual results to differ materially from management's current projections, forecasts, estimates and expectations is contained in the company's SEC filings. In addition to the risks and uncertainties set forth in the company's SEC filings, the forward-looking statements in this presentation could be affected by the ability of the company to implement the initiatives that are part of its restructuring, operational improvement and cost reduction program, and the terms under which the company executes those initiatives, the ability of the company to execute the financing necessary to finance its share repurchase plan and the actions of its board of directors with respect to future dividends and other cash distributions to shareholders, which will be based upon a number of factors, including the Company’s profit levels, operating cash flow levels and capital requirements as well as financial and other business conditions existing at the time.
Regulation GThis presentation includes certain non-GAAP financial measures. A reconciliation of these measures to the most directly comparable GAAP measure is included in the appendix of the printed version of the slides and the version included on the company’s website at www.txucorp.com under Investor Resources/Presentations.
Safe Harbor Statement & Regulation G
2
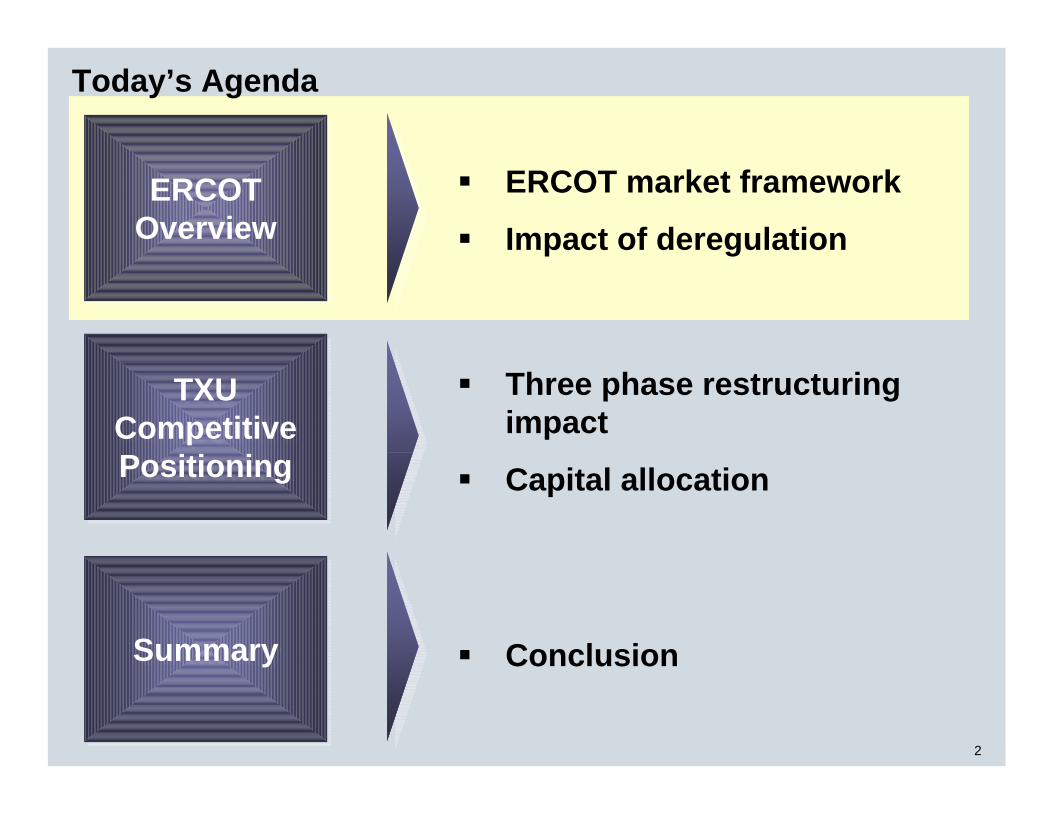
Today’s Agenda
SummarySummary Conclusion
ERCOTOverviewERCOT
OverviewERCOT market framework
Impact of deregulation
TXUCompetitivePositioning
TXUCompetitivePositioning
Three phase restructuring impact
Capital allocation
3
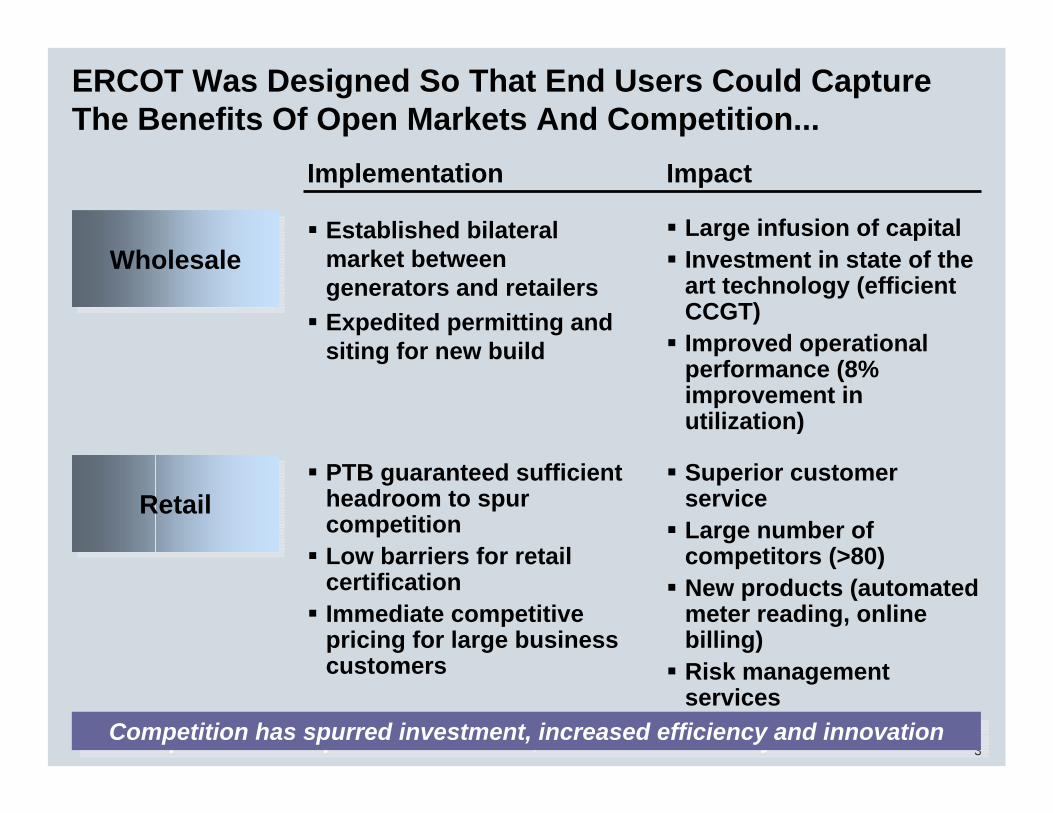
ERCOT Was Designed So That End Users Could Capture The Benefits Of Open Markets And Competition...
Established bilateral market between generators and retailersExpedited permitting and siting for new build
WholesaleWholesale
RetailRetail
Large infusion of capitalInvestment in state of the art technology (efficient CCGT)Improved operational performance (8% improvement in utilization)
PTB guaranteed sufficient headroom to spur competitionLow barriers for retail certificationImmediate competitive pricing for large business customers
Superior customer serviceLarge number of competitors (>80)New products (automated meter reading, online billing)Risk management services
Competition has spurred investment, increased efficiency and innovationCompetition has spurred investment, increased efficiency and innovation
Implementation Impact

4
…Similar To Those Seen In Other Deregulated Markets
240
100
84 04405060708090
100110120
79 81 83 85 87 89 91 93
58%58%
Smaller work force:British Telecom employees84-04; Thousands
Efficiency gains... Price decreases... ...And innovation
Airline retail price compression:Real yield index (1979=100) 79-94; No units
A competitive market ruthlessly forces competitors to improve A competitive market ruthlessly forces competitors to improve
Pre-deregulation
Today
Source: British telecom, O&D survey
Access to over 300 channels (from 30)
HDTV technology
DSL (Internet broadband)
Pay-per-View
Digital Video Recorder
Parental controls
New cable services96-04; No units
45%45%
5
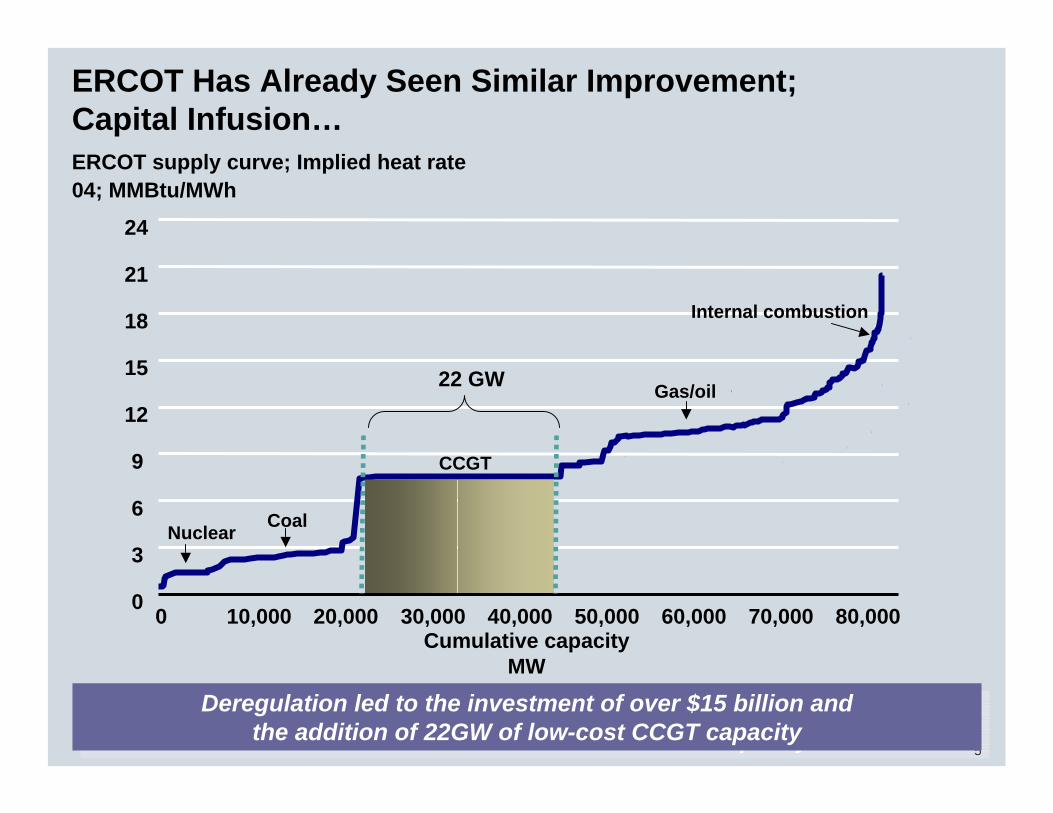
ERCOT supply curve; Implied heat rate04; MMBtu/MWh
ERCOT Has Already Seen Similar Improvement;Capital Infusion…
Deregulation led to the investment of over $15 billion andthe addition of 22GW of low-cost CCGT capacity
Deregulation led to the investment of over $15 billion andthe addition of 22GW of low-cost CCGT capacity
0
3
6
9
12
15
18
21
24
0 10,000 20,000 30,000 40,000 50,000 60,000 70,000 80,000Cumulative capacity
MW
22 GW
Internal combustion
Nuclear Coal
CCGT
Gas/oil
6
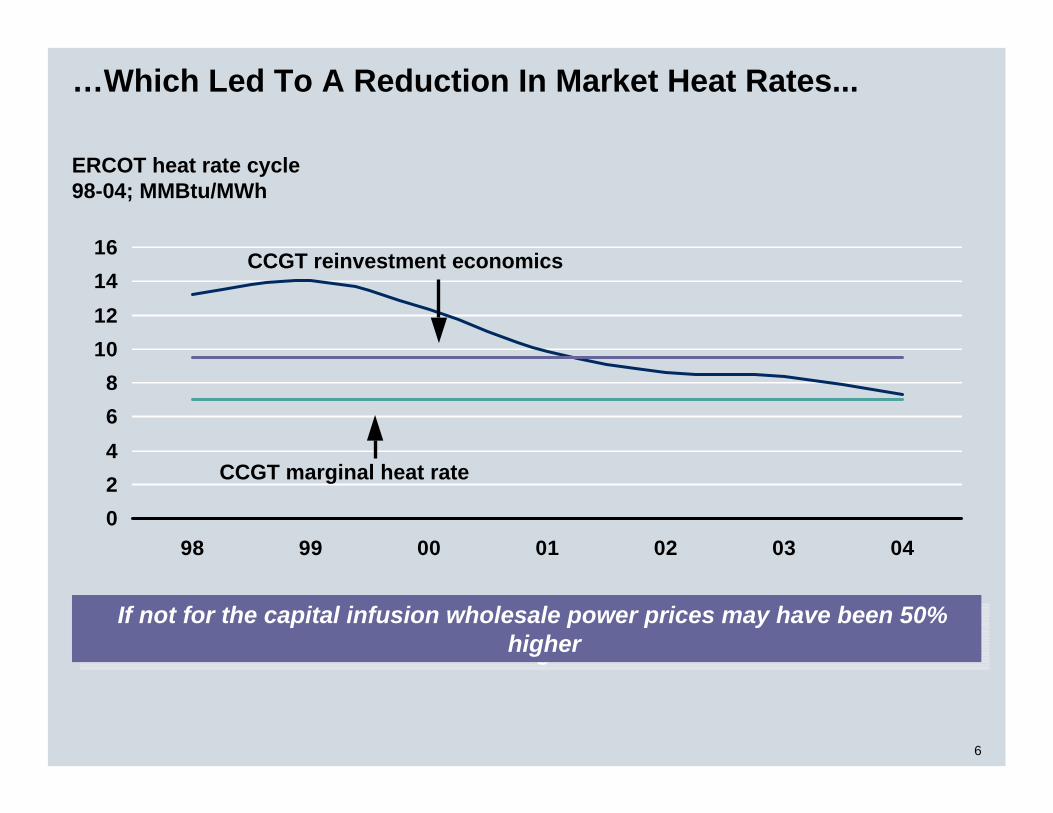
…Which Led To A Reduction In Market Heat Rates...
ERCOT heat rate cycle98-04; MMBtu/MWh
02468
10121416
98 99 00 01 02 03 04
CCGT marginal heat rate
CCGT reinvestment economics
If not for the capital infusion wholesale power prices may have been 50% higher
If not for the capital infusion wholesale power prices may have been 50% higher

7
…Strong Retail Competition…
Source: KEMA
ERCOT has the most active de-regulated retail market in the USERCOT has the most active de-regulated retail market in the US
11223
67
10
1920
TX OH DC NY PA MD MA CT ME CA
Residential customer switching04 YTD; Percent

8
…Giving End Use Customers Access To Lower Prices
02E-04E
Competitive residential price1 vs. regulated rate 02-04; Percent savings
Competitive large business price vs. regulated rate 02-04; Percent savings
Customers have benefited from access to lower electricity prices than they would have experienced under a regulated rate regime
Customers have benefited from access to lower electricity prices than they would have experienced under a regulated rate regime
1 Competitive Residential price based on 15% discount to TXU PTB as currently offered by market competitors, e.g., Utility Choice (14.6%), Cirro (14.6%) and Gexa (16.6%); Regulated world assumes 7.8 GW (versus 22GW actually built) added capacity in the rate base at a cost of $600/kw, O&M costs approximately $20/kw-yr resulting in an average cost of $93/kw-yr average cost in the rate base
2 Based on 04 with the following assumptions: Competitive prices assume $4.07/MMBtu Henry Hub gas price, 24X7 heat rate of 7.3 MWh/MMBtu, and incumbent residential gross margins of 30% and LC&I gross margins of 5%
202E-04E
14%19%

9
Overall The Market Is Considered A Success
Continuing need for the PUC
ERCOT governance
Funding for independent market oversight
Administrative penalties for market rule violations
Taxes
Education
Healthcare
Criminal justice
Insurance reform
Issues facing the Sunset Commission Top issues facing Texas voters
There appears to be little impetus to make major changes to the ERCOT framework
There appears to be little impetus to make major changes to the ERCOT framework
Source: Sunset Commission, Texas House of Representatives

10
Today’s Agenda
SummarySummary Conclusion
ERCOTOverviewERCOT
OverviewERCOT market framework
Impact of deregulation
TXUCompetitivePositioning
TXUCompetitivePositioning
Three phase restructuring impact
Capital allocation

11
To Compete In The Deregulated World TXU Is Focused On Three Core Businesses
Assets Operational earnings
$1.4 $1.8
OCF
$23.3
44% 64% 70%
Size and shape of TXU’s businesses05E; $ billions and percent
6th largest US transmission and distribution companyHigh growth market (2.5% per year)Lowest wires cost in Texas
2nd largest deregulated generation outputLow cost baseload capacity and highly flexible gas fleetRobust wholesale market and tightening reserve margins
Largest competitive electricity retailerHigh growth market (2.5% per year)Distinctive brand recognition and reputation for reliability
TXU Power
TXU Electric Delivery
TXU Energy
Structural advantages
16%
16% 4%
40%20%
26%

12
Sold TXU Australia, TXU Gas,and TXU FuelDeployed proceeds to repair balance sheetStrengthened contribution marginsImplemented customer service improvements
Execute no-regrets transactionsImprove financial flexibilityCapture “quick-hit” profitability improvements Assess key risks and implement mitigation plans
How We Did It/How We Are Doing ItWhat We Needed To Do
We Are Executing A Three Phase Improvement Program
Phase 1:Rationalize, Restructure & Restore Financial Strength
Phase 2: Strengthen the Core & Drive Performance Improvement
Phase 3: Allocate Capitaland Grow

13
In Phase One We Divested Non-Core Businesses, Deploying Proceeds To Improve Financial Flexibility
Phase 1: Sources of cash04E; $ billions
Gas
Australia
TUFCO
Cash from Ops
Cash BalancesSecuritization
3.6
1.9
0.51.2
0.81.0
14.2
Phase 1: Uses of cash04E; $ billions
Debt repurchase3
Equity repurchase
Investments
7.63
5.12
0.914.2
Dividend 0.3
1 Includes $1.8B debt assumed by acquirers2 Includes $1.1B equity portion of Exchangeable Preferred Membership Interest repurchase3 Includes retirements premiums of $0.5 billion
0.5
4.7
Communications
Borrowings
0.3Disc Ops & Other
14
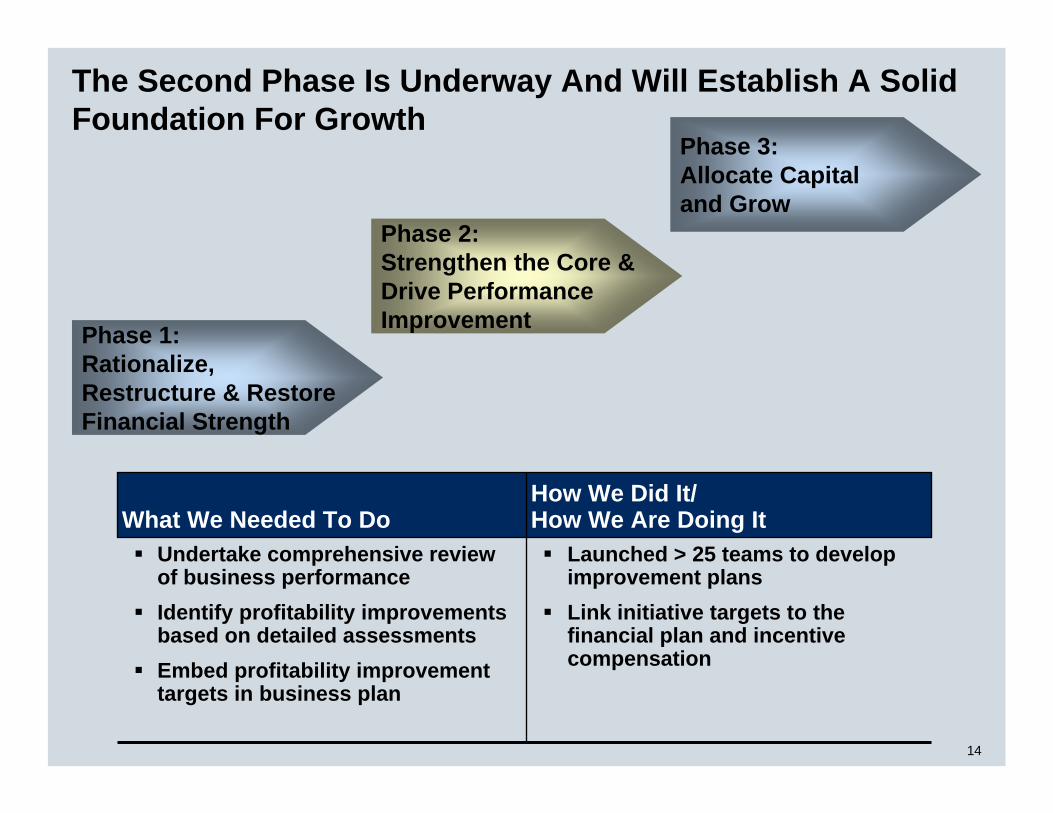
Launched > 25 teams to develop improvement plansLink initiative targets to the financial plan and incentive compensation
Undertake comprehensive review of business performance Identify profitability improvements based on detailed assessmentsEmbed profitability improvement targets in business plan
How We Did It/How We Are Doing ItWhat We Needed To Do
The Second Phase Is Underway And Will Establish A Solid Foundation For Growth
Phase 1:Rationalize, Restructure & Restore Financial Strength
Phase 2: Strengthen the Core & Drive Performance Improvement
Phase 3: Allocate Capitaland Grow

15
Looking At Other Deregulated Industries We Have Observed Five Critical Performance Levers For the Winners
Performance Management• High performance culture• Balanced cascading scorecards• Incentives linked to key value drivers
Operational Excellence
• Top decilereliability
• Capacity factors
Cost Leadership
• World class industrial production costs
• Lean SG&A
Market Leadership
• Superior customer service/brand management
• Value based pricing
Commercial Excellence
• Asset optimization
• Commodity risk management
1
5
42 3

16
We Leveraged These Performance Levers To Design Improvement Programs For Each Business
TXU Power
TXU Electric Delivery
TXU Energy
• TXU operating system(lean)
• Strategic sourcing• Technological
innovation
• Customer experience
• Customer segmentation
• TXU operating system (lean)
• Strategic sourcing
Implementation
• Achieve industry leading safety performance
• Top decile reliability• Top decile cost performance• Earn allowable return
• Excellent customer service• Retain and grow profitable
customer base• Top decile purchased power
performance
• Top decile cost performance• Top decile production
performance
Objectives
• Operational excellence
• Cost leadership
• Market leadership• Commercial
excellence
• Cost leadership• Operational
excellence
Strategy

17
TXU Power Is Focused On Cost Leadership And Operational Excellence
• Market price impacts(95)130505Market effects
60-80
152
150
-07E
• Improved capacity factor
• Plant outage avoidance
• Strategic sourcing• Operating system• Benefit expense
reduction
Examples of Initiatives
11570Cost Leadership
310-340520-550Improvement Plan Total
(40)1
-05E
80Operational excellence
-Commercial Excellence
06EPerformance Lever
EBIT improvement vs 04E05-07; $ millions
1 Impacts from Dual Outage2 Impact of nuclear steam generator replacement

18
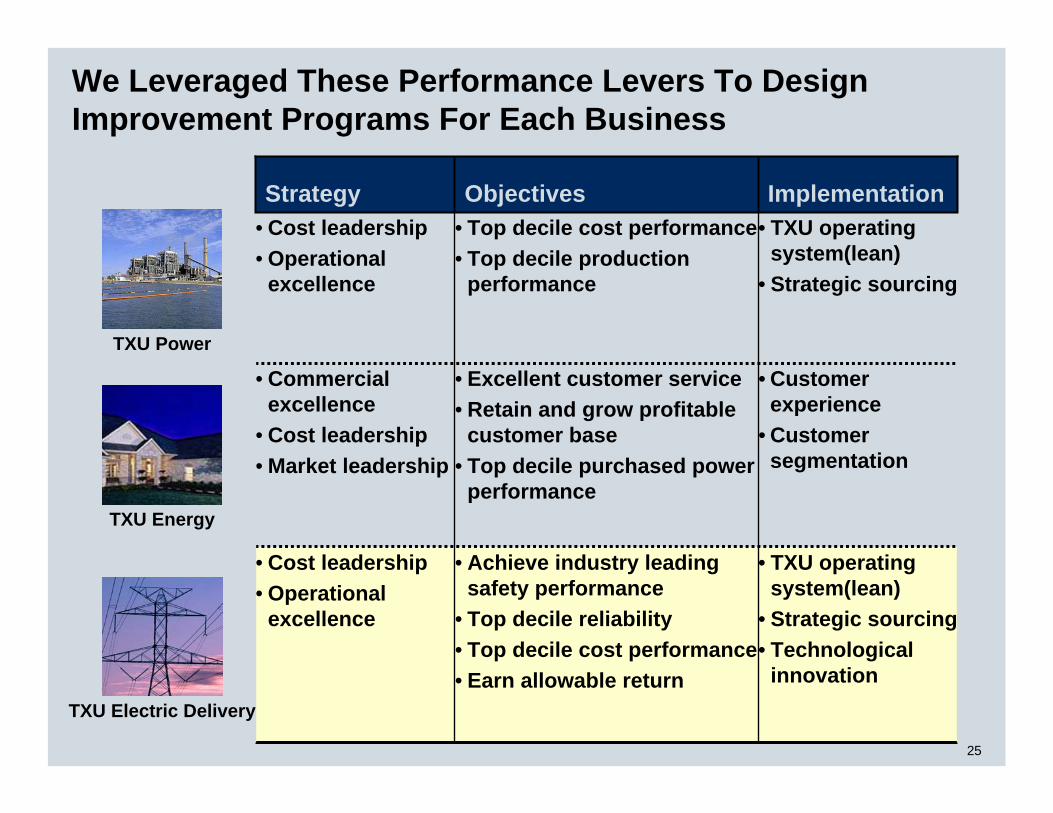
We Leveraged These Performance Levers To Design Improvement Programs For Each Business
• TXU operating system(lean)
• Strategic sourcing• Technological
innovation
• Customer experience
• Customer segmentation
• TXU operating system(lean)
• Strategic sourcing
Implementation
• Achieve industry leading safety performance
• Top decile reliability• Top decile cost performance• Earn allowable return
• Excellent customer service• Retain and grow profitable
customer base• Top decile purchased power
performance
• Top decile cost performance• Top decile production
performance
Objectives
• Cost leadership• Operational
excellence
• Commercial excellence
• Cost leadership• Market leadership
• Cost leadership• Operational
excellence
Strategy
TXU Power
TXU Electric Delivery
TXU Energy
19
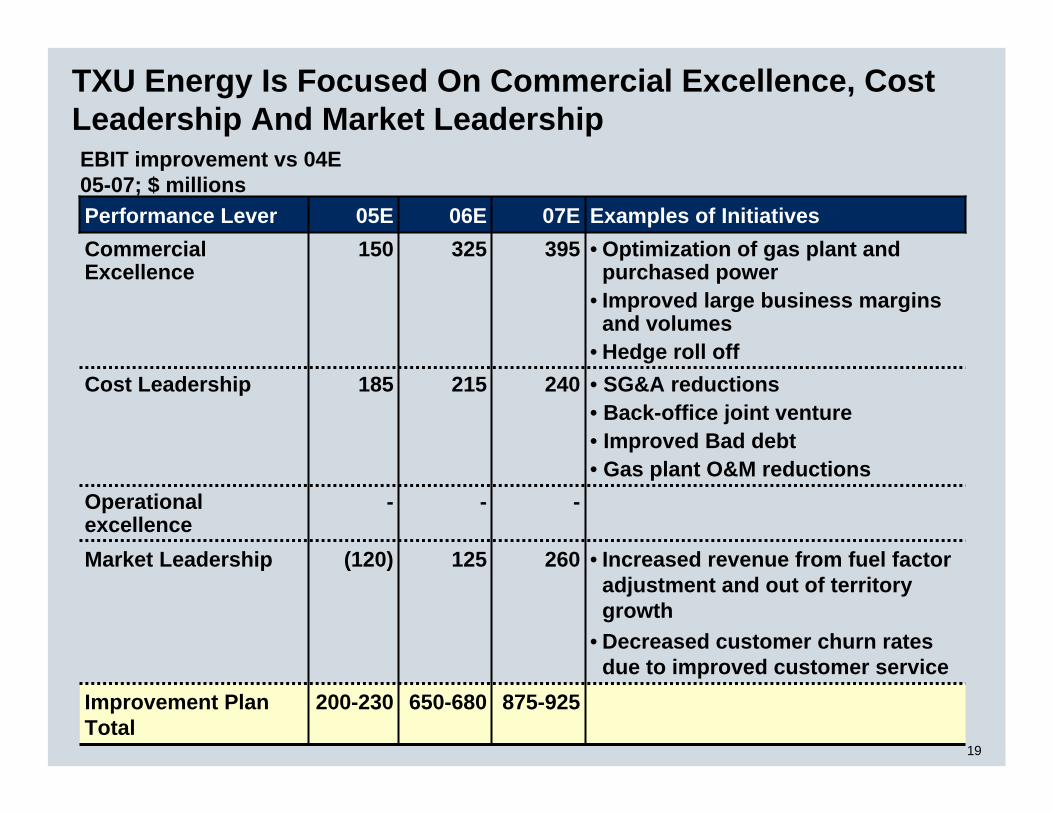
EBIT improvement vs 04E05-07; $ millions
TXU Energy Is Focused On Commercial Excellence, Cost Leadership And Market Leadership
• Increased revenue from fuel factor adjustment and out of territory growth
• Decreased customer churn rates due to improved customer service
260125(120)Market Leadership
875-925
-
240
39507E
• SG&A reductions• Back-office joint venture• Improved Bad debt• Gas plant O&M reductions
• Optimization of gas plant and purchased power
• Improved large business margins and volumes
• Hedge roll off
Examples of Initiatives
215185Cost Leadership
650-680200-230Improvement Plan Total
-
15005E
-Operational excellence
325Commercial Excellence
06EPerformance Lever

20
Similar To Other Commodities Electricity Is Volatile…
Commodity prices94-04; No units (normalized to 1 Jan 04)
0%
100%
200%
300%
400%
500%
600%
Standard deviation
Cotton 26%
Pork bellies 28%
Crude oil 43%
Natural gas 49%
Jan 94 Sept 04
Power prices are less volatile than both crude oil and natural gasPower prices are less volatile than both crude oil and natural gas
ERCOT power 29%

21
…But Unlike Other Commodities, Its Cost Is Not Directly Passed Through To The Consumer…
1 Assumes all future prices are equal to forward curve as of October 22, 2004
5.00
5.50
6.00
6.50
7.00
7.50
8.00
Jan-04 Apr-04 Jul-04 Oct-04 Jan-05
Historical Gas Prices vs. Forward Curve04-05; $/MMBtu
Current fuel factor adjustment threshold(+5%) = $6.85Current fuel factor adjustment = $ 6.52
Daily NYMEX gas prices
20 day rolling average of 12 month forward curve1
Based on the PTB framework, retail price can only be adjusted after large shifts in the forward gas curve
Based on the PTB framework, retail price can only be adjusted after large shifts in the forward gas curve

22
…Making Retail Economics Unsustainable Without Further Price Adjustments
(5)
10TXUNorth Texas residential gross margin05E; $/MMBtu
Attacker1
TXU
Attacker
North Texas residentialnet margin2
05E; $/MMBtu
1 Includes acquisition costs of $150/MWh amortized over 24 months2 Includes impact of SG&A, bad debt, income taxes and revenue taxes; Attacker economics based on 10% discount from PTB, SG&A of $2.5/MWh,
bad debt equals 1.3% of revenues, income taxes at 35% rate, revenue taxes equals 1.8% of revenues; forward curve as of October 21, 2004
Cal 05 gas, $/MMBtuPTB Strike, $/MMBtu
7.636.52
7.636.92
7.637.63
No fuel factor adjustment
Modeled fuel factor adjustment in current plan
Potential fuel factor adjustment
(2)
13 19
3
(7)
3
(5)
4
(2)
7
ESTIMATES
23
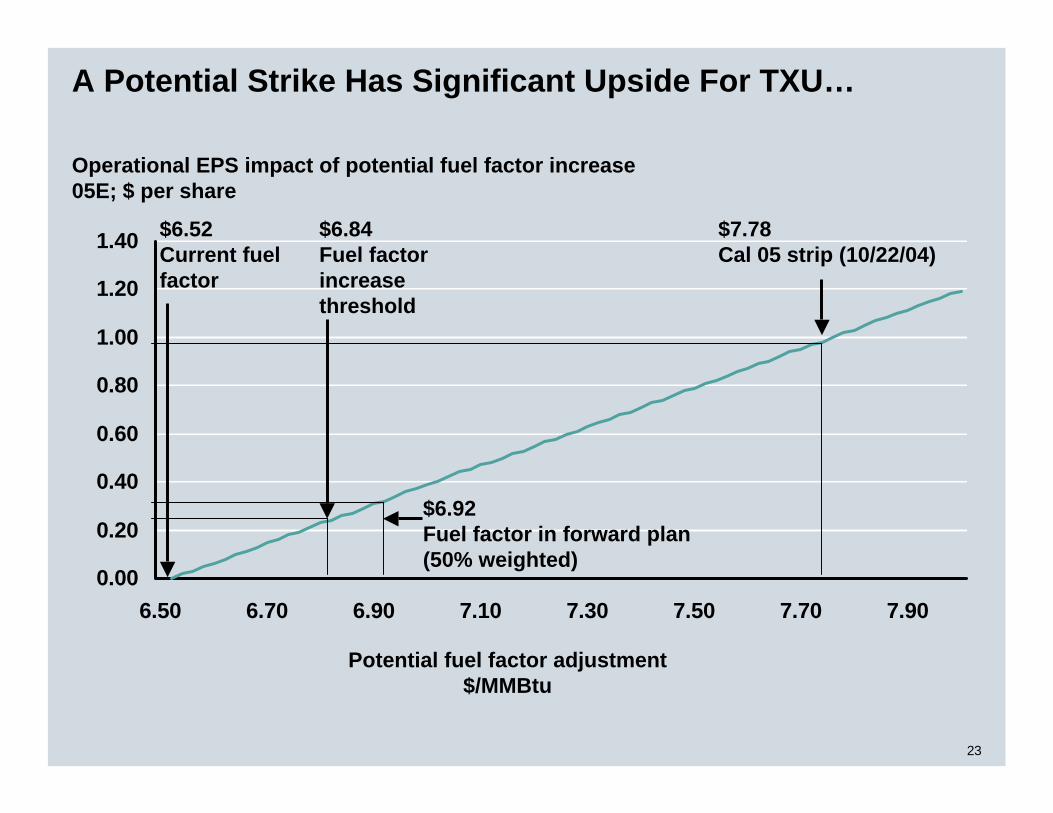
A Potential Strike Has Significant Upside For TXU…
0.00
0.20
0.40
0.60
0.80
1.00
1.20
1.40
6.50 6.70 6.90 7.10 7.30 7.50 7.70 7.90
Operational EPS impact of potential fuel factor increase05E; $ per share
Potential fuel factor adjustment$/MMBtu
$6.52Current fuel factor
$6.84Fuel factor increase threshold
$7.78Cal 05 strip (10/22/04)
$6.92Fuel factor in forward plan (50% weighted)

24
6.25 6.45 6.65 6.85 7.05 7.25 7.45 7.65 7.85 8.05 8.25 8.45 8.65
…And Based On Historical Trends Is Likely To Occur
Frequency distribution of potential 05 gas prices1
05E; $/MMBtu
1 Curve based on volatility of forward curve from Nov 1 to Dec 31 of entire year from 90-03
Based on historical price movements there is less than 0.5% chancethat TXU would not be eligible for a fuel factor adjustment in 05
Based on historical price movements there is less than 0.5% chancethat TXU would not be eligible for a fuel factor adjustment in 05
$6.84Fuel factor increase threshold(<.5%)
$6.92 Fuel factor in model(<1.5%)
Gas price$/MMBtu
25
We Leveraged These Performance Levers To Design Improvement Programs For Each Business
• TXU operating system(lean)
• Strategic sourcing• Technological
innovation
• Customer experience
• Customer segmentation
• TXU operating system(lean)
• Strategic sourcing
Implementation
• Achieve industry leading safety performance
• Top decile reliability• Top decile cost performance• Earn allowable return
• Excellent customer service• Retain and grow profitable
customer base• Top decile purchased power
performance
• Top decile cost performance• Top decile production
performance
Objectives
• Cost leadership• Operational
excellence
• Commercial excellence
• Cost leadership• Market leadership
• Cost leadership• Operational
excellence
Strategy
TXU Power
TXU Electric Delivery
TXU Energy
26
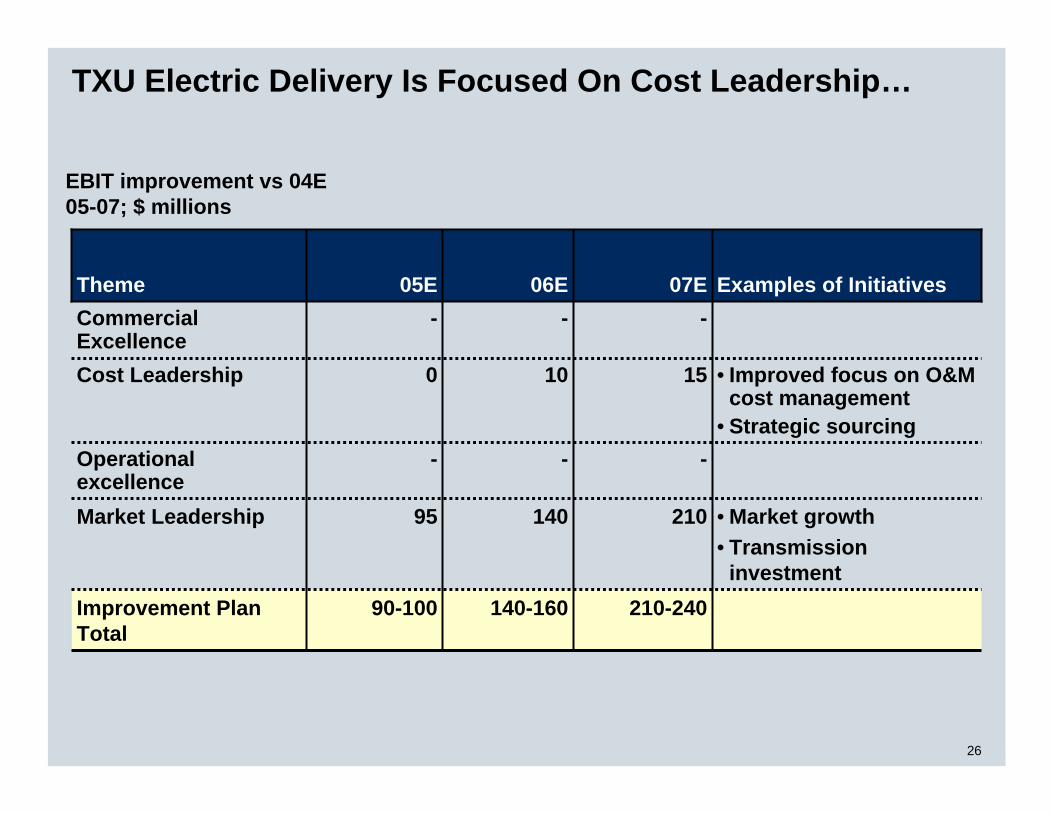
EBIT improvement vs 04E05-07; $ millions
TXU Electric Delivery Is Focused On Cost Leadership…
• Market growth• Transmission
investment
21014095Market Leadership
210-240
-
15
-07E
• Improved focus on O&M cost management
• Strategic sourcing
Examples of Initiatives
100Cost Leadership
140-16090-100Improvement Plan Total
-
-05E
-Operational excellence
-Commercial Excellence
06ETheme

27
These Improvement Programs For Each Business Will Drive Overall Performance For TXU
• TXU operating system (lean)
• Strategic sourcing
• Technological innovation
• Customer experience
• Customer segmentation
• TXU operating system (lean)
• Strategic sourcing
Implementation
• Achieve leading safety performance
• Top decile reliability• Top decile cost
performance• Earn allowable
return
• Excellent customer service
• Retain and grow profitable customer base
• Top decilepurchased power performance
• Top decile cost performance
• Top decileproduction performance
Objectives
• Cost leadership
• Operational excellence
• Commercial excellence
• Cost leadership
• Market leadership
• Cost leadership
• Operational excellence
Strategy
TXU Power
TXU Electric Delivery
TXU Energy

28
EBIT improvement vs 04E05-07; $ millions
TXU Is Driving Performance Improvement Across All Four Performance Levers…
• Increased revenue from PTB strikes and out of territory price increases
• Decreased customer churn rates due to improved customer service
380400485Market Leadership
1,240-1,300
15
480
39507E
• Improved capacity factor• Plant outage avoidance
• SG&A reductions• CG Energy joint venture• Improved focus on O&M cost
management
• Optimization of gas plant and purchased power
• Improved large business margins and volumes
Examples of Initiatives
410285Cost Leadership
1,180-1,250850-910Improvement Plan Total
(40)
15005E
80Operational excellence
325Commercial Excellence
06ETheme
The “$600 million over 5 years” 1 is now “$750 million over 3 years”The “$600 million over 5 years” 1 is now “$750 million over 3 years”1 Improvement program discussed at Lehman Brothers and Merrill Lynch Power Conferences
29
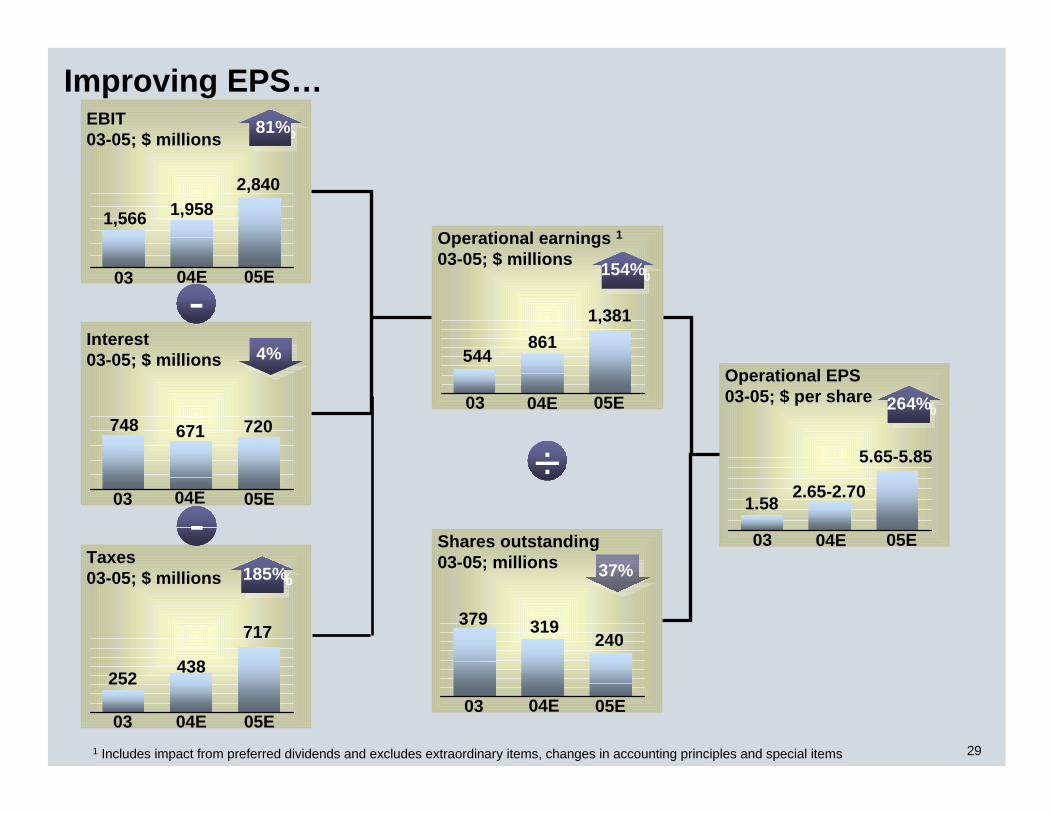
05E03
438
717
185%185%Taxes03-05; $ millions
-
04E
252
Improving EPS…
Operational earnings 103-05; $ millions
05E03
544
1,381
154%154%
861
04E
Shares outstanding03-05; millions
05E03
379 319
÷
37%
04E
240
Interest03-05; $ millions
05E03
748 720
-
04E
671
4%Operational EPS03-05; $ per share
05E03
1.58
5.65-5.85
264%264%
04E
2.65-2.70
1 Includes impact from preferred dividends and excludes extraordinary items, changes in accounting principles and special items
EBIT03-05; $ millions
05E
81%81%
1,9582,840
04E
1,566
03
30
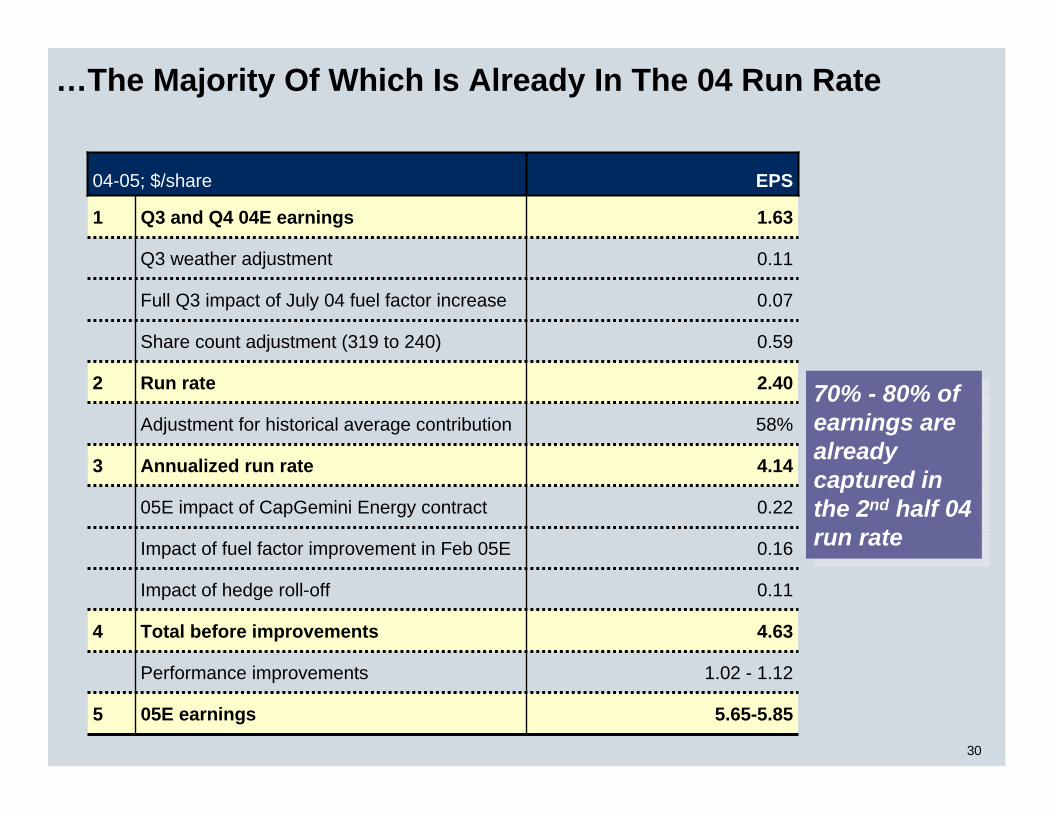
…The Majority Of Which Is Already In The 04 Run Rate
5
4
3
2
1
4.14Annualized run rate
0.16Impact of fuel factor improvement in Feb 05E
0.11Impact of hedge roll-off
4.63Total before improvements
EPS04-05; $/share
58%Adjustment for historical average contribution
2.40Run rate
0.2205E impact of CapGemini Energy contract
1.63Q3 and Q4 04E earnings
0.59Share count adjustment (319 to 240)
5.65-5.85
1.02 - 1.12
0.07
0.11
05E earnings
Performance improvements
Full Q3 impact of July 04 fuel factor increase
Q3 weather adjustment
70% - 80% of earnings are already captured in the 2nd half 04 run rate
70% - 80% of earnings are already captured in the 2nd half 04 run rate

31
TXU’s Financial Profile Is Significantly Improved…
Total debt1
03-05; $ Billions
Operational EPS03-05; $ Per Share
Free cash flow1
03-05; $ MillionsROIC1
03-05; Percent
EBITDA/Interest1
03-05; RatioTotal debt/EBITDA1
03-05; Percent
3.0
4.84.1
5.3
3.24.3
12.1 11.611.6
60%60%4%4%
5.0
10.2176%176%836
1,600
90
04E 05E03
1.58
5.65-5.85
2.65-2.70 264%264%
04E 05E03 04E 05E03
04E 05E03 04E 05E03 04E 05E03
13.8
40%40%
1 Adjusted for unusual tax of approximately $600 million in 03 (one time refund associated with Europe) and estimated one time tax expense of up to $500-$600 million in 05 (associated with portfolio restructuring transactions)
91%91%
32
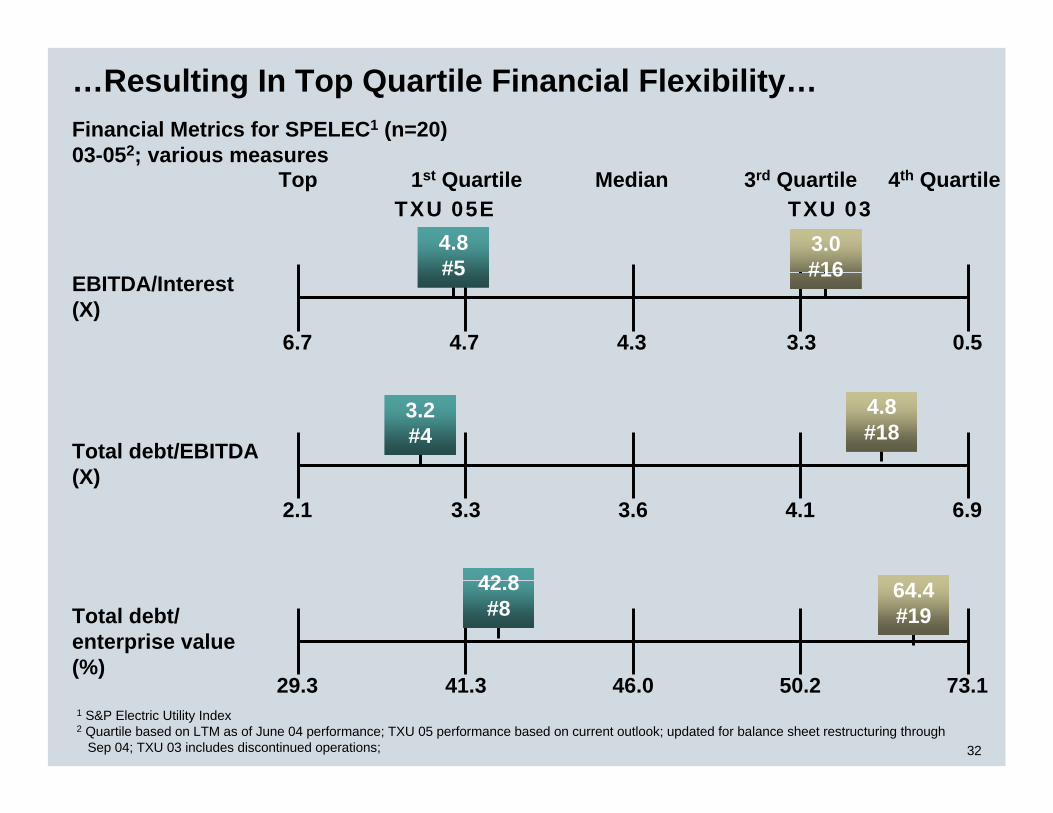
…Resulting In Top Quartile Financial Flexibility…Financial Metrics for SPELEC1 (n=20)03-052; various measures
Top 1st Quartile Median 3rd Quartile
Total debt/EBITDA(X)
2.1 3.3 3.6 4.1 6.9
Total debt/ enterprise value(%)
29.3 41.3 46.0 50.2 73.1
EBITDA/Interest(X)
4.7 4.3 3.3 0.56.7
4.8#5
3.2#4
1 S&P Electric Utility Index2 Quartile based on LTM as of June 04 performance; TXU 05 performance based on current outlook; updated for balance sheet restructuring through
Sep 04; TXU 03 includes discontinued operations;
TXU 05E4th Quartile
3.0#16
TXU 03
64.4#19
4.8#18
42.8#8
33
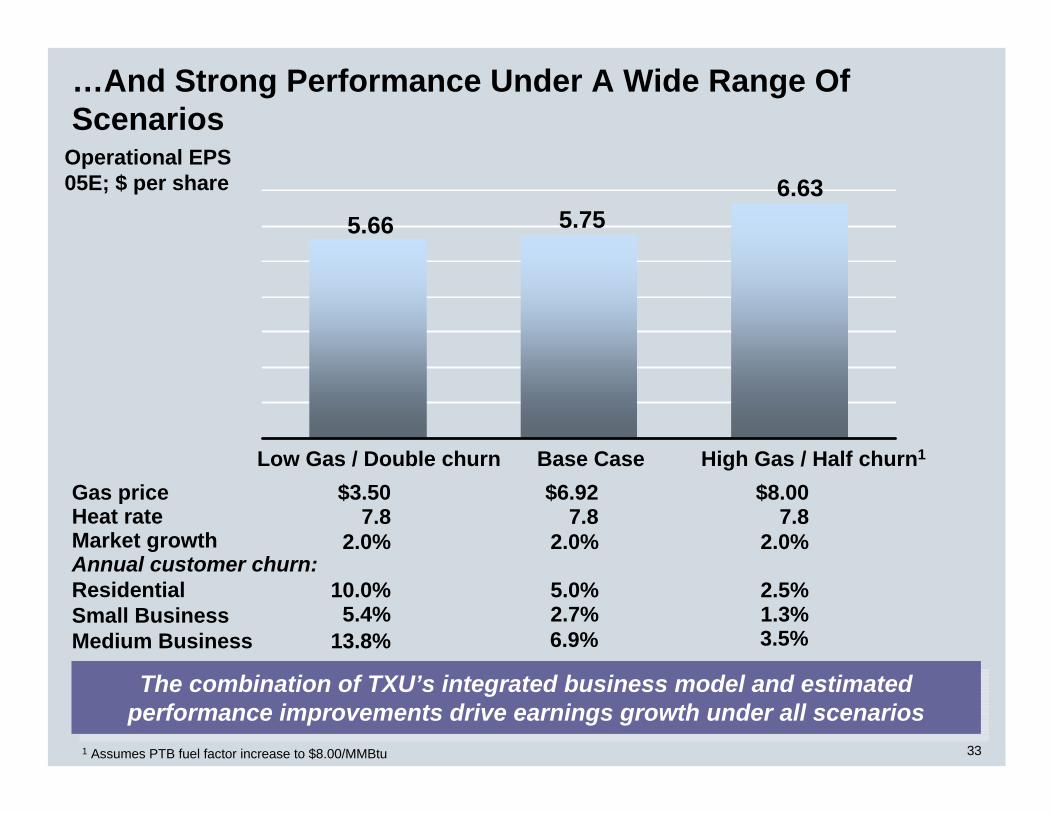
…And Strong Performance Under A Wide Range Of Scenarios
Operational EPS05E; $ per share
The combination of TXU’s integrated business model and estimatedperformance improvements drive earnings growth under all scenariosThe combination of TXU’s integrated business model and estimated
performance improvements drive earnings growth under all scenarios
5.66 5.756.63
Gas price $3.50 $6.92 $8.00Heat rate 7.8 7.8 7.8
Annual customer churn:ResidentialSmall BusinessMedium Business
10.0% 5.0% 2.5%5.4% 2.7% 1.3%
Market growth 2.0% 2.0% 2.0%
Low Gas / Double churn Base Case High Gas / Half churn1
13.8% 6.9% 3.5%
1 Assumes PTB fuel factor increase to $8.00/MMBtu
34
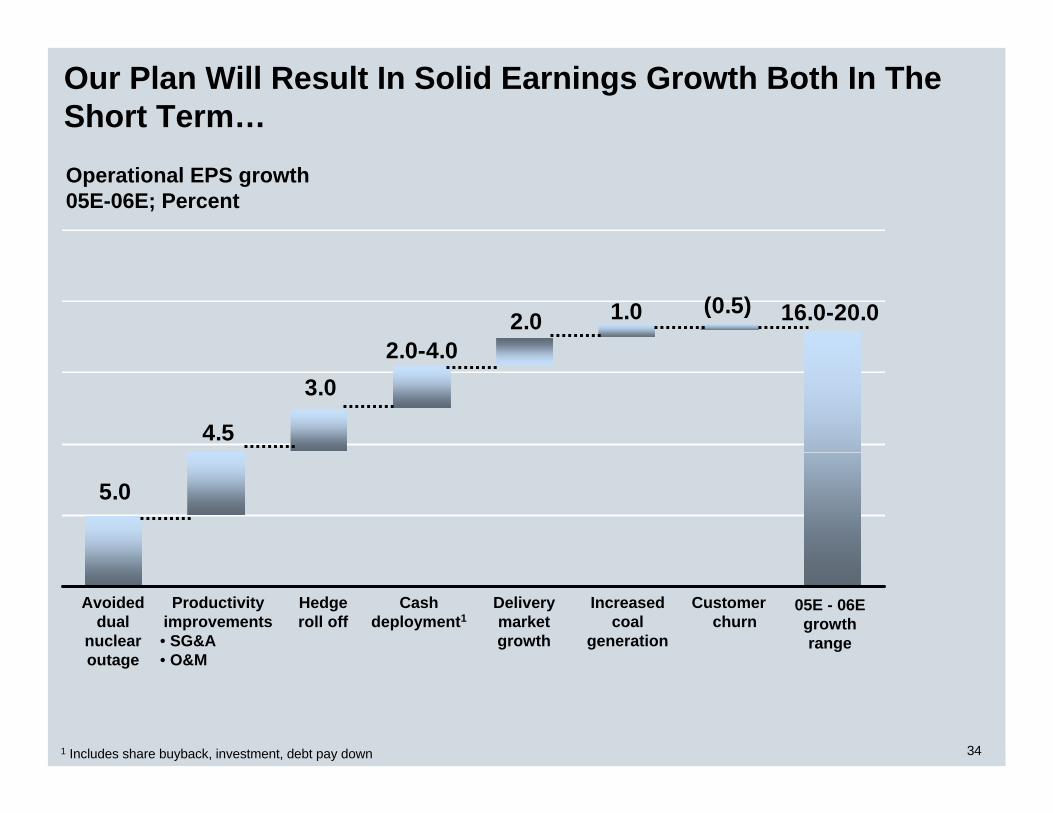
Our Plan Will Result In Solid Earnings Growth Both In The Short Term…
1.0 16.0-20.0(0.5)2.0
5.0
4.5
3.02.0-4.0
Operational EPS growth05E-06E; Percent
1 Includes share buyback, investment, debt pay down
Delivery market growth
Avoided dual
nuclear outage
Hedge roll off
Customerchurn
Productivity improvements• SG&A• O&M
Cash deployment1
05E - 06E growth range
Increased coal
generation
35
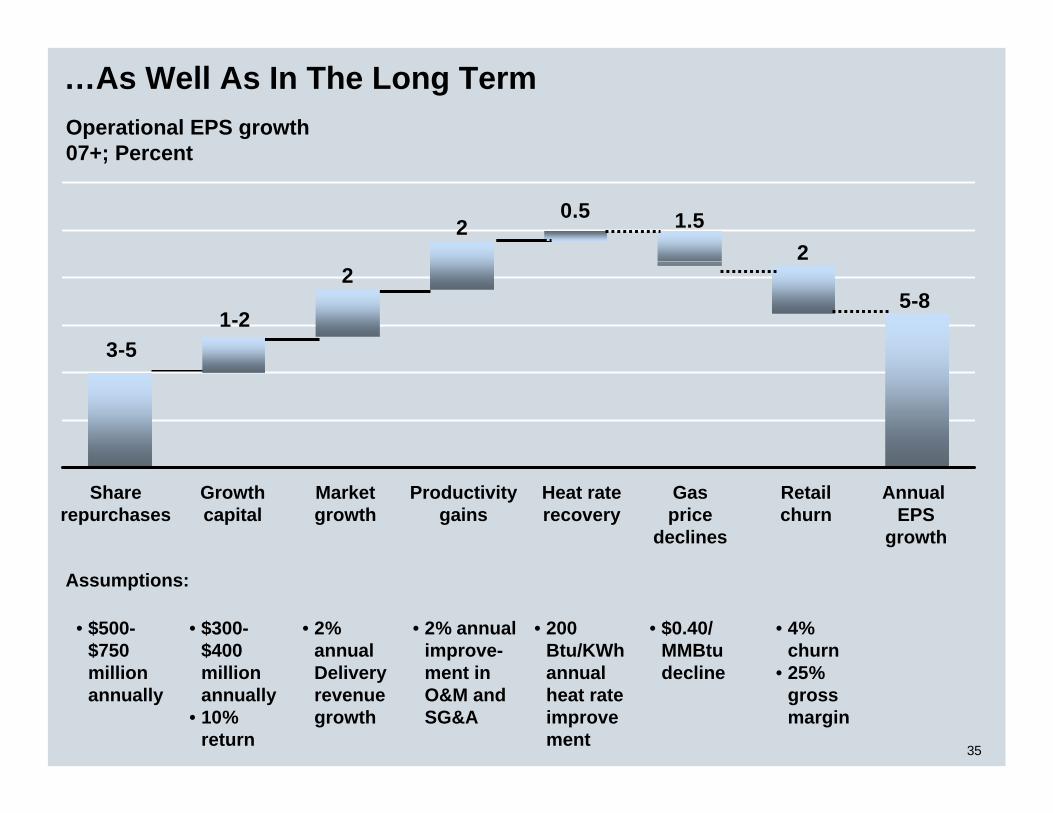
…As Well As In The Long TermOperational EPS growth07+; Percent
Share repurchases
Growth capital
Market growth
Productivity gains
Annual EPS
growth
Heat rate recovery
Assumptions:
Gas price
declines
Retail churn
5-8
21.50.5
2
2
1-23-5
• $500-$750 million annually
• $300-$400 million annually
• 10% return
• 2% annual Delivery revenue growth
• 2% annual improve-ment in O&M and SG&A
• 200 Btu/KWh annual heat rate improvement
• 4% churn
• 25% gross margin
• $0.40/ MMBtudecline
36
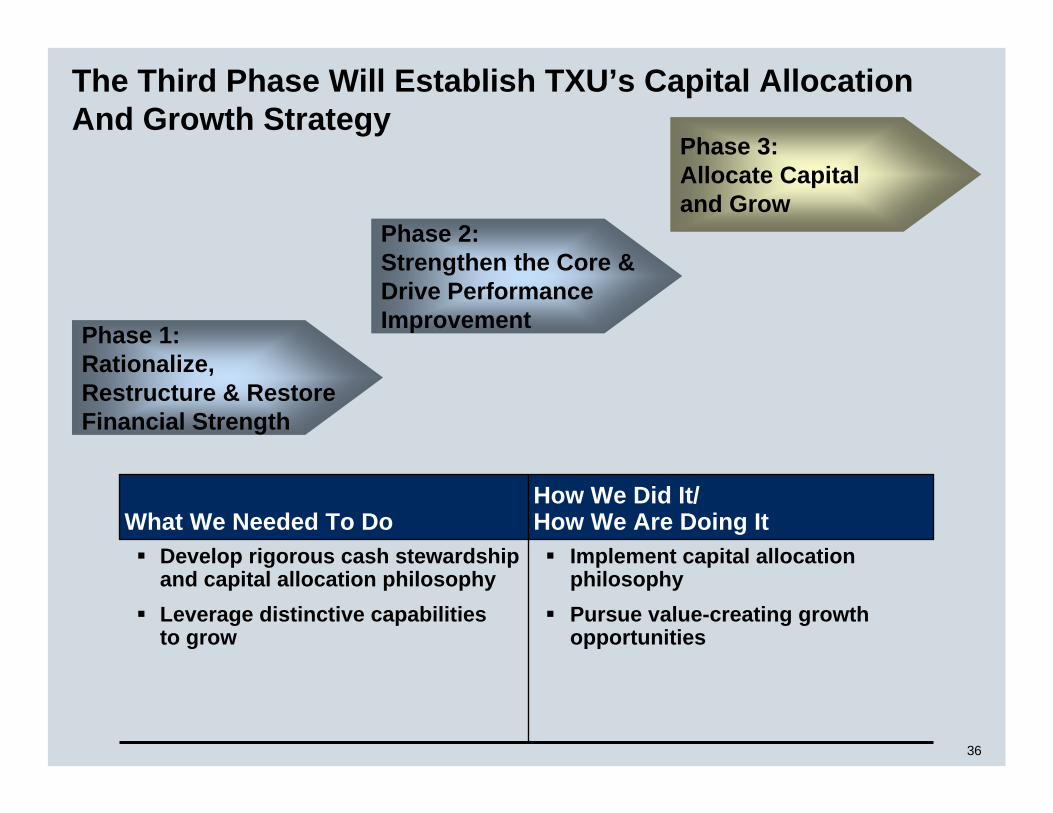
Implement capital allocation philosophy Pursue value-creating growth opportunities
Develop rigorous cash stewardship and capital allocation philosophyLeverage distinctive capabilitiesto grow
How We Did It/How We Are Doing ItWhat We Needed To Do
The Third Phase Will Establish TXU’s Capital Allocation And Growth Strategy
Phase 1:Rationalize, Restructure & Restore Financial Strength
Phase 2: Strengthen the Core & Drive Performance Improvement
Phase 3: Allocate Capitaland Grow
37
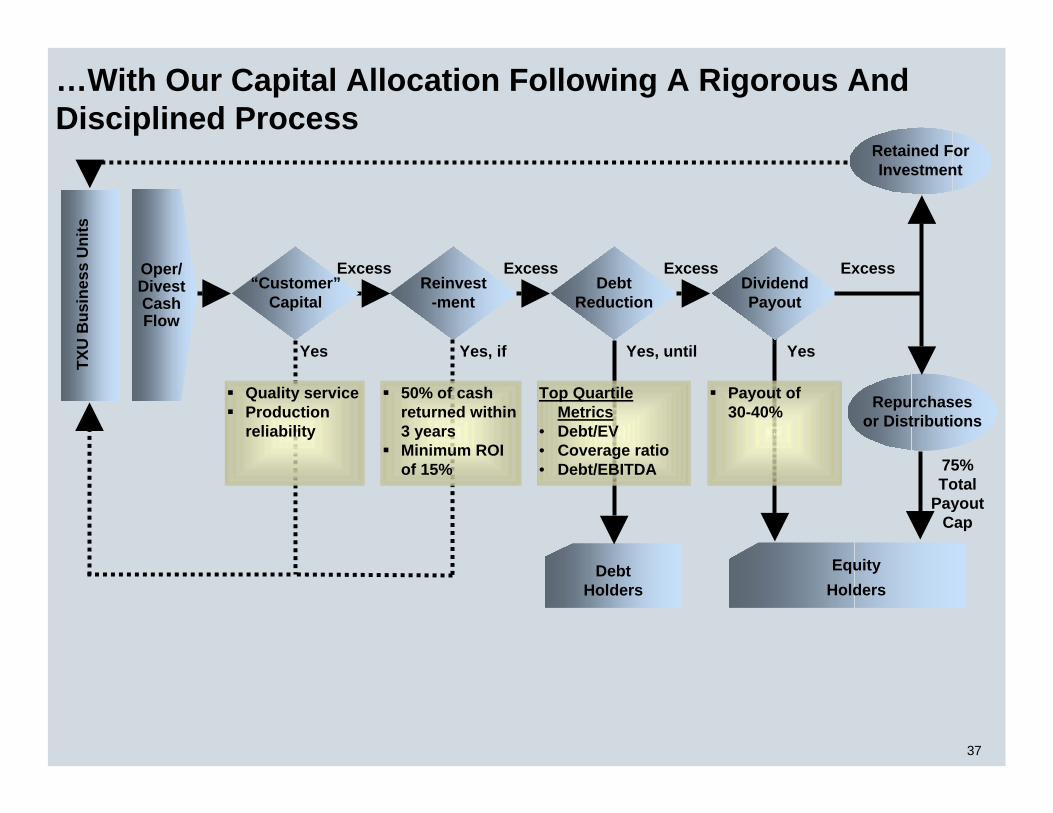
…With Our Capital Allocation Following A Rigorous And Disciplined Process
Reinvest-ment
Excess
Yes, if
50% of cash returned within 3 yearsMinimum ROI of 15%
DebtHolders
DebtReduction
Yes, until
Top Quartile Metrics
• Debt/EV• Coverage ratio • Debt/EBITDA
Excess
Yes
Payout of 30-40%
Excess
EquityHolders
DividendPayout
Oper/DivestCashFlow
TXU
Bus
ines
s U
nits
“Customer”Capital
Yes
Quality serviceProduction reliability
Repurchasesor Distributions
Retained ForInvestment
Excess
75% Total
Payout Cap
38
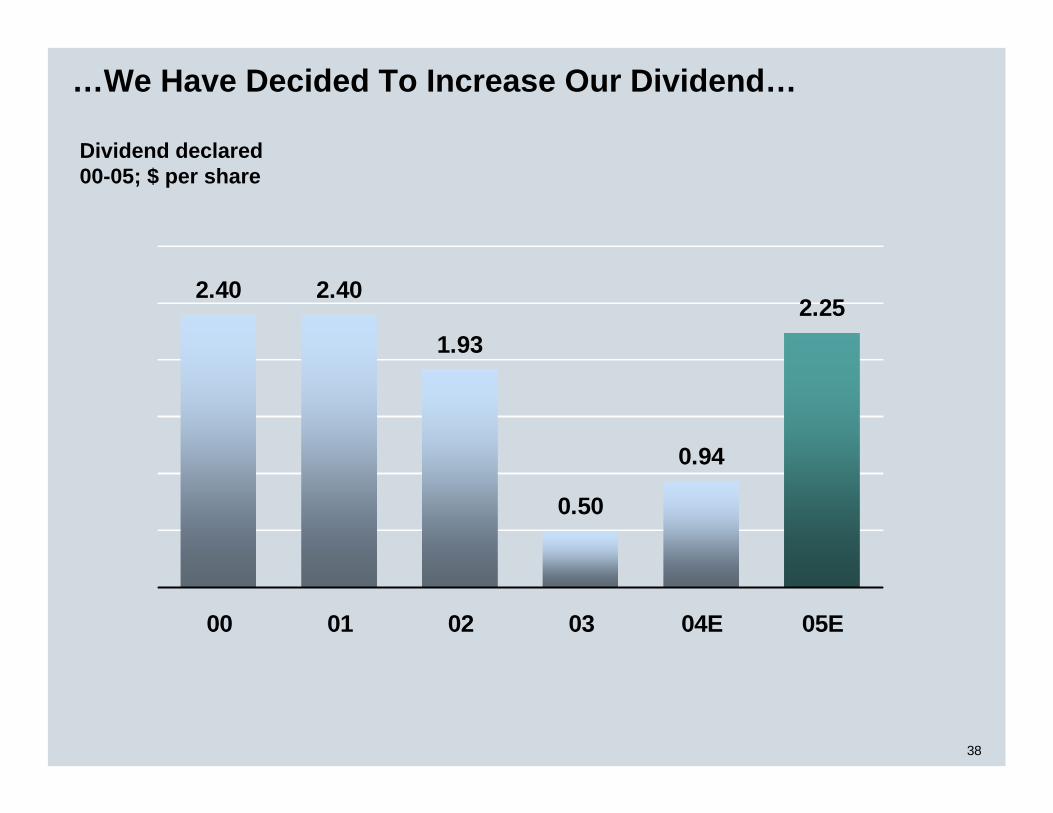
…We Have Decided To Increase Our Dividend…
2.40 2.40
1.93
0.50
0.94
2.25
00 01 02 03 04E 05E
Dividend declared00-05; $ per share
39
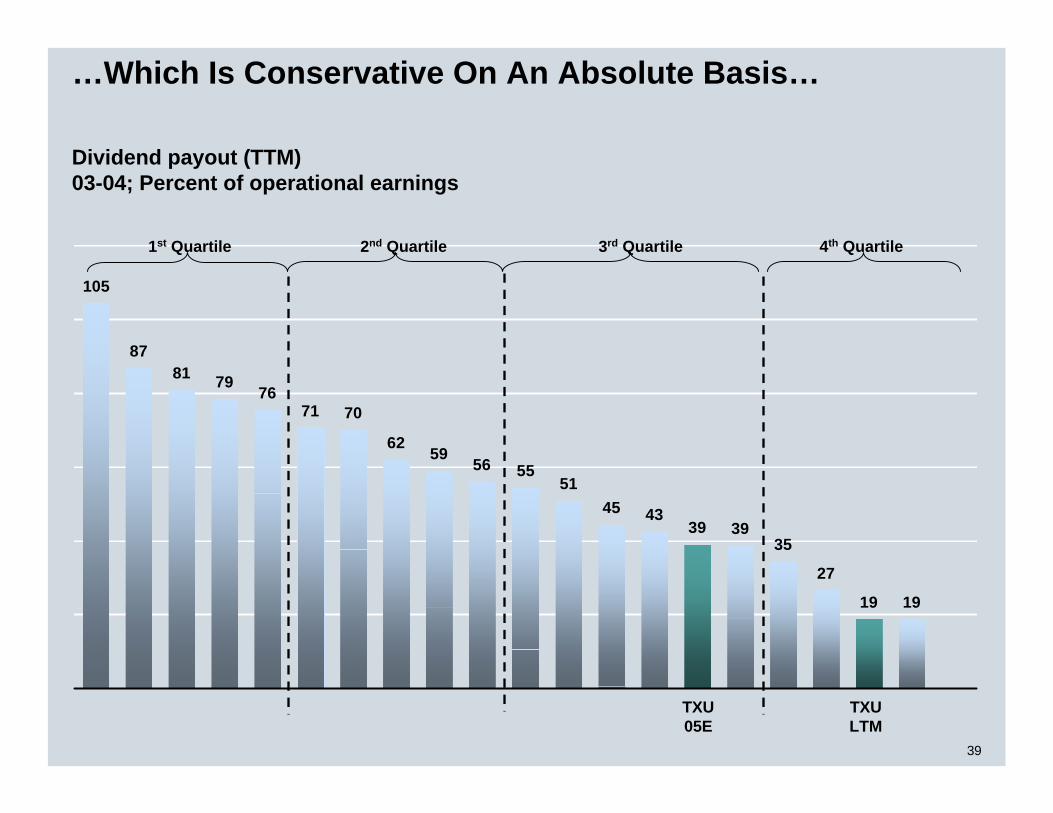
…Which Is Conservative On An Absolute Basis…
105
8781 79 76
71 70
62 59 56 5551
45 4339 39
35
27
19 19
Dividend payout (TTM)03-04; Percent of operational earnings
1st Quartile 2nd Quartile 3rd Quartile 4th Quartile
TXULTM
TXU05E

40
…With A High Performance Growth Rate…
16
9
53 3 2 1 1 0 0
(1)
(3)(5)
(10)(13) (13) (14)
(20)
1st Quartile 2nd Quartile 3rd Quartile 4th Quartile
Dividend growth rate 94-03; Percent
TXU05E-07E
TXU94-03
41
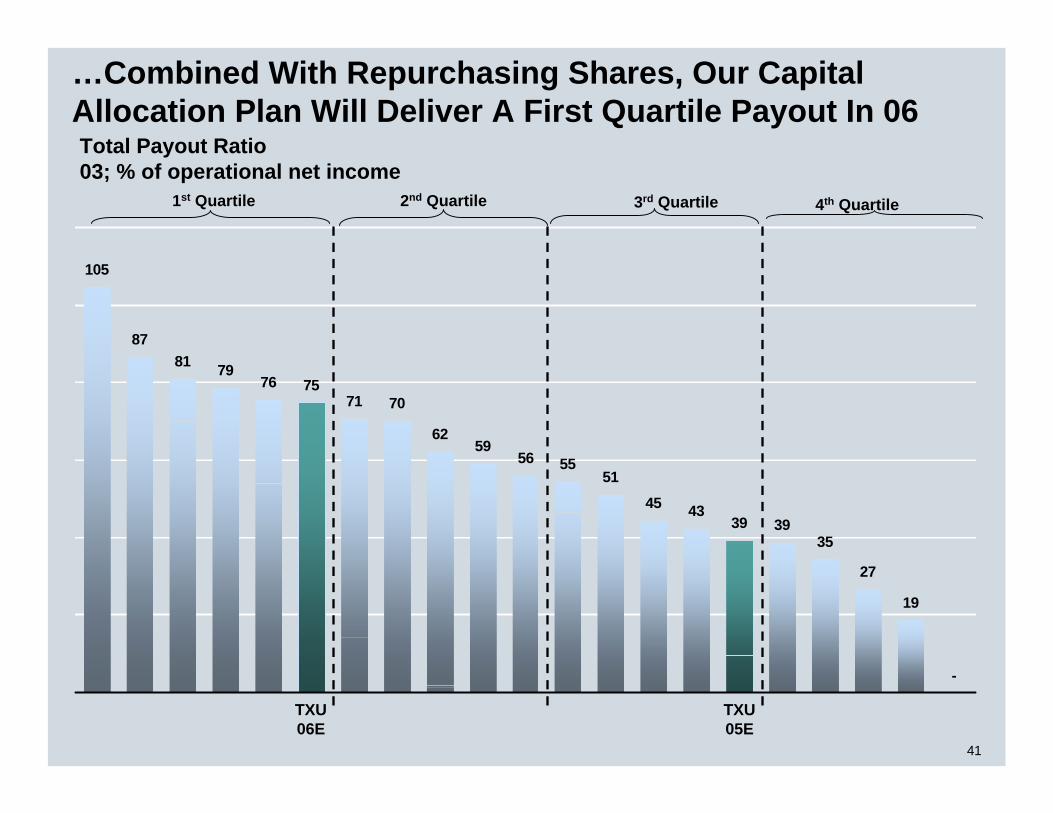
…Combined With Repurchasing Shares, Our Capital Allocation Plan Will Deliver A First Quartile Payout In 06
105
8781 79
76 7571 70
6259
56 5551
45 4339 39
35
27
19
-
Total Payout Ratio 03; % of operational net income
1st Quartile 2nd Quartile 3rd Quartile 4th Quartile
TXU05E
TXU06E
42
0
1
2
3
4
5
6
7
820406080100
0
1
2
3
4
5
6
7
820406080100
0
1
2
3
4
5
6
7
8
204060801000
1
2
3
4
5
6
7
8
20406080100
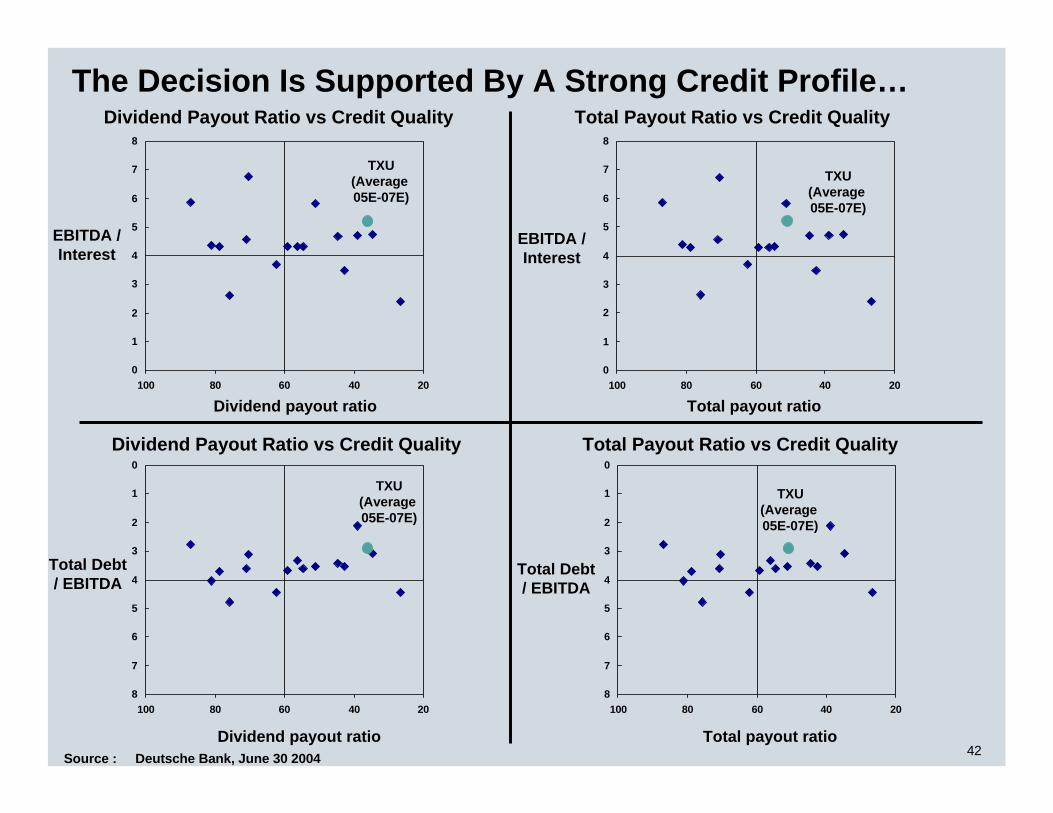
EBITDA / Interest
Dividend Payout Ratio vs Credit Quality
EBITDA / Interest
Total Payout Ratio vs Credit Quality
Source : Deutsche Bank, June 30 2004
TXU(Average 05E-07E)
TXU(Average 05E-07E)
The Decision Is Supported By A Strong Credit Profile…
Total Debt / EBITDA
Dividend Payout Ratio vs Credit Quality Total Payout Ratio vs Credit Quality
Total Debt / EBITDA
Dividend payout ratio
Total payout ratio
Total payout ratio
Dividend payout ratio
TXU(Average 05E-07E)
TXU(Average 05E-07E)
43
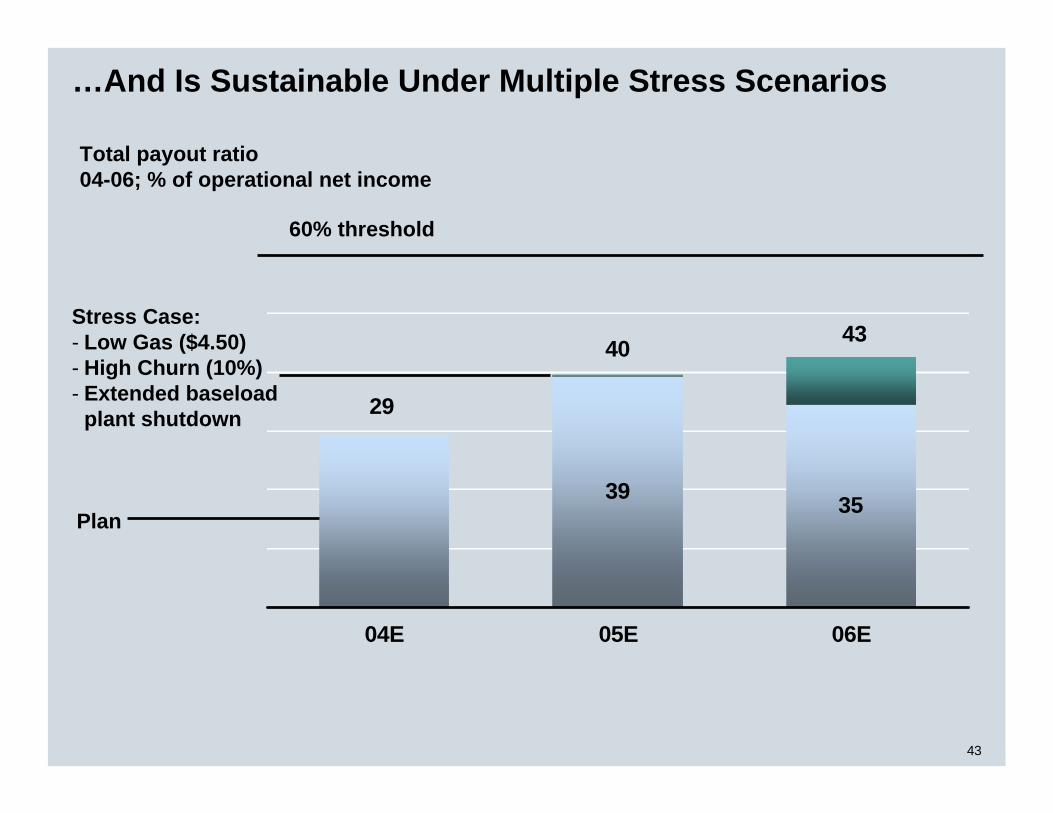
39 35
29
4340
04E 05E 06E
…And Is Sustainable Under Multiple Stress Scenarios
Stress Case:- Low Gas ($4.50)- High Churn (10%)- Extended baseload
plant shutdown
Plan
Total payout ratio 04-06; % of operational net income
60% threshold

44
Today’s Agenda
SummarySummary Conclusion
ERCOTOverviewERCOT
OverviewERCOT market framework
Impact of deregulation
TXUCompetitivePositioning
TXUCompetitivePositioning
Three phase restructuring impact
Capital allocation
45
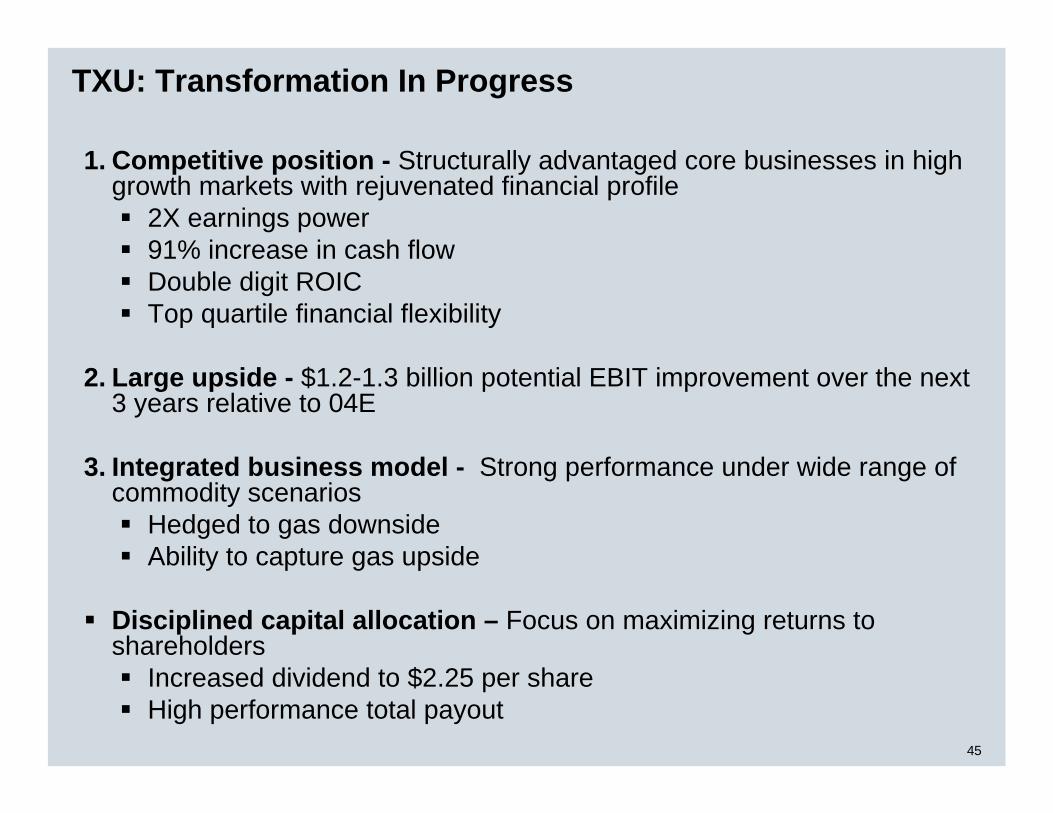
TXU: Transformation In Progress
1. Competitive position - Structurally advantaged core businesses in high growth markets with rejuvenated financial profile
2X earnings power91% increase in cash flow Double digit ROICTop quartile financial flexibility
2. Large upside - $1.2-1.3 billion potential EBIT improvement over the next 3 years relative to 04E
3. Integrated business model - Strong performance under wide range of commodity scenarios
Hedged to gas downsideAbility to capture gas upside
Disciplined capital allocation – Focus on maximizing returns to shareholders
Increased dividend to $2.25 per shareHigh performance total payout
EEI Conference
C. John WilderChief Executive Officer
October 26, 2004

EEI Conference
C. John WilderChief Executive Officer
October 26, 2004

Regulation G Reconciliations
For future periods, TXU is currently unable to estimate the impact of special items or changes in accounting principles or policies on free cash flow, return on invested capital, total debt to capitalization or interest coverage. TXU is therefore currently unable to reconcile the most directly comparable GAAP measure to these items for forecasted periods.
Certain amounts previously reported for the year ended December 31, 2003 have been restated to reflect reporting of TXU Gas and TXU Australia and TXU Energy Company LLC’scogeneration and wholesale energy sales business in New Jersey as discontinued operations.
49
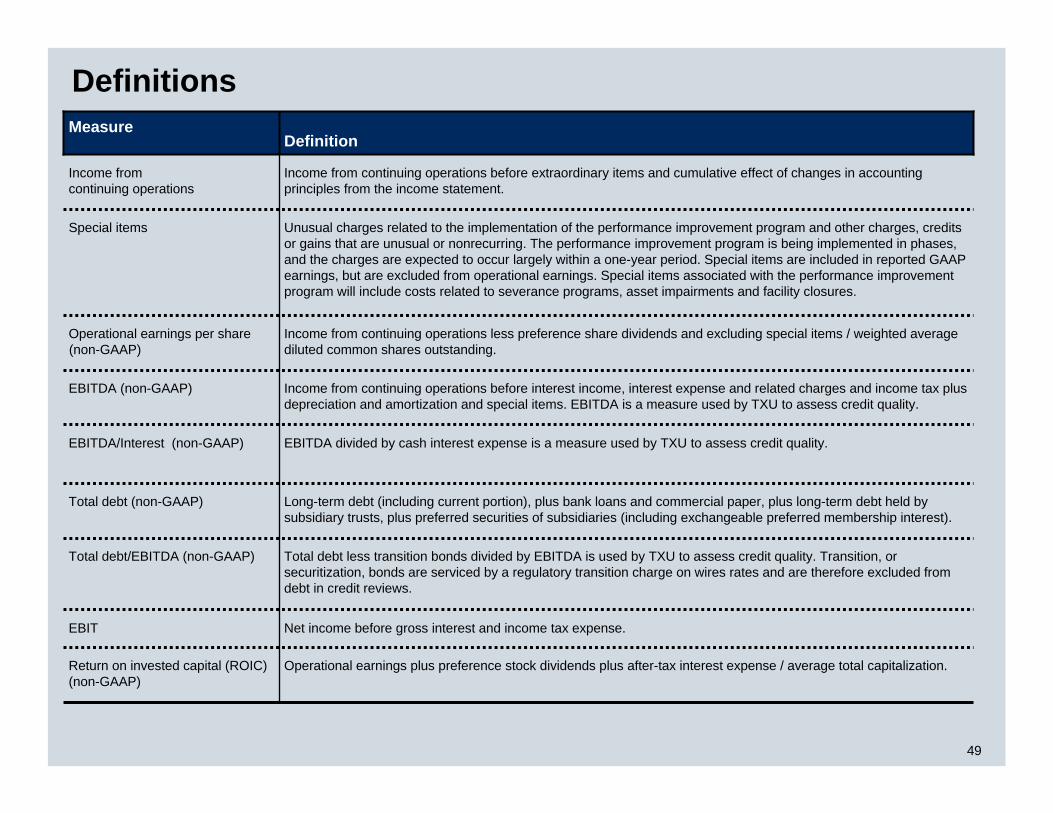
Definitions
Net income before gross interest and income tax expense.EBIT
Operational earnings plus preference stock dividends plus after-tax interest expense / average total capitalization.Return on invested capital (ROIC) (non-GAAP)
Unusual charges related to the implementation of the performance improvement program and other charges, credits or gains that are unusual or nonrecurring. The performance improvement program is being implemented in phases, and the charges are expected to occur largely within a one-year period. Special items are included in reported GAAP earnings, but are excluded from operational earnings. Special items associated with the performance improvement program will include costs related to severance programs, asset impairments and facility closures.
Special items
Long-term debt (including current portion), plus bank loans and commercial paper, plus long-term debt held by subsidiary trusts, plus preferred securities of subsidiaries (including exchangeable preferred membership interest).
Total debt (non-GAAP)
Total debt less transition bonds divided by EBITDA is used by TXU to assess credit quality. Transition, or securitization, bonds are serviced by a regulatory transition charge on wires rates and are therefore excluded from debt in credit reviews.
Total debt/EBITDA (non-GAAP)
DefinitionMeasure
EBITDA divided by cash interest expense is a measure used by TXU to assess credit quality.EBITDA/Interest (non-GAAP)
Income from continuing operations before interest income, interest expense and related charges and income tax plus depreciation and amortization and special items. EBITDA is a measure used by TXU to assess credit quality.
EBITDA (non-GAAP)
Income from continuing operations less preference share dividends and excluding special items / weighted average diluted common shares outstanding.
Income from continuing operations before extraordinary items and cumulative effect of changes in accounting principles from the income statement.
Operational earnings per share (non-GAAP)
Income fromcontinuing operations
50
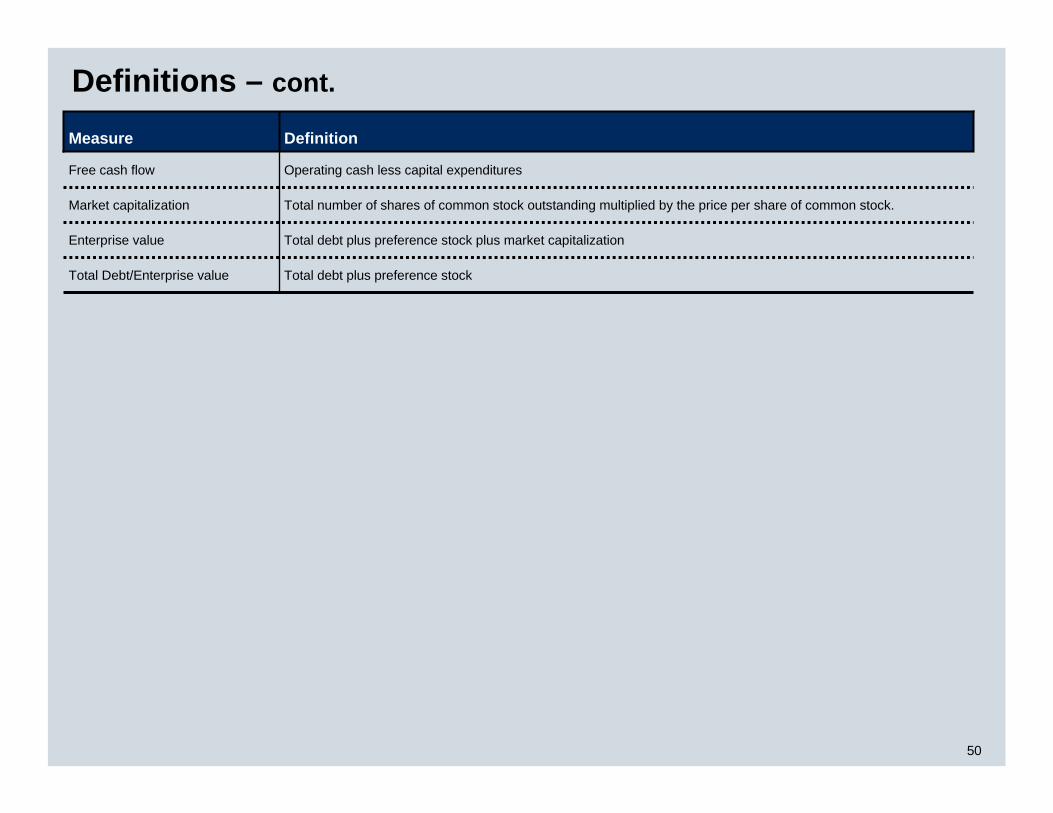
Definitions – cont.
Total debt plus preference stock plus market capitalizationEnterprise value
Total number of shares of common stock outstanding multiplied by the price per share of common stock.Market capitalization
Operating cash less capital expendituresFree cash flow
DefinitionMeasure
Total debt plus preference stockTotal Debt/Enterprise value

51
Table 1: TXU Corp. Operational EPSYear Ended December 31, 2003; $ and shares in Millions
Income from continuing operations before extraordinary loss and cumulativeeffect of changes in accounting principles as reported 737$
Operations discontinued (171)
Less Preference stock dividends (22)
Operational earnings 544
After-tax interest on preferred membership interests in TXU Energy 53
Adjusted operational earnings for diluted EPS calculation 597$
Average shares of common stock outstanding - diluted (millions) 379
Operational earnings per share - diluted 1.58$

52
Table 2: TXU Corp. Free Cash FlowYear ended December 31, 2003; $ Millions
As Reported
Operations Discontinued
Continuing Operations
Cash provided by operating activities 2,798 389 2,409
Less Capital expenditures:Capital expenditures 956 Acquisitions of business 150 Nuclear fuel 44 Total capital expenditures 1,150 193 957
Less income tax refund associated with Europe 616 Free cash flow 836

53
Table 3: TXU Corp. Return on Invested Capital (ROIC)Year ended December 31, 2003; $ Millions
Operational earnings 544$
Preference stock dividends 22
Interest expense and related charges * 784 Taxes at 35% 341
After-tax interest expense and related charges 443
Total return 1,009$
Average invested capital 20,322$
Return on invested capital 5.0%
* Excludes $192M interest for operations discontinued

54
Table 4: TXU Corp. EBITDA/InterestYear Ended December 31, 2003; $ Millions
As Reporte
Operations Discontinue
Ongoing Operation
Income before income taxes, extraordinary loss and cumulative effect of change in accounting principles 1,051$ 233$ 818$
Interest expense and related charges 975 191 784
Interest income (44) (8) (36)
EBIT 1,982 416 1,566
Depreciation and amortization 886 163 723
EBITDA 2,868$ 579$ 2,289$
Interest expense and related charges 784$ Amortization of discount and reacquired debt expense (31) Capitalized interest 12
Cash interest expense 765$
EBITDA/Interest 3.0
55
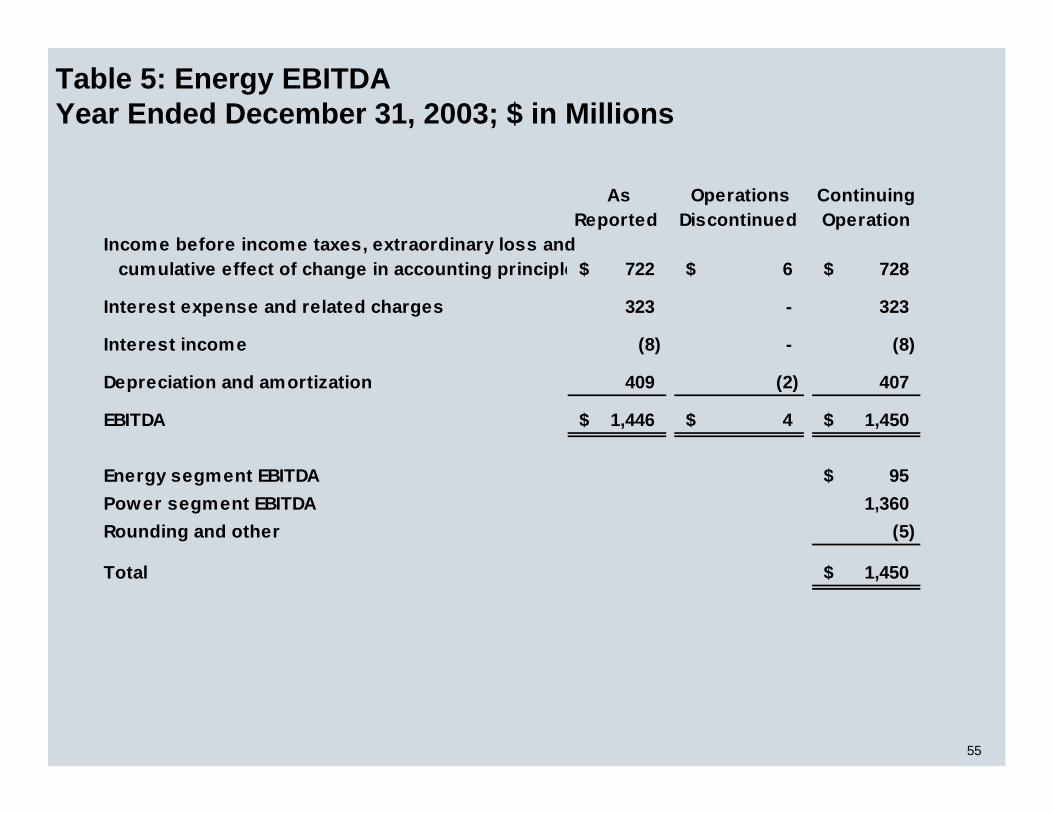
Table 5: Energy EBITDAYear Ended December 31, 2003; $ in Millions
As Reported
Operations Discontinued
Continuing Operation
Income before income taxes, extraordinary loss and cumulative effect of change in accounting principle 722$ 6$ 728$
Interest expense and related charges 323 - 323
Interest income (8) - (8)
Depreciation and amortization 409 (2) 407
EBITDA 1,446$ 4$ 1,450$
Energy segment EBITDA 95$ Power segment EBITDA 1,360 Rounding and other (5)
Total 1,450$
56
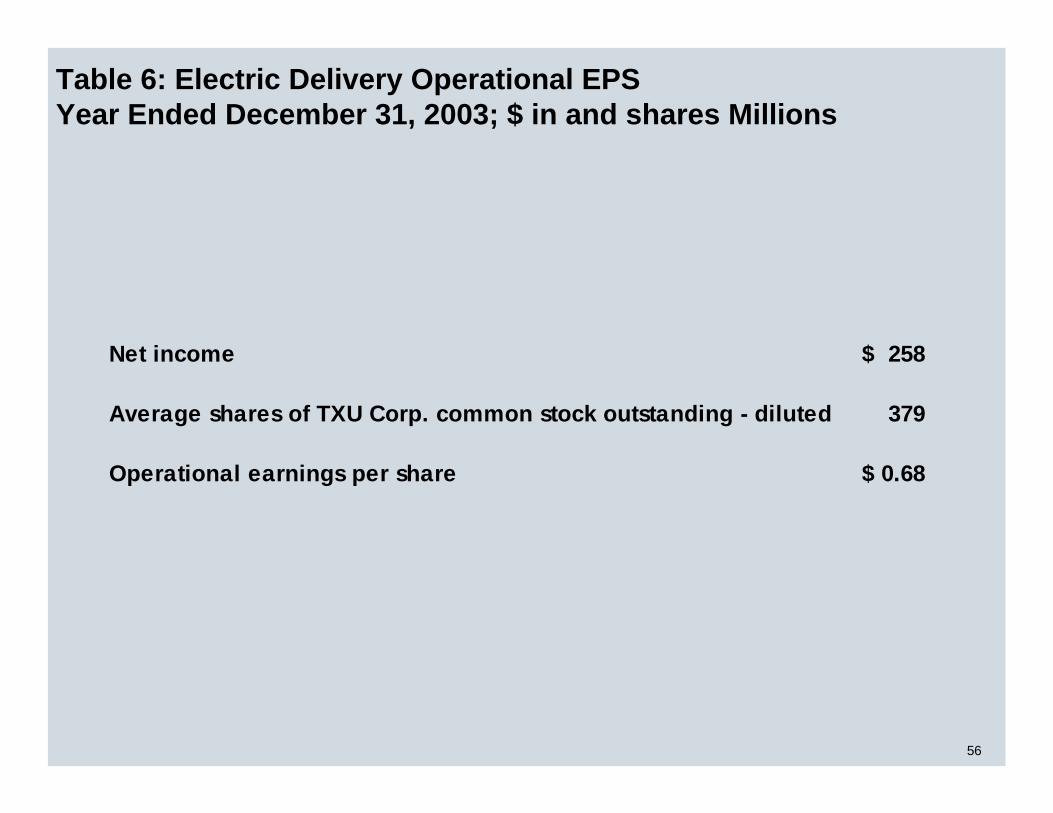
Table 6: Electric Delivery Operational EPSYear Ended December 31, 2003; $ in and shares Millions
Net income 258$
Average shares of TXU Corp. common stock outstanding - diluted 379
Operational earnings per share 0.68$
57
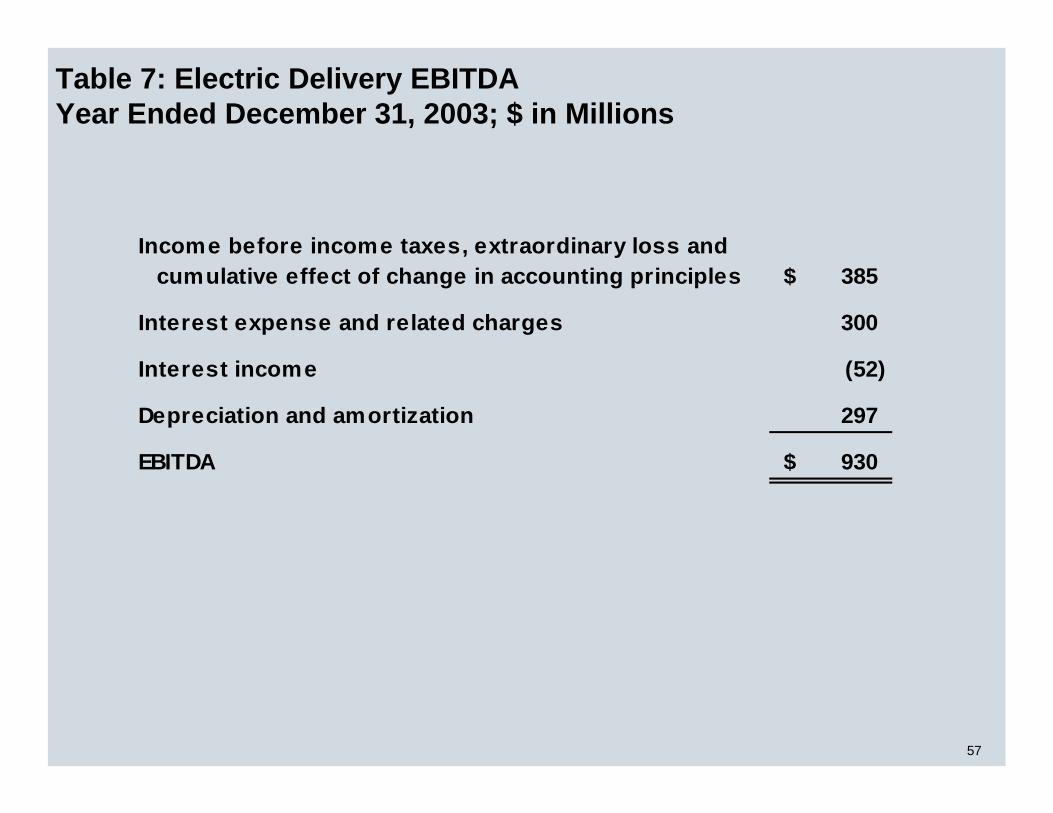
Table 7: Electric Delivery EBITDAYear Ended December 31, 2003; $ in Millions
Income before income taxes, extraordinary loss and cumulative effect of change in accounting principles 385$
Interest expense and related charges 300
Interest income (52)
Depreciation and amortization 297
EBITDA 930$

58
Table 8: TXU Corp. Total debt/EBITDAYear Ended December 31, 2003; $ Millions
Total debt 12,090
EBITDA 2,289
Total debt/EBITDA 5.3

59
Table 9: TXU Corp Total Debt to Enterprise Value Ratio December 31, 2003; $ Millions
As Reported
Operations Discontinued
Continuing Operations
DebtNotes Payable: Commercial Paper 39 39 - Banks 58 58 - Long-term Debt due Currently 677 - 677 LT Debt held by sub Trusts 546 - 546 All other LT debt, less due current 12,324 1,716 10,608 Securitization Debt (500) - (500) Preferred securities of subs 759 - 759
Total debt 13,903 12,090
Preference stock 300 - 300
Total debt and preference stock 14,203 12,390
Market CapitalizationShares Outstanding 324 324 Price per Share 23.72 23.72
Total Market Capitalization 7,685 7,685
Enterprise Value 21,888 20,075
Debt to Enterprise Value 64.9% 61.7%