Energy Efficiency Statistical Summary 2015 2.2 UK final energy consumption ... The historic...
28
Energy Efficiency Statistical Summary 2015 Energy Efficiency Deployment Office January 2015
-
Upload
truongcong -
Category
Documents
-
view
215 -
download
1
Transcript of Energy Efficiency Statistical Summary 2015 2.2 UK final energy consumption ... The historic...
Energy Efficiency Statistical Summary 2015
Energy Efficiency Deployment Office
January 2015

2
URN: 14D/436
© Crown copyright 2015
You may re-use this information (not including logos) free of charge in any format or medium, under the terms of the Open Government Licence.
To view this licence, visit www.nationalarchives.gov.uk/doc/open-government-licence/ or write to the Information Policy Team, The National Archives, Kew, London TW9 4DU, or email: [email protected].
Any enquiries regarding this publication should be sent to us at [email protected]@decc.gsi.gov.uk
This document is also available from our website at www.gov.uk/decc
3
Contents
Chapter 1: Introduction .......................................................................................................... 4
Summary of indicators .............................................................................................................. 5
Chapter 2: Macro indicators .................................................................................................. 7
Chart 2.1 UK primary and final energy consumption, temperature corrected, 1980-2013 ..... 7
Chart 2.2 UK final energy consumption per unit of GDP (real terms), 1980-2013 .................... 8
Chart 2.3 Final energy consumption per unit of GDP, G7 and the EU28, 1980-2012 .............. 9
Chapter 3: Energy Projections ............................................................................................ 10
Projected energy consumption ........................................................................................... 10
Chart 3.1 Projected UK final energy consumption in 2012 and 2014, 1980-2030 .................. 11
Chart 3.2 Projected UK final energy consumption, Carbon Plan scenarios, 1980-2050 ......... 12
Energy savings ..................................................................................................................... 13
Chart 3.3 Projected UK policy savings for final energy consumption, 2015-2030 .................. 13
Benefits of energy efficiency ............................................................................................... 14
Chart 3.4 UK bill savings from DECC energy saving policies, 2014 & 2020 ........................... 14
Chart 3.5 Projected energy net imports, UK, 2014 & 2020 ..................................................... 15
Chart 3.6 Projected UK Greenhouse gas emissions with policy saving, 2010-2030, ............. 16
Chapter 4: Sectoral Indicators ............................................................................................ 17
Domestic ............................................................................................................................... 17
Chart 4.1 Domestic energy consumption, consumption per household and energy service demand, UK, 1990-2013 ........................................................................................................ 18
Chart 4.2 Energy efficiency rating of homes in England, 1996-2013 ...................................... 19
Non-Domestic ...................................................................................................................... 20
Chart 4.3 Proportion of non-domestic EPCs per year by energy efficiency rating, England and Wales ..................................................................................................................................... 20
Chart 4.4 Industrial energy intensity (final energy consumption per unit of production), UK, 1980-2013 .............................................................................................................................. 22
Chart 4.5 Service Sector energy intensity (energy consumption per unit of gross value added), UK, 1980-2013 .......................................................................................................... 23
Transport
Chart 4.6 Car energy use and efficiency indicators, UK, 1980-2013 ...................................... 24
Appendix A – Data Sources & Unit Conversion................................................................. 26

4
Chapter 1: Introduction
1.1. This Statistical Summary sets out key energy efficiency indicators that can be used to monitor progress made by the UK to improve energy efficiency whilst enabling growth and continuing to provide households and businesses with the energy services they require. The indicators monitor energy efficiency both at the whole economy level and in individual sectors.
1.2. The historic indicators in this Statistical Summary show the time period 1980-2013 where available. For the energy projections and policy saving analysis in chapter three, the analysis is made based on the DECC energy and emissions projections.1
Energy efficiency
1.3. As defined in the 2012 Energy Efficiency Strategy2, on a technical level, energy efficiency is the relationship between the energy consumed and the output produced by that energy, often called “energy services”. For example the number of miles travelled for a litre of fuel. Increasing energy efficiency means using either less energy to provide the same level of energy services, or using the same level of energy to provide a higher level of energy services.
1.4. The benefit of energy services can also be measured in terms of its economic value. At an economy-wide level this is the relationship between Gross Domestic Product (GDP) and energy consumption.
1.5. This analysis uses a range of publically available data sources to produce indicators which are used to measure progress with energy efficiency.
1 DECC Energy & Emissions Projections 2014
https://www.gov.uk/government/collections/energy-and-emissions-projections 2 DECC (2012) The Energy Efficiency Strategy:
https://www.gov.uk/government/uploads/system/uploads/attachment_data/file/65602/6927-energy-efficiency-
strategy--the-energy-efficiency.pdf
5
Summary of indicators
Ref Indicators Summary of findings
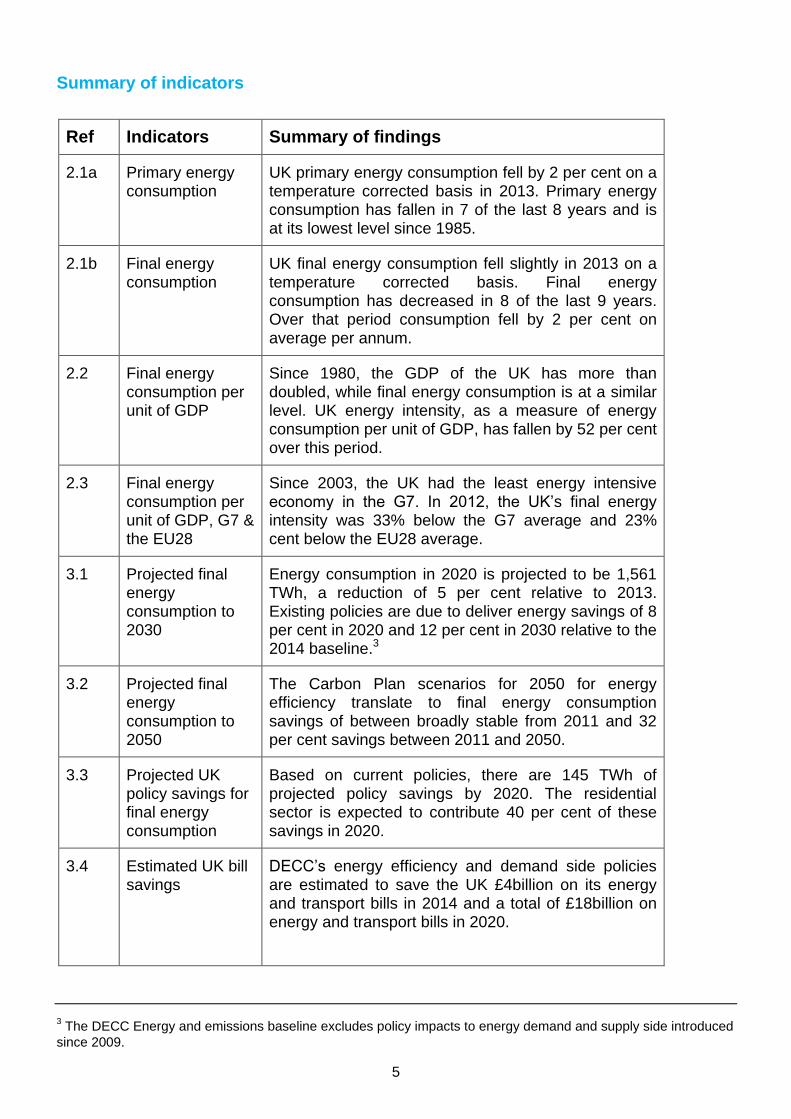
2.1a Primary energy consumption
UK primary energy consumption fell by 2 per cent on a temperature corrected basis in 2013. Primary energy consumption has fallen in 7 of the last 8 years and is at its lowest level since 1985.
2.1b Final energy consumption
UK final energy consumption fell slightly in 2013 on a temperature corrected basis. Final energy consumption has decreased in 8 of the last 9 years. Over that period consumption fell by 2 per cent on average per annum.
2.2 Final energy consumption per unit of GDP
Since 1980, the GDP of the UK has more than doubled, while final energy consumption is at a similar level. UK energy intensity, as a measure of energy consumption per unit of GDP, has fallen by 52 per cent over this period.
2.3 Final energy consumption per unit of GDP, G7 & the EU28
Since 2003, the UK had the least energy intensive economy in the G7. In 2012, the UK’s final energy intensity was 33% below the G7 average and 23% cent below the EU28 average.
3.1 Projected final energy consumption to 2030
Energy consumption in 2020 is projected to be 1,561 TWh, a reduction of 5 per cent relative to 2013. Existing policies are due to deliver energy savings of 8 per cent in 2020 and 12 per cent in 2030 relative to the 2014 baseline.3
3.2 Projected final energy consumption to 2050
The Carbon Plan scenarios for 2050 for energy efficiency translate to final energy consumption savings of between broadly stable from 2011 and 32 per cent savings between 2011 and 2050.
3.3 Projected UK policy savings for final energy consumption
Based on current policies, there are 145 TWh of projected policy savings by 2020. The residential sector is expected to contribute 40 per cent of these savings in 2020.
3.4 Estimated UK bill savings
DECC’s energy efficiency and demand side policies are estimated to save the UK £4billion on its energy and transport bills in 2014 and a total of £18billion on energy and transport bills in 2020.
3 The DECC Energy and emissions baseline excludes policy impacts to energy demand and supply side introduced
since 2009.
6
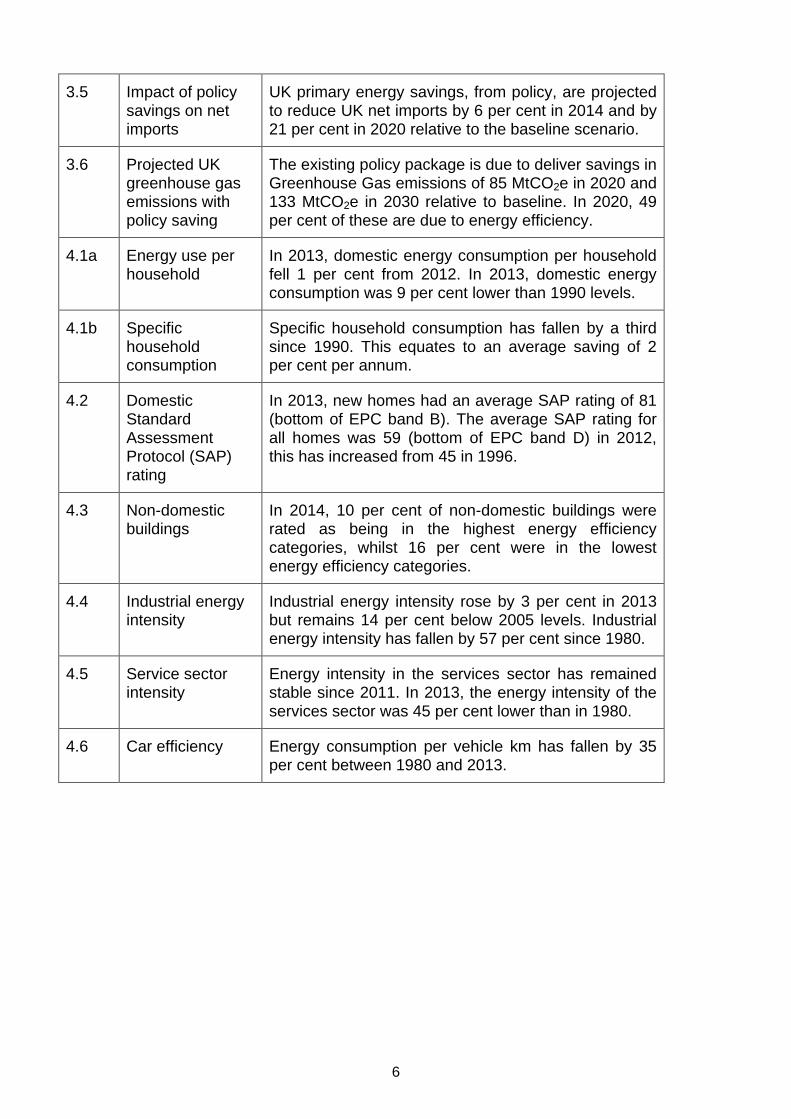
3.5 Impact of policy savings on net imports
UK primary energy savings, from policy, are projected to reduce UK net imports by 6 per cent in 2014 and by 21 per cent in 2020 relative to the baseline scenario.
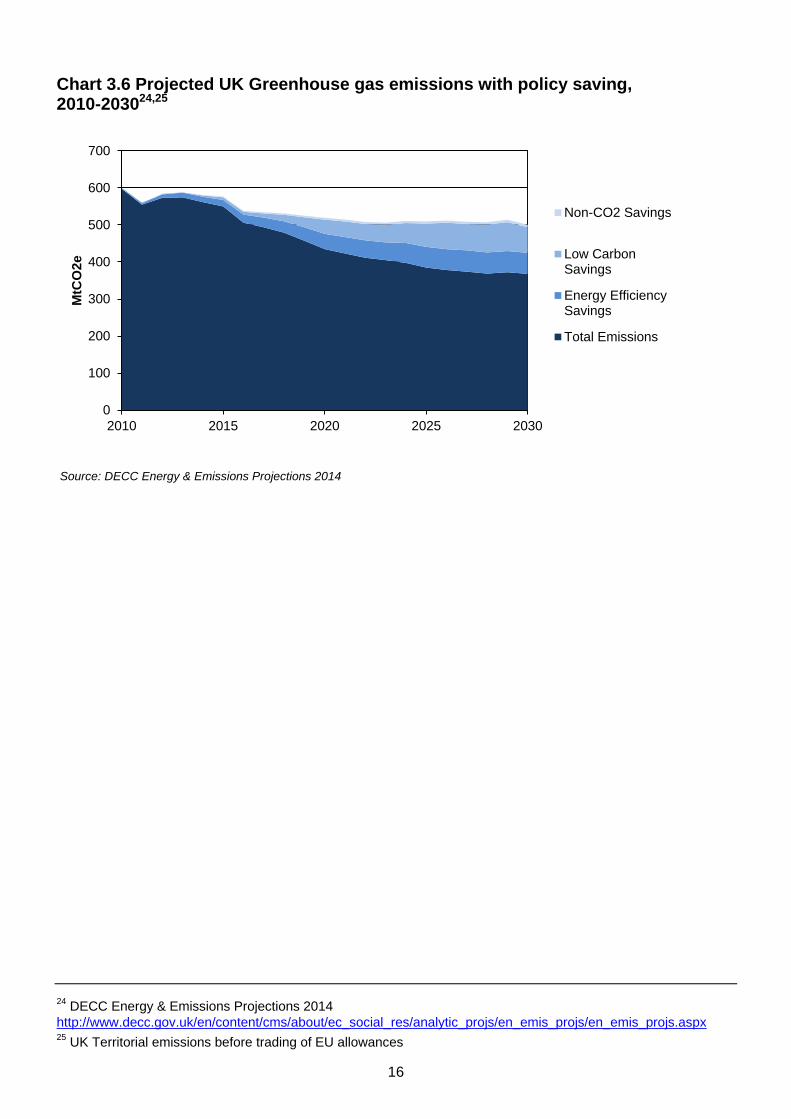
3.6 Projected UK greenhouse gas emissions with policy saving
The existing policy package is due to deliver savings in Greenhouse Gas emissions of 85 MtCO2e in 2020 and 133 MtCO2e in 2030 relative to baseline. In 2020, 49 per cent of these are due to energy efficiency.
4.1a Energy use per household
In 2013, domestic energy consumption per household fell 1 per cent from 2012. In 2013, domestic energy consumption was 9 per cent lower than 1990 levels.
4.1b Specific household consumption
Specific household consumption has fallen by a third since 1990. This equates to an average saving of 2 per cent per annum.
4.2 Domestic Standard Assessment Protocol (SAP) rating
In 2013, new homes had an average SAP rating of 81 (bottom of EPC band B). The average SAP rating for all homes was 59 (bottom of EPC band D) in 2012, this has increased from 45 in 1996.
4.3 Non-domestic buildings
In 2014, 10 per cent of non-domestic buildings were rated as being in the highest energy efficiency categories, whilst 16 per cent were in the lowest energy efficiency categories.
4.4 Industrial energy intensity
Industrial energy intensity rose by 3 per cent in 2013 but remains 14 per cent below 2005 levels. Industrial energy intensity has fallen by 57 per cent since 1980.
4.5 Service sector intensity
Energy intensity in the services sector has remained stable since 2011. In 2013, the energy intensity of the services sector was 45 per cent lower than in 1980.
4.6 Car efficiency Energy consumption per vehicle km has fallen by 35 per cent between 1980 and 2013.
7
Chapter 2: Macro indicators
2.1. Macro indicators provide a good measure of the direction of travel in energy efficiency over the long term and also enable high level comparisons to be made internationally. They also provide a measure of whether the UK is on track to achieve the level of ambition set for energy efficiency to meet 2050 Greenhouse Gas emissions targets.
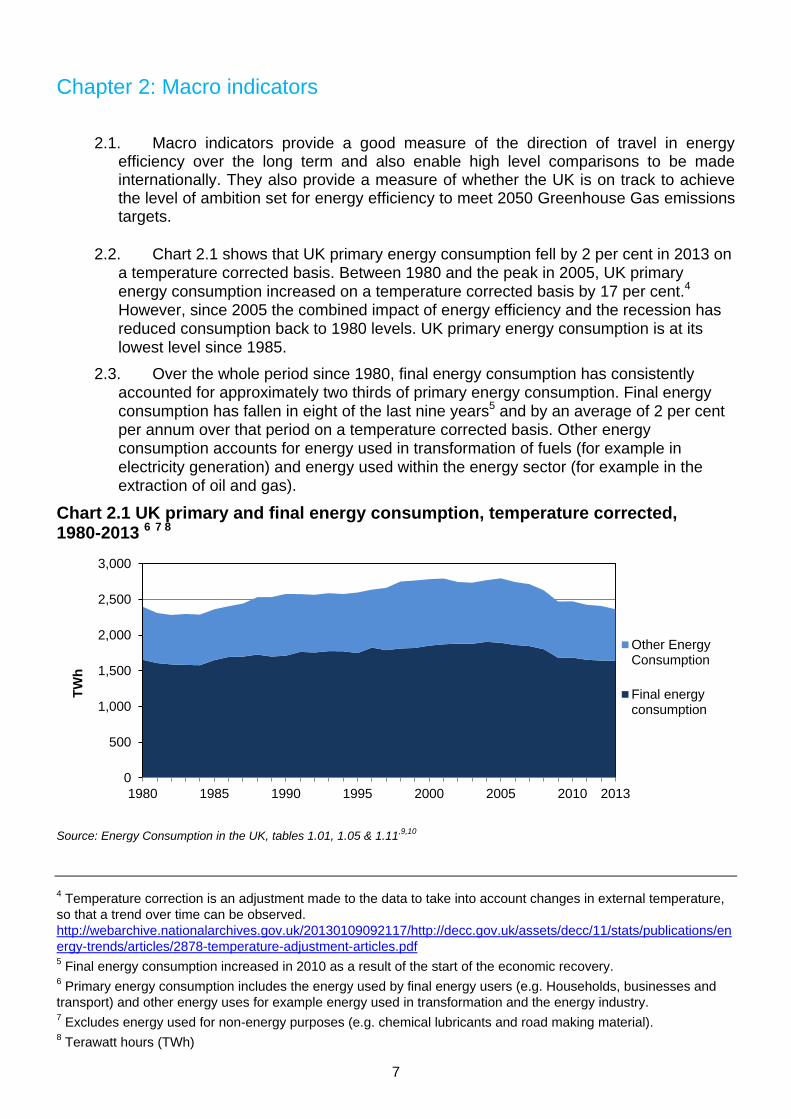
2.2. Chart 2.1 shows that UK primary energy consumption fell by 2 per cent in 2013 on a temperature corrected basis. Between 1980 and the peak in 2005, UK primary energy consumption increased on a temperature corrected basis by 17 per cent.4 However, since 2005 the combined impact of energy efficiency and the recession has reduced consumption back to 1980 levels. UK primary energy consumption is at its lowest level since 1985.
2.3. Over the whole period since 1980, final energy consumption has consistently accounted for approximately two thirds of primary energy consumption. Final energy consumption has fallen in eight of the last nine years5 and by an average of 2 per cent per annum over that period on a temperature corrected basis. Other energy consumption accounts for energy used in transformation of fuels (for example in electricity generation) and energy used within the energy sector (for example in the extraction of oil and gas).
Chart 2.1 UK primary and final energy consumption, temperature corrected, 1980-2013 6 7 8
Source: Energy Consumption in the UK, tables 1.01, 1.05 & 1.11
,9,10
4 Temperature correction is an adjustment made to the data to take into account changes in external temperature,
so that a trend over time can be observed.
http://webarchive.nationalarchives.gov.uk/20130109092117/http://decc.gov.uk/assets/decc/11/stats/publications/en
ergy-trends/articles/2878-temperature-adjustment-articles.pdf 5 Final energy consumption increased in 2010 as a result of the start of the economic recovery.
6 Primary energy consumption includes the energy used by final energy users (e.g. Households, businesses and
transport) and other energy uses for example energy used in transformation and the energy industry. 7 Excludes energy used for non-energy purposes (e.g. chemical lubricants and road making material).
8 Terawatt hours (TWh)
0
500
1,000
1,500
2,000
2,500
3,000
1980 1985 1990 1995 2000 2005 2010 2013
TW
h
Other EnergyConsumption
Final energyconsumption
8
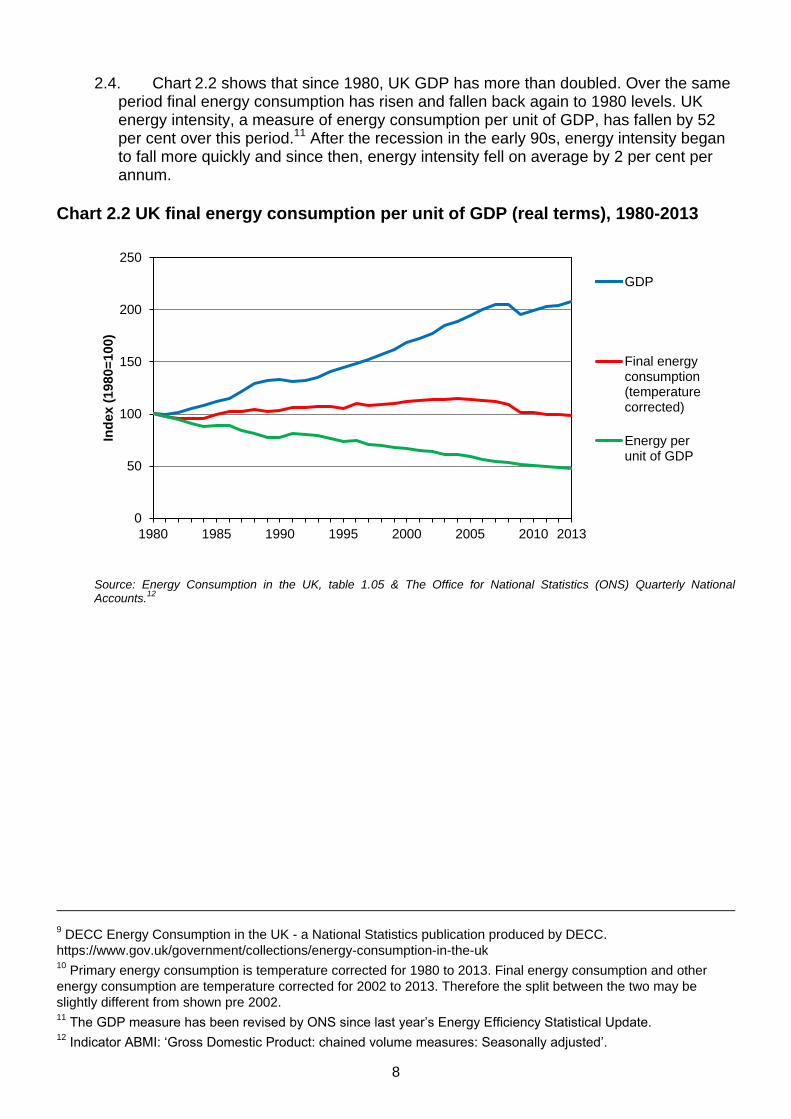
2.4. Chart 2.2 shows that since 1980, UK GDP has more than doubled. Over the same period final energy consumption has risen and fallen back again to 1980 levels. UK energy intensity, a measure of energy consumption per unit of GDP, has fallen by 52 per cent over this period.11 After the recession in the early 90s, energy intensity began to fall more quickly and since then, energy intensity fell on average by 2 per cent per annum.
Chart 2.2 UK final energy consumption per unit of GDP (real terms), 1980-2013
Source: Energy Consumption in the UK, table 1.05 & The Office for National Statistics (ONS) Quarterly National Accounts.
12
9 DECC Energy Consumption in the UK - a National Statistics publication produced by DECC.
https://www.gov.uk/government/collections/energy-consumption-in-the-uk 10
Primary energy consumption is temperature corrected for 1980 to 2013. Final energy consumption and other
energy consumption are temperature corrected for 2002 to 2013. Therefore the split between the two may be
slightly different from shown pre 2002. 11
The GDP measure has been revised by ONS since last year’s Energy Efficiency Statistical Update. 12
Indicator ABMI: ‘Gross Domestic Product: chained volume measures: Seasonally adjusted’.
0
50
100
150
200
250
1980 1985 1990 1995 2000 2005 2010 2013
Ind
ex
(1
98
0=
10
0)
GDP
Final energyconsumption(temperaturecorrected)
Energy perunit of GDP
9
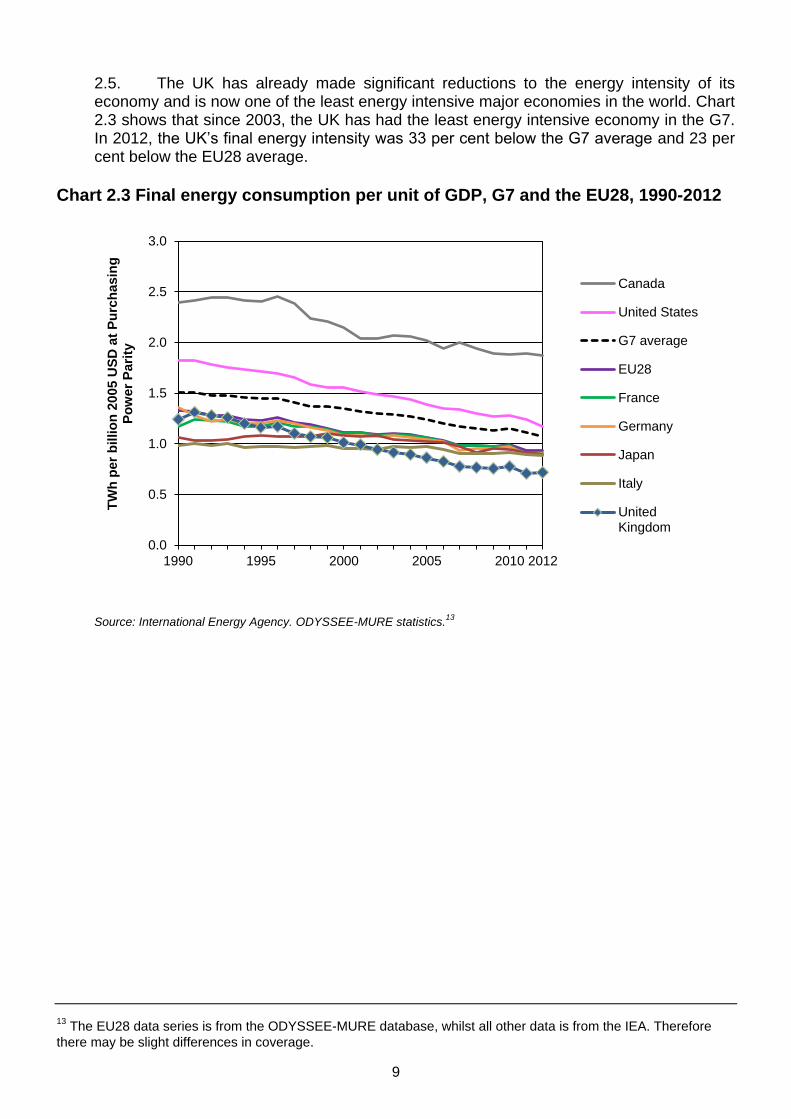
2.5. The UK has already made significant reductions to the energy intensity of its economy and is now one of the least energy intensive major economies in the world. Chart 2.3 shows that since 2003, the UK has had the least energy intensive economy in the G7. In 2012, the UK’s final energy intensity was 33 per cent below the G7 average and 23 per cent below the EU28 average.
Chart 2.3 Final energy consumption per unit of GDP, G7 and the EU28, 1990-2012
Source: International Energy Agency. ODYSSEE-MURE statistics.13
13
The EU28 data series is from the ODYSSEE-MURE database, whilst all other data is from the IEA. Therefore
there may be slight differences in coverage.
0.0
0.5
1.0
1.5
2.0
2.5
3.0
1990 1995 2000 2005 2010 2012
TW
h p
er
billio
n 2
00
5 U
SD
at
Pu
rch
as
ing
P
ow
er
Pa
rity
Canada
United States
G7 average
EU28
France
Germany
Japan
Italy
UnitedKingdom
10
Chapter 3: Energy Projections
Projected energy consumption
3.1. The Department of Energy and Climate Change (DECC) publishes projections for energy consumption and emissions.14 Projections are made by DECC based on a range of scenarios. Two of these have been presented in this report. Firstly the baseline scenario that projects what energy demand and emissions would be in the absence of new policies announced since Low Carbon Transition Plan in 2009 and a reference scenario that includes the impact of existing and planned policies15.
3.2. These projections reflect the latest estimates of policy savings and the outlook for household, population and economic growth together with the latest energy price assumptions.
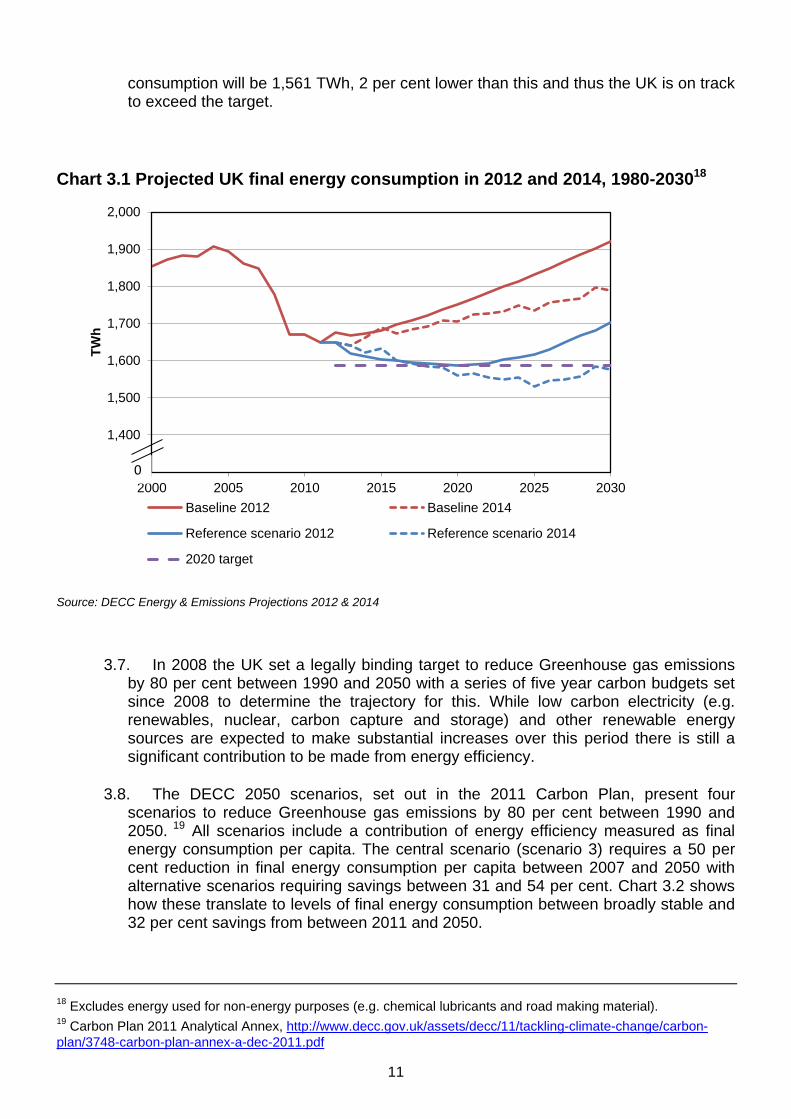
3.3. In line with these changes, since the 2012 Energy Efficiency Strategy, projections of final energy consumption are now lower, as shown in Chart 3.1, both in the baseline scenario and the reference scenario including the impact of policies. UK final energy consumption is now projected to be 2 per cent lower in 2020 and 7 per cent lower in 2030 than was projected in 2012.
3.4. UK final energy consumption peaked in 2004 at 1,900 TWh, before falling on average by 2 per cent per annum until 2008. This was followed by a 6 per cent reduction in 2009 as the UK went into recession. The latest projections show reductions in energy consumption of nearly 1 per cent per annum are expected until 2020 before a net increase of energy consumption between 2020 and 2030. This is because the DECC energy projections only include existing polices and planned policies that are being consulted on. They exclude future policies in an earlier stage of development. Existing and planned policies continue to provide savings beyond 2020 but further policies will be needed to drive forward energy savings to 2030 and beyond.
3.5. The 2014 projections estimate policy savings, relative to a pre-Low Carbon Transition Plan baseline, of 145 TWh in 2020, an 8 per cent reduction compared to the 2014 projected energy baseline using the latest growth assumptions but without the impact of policy. This rises to 212 TWh in 2030 which represents a 12 per cent saving relative to the baseline.
3.6. The UK 2020 energy efficiency target16 was set such that energy consumption in 2020 was no higher than was projected in the 2012 based projections. Using the baseline scenario from 2007 from which the European Commission set this target it represented a saving of 18 per cent in final energy, equivalent to a 20 per cent saving in term of primary energy. The target is therefore for energy consumption to not exceed 1,586 TWh17 and under the current reference projection, UK final energy
14
DECC Energy & Emissions Projections https://www.gov.uk/government/collections/energy-and-emissions-
projections 15
The baseline refers to the scenario without policy introduced in the UK Low Carbon Transition Plan (July 2009)
http://webarchive.nationalarchives.gov.uk/20100509134746/http:/www.decc.gov.uk/en/content/cms/publications/lc_
trans_plan/lc_trans_plan.aspx or subsequently. 16
Article 3 of Energy Efficiency Directive non-binding final energy consumption target, notified to the European
Commission in April 2013 http://ec.europa.eu/energy/efficiency/eed/reporting_en.htm 17
The UK share of the EU target is formally set as 129.2 mtoe on a Net Calorific Value (NCV) basis.
11
consumption will be 1,561 TWh, 2 per cent lower than this and thus the UK is on track to exceed the target.
Chart 3.1 Projected UK final energy consumption in 2012 and 2014, 1980-203018
Source: DECC Energy & Emissions Projections 2012 & 2014
3.7. In 2008 the UK set a legally binding target to reduce Greenhouse gas emissions by 80 per cent between 1990 and 2050 with a series of five year carbon budgets set since 2008 to determine the trajectory for this. While low carbon electricity (e.g. renewables, nuclear, carbon capture and storage) and other renewable energy sources are expected to make substantial increases over this period there is still a significant contribution to be made from energy efficiency.
3.8. The DECC 2050 scenarios, set out in the 2011 Carbon Plan, present four scenarios to reduce Greenhouse gas emissions by 80 per cent between 1990 and 2050. 19 All scenarios include a contribution of energy efficiency measured as final energy consumption per capita. The central scenario (scenario 3) requires a 50 per cent reduction in final energy consumption per capita between 2007 and 2050 with alternative scenarios requiring savings between 31 and 54 per cent. Chart 3.2 shows how these translate to levels of final energy consumption between broadly stable and 32 per cent savings from between 2011 and 2050.
18
Excludes energy used for non-energy purposes (e.g. chemical lubricants and road making material). 19
Carbon Plan 2011 Analytical Annex, http://www.decc.gov.uk/assets/decc/11/tackling-climate-change/carbon-
plan/3748-carbon-plan-annex-a-dec-2011.pdf
1,300
1,400
1,500
1,600
1,700
1,800
1,900
2,000
2000 2005 2010 2015 2020 2025 2030
TW
h
Baseline 2012 Baseline 2014
Reference scenario 2012 Reference scenario 2014
2020 target
0

12
Chart 3.2 Projected UK final energy consumption, Carbon Plan scenarios, 1980-205020
Source: DECC Energy Projections & Digest of UK Energy Statistics 21
3.9. The four scenarios differ in their energy and generation mix but a key difference between them is the impact and resultant savings of energy efficiency. Scenario 4 is based on high energy efficiency and higher renewables and yields the greatest energy consumption savings. In this future, people embrace a low carbon behaviour change through higher uptake of home insulation and technologies such as heating controls that allow the public to recognise the financial benefits of taking up energy efficiency. More efficient heating systems and vehicles allow further reductions. Scenario 1 reflects a future with less behaviour change and subsequently less energy efficiency savings but carbon reduction is met primarily through greater transition to nuclear power stations and the subsequent decarbonisation of the grid.
3.10. Final energy consumption is projected to fall until 2025 but without new policy measures would be expected to rise after then. This analysis illustrates that new policy will be needed to continue the contribution of energy efficiency to carbon abatement.
20
Excludes energy used for non-energy purposes (e.g. chemical lubricants and road making material). 21
The Digest of UK Energy Statistics - a National Statistics publication produced by DECC,
http://www.decc.gov.uk/en/content/cms/statistics/energy_stats/source/total/total.aspx
0
200
400
600
800
1,000
1,200
1,400
1,600
1,800
2,000
1980 1985 1990 1995 2000 2005 2010 2015 2020 2025 2030 2035 2040 2045 2050
Fin
al e
ne
rgy c
on
su
mp
tio
n (
TW
h)
2013 Policy package to 2030 to be developed
Scenario 1
Scenario 2
Scenario 3
Scenario 4
13
Energy savings
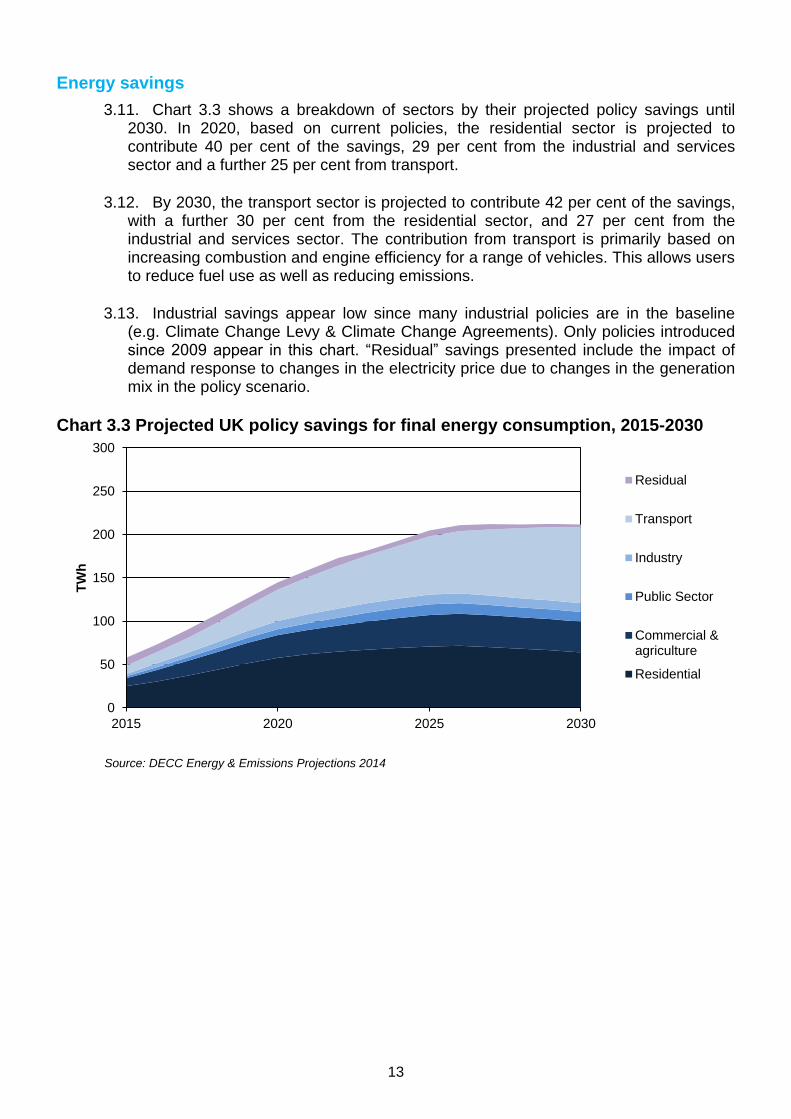
3.11. Chart 3.3 shows a breakdown of sectors by their projected policy savings until 2030. In 2020, based on current policies, the residential sector is projected to contribute 40 per cent of the savings, 29 per cent from the industrial and services sector and a further 25 per cent from transport.
3.12. By 2030, the transport sector is projected to contribute 42 per cent of the savings, with a further 30 per cent from the residential sector, and 27 per cent from the industrial and services sector. The contribution from transport is primarily based on increasing combustion and engine efficiency for a range of vehicles. This allows users to reduce fuel use as well as reducing emissions.
3.13. Industrial savings appear low since many industrial policies are in the baseline (e.g. Climate Change Levy & Climate Change Agreements). Only policies introduced since 2009 appear in this chart. “Residual” savings presented include the impact of demand response to changes in the electricity price due to changes in the generation mix in the policy scenario.
Chart 3.3 Projected UK policy savings for final energy consumption, 2015-2030
Source: DECC Energy & Emissions Projections 2014
0
50
100
150
200
250
300
2015 2020 2025 2030
TW
h
Residual
Transport
Industry
Public Sector
Commercial &agriculture
Residential
14
Benefits of energy efficiency
3.14. There are a number of benefits to energy efficiency and energy savings. These include bill savings, improved security of supply and lower Greenhouse gas emissions.
3.15. Analysis of bill savings from energy saving policies can be done using the DECC Energy & Emissions Projections projected savings and energy price assumptions. Some policies switch energy sources for example gas to renewables. The impact of these has been included and the different prices of these energy sources will affect the net savings shown.
3.16. The analysis multiplies the policy savings, described previously in this chapter and energy price assumptions22, to estimate a total saving on energy and transport bills across the economy23.
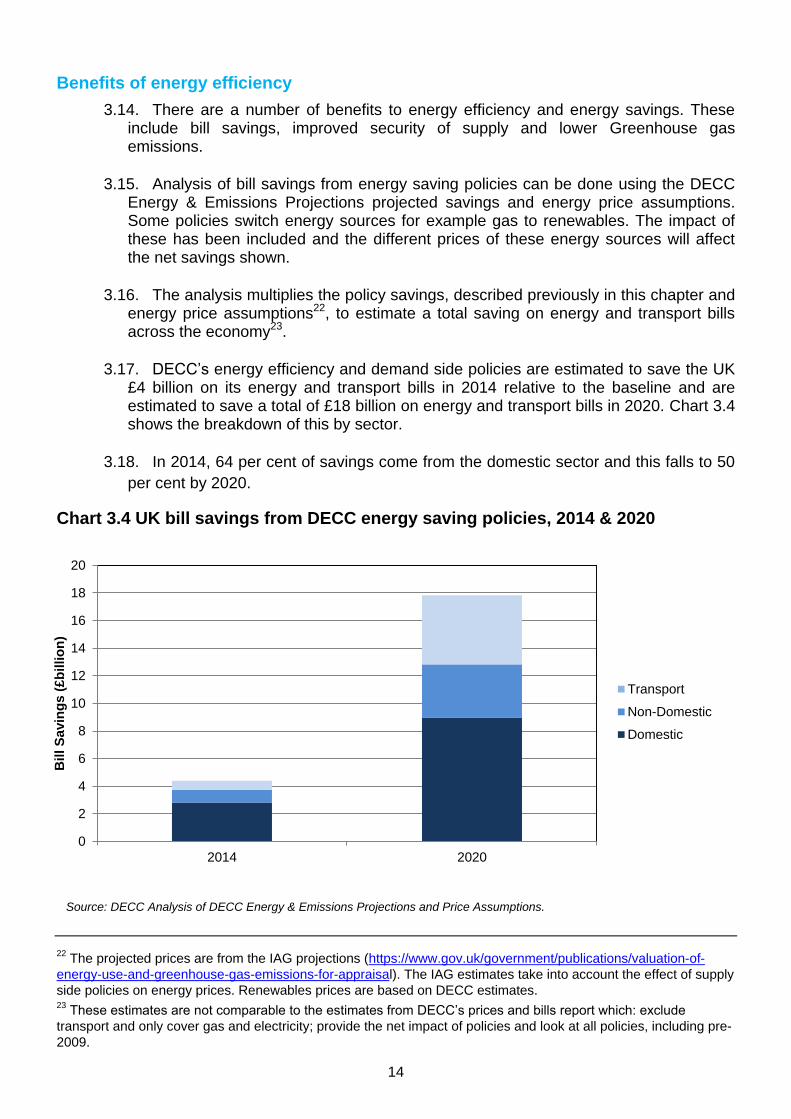
3.17. DECC’s energy efficiency and demand side policies are estimated to save the UK £4 billion on its energy and transport bills in 2014 relative to the baseline and are estimated to save a total of £18 billion on energy and transport bills in 2020. Chart 3.4 shows the breakdown of this by sector.
3.18. In 2014, 64 per cent of savings come from the domestic sector and this falls to 50
per cent by 2020.
Chart 3.4 UK bill savings from DECC energy saving policies, 2014 & 2020
Source: DECC Analysis of DECC Energy & Emissions Projections and Price Assumptions.
22
The projected prices are from the IAG projections (https://www.gov.uk/government/publications/valuation-of-
energy-use-and-greenhouse-gas-emissions-for-appraisal). The IAG estimates take into account the effect of supply
side policies on energy prices. Renewables prices are based on DECC estimates. 23
These estimates are not comparable to the estimates from DECC’s prices and bills report which: exclude
transport and only cover gas and electricity; provide the net impact of policies and look at all policies, including pre-
2009.
0
2
4
6
8
10
12
14
16
18
20
2014 2020
Bil
l S
avin
gs
(£
billio
n)
Transport
Non-Domestic
Domestic
15
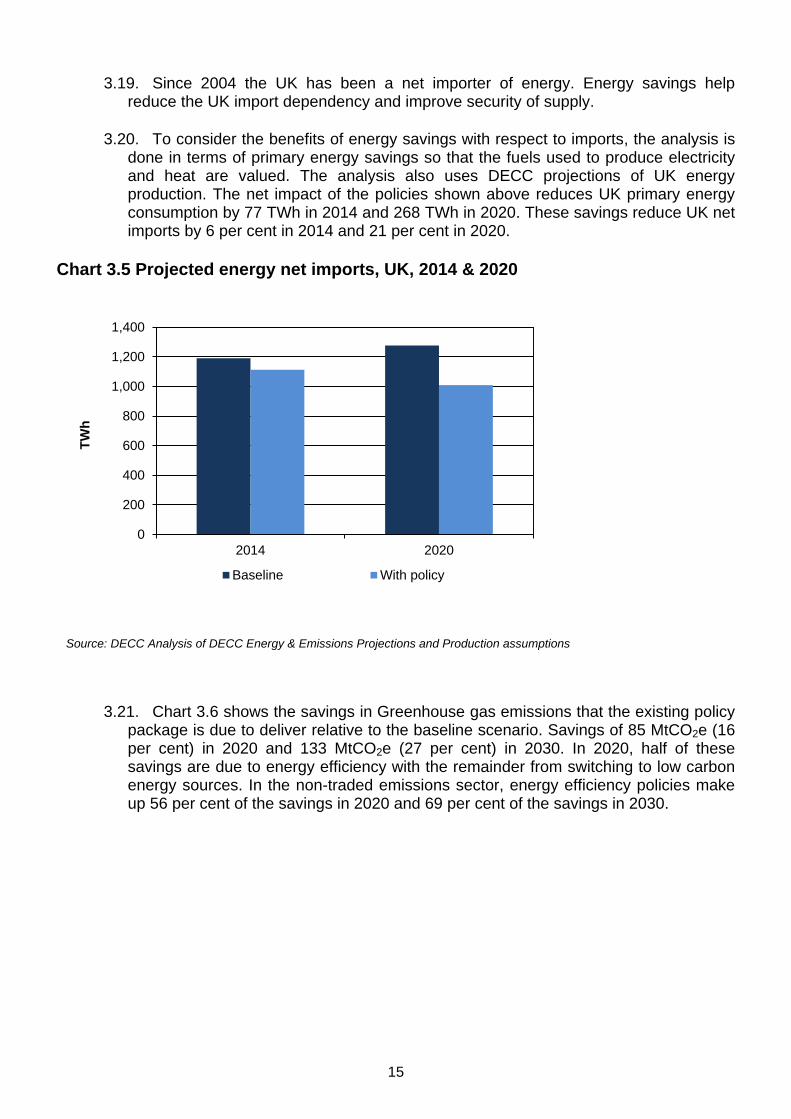
3.19. Since 2004 the UK has been a net importer of energy. Energy savings help reduce the UK import dependency and improve security of supply.
3.20. To consider the benefits of energy savings with respect to imports, the analysis is done in terms of primary energy savings so that the fuels used to produce electricity and heat are valued. The analysis also uses DECC projections of UK energy production. The net impact of the policies shown above reduces UK primary energy consumption by 77 TWh in 2014 and 268 TWh in 2020. These savings reduce UK net imports by 6 per cent in 2014 and 21 per cent in 2020.
Chart 3.5 Projected energy net imports, UK, 2014 & 2020
Source: DECC Analysis of DECC Energy & Emissions Projections and Production assumptions
3.21. Chart 3.6 shows the savings in Greenhouse gas emissions that the existing policy package is due to deliver relative to the baseline scenario. Savings of 85 MtCO2e (16 per cent) in 2020 and 133 MtCO2e (27 per cent) in 2030. In 2020, half of these savings are due to energy efficiency with the remainder from switching to low carbon energy sources. In the non-traded emissions sector, energy efficiency policies make up 56 per cent of the savings in 2020 and 69 per cent of the savings in 2030.
0
200
400
600
800
1,000
1,200
1,400
2014 2020
TW
h
Baseline With policy
16
Chart 3.6 Projected UK Greenhouse gas emissions with policy saving, 2010-203024,25
Source: DECC Energy & Emissions Projections 2014
24
DECC Energy & Emissions Projections 2014
http://www.decc.gov.uk/en/content/cms/about/ec_social_res/analytic_projs/en_emis_projs/en_emis_projs.aspx 25
UK Territorial emissions before trading of EU allowances
0
100
200
300
400
500
600
700
2010 2015 2020 2025 2030
MtC
O2
e
Non-CO2 Savings
Low CarbonSavings
Energy EfficiencySavings
Total Emissions
17
Chapter 4: Sectoral Indicators
4.1. Macro indicators, as used in Chapter 2, do not enable a complete understanding of changes to energy efficiency. Changes in energy intensity can shift due to changes in economic structure, or recession, as well as improved energy efficiency and therefore looking at individual sectors of the economy provides additional insight. Sectoral indicators have the advantage of being driven by a narrower range of energy uses and have stronger links to the drivers of energy use and efficiency.
Domestic
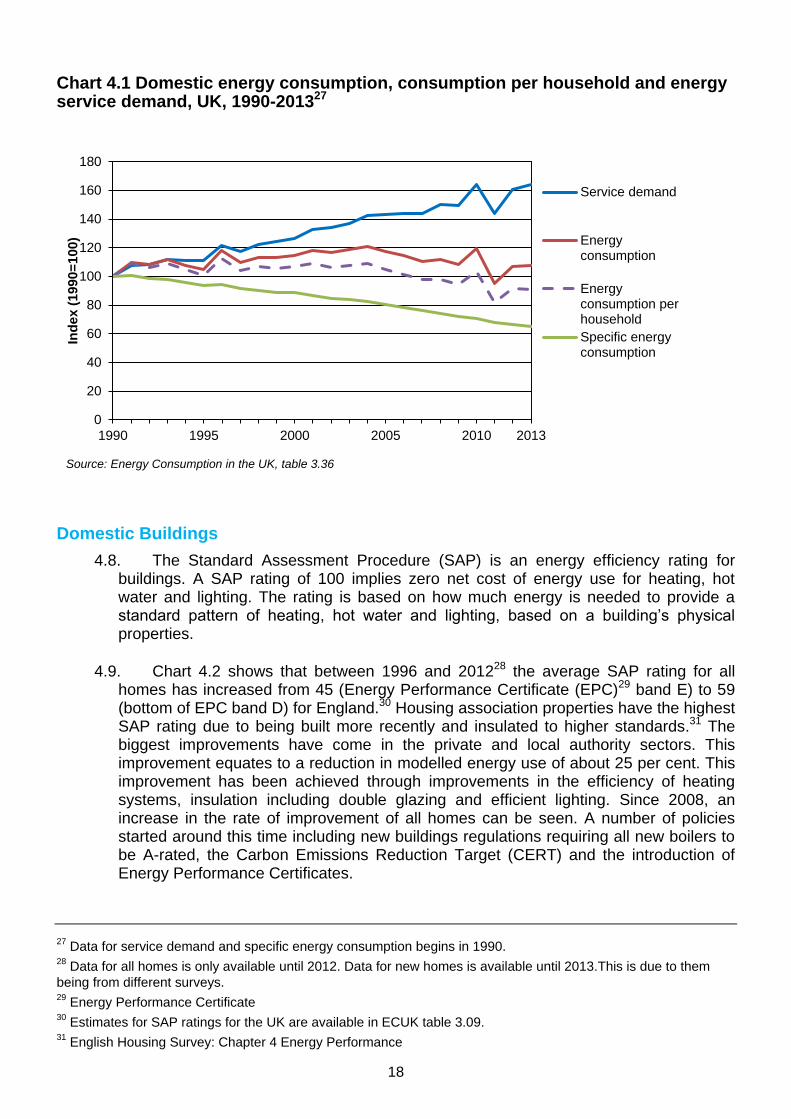
4.2. Chart 4.1 shows that domestic energy consumption per household rose by 9 per cent between 1990 and 2004. Since then it has fallen by 17 per cent and in 2013 was 9 per cent lower than 1990 levels.
4.3. In 2013, domestic energy consumption per household fell 1 per cent, while the external temperature in 2013 was 0.6 degrees Celsius colder than in 2012. Given a reduction in consumption was observed between the two years, despite cooler temperatures, this signals improvements in energy efficiency and energy usage. The peak energy consumption observed in 2010 was due to weather related effects.
4.4. Service demand is an indicator which captures the changes in energy use. The indicator models energy usage, which is affected by external and internal temperatures achieved and the number of households. Additional demand from lighting and appliances will also increase service demand.
4.5. Specific energy consumption is defined as the level of energy consumption needed for a unit of service demand. It gives a good indication of technical energy efficiency and accounts for improvements in building standards, the efficiency of heating systems, lighting and appliances. For example, since 1990 the number of home computers and laptops has increased by a factor of seven, whilst the number of televisions has almost doubled.26 While the energy consumption has increased, service demand has increased at a faster rate leading to a reduction in specific energy consumption.
4.6. While service demand is modelled to have risen by 64 per cent since 1990, energy consumption has risen by just 7 per cent, driving a reduction in specific energy consumption of one third. This equates to an average saving of 2 per cent per annum.
4.7. It should be noted that specific energy consumption measures technical energy efficiency savings. This does not capture savings due to changing behaviour, for example turning off lights in unoccupied rooms, reducing temperatures or not boiling excess water in a kettle.
26
Energy Consumption in the United Kingdom, table 3.12
18
Chart 4.1 Domestic energy consumption, consumption per household and energy service demand, UK, 1990-201327
Source: Energy Consumption in the UK, table 3.36
Domestic Buildings
4.8. The Standard Assessment Procedure (SAP) is an energy efficiency rating for buildings. A SAP rating of 100 implies zero net cost of energy use for heating, hot water and lighting. The rating is based on how much energy is needed to provide a standard pattern of heating, hot water and lighting, based on a building’s physical properties.
4.9. Chart 4.2 shows that between 1996 and 201228 the average SAP rating for all homes has increased from 45 (Energy Performance Certificate (EPC)29 band E) to 59 (bottom of EPC band D) for England.30 Housing association properties have the highest SAP rating due to being built more recently and insulated to higher standards.31 The biggest improvements have come in the private and local authority sectors. This improvement equates to a reduction in modelled energy use of about 25 per cent. This improvement has been achieved through improvements in the efficiency of heating systems, insulation including double glazing and efficient lighting. Since 2008, an increase in the rate of improvement of all homes can be seen. A number of policies started around this time including new buildings regulations requiring all new boilers to be A-rated, the Carbon Emissions Reduction Target (CERT) and the introduction of Energy Performance Certificates.
27
Data for service demand and specific energy consumption begins in 1990. 28
Data for all homes is only available until 2012. Data for new homes is available until 2013.This is due to them
being from different surveys. 29
Energy Performance Certificate 30
Estimates for SAP ratings for the UK are available in ECUK table 3.09. 31
English Housing Survey: Chapter 4 Energy Performance
0
20
40
60
80
100
120
140
160
180
1990 1995 2000 2005 2010 2013
Ind
ex
(1
99
0=
10
0)
Service demand
Energyconsumption
Energyconsumption perhousehold
Specific energyconsumption

19
4.10. There is still a significant gap between the modelled performance of all homes and new homes. New homes have an average SAP rating of 81 (bottom of EPC band B) in 2013. The most recent data for all homes is from 2012 and is a rating of 59, so based on the SAP model, new homes in 2013 would require less than half the energy than the average home to achieve the same level of energy service. Analysis from the National Energy Efficiency Data-framework has shown that the difference between old and new homes in actual energy consumption is much smaller with properties built post 2000 consuming just 17 per cent less gas than pre 1919 homes. 32 This difference is a result of the modelling assumptions for SAP and a variety of factors including different heating practices being undertaken in different households.
4.11. Of EPCs for new homes in 201433, 74 per cent are EPC bands A or B. This has increased from 58 per cent in 2008. Of the EPCs lodged for all homes to date in 2014, 7 per cent are in the highest energy efficiency categories and 6 per cent are rated in the lowest energy efficiency categories.34
Chart 4.2 Energy efficiency rating of homes in England, 1996-2013
Source: English Housing Survey (all homes) 1996-2012, Codes for sustainable homes and energy performance 2008-2013 35
(new homes), Department for Communities & Local Government
32
National Energy Efficiency Data-framework: Summary of analysis 2013 part 1.
http://www.decc.gov.uk/en/content/cms/statistics/energy_stats/en_effic_stats/need/need.aspx 33
To 30th October 2014, DCLG Live tables on Energy Performance of Buildings Certificates -
https://www.gov.uk/government/statistical-data-sets/live-tables-on-energy-performance-of-buildings-certificates 34
The lowest energy efficiency category is receiving an EPC rating of F or G. 35
Codes for sustainable homes and energy performance - https://www.gov.uk/government/statistics/code-for-
sustainable-homes-and-energy-performance-of-buildings-data-december-2013
0
10
20
30
40
50
60
70
80
90
100
1996 2000 2005 2010 2013
SA
P (
20
09
) R
ati
ng
New homes
All homes
20
Non-Domestic Buildings
4.12. All non-domestic buildings at the point of construction, sale or rent require a non-domestic Energy Performance Certificate and this is valid for 10 years. This analysis is based on a self-selecting sample and therefore is not fully representative of all non-domestic buildings. Since the scheme began in 2008, just over half a million non-domestic EPCs have been lodged.36 The energy efficiency rating for non-domestic buildings ranges from A+ to G.
4.13. Each year around 100,000 EPCs are issued. Therefore, chart 4.3 is a sample of non-domestic buildings assessed for that year.
4.14. All non-domestic EPCs come with a recommendation report that advises the owner how to increase energy efficiency. Any recommendations taken up would not be represented in these statistics.
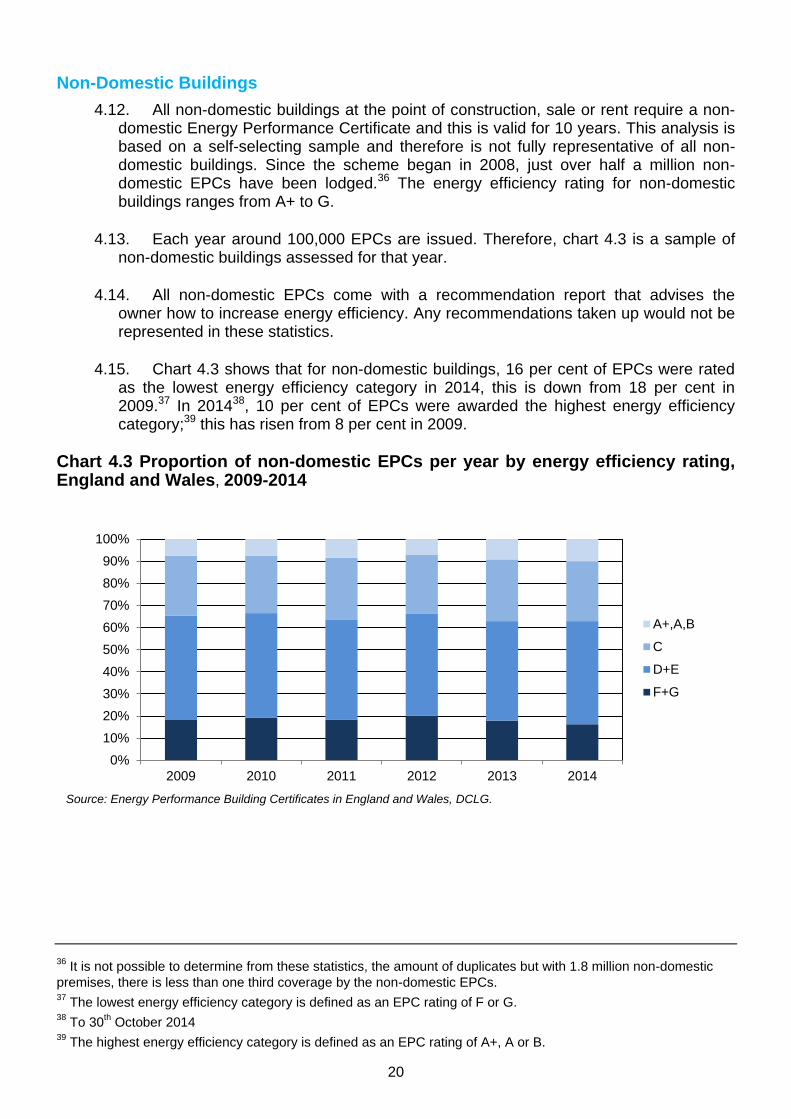
4.15. Chart 4.3 shows that for non-domestic buildings, 16 per cent of EPCs were rated as the lowest energy efficiency category in 2014, this is down from 18 per cent in 2009.37 In 201438, 10 per cent of EPCs were awarded the highest energy efficiency category;39 this has risen from 8 per cent in 2009.
Chart 4.3 Proportion of non-domestic EPCs per year by energy efficiency rating, England and Wales, 2009-2014
Source: Energy Performance Building Certificates in England and Wales, DCLG.
36
It is not possible to determine from these statistics, the amount of duplicates but with 1.8 million non-domestic
premises, there is less than one third coverage by the non-domestic EPCs. 37
The lowest energy efficiency category is defined as an EPC rating of F or G. 38
To 30th October 2014
39 The highest energy efficiency category is defined as an EPC rating of A+, A or B.
0%
10%
20%
30%
40%
50%
60%
70%
80%
90%
100%
2009 2010 2011 2012 2013 2014
A+,A,B
C
D+E
F+G
21
4.16. The evidence around energy use in non-domestic buildings is currently limited but DECC is running two major projects to improve the evidence in this sector. DECC has commissioned the Building Energy Efficiency Survey (BEES), a major research project to update the evidence of how energy is used in non-domestic buildings.40 Secondly, the National Energy Efficiency Data-framework (NEED) uses existing non-domestic consumption data to analyse energy usage in the non-domestic sector.41 This work will support evaluation and development of current and future energy efficiency policies, as well as improving the quality of the Government’s energy efficiency modelling.
40
DECC, Building Energy Efficiency Survey (BEES)
https://www.gov.uk/government/collections/non-domestic-buildings-energy-use-project 41
DECC, Non-domestic National Energy Efficiency Data-framework (ND NEED)
https://www.gov.uk/government/collections/national-energy-efficiency-data-need-framework
22
Industrial Sector
4.17. Energy efficiency in industry focuses on maximising the amount of production which can be achieved from each unit of energy. Energy is a key input and cost for many industries.
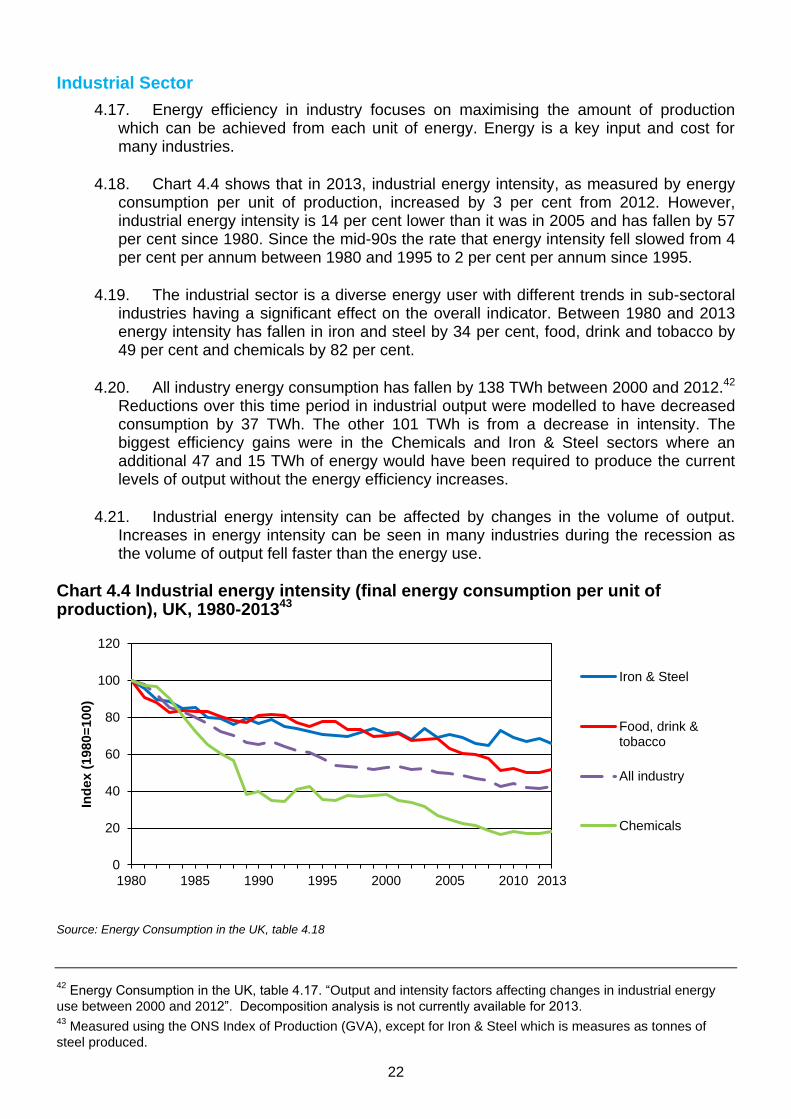
4.18. Chart 4.4 shows that in 2013, industrial energy intensity, as measured by energy consumption per unit of production, increased by 3 per cent from 2012. However, industrial energy intensity is 14 per cent lower than it was in 2005 and has fallen by 57 per cent since 1980. Since the mid-90s the rate that energy intensity fell slowed from 4 per cent per annum between 1980 and 1995 to 2 per cent per annum since 1995.
4.19. The industrial sector is a diverse energy user with different trends in sub-sectoral industries having a significant effect on the overall indicator. Between 1980 and 2013 energy intensity has fallen in iron and steel by 34 per cent, food, drink and tobacco by 49 per cent and chemicals by 82 per cent.
4.20. All industry energy consumption has fallen by 138 TWh between 2000 and 2012.42 Reductions over this time period in industrial output were modelled to have decreased consumption by 37 TWh. The other 101 TWh is from a decrease in intensity. The biggest efficiency gains were in the Chemicals and Iron & Steel sectors where an additional 47 and 15 TWh of energy would have been required to produce the current levels of output without the energy efficiency increases.
4.21. Industrial energy intensity can be affected by changes in the volume of output. Increases in energy intensity can be seen in many industries during the recession as the volume of output fell faster than the energy use.
Chart 4.4 Industrial energy intensity (final energy consumption per unit of production), UK, 1980-201343
Source: Energy Consumption in the UK, table 4.18
42
Energy Consumption in the UK, table 4.17. “Output and intensity factors affecting changes in industrial energy
use between 2000 and 2012”. Decomposition analysis is not currently available for 2013. 43
Measured using the ONS Index of Production (GVA), except for Iron & Steel which is measures as tonnes of
steel produced.
0
20
40
60
80
100
120
1980 1985 1990 1995 2000 2005 2010 2013
Ind
ex
(1
98
0=
10
0)
Iron & Steel
Food, drink &tobacco
All industry
Chemicals
23
Service Sector
4.22. The service sector consists of commercial and public sector services and is dominated by the energy uses associated with non-domestic buildings.
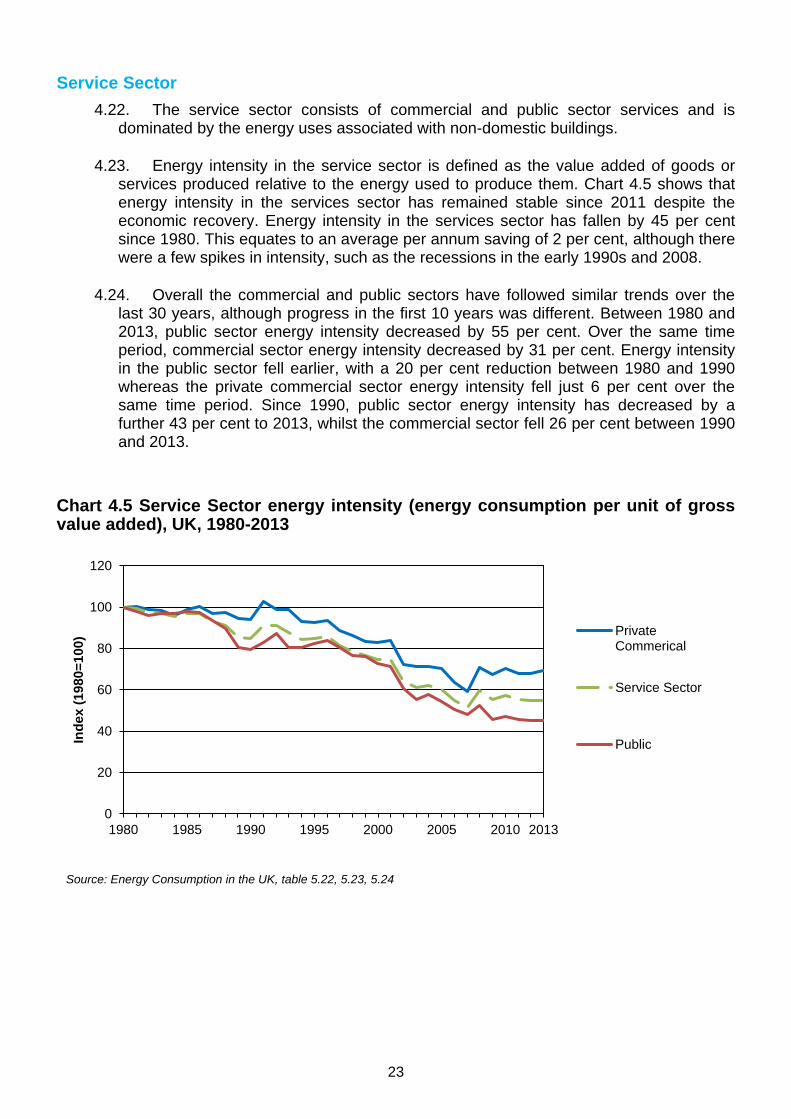
4.23. Energy intensity in the service sector is defined as the value added of goods or services produced relative to the energy used to produce them. Chart 4.5 shows that energy intensity in the services sector has remained stable since 2011 despite the economic recovery. Energy intensity in the services sector has fallen by 45 per cent since 1980. This equates to an average per annum saving of 2 per cent, although there were a few spikes in intensity, such as the recessions in the early 1990s and 2008.
4.24. Overall the commercial and public sectors have followed similar trends over the last 30 years, although progress in the first 10 years was different. Between 1980 and 2013, public sector energy intensity decreased by 55 per cent. Over the same time period, commercial sector energy intensity decreased by 31 per cent. Energy intensity in the public sector fell earlier, with a 20 per cent reduction between 1980 and 1990 whereas the private commercial sector energy intensity fell just 6 per cent over the same time period. Since 1990, public sector energy intensity has decreased by a further 43 per cent to 2013, whilst the commercial sector fell 26 per cent between 1990 and 2013.
Chart 4.5 Service Sector energy intensity (energy consumption per unit of gross value added), UK, 1980-2013
Source: Energy Consumption in the UK, table 5.22, 5.23, 5.24
0
20
40
60
80
100
120
1980 1985 1990 1995 2000 2005 2010 2013
Ind
ex
(1
98
0=
10
0) Private
Commerical
Service Sector
Public
24
Transport sector
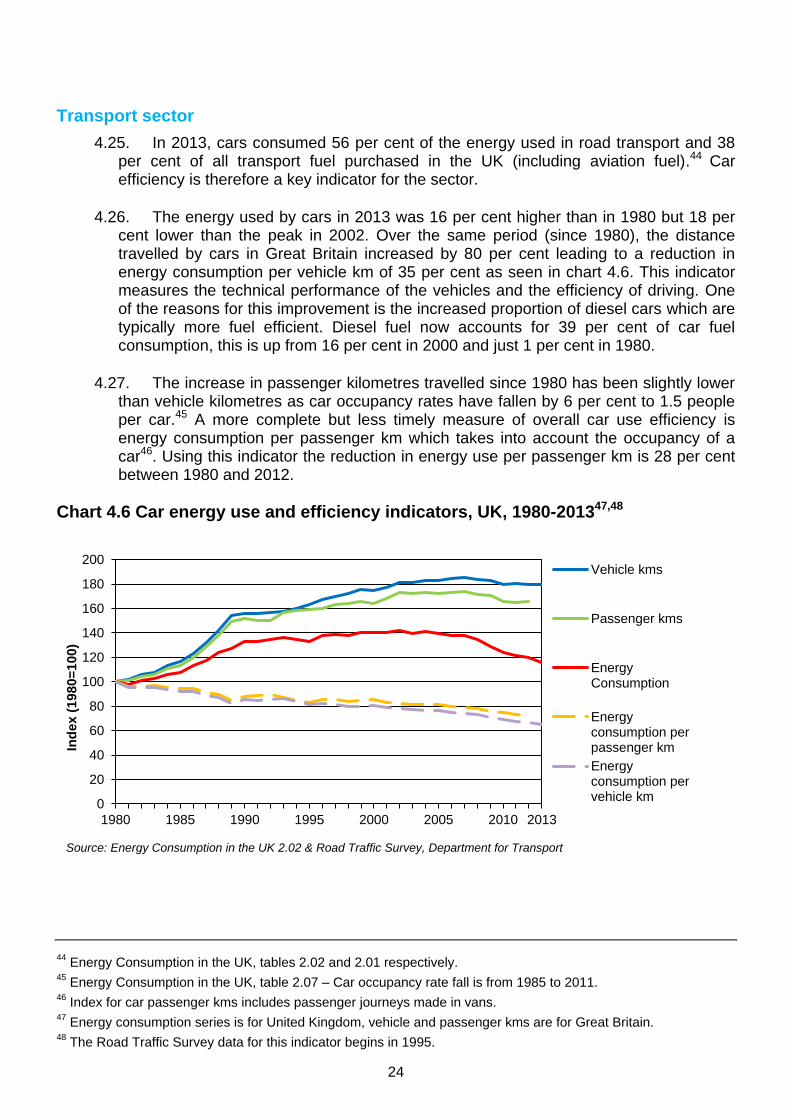
4.25. In 2013, cars consumed 56 per cent of the energy used in road transport and 38 per cent of all transport fuel purchased in the UK (including aviation fuel).44 Car efficiency is therefore a key indicator for the sector.
4.26. The energy used by cars in 2013 was 16 per cent higher than in 1980 but 18 per cent lower than the peak in 2002. Over the same period (since 1980), the distance travelled by cars in Great Britain increased by 80 per cent leading to a reduction in energy consumption per vehicle km of 35 per cent as seen in chart 4.6. This indicator measures the technical performance of the vehicles and the efficiency of driving. One of the reasons for this improvement is the increased proportion of diesel cars which are typically more fuel efficient. Diesel fuel now accounts for 39 per cent of car fuel consumption, this is up from 16 per cent in 2000 and just 1 per cent in 1980.
4.27. The increase in passenger kilometres travelled since 1980 has been slightly lower than vehicle kilometres as car occupancy rates have fallen by 6 per cent to 1.5 people per car.45 A more complete but less timely measure of overall car use efficiency is energy consumption per passenger km which takes into account the occupancy of a car46. Using this indicator the reduction in energy use per passenger km is 28 per cent between 1980 and 2012.
Chart 4.6 Car energy use and efficiency indicators, UK, 1980-201347,48
Source: Energy Consumption in the UK 2.02 & Road Traffic Survey, Department for Transport
44
Energy Consumption in the UK, tables 2.02 and 2.01 respectively. 45
Energy Consumption in the UK, table 2.07 – Car occupancy rate fall is from 1985 to 2011. 46
Index for car passenger kms includes passenger journeys made in vans. 47
Energy consumption series is for United Kingdom, vehicle and passenger kms are for Great Britain. 48
The Road Traffic Survey data for this indicator begins in 1995.
0
20
40
60
80
100
120
140
160
180
200
1980 1985 1990 1995 2000 2005 2010 2013
Ind
ex
(1
98
0=
10
0)
Vehicle kms
Passenger kms
EnergyConsumption
Energyconsumption perpassenger km
Energyconsumption pervehicle km

25
For more information on domestic and non-domestic energy efficiency please see the following Department of Energy and Climate Change publications.
Energy Consumption in the UK - a comprehensive review of energy consumption and changes in efficiency, intensity and output since the 1970s for the UK.
https://www.gov.uk/government/collections/energy-consumption-in-the-uk
The National Energy Efficiency Data Framework – analysis of domestic and non-domestic energy efficiency at a sub-national level looking at consumption and efficiency of dwellings and buildings and the characteristics of these.
https://www.gov.uk/government/publications/national-energy-efficiency-data-need-report-summary-of-analysis
Energy Sector Indicators – Indicators of the energy sector covering economic, supply, prices and environmental indicators.
https://www.gov.uk/government/collections/uk-energy-sector-indicators
Energy Trends – A quarterly publication containing headline energy and feature articles on a range of energy topics.
https://www.gov.uk/government/collections/energy-trends
26
Appendix A – Data Sources & Unit Conversion
The Energy Efficiency Statistical Summary uses a range of sources, this annex provides a brief description of each of the key data sources and where they can be found. Unit conversion has taken place on some of the data and there is a short note addressing this in the annex.
Data Sources
Energy Consumption in the UK - Energy consumption in the United Kingdom’ is an annual statistical publication providing a comprehensive review of energy consumption and changes in efficiency, intensity and output since the 1970s. As well as covering statistics across the UK, Energy Consumption in the UK reports energy consumption statistics by four sectors – the transport, domestic, industrial and services sectors.https://www.gov.uk/government/collections/energy-consumption-in-the-uk
DECC Energy and Emissions Projections – The DECC Energy and Emissions projections publication is an annual publication of projections for future energy use and greenhouse gas emissions in the UK. The projections are based on assumptions of future economic growth, fossil fuel prices, electricity generation costs, UK population and other key variables regularly updated. Each set of projections takes account of climate change policies where funding has been agreed and where decisions on policy design are sufficiently advanced to allow robust estimates of policy impacts to be made. https://www.gov.uk/government/collections/energy-and-emissions-projections
English Housing Survey & Codes for sustainable homes and energy performance – The English Housing Survey and the Codes for sustainable homes and energy performance are publications by the Department for Communities and Local Government. These focus on household characteristics and home energy performance. https://www.gov.uk/government/organisations/department-for-communities-and-local-government/about/statistics
International Energy Agency - The International Energy Agency annually publishes energy statistics in a comparative format for most countries in the world. Figures have been obtained from the IEA database. http://data.iea.org/IEASTORE/DEFAULT.ASP
The Office for National Statistics Blue Book - The Blue Book is an annual publication of the full set of economic accounts, or National Accounts, for the United Kingdom. These accounts are compiled by the Office for National Statistics. They record and describe economic activity in the United Kingdom and as such are used to support the formulation and monitoring of economic and social policies. http://www.ons.gov.uk/ons/rel/naa1-rd/united-kingdom-national-accounts/the-blue-book--2013-edition/index.html
Transport Statistics GB & the Road Traffic Survey - Transport Statistics Great Britain (TSGB) is the Department for Transport’s main statistical compendium publication. It describes the major statistical trends in the British transport sector. The Road Traffic Survey provides estimates of the vehicle miles travelled each year in Great Britain, by vehicle type, road category and region. https://www.gov.uk/government/organisations/department-for-transport/about/statistics
ODYSSEE-MURE -. The ODYSSEE-MURE project is a European Commission supported project made up of partners from EU Member States together with Norway to produce detailed energy efficiency indicators for European countries. The majority of European Union (EU) countries have data covering at least 2000 to 2012. However, in some cases a country will not

27
have 2012 data available yet so in this case 2011 data has been used. If a country is not displayed on a cross-European chart, it is because that country does not have data for that indicator.
Unit Conversion Data published in the Energy Consumption in the UK and Energy and Emissions Projections publications are often published in tonnes of oil equivalent (toe). The Energy Efficiency Deployment Office publishes figures in (kilo or terra) watt hours (kWh or TWh) as standard. The Digest of United Kingdom Energy Statistics, Annex A, details the conversion factors to achieve this. 1 tonne of oil equivalent = 11,630 kWh https://www.gov.uk/government/uploads/system/uploads/attachment_data/file/338752/Annex_A.pdf
Gross and Net Calorific Values DECC publications use the gross calorific values of fuels unless otherwise stated. Many EU publications use the net calorific value as standard (see footnote 17). The energy content of a fuel can be measured as the heat released on complete combustion. The SI (Système International) derived unit of energy and heat is the Joule. This is the energy in a given quantity of the fuel and is often measured in GJ per tonne. The energy content can be expressed as an upper (or gross) value and a lower (or net) value. The difference between the two values is due to the release of energy from the condensation of water in the products of combustion. Gross calorific values are used throughout this publication.

28
© Crown copyright 2015
Department of Energy & Climate Change
3 Whitehall Place
London SW1A 2AW
www.gov.uk/decc
URN: 14D/436