Energy Efficiency Policy in Technical Report - NREL · Technical Report . NREL/TP-6A2-46532 ....
63
Technical Report NREL/TP-6A2-46532 December 2009 Energy Efficiency Policy in the United States: Overview of Trends at Different Levels of Government Elizabeth Doris, Jaquelin Cochran, and Martin Vorum
-
Upload
truongtruc -
Category
Documents
-
view
218 -
download
0
Transcript of Energy Efficiency Policy in Technical Report - NREL · Technical Report . NREL/TP-6A2-46532 ....
Technical Report NREL/TP-6A2-46532 December 2009
Energy Efficiency Policy in the United States: Overview of Trends at Different Levels of Government Elizabeth Doris, Jaquelin Cochran, and Martin Vorum

National Renewable Energy Laboratory 1617 Cole Boulevard, Golden, Colorado 80401-3393 303-275-3000 • www.nrel.gov
NREL is a national laboratory of the U.S. Department of Energy Office of Energy Efficiency and Renewable Energy Operated by the Alliance for Sustainable Energy, LLC
Contract No. DE-AC36-08-GO28308
Technical Report NREL/TP-6A2-46532 December 2009
Energy Efficiency Policy in the United States: Overview of Trends at Different Levels of Government Elizabeth Doris, Jaquelin Cochran, and Martin Vorum Prepared under Task No. IGIN.7500

NOTICE This report was prepared as an account of work sponsored by an agency of the United States government. Neither the United States government nor any agency thereof, nor any of their employees, makes any warranty, express or implied, or assumes any legal liability or responsibility for the accuracy, completeness, or usefulness of any information, apparatus, product, or process disclosed, or represents that its use would not infringe privately owned rights. Reference herein to any specific commercial product, process, or service by trade name, trademark, manufacturer, or otherwise does not necessarily constitute or imply its endorsement, recommendation, or favoring by the United States government or any agency thereof. The views and opinions of authors expressed herein do not necessarily state or reflect those of the United States government or any agency thereof.
Available electronically at http://www.osti.gov/bridge
Available for a processing fee to U.S. Department of Energy and its contractors, in paper, from:
U.S. Department of Energy Office of Scientific and Technical Information P.O. Box 62 Oak Ridge, TN 37831-0062 phone: 865.576.8401 fax: 865.576.5728 email: mailto:[email protected]
Available for sale to the public, in paper, from: U.S. Department of Commerce National Technical Information Service 5285 Port Royal Road Springfield, VA 22161 phone: 800.553.6847 fax: 703.605.6900 email: [email protected] online ordering: http://www.ntis.gov/ordering.htm
Printed on paper containing at least 50% wastepaper, including 20% postconsumer waste

iii
Abstract This report catalogs by sector—buildings, transportation, industrial, and power—energy efficiency policies at the federal, state, and local levels, and identifies some prominent policy trends. Four key findings emerged from this report: 1) leadership on energy efficiency is necessary—and is found—at each level of government; 2) there is no widely accepted methodology for evaluating energy efficiency policies; 3) coordination among the three levels of government—and across sectors—is increasingly important, and there are opportunities to significantly improve policy performance through a unified strategy; and 4) there are efficiencies to be gained by informing policies in one sector with experience from others.
Acknowledgments This work is made possible by the U.S. Department of Energy. For their review of this report, the authors wish to thank John Barnett, Ron Benioff, Misty Conrad, David Kline, Jeff Logan, and Todd Ramsden of NREL; Mirium Pye of NYSERDA; and Bond Calloway, Dennis Griffith, and an anonymous reviewer from the American Institute of Chemical Engineers. We are also thankful for the technical editing of Julie Tuttle in NREL’s Communications Office. Any remaining errors, of course, are the responsibility of the authors.

iv
Acronyms and Abbreviations ARRA 2009 American Recovery and Reinvestment Act of 2009 ACEEE American Council for an Energy-Efficient Economy AFV alternative-fuel vehicles ASHRAE American Society of Heating, Refrigerating, and Air Conditioning
Engineering ATV advanced technology vehicle BETC Business Energy Tax Credit BTU British thermal unit CAFE Corporate Average Fuel Economy DOE U.S. Department of Energy DSIRE Database of State Incentives for Renewables and Efficiency EISA 2007 Energy Independence and Security Act EPA U.S. Environmental Protection Agency EPAct05 Energy Policy Act (II) EPAct92 Energy Policy Act (I) EPCA Energy Policy and Conservation Act FEMP Federal Energy Management Program GDP gross domestic product GGE gallons of gasoline equivalents HEV hybrid electric vehicle HOV high occupancy vehicle HTS high-temperature superconductivity HVAC heating, ventilation, and air conditioning IAC Department of Energy Industrial Assessment Centers IECC International Energy Conservation Code IOU investor-owned utility LEED Leadership in Energy and Environmental Design mpg miles per gallon MWh megawatt-hours NAECA National Appliance Energy Conservation Act NECPA National Energy Conservation and Policy Act NHTSA National Highway Traffic Safety Administration PBF public benefits funds PURPA Public Utility Regulatory Act of 1978 R&D research and development REAP U.S. Department of Agriculture’s Rural Energy for America Program SBC systems benefit charge SEP State Energy Program SMUD Sacramento Municipal Utility District USDA United States Department of Agriculture VALE Voluntary Airport Low Emission WAP Weatherization Assistance Program

v
Executive Summary The benefits of energy efficiency are manifold—lower energy bills, improved air quality, reduced greenhouse gases, increased energy security, and a deferred need to invest in new infrastructure. Numerous studies document the prevalence of economically attractive, energy-saving opportunities that have yet to be widely adopted (McKinsey 2009, APS 2008, IEA 2009, IPCC 2007, Gigaton Throwdown 2009, UNEP 2007, WBCSD 2009). The failure to implement these opportunities indicates persistent market and other barriers to efficiency. Government policies should be designed to target these barriers and enable the benefits of energy efficiency to be realized.
This report catalogues by sector—buildings, transportation, industrial, and power—energy efficiency policies at the federal, state, and local levels, and, where discernable, identifies policy trends. Four key findings emerged from this report:
1. Leadership on energy efficiency is necessary—and is found—at each level of government.
Policies initiated at state and local levels, within diverse political and economic contexts, can inform how similar policies can be employed and scaled-up in other places and jurisdictions. California, for example, has repeatedly designed efficiency programs that have served as models elsewhere. Federal leadership is also key, not only for the benefit of consumers and manufacturers, but also to provide the impetus for the country as a whole to realize its energy efficiency potential—to improve the economy, environment, and national security.
2. There is no widely accepted methodology for evaluating energy efficiency policies.
Measuring policy impact is critical for evaluating the effectiveness of policies at all levels of government. But such measurement is difficult due to the overlapping nature of policy implementation, the lack of coordination of intended impacts, and the challenge of calculating and attributing whether actual energy savings result from a particular policy.
3. Coordination among the three levels of government—and across sectors—is increasingly important, and there are opportunities to significantly improve policy performance through a unified strategy.
There is currently no comprehensive policy strategy for energy efficiency in the United States. Policies are conceived within narrow political constraints based on some specific need, and without a thorough consideration of the policies’ interaction with other policies. A strategic approach to improving energy efficiency in the United States would coordinate efforts across jurisdictions and sectors, as occurred under the National Action Plan for Energy Efficiency.
4. There are efficiencies to be gained by informing policies in one sector with experience from others.
In each sector, similar energy policy tools are employed—baseline standards, beyond-baseline incentives, labeling, technical assistance, and public leadership—but the relative use of each tool within overall policy varies significantly by sector. These differences reflect a number of factors, including the relative strengths of governing jurisdictions, political expediency, and technological and economic limitations. A more effective policy approach would find ways to move beyond these established constraints toward a comprehensive assessment of energy efficiency barriers and the policies needed to address them.

vi
Table of Contents Abstract ........................................................................................................................................................ iii Acknowledgments ........................................................................................................................................ iii Acronyms and Abbreviations ...................................................................................................................... iv Executive Summary ...................................................................................................................................... v Table of Contents ......................................................................................................................................... vi Table of Tables and Figures ........................................................................................................................ vii 1 Introduction: The Role of Jurisdiction Level in Targeting Energy Efficiency Improvements............. 1 2 Buildings .............................................................................................................................................. 5
2.1 Building codes ............................................................................................................................. 7 2.2 Appliance Standards .................................................................................................................. 12 2.3 Labeling and Education ............................................................................................................. 14 2.4 Financial Incentives ................................................................................................................... 14 2.5 Research and Development ....................................................................................................... 19
3 Transportation Sector ......................................................................................................................... 20
3.1 Fuel Efficiency Standards .......................................................................................................... 21 3.2 Labeling and Consumer Education ............................................................................................ 24 3.3 Incentives ................................................................................................................................... 24 3.4 Technical Assistance ................................................................................................................. 26 3.5 Urban Planning and Behavior Change ...................................................................................... 28 3.6 Research and Development ....................................................................................................... 29
4 Industrial Sector ................................................................................................................................. 30
4.1 Incentives ................................................................................................................................... 30 4.2 Technical Assistance ................................................................................................................. 33 4.3 Research and Development ....................................................................................................... 34
5 Power Sector ...................................................................................................................................... 35
5.1 Incentives ................................................................................................................................... 36 5.2 Research and Development ....................................................................................................... 41
6 Discussion: Trends in Energy Efficiency Policy Development ......................................................... 42
Appendix A: Statewide Building Code Status ................................................................................... 44 Appendix B: State Incentives and Regulations in the Transportation Sector..................................... 46
References ................................................................................................................................................... 50

vii
Table of Tables and Figures Table 1: Strengths and Challenges to Legislating and Regulating Energy Efficiency
at Each Jurisdictional Level .......................................................................................................... 1
Table 2: Prominent Jurisdictional Drivers .................................................................................................. 3
Table 3: Map of Building Code Policies to Jurisdiction ............................................................................. 6
Table 4: Summary of Local Government (County, City, Township) Requirements for LEED Certification (Encouragement or Requirement) ......................................................... 10
Table 5: Summary of Local Government (County, City, Township) Incentives for LEED Certification ............................................................................................................... 10
Table 6: Legislation Relating to Federal Standard Setting for Energy Efficiency ................................... 12
Table 7: Non-R&D Financial Incentives for Energy Efficiency by Sector Type and Date of Availability .................................................................................................... 16
Table 8: State Public Benefit Funds with Effective Dates and Estimated Funding .................................. 17
Table 9: Map of Transportation Policies to Jurisdiction ........................................................................... 21
Table 10: Federal Efficiency Standards, Including Lead by Example Fleet Purchasing Requirements ..... 22
Table 11: Federal Tax Incentives Related to Energy in the Transportation Sector .................................... 25
Table 12: Federal Technical Assistance Programs in the Transportation Sector ........................................ 27
Table 13: Map of Industrial Energy Efficiency Policies to Jurisdiction ..................................................... 30
Table 14: States with Industrial Sector Incentives ...................................................................................... 31
Table 15: Program Funding with Industry Applicability ............................................................................ 32
Table 16: Map of Utility-based Energy Efficiency Policies by Jurisdiction .............................................. 35
Table 17: Federal Regulations related to Energy in the Power Sector ....................................................... 39 Figure 1: Energy Intensity Indicator by Sector 1985-200 (Source: EERE 2009b) ...................................... 4
Figure 2: California per capita electricity consumption relative .................................................................. 7
Figure 3: Residential Energy Code Status (July 2009) ................................................................................ 8
Figure 4: Commercial Energy Code Status (July 2009) ............................................................................... 9
Figure 5: California's annual energy savings from efficiency programs and standards (Source: Rosenfeld 2008) ........................................................................................... 11
Figure 6: Impact of national and state appliance standards on energy ....................................................... 13
Figure 7: Electric Decoupling Activities in the United States as of May 2009 ......................................... 40
1
1 Introduction: The Role of Jurisdiction Level in Targeting Energy Efficiency Improvements
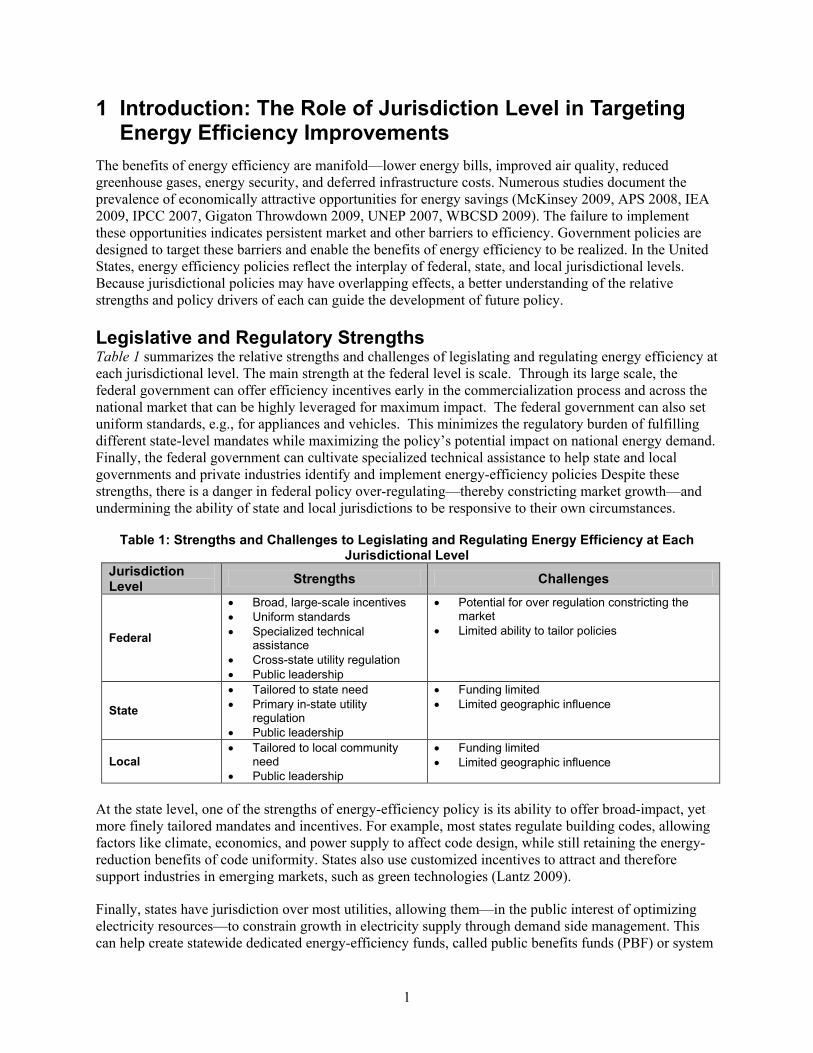
The benefits of energy efficiency are manifold—lower energy bills, improved air quality, reduced greenhouse gases, energy security, and deferred infrastructure costs. Numerous studies document the prevalence of economically attractive opportunities for energy savings (McKinsey 2009, APS 2008, IEA 2009, IPCC 2007, Gigaton Throwdown 2009, UNEP 2007, WBCSD 2009). The failure to implement these opportunities indicates persistent market and other barriers to efficiency. Government policies are designed to target these barriers and enable the benefits of energy efficiency to be realized. In the United States, energy efficiency policies reflect the interplay of federal, state, and local jurisdictional levels. Because jurisdictional policies may have overlapping effects, a better understanding of the relative strengths and policy drivers of each can guide the development of future policy. Legislative and Regulatory Strengths Table 1 summarizes the relative strengths and challenges of legislating and regulating energy efficiency at each jurisdictional level. The main strength at the federal level is scale. Through its large scale, the federal government can offer efficiency incentives early in the commercialization process and across the national market that can be highly leveraged for maximum impact. The federal government can also set uniform standards, e.g., for appliances and vehicles. This minimizes the regulatory burden of fulfilling different state-level mandates while maximizing the policy’s potential impact on national energy demand. Finally, the federal government can cultivate specialized technical assistance to help state and local governments and private industries identify and implement energy-efficiency policies Despite these strengths, there is a danger in federal policy over-regulating—thereby constricting market growth—and undermining the ability of state and local jurisdictions to be responsive to their own circumstances.
Table 1: Strengths and Challenges to Legislating and Regulating Energy Efficiency at Each Jurisdictional Level
Jurisdiction Level Strengths Challenges
Federal
• Broad, large-scale incentives • Uniform standards • Specialized technical
assistance • Cross-state utility regulation • Public leadership
• Potential for over regulation constricting the market
• Limited ability to tailor policies
State
• Tailored to state need • Primary in-state utility
regulation • Public leadership
• Funding limited • Limited geographic influence
Local • Tailored to local community
need • Public leadership
• Funding limited • Limited geographic influence
At the state level, one of the strengths of energy-efficiency policy is its ability to offer broad-impact, yet more finely tailored mandates and incentives. For example, most states regulate building codes, allowing factors like climate, economics, and power supply to affect code design, while still retaining the energy-reduction benefits of code uniformity. States also use customized incentives to attract and therefore support industries in emerging markets, such as green technologies (Lantz 2009).
Finally, states have jurisdiction over most utilities, allowing them—in the public interest of optimizing electricity resources—to constrain growth in electricity supply through demand side management. This can help create statewide dedicated energy-efficiency funds, called public benefits funds (PBF) or system

2
benefit charges (SBC). These PBFs, derived from utility bills, offer stability to state funding of energy efficiency and demonstrate a state commitment to energy efficiency as a resource, which can in turn reduce long-term risks to private-sector investors in efficient technologies.
Local governments are constrained by their more limited geographic jurisdiction and smaller budgets, but are able to fine-tune policies to the specific needs of the community. For example, most localities have jurisdiction over zoning, planning, and building permits, and can directly impact and respond to the needs and environment of local residents and businesses. Local governments also remain key partners in the implementation of federal and state efficiency policies. Because of their direct knowledge and access to community-level input, local governments have a relative advantage in implementing certain federal and state mandates, e.g., rerouting school bus routes to reduce engine idling.
The primary area of overlap where all levels of government are well positioned to promote energy efficiency and expand the market for efficient technologies is to lead by example through specific programs, acquisition practices, and public advocacy. Establishing aggressive efficiency standards for buildings and vehicles not only saves energy within each jurisdiction, but also establishes a market for emerging technologies and educates the public about the existence and benefits of these efficient technologies.
Policy Drivers The key policy drivers for energy efficiency—economic development, environment, energy security—transcend jurisdictional level but vary in their manifestation (Table 2). For example, all three levels of government work to improve air quality, but they address this concern in different ways. Similarly, energy security is a goal at each jurisdictional level, but while the federal government focuses on vehicle efficiency, local governments are more likely to promote fuel diversity. At each jurisdictional level there is an inherent tension between leveraging investment and tailoring policy—a trade-off that helps to shape each jurisdiction’s approach to policy design. There is a consonance among policy goals at all three levels, with each jurisdiction focusing its operations on its own unique geographical scope. Understanding how the policies interact and can contribute to a comprehensive efficiency policy is critical to developing a plan to reduce energy consumption. This report provides a sector-by-sector review of historical and current policies, with a specific focus on how each jurisdiction adapts general policy tools (e.g., standards, financial incentives) to reflect its relative strengths and policy focus.
Challenges in Measuring Policy Impact Measuring policy impact is critical for evaluating the effectiveness of policies at different jurisdictional levels. This is difficult due to the overlapping nature of policy implementation, the lack of coordination of intended impacts, and the challenge of calculating and attributing energy savings to a particular policy. Additionally, some policies that result in energy savings are primarily targeted at economic development, e.g., rebates for energy efficient appliances or vehicles that are designed to drive retail sales and boost manufacturing. The policy impacts may be measured against the economic goals (e.g., number of appliances sold), rather than energy savings.
A further complication in accurately measuring policy impact is changes in energy use that result from non-policy factors, e.g., economic context, weather, and technological advancement. Separating these ancillary impacts from the effectiveness of the policy requires an extensive understanding of the economy and weather systems, and often must be done in retrospect, when the policy can be evaluated under a variety of different contexts. Because most individual policies are responsible for only a small fraction of

3
changes in energy efficiency, and are not planned with funding for extensive evaluation, very few reviews of this nature are available.1
Table 2: Prominent Jurisdictional Drivers
Jurisdiction Drivers Ability to leverage
investment Ability to
tailor policy
Federal
Economic Development • Support broad economic growth Environmental Protection • Protect public health • Reduce carbon emissions Energy Security • Reduce dependence on oil • Maintain reliability of grid infrastructure
High Low
State
Economic Development • Attract jobs and industry • Improve power-supply reliability • Reduce need for large-scale capital
investments in power supply • Reduce consumer energy bills Environmental Protection • Improve regional air quality • Reduce carbon emissions Energy Security • Fuel diversity (electric and transport) • Price stability
Medium Medium
Local
Economic Development • Foster local economic development • Reduce traffic Environmental Protection • Improve local air quality Energy Security • Fuel diversity (electric and transport)
Low High
Source: Brown and Mosey 2008 In aggregate, energy efficiency improvements are measured through changes in energy intensity in each sector, which is total U.S. energy consumption per dollar of gross domestic product (GDP). In this method, lower energy intensity is equated to improved energy efficiency.2
1 A forthcoming National Academy of Sciences study reviews impacts of energy efficiency policies on energy consumption, but no widely accepted methodology is consistently applied to efficiency policy evaluations.
The method does not attempt to measure policy impacts, but instead reflects changes in energy use relative to changes in the economy. Since 1985, energy intensity in the United States has decreased, representing both structural changes and
2 Lower energy intensity does not necessarily equal reductions in energy use.

4
an increasingly energy efficient economy (Figure 1). This metric, however, is general, and does not identify the sources of the increased efficiency. 3
The strength of energy intensity data, however, is that it accounts for both economic development and energy reductions.
Figure 1: Energy Intensity Indicator by Sector 1985-200 (Source: EERE 2009b)
At state and local levels, policies are evaluated to the extent that jurisdictions have the interest and financial capability to do so. These evaluations are generally focused on the ancillary benefits of energy savings, e.g., job creation, electricity prices, and environmental impacts. Typically, modeled energy savings (as opposed to actual savings) are the basis for these evaluations. While these evaluations of investment effectiveness are of high value to the jurisdiction, aggregating the impact of these policies on energy use and intensity at the national level is not possible through such diverse methodologies.4
In each of the sector descriptions, evaluations are presented where available and applicable, recognizing that currently there is no widely accepted methodology for evaluating programs across policies and jurisdictions.
3 Likewise, energy consumption per capita is another broad, but crude, measurement of efficiency. 4 Developing a regional- or national-scale energy savings model would facilitate evaluation of the large-scale energy efficiency benefits of local and state programs.

5
2 Buildings Buildings consume 40% of U.S. primary energy, including 72% of U.S. electricity consumption and 36% of natural gas consumption (EERE 2008). The building sector drives the growth for new power plants—87% of the growth in electricity sales between 1985 and 2006 is attributable to building sector demand (Ibid). Successfully implementing legislation that targets building design and appliance performance can directly reduce this demand. To increase the use of energy-efficient technologies in buildings, the five policy types most frequently employed are:
1. Building codes, which, by addressing design, affect long-term energy demands
2. Appliance standards, which mandate minimum levels of efficiency of appliances
3. Labels and consumer information, which provide consumers information on long-term energy consumption of appliances and buildings
4. Incentives, both financial and non-financial, which include programs such as tax credits and expedited permitting for efficient buildings
5. Research and development, e.g., on technologies needed to achieve cost-competitive zero-energy buildings.
An overarching characterization of these policies is that of market transformation, defined as permanent success of energy efficiency technologies in the marketplace. Strategies to achieve market transformation encompass two primary categories that contribute to opening, and then expanding markets for energy efficiency (Brown and Busche 2008, Geller and Nadel 1994).
• Barrier Reduction (also called standard setting and mandates, or “push”). Policies that remove barriers to energy efficiency include those that raise performance standards and create uniform criteria for adopting new technologies. Uniform criteria help streamline regulatory approval. Energy efficiency policies included in this category are building codes and equipment standards.
• Technology Accessibility (also called financial and non-financial incentives or “pull”). This policy
type aims to reduce initial procurement and installation costs, thereby making energy-efficient products, which already have lower lifetime energy costs, the cost-effective choice. Policies of this type include rebates, subsidies, tax incentives, and grants.
A subset of both of these policy types is to lead by example, where governments apply barrier reduction and technology accessibility policies to public activities and infrastructure within their jurisdiction. This type of public leadership allows governments to reap available energy cost savings and, more significantly for market transformation, reduce the private sector risk of investment in new efficient technologies (see Text Box 1).
Building efficiency policies historically map to different jurisdictions in the United States (See Table 3). The federal government creates nationwide appliance standards, providing uniformity for manufacturers and thereby reducing the burden of providing different equipment for each state market. The federal government also provides large-scale financial incentives early in the commercialization process, widespread education through labeling, and support for research and development.

6
Most state governments have authority over the design of building codes, although until recently this was the domain of localities. With jurisdiction over electric utilities, many state governments also provide financial incentives as part of demand-side management programs, and some states set standards for appliances not governed by federal legislation.
Finally, local jurisdiction primarily focuses on building code enforcement, and, in some states, building code design.5
Some local governments also influence efficiency by offering incentives to developers, such as expedited permitting for efficient buildings, and by modeling efficiency in municipal buildings. Some local governments also offer financial incentives for energy efficiency, such as appliance rebates.
Table 3: Map of Building Code Policies to Jurisdiction Federal State Local
Barrier Reduction
Building code design No6 Most Some Building code enforcement No Some All Appliance standards Yes Some None Labeling Yes None7 None Public leadership Yes Most Most
Technology Accessibility
Incentives (Multiple kinds) Yes Some Some
Research and Development Yes Some None
Most recently, with the passage of the American Recovery and Reinvestment Act of 2009 (ARRA) and the consideration of the American Clean Energy and Security Act of 2009, the federal government has expanded its activities in building code design and financial incentives in the buildings sector. While these policies are too new to estimate their long-term impact, it is certain that expanding the federal role in this sector will affect the focus and priorities of all jurisdictions.
The following sections address the policy types in more detail.
5 Design at the local level usually entails adopting building codes written by third-party organizations, with minor adjustments—unrelated to energy efficiency—specific to the locality. Although locally-selected, the widespread adoption of such codes gives them a national scope. 6 The federal government provides research to help strengthen and suggest building codes, but currently does not require adoption of a national code. 7 In the past a handful of states have had labeling programs for energy efficiency, like the now defunct tumblewash program in the Northwest.
Text Box 1
Federal Energy Management Program
The Energy Policy Act of 2005, expanded under the Energy Independence and Security Act of 2007, requires that all existing and new federal buildings lead by example. Existing buildings must reduce energy consumption 30% by 2015, compared with 2003 levels, through building upgrades and efficient appliances. New buildings must achieve efficiencies of 30% better than ASHRAE and IECC codes.
The Federal Energy Management Program (FEMP) assists federal agencies in meeting these goals. FEMP helps federal agencies identify and engage sources of financing for efficiency upgrades, such as Energy Savings Performance Contracts, Utility Energy Service Contracts, and federal and state incentive programs. FEMP also offers energy audits and guidance for equipment purchases.

7
2.1 Building codes Codes help occupants save energy and money over a building’s lifetime by regulating aspects of the building envelope,8
2.1.1 Policy Evolution
lighting, and heating, ventilation, and air conditioning (HVAC) system. Building codes are an essential part of government efforts to transform the long-term market for energy efficiency. The next section investigates the role of building codes in each jurisdiction, and policies that support governments to lead by example.
Building codes fall primarily within state and local jurisdiction, and consequently vary widely across the United States to meet the needs and climates of different regions. States that allow jurisdiction to remain at the local level require local codes to exceed a statewide minimum. Some states that do have statewide mandates use strict codes to aggressively reduce energy demand. In California for example, per capita building-related energy demand has remained uniquely stable over the last three decades, after passage in the 1970s of both a statewide building code and appliance standards (see Figure 2).
Figure 2: California per capita electricity consumption relative
to the rest of the United States (Source: Rosenfeld 2008)
The U.S. federal government does not have direct jurisdiction over building codes, although since 1977 the government has contributed to the development of model codes and requires that states consider adopting them. The federal government also provides states with technical assistance in adopting, implementing, and enforcing building codes. The 2009 ARRA offers a financial incentive to states that adopt the latest model building codes.
8 The building envelope is the outer shell of the building that separates the indoor and outdoor environments.
Per Capita Electricity Sales (not including self-generation)(kWh/person) (2006 to 2008 are forecast data)
0
2,000
4,000
6,000
8,000
10,000
12,000
14,000
1960
1962
1964
1966
1968
1970
1972
1974
1976
1978
1980
1982
1984
1986
1988
1990
1992
1994
1996
1998
2000
2002
2004
2006
2008
United States
California
Per Capita Income in Constant 2000 $1975 2005 % change
US GDP/capita 16,241 31,442 94%Cal GSP/capita 18,760 33,536 79%
2005 Differences = 5,300kWh/yr = $165/capita

8
Because buildings contribute 40% of U.S. carbon emissions due to fossil fuel-based heating and electricity (EERE 2008), the American Clean Energy and Security Act of 2009 currently before Congress mandates the creation of a national energy efficiency building code and a financial penalty if states and local governments do not adopt codes that meet or exceed this threshold. Although the federal government will not require states to comply with and enforce a national code, the legislation withholds federal funding and carbon-emission allowances if states and local governments do not comply.
State Jurisdiction Most states have adopted codes based on model codes developed by the International Energy Conservation Code (IECC) and the American Society of Heating, Refrigerating and Air Conditioning Engineers (ASHRAE). The stringency of the codes adopted depends on the states’ climate and regulatory environments and the relative strengths and interests of local stakeholders.
Thirty-five states mandate residential codes (Figure 3) and thirty-six mandate commercial codes (Figure 4) including 21 that share the most stringent version in practice (BCAP 2009). Five states and the District of Columbia have plans to increase the stringency in building codes (Ibid.). In addition to phasing in new performance standards over time, thereby allowing for industry and retail markets to adjust to the changes, these minimum standards can stimulate expanded markets for efficient building materials. This, in turn, can enable industry to capture cost reductions resulting from production economies of scale.
Figure 3: Residential Energy Code Status (July 2009)

9
Figure 4: Commercial Energy Code Status (July 2009) Appendix A lists the status of commercial and residential building codes in all states and Washington, D.C.
Local governments have jurisdiction over building codes in four regards: Local Jurisdiction
• Establishing codes, unless pre-empted by state codes (and, in limited cases, more strictly than state codes),
• Enforcing codes,
• Leading by example, and
• Promoting high efficiency certification of public and private buildings, typically through the U.S. Green Building Council’s Leadership in Energy and Environmental Design (LEED) program.
In states without mandatory building codes, local governments can establish codes. For example, Illinois has a statewide commercial building code, but most localities establish their own residential codes. Many Illinois counties have adopted IECC 2003, some have adopted IECC 2006, and still others have codes that date back to IECC 2000 and 1998.
One of the most critical activities in ensuring energy savings resulting from building codes is local enforcement. Each jurisdiction varies in its procedures for enforcing compliance, including training and resources available to code officials.

10
Local jurisdictions can also strengthen the market for energy efficiency by encouraging (through suggestion or financial incentive) or mandating high performance buildings, for example through LEED Certification.9
Table 5
One hundred thirty jurisdictions require that government-owned or supported buildings be LEED certified, and a few even mandate LEED certification for new private buildings. Since local jurisdictions have little regulatory power over the private sector, a more popular option than mandating is to encourage certification through financial and non-financial incentives (Table 4). summarizes the number of communities, by size, offering incentives for LEED certification.
Table 4: Summary of Local Government (County, City, Township) Requirements for LEED Certification (Encouragement or Requirement)
Jurisdiction Population
Government-owned or Supported Private (New) Encouraged Required Encouraged Required
0-25,000 3 15 7 8
25,001-75,000 2 28 3 17
75,001-125,000 3 9 4 1
125,001-200,000 1 15 4 4
200,001+ 5 63 20 10
Total 14 130 48 30 Source: USGBC 2009
Table 5: Summary of Local Government (County, City, Township) Incentives for LEED Certification
Jurisdiction Population Government-owned or Supported Private (New)
0-25,000 1 3
25,001-75,000 1 3
75,001-125,000 0 4
125,001-200,000 1 2
200,001+ 1 20
Total 4 32 Source: USGBC 2009
2.1.2 Policy Impact and Evaluation The adoption of the most recent model building codes would yield significant energy savings. In the residential sector, a recent McKinsey (2009) study estimates that the 2009 IECC code improves efficiency by 12%-16% relative to the 2006 IECC code. A projected 2012 code could save an additional 15% (Ibid.). Adopting both of these codes as they are made available would save an estimated 250 trillion end-use BTUs annually by 2020 (Ibid.).
A similar potential for energy savings exists in the commercial sector. Adopting the latest building code, ASHRAE Standard 90.1-2007, followed by adoption of a code with an estimated 30% improved efficiency in 2012, would yield an estimated energy savings of 270 trillion end-use BTUs in 2020 (Ibid). This would represent 12% of potential commercial energy demand (Ibid). Yet today, only two states have adopted the most recent commercial building codes and 13 states have adopted either no code or codes
9 While LEED is not the only certification system available to localities, it is among the most common and provides insights into the overall market.

11
that are at least three generations behind (Ibid). Commissioner Arthur H. Rosenfeld of the California Energy Commission documented the effectiveness of building codes in California, as illustrated in Figure 5. Building codes are responsible for reductions in peak demand of 5.75 GW (in 2003), in electricity consumption of 11 TWh per year, and a household annual savings of $2,000 (APS 2008). Each revision in California’s energy code (2002, 2005, and 2008) cut energy use by 10%-15% compared to the previous standard (Ibid.).
Figure 5: California's annual energy savings from efficiency programs and standards (Source: Rosenfeld 2008)
Although few states comprehensively track code enforcement due to limited resources, one recent survey indicates widespread lack of compliance with energy codes (BCAP 2008). Code officials cited barriers to enforcement, including limited manpower and training, and low prioritization of energy codes relative to safety-related codes (Ibid.). Another survey found that only four states have high compliance rates for current codes (Eldridge et al. 2008). A recent McKinsey study (2009) estimates full code compliance ranging from 40%-60%. There are rare examples of high levels of compliance, such as the state of Hawaii, which has an extensive training program for enforcement and an estimated 1999 compliance of 80% (Eley 1999).
The McKinsey study suggests four ways of improving code compliance: 1) using third-party verifiers to spot-check buildings; 2) hiring more building officials; 3) increasing the pay and training of building officials; and 4) increasing the objectivity of performance-based code compliance. The estimated cost of improving compliance ranges from $210 million to $1 billion per year, but—if annually invested for ten years—would still yield $3.5 billion in net present savings at the higher cost estimate (Ibid.).
Annual Energy Savings from Efficiency Programs and Standards
0
5,000
10,000
15,000
20,000
25,000
30,000
35,000
40,000
45,000
1975
1976
1977
1978
1979
1980
1981
1982
1983
1984
1985
1986
1987
1988
1989
1990
1991
1992
1993
1994
1995
1996
1997
1998
1999
2000
2001
2002
2003
GW
h/y
ear
Appliance Standards
Building Standards
Utility Efficiency Programs at a cost of
~1% of electric bill
~15% of Annual Electricity Use in California in 2003

12
2.2 Appliance Standards Appliance standards mandate that new equipment must meet minimum energy efficiency standards. Industry-wide standards help reduce adoption costs and maintain a level playing field among manufacturers. Standards help reduce the cost of efficiency because manufacturers seek least-cost ways of reducing energy consumption in order to compete in the price-sensitive share of the market (Nadel et al. 2005). Such standards, by increasing the overall efficiency of a product, also reduce the effects of many barriers to long-term energy savings, e.g., split incentives. Split incentives arise when those who purchase equipment do not have to pay for energy operating costs, such as home developers or landlords, who make decisions based only on initial capital costs.
2.2.1 Policy Evolution The federal government has primary jurisdiction in setting standards. Sixteen states have also adopted standards for residential and commercial appliances not covered by federal legislation.
Federal Jurisdiction Prominent federal policies in standard setting are outlined in Table 6. Since 1996, federal statutes have required the DOE to “set appliance efficiency standards at levels that achieve the maximum improvement in energy efficiency that is technologically feasible and economically justified” (EERE 2009a).
Table 6: Legislation Relating to Federal Standard Setting for Energy Efficiency
Name of Legislation Year of Passage Description Legislative
Reference*
Energy Policy and Conservation Act (EPCA) 1975
Calls for establishment of energy conservation program and efficiency targets
PL 94-163
National Energy Conservation and Policy Act (NEPCA)
1978 Authorizes DOE to set mandatory standards for thirteen household products
PL 100-12
National Appliance Energy Conservation Act (NAECA) 1988
Establishes national standards for home appliances, and schedules regular updates through 2012
PL 100-357
Energy Policy Act (I) (EPAct92) 1992 Expands standards to include additional
commercial and residential appliances PL 102-486
Energy Policy Act (II) (EPAct05) 2005 Updates testing procedures for
appliances PL 109-58
Energy Independence and Security Act (EISA 2007) 2007
Expands standards to include additional appliances and updates some existing standards
PL 110-140
*All Appliance and Standards laws as well as DOE's authority in standard setting are found in 42 USC 77, Sub 3, Part A. Note: A full listing of equipment in the standard setting process is available through the Appliance Standards Awareness Project (ASAP): http://www.standardsasap.org/federal.htm.
Sources: DSIRE 2009, LBL 2009, EERE 2009a, ASAP 2007
To develop a set of rules for setting appliance efficiency standards, DOE led a collaborative process in the mid-1990s that involved manufacturers and regulatory and consumer advocates. This collaborative process produced a protocol titled “Procedures for Consideration of New or Revised Energy Conservation Standards for Consumer Products,” published in 1996 (10 CFR Part 430). The Procedures stipulate that rule-makers must consider the economic impacts of proposed standards on manufacturers and consumers,

13
as well as non-economic benefits associated with energy conservation, such as those related to carbon reduction and national security. The Procedures also stipulate the methodologies to calculate these costs and benefits.
State Jurisdiction Fifteen states10
2.2.2 Policy Impact and Evaluation
and Washington D.C. have adopted energy efficiency standards for residential and commercial appliances not covered by federal standards. California initiated many of these standards beginning in 1976, before the existence of federal legislation, providing a long-term demonstration of energy savings and reducing the implementation cost for other states to adopt California’s standards. In special circumstances, states may petition to have a stricter standard for an appliance than is covered by federal standards. This results in a patchwork of standards and may result in increased costs to manufacturers, relative to a single federal standard.
To date, 17 residential, 13 lighting, and 17 commercial equipment federal standards have been promulgated by Congress or DOE (ASAP 2009). Extensive technological analyses have demonstrated the large energy savings that result from the standards, especially in later years as market penetration increases.11
An American Council for an Energy-Efficient Economy (ACEEE) study estimates similar savings. Over the 1990-2000 period, net present benefits exceed costs by an over three to one ratio. In 2010, existing standards will save 250 billion kWh (6.5% of projected electricity use) and reduce peak demand by 7.6% (ACEEE 2009).
A 2003 study (Meyers et al.) suggests that standards taking effect from 1988-2003 will capture cumulative reductions in energy use from 1988-2050 of 8%-9% relative to a no-standards baseline. The corresponding cumulative costs of these standards have been estimated to be $200-$250 million (2002 dollars), with a cumulative (through 2050) benefit/cost ratio of 2.75:1 (Meyers et al. 2003). A more recent study corroborates these findings, estimating 4% and 8% energy reductions resulting from standards in the commercial and residential sectors, respectively, for standards in place from 1987-2006 (Meyers et al. 2008).
Figure 6 illustrates the impact of national and state standards on the energy efficiency of gas furnaces, central air-conditioning, and refrigerators.
Figure 6: Impact of national and state appliance standards on energy efficiency (Source: S. Nadel (2003) cited in Rosenfeld 2008)
10 Arizona, California, Connecticut, Florida, Maine, Maryland, Massachusetts, Nevada, New Hampshire, New Jersey, New York, Oregon, Rhode Island, Vermont, and Washington 11 For an example of literature that analyzes the economic aspects of energy efficiency standards, please see Gillingham et al 2006.

14
2.3 Labeling and Education Labeling conveys information on energy operating costs to help consumers make purchasing decisions. In the United States labeling, from the federal level, comes in two forms:
• Comparative (“EnergyGuide”), which inform consumers about a products’ annual energy consumption relative to other products in the same class; and
• Endorsements (“ENERGY STAR®”), which through a symbol placed on a product certify that the product is one of the most energy efficient in its class.
2.3.1 Policy Evolution Labeling programs take place only at the federal level. Mandatory comparative labeling was legislated in the Energy Policy and Conservation Act of 1975 and National Energy Conservation Policy Act of 1979, and was launched in 1980. The Federal Trade Commission prescribes the labeling requirements for residential appliances, and jointly with DOE, for commercial appliances.
Endorsement labels are used in the United States to identify very efficient products in a given class. Under the name ENERGY STAR (http://www.EnergyStar.gov), endorsement labeling is a voluntary program jointly implemented by the U.S. Environmental Protection Agency (EPA) and DOE. Initiated in 1992, the program now covers 50 product categories and is a well recognized label.
2.3.2 Policy Impact and Evaluation The DOE estimates that the ENERGY STAR program is responsible for $16 billion in consumer savings in 2007 alone (Energy Star 2009b).12
One criticism of these types of labeling programs, both for the comparative information and ENERGY STAR endorsement, is their focus on efficiency rather than total consumption. Products are segregated by class, allowing large, upscale, energy-consuming products to be a separate category from similar products with much smaller energy footprints. This enables products, such as refrigerators, to grow much larger and offer more energy-consuming features without losing energy-efficiency endorsements. A smaller, less energy-consuming product can be labeled inefficient using the same energy consumption per cubic volume metric. Some evaluations of labeling programs have cited the need for a cap on total energy consumption of products labeled as energy efficient (Deumling 2008).
An independent 2002 study of the EnergyGuide label found that manufacturers and consumers widely recognize the label, but that the label’s contents should be revised to be more useful in terms of communicating information to consumers and thereby increase energy savings (Thorne and Egan 2002).
2.4 Financial Incentives Energy efficient technologies, especially in early adoption, can have high up-front capital costs relative to inefficient alternatives. To help reduce this cost barrier and spur development, some policies offer financial incentives, such as grants, loans, rebates, subsidies, and tax incentives.
12 To calculate energy savings, the DOE compared the efficiency of purchased ENERGY STAR appliances to the least efficient products in their class, an assumption which may not accurately reflect the value of the ENERGY STAR program. The DOE also incorporated harder to measure impacts, such as those related to the education campaign.

15
2.4.1 Policy Evolution Federal Jurisdiction Text Box2 presents a summary of historical and current energy efficiency policies that offer financial incentives to the buildings sector. Beyond the direct impact of lowering product capital and installation costs, these financial incentives have different goals depending on the sector. In the industrial and manufacturing sectors, the goal is to target efficiency improvements early in the commercialization process in order to reduce program implementation costs. In the commercial, residential, and end-user sectors, the goal is to use the financial incentives to educate the public on benefits of energy efficiency and increase market penetration of existing efficient technologies.
Relative to standards and labeling, federal financial incentives for efficiency are new. A set of tax incentives for energy efficiency were available from 1978-1985 (PL 95-618), but in recent years, the longest-available economic supports are the grants and loans offered to small agricultural residents and businesses through the U.S. Department of Agriculture’s Rural Energy for America Program (REAP), which began in 2002 (see Text Box ).13
13 REAP is the new program name for the Renewable Energy Systems and Energy Efficiency Improvements Program established in the Farm Security and Rural Investment Act of 2002.
Text Box 2
Renewable Energy Assistance Project (REAP)
From 2002-2007, the United States Department of Agriculture (USDA) provided $23 million annually, in grants, loans, and loan guarantees, to small farmers to make energy efficient improvements and install renewable energy technologies. In the first year, the quality and number of applications were low, prompting the USDA and energy advocates, such as the Environmental Law and Policy Center, to offer technical assistance and better marketing in subsequent years. The program has since been oversubscribed.
Energy efficiency projects represented 38% of total REAP awards between 2002-2005, and resulted in approximate energy savings of 75,000 Megawatt-hours (MWh). Additional program benefits include reductions in emissions resulting from energy not used, and energy cost savings for rural Americans (Walters et al. 2006).
Based on program popularity and impact, as well as the increasing focus on energy and rural development issues more broadly in the United States, USDA announced that the program would expand to $220.9 million for 2008. Subsequently, the Food, Conservation and Energy Act of 2008 (HR 2419) allocated $60-$70 million annually from 2009-2012 for the program’s continuation.
16
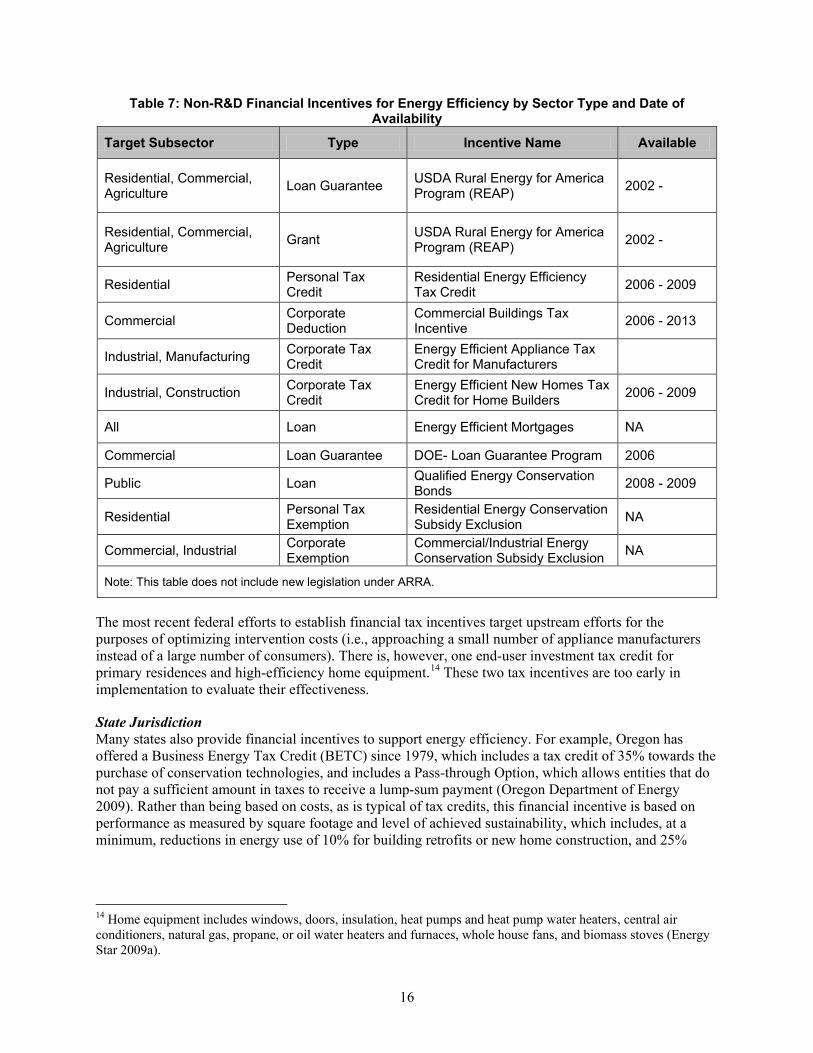
Table 7: Non-R&D Financial Incentives for Energy Efficiency by Sector Type and Date of Availability
Target Subsector Type Incentive Name Available
Residential, Commercial, Agriculture Loan Guarantee USDA Rural Energy for America
Program (REAP) 2002 -
Residential, Commercial, Agriculture Grant USDA Rural Energy for America
Program (REAP) 2002 -
Residential Personal Tax Credit
Residential Energy Efficiency Tax Credit 2006 - 2009
Commercial Corporate Deduction
Commercial Buildings Tax Incentive 2006 - 2013
Industrial, Manufacturing Corporate Tax Credit
Energy Efficient Appliance Tax Credit for Manufacturers
Industrial, Construction Corporate Tax Credit
Energy Efficient New Homes Tax Credit for Home Builders 2006 - 2009
All Loan Energy Efficient Mortgages NA
Commercial Loan Guarantee DOE- Loan Guarantee Program 2006
Public Loan Qualified Energy Conservation Bonds 2008 - 2009
Residential Personal Tax Exemption
Residential Energy Conservation Subsidy Exclusion NA
Commercial, Industrial Corporate Exemption
Commercial/Industrial Energy Conservation Subsidy Exclusion NA
Note: This table does not include new legislation under ARRA.
The most recent federal efforts to establish financial tax incentives target upstream efforts for the purposes of optimizing intervention costs (i.e., approaching a small number of appliance manufacturers instead of a large number of consumers). There is, however, one end-user investment tax credit for primary residences and high-efficiency home equipment.14
State Jurisdiction
These two tax incentives are too early in implementation to evaluate their effectiveness.
Many states also provide financial incentives to support energy efficiency. For example, Oregon has offered a Business Energy Tax Credit (BETC) since 1979, which includes a tax credit of 35% towards the purchase of conservation technologies, and includes a Pass-through Option, which allows entities that do not pay a sufficient amount in taxes to receive a lump-sum payment (Oregon Department of Energy 2009). Rather than being based on costs, as is typical of tax credits, this financial incentive is based on performance as measured by square footage and level of achieved sustainability, which includes, at a minimum, reductions in energy use of 10% for building retrofits or new home construction, and 25%
14 Home equipment includes windows, doors, insulation, heat pumps and heat pump water heaters, central air conditioners, natural gas, propane, or oil water heaters and furnaces, whole house fans, and biomass stoves (Energy Star 2009a).
17
reductions for lighting upgrades. A tax credit is also available to developers of sustainable buildings with LEED-certifications of at least Silver.15
The Database of State Incentives for Renewable Energy and Energy Efficiency (DSIRE,
www.dsireusa.org) details many of these state- and utility-based financial incentives for the building sector. Other examples include the California Energy Commission, which offers loans at a fixed rate of 3% to schools, hospitals, and local governments for energy audits and the implementation of efficiency measures. Missouri offers an occasional sales tax holiday on the purchase of ENERGY STAR appliances. New York offers financial incentives and technical assistance to owners of multifamily buildings to improve building energy performance. Utilities across most states offer rebates toward the purchase of energy-efficient appliances (DSIRE 2009).
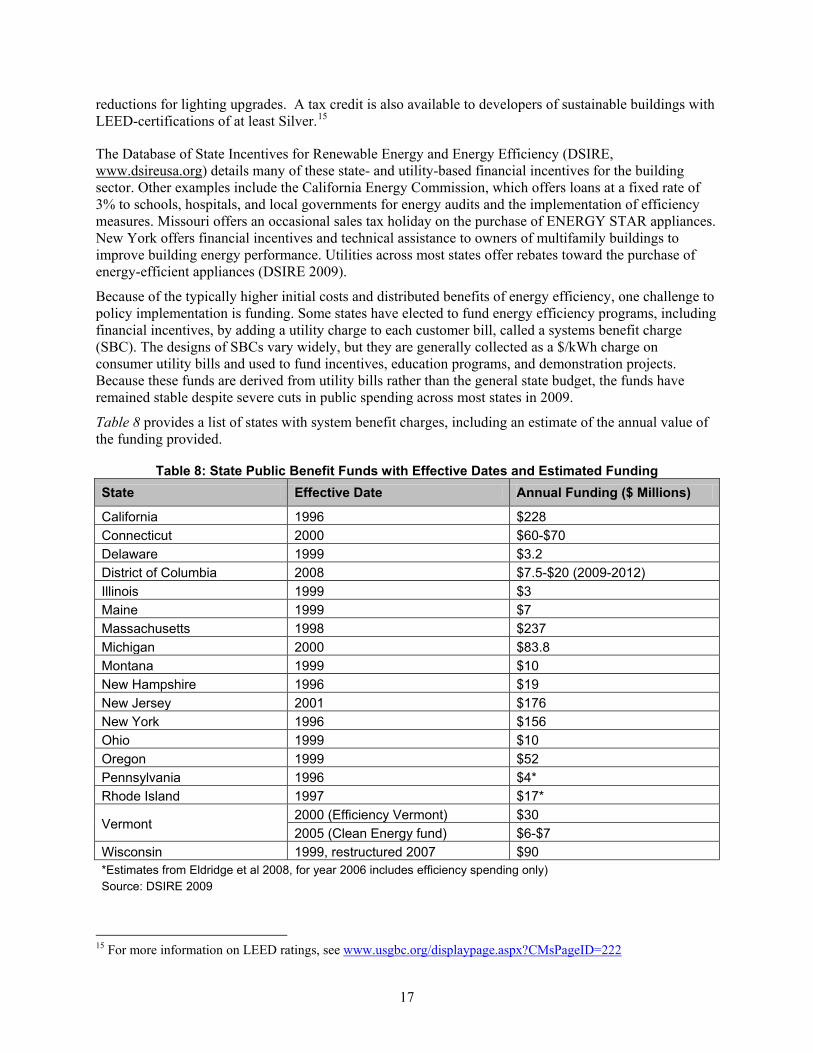
Because of the typically higher initial costs and distributed benefits of energy efficiency, one challenge to policy implementation is funding. Some states have elected to fund energy efficiency programs, including financial incentives, by adding a utility charge to each customer bill, called a systems benefit charge (SBC). The designs of SBCs vary widely, but they are generally collected as a $/kWh charge on consumer utility bills and used to fund incentives, education programs, and demonstration projects. Because these funds are derived from utility bills rather than the general state budget, the funds have remained stable despite severe cuts in public spending across most states in 2009.
Table 8 provides a list of states with system benefit charges, including an estimate of the annual value of the funding provided.
Table 8: State Public Benefit Funds with Effective Dates and Estimated Funding State Effective Date Annual Funding ($ Millions)
California 1996 $228 Connecticut 2000 $60-$70 Delaware 1999 $3.2 District of Columbia 2008 $7.5-$20 (2009-2012) Illinois 1999 $3 Maine 1999 $7 Massachusetts 1998 $237 Michigan 2000 $83.8 Montana 1999 $10 New Hampshire 1996 $19 New Jersey 2001 $176 New York 1996 $156 Ohio 1999 $10 Oregon 1999 $52 Pennsylvania 1996 $4* Rhode Island 1997 $17*
Vermont 2000 (Efficiency Vermont) $30 2005 (Clean Energy fund) $6-$7
Wisconsin 1999, restructured 2007 $90 *Estimates from Eldridge et al 2008, for year 2006 includes efficiency spending only) Source: DSIRE 2009
15 For more information on LEED ratings, see www.usgbc.org/displaypage.aspx?CMsPageID=222

18
Local Jurisdiction Local governments offer both financial and non-financial incentives. One new policy trend is to finance residential energy efficiency improvements through municipal bonds that are repaid through property taxes. The financing is provided in exchange for a lien on the property.
This type of project alleviates two barriers that would otherwise restrict energy-efficiency financing—credit and collateral (Johnson 2009). Residents do not need good credit to get a loan, because the loan is secured against their property. That the property serves as collateral is also essential to eliminating the lender’s risk, because, unlike solar panels, energy efficiency retrofits cannot be removed in the event of non-payment.
Another benefit of this program is that homeowners do not have to recoup their investment through home sale price if home ownership changes hands. The loan resides with the property owner rather than the purchaser. This is especially valuable because energy efficiency upgrades, such as insulation, are often invisible to prospective home buyers.
A second type of locally-implemented financing is through the Weatherization Assistance Program (WAP), which recently benefited from a surge in funding by the federal American Recovery and Reinvestment Act of 2009. Rather than subsidizing the monthly utility bills of low-income residents, the goal of WAP is to permanently reduce their bills by helping pay for one-time energy efficiency upgrades to their residences. A secondary goal is to increase the number of “green jobs” by expanding the market for energy audits and efficiency retrofits. WAP-funded programs have weatherized more than 6.2 million homes over a 32-year period, reducing heating and cooling bills by an average of 32% (McKinsey 2009). The ARRA increases the projected pace of weatherization from 100,000 homes annually to 1 million for each of the next three years (Ibid.).
Local governments can also influence building efficiency through non-financial incentives. In states with building codes that do not allow local alterations, localities can affect energy efficiency in the private sector by offering incentives to developers. This includes financial outlays, such as New York’s incentive for green building,16
but, more commonly, includes zero-cost incentives, such as expedited permitting. For example, one locality, Arlington, VA, grants density and/or height bonuses to buildings that achieve LEED-certification. The effectiveness of this small group of geographically dispersed incentives has not been evaluated in the aggregate.
2.4.2 Policy Impact and Evaluation Evidence from the evaluation of historical tax credits for energy efficiency offers lessons learned and insight into the potential impact of tax incentives offered at the federal level. The Energy Act of 1978 (PL 95-618) established a 15% tax credit—capped at $300 and available from 1978-1987—for homeowners to make efficiency upgrades. Before the program was ended in a suite of policy reforms in 1985, 30 million claims were filed, resulting in a $5 billion (nominal dollars) reduction in tax revenues.
There is evidence from program evaluation surveys that participants perceived that the effort exerted to get the incentive outweighed the value of the tax credit (an average of $166 per applicant). Moreover, the survey suggested that a high percentage (94%) of those filing for the incentive would have invested in the technology without the incentive (“free riders”) (Gillingham et al 2006).
These challenges, low incentive value and high free-ridership, are common to financial incentive policies. Determining the appropriate level of incentive is difficult because it depends on investor discount rates, technology costs and other factors. Today’s tax credits allow for larger incentives for higher efficiency
16 For details, see: http://www.dsireusa.org/incentives/incentive.cfm?Incentive_Code=NY05F&re=1&ee=1.

19
equipment, potentially increasing the impact of the program and reducing free riders. The actual outcome remains to be seen pending experience with the program. 2.5 Research and Development Although this report focuses primarily on policies that promote market transformation and deployment strategies for energy efficiency technologies, the DOE sponsors a number of research and development programs across all sectors (buildings, transportation, industry, and power) through the Energy Policy Act of 2005, the Energy Independence and Security Act of 2007, and ARRA 2009. A full analysis of efficiency-related research and development, including at the state level, is beyond the scope of this report, but a summary of DOE-sponsored R&D is provided for each sector in the relevant section of this report.
For buildings, current programs totaling $140 million (FY09, not including ARRA funding) focus on energy efficiency gains in:
• Building envelope, including the goal of market-viable windows with R5 insulation by 2010; net-zero energy systems by 2025; and reductions in average thermal load of existing and new residential buildings of 30% and 66%, respectively;
• Building equipment, including advanced refrigerants, smart sensors, and heat recovery;
• Analysis and design tools, such as performance simulation software; and
• Solid state lighting, with a goal of 50% load reductions in 2025 compared with 2005 (http://www.ssl.energy.gov/) (DOE 2009).

20
3 Transportation Sector The transportation sector consumes 28 quadrillion BTUs annually, and represents 28% of U.S. primary energy consumption (EIA 2008). Fuel consumption in the transportation sector spans many end-uses in the movement of both people and goods. Improving transportation efficiencies could address, for example:
• Movement of people: e.g., reducing the fuel needed to drive each mile and the total vehicle miles driven, including through the use of alternative modes of transit beyond single-occupant vehicles
• Movement of goods: e.g., increasing intermodal transportation by combining the use of barges and trains with tractor-trailers.
Energy efficiency policies in this sector therefore focus on developing and deploying new technologies that increase fuel efficiency and creating incentives to alter transportation patterns. Transportation policies can be categorized as:17
1. Standards, which establish minimum fuel efficiency
2. Labeling, which provides consumers comparative information on fuel efficiency 3. Incentives, both financial and non-financial, which target manufacturers and consumers to
encourage market front-runners to develop and purchase more efficient vehicles 4. Technical assistance, which assists the public and private sectors in adopting fuel-efficient
technologies and implementing policies to reduce fuel consumption 5. Urban planning and behavior change, including zoning, traffic design, and idle reduction rules to
reduce fuel consumption 6. Research and development, e.g., on battery technology.
The federal government has taken the lead on most of these policies, with the exception of urban planning, which resides primarily in local and regional jurisdictions. The federal government establishes mandatory manufacturing standards and voluntary programs that provide education, incentives, and assistance for increasing fuel efficiency.
States, until this year, have not been allowed to preempt federal fuel efficiency standards. In July, California received permission from the federal government to allow stricter state-level fuel efficiency standards, which up to thirteen other states and Washington, D.C. have agreed to adopt (EPA 2009). Also, half of all states offer incentives that encourage the use of fuel-efficient technologies, regulations that govern engine idling, and technical assistance to municipalities and businesses to implement energy-saving programs (see Appendix B).
Local governments tend to focus on policies that alter driving patterns as part of broader efforts to reduce pollution and traffic. Such policies include land use planning (often part of a regional collaboration), public transportation programs, and regulations that restrict engine idling. A limited number of local governments offer consumer incentives to adopt fuel-efficient vehicles.
Governments across all jurisdictions lead by example, supporting efficient technologies in publicly-owned fleets.
17 This report primarily focuses policies that address personal vehicles, but similar policies can be developed for other modes of transportation.

21
Table 9 summarizes the mapping of policies to jurisdiction.
Table 9: Map of Transportation Policies to Jurisdiction Federal State Local
Fuel efficiency standards18 Yes Some None
Labeling Yes None None
Incentives Yes Half Some
Technical assistance Yes Half None
Urban planning and behavior change No Some Some
Research and development Yes Some None The remainder of this section provides brief narrative descriptions of current status,19
3.1 Fuel Efficiency Standards
and, where available, illustrative examples of successes and summaries of published policy evaluations.
Fuel efficiency standards promote technological innovation and adoption across the nation’s vehicle fleet. Because cars remain in service for an average of nine years (Federal Highway Administration 2009), fuel efficiency standards are an important tool in curtailing long-term fuel demand.
3.1.1 Policy Evolution Federal Jurisdiction The Corporate Average Fuel Economy (CAFE) has been the primary federal legislation to control fuel efficiency in U.S. vehicles. CAFE requires that the average fuel economy, expressed in miles per gallon (mpg), of all vehicles20
Legislated by Congress in 1975 in response to the Arab-oil embargo, the original goal was to double average fuel efficiency to 27.5 mpg by 1985. Instead, due to increases in vehicle weight and performance, the average peaked at 22.0
sold by each manufacturer in a given model year meet or exceed minimum fuel-efficiency standards. CAFE standards are codified in 49 CFR 6 and implemented jointly by the National Highway Traffic Safety Administration (NHTSA), who set the standards, and the EPA, which tests vehicle efficiency and runs the labeling program.
21
Although the federal government has only recently increased fuel-efficiency standards for the private sector, the government has established relatively strict fuel efficiency for all federal vehicles. Executive Order 13149: The Greening of Government (EO13149 2000) states, “Each agency operating 20 or more motor vehicles within the United States shall reduce its entire vehicle fleet’s annual petroleum consumption by at least 20 percent by the end of FY 2005, compared with FY 1999 petroleum
mpg in 1987 and gradually declined to 19.3 mpg in 2004, before rising again to 20.6 in 2007 (EPA 2008). Revisions to the standard, passed in 2007 for the first time since 1975, mandate a 35 mpg average by 2020.
18 Not including policies that require governments to lead by example. 19 Note that ARRA related funds are not explicitly covered here, as a result of early stage of implementation of the programs. 20 The legislation applies to cars and light trucks with a gross vehicle weight rating of less than 8500 pounds, but will include vehicles up to 10,000 lbs after model year 2010. 21 EPA and NHTSA use different calculations for fuel efficiency. CAFE standards, set by NHTSA, represent estimates that are 25% higher than the corresponding EPA “real-world” adjusted estimates (EPA 2008).

22
consumption levels.” The DOE guidance stated that increasing vehicle fleet efficiency by 3 mpg could decrease petroleum use by 10-13% (EO13149 2000).
Table 10 describes the history of federal efficiency regulations, including legislation that requires federally-owned vehicles to consume fewer fossil-fuels through the use of alternative-fuel vehicles.
Table 10: Federal Efficiency Standards, Including Lead by Example Fleet Purchasing Requirements
Program Description Citation
Clean Air Act Amendments of 1990
Created initiatives to reduce mobile source pollutants 42 USC 7401-7671
Corporate Average Fuel Economy (CAFE) (1975)
CAFE is the sales-weighted average fuel economy, expressed in miles per gallon, of a manufacturer's fleet of passenger cars or light trucks with a gross vehicle weight rating of up to 8,500 pounds manufactured for sale in the U.S. for any given model year.
49 USC 329
Idle Reduction Facilities Regulation
This legislation permits states to provide facilities in interstate system rights-of-way that allow operators of commercial vehicles to reduce truck idling or use alternate power sources.
23 USC 111
Updated Fuel Economy Test Procedures and Labeling (1975)
The EPA is responsible for oversight of motor vehicle fuel economy testing. Manufacturers test their own vehicles and report the results to the EPA.
40 CFR 600
Requirement for Federal Fleets (1992)
Seventy-five percent of new light-duty vehicles acquired by certain federal fleets must be AFVs (alternative fuel vehicles), including ethanol flex fuel, hybrid electric vehicles, fuel cell vehicles, and advanced lean burn vehicles.
Energy Policy Act of 1992 (EPAct)
Vehicle Acquisition and Fuel Use Requirements for Private and Local Government Fleets
DOE extends to 2030 the goal of EPAct 1992 to achieve production capacity of alternative fuels equivalent to 30% of U.S. motor fuel consumption.
42 USC 13257
Source: AFDC 2009 State Jurisdiction The federal government has jurisdiction over setting manufacturer standards, but on June 30, 2009, granted California a waiver to allow the state to establish a separate, higher fuel efficiency standard. Thirteen states and Washington, D.C. have adopted California’s proposed standard, but with the revised federal emission standards passed in May 2009, the California and federal standards are already in alignment.
Because this waiver was granted this year, state policies to date have largely emphasized public leadership in transportation efficiency through fleet procurement policies (in 25 states). Bulk purchasing enables states to expand the market for high-efficiency vehicles. Most of these programs result from executive or administrative orders and the stringency and impact vary widely, depending on program design and level of advocacy. Most programs have a clause allowing state agencies with reasonable cause

23
to be released from the program, and without careful implementation, the percentage of released agencies can be large. However, when appropriately implemented (e.g., in California) these programs may increase state fleet efficiency and, through lower costs resulting from the expanded market, expand the private market for transportation efficiency gains.
Some states, such as California, have increased statewide average fuel efficiency, despite historical federal jurisdiction over standards, by requiring a minimum percentage of vehicles sold to be zero- or low-emission vehicles. This type of emissions policy directly influences average fuel efficiency by encouraging the sales of alternative-fuel vehicles. California has also established efficiency standards for areas not governed under federal jurisdiction, such as for tires.
Reducing engine idling, which reduces fuel burned during non-travel time, is another way to increase vehicles’ effective mpg. The trucking industry estimates that trucks consume one gallon per hour during idling. About half of all states have passed legislation related to engine idling; e.g., directly limiting the amount of time trucks may remain idle. State programs to reduce idling often stem from efforts to reduce local emissions and consumer costs, but are also an effective tool to reduce fuel consumption.
Increasingly, states are forming regional collaboratives to address climate change challenges. While most of these efforts focus on electricity generation, the Western Climate Initiative (comprising seven western states and four Canadian provinces) includes transportation fuels in its cap-and-trade program (WCI 2009).
Local Jurisdiction To reduce local air pollution and public expenditures on fuel, several localities are instituting stringent fuel-efficiency policies for municipal fleets. For example the city of Denver leads by example through its long-standing emissions reduction program. The goal of the program in 1993 was a 1% reduction of greenhouse emissions from the Denver municipal fleet every year for 10 years. After accomplishing this goal ahead of schedule, in 2000 the city revised its goal to further increase fleet efficiency, minimize vehicle miles traveled, and increase the use of alternative fuels (Linstroth and Bell 2007).
Local governments have also been active in developing idle reduction policies to promote local air quality. For example in Minneapolis, in order to reduce local air pollution, a 2008 city ordinance restricts engine idling to three minutes for most private and public vehicles (MN AQ 2008).
Other examples of local action include Seattle’s Fleet Action Plan, which requires increased fuel efficiency and the use of certain alternative fuels, and Minneapolis’s procurement policy that has resulted in 18 additional hybrid-electric vehicles to the municipal fleet in 2007, for a total of 25 (MN 2008).
3.1.2 Policy Impact and Evaluation A National Research Council Committee reviewed the impact of minimum fuel efficiency standards between 1975 and 2002, and concluded that due to a variety of factors (e.g., fuel price fluctuations, changes in consumer behavior, and general vehicle technology improvement), isolating the impact of the standards was impossible (NAS 2002). Nevertheless, the standards resulted in maintaining a minimum fuel economy when fuel prices were very low.
The standards have a secondary effect of reducing vehicle-related air pollution. The Clean Air Act of 1970 and associated amendments in 1990 require reductions in vehicle-related emissions. Because reducing the amount of fuel burned reduces air pollution, the federal fuel-efficiency standard is one of the policies used to fulfill the Clean Air Act.

24
3.2 Labeling and Consumer Education Fuel-consumption labels help inform consumers about the fuel efficiency and potential operating costs of a vehicle. The EPA provides fuel efficiency estimates for both city and highway driving, and this information is provided in an easy-to-read sticker placed prominently on new vehicles for sale.
3.2.1 Policy Status Fuel-efficiency labeling is offered exclusively by the federal government. The federal government requires that all new cars contain a fuel efficiency label that provides EPA estimates for fuel consumption and how the vehicle’s fuel efficiency compares to other vehicles in its class. This label provides similar information to the EnergyGuide label for appliances. In addition to this vehicle sticker, DOE’s Office of
Energy Efficiency and Renewable Energy and the EPA jointly provide comparative fuel efficiency and information on how to reduce fuel consumption on the web site www.fueleconomy.gov.
3.2.2 Policy Impact and Evaluation To date, no analysis has been done on the energy savings impacts of the vehicle labels. Currently, the label is comparative, and does not provide an endorsement (like the ENERGY STAR label for high-efficiency appliances). An endorsement label is provided through the federal SmartWay program (see AFDC 2009 for description), but an evaluation of that program is not currently available. Sociology literature generally supports the effectiveness of well-designed comparative labels in expanding the market for energy efficiency (Thorne and Egan 2002).
3.3 Incentives Incentives, both financial and non-financial, encourage manufactures to develop fuel-efficient technologies and consumers to purchase such technologies. Financial incentives include low-interest loans for manufactures to upgrade their manufacturing process or produce fuel-efficient equipment. Consumer-oriented financial incentives focus on lowering the upfront cost of fuel-efficient technologies. Non-financial incentives are particularly popular at the state and local levels because they do not incur a cost to government. Such incentives include access to traffic-restricted roads and parking.
3.3.1 Policy Evolution Federal Jurisdiction The federal government provides a number of financial incentives for high efficiency vehicles (Table 11). On the manufacturing side, for example, the federal government offers low-interest loans to help car manufactures upgrade their plants to improve their ability to manufacture highly efficient vehicles. The federal government also applies a “gas guzzler” tax, normally collected from manufacturers or importers, on passenger cars that fail to meet a fuel economy of 22.5 mpg.
For consumers, the federal government offers tax credits for the purchase of a select number of hybrid, diesel, alternative fuel, and electric vehicles through at least 2010. In June 2009, the federal government instituted the Car Allowance Rebate System, also known as Cash-for-Clunkers. The program provided consumers a credit for inefficient vehicles that they trade in towards the purchase of a more efficient new vehicle.
State Jurisdiction Incentives at the state-level include financial incentives for manufacturers, as well as financial and non-financial incentives for consumers. Some states offer R&D manufacturing incentives, often with the concurrent goal of developing the state’s workforce and attracting manufacturers of advanced vehicle

25
technologies. Wisconsin, for example, offers tax credits of 10% of the corporation’s research expenses on batteries and engines that reduce fuel use (AFDC 2009). Other states offer grants toward the establishment of alternative fuel production. State governments also make low-interest loans and grants to businesses for purchasing technologies that reduce fuel consumption, such as loans for idle-reduction technologies.
Table 11: Federal Tax Incentives Related to Energy in the Transportation Sector
Policy Description Citation
Advanced Technology Vehicle (ATV) Manufacturing Incentives (2007)
Direct loans for up to 30% of the cost of re-equipping, expanding, or establishing manufacturing facilities in the U.S. used to produce qualified ATVs or ATV components.
PL 110-140, Section 136
Idle Reduction Equipment Excise Tax Exemption (2008)
Qualified on-board idle reduction devices and systems are exempt from the 12% retail excise tax imposed on heavy-duty trucks and trailers.
PL 110-343, Section 206, 25 USC 4053
Heavy-Duty Hybrid Electric Vehicle (HEV) Tax Credit (2007)
A tax credit of up to $18,000 is available for the purchase of qualified heavy-duty HEVs with a gross vehicle weight rating of more than 8,500 pounds.
26 USC30B
Light-Duty HEV and Advanced Lean Burn Vehicle Tax Credit (2007)
A tax credit for qualified light-duty HEVs and advanced lean burn technology vehicles placed in service after December 31, 2005. The credit begins to phase out in the second quarter following the calendar quarter in which at least 60,000 of a manufacturer's qualifying HEVs and/or lean burn passenger automobiles and light trucks have been sold.
26 USC30B
High Occupancy Vehicle (HOV) Lane Exemption (2007)
Allows states to exempt certified low emission and energy-efficient vehicles from HOV lane requirements. 23 USC 166
Qualified Plug-In Electric Drive Motor Vehicle Tax Credit
A tax credit for the purchase of a new qualified plug-in electric drive motor vehicle that draws propulsion using a traction battery that has at least four kilowatt hours of capacity, uses an off-board source of energy to recharge the battery, and meets specified emission standards. The credit will begin to be phased out in the second quarter following the calendar quarter in which a minimum of 250,000 qualified plug-in electric drive vehicles have been sold for use in the U.S. This tax credit expires December 31, 2014.
26 USC 30D
Pollution Prevention Grants Program (2007)
Supports state and tribal technical assistance, education, and research programs that help businesses and industries identify better environmental strategies and solutions for complying with federal and state environmental regulations.
42 USC 13104
Source: AFDC 2009 Examples of consumer financial incentives include reductions in state taxes on the sale of alternative fuels and tax credits toward the purchase of infrastructure needed for electric cars. Non-financial incentives at the state level include exemption from high-occupancy vehicle (HOV) rules, which restrict the number of cars allowed in select highway lanes. Such policies use the incentive of time savings rather than fuel savings to attract the purchase of fuel-efficient vehicles.

26
Appendix B summarizes state incentives and regulations that encourage or mandate steps to increase energy efficiency in transportation systems and operational behavior (AFDC 2009).
Local Jurisdiction Some local governments offer incentives to the private sector for increased vehicle efficiency. Salt Lake City, for example, issues preferred “green” parking permits for high efficiency (i.e., greater than 41 mpg) vehicles (SLC 2009). The city of Flagstaff, Arizona offers a rebate on the 1% vehicle sales tax (up to $300) to consumers who purchase vehicles with a highway fuel economy over 27 miles per gallon (Flagstaff 2009). The program began in 2009 and no evaluation has been carried out.
3.3.2 Policy Impact and Evaluation Because the IRS tax credit programs are in progress, there has been very little evaluation of the programs’ effectiveness. An initial study provides evidence that consumers have altered their behavior in anticipation of the credit (Sallee DRAFT 2007).
One criticism of tax credit programs as a tool for fuel efficiency is that hybrid vehicles can qualify for tax credits even if they have relatively low fuel efficiency, such as vehicles where the hybrid system is used to increase acceleration rather than decrease engine size. Conversely, some highly efficient hybrid vehicles do not qualify because the manufacturer has already sold over 60,000 hybrid vehicles. This qualification was designed to support domestic car manufacturers, which were late adopters of hybrid technology.
3.4 Technical Assistance Technical assistance programs draw on the expertise of government agencies to assist states, municipalities, and businesses in improving energy efficiency.
3.4.1 Policy Evolution Federal Jurisdiction The federal government funds multiple programs that assist state and local governments and the private sector to increase the use of high efficiency and alternative-fuel vehicles. For example, through the Clean School Bus program, the federal government works with municipalities to minimize children’s exposure to diesel bus exhaust through changes in route and idling procedures. Table 12 summarizes efficiency-related technical assistance programs in the transportation sector.
State Jurisdiction Twenty-six states plus Washington, D.C. offer technical assistance programs to help fleet managers evaluate the feasibility of incorporating or converting to alternative-fuel vehicles (AFV) (AFDC 2009). For example, Texas offers technical training for mechanics on AFVs and feasibility studies for compressed natural gas fueling stations. California offers technical assistance on electric vehicle infrastructure.

27
Table 12: Federal Technical Assistance Programs in the Transportation Sector
Program Description Citation
Air Pollution Control Program (2007)
Assists state, local, and tribal agencies in planning, developing, establishing, improving, and maintaining adequate programs to prevent and control air pollution and implement national air quality standards. Air quality affects energy efficiency because reduced energy use reduces electricity production, a source of air pollution.
42 USC 7405
Alternative Transportation in Parks and Public Lands Program (2005)
Provides funds to support planning and capital expenses for alternative transportation systems in parks.
49 USC 5320
Congestion Mitigation and Air Quality (CMAQ) Improvement Program (2007)
Provides funding to states’ departments of transportation, municipal planning organizations, and transit agencies for projects and programs that reduce transportation-related emissions in air quality nonattainment and maintenance areas.
23 USC 149
Clean Cities
Promotes the energy, economic, and environmental security of the United States by supporting local initiatives to adopt practices that reduce the use of petroleum in the transportation sector.
Clean School Bus USA
Reduces children’s exposure to harmful diesel exhaust through a public-private partnership that limits school bus idling, implements pollution reduction technologies, improves route logistics, and switches to clean fuels.
SmartWay Transport Partnership
Assists the ground freight industry in quantifying emissions and creating a plan to reduce fuel consumption.
State Energy Program (SEP) Funding
Provides grants to states to assist in designing, developing, and implementing renewable energy and energy efficiency programs.
Voluntary Airport Low Emission (VALE) Program (2007)
Reduces ground level emissions at commercial service airports located in designated ozone and carbon monoxide air quality nonattainment and maintenance areas
49 USC 40101
Source: AFDC 2009 3.4.2 Policy Impact and Evaluation Technical assistance programs have benefits beyond fuel savings, including community building and information dissemination. For example, DOE’s Clean Cities program has resulted in an estimated fuel savings of 360 million gallons of gasoline equivalents (GGE) in 2006 (exceeding program goals by over 50 GGE). In addition, this program helped establish over 90 community-based clean-cities coalitions that create networks, effectively disseminate information, and leverage federal program dollars through public-private partnerships (Smith 2007).

28
3.5 Urban Planning and Behavior Change One of the most effective long-term and low-cost measures to reduce fuel consumption is to develop zoning and transportation plans that prioritize walking and public transportation and minimize driving. State and local governments have also used regulations to alter driver behavior, such as idle reduction policies that exist in 26 states. The federal government has offered policies that encourage behavioral change, such as federally-mandated speed limits (1974-1995) to improve fuel efficiency, but transportation and land-use planning falls primarily within state and local jurisdictions.
3.5.1 Policy Evolution State Jurisdiction Some states have innovative state petroleum- and/or emissions-reduction plans, which offer multiple benefits including reduced petroleum use, congestion, and parking shortages. For example, Vermont’s Greenhouse Emissions Study includes transportation-related energy efficiency recommendations, including the increased use of alternative modes of transportation and public education about efficient transport options. These state plans vary, because they develop from stakeholder-driven processes, but the tailored programs allow for flexible solutions to petroleum dependency.
Local Jurisdiction Urban planning is a multi-faceted effort that is carried out in a variety of ways in different localities. Some communities integrate climate change or sustainability programs into their larger master planning processes, while others separate out the sustainability planning process in order to make it more flexible to changing needs.
The transportation pieces of urban planning include transportation infrastructure, public transportation, population density goals, land use planning, and vehicle miles traveled targets. In 2006, the city of Berkeley, California integrated transportation efficiency into the community climate change action plan with a goal of creating a community where public transport and walking are the primary modes of transportation (Berkeley 2008). This plan was based on a voter-passed measure to reduce greenhouse gases by 80% and outlines the goals, strategies (including funding), and evaluation methods, and assigns city offices to each of the tasks.
3.5.2 Policy Impact and Evaluation No evaluation has been completed for these programs.

29
3.6 Research and Development Although this report focuses primarily on policies that promote market transformation and deployment strategies for energy efficiency technologies, the DOE sponsors a number of research and development programs across all sectors (buildings, transportation, industry, and power) through the Energy Policy Act of 2005, the Energy Independence and Security Act of 2007, and ARRA 2009. These are somewhat outside the scope of this report, but represent an important role for government and so are summarized for each sector. To support improved efficiencies in the transportation sector, DOE currently sponsors research and development programs totaling $273 million (FY09, not including ARRA funding), with a focus on:
• Light vehicles, through FreedomCAR and the Fuel Partnership, which have specific performance goals for AFVs, alternative fuels, and lightweight materials;
• Heavy vehicles, primarily through the 21st Century Truck Partnership,22
• Aviation, with a focus on reducing carbon dioxide emissions of 25% compared to business-as-usual within 10 years and 50% within 25 years (DOE 2009).
which focuses on long-haul performance, stop-and-go operations, and stationary power needs. Specific goals include decreasing aerodynamic drag and tire-rolling resistance, and electrifying ancillary equipment; and
22 This program is a partnership among DOE, EPA, and the US Department of Transportation.

30
4 Industrial Sector The industrial sector, which accounts for 31% of U.S. primary energy consumption (EIA 2008), spans a wide variety of subsectors, all of which have different energy needs. Thus policies to improve energy efficiency in this sector are designed to allow flexibility across a number of differing industry needs, including:
1. Incentives, both financial (e.g., loans and grants for industries to upgrade equipment) and non-financial (e.g., expedited permitting)
2. Technical assistance, including programs, such as energy audits, that help industries identify and implement energy-efficiency programs
3. Research and development.
The federal government offers all three policy types. It offers tax incentives for the manufacturing and home building subsectors, and loans that require energy savings and emission reductions from participating companies. These incentives are flexible enough to apply to a broad array of industry subsectors. In addition, the federal government offers several general industry programs that provide plant-specific technical assistance to highly energy-intensive industries.
State government programs focus on financial incentives, including tax credits, loans, and grants, to offset costs to industries for adopting efficient technologies. Many states also offer programs that can provide customized support to individual industries as part of broader energy efficiency programs. These programs allow funds to be spent on both incentives and technical assistance.
Local government programs related to energy efficiency are often designed with the goal of attracting industries, and thus jobs, to the locality. These programs primarily rely on non-financial incentives, such as expedited permitting for “green” industries.
Table 13 summarizes the mapping of policies to jurisdiction.
Table 13: Map of Industrial Energy Efficiency Policies to Jurisdiction Federal State Local
Incentives Yes Some Some
Technical Assistance Yes Some None
Research and development Yes Some None The following sections expand on some of these key industrial programs.
4.1 Incentives Incentives in the industrial sector often involve one of two goals related to energy efficiency. First, financial incentives can help industries defray the upfront costs of adopting energy-efficient technologies. Second, financial and non-financial incentives that reward energy efficiency are used to attract green industries to a state or locality, with the end goal not of energy savings, but of job creation in an emerging market.
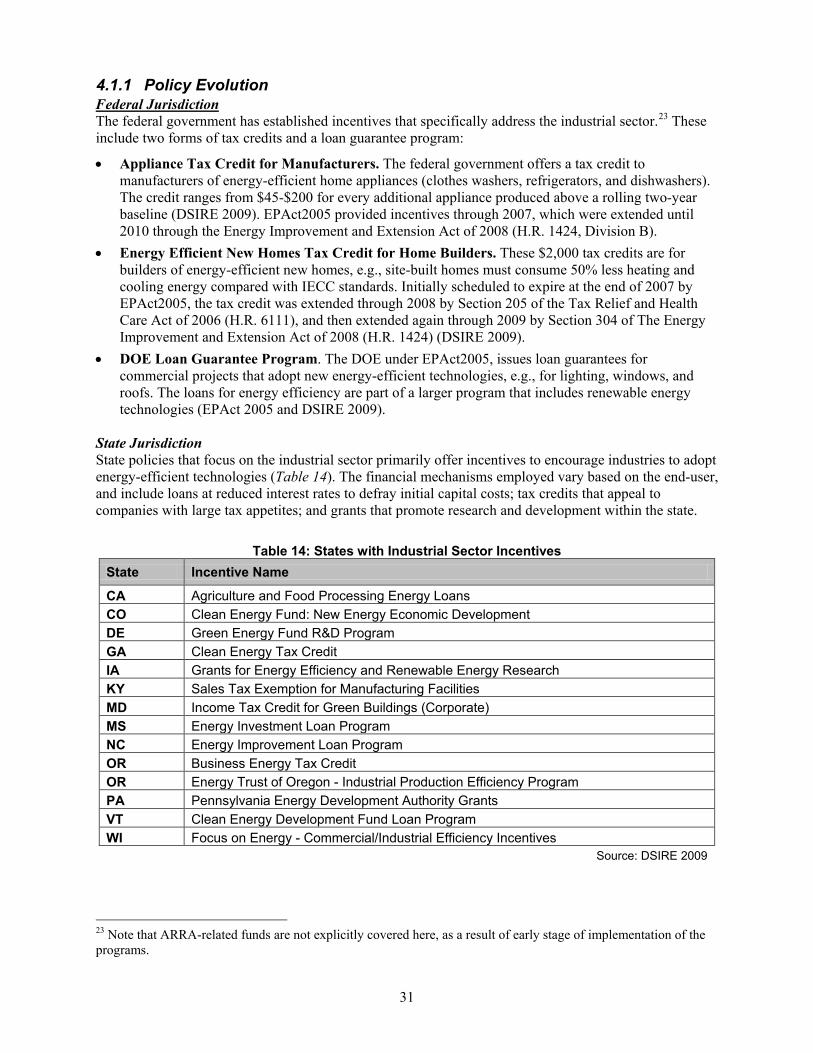
31
The federal government has established incentives that specifically address the industrial sector.Federal Jurisdiction
23
• Appliance Tax Credit for Manufacturers. The federal government offers a tax credit to manufacturers of energy-efficient home appliances (clothes washers, refrigerators, and dishwashers). The credit ranges from $45-$200 for every additional appliance produced above a rolling two-year baseline (DSIRE 2009). EPAct2005 provided incentives through 2007, which were extended until 2010 through the Energy Improvement and Extension Act of 2008 (H.R. 1424, Division B).
These include two forms of tax credits and a loan guarantee program:
• Energy Efficient New Homes Tax Credit for Home Builders. These $2,000 tax credits are for builders of energy-efficient new homes, e.g., site-built homes must consume 50% less heating and cooling energy compared with IECC standards. Initially scheduled to expire at the end of 2007 by EPAct2005, the tax credit was extended through 2008 by Section 205 of the Tax Relief and Health Care Act of 2006 (H.R. 6111), and then extended again through 2009 by Section 304 of The Energy Improvement and Extension Act of 2008 (H.R. 1424) (DSIRE 2009).
• DOE Loan Guarantee Program. The DOE under EPAct2005, issues loan guarantees for commercial projects that adopt new energy-efficient technologies, e.g., for lighting, windows, and roofs. The loans for energy efficiency are part of a larger program that includes renewable energy technologies (EPAct 2005 and DSIRE 2009).
State Jurisdiction State policies that focus on the industrial sector primarily offer incentives to encourage industries to adopt energy-efficient technologies (Table 14). The financial mechanisms employed vary based on the end-user, and include loans at reduced interest rates to defray initial capital costs; tax credits that appeal to companies with large tax appetites; and grants that promote research and development within the state.
Table 14: States with Industrial Sector Incentives State Incentive Name
CA Agriculture and Food Processing Energy Loans CO Clean Energy Fund: New Energy Economic Development DE Green Energy Fund R&D Program GA Clean Energy Tax Credit IA Grants for Energy Efficiency and Renewable Energy Research KY Sales Tax Exemption for Manufacturing Facilities MD Income Tax Credit for Green Buildings (Corporate) MS Energy Investment Loan Program NC Energy Improvement Loan Program OR Business Energy Tax Credit OR Energy Trust of Oregon - Industrial Production Efficiency Program PA Pennsylvania Energy Development Authority Grants VT Clean Energy Development Fund Loan Program WI Focus on Energy - Commercial/Industrial Efficiency Incentives
Source: DSIRE 2009
23 Note that ARRA-related funds are not explicitly covered here, as a result of early stage of implementation of the programs.
4.1.1 Policy Evolution

32
In addition to the specific programs listed in Table 14, general state funding programs that comprise energy efficiency are also available to the industrial sector (Table 15). These programs, typically funded by utility tariffs, oil overcharge, and/or nuclear waste storage agreement tariffs, provide a source of stable funding for loans, grants, education, and public information programs. For industrial audiences, these funds can be used to recruit energy-efficient industries to the state, and help industries defray the capital cost of energy-efficient investments.
Table 15: Program Funding with Industry Applicability State Program
CT New Energy Technology Program MA Energy Efficiency Fund (PBF) ME Efficiency Maine (PBF) MI Low Income and Energy Efficiency Fund (PBF) MT Universal System Benefits Program NH System Benefits Charge NJ Societal Benefits Charge NY Systems Benefit Charge OH Advanced Energy Fund OR Oregon Energy Trust –PBF PA Public Benefits Programs RI Rhode Island Renewable Energy Fund WI Focus on Energy (PBF) VT Efficiency Vermont VT Clean Energy Development Fund
Source: DSIRE 2009 Local Jurisdiction Energy-efficiency incentive programs in local jurisdictions are often non-financial in scope. Historically, industrial energy efficiency at the local level was almost exclusively the realm of utilities, which offered energy audits to industries, after which companies privately implemented the efficiency recommendations. Today, utility programs are still the main driver for local industrial programs, but there are a number of emerging efficiency-related programs that relate to the primary goals of local governments: economic development and job creation.
Unlike the state level, whose programs are funded by statewide fees and therefore can offer financial incentives, local governments face budgetary restrictions and focus instead on non-financial incentives to attract manufacturing and other industrial subsectors. Many companies are specifically targeting the emerging clean energy sector, and consequently are designing incentive policies that reward energy-efficient industries.
Researchers in the Twin Cities of Minneapolis and Saint Paul, for example, have developed recommendations for the cities to attract green manufacturing and other industries using both non-financial and very targeted and restricted financial incentives (Demma et al 2008). Based on experiences in other localities and states, the two non-financial incentives that the researchers recommend are expedited permitting and the creation of an information portal which informs industries of the benefits and opportunities of locating manufacturing plants within the jurisdiction. They also recommend the development of limited green zones where targeted financial incentives, which would be based on the number of new manufacturing jobs, can be used to attract new manufacturers.

33
4.1.2 Policy Impact and Evaluation The impacts of incentive programs vary widely and are generally not well understood or quantified. Moreover, none of the state incentive programs are specifically targeted toward industrial applications, and evaluations of the programs in terms of effectiveness at meeting the needs of the industrial sector have not been completed.
4.2 Technical Assistance Technical assistance programs are designed to help industries identify strategies to reduce energy consumption, such as through energy audits and information campaigns. The intended outcome of such programs is to incorporate energy efficiency into systematic decision-making. This enables industries to “learn by doing.” The programs also extend beyond specific programs and businesses to encourage the industry more broadly to maintain their competiveness through improved efficiencies.
4.2.1 Policy Status Federal Jurisdiction Federally–funded, industrial energy-efficiency programs encourage the adoption of technologies that increase efficiency at the plant level. While there are a number of these programs, the historical leading programs that partner with industry are:
• Department of Energy Industrial Assessment Centers (IAC): The IAC program, started in 1976, is an innovative collaboration among stakeholders from the federal government, universities, and industry. The IAC program trains university engineers to perform industrial energy audits, estimate costs of implementation and financing, and design processes for follow-up in the field (i.e., at the industrial plant operations management level). This is a grass-roots level program to use combined public/private sector resources to assist plant and project-based teams to accomplish large-scale energy efficiency improvements. There are 26 IACs throughout the United States that have, to date, completed over 14,000 project audits and provided over 100,000 recommendations ranging from lighting upgrades to capturing and converting waste heat to electricity. More information is available at: http://www1.eere.energy.gov/industry/bestpractices/about_iac.html.
• Leadership Programs. Because industries vary widely in energy intensity, there is a correspondingly broad range of possibilities to reduce energy use among different industries. The EPA runs voluntary programs in which companies commit to reducing environmental impacts. A key step in moderating environmental impacts is to increase energy efficiency, first at the plant level and successively company-wide. The EPA’s program is entitled ClimateLeaders and information can be found at www.epa.gov/climateleaders/.
• Industries in Focus: These programs offer tailored services on best practices and innovative energy saving ideas for industry. They also offer assistance in identifying funding resources for industry and recognize energy-efficiency leaders. More information is available at: http://www.energystar.gov/index.cfm?c=in_focus.bus_industries_focus.
State Jurisdiction Many of the general state efficiency funding programs described above (Table 15) can be made available to industries. In addition to financial incentives, these programs also offer energy audits and information on how to reduce energy consumption.

34
4.2.2 Policy Impact and Evaluation The IAC program has made a total of 105,656 energy-efficiency recommendations since 1981. Leveraging federal IAC funds,24
Investments in energy efficiency have also achieved benefits that extend beyond energy and financial savings. For example, in the plastics subsector, an IAC audit led to the implementation of energy savings equivalent to over $340,000 dollars annually ($100,000 over the original estimate). These investments had the ancillary benefit of reducing water consumption by over 1.5 million gallons annually (IAC 2006).
companies invested $461 million in implementing 47% (49,602) of the recommendations, with a resulting savings of $554 million (IAC 2009).
In addition, overall industrial improvements can be captured through end uses in other industries, including commercial and residential sectors in motors and HVAC equipment. Because these improvements stem from efficiencies in industrial sector processes, the savings can be partially attributed to the federal and state programs.
Rigorous program evaluation of technical assistance programs at the state level is lacking, but anecdotal evidence suggests a positive impact. As one example, Wisconsin’s “Focus on Energy” program provided a pulp and paper guidebook that increased awareness and implementation of efficiency practices (McKinsey 2009).
One overarching barrier to successful industrial efficiency programs at any level of government is intra-industry cooperation. Industries are reluctant to share energy efficiency technology out of concern for both anti-trust laws and market competition.
4.3 Research and Development Although this report focuses primarily on policies that promote market transformation and deployment strategies for energy efficiency technologies, the DOE sponsors a number of research and development programs across all sectors (buildings, transportation, industry, and power) through the Energy Policy Act of 2005, the Energy Independence and Security Act of 2007, and ARRA 2009. These are somewhat outside the scope of this report, but represent an important role for government and so are summarized for each sector. The DOE sponsors $90 million (FY09, not including ARRA funding) in R&D for the industrial sector, with an overall objective of 20% reductions in energy intensity from 1990 levels in energy-intensive industries by 2020. Specific research funding targets:
• Energy conversion and utilization, such as in gasification technologies, high-efficiency boilers, waste recovery heat exchangers, and cogeneration;
• Energy-intensive and high carbon dioxide-emitting processes, with the goal, for example, of producing high-quality iron without the use of metallurgical coke; and
• Resource recovery and utilization, such as through reductions in material use, improved materials recycling, improved use of wastes and byproducts, and identifying new markets for recovered materials (DOE 2009).
24 Annual program expenditures vary widely, but approximate $4M in 2009.

35
5 Power Sector The electric power sector consumes 40 quadrillion BTUs, or 40% of total primary U.S. energy, almost all of which overlaps with the primary end-users of the generated electricity—the building and industrial sectors (EIA 2008). Energy efficiency policies in the power sector address two concerns: production (plant efficiency) and consumption (end-use efficiency). This report focuses on the later—government policies that support the unique contribution of utilities to end-use efficiency.
As electricity providers, utilities—regulated under either state or local jurisdiction—play a key role in the design and implementation of energy efficiency programs in the United States.25
The role of the federal government with regards to power-sector efficiency has been largely advisory. The federal government employs two primary techniques in this sector to encourage energy efficiency: legislation that requires states to consider certain policies, and funding for state energy-efficiency programs in states that adopt certain policies. The federal government also supports research and development related to many aspects of energy efficiency, including wire conductivity in electronics, the electricity grid, and power storage on the end user side, and efficiency of gas and steam turbines on the production side.
Utilities have direct contact with customers and knowledge of customer needs in relation to electricity production and distribution capacity. Utilities can leverage this knowledge to develop pricing policies and incentive programs that help match demand with production on a temporal basis (hourly, daily, seasonally, etc.)
State governments have primary jurisdiction over utilities, with the exception of municipally-owned utilities and rural electric cooperatives. State-level energy efficiency policies are largely regulatory (as opposed to legislative), and implemented through state public utility commissions, whose commissioners are appointed by governors. Policies include both incentives and technical assistance. Many examples of technical assistance overlap with those already reviewed in the buildings, transportation, and industrial sectors, and are not revisited in this section.
Local governments have jurisdiction over municipally-owned utilities and rural electric cooperatives. Some of these utilities offer financial incentives, such as rebates and loans, for customers to adopt energy-efficient technologies.
Table 16 summarizes the mapping of utility-related energy-efficiency policies by jurisdiction.
Table 16: Map of Utility-based Energy Efficiency Policies by Jurisdiction Federal State Local
Incentives Advisory Some Some
Research and development Yes Some None
Technical Assistance No26 Some Some The following sections summarize the incentive programs and provide an overview of DOE’s funding for R&D.
25 Others in this arena include energy service companies (ESCOs) and governments. 26 Federal programs that help utilities improve plant and grid efficiency through advances in R&D, such as DOE's Distributed Energy and Electric Reliability Program, are not reviewed in this report.

36
5.1 Incentives One of the key methods for reducing energy consumption is to change the incentives of:
• End-users—by making the price of electricity dependent on both the time of day and total electricity usage; by subsidizing the purchase of efficient technologies; and by enabling efficiency investments through on-bill loans and tariff-based financing
• Utilities—by disassociating profits from sales volume, and instead linking profits to reductions in energy demand.
End-users. One type of incentive for end-users focuses on reducing peak electricity demand. The price of electricity for end-users is constant throughout the year, despite potentially drastic seasonal and hourly changes in costs to the utilities to provide this electricity. With more accurate time-based price signals and information feedback—which will become available with smart meters—end-users have a financial incentive to reduce electricity demand during peak periods, when electricity costs are most expensive.
A second type of incentive aimed at end-users targets total electricity demand. One example is a tiered-pricing structure that increases the cost of electricity for incrementally larger blocks of electricity consumption. For example the price of electricity for the first 500 kWh consumed in a month is $0.08/kWh, whereas the price of electricity consumed for the next 500kWh in that month is $0.12/kWh. This price signal encourages end-users to reduce total demand.
A third type of utility-based incentive, which also seeks to reduce total electricity demand, is direct financial incentives including rebates and loans to help subsidize the cost of purchasing energy audits and efficient technologies such as light bulbs and appliances. One type of loan—on-bill and tariff-based—allows consumers to repay energy-efficiency upgrades through their utility bills. Utilities pay for the upgrade (e.g., insulation, lighting), and require consumers to either repay the costs through a loan, which consumers would need to repay even if they moved, or through a higher tariff, which would remain with the house. Eligible upgrades are restricted to those in which the energy cost savings exceed the monthly principal and interest repayments on the upgrade loan. These types of end-user incentives are a few examples of a broader collection of utility-sponsored “demand-side management” programs.
Utilities. Historically in the United States, utility revenues are based on volumetric sales of electricity, creating a financial incentive to sell greater volumes of electricity (commonly called the “throughput incentive”), and a disincentive for utilities to support energy-efficiency programs. In efforts to align utilities’ financial incentives with the benefits of energy efficiency to the public, state and sub-state regulatory bodies that have jurisdiction over utilities have developed multiple solutions to reverse this disincentive, with varying success.
One successful example of regulatory change is to disassociate utility profits from sales volume; this is called “decoupling.” Under decoupling, utilities receive differing rates (per kWh) depending on total electricity demand. If demand increases above a state-identified target, the rates fall; if demand decreases, rates rise. In this way, utilities have a financial incentive to help end-users reduce energy demand to receive higher per kWh rates, e.g., by providing end-user financial incentives (such as subsidized energy audits and energy-efficient appliances), or by providing technical assistance and information on how to reduce demand.

37
5.1.1 Policy Evolution Federal Jurisdiction In the power sector, the role of the federal government has largely been advisory, but key legislations have strengthened this advisory role. For example, with the issuance of the Public Utility Regulatory Act of 1978 (PURPA), the federal government required state and sub-state utility regulatory boards to consider certain programs and policies suggested by federal legislation. In this way, the states maintained jurisdiction of regulating utilities, but the federal government had a role in requiring that regulatory boards consider widespread improvements in energy efficiency and renewable energy (commonly called, “states-must-consider” legislation) (Persons 1995). Both EPAct2005 and EISA2007 have expanded the original PURPA to include new states-must-consider legislation. In practice, some states extensively adopt the federal government’s proposed legislation; other states have considered and rejected the suggestions.
Another key legislation that has strengthened the advisory role of the federal government is ARRA (2009). This legislation requires governors to at least annually seek to implement processes that will lead to the alignment of utility incentives with energy efficiency in order to receive SEP grant funding in upcoming years. This provision was generalized to include a broader set of incentive alignment strategies from an earlier version that requires decoupling utility revenues from volumetric electricity sales, a practice already in place in some states (detailed under “State Jurisdiction” below).
An emerging trend in federal energy legislation builds upon highly successful renewable portfolio and energy efficiency resource standards at the state level. These mechanisms mandate that utilities or other load serving entities reduce electricity consumption, typically by a percentage of baseline energy use using a standard methodology to calculate savings. Utilities then use cost-effective options to fulfill the mandate, or provide an alternative minimum payment. In the 2008-2009, U.S. legislative session, House Resolution 245427 and Senate Bill 146228
Another emerging policy trend is to establish a comprehensive, stakeholder-based policy implementation plan, such as the National Action Plan for Energy Efficiency (
are examples of this strategy. At the time of this reporting, both bills are in committee review.
Text Box ). In this strategy, the federal government does not mandate policy changes, but facilitates a wide consensus among public and private sectors on policy steps needed to advance energy efficiency.29
Table 17 summarizes federal legislation applied to the power sector.
27 The current status of the bill can be found at: http://thomas.loc.gov/cgi-bin/bdquery/z?d111:h.r.00889: 28 The current status of the bill can be found at: http://thomas.loc.gov/cgi-bin/bdquery/z?d111:SN00548:@@@L&summ2=m& 29 Another example of a policy that has been implemented vertically through jurisdictional levels and broadly across economic sectors is the federally-driven environmental policy, Title 40 “Protection of the Environment” (http://www.epa.gov/lawsregs/search/40cfr.html), which governs a diverse range of pollution sources.

38
Text Box 3
National Action Plan for Energy Efficiency
The National Action Plan for Energy Efficiency (Action Plan) is a public-private partnership established with a central goal of leveraging opportunities to improve energy efficiencies in the gas and electric power sectors. The Action Plan is led by DOE and EPA and includes over 100 electricity and gas utilities, consumer advocates, and government and regulatory agencies. The stakeholder partnership envisions, plans, implements, and tracks progress toward adopting recommendations to increase energy efficiency.
The recommendations developed by the stakeholder group are not mandatory. However, the stakeholders include all affected parties, and their recommendations therefore represent an acceptable compromise for many. In addition, the collaborative approach allows for creative ideas without fear of regulatory action.
In 2006, the 100 stakeholders developed the following overarching recommendations to utilities and commissioners interested in maximizing energy efficiency:
• Recognize energy efficiency as a high-priority energy resource. • Make a strong, long-term commitment to implement cost-effective energy efficiency as a resource. • Broadly communicate the benefits of and opportunities for energy efficiency. • Promote sufficient, timely, and stable program funding to deliver energy efficiency where cost-
effective. • Modify policies to align utility incentives with the delivery of cost-effective energy efficiency and
modify ratemaking practices to promote energy efficiency investments.
To carry out these recommendations, the Action Plan stakeholders develop and exchange policy suggestions, definitions of best practices, case studies, and analyses of potential impacts of policy changes to support ten specific sector-based goals:
1. Establishing cost-effective energy efficiency as a high-priority resource 2. Developing processes to align utility and other program administrator incentives such that efficiency
and supply resources are on a level playing field 3. Establishing cost effectiveness tests 4. Establishing evaluation, measurement, and verification mechanisms 5. Establishing effective energy efficiency delivery mechanisms 6. Developing state policies to ensure robust energy efficiency practices 7. Aligning customer pricing and incentives to encourage investment in energy efficiency 8. Establishing state-of-the-art billing systems 9. Implementing state-of-the-art efficiency information sharing and delivery systems 10. Implementing advanced technologies.
Finally, the Action Plan creates a centralized body of programmatic information, evaluation methods and informative impact assessments, as well as opportunities for peer-level exchange on energy efficiency and progress tracking, available to both collaborative members and the general public on the Web site http://www.epa.gov/cleanenergy/energy-programs/napee/index.html.

39
Table 17: Federal Regulations related to Energy in the Power Sector
Policy Description Citation
Department of Energy Organization Act of 1977
Establishes the Federal Regulatory Commission, an independent body that regulates interstate electricity sales and other interstate policy issues.
84 USC
Public Utility Regulatory Power Act of 1978
Requires electric utilities to buy power from non-utility electric power producers at the "avoided cost" rate, which is the cost the electric utility would incur were it to generate or purchase from another source. Extends FERC jurisdiction over small power plant production and cogeneration.
16 U.S.C. Sections 2601-2645
Energy Policy Act of 2005 (EPAct05)
Amends PURPA section 111d to require utilities to make available net metering, smart meters, and peak-load reduction agreements (EPAct 05 Section 1251).
42 USC, PL 109-58
Energy Independence and Security Act of 2007 (EISA 2007)
Adds four “states-must-consider” standards to PURPA in EISA 2007 Sections 532 and 1307, including integrated resource planning, rate design modification to promote energy efficiency investments, consideration of smart grid investments, and smart grid information.
42 USC, PL 110-140
American Recovery and Reinvestment Act of 2009 (ARRA 2009)
Requires governors to begin the process of aligning utility incentives with energy efficiency in order to receive state energy program grant funding (42 U.S.C. 6321 et seq.).
Section 410(1)
State Jurisdiction Public utility commissions regulate at the state level all utilities that are within their jurisdiction, which typically include all of the private investor-owned utilities (IOUs) in the state. Municipal utilities and rural electric co-operatives are regulated separately, and are discussed under “local jurisdiction.”
The primary power-sector, state-level regulation pertaining to energy efficiency recently has been to decouple utility sales revenues from volumetric electricity sales. When well designed, decoupling provides an incentive for utility companies to invest in energy efficiency without the risk of revenue loss.
California has maintained one of the most notable successes in decoupling since 1981 (Risser 2006). Decoupling provided an incentive for utilities to design and implement cutting-edge energy-efficiency programs, which resulted in extensive efficiency gains (Risser 2006, Eto et al. 1997), and contributed to the stabilization of consumption intensity in the state (Rosenfeld 2003). Since then nine states have adopted variations of California’s decoupling program to fit different state needs and priorities (Sedano 2009, Action Plan 2008, see specifically Appendix A of that document). Five states have pending regulation or legislation regarding decoupling (Figure 7).

40
Figure 7: Electric Decoupling Activities in the United States as of May 2009
Other state policies in the power sector are summarized in a report by the National Action Plan for Energy Efficiency. The Action Plan lists the current status of state policies relative to the Plan’s ten implementation goals (Table TB-1 from Action Plan 2008, reprinted in Appendix C). Subsequent updates will illustrate progress toward the Action Plan goals.
Local Jurisdiction The two types of utilities regulated at the local level are municipal and rural electric cooperatives. Both of these types of utilities frequently offer energy efficiency programs across all end-use sectors, both to promote efficient use of energy and avoid building power plants or purchasing expensive additional power.
Municipal Utilities. Municipal utilities operate as a branch of local government. Their utility programs are often highly targeted to the specific needs of the municipality. For example, the Sacramento Municipal Utility District (SMUD) offers product rebates and loans in the residential and commercial sectors in order to serve the broad needs of constituents, some of whom require financing support and some of whom require capital-cost reduction (SMUD 2009). Some municipalities model their programs on or partner with larger area utilities to develop co-branded products. For example, CoolAdvantage, an air conditioner rebate program, is implemented by the New Jersey Bureau of Public Utilities, and also used and co-branded by Atlantic City Electric (a municipal utility) (NJ Clean Energy 2009). In this way, municipal utilities can leverage limited resources.

41
Electric Cooperatives. Electric cooperatives are member-owned. A subset of these, Rural Electric Cooperatives (Co-op), are regulated by their member owners through the periodic election of a Co-op Board, which serves as the regulatory body. In this way, the Co-ops function somewhat like municipal utilities and can closely reflect the wishes and needs of the local communities. The Kauai (Hawaii) Co-op, for example, provides residential and commercial customers with energy efficient loans and rebates, as well solar water heating programs to take advantage of the island’s solar resources (KIUC 2009).
5.1.2 Policy Impact and Evaluation The effectiveness of the “states-must-consider” approach in terms of improving energy efficiency is challenging to track due to the various ways the suggested policies are integrated at the state level.
Decoupling as a policy tool has been more extensively evaluated. That only a minority of states have adopted decoupling is the result of multiple factors, including some notable implementation challenges. Transforming the business models of utilities is a fundamental change, and the regulatory language of decoupling can be complicated and create unintended results.
In Maine, for example, decoupling was implemented in 1991, and ended less than a year later as a result of a large requested rate increase associated, in part, with the decoupling program. Scholars agree that poor design of the decoupling program was the culprit. The design of the program did not allow for changes in weather to be incorporated into the calculation of expected revenue for the utility, and so a mild winter compared with the base year resulted in a large windfall for the utility (Hudson et al 1995). Successful policy design must also include an evaluation of state and stakeholder priorities, in order to establish buy-in and minimize the opportunities for failure.
5.2 Research and Development Although this report focuses primarily on policies that promote market transformation and deployment strategies for energy efficiency technologies, the DOE sponsors a number of research and development programs across all sectors (buildings, transportation, industry, and power) through the Energy Policy Act of 2005, the Energy Independence and Security Act of 2007, and ARRA 2009. These are somewhat outside the scope of this report, but represent an important role for government and so are summarized for each sector. The DOE sponsors $100 million (FY09, not including ARRA funding) in R&D for the power sector, including research on:
• High-temperature superconductivity (HTS) wires, which have 100 times the capacity of conventional wires, and the use of HTS in a wide range of equipment;
• Transmission and distribution, including technologies to improve reliability and facilitate customer participation in electricity markets; and
• Energy storage, with one goal of reducing peak demand and power quality disturbances, and a second goal of improving storage for stationary applications, such as renewable energies (DOE 2009).

42
6 Discussion: Trends in Energy Efficiency Policy Development
This report catalogues federal, state, and local energy efficiency policies in the buildings, transportation, industrial, and power sectors from the 1970’s forward, and identifies some prominent policy trends. This effort is a first step toward informing stakeholders—legislators, regulators, and business and consumer groups—about individual programs and policies, in anticipation of increased policy integration in the future. Four key observations based on research for this report are summarized below. 1. Leadership on energy efficiency is necessary—and is found—at each level of government.
Policies initiated at state and local levels, within diverse political and economic contexts, can inform how similar policies can be employed and scaled-up in other places and jurisdictions. California, for example, has repeatedly designed efficiency programs that have served as models elsewhere. Federal leadership is also key, not only for the benefit of consumers and manufacturers, but also to provide the impetus for the country as a whole to realize its energy efficiency potential in order to improve the economy, environment, and national security.
2. There is no widely accepted methodology for evaluating energy efficiency policies.
Measuring policy impact is critical for evaluating the effectiveness of policies at all levels of government. But such measurement is difficult due to the overlapping nature of policy implementation, the lack of coordination of intended impacts, and the challenge of calculating and attributing whether actual energy savings result from a particular policy.
3. Coordination among the three levels of government—and across sectors—is increasingly important, and there are opportunities to significantly improve policy performance through a unified strategy.
There is currently no comprehensive policy strategy for energy efficiency in the United States. Policies are conceived within narrow political constraints based on some specific need, and without a thorough consideration of the policies’ interaction with other policies. The result is a geographically and economically fragmented patchwork of tactics and policy design, which, in turn, contributes to regulatory uncertainty and private-sector inaction.
As the economy grows increasingly connected—particularly when technological innovations like the Smart Grid affect all sectors—the interaction among these policies becomes more important. A strategic approach to improving energy efficiency in the United States would coordinate efforts across jurisdictions and sectors, and would necessarily consider broad questions such as:
1. What barriers to energy efficiency are insufficiently addressed by current policies among the three levels of government?
2. What areas of policy jurisdiction overlap among the three levels of government, and which policy features are appropriate to implement at each governmental level?
3. How can policies that cross different levels of government accommodate differing policy drivers?
4. What methods can best be used to measure impacts—intentional and unintentional—of energy policies?

43
Stakeholder-led efforts are one avenue to meet the challenge of these questions. This approach has already been successfully demonstrated, e.g., in the National Action Plan for Energy Efficiency. As discussed in Text Box 3, a wide array of Action Plan stakeholders—including different levels of government—identified policy strategies that drew from their various strengths, interests, and capabilities, and in this way resulted in a strategy that provides useful coordination and internal consistency between policies at all three levels. This approach requires strong leadership from a central body, in this case the EPA, as well as a commitment from stakeholders to a sustained, collaborative process. Such methods have been successfully implemented in other countries, and a study of these cases, such as may be available through the International Partnership for Energy Efficiency Cooperation and other multilateral collaborations, may be useful in crafting approaches to policy integration.
4. There are efficiencies to be gained by informing policies in one sector with experience from others.
In each sector, similar energy policy tools are employed—baseline standards, beyond-baseline incentives, labeling, technical assistance, and public leadership—but the relative use of each tool within overall policy varies significantly by sector. These differences reflect a number of factors, including the relative strengths of governing jurisdictions, political expediency, and technological and economic limitations (e.g., it is easier to define, measure, and label the efficiency of standardized vehicles than of unique building constructions). A more effective policy approach to energy efficiency would find ways to move beyond these established constraints toward a comprehensive assessment of energy efficiency barriers and the policies needed to address them.

44
Appendix A: Statewide Building Code Status Summary status of statewide building codes for commercial and residential standards, including states with “Lead by example” efficiency standards for public buildings, and effective year. Statewide Building Codes Lead by example
State Commercial Residential Effective Year
AK
AL 2006
AR 2003 IECC/ ASHRAE 90.1-2001 2003 IECC 2005
AZ 2005
CA ASHRAE 90.1-2007 2006 IECC 2007
CO 2005/2007
CT 2003 IECC/ ASHRAE 90.1-2001 2003 IECC 2007
DC 1998-2001 IECC 2004
DE 2001IECC/ ASHRAE 90.1-1999 or eq (EPCA) 1998-2001 IECC 2004
FL ASHRAE 90.1-2007 1998-2001 IECC 1974
GA 2006 IECC/ ASHRAE 90.1-2004 2006 IECC
HI 2008
IA 2006 IECC/ ASHRAE 90.1-2004 2006 IECC 2008
ID 2006 IECC/ ASHRAE 90.1-2004 2006 IECC
IL 2006 IECC/ ASHRAE 90.1-2004 2005
IN Pre-1998 IECC 2008
KS 2007
KY 2006 IECC/ ASHRAE 90.1-2004 2006 IECC 2005
LA 2006 IECC/ ASHRAE 90.1-2004 2006 IECC 2007
MA ASHRAE90.1-2007 2006 IECC 2007
MD 2006 IECC/ ASHRAE 90.1-2004 2006 IECC 1992
ME 2006 IECC/ ASHRAE 90.1-2004 2003
MI 2001 IECC/ ASHRAE 90.1-1999 or eq (EPCA) 2006 IECC 2007
MN Pre-1998 IECC 2005
MO 1993
MS
MT 2003 IECC/ ASHRAE 90.1-2001 2003 IECC
NC 2006 IECC/ ASHRAE 90.1-2004 2003 IECC 2007
ND Pre-1998 IECC
NE 2003 IECC/ ASHRAE 90.1-2001 2003 IECC

45
Summary status of statewide building codes for commercial and residential standards, including states with “Lead by example” efficiency standards for public buildings, and effective year. Statewide Building Codes Lead by example
State Commercial Residential Effective Year
NH 2006IECC/ ASHRAE90.1-2004 2006 IECC 2005
NJ 2006 IECC/ ASHRAE 90.1-2004 2006 IECC 2002
NM 2006IECC/ ASHRAE 90.1-2004 2006 IECC 2007
NV 2006 IECC/ ASHRAE 90.1-2004 2006 IECC 2008
NY 2006 IECC/ ASHRAE 90.1-2004 2006 IECC 2001
OH 2003 IECC 2007
OK 1998-2001 IECC 2008
OR 2006 IECC/ ASHRAE 90.1-2004 2006 IECC 2008
PA 2006IECC/ ASHRAE90.1-2004 2006 IECC 2004
RI 2006IECC/ ASHRAE90.1-2004 2006 IECC 2005
SC 2006IECC/ ASHRAE90.1-2004 Pre-1998 IECC 2007
SD Pre-1998 IECC 2008
TN Pre-1998 IECC 2008
TX 2003 IECC/ ASHRAE 90.1-2001 1998-2001 IECC 2001
UT 2006 IECC/ ASHRAE 90.1-2004 2006 IECC 2006
VA 2006 IECC/ ASHRAE 90.1-2004 2007
VT 2006 IECC/ ASHRAE 90.1-2004 1998-2001 IECC
WA 2006 IECC/ ASHRAE 90.1-2004 2006 IECC 2005
WI 2006 IECC/ ASHRAE 90.1-2004 Pre-1998 IECC 2006
WV 2003 IECC/ ASHRAE 90.1-2001 2003 IECC
WY
USA 2005 Source: DSIRE 2009

46
Appendix B: State Incentives and Regulations in the Transportation Sector State Incentives State Regulations
Stat
e
HO
V Ex
empt
ion
AFV
Reb
ate
(with
EE)
Emis
sion
s R
educ
tion
Gra
nts
HEV
/HE
Vehi
cle
Tax
Ince
ntiv
es
Idle
Red
uctio
n In
cent
ives
Ex
empt
ion
Emis
sion
s Te
stin
g M
anuf
actu
ring
Ince
ntiv
es
R&
D
Park
ing
Ince
ntiv
es
Lead
By
Exam
ple
Stat
e En
ergy
&
Clim
ate
Plan
Vehi
cle
Labe
ling
Tire
Infla
tion
Prog
ram
Idle
Red
uctio
n R
ules
AK x AR x x x AZ x x CA x x X x x x x x CO x x x CT x x x DC x x DE x FL x x x x GA x x HI x x IA x ID x IL X x x x IN x KS x KY x LA x MD x x x x ME x x MI x x MN x x x MO x x MS x MT x NC X x NE x NH x x NJ x x x x x NM x x x x NV x NY x X x x OR X x x x PA X x x RI x x

47
State Incentives State Regulations St
ate
HO
V Ex
empt
ion
AFV
Reb
ate
(with
EE)
Emis
sion
s R
educ
tion
Gra
nts
HEV
/HE
Vehi
cle
Tax
Ince
ntiv
es
Idle
Red
uctio
n In
cent
ives
Ex
empt
ion
Emis
sion
s Te
stin
g M
anuf
actu
ring
Ince
ntiv
es
R&
D
Park
ing
Ince
ntiv
es
Lead
By
Exam
ple
Stat
e En
ergy
&
Clim
ate
Plan
Vehi
cle
Labe
ling
Tire
Infla
tion
Prog
ram
Idle
Red
uctio
n R
ules
SC x x TN x x X x UT x x VA x x X x VT x X WA X x x WI x x X x X x WV x
TOT 10 2 7 6 12 1 2 5 1 25 9 1 1 26
Source: 2009 AFDC Summary of State Incentives and State Regulations

48
Appendix C: Action Plan Progress Report Progress in Meeting Implementation Goals as of December 2007.
Implementation Goal and Key Steps States Having Adopted Policy
Electricity Natural Gas
Complete Partially Complete Partially Goal One: Establishing Cost-Effective Energy Efficiency as a High-Priority Resource
1 Process in place, such as a state and/or regional collaborative, to pursue energy efficiency as a high-priority resource. 14 0 14 0
2 Policy established to recognize energy efficiency as high-priority resource. 21 22 8 8
3 Potential identified for cost-effective, achievable energy efficiency over the long term. 25 1 13 0
4 Energy efficiency savings goals or expected energy savings targets established consistent with cost-effective potential. 15 3 5 2
5 Energy efficiency savings goals and targets integrated into state energy resource plan, with provisions for regular updates. 0 16 0 1
6 Energy efficiency savings goals and targets integrated into a regional energy resource plan.** TBD TBD TBD TBD
Goal Two: Developing Processes to Align Utility Such That Efficiency and Supply Resources Are on a Level Playing Field and Other Program Administrator Incentives
7 Utility and other program administrator disincentives are removed.
17 8 18 5
8 Utility and other program administrator incentives for energy efficiency savings reviewed and established as necessary.
10 5 5 2
9 Timely cost recovery in place.** TBD TBD TBD TBD Goal Three: Establishing Cost-Effectiveness Tests
10 Cost-effectiveness tests adopted which reflect the long-term resource value of energy efficiency.
29 2 9 0
Goal Four: Establishing Evaluation, Measurement, and Verification Mechanisms
11 Robust, transparent EM&V procedures established. 14 6 5 2
Goal Five: Establishing Effective Energy Efficiency Delivery Mechanisms
12 Administrator(s) for energy efficiency programs clearly established. 24 2 13 1
13 Stable (multi-year) and sufficient funding in place consistent with energy efficiency goals. 4 9 2 4
14 Programs established to deliver energy efficiency to key customer classes and meet energy efficiency goals and targets. 24 2 7 0
15 Strong public education programs on energy efficiency in place. 18 5 13 6
16 Energy efficiency program administrator engaged in developing and sharing program best practices at the regional and/or national level.
30 0 18 0

49
Implementation Goal and Key Steps States Having Adopted Policy
Electricity Natural Gas
Complete Partially Complete Partially
Goal Six: Developing State Policies to Ensure Robust Energy Efficiency Practices
17 State policies require routine review and updating of building codes. 28 13 28 13
18 Building codes effectively enforced.** TBD TBD TBD TBD
19 State appliance standards in place. 11 0 11 0
20 Strong state and local government lead-by example programs in place. 13 24 13 24
Goal Seven: Aligning Customer Pricing and Incentives to Encourage Investment in Energy Efficiency
21 Rates examined and modified considering impact on customer incentives to pursue energy efficiency. 7 5 2 0
22 Mechanisms in place to reduce consumer disincentives for energy efficiency (e.g., including financing mechanisms). 4 1 0 0
Goal Eight: Establishing State of the Art Billing Systems
23 Consistent information to customers on energy use, costs of energy use, and options for reducing costs.**
TBD TBD TBD TBD
Goal Nine: Implementing State of the Art Efficiency Information Sharing and Delivery Systems
24 Investments in advanced metering, smart grid infrastructure, data analysis, and two-way communication to enhance energy efficiency. 5 29 *** ***
25
Coordinated energy efficiency and demand response programs established by customer class to target energy efficiency for enhanced value to customers.** TBD TBD *** ***
26 Residential programs established to use trained and certified professionals as part of energy efficiency program delivery. 9 0 9 0
Goal Ten: Implementing Advanced Technologies
27 Policies in place to remove barriers to combined heat and power. 11 24 *** ***
28 Timelines developed for the integration of advanced technologies.** TBD TBD TBD TBD
* See Action Plan 2007, Appendix D for additional information on how these numbers have been determined. ** See Action Plan Appendix D for discussion of why progress on this policy step is not currently measured. ***Steps 24, 25, and 27 do not apply to natural gas. TBD = To be determined
SOURCE: Replicated from Table ES-1 in Action Plan 2008
50
References [ACEEE] American Council for an Energy-Efficient Economy. 2009. "Appliance and Equipment
Efficiency Standards: One of America's Most Effective Energy-Saving Policies." Retrieved July 17, 2009, from http://www.aceee.org/energy/applstnd.htm.
[Action Plan] National Action Plan for Energy Efficiency. 2008. National Action Plan for Energy Efficiency Vision Plan 2025: A Framework for Change. URL: www.epa.gov/eeactionplan
[AFDC] Alternative Fuels & Advanced Vehicles Data Center. United States Incentives and Laws. URL: http://www.afdc.energy.gov/afdc/progs/fed_summary.php/afdc/US/0. Accessed January 2009.
[APS] American Physical Society. 2008. "Energy Future: Think Efficiency." from http://www.aps.org/energyefficiencyreport/report/aps-energyreport.pdf.
[ASAP] Appliance Standards Awareness Project. 2007. Fact Sheet: Appliance Efficiency Standards in the 2007 Energy Bill. URL: http://www.standardsasap.org/documents/2007EnergyBill_Standardsfactsheet.pdf. Accessed January 2009.
----. 2009. Federal Standards. URL: http://www.standardsasap.org/federal.htm. Accessed July 2009.
[BCAP] Building Codes Assistance Project. 2008. "Residential Building Energy Codes: Enforcement and Compliance Study." Retrieved July 13, 2009, from http://bcap-energy.org/files/Residential_Survey_Report_Oct08.pdf
Berkeley. 2008. City of Berkeley Climate Action Plan. URL:
http://www.berkeleyclimateaction.org/docManager/1000000221/AA.CAP_Complete_doc.pdf. Accessed May 2009.
Brown, E., and S. Busche. 2008. State of the States 2008. Renewable Energy Trends and the Role of Policy. Golden, Co: NREL.
Brown, E. and G. Mosey. 2008. Analytic Framework for Evaluation of State Energy Efficiency and Renewable Energy Policies with Reference to Stakeholder Drivers. 10 pp. NREL Report No. TP-670-43539.
Demma, J., A. Hagar, L. Mcilvaine, K. Mitchell, K. Swanson, A. Vesota Flack, and C. Campbell. 2008. Minneapolis Saint Paul: Green Cities Green Jobs. Prepared for the Mayors’ initiative on green manufacturing. URL: http://www.ci.stpaul.mn.us/DocumentView.asp?DID=5757.
Deumling, R. 2008. "Public Policies, Private Choices: Consumer Desire and the Practice of Energy Efficiency."
Accessed May 2009.
Environmental Energy Technologies Division Seminars Retrieved June 22, 2009, from http://eetdseminars.lbl.gov/download/Deumling_LBNL.Slides.5.27.08.pdf.
[DOE] Department of Energy. 2009. Questionnaire for Energy Efficiency Compendium for APERC.

51
[DSIRE] Database of State Renewable Energy and Energy Efficiency Incentives. 2009. Energy Efficiency Incentives and Regulations Search Page. URL: http://www.dsireusa.org/library/includes/incentive2.cfm?Incentive_Code=US04R&State=federal¤tpageid=1&ee=1&re=0. Accessed January 2009.
[EERE] US Department of Energy, Office of Energy Efficiency and Renewable Energy. 2009a. Appliance and Commercial Equipment Laws and Regulations Web Page. URL: http://www1.eere.energy.gov/buildings/appliance_standards/laws_regs.html. Accessed January 2009.
----. 2009b. Energy Intensity Indicators 1985-2003. URL: http://www1.eere.energy.gov/ba/pba/intensityindicators/index.html. Accessed March 2009.
----. 2008. "Energy Efficiency Trends in Residential and Commercial Buildings." from http://apps1.eere.energy.gov/buildings/publications/pdfs/corporate/bt_stateindustry.pdf.
[EIA] Energy Information Administration. 2008. Annual Energy Review 2008.
Eldridge, M., M. Neubauer, D. York, S. Vaidyanathan, A. Chittum, and S. Nadel. 2008. The 2008 State Energy Scorecard. ACEEE RPT: E086. ACEEE: Washington, DC.
Eley Associates. 1999. Energy Code Compliance Study: Honolulu and Hawaii Counties. Prepared for the State of Hawaii, Department of Business, Economic Development, and Tourism: Energy, Resources, and Technology Division.
Energy Star. 2009a. Qualifying Products for Federal Tax Credits for Energy Efficiency in Primary Residence. URL: http://www.energystar.gov/index.cfm?c=products.pr_tax_credits#c1. Accessed July 2009.
Energy Star. 2009b. History: ENERGY STAR Website. URL: http://www.energystar.gov/index.cfm?c=about.ab_history. Accessed January 2009.
[EPA] Environmental Protection Agency. 2009. "EPA Grants California GHG Waiver." Retrieved June 30, 2009, from www.epa.gov/newsroom.
----. 2008. Light-Duty Automotive Technology and Fuel Economy Trends: 1975 Through 2008, Executive Summary. http://www.epa.gov/OMS/cert/mpg/fetrends/420s08003.pdf (EPA420-S-08-003)
Eto, J., S. Stoft, and T. Belden. 1997. The Theory and Practice of Decoupling Utility Revenues from Sales. Utility Policy: Volume 6, Issue 1, March 1997, Pages 43-55.
.
Federal Highway Administration. 2009. "Average Age of Automobiles and Trucks in Use, 1970-1999." Retrieved July 9, 2009, from http://www.fhwa.dot.gov/ohim/onh00/line3.htm.
Flagstaff. 2009. Auto Rebate Program Requirements. Website: http://www.flagstaffchamber.com/pdf/Auto_Rebate_Pgm_Requirements.pdf. Accessed May 2009.
Geller, H. and S. Nadel. 1994. Market Transformation Policies to promote end use efficiency. ACEEE-E941. Washington, DC: ACEEE

52
Gigaton Throwdown 2009. Gigaton Throwdown: Redefining What's Possible for Clean Energy by 2020. San Francisco, CA, Gigaton Throwdown Initiative.
Gillingham, K., R. Newell, and K. Palmer. 2006. Energy Efficiency Policies: A Retrospective
Examination. Annual Review of Environmental Resources 31:161-92.
Hudson, L. et al. 1995. Maine’s Electric Adjustment Mechanism: Why It Fizzled. Electricity Journal: Volume 8, October 1995, Pages 74-83.
[IAC] Industrial Assessment Center. 2009. Database of IAC Efforts. URL: http://iac.rutgers.edu/database/recommendations.php. Accessed March 2009
----. 2006. Case Study, Plastics: Vinyl Flooring Texas Tile Manufacturing LLC: Additional Savings are a Pleasant Surprise. URL: http://iac.rutgers.edu/redirect.php?rf=AM0517CaseStudy. Accessed March 2009.
[IEA] International Energy Agency. 2009. Progress with Implementing Energy Efficiency Policies in the G8, OECD/IEA.
[IPCC] Intergovernmental Panel on Climate Change. 2007. Climate Change 2007: Mitigation.
Contribution of Working Group III to the Fourth Assessment Report of the Intergovernmental Panel on Climate Change
. Cambridge, United Kingdom and New York, NY, USA, Cambridge University Press.
Johnson, C. 2009. "Municipal Energy Financing." Innovative Energy Efficiency Financing Approaches
[KIUC] Kauai Island Utility Cooperative. 2009. Website: Energy –Information, Savings, and Safety. URL:
Retrieved June 22, 2009, from http://www.eecbg.energy.gov/Downloads/EECBG_Innovative_EE_Financing_Approaches_Webcast_060109.pdf
http://www.kiuc.coop/indexenergy.htm. Accessed May 2009.
Lantz, E. (forthcoming). State Policy and the Pursuit of Renewable Energy Manufacturing. State Clean Energy Practices
[LBL] Lawrence Berkeley Laboratory. 2009. Energy Efficiency Standards Website. URL:
, National Renewable Energy Laboratory.
http://ees.ead.lbl.gov/node/2. Accessed January 2009.
Linstroth, T and R. Bell. 2007. Local Action: The New Paradigm in Climate Change Policy. UPNE.
McKinsey & Company. 2009. Unlocking Energy Efficiency in the U.S. Economy. McKinsey Global Energy and Materials, McKinsey & Company.
Meyers, S. J. McMahon, J. McNeil, and X. Liu. 2003. Impacts of US federal energy efficiency standards for residential appliances. Energy 28 (2003) 755-767.
Meyers, S. J. McMahon, and B. Atkinson. 2008. Realized and Projected Impacts of US Energy Efficiency Standards for Residential and Commercial Appliances. LBNL-63017. URL: http://www.osti.gov/bridge/servlets/purl/938510-IKYBEw/938510.PDF

53
[MN] Minneapolis, MN. 2008. Greenprint Minneapolis 2008 Report. URL: http://www.ci.minneapolis.mn.us/sustainability/docs/GreenPrint2008.pdf. Accessed May 2009.
[MN AQ] Minneapolis, MN Office of Air Quality. 2008. Anti-idling Ordinance. URL: http://www.ci.minneapolis.mn.us/airquality/AntiIdling_home.asp. Accessed May 2009.
Nadel, S., A. deLaski, et al. 2005. Leading the Way: Continued Opportunities for New State Appliance and Equipment Efficiency Standards. American Council for an Energy-Efficient Economy and Appliances Standards Awareness Project.
[NAS] Committee on the Effectiveness and Impact of Corporate Average Fuel Economy (CAFE) Standards, National Research Council. 2002. Effectiveness and Impact of Corporate Average Fuel Economy (CAFE) Standards. National Academy of Sciences: Washington, DC.
NJ Clean Energy. 2009. Website: CoolAdvantage Program. URL: http://www.njcleanenergy.com/residential/programs/cooladvantage/cooladvantage-program. Accessed May 2009.
Oregon Department of Energy. 2008. "Oregon Business Energy Tax Credit." Retrieved July 17, 2009, from http://egov.oregon.gov/ENERGY/CONS/BUS/docs/betcbro.pdf.
Persons, G. 1995. The Making of Energy and Telecommunications Policy. Praeger Publishing, Westport, Connecticut.
Risser, R. 2006. Decoupling in California: More than Two Decades of Broad Support and Success. Presentation to the NARUC Workshop on Workshop on Aligning Regulatory Incentives with Demand-Side Resources. URL: http://www.narucmeetings.org/Presentations/Risser.pdf. Accessed May 2009.
Rosenfeld, A. H. 2008. "Energy End-Use Efficiency." Physics of Sustainable Energy
Rosenfeld, A. H. 2003. The California Vision: Reducing Energy Intensity 2% per Year. Presented at the 2003 ACEEE Energy Efficiency as a Resource Conference. URL:
Retrieved July 9, 2009, from www.energy.ca.gov/2008publications/CEC-999-2008-005/CEC-999-2008-005.PDF.
http://www.aceee.org/conf/03ee/Rosenfeld-WSw.pdf. Accessed May 2009.
Sallee, James M. (2007), “Tax Credits and the Market for Hybrid Vehicles,” working paper.
Sedano, R. 2009. Decoupling: Utility Sales from Revenues. Presentation to the Kentucky PUC. URL: http://www.raponline.org/Slides/RS-KentuckyDecoupling-9April2009.pdf. Accessed May 2009.
[SLC] Salt Lake City. 2009. Salt Lake City Transportation Free Metered Parking Programs. URL: http://www.slcgov.com/transportation/parking/mpg.htm. Accessed May 2009.
Smith, D. 2007. State of Clean Cities and Vehicle Technologies Deployment. Presentation at the Clean Cities Leadership Retreat. URL: www1.eere.energy.gov/cleancities/toolbox/docs/mammoth_doe_pt1_dennis_ smith.ppt
[SMUD] Sacramento Municipal Utility District. 2009. Webpage: Rebates and Incentives. URL: http://www.smud.org/en/business/rebates/Pages/index.aspx

54
Thorne, J. and C. Egan. 2002. Evaluation of the Federal Trade Commission’s Energy Guide Appliance Label: Final Report and Recommendations. ACEEE-A021. Washington, DC: ACEEE.
[UNEP] United Nations Environmental Programme. 2007. Buildings and Climate Change: Status, Challenges, and Opportunities, United Nations Environmental Programme.
[USGBC] United States Green Building Council. 2009. Public Policy Database Search. URL:
http://www.usgbc.org/PublicPolicy/SearchPublicPolicies.aspx?PageID=1776. Accessed May 2008.
Walters, T., S. Savage, and J. Brown. 2006. USDA Section 9006 Program: Status and Energy Benefits of Grant Awards in FY 2003-2005. NREL TP 710-40465. National Renewable Energy Laboratory: Golden, Co. URL: http://www.nrel.gov/docs/fy06osti/40465
[WBCSD] World Business Council on Sustainable Development. 2009. Transforming the Market: Energy Efficiency in Buildings, World Business Council for Sustainable Development.
[WCI] Western Climate Initiatives. 2009. Workplan October 2007- August 2008. URL:
http://www.westernclimateinitiative.org/ewebeditpro/items/O104F13792.pdf. Accessed March 2009.

F1147-E(10/2008)
REPORT DOCUMENTATION PAGE Form Approved OMB No. 0704-0188
The public reporting burden for this collection of information is estimated to average 1 hour per response, including the time for reviewing instructions, searching existing data sources, gathering and maintaining the data needed, and completing and reviewing the collection of information. Send comments regarding this burden estimate or any other aspect of this collection of information, including suggestions for reducing the burden, to Department of Defense, Executive Services and Communications Directorate (0704-0188). Respondents should be aware that notwithstanding any other provision of law, no person shall be subject to any penalty for failing to comply with a collection of information if it does not display a currently valid OMB control number. PLEASE DO NOT RETURN YOUR FORM TO THE ABOVE ORGANIZATION. 1. REPORT DATE (DD-MM-YYYY)
December 2009 2. REPORT TYPE
Technical Report 3. DATES COVERED (From - To)
4. TITLE AND SUBTITLE
Energy Efficiency Policy in the United States: Overview of Trends at Different Levels of Government
5a. CONTRACT NUMBER DE-AC36-08-GO28308
5b. GRANT NUMBER
5c. PROGRAM ELEMENT NUMBER
6. AUTHOR(S) E. Doris, J. Cochran, and M. Vorum
5d. PROJECT NUMBER NREL/TP-6A2-46532
5e. TASK NUMBER IGIN.7500
5f. WORK UNIT NUMBER
7. PERFORMING ORGANIZATION NAME(S) AND ADDRESS(ES) National Renewable Energy Laboratory 1617 Cole Blvd. Golden, CO 80401-3393
8. PERFORMING ORGANIZATION REPORT NUMBER NREL/TP-6A2-46532
9. SPONSORING/MONITORING AGENCY NAME(S) AND ADDRESS(ES)
10. SPONSOR/MONITOR'S ACRONYM(S) NREL
11. SPONSORING/MONITORING AGENCY REPORT NUMBER
12. DISTRIBUTION AVAILABILITY STATEMENT National Technical Information Service U.S. Department of Commerce 5285 Port Royal Road Springfield, VA 22161
13. SUPPLEMENTARY NOTES
14. ABSTRACT (Maximum 200 Words) This report catalogs by sector—buildings, transportation, industrial, and power—energy efficiency policies at the federal, state, and local levels, and identifies some prominent policy trends. Four key findings emerged from this report: 1) leadership on energy efficiency is necessary—and is found—at each level of government; 2) there is no widely accepted methodology for evaluating energy efficiency policies; 3) coordination among the three levels of government—and across sectors—is increasingly important, and there are opportunities to significantly improve policy performance through a unified strategy; and 4) there are efficiencies to be gained by informing policies in one sector with experience from others. 15. SUBJECT TERMS
energy efficiency; EE; energy efficiency policy; buildings energy; transportation; industrial sector; power sector; energy analysis; federal energy policy; state energy policy; energy policy; NREL; Elizabeth Doris; Jaquelin Cochran; Martin Vorum
16. SECURITY CLASSIFICATION OF: 17. LIMITATION OF ABSTRACT
UL
18. NUMBER OF PAGES
19a. NAME OF RESPONSIBLE PERSON a. REPORT
Unclassified b. ABSTRACT Unclassified
c. THIS PAGE Unclassified 19b. TELEPHONE NUMBER (Include area code)
Standard Form 298 (Rev. 8/98) Prescribed by ANSI Std. Z39.18