
Energy efficiency optimization economic value driver?
22
THE CARBON OPPORTUNITY FIRM Energy efficiency optimization – economic value driver? Conference: “Kyoto Protocol as a financial tool for implementing energy efficiency projects” Yekaterinburg, 6 - 7 April 2011 April 6, 2011
Transcript of Energy efficiency optimization economic value driver?
THE CARBON OPPORTUNITY FIRM
Energy efficiency optimization – economic value driver? Conference: “Kyoto Protocol as a financial tool for implementing energy efficiency projects”
Yekaterinburg, 6 - 7 April 2011
April 6, 2011
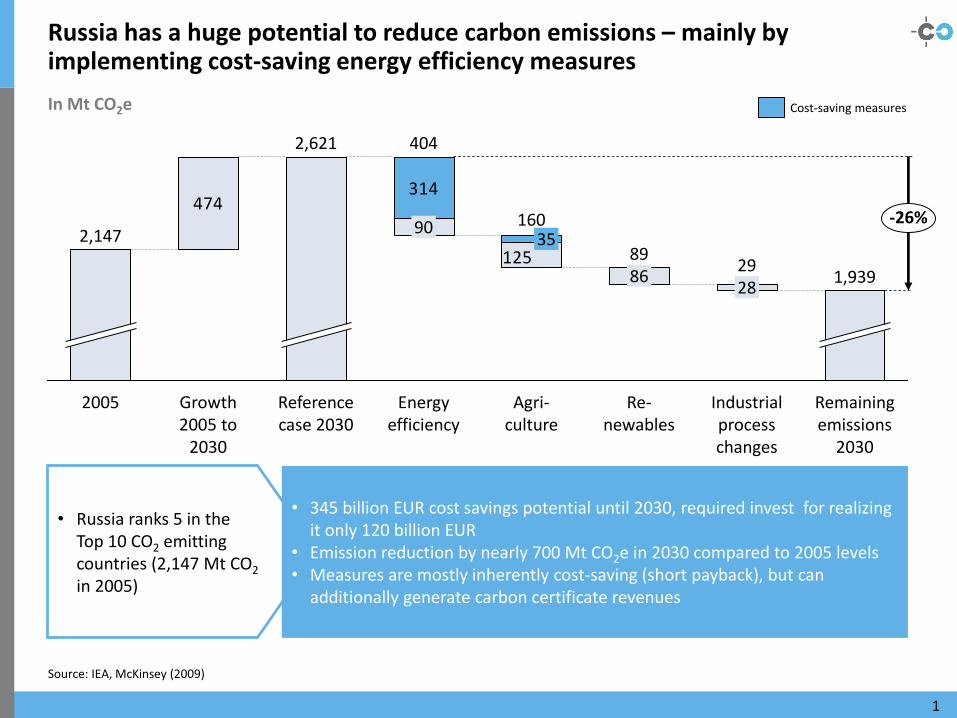
Russia has a huge potential to reduce carbon emissions – mainly by implementing cost-saving energy efficiency measures
In Mt CO2e
Source: IEA, McKinsey (2009)
1
125
474314
2,621
Growth 2005 to
2030
2005
2,147
Remaining emissions
2030
Industrial process changes
29 28
Re- newables
89 86
Agri- culture
160
Energy efficiency
404
90
Reference case 2030
35
1,939
-26%
• Russia ranks 5 in the Top 10 CO2 emitting countries (2,147 Mt CO2 in 2005)
• 345 billion EUR cost savings potential until 2030, required invest for realizing it only 120 billion EUR
• Emission reduction by nearly 700 Mt CO2e in 2030 compared to 2005 levels • Measures are mostly inherently cost-saving (short payback), but can
additionally generate carbon certificate revenues
Cost-saving measures
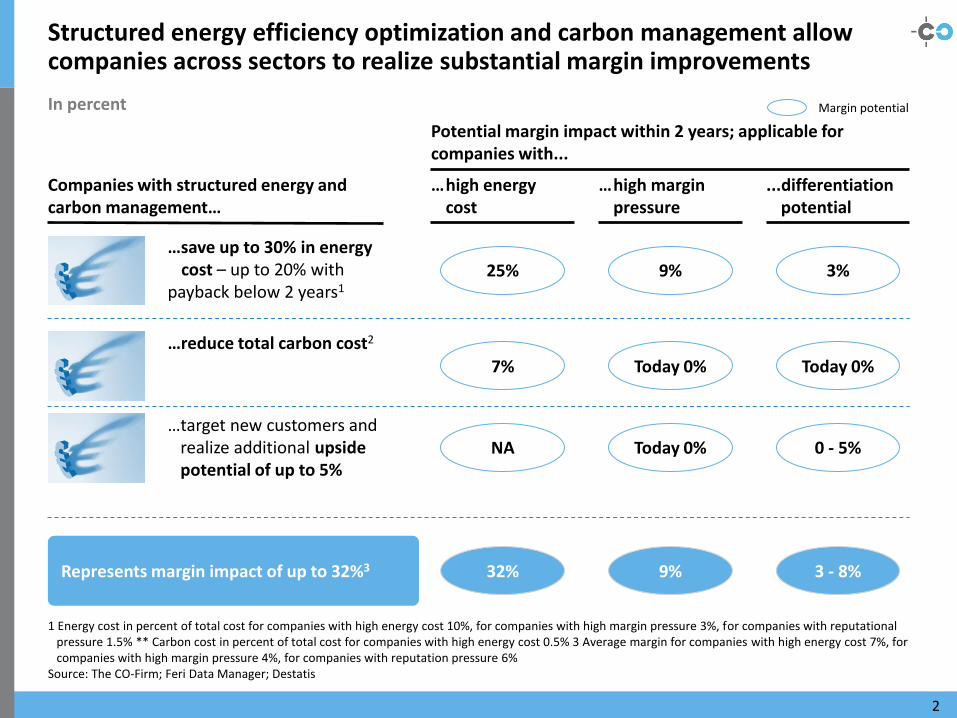
Structured energy efficiency optimization and carbon management allow companies across sectors to realize substantial margin improvements
1 Energy cost in percent of total cost for companies with high energy cost 10%, for companies with high margin pressure 3%, for companies with reputational pressure 1.5% ** Carbon cost in percent of total cost for companies with high energy cost 0.5% 3 Average margin for companies with high energy cost 7%, for companies with high margin pressure 4%, for companies with reputation pressure 6%
Source: The CO-Firm; Feri Data Manager; Destatis
Companies with structured energy and carbon management…
In percent
…save up to 30% in energy cost – up to 20% with payback below 2 years13
…reduce total carbon cost2
…target new customers and realize additional upside potential of up to 5%
Potential margin impact within 2 years; applicable for companies with...
Represents margin impact of up to 32%3
… high energy cost
… high margin pressure
...differentiation potential
25% 9% 3%
7% Today 0% Today 0%
NA Today 0% 0 - 5%
32% 9% 3 - 8%
Margin potential
2
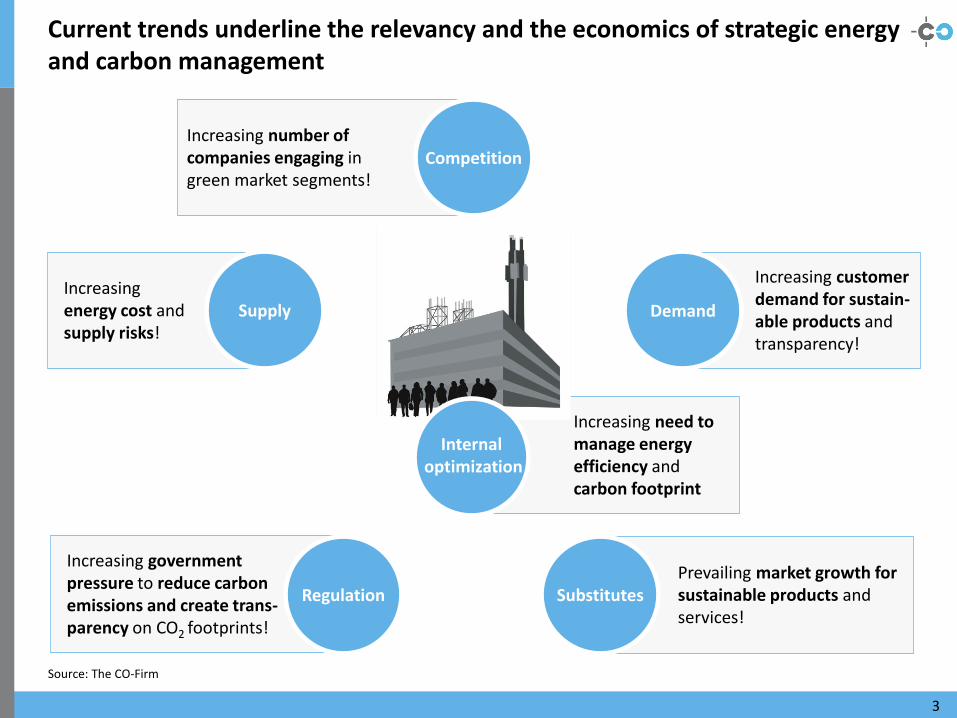
Increasing need to manage energy efficiency and carbon footprint
Current trends underline the relevancy and the economics of strategic energy and carbon management
Source: The CO-Firm
3
Demand
Internal optimization
Supply
Competition
Regulation
Increasing government pressure to reduce carbon emissions and create trans-parency on CO2 footprints!
Increasing energy cost and supply risks!
Increasing number of companies engaging in green market segments!
Increasing customer demand for sustain-able products and transparency!
Substitutes Prevailing market growth for sustainable products and services!
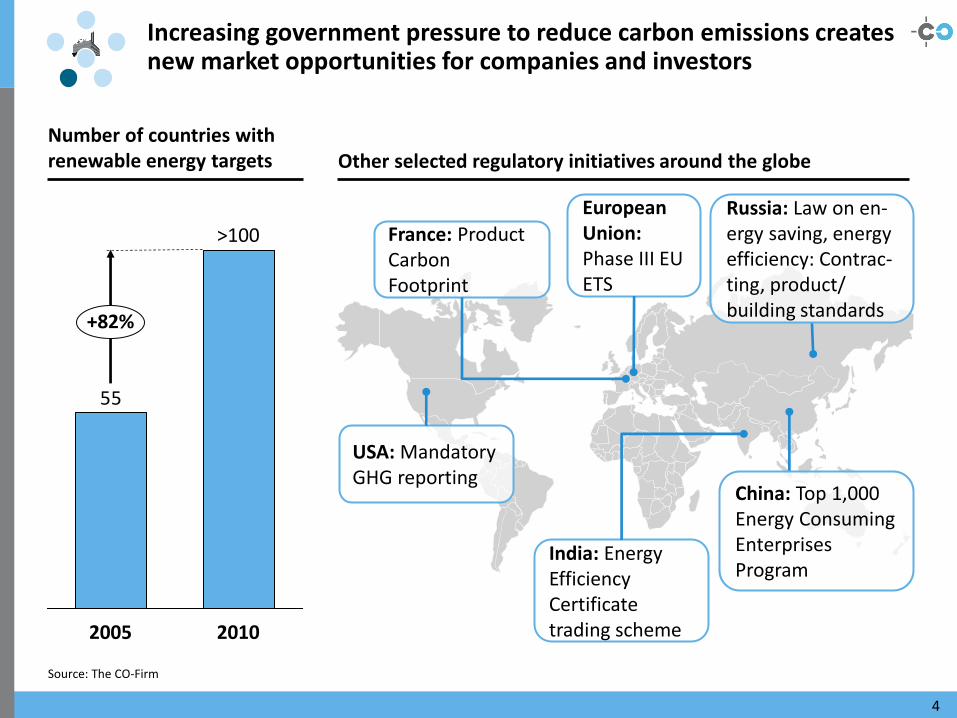
Increasing government pressure to reduce carbon emissions creates new market opportunities for companies and investors
Source: The CO-Firm
4
55
2005 2010
+82%
>100
Number of countries with renewable energy targets Other selected regulatory initiatives around the globe
China: Top 1,000 Energy Consuming Enterprises Program
India: Energy Efficiency Certificate trading scheme
France: Product Carbon Footprint
USA: Mandatory GHG reporting
European Union: Phase III EU ETS
Russia: Law on en-ergy saving, energy efficiency: Contrac-ting, product/ building standards
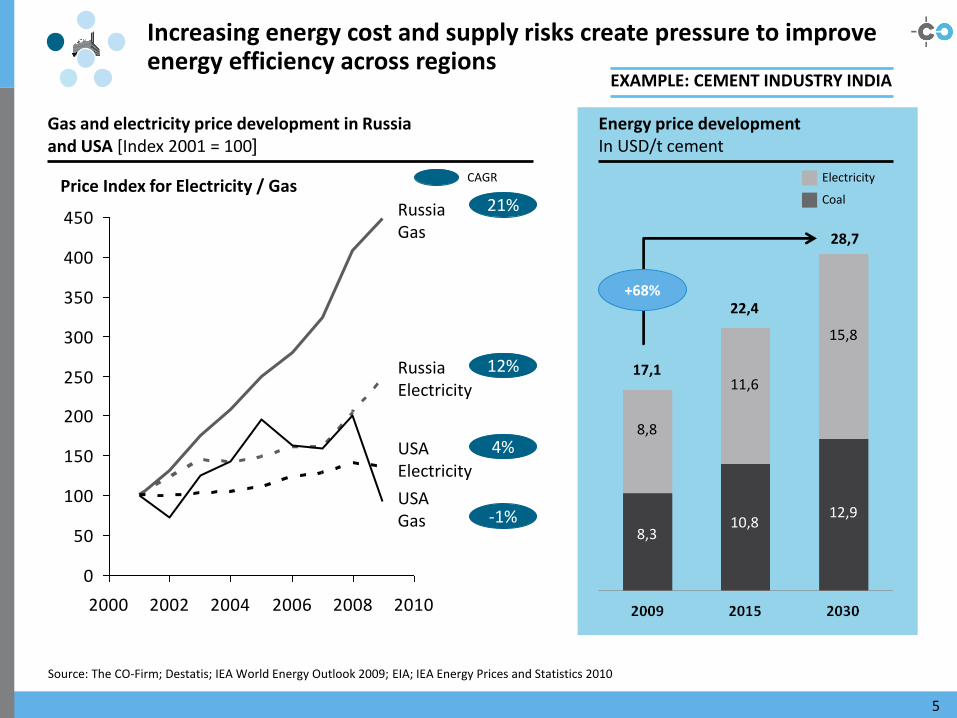
Increasing energy cost and supply risks create pressure to improve energy efficiency across regions
Source: The CO-Firm; Destatis; IEA World Energy Outlook 2009; EIA; IEA Energy Prices and Statistics 2010
5
0
50
100
150
200
250
300
350
400
450
2000 2002 2004 2006 2008 2010
USA Gas
USA Electricity
Russia Gas
Russia Electricity
Gas and electricity price development in Russia and USA [Index 2001 = 100]
Price Index for Electricity / Gas CAGR
21%
12%
4%
Energy price development In USD/t cement
8,3
8,8
17,1
10,8
11,6
22,4
12,9
15,8
28,7
+68%
Electricity
Coal
EXAMPLE: CEMENT INDUSTRY INDIA
-1%
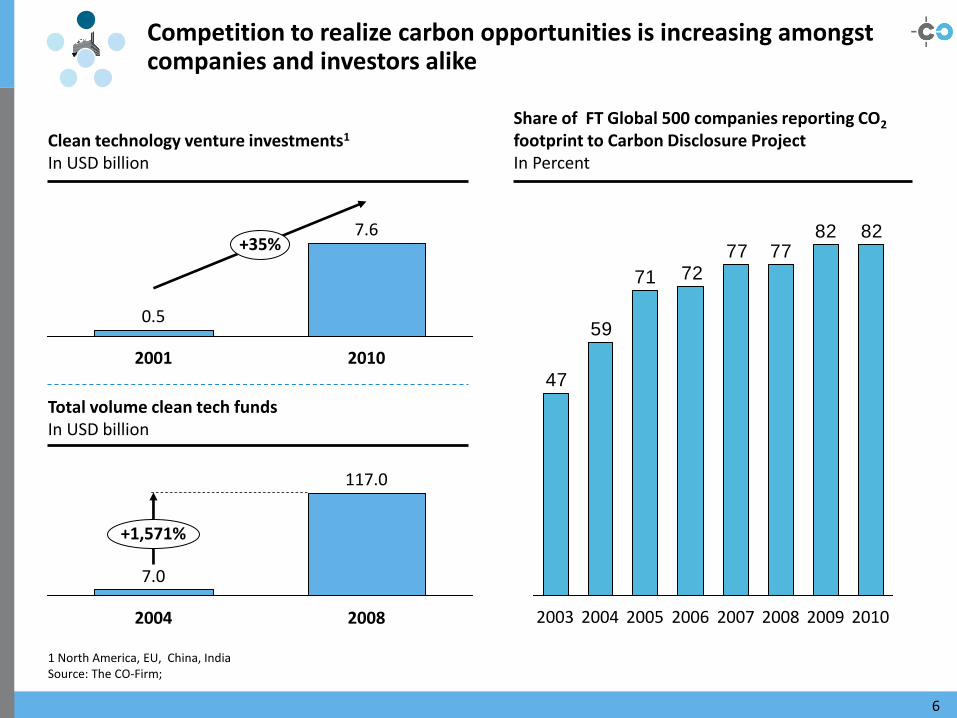
Competition to realize carbon opportunities is increasing amongst companies and investors alike
1 North America, EU, China, India Source: The CO-Firm;
6
7.6 +35%
2001 2010
0.5
Clean technology venture investments1
In USD billion
7.0
2004
117.0
2008
+1,571%
Total volume clean tech funds
In USD billion
Share of FT Global 500 companies reporting CO2
footprint to Carbon Disclosure Project In Percent
82827777
7271
59
47
2010 2007 2008 2009 2006 2003 2004 2005
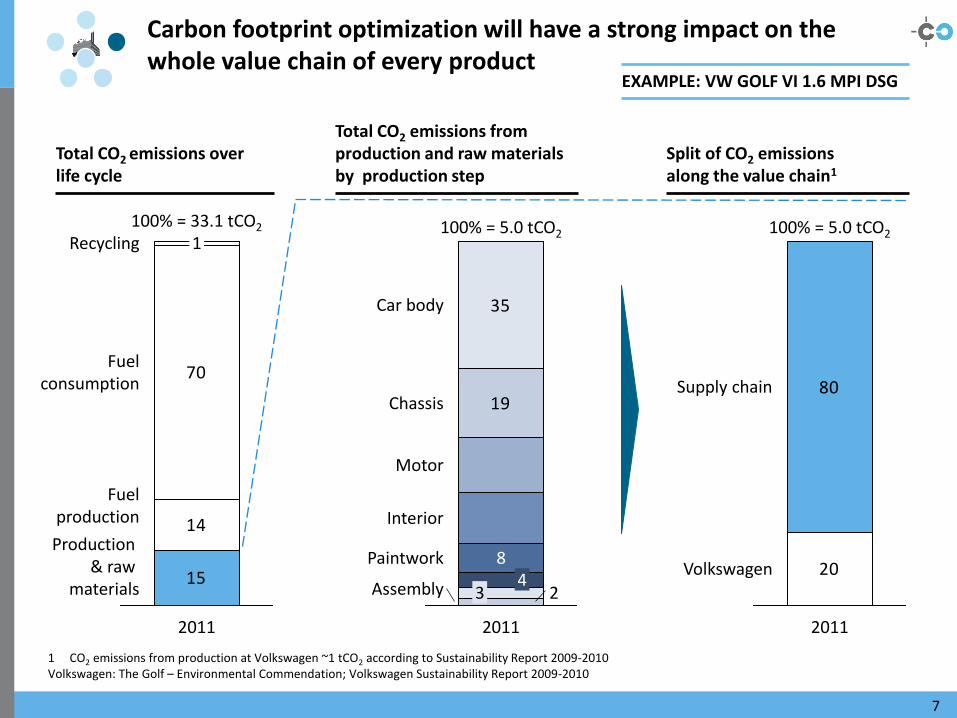
15
14
70
1
2011
100% = 33.1 tCO2
Recycling
Fuel consumption
Fuel production
Production & raw
materials
Carbon footprint optimization will have a strong impact on the whole value chain of every product
1 CO2 emissions from production at Volkswagen ~1 tCO2 according to Sustainability Report 2009-2010 Volkswagen: The Golf – Environmental Commendation; Volkswagen Sustainability Report 2009-2010
7
2
19
35
Assembly
Paintwork
Interior
Motor
Chassis
Car body
2011
100% = 5.0 tCO2
3 4
8
Total CO2 emissions over life cycle
Total CO2 emissions from production and raw materials by production step
Split of CO2 emissions along the value chain1
EXAMPLE: VW GOLF VI 1.6 MPI DSG
20
80Supply chain
Volkswagen
2011
100% = 5.0 tCO2
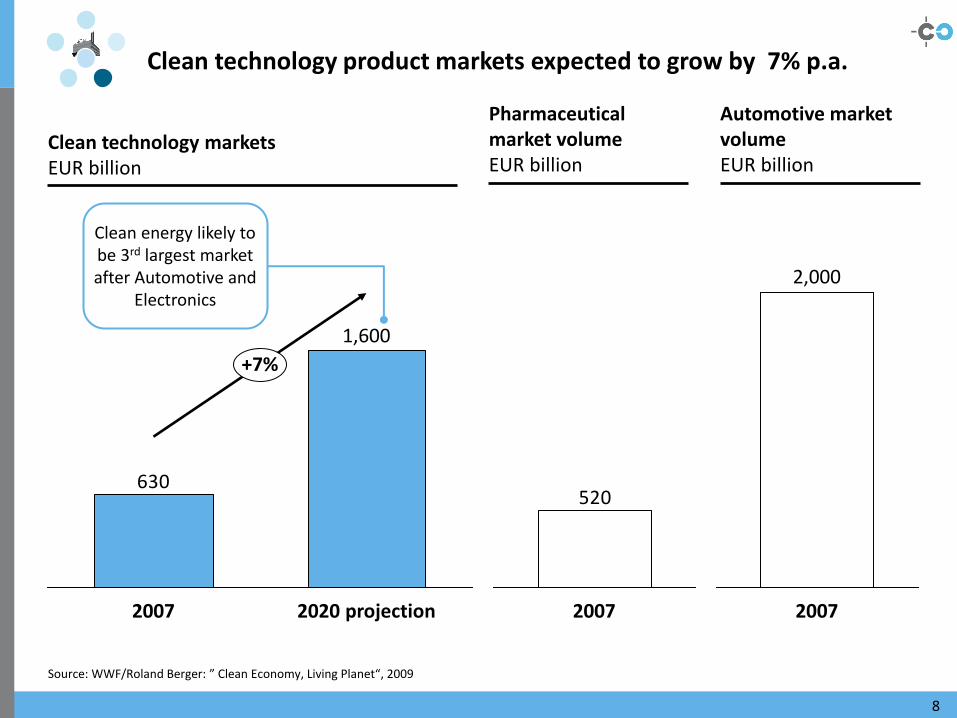
Clean technology product markets expected to grow by 7% p.a.
Source: WWF/Roland Berger: ” Clean Economy, Living Planet“, 2009
8
630
+7%
2020 projection
1,600
2007
Clean technology markets
EUR billion
2,000
2007
Automotive market volume
EUR billion
520
2007
Pharmaceutical market volume
EUR billion
Clean energy likely to be 3rd largest market after Automotive and
Electronics
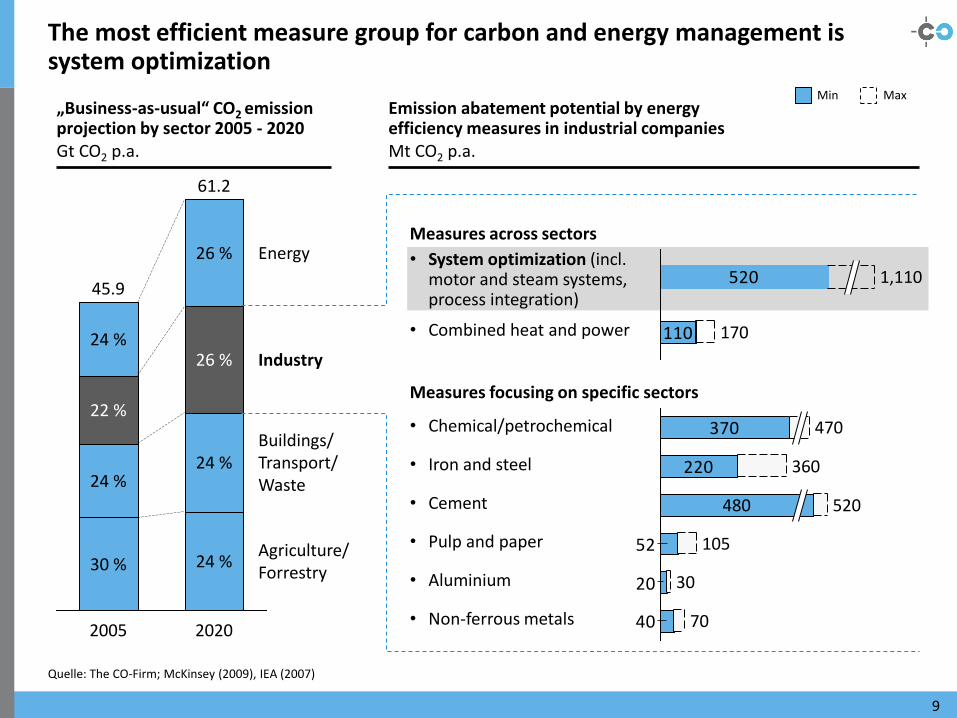
The most efficient measure group for carbon and energy management is system optimization
Quelle: The CO-Firm; McKinsey (2009), IEA (2007)
9
„Business-as-usual“ CO2 emission projection by sector 2005 - 2020 Gt CO2 p.a.
Measures across sectors
• System optimization (incl. motor and steam systems, process integration)
• Combined heat and power
Emission abatement potential by energy efficiency measures in industrial companies Mt CO2 p.a.
110
520 1,110
170
Agriculture/ Forrestry
Buildings/ Transport/ Waste
Industry
Energy
2020
61.2
24 %
24 %
26 %
26 %
2005
45.9
30 %
24 %
22 %
24 %
Min Max
Measures focusing on specific sectors
• Chemical/petrochemical
• Iron and steel
• Cement
• Pulp and paper
• Aluminium
• Non-ferrous metals 40
20
52
220
370
70
30
105
470
520 480
360
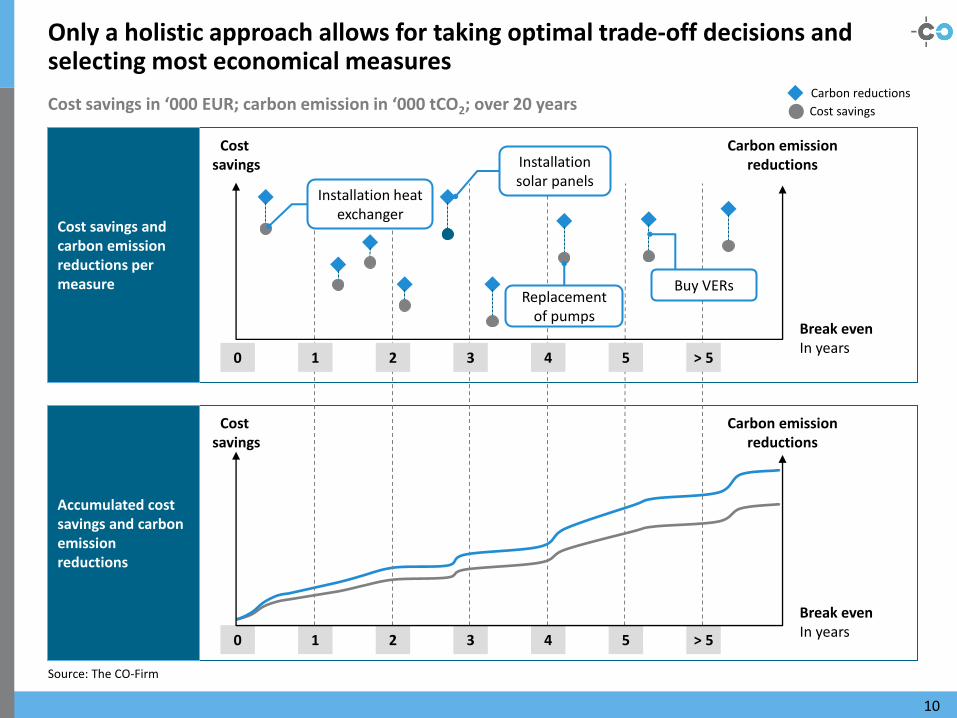
Only a holistic approach allows for taking optimal trade-off decisions and selecting most economical measures
Source: The CO-Firm
Carbon emission reductions
Break even In years
Cost savings
Cost savings in ‘000 EUR; carbon emission in ‘000 tCO2; over 20 years
Break even In years
Carbon reductions
Cost savings
Accumulated cost savings and carbon emission reductions
Cost savings and carbon emission reductions per measure
1 2 3 4 5 0 > 5
1 2 3 4 5 0 > 5
Installation solar panels
Buy VERs Replacement
of pumps
10
Carbon emission reductions
Cost savings
Installation heat exchanger
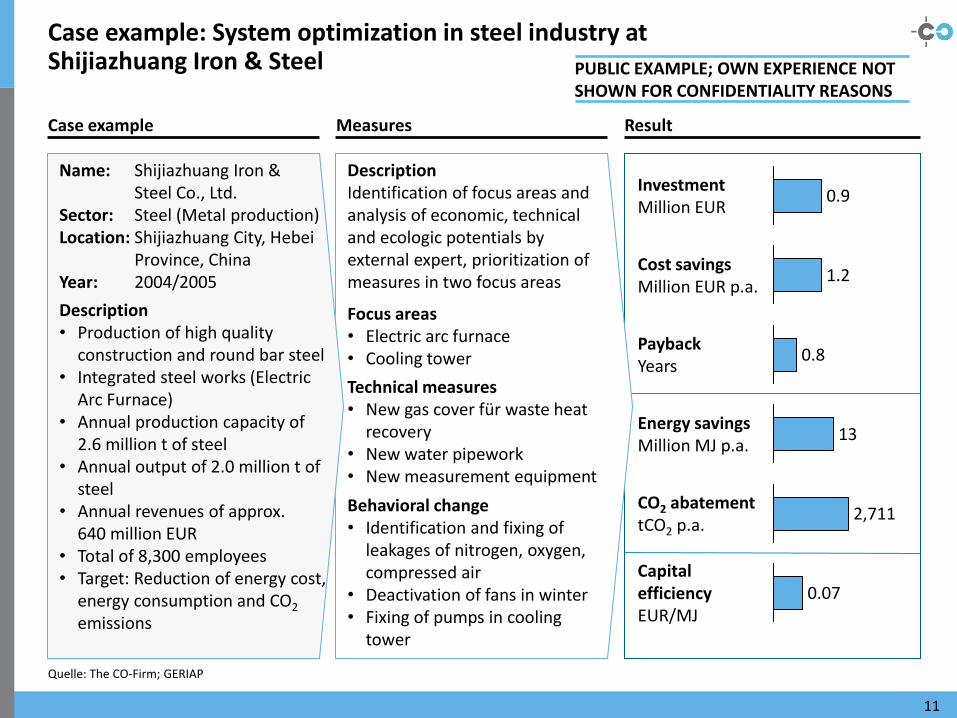
Case example: System optimization in steel industry at Shijiazhuang Iron & Steel
Quelle: The CO-Firm; GERIAP
11
Case example Measures
Name: Shijiazhuang Iron & Steel Co., Ltd.
Sector: Steel (Metal production) Location: Shijiazhuang City, Hebei
Province, China Year: 2004/2005
Description • Production of high quality
construction and round bar steel • Integrated steel works (Electric
Arc Furnace) • Annual production capacity of
2.6 million t of steel • Annual output of 2.0 million t of
steel • Annual revenues of approx.
640 million EUR • Total of 8,300 employees • Target: Reduction of energy cost,
energy consumption and CO2 emissions
Technical measures • New gas cover für waste heat
recovery • New water pipework • New measurement equipment
Behavioral change • Identification and fixing of
leakages of nitrogen, oxygen, compressed air
• Deactivation of fans in winter • Fixing of pumps in cooling
tower
Focus areas • Electric arc furnace • Cooling tower
Description Identification of focus areas and analysis of economic, technical and ecologic potentials by external expert, prioritization of measures in two focus areas
Result
Investment Million EUR
Cost savings Million EUR p.a.
Payback Years
Capital efficiency EUR/MJ
CO2 abatement tCO2 p.a.
Energy savings Million MJ p.a.
0.9
0.8
13
2,711
0.07
1.2
PUBLIC EXAMPLE; OWN EXPERIENCE NOT SHOWN FOR CONFIDENTIALITY REASONS
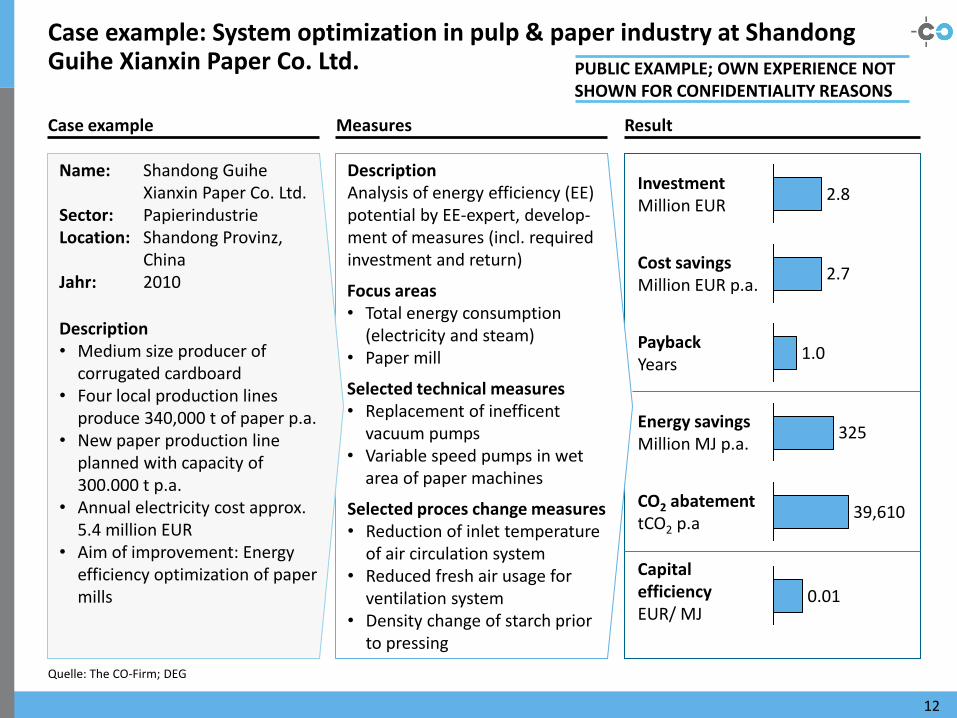
Case example: System optimization in pulp & paper industry at Shandong Guihe Xianxin Paper Co. Ltd.
Quelle: The CO-Firm; DEG
12
Investment Million EUR
Cost savings Million EUR p.a.
Payback Years
Capital efficiency EUR/ MJ
CO2 abatement tCO2 p.a
Energy savings Million MJ p.a.
2.8
1.0
325
39,610
2.7
0.01
Name: Shandong Guihe Xianxin Paper Co. Ltd.
Sector: Papierindustrie Location: Shandong Provinz,
China Jahr: 2010
Description • Medium size producer of
corrugated cardboard • Four local production lines
produce 340,000 t of paper p.a. • New paper production line
planned with capacity of 300.000 t p.a.
• Annual electricity cost approx. 5.4 million EUR
• Aim of improvement: Energy efficiency optimization of paper mills
Selected technical measures • Replacement of inefficent
vacuum pumps • Variable speed pumps in wet
area of paper machines
Selected proces change measures • Reduction of inlet temperature
of air circulation system • Reduced fresh air usage for
ventilation system • Density change of starch prior
to pressing
Focus areas • Total energy consumption
(electricity and steam) • Paper mill
Description Analysis of energy efficiency (EE) potential by EE-expert, develop-ment of measures (incl. required investment and return)
Case example Measures Result
PUBLIC EXAMPLE; OWN EXPERIENCE NOT SHOWN FOR CONFIDENTIALITY REASONS
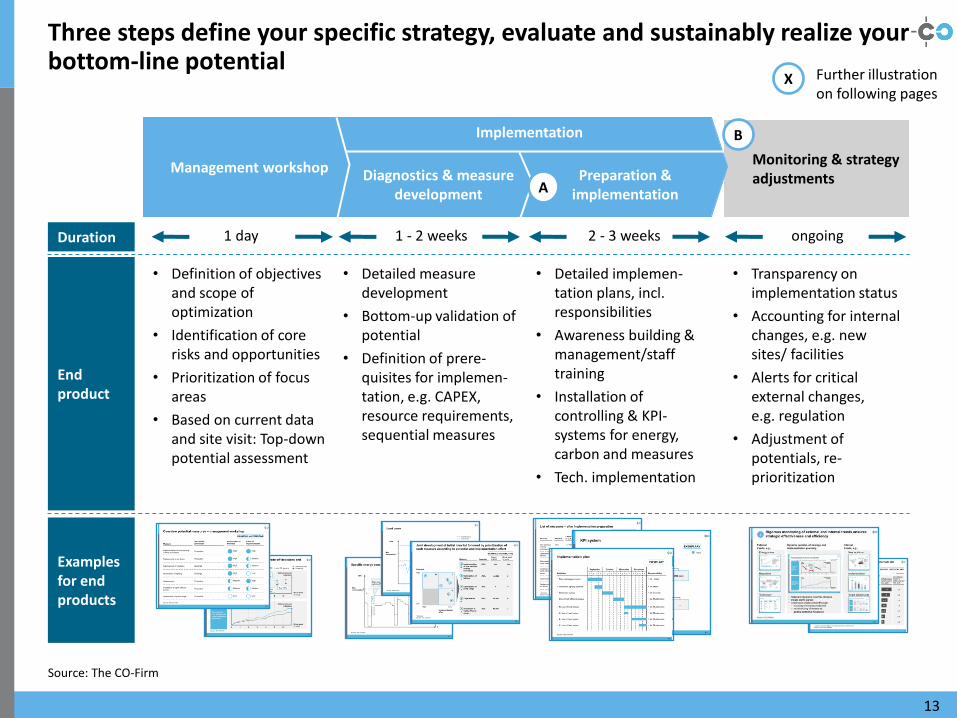
Examples for end products
End product
Duration
Three steps define your specific strategy, evaluate and sustainably realize your bottom-line potential
Source: The CO-Firm
Monitoring & strategy adjustments
1 day
• Definition of objectives and scope of optimization
• Identification of core risks and opportunities
• Prioritization of focus areas
• Based on current data and site visit: Top-down potential assessment
1 - 2 weeks 2 - 3 weeks ongoing
• Detailed measure development
• Bottom-up validation of potential
• Definition of prere-quisites for implemen-tation, e.g. CAPEX, resource requirements, sequential measures
• Detailed implemen-tation plans, incl. responsibilities
• Awareness building & management/staff training
• Installation of controlling & KPI-systems for energy, carbon and measures
• Tech. implementation
• Transparency on implementation status
• Accounting for internal changes, e.g. new sites/ facilities
• Alerts for critical external changes, e.g. regulation
• Adjustment of potentials, re-prioritization
13
Diagnostics & measure development
Preparation & implementation
Implementation
Management workshop
A
B
X Further illustration on following pages
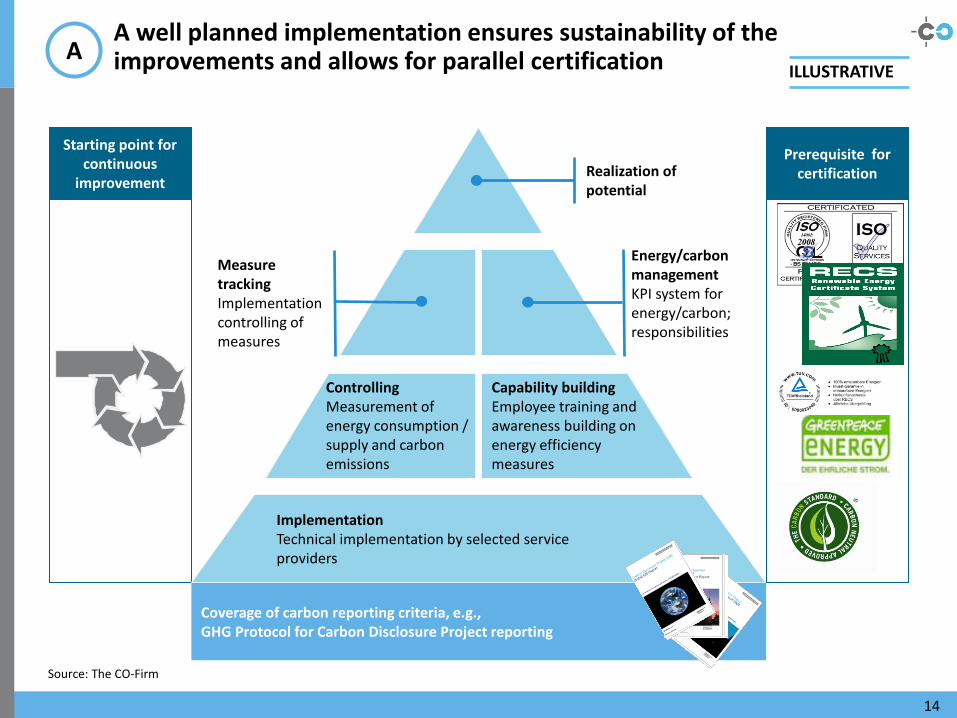
Starting point for continuous
improvement
A well planned implementation ensures sustainability of the improvements and allows for parallel certification
Source: The CO-Firm
Realization of potential
Capability building Employee training and awareness building on energy efficiency measures
Controlling Measurement of energy consumption / supply and carbon emissions
Implementation Technical implementation by selected service providers
Energy/carbon management KPI system for energy/carbon; responsibilities
Measure tracking Implementation controlling of measures
Coverage of carbon reporting criteria, e.g., GHG Protocol for Carbon Disclosure Project reporting
14
A
Prerequisite for certification
ILLUSTRATIVE
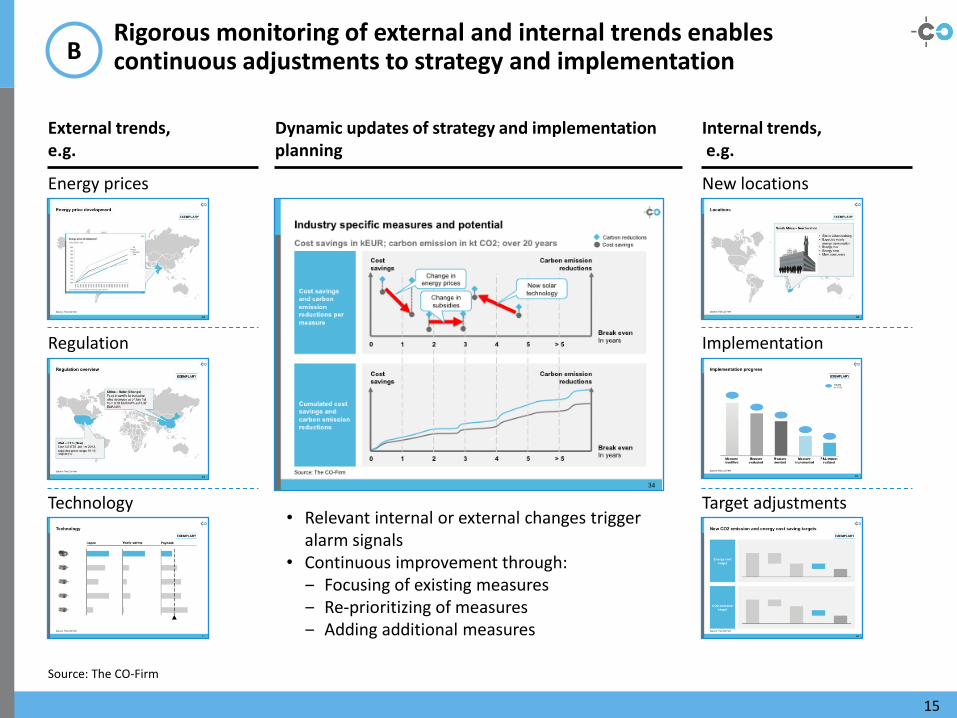
Rigorous monitoring of external and internal trends enables continuous adjustments to strategy and implementation
Source: The CO-Firm
External trends, e.g.
Internal trends, e.g.
Dynamic updates of strategy and implementation planning
• Relevant internal or external changes trigger alarm signals
• Continuous improvement through: ‒ Focusing of existing measures ‒ Re-prioritizing of measures ‒ Adding additional measures
15
B
Energy prices
Regulation
Technology
New locations
Implementation
Target adjustments
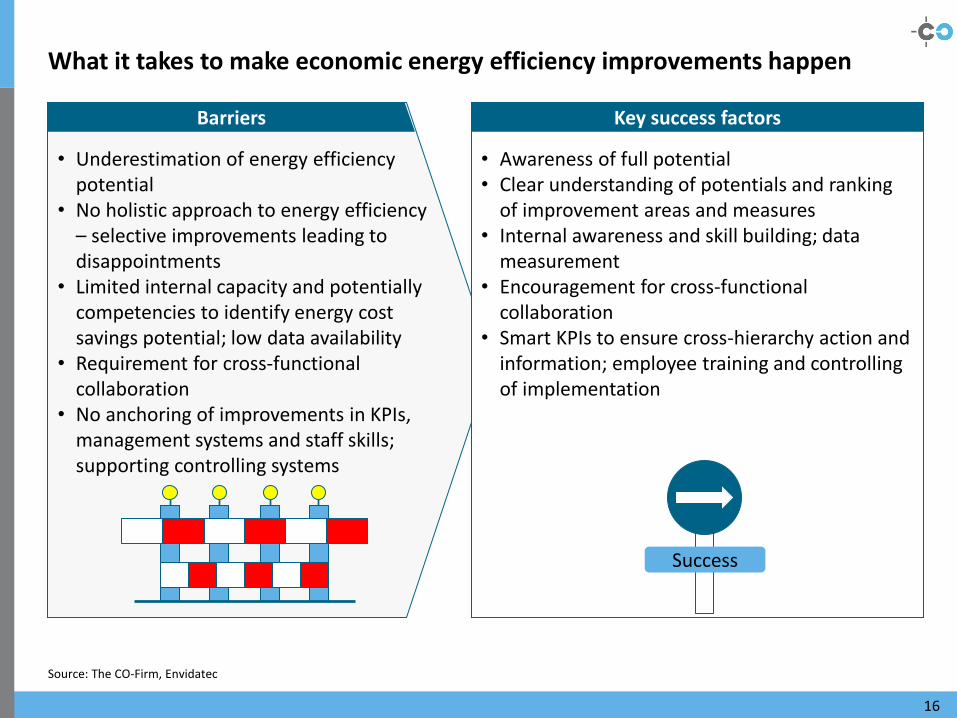
What it takes to make economic energy efficiency improvements happen
Source: The CO-Firm, Envidatec
• Underestimation of energy efficiency potential
• No holistic approach to energy efficiency – selective improvements leading to disappointments
• Limited internal capacity and potentially competencies to identify energy cost savings potential; low data availability
• Requirement for cross-functional collaboration
• No anchoring of improvements in KPIs, management systems and staff skills; supporting controlling systems
• Awareness of full potential • Clear understanding of potentials and ranking
of improvement areas and measures • Internal awareness and skill building; data
measurement • Encouragement for cross-functional
collaboration • Smart KPIs to ensure cross-hierarchy action and
information; employee training and controlling of implementation
Success
Barriers Key success factors
16
THE CARBON OPPORTUNITY FIRM
Your contact:
Dr. Nicole Röttmer
Mobile: +49 162 20 57 625
E-Mail: [email protected]
www.co-firm.com
Many thanks for your attention.
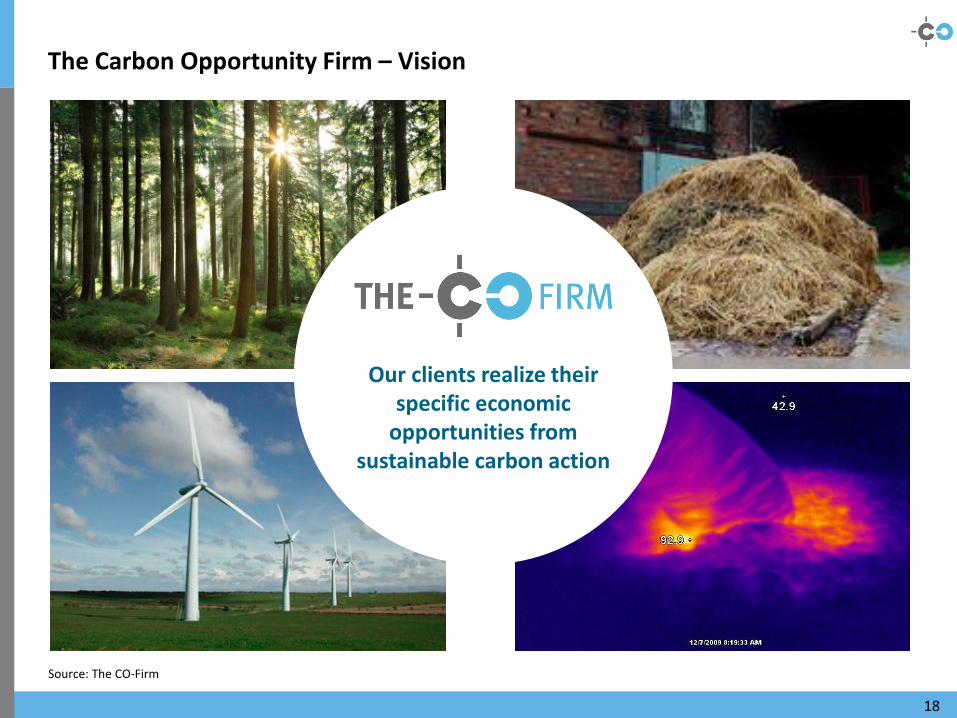
The Carbon Opportunity Firm – Vision
Source: The CO-Firm
18
Our clients realize their specific economic
opportunities from sustainable carbon action
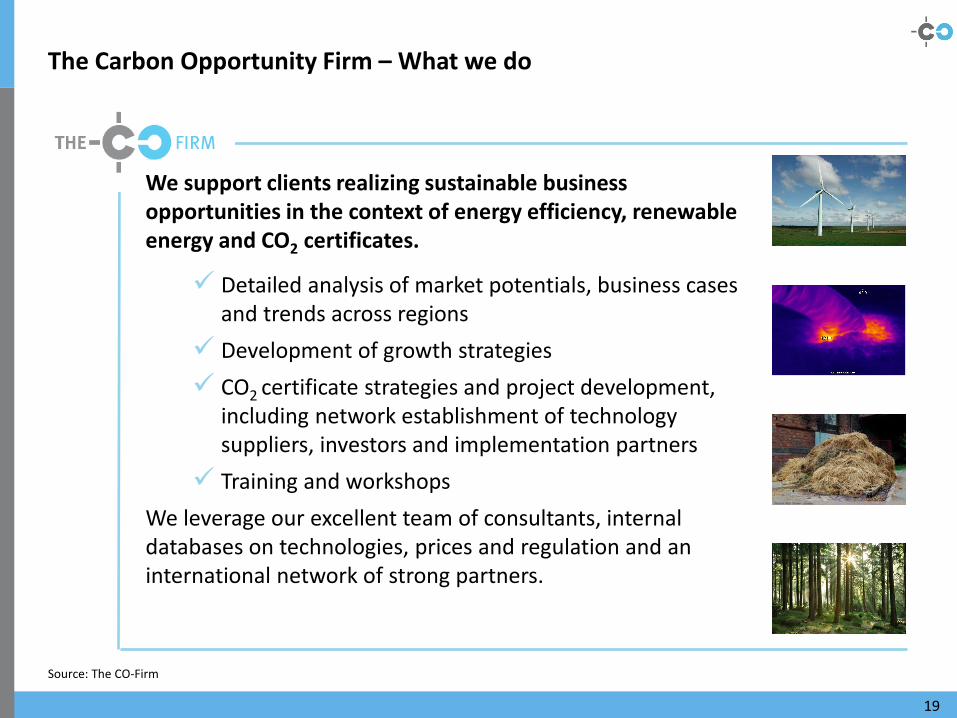
The Carbon Opportunity Firm – What we do
Source: The CO-Firm
19
We support clients realizing sustainable business opportunities in the context of energy efficiency, renewable energy and CO2 certificates.
Detailed analysis of market potentials, business cases and trends across regions
Development of growth strategies
CO2 certificate strategies and project development, including network establishment of technology suppliers, investors and implementation partners
Training and workshops
We leverage our excellent team of consultants, internal databases on technologies, prices and regulation and an international network of strong partners.
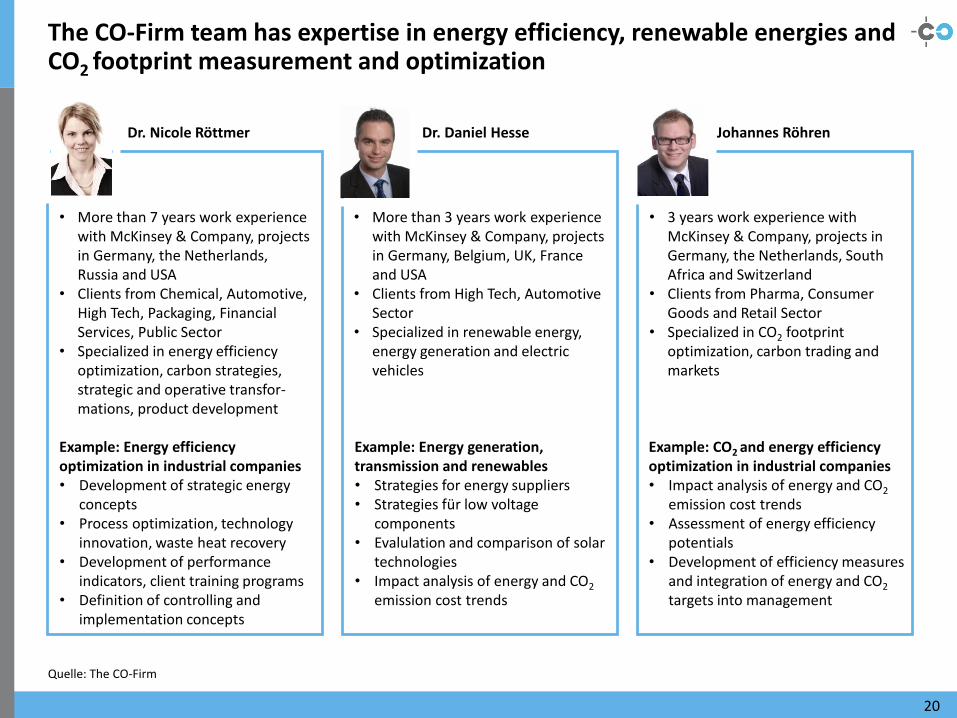
The CO-Firm team has expertise in energy efficiency, renewable energies and CO2 footprint measurement and optimization
Quelle: The CO-Firm
20
• More than 7 years work experience with McKinsey & Company, projects in Germany, the Netherlands, Russia and USA
• Clients from Chemical, Automotive, High Tech, Packaging, Financial Services, Public Sector
• Specialized in energy efficiency optimization, carbon strategies, strategic and operative transfor-mations, product development
Dr. Nicole Röttmer Dr. Daniel Hesse Johannes Röhren
Example: Energy efficiency optimization in industrial companies • Development of strategic energy
concepts • Process optimization, technology
innovation, waste heat recovery • Development of performance
indicators, client training programs • Definition of controlling and
implementation concepts
Example: Energy generation, transmission and renewables • Strategies for energy suppliers • Strategies für low voltage
components • Evalulation and comparison of solar
technologies • Impact analysis of energy and CO2
emission cost trends
• More than 3 years work experience with McKinsey & Company, projects in Germany, Belgium, UK, France and USA
• Clients from High Tech, Automotive Sector
• Specialized in renewable energy, energy generation and electric vehicles
• 3 years work experience with McKinsey & Company, projects in Germany, the Netherlands, South Africa and Switzerland
• Clients from Pharma, Consumer Goods and Retail Sector
• Specialized in CO2 footprint optimization, carbon trading and markets
Example: CO2 and energy efficiency optimization in industrial companies • Impact analysis of energy and CO2
emission cost trends • Assessment of energy efficiency
potentials • Development of efficiency measures
and integration of energy and CO2 targets into management
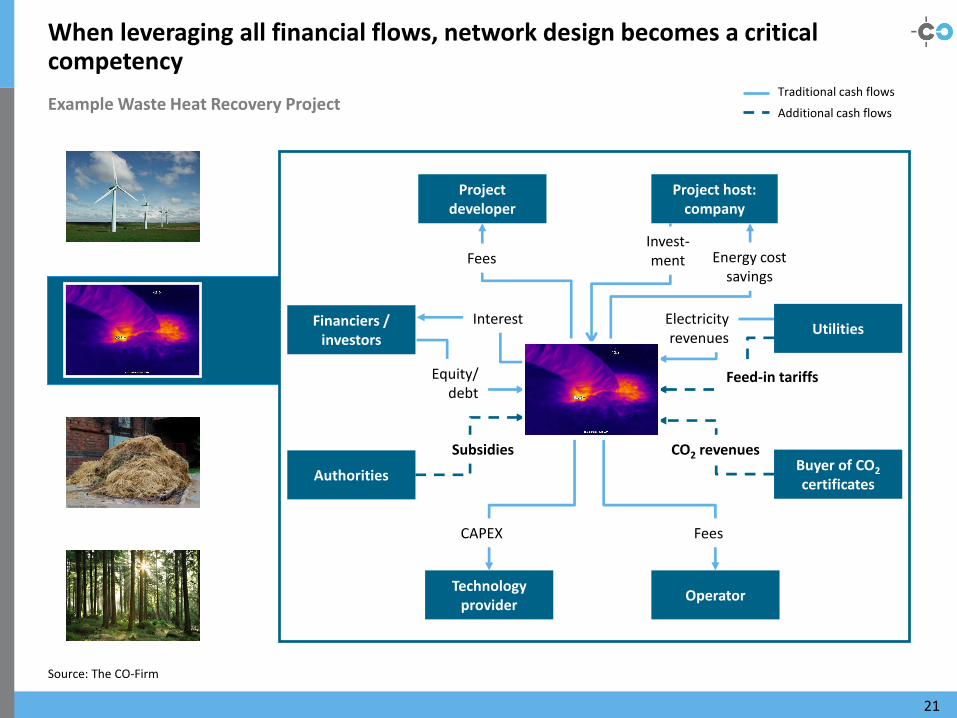
When leveraging all financial flows, network design becomes a critical competency
Example Waste Heat Recovery Project
21
Technology provider
Operator
Project developer
Financiers / investors
Authorities
Utilities
Buyer of CO2 certificates
Project host: company
Energy cost savings
Fees
Equity/ debt
Interest
Subsidies
Feed-in tariffs
Electricity revenues
CO2 revenues
Fees CAPEX
Traditional cash flows
Additional cash flows
Invest-ment
Source: The CO-Firm