Energy Efficiency in Buildings, IPEEC
25
Energy Efficiency in Buildings Governments & Markets and the IPEEC Experience Amit Bando, IPEEC February 2013 Saudi HVAC Confex 2013
-
Upload
nooone -
Category
Technology
-
view
346 -
download
4
Transcript of Energy Efficiency in Buildings, IPEEC

Energy Efficiency in BuildingsGovernments & Markets and
the IPEEC Experience Amit Bando, IPEECFebruary 2013
Saudi HVAC Confex 2013
2
What is IPEEC? 1.

33

IPEEC is an Autonomous Entity
4
IPEEC was established in 2009 at the G8 summit in Italy
Reports to G20 Summit, Clean Energy Ministerial & others
The IPEEC Secretariat is located in Paris, France
Members account for over 75% of world GDP and energy use.
Italy
Russia
Japan
Republic of KoreaChina
India
Australia
GermanyUnited
KingdomFrance
Canada
USA
Mexico
Brazil
EU

8 Task Groups Dedicated to EE
5
Finance
Energy manageme
nt
Policy Making/Capacity Building
Capacity building, training
EE Indicato
rs
Energy performan
ce
Appliances
Compilation of national and international initiatives
Energy performance
Energy Management
Commercial/ Residential
Sector
Industrial Sector Utilities Sector
Energy Provider

6
Energy Consumption in the world is Rising Fast
2.
7
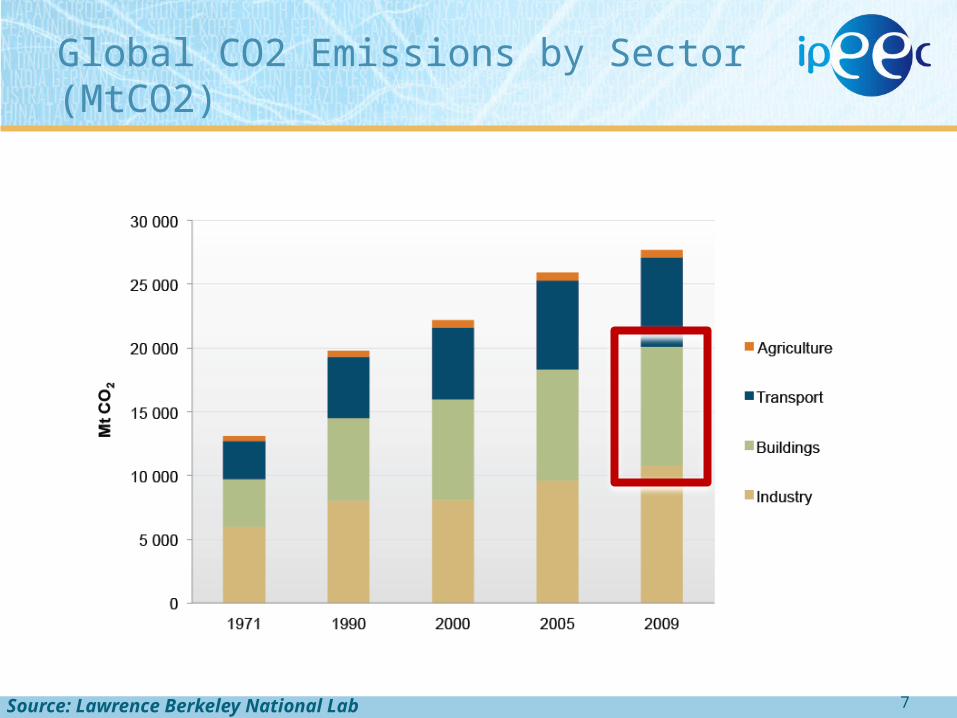
Global CO2 Emissions by Sector (MtCO2)
Source: Lawrence Berkeley National Lab
1990 1991 1992 1993 1994 1995 1996 1997 1998 1999 2000 2001 2002 2003 2004 2005 2006 2007 20080.0
0.5
1.0
1.5
2.0
2.5
3.0
3.5
4.0
4.5
5.0
Ener
gy c
onsu
mpti
on (G
toe)
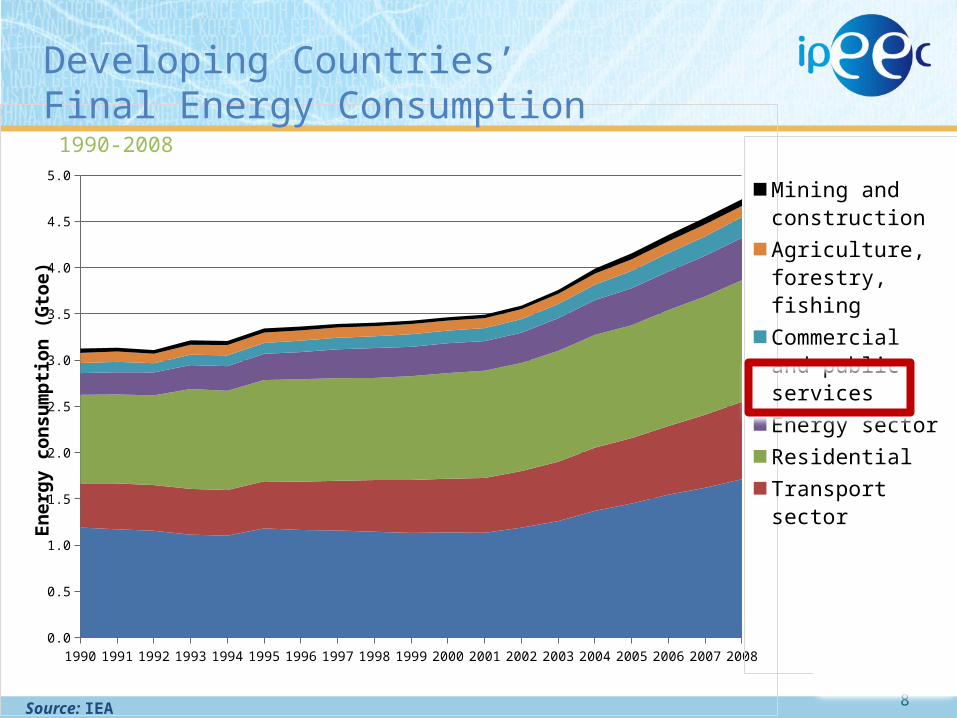
Developing Countries’ Final Energy Consumption
1990-2008
8
Mining and construction
Agriculture, forestry, fishing
Commercial and public services
Energy sector
Residential
Transport sector
Industry sector
Source: IEA 2010
9
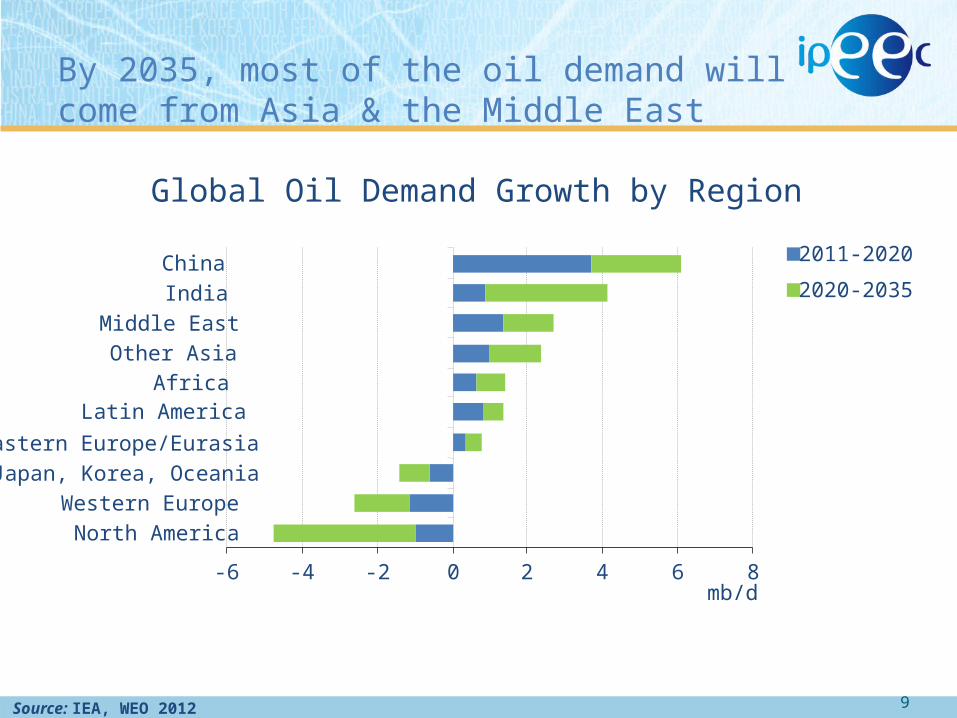
By 2035, most of the oil demand will come from Asia & the Middle East
2011-2020
-6 -4 -2 0 2 4 6 8
North AmericaWestern Europe
Japan, Korea, OceaniaEastern Europe/Eurasia
Latin AmericaAfrica
Other AsiaMiddle East
IndiaChina
mb/d
2020-2035
Global Oil Demand Growth by Region
Source: IEA, WEO 2012

10
The MENA Region Significantly Contributes to the Global Demand
3.

11
Economic Growth in the Region
2008 2009 2010 2011 20120
1
2
3
4
5
6
7
MENA RegionSaudi Arabia
Source: World Bank
Economic growth has slowed down during the past few years but remains robust
As a result, an urban middle class is emerging

12
Important Increase of MENA Urban Population
Population Urban Population Rural Population0
50
100
150
200
250
300
350
400
450
500
300
170130
170
110
60
20202008
Includes informal housing (up to 20
– 40% in some cities)
+ 65%+ 8.5%
Million people
The economic growth leads to an acceleration of the urbanisation
Cairo, Tehran & Baghdad gather 25% of the urban population
Source: World Bank, UN

13
Increased Energy Consumption
As a consequence, energy consumption in the region is rising In 2009, the total Middle East final consumption reached 393495
ktoe (IEA)
Total Energy Consumption in Saudi Arabia
Source: EIA

14
Middle East’s Energy Intensity Growing
0 0.3 0.6 0.9 1.2 1.5
World
China
Latin America
Middle East
Africa
Japan
European Union
United States
E. Europe/Eurasia
1980
2010
toe per thousand dollars of GDP ($2011, MER)
Source: IEA, WEO 2012
Energy Intensity by Regions (1980 – 2010)
In most places, Energy Intensity has decreased over the past 30 years…
Except in Africa and ,more significantly, in the Middle East
15
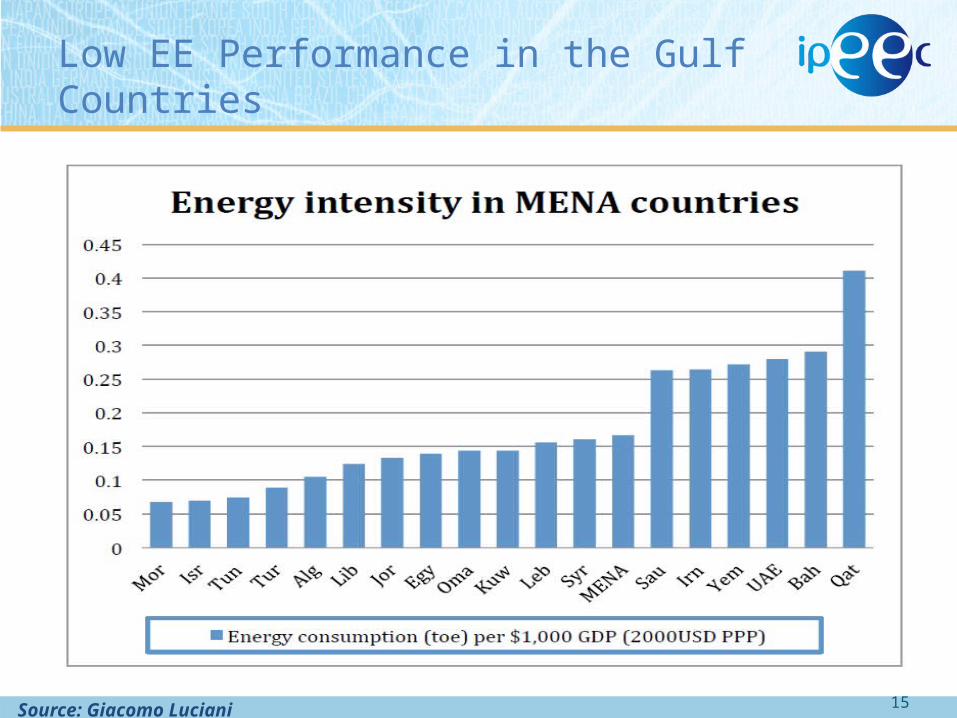
Low EE Performance in the Gulf Countries
Source: Giacomo Luciani (2012)
16
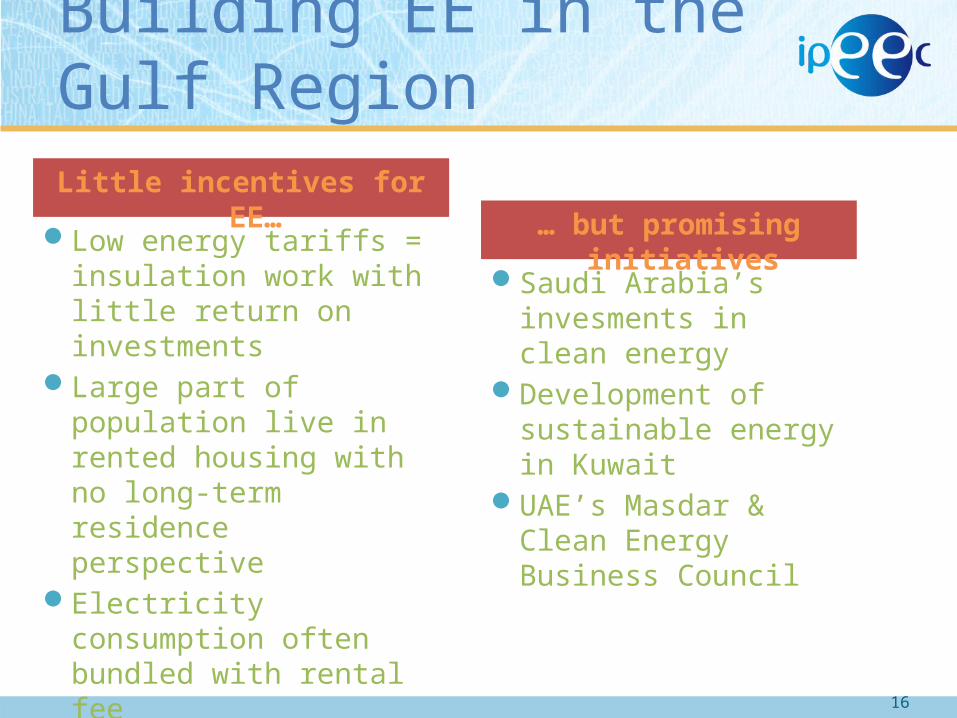
Building EE in the Gulf Region
Low energy tariffs = insulation work with little return on investments
Large part of population live in rented housing with no long-term residence perspective
Electricity consumption often bundled with rental fee
Saudi Arabia’s invesments in clean energy
Development of sustainable energy in Kuwait
UAE’s Masdar & Clean Energy Business Council
Little incentives for EE… … but promising
initiatives
17
EE in Buildings Can Help Reduce Energy Consumption
4.
18
Different Ways to Improve EE in Buildings
Energy use in « buildings » means both energy use of the building themselves and of the electric appliances. Together they account for 40% of the GHG emissions worldwide,
Measures to enhance EE in buildings can mean: Improving EE of appliances, Refurbishing:
Commercial buildings, or Residential buildings;
Building new EE houses.EE in buildings is a sensitive topic with social
implications.
19
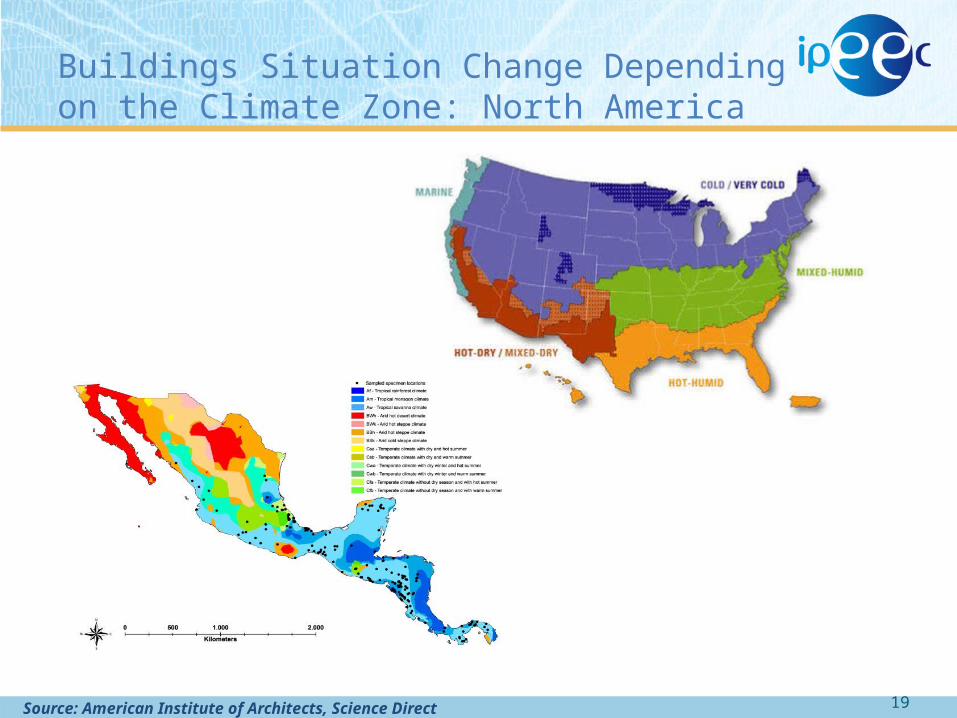
Buildings Situation Change Depending on the Climate Zone: North America
Source: American Institute of Architects, Science Direct
20
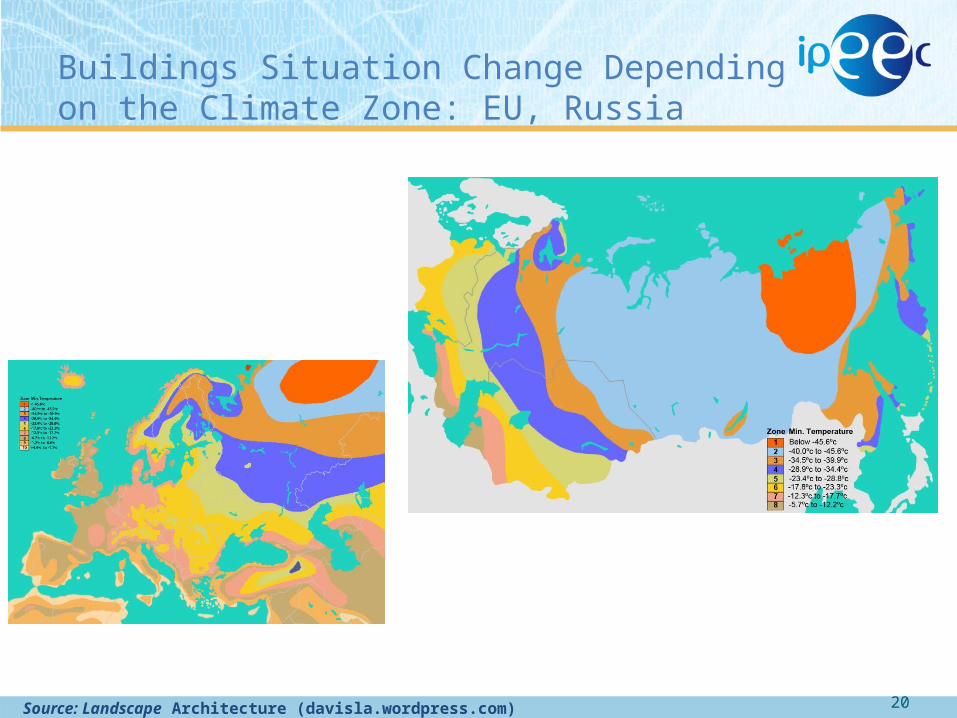
Buildings Situation Change Depending on the Climate Zone: EU, Russia
Source: Landscape Architecture (davisla.wordpress.com)

21
Buildings Situation Change Depending on the Climate Zone: India & China
Source: TERI, China Academy of Building Research

22
How Important are HVAC in the World?
HVAC represent an important share of energy consumption in the USA & Europe: In the USA (2009), HVAC energy consumption as
part of the building’s total energy use represent : 39% in the residential sector, 32% in the commercial sector.
In the EU (2007), HVAC represents 333 TWh (approx. 11% of total annual European electricity consumption)
In emerging countries, use of HVAC is expected to rise, due to the emergence of middle classes: 80% of Chinese large & medium cities are equipped
with AC. In 2008, AC energy consumption represented 41 billion KWh,
40% of the Mumbai’s electricity is used by AC.
23
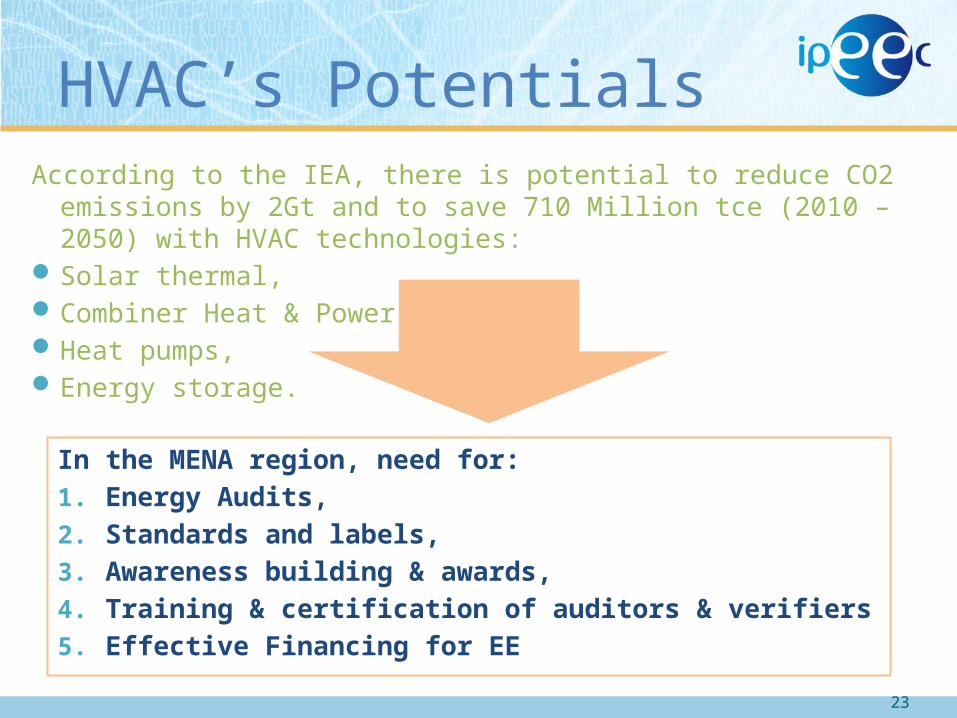
HVAC’s PotentialsAccording to the IEA, there is potential to reduce CO2 emissions
by 2Gt and to save 710 Million tce (2010 – 2050) with HVAC technologies:
Solar thermal,Combiner Heat & Power,Heat pumps,Energy storage.
In the MENA region, need for:1. Energy Audits,2. Standards and labels,3. Awareness building & awards,4. Training & certification of auditors & verifiers5. Effective Financing for EE

24
An Example of EE Effective Financing
Housing NAMA
Penetration and Scaling
up
PENETRATION
SCALING UP
&
Green MortgageFOVISSSTE
•Pilot 2012 in hand Green Mortgage
Penetration
Optimum use of existing infrastructure
Reclaiming of urban voidsDensity increase
It Combines:Regional planning,Urban Development,Urban Design, andSustanaible Housing.
Aguascalientes Pilot Project
Source: CONAVI, 2012
Mexico’s Strategy to strengthen Municipal and State legislation in order to promote “Smart city growth”.

Thank you for your attention!
More information on www.ipeec.org
Any questions? Please contact us: [email protected]
9 rue de la Fédération75739 Paris
France