“Energy conservation saves dollars and makes sense.
23
“Energy conservation saves dollars and makes sense. ” Dr. Mitchell Colgan College of Charleston, Department of Geology & Environmental Sciences Subcommittee Chair 41
Transcript of “Energy conservation saves dollars and makes sense.

“Energy conservation saves dollars and makes sense. ” Dr. Mitchell Colgan
College of Charleston, Department of Geology
& Environmental Sciences Subcommittee Chair
41

n the previous chapter, energy usage within buildings was discussed, and in this chapter, the production, transmission,
and conservation of energy are examined. The burning of fossil fuels generates much of the energy that powers our daily activities. Charleston’s reliance on fossil fuels raises three questions concerning the sustainability of our community and the possibility of reducing our dependence upon these sources: • How can we reduce our
dependence on costly fossil fuels that generate global warming greenhouse gases?
• How can we protect public
health and ensure clean air and water while providing needed energy?
• How can we promote the
creation of a local “clean energy” economy, which would reduce the flow of energy dollars out of our community and nation?
Charleston citizens can draw on the successes of other communities that have wrestled with these questions and have established practical solutions.
The Current System
Currently, South Carolina depends heavily on fossil fuels for its energy needs, consuming 61% of its electricity from coal-fired power plants.1 Charleston, in particular, receives at least 66% of its power from this source.2 When coal is used to generate electricity it releases more heat-trapping carbon dioxide than other fossil fuels. Along with carbon dioxide, coal releases oxides of sulfur that produce acid precipitation and trace metals like mercury. As a consequence, coal burning reduces the region’s air quality, contaminates waterways, and compromises public health (Visit http://www.scdhec.gov/environment/water/fish/docs/map.pdf to view map of SC’s contaminated waterways) . Coal is often seen as an inexpensive generator of electricity, but hidden costs associated with the human health problem and environmental pollution can be costly to a community- three times greater, in fact, than the cost of energy production.3
Win-Win Choices
This plan recommends that Charleston place a high priority on energy efficiency and renewable energy, which would decrease greenhouse gases, reduce toxic
CLEANER ENERGY
ACTIONS 1. Establish an “Efficiency-
First” principle. 2. Use energy efficiently. 3. Generate and support
renewable energy. 4. Transmit and deliver
electricity efficiently. 5. Encourage the public to
participate.
BENEFITS
Reduce energy costs Create jobs
Improve public health
Protect clean air
Protect clean water
Conserve natural resources Enhance quality of life Slow climate change
Raise awareness
42
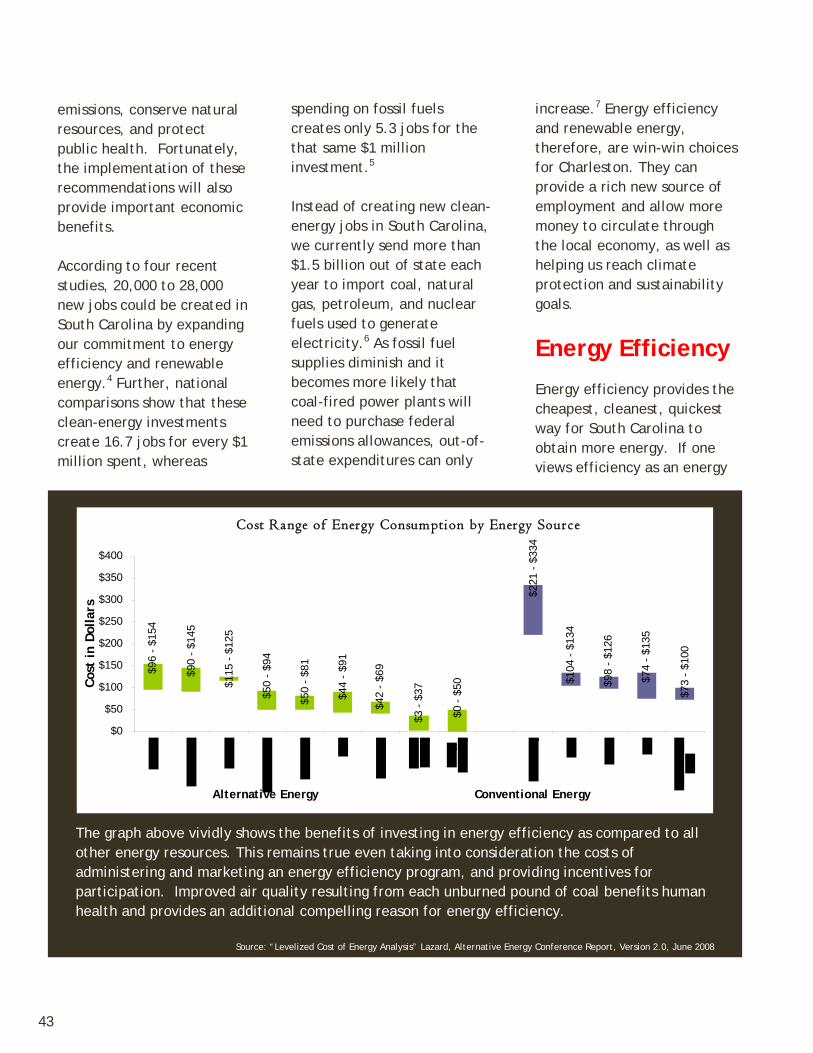
emissions, conserve natural resources, and protect public health. Fortunately, the implementation of these recommendations will also provide important economic benefits. According to four recent studies, 20,000 to 28,000 new jobs could be created in South Carolina by expanding our commitment to energy efficiency and renewable energy.4 Further, national comparisons show that these clean-energy investments create 16.7 jobs for every $1 million spent, whereas
spending on fossil fuels creates only 5.3 jobs for the that same $1 million investment.5 Instead of creating new clean-energy jobs in South Carolina, we currently send more than $1.5 billion out of state each year to import coal, natural gas, petroleum, and nuclear fuels used to generate electricity.6 As fossil fuel supplies diminish and it becomes more likely that coal-fired power plants will need to purchase federal emissions allowances, out-of-state expenditures can only
increase.7 Energy efficiency and renewable energy, therefore, are win-win choices for Charleston. They can provide a rich new source of employment and allow more money to circulate through the local economy, as well as helping us reach climate protection and sustainability goals.
Energy Efficiency
Energy efficiency provides the cheapest, cleanest, quickest way for South Carolina to obtain more energy. If one views efficiency as an energy
The graph above vividly shows the benefits of investing in energy efficiency as compared to all other energy resources. This remains true even taking into consideration the costs of administering and marketing an energy efficiency program, and providing incentives for participation. Improved air quality resulting from each unburned pound of coal benefits human health and provides an additional compelling reason for energy efficiency.
Source: “Levelized Cost of Energy Analysis” Lazard, Alternative Energy Conference Report, Version 2.0, June 2008
Cost Range of Energy Consumption by Energy Source$2
21 -
$334
$0 -
$50
$3 -
$37
$90
- $14
5
$96
- $15
4
$115
- $1
25
$50
- $94
$50
- $81
$44
- $91
$42
- $69
$104
- $1
34
$98
- $12
6
$74
- $13
5
$73
- $10
0
$0
$50
$100
$150
$200
$250
$300
$350
$400
Alternative Energy Conventional Energy
Cost
in D
olla
rs
43
resource, then it costs three to ten times less than any other energy resource, including renewable energy..
8 South Carolina residents have the fifth highest rate of electricity consumption in the United States9 and the state’s energy efficiency policies rank 34th among the fifty states. 10 Therefore, South Carolina must make concerted efforts to improve its policies and support energy efficiency programs. For our local efforts, there are many successful models that the City can follow to promote energy efficiency, such as: • Developing energy-
efficient procurement standards, which integrate
life-cycle cost assessment for municipal governments;
• Helping residents and businesses increase energy efficiency (this program is currently in the planning stages, scheduled to begin in 2010);
• Creating a “climate partnership” that challenges the City’s major energy consumers to work together to reduce consumption;
• Supporting South Carolina Electric and Gas (SCE&G) in their continued expansion of technology and management systems that help consumers reduce energy consumption; and
• Encouraging a four-day work-week and telecommuting.
It is worth noting that utilities around the country have already developed ambitious energy-efficiency programs. In ten states, utilities have achieved statewide energy savings on the order of 1% of retail sales per year.11 As of 2006, South Carolina’s four largest utilities achieved energy efficiency savings equal to 0% – although Duke Energy Carolinas has proposed to reach 1% per year by 2015, and other utilities are studying the issue.12
Renewable Energy
Renewable energy resources include solar, wind, tidal, geothermal, and hydroelectric energy, methane from landfills, and biofuels from sustainable crops. Renewable energy resources are now
Climate partnerships between utilities, governments, businesses and residents can work to reduce overall consumption and improve efficiency of energy used.
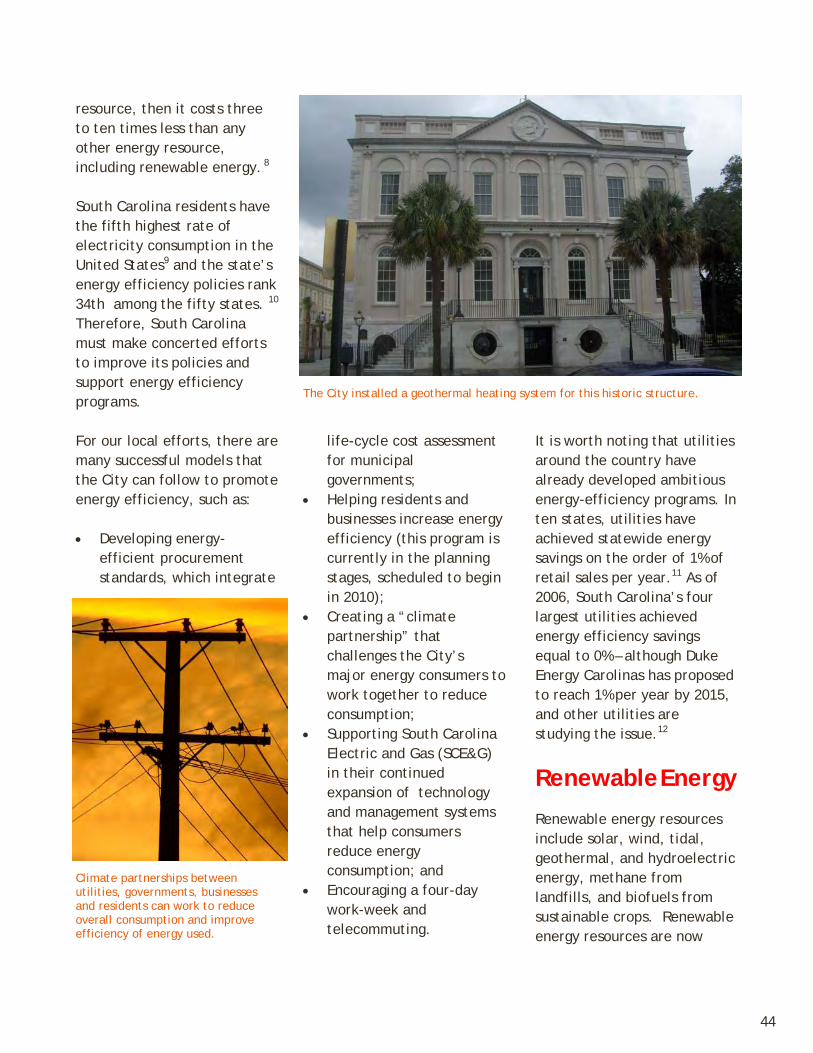
The City installed a geothermal heating system for this historic structure.
44
SCE&G IN PROGRESS
Since March 2009, SCE&G has actively solicited input from customers and key stakeholder groups throughout South Carolina regarding the types of programs they would like to see implemented to help them save energy. The majority of the feedback the company has received falls into three general categories of interest for program consideration: rebates/incentives, consumer education and in-home services. In June 2009, SCE&G filed a portfolio of nine proposed Energy Efficiency programs with the South Carolina Office of Regulatory Staff and the Public Service Commission of South Carolina. Seven of the programs are geared toward residential customers, with the remaining two focused on commercial/industrial customers. The company expects a decision regarding these proposed programs by spring 2010. For further information on the proposed programs or for detail on existing tools and resources, visit www.sceg.com/energywise. SCE&G also offers net metering for customers interested in generating their own renewable electricity to power their homes or businesses and even sell the excess energy back to SCE&G. For additional information and resources, including a comprehensive list of FAQ’s, visit www.sceg.com/netmetering. Additionally, in conjunction with other investor owned utilities in South Carolina, the Office of Regulatory Staff and the South Carolina Energy Office, SCE&G is a founding member and serves on the board of directors of Palmetto Clean Energy (PaCE), a non-profit organization dedicated to supporting renewable energy generation in South Carolina. Through incentives paid by PaCE to renewable energy generators, the organization encourages the development and addition of renewable energy resources, such as solar, hydro, biomass and wind energy to South Carolina’s power supply. For more information and enrollment options, visit www.palmettocleanenergy.org.
Felicia Rhue Howard Director, SCANA Demand Side Management
Green Committee Member
economically competitive with traditional energy sources, and they are likely to become more competitive over time. Generating electricity from renewable sources produces far fewer greenhouse gases, little air or water pollution, and comparatively few human health risks compared to the burning of fossil fuels. Currently, South Carolina gets less than 3% of its energy from renewable sources (hydroelectric power about 2%; other renewables less than 1%).13 This plan recommends that the City, working closely with SCE&G and other utilities, encourages the development of renewable energy resources and to work with state officials to establish a statewide renewable energy portfolio standard equal to or greater than the national average. The City should lead the way by: Establishing a renewable energy goal of 15% by 2020. This goal for the City to derive of 15% of its electrical energy from renewable sources is modest compared to other municipalities. Other Cities are setting goals higher than 15% by 2020. Future innovations in renewable technologies might enable the City to easily exceed this goal. Consequently, City officials should be encouraged to increase this goal to keep pace with
45

changes in technology. Los Angeles is scheduled to reach 20% renewable energy by 2010, and 40% by 2020 – at that point replacing all of its coal-fired power with renewable energy.14 Austin, Texas currently gets 12% of its energy from renewable resources, and has set a goal of nearly 40% by 2020.15
Grand Rapids, Michigan met its goal of 20% renewables in 2008. By 2020, Grand Rapids plans to meet 100% of its energy needs from renewable sources.16
The City should encourage development of large-scale sources of renewable energy, potentially including solar, tidal, and offshore wind. Wind energy is an important energy resource for South Carolina, and it is a much more practical option than many people realize. As of 2006, wind farms supplied 20% of Denmark’s electrical needs 17, and by 2030, wind farms are expected to supply 25% of Europe’s electrical needs.18 A 2009 U.S. Department of Energy study shows that wind energy could generate 20% of our nation’s electrical needs.
Delaware is on the verge of building the nation’s first offshore wind farm, and Rhode Island and New Jersey will soon follow suit.19 South Carolina’s strong offshore winds could be harnessed to generate electricity, and this clean, renewable source could meet some of the state’s energy needs. Production, deployment, and maintenance of offshore turbines would bring well-paid jobs to the Charleston area. 20 But the true economic development opportunity is even larger. An offshore industrial cluster in
The City and citizens can meet its renewable goals through small site installations of alternative energy sources, such as solar and wind energy generatorss.
46
South Carolina could potentially capture locally up to 50% of the costs associated with building offshore wind farms, representing an estimated market greater than $80 billion over the next twenty years.21 Finally, the City should encourage on-site generation of renewable energy. Strategies include working with local partners to apply for renewable energy grants for public housing, working with SCE&G, amending ordinances as needed, and investigating financing mechanisms to facilitate installation of energy-generating devices at private homes.
Collaboration is Essential
The City of Charleston and its citizens relies primarily on SCE&G to provide its electrical and natural gas needs. The City will need to work closely with SCE&G, Berkeley Electric Cooperative and Santee Cooper to achieve the desired energy efficiencies and reliance on renewable energy to protect our climate, enhance our overall sustainability and promote health.
SCHOOLS CASH IN ON ENERGY SAVINGS
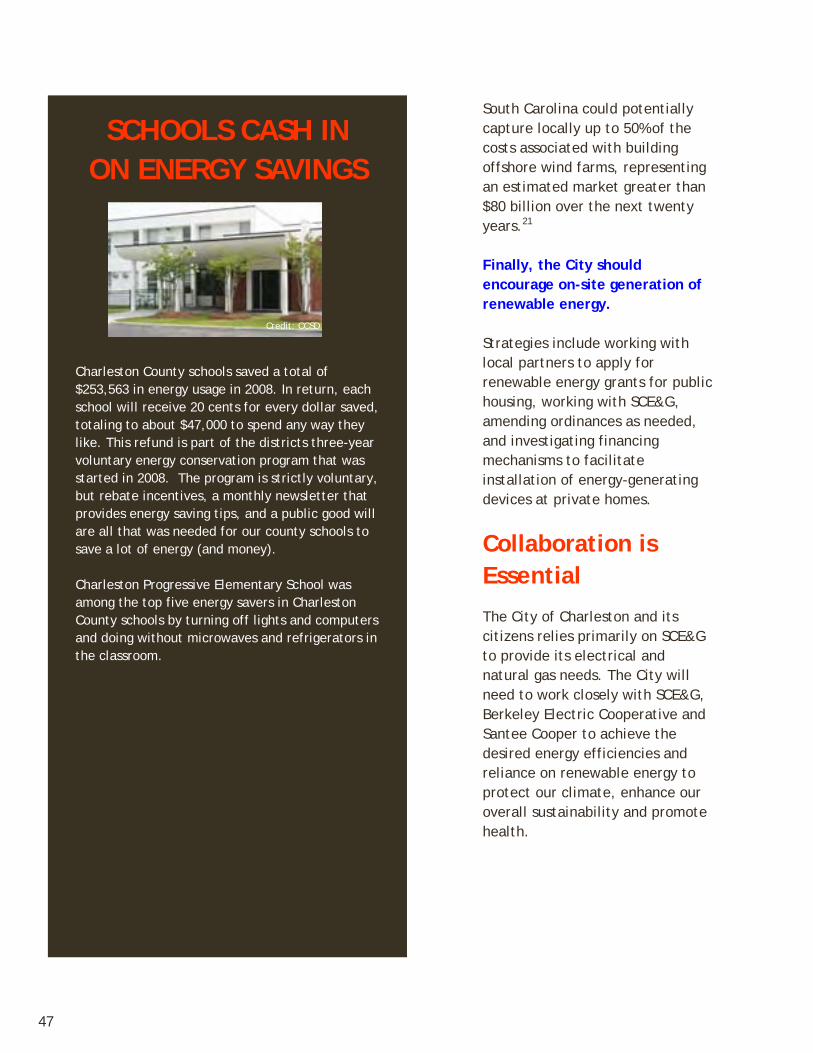
Charleston County schools saved a total of $253,563 in energy usage in 2008. In return, each school will receive 20 cents for every dollar saved, totaling to about $47,000 to spend any way they like. This refund is part of the districts three-year voluntary energy conservation program that was started in 2008. The program is strictly voluntary, but rebate incentives, a monthly newsletter that provides energy saving tips, and a public good will are all that was needed for our county schools to save a lot of energy (and money). Charleston Progressive Elementary School was among the top five energy savers in Charleston County schools by turning off lights and computers and doing without microwaves and refrigerators in the classroom.
Credit: CCSD
47

“While our electric rates are among the lowest nationwide, our bills are among the highest. This means that there are enormous gains to be realized through investing in energy efficiency -- improving insulation, replacing heating and air conditioner systems, fixing leaky windows, and many other simple, cost-effective measures.”
Tony Bakker Charleston Resident
Post & Courier, Letter to the Editor 48

Cleaner Energy Goals, Actions & Recommendations ACTIONS 1. Establish an “Efficiency-First”
principle.
2. Use energy efficiently. A. Increase the conservation of
electricity, B. Develop energy-efficient
procurement standards for the City.
C. Continue to use energy service companies.
D. Create a Charleston Climate Partnership with major energy consumers.
E. Establish an alternative financing program to facilitate energy efficiency.
F. Study the implementation of a four-day workweek.
3. Generate and support renewable energy.
A. Set a goal for renewable energy.
B. Help develop large-scale sources of renewable energy.
C. Encourage on-site generation of renewable energy on City and private property.
4. Transmit and deliver electricity
efficiently.
5. Encourage the public to participate. E1. ESTABLISH AN “EFFICIENCY-FIRST” PRINCIPLE Summary of Specific Issues: Population growth and new technologies have increased energy demands, and consequently greenhouse gas emissions. Energy efficiency is the most cost effective, cleanest, and quickest way to reduce energy consumption and decrease greenhouse gas emissions. Recommendation/Strategy/Action Plan: The City should establish an "Efficiency First" principle to guide all of its energy-use decisions. This principle should influence energy contracts (Recommendation E-2A) and purchases of equipment and supplies (Recommendation E–2B). The Efficiency First principle should guide decisions about buildings and land use. (See Buildings Section and Recommendation B1.) The success of an “Efficiency First” principle depends on City employees’ general understanding of the costs and benefits of selecting energy-efficient items. Estimated Greenhouse Gas Reductions to be Achieved – In Metric Tons/Year: Probably substantial. Implementation Responsibilities/Assignments: The Sustainability Director should create a program to educate City employees about the "Efficiency First" principle.
38% Quantifiable measures could achieve 38% of 2030 reduction goal (equal to 427,175 mtCO2e). See page 21 for details.
49

Cost to Implement/Net Savings from Implementation: Probably quite small. Additional Benefits: Cost savings and leading by example. Timeline for Implementation: Immediate. References: Programs instituted in both Los Angeles and Kansas City.
E2. USE ENERGY EFFICIENTLY E-2A: Increase the conservation of
electricity. Summary of Specific Issues: In other cities, “demand-side management” (DSM) programs have reduced the growth in the demand for electrical power. There are two types of DSM programs: • Energy conservation programs that reduce
total quantity of electricity used (measured in kilowatt-hours).
• Demand response programs that reduce peak demand for electricity (measured in kilowatts).
Since these conservation programs reduce electrical usage, utility companies can forgo the construction of expensive new generating facilities. With reduced usage, peak electrical demands are lessened and the strains on the existing power infrastructure are diminished, minimizing the probability of future power outages. Also, utility companies providing consumers with low-cost, real-time energy usage monitoring devices will help households with the means to make wise energy conservation choices. Finally, a community’s energy needs are met with less electricity, reducing greenhouse gas emissions. DSM programs, then, can make the delivery of electricity more reliable, less expensive, and less polluting.
Recommendation/Strategy/Action Plan: • SCE&G: Since the City of Charleston does
not operate a municipal utility, it must rely on SCE&G to meet its electricity needs. The City should therefore encourage SCE&G to employ robust DSM programs. Charleston should also review its contracts with SCE&G to insure that DSM programs and other energy conservation measures are encouraged. Further, the City should work with the state Public Service Commission to require that all of the state’s utilities have DSM practices and other conservation measures to increase efficiency and reduce greenhouse gases.
• INTERNAL PROGRAM: Internally, the City
should use energy management systems in its buildings to monitor energy uses at the department level. City departments should design and implement energy conservation and demand response programs. In the process, the City should take advantage of any additional opportunities for efficiency, including but not limited to:
• Installing thermostats with timer-
activated set points that control air conditioning/space heating to provide higher or lower temperatures for nights and holidays; and
• Switching to work-space lighting and
reduced room lighting with timer-actuated room lighting to turn off lights after working hours (subject to safety regulations for passageways and stairwells.)
Implementation Responsibilities/Assignments: The Sustainability Director should oversee energy use. The Mayor’s office should work with SCE&G to help design its DSM programs. The City should participate in South Carolina Public Service Commission dockets as necessary to promote its interests in DSM and conservation.
50

Cost to Implement/Net Savings from Implementation: Primarily staff time. Additional Benefits: Cost savings and community leadership. Timeline for Implementation: Review of the contract and DSM program development with SCE&G should start immediately.
E-2B: Develop energy-efficient procurement standards for the City. Summary of Specific Issues: Purchasing decisions affect the amount of energy used. Purchasing rules that promote the use of environmentally preferable products and consider life-cycle costs are an effective means of saving money and energy. Recommendation/Strategy/Action Plan: A green life-cycle purchasing policy should be established for all City departments. In purchasing decisions, departments should be directed to consider life-cycle costs; energy consumption to make, ship, operate, and decommission the product; waste generation; recycled material content; and longevity of items purchased. (See also Recommendation W-1E.) Implementation Responsibilities/Assignments: The Sustainability Director should review and suggest modifications to the City’s existing procurement policy. Department heads and purchasing officers are tasked with overseeing implementation of the policy. Cost to Implement/Net Savings from Implementation: Staff time for both the Sustainability Director and City purchasing officers. Additional Benefits: This policy will reinforce Charleston’s commitment to energy conservation and environmental
stewardship. The City will provide leadership and inspiration for regional municipalities and local businesses.
Timeline for Implementation: Immediate because of low initial cost. E-2C: Continue to use energy service companies. Summary of Specific Issues: Energy service companies, often called ESCOs, provide comprehensive energy solutions that save money and energy. Additionally, these companies provide a means to finance the up-front costs of energy purchases. For instance, the City of Charleston has a successful relationship with Johnson Controls, ESCO, that currently allows it to save more than a half-million dollars per year on energy costs. Recommendation/Strategy/Action Plan: Charleston should maintain and expand its present relationship with energy service companies. Estimated Greenhouse Gas Reductions to be Achieved – In Metric Tons/Year: See Johnson Controls Reports. Implementation Responsibilities/Assignments: Sustainability Director should be involved in overseeing the Johnson Controls contract and performance. Cost to Implement/Net Savings from Implementation: See Johnson Controls Reports. Timeline for Implementation: Continuation of current practices. E-2D: Create a Charleston Climate Partnership with major energy consumers. Summary of Specific Issues: The City of
51

Charleston’s plans to reduce greenhouse gases can only be realized with the cooperation of the City’s major energy consumers. Recommendation/Strategy/Action Plan: Create a Charleston Climate Partnership that challenges large energy users and near-by communities to work together to reduce energy consumption. Develop major business and residential outreach campaigns supporting the adoption of best practices related to energy conservation and the purchase of renewable energy. Implementation Responsibilities/Assignments: The Sustainability Director and the Charleston Chamber of Commerce should work together to develop the Charleston Climate Partnership. Cost to Implement/Net Savings from Implementation: Little cost to the City beyond staff time. Additional Benefits: Sharing of information about energy conservation and renewable energy, and the City assuming a leadership role in working with other communities and business leaders.
Timeline for Implementation: Immediate as there are no initial costs involved. References: New York City E-2E: Establish an alternative financing program to facilitate energy efficiency. Summary of Specific Issues: Charleston’s aging building stock offers immense opportunities for energy efficiency in commercial, industrial, municipal, and residential sectors. Often it is lack of knowledge, financing opportunities, and skilled labor that prevent residents, business owners, and government entities from taking advantage of potential energy reductions and cost savings. Recommendation/Strategy/Action Plan: The
City is already working with a consultant and various local partners to create a self-sustaining entity that will offer comprehensive services to support energy efficiency improvements in residential, commercial, industrial, and government facilities. Services will include energy audits, tailored retrofit programs, financing options, and skilled labor. The City should continue to play a leading role in this effort through and beyond the program’s projected launch date in 2010. (See also Recommendation B5.)
Implementation Responsibilities/Assignments: The Sustainability Director should coordinate this effort for the City. Cost to Implement/Net Savings from Implementation: Proportional to program and services provided. Estimates have made up to $500,000. Additional Benefits: Local job creation, revenue generation, improved health and quality of life, and demonstration of leadership by the City for the State of South Carolina. Timeline for Implementation: The program could be operational by spring 2010. It should provide services to 1,000 housing units, small businesses, or other institutions by 2011; and provide services to all housing units, small businesses and institutions requesting help by 2015. References: Many cities have established similar programs, including the Cambridge Energy Alliance in Massachusetts and programs in Milwaukee, Wisconsin; Charlottesville, Virginia; Portland, Oregon; Babylon, New York; and New York City. E-2F: Study the implementation of a four-day workweek. Summary of Specific Issues: Electricity used in buildings operated by the City of Charleston accounts for 63% of City government’s carbon
52

footprint. Several cities and businesses have instituted a four-day workweek to save energy and reduce operating costs. A four-day workweek can reduce automobile travel, as well as reduce electricity use in City buildings, and can therefore reduce carbon dioxide emissions. Recommendation/Strategy/Action Plan: The City of Charleston should study the possibility of a four-day workweek with departments and the community. Estimated Greenhouse Gas Reductions to be Achieved – In Metric Tons/Year: There will be a small decrease in electricity demand because the reduced work week will be partly compensated for by extending working hours on the remaining four days. We estimate at most a 15% reduction in energy use for City departments. The major energy saving and greenhouse gas reduction will accrue from a 20% reduction in commuting mileage. Implementation Responsibilities/Assignments: The Sustainability Director working together with City department heads should study possible implementation of the four-day workweek. Additional Benefits: Improvement in worker morale, increased work productivity, improved employee retention, reduced employee absenteeism, reduced highway usage. Timeline for Implementation: Implementation will be complex because services to the public may be affected. We recommend initiation of a study during the next 5 years. References: The state of Utah. http://www.heraldextra.com/news/local/article_e5e96c0c-7ee6-5787-b46f-c8ac9990c440.html http://www.usatoday.com/news/
nation/2008-06-30-four-day_N.htm http://www.theoildrum.com/node/2996 College of Charleston MES Green Committee (Case Studies Fall 2008); Recommendations to the Charleston Green Committee for a Sustainable Charleston, SC.
E3. GENERATE AND SUPPORT RENEWABLE ENERGY E-3A: Set a goal for renewable energy. Summary of Specific Issues: To meet long-term goals for reducing greenhouse gas emissions, the city needs to access low-cost, reliable, renewable energy. Our goal is to have 15% of Charleston’s energy needs met by new renewable energy sources, developed after passage of this plan, by 2020 and 30% by 2030. This is a modest goal. Thirty-three states have set renewable energy goals. Ten percent is the lowest goal set by any state, and states that chose that goal plan to reach it no later than 2015. More ambitious states include California, which will require its utilities to generate 20% of their power from renewables by 2010, and 33% by 2020. Los Angeles is scheduled to reach 20% renewable energy by 2010, and 40% by 2020. Ahead of Los Angeles, interestingly, is Grand Rapids, Michigan, which met its goal of 20% in 2008. By 2020, Grand Rapids plans to rely 100% on renewable energy.
Recommendation/Strategy/Action Plan: The City should develop a strategy that will result in at least 15% of its electrical energy needs being met from renewable energy sources by 2020. The City should also pursue opportunities to procure, support, or generate renewable energy.
53

Estimated Greenhouse Gas Reductions to be Achieved – In Metric Tons/Year: If the goal of 15% is met by 2020, there would be a reduction of approximately 40,500 tons CO2/yr. Implementation Responsibilities/Assignments: • The Sustainability Director should identify
possible renewable energy sources to replace fossil fuels. The Sustainability Director will collaborate with utilities and pursue other funding sources.
• City lawyers should review the SCE&G
contract to determine the feasibility of producing renewable energy or procuring renewable energy from SCE&G and/or other providers.
• The Sustainability Director should review
opportunities to purchase renewable energy (e.g. green tags) from green power purchase programs (e.g. Palmetto Clean Energy) or other sources.
• The City with SCE&G, South Carolina Public
Service Commission, and the South Carolina General Assembly should explore the possibilities of setting reasonable statewide standards for renewable energy generation.
Additional Benefits: Embracing renewable energy could foster economic development around sustainability and renewable energy. Timeline for Implementation: Implementation can begin immediately. E-3B: Help develop large-scale sources of renewable energy. Summary of Specific Issues: Development of local, large-scale facilities that generate renewable energy is an important step toward fulfilling long-term goals for reducing carbon dioxide emissions. The wind energy potential
offshore near Charleston is sufficient to meet much of the City’s electricity demand. Off-shore wind farms are successful in Europe and plans are underway for major installations in the Northeastern US. There is also the potential for Charleston to attract a national/ international offshore wind manufacture and distribution hub. The city already meets important infrastructure requirements, such as port facilities and steel manufacturing facilities. In addition, tidal and wave energy, as well as large-scale solar farms, may be potential energy resources for the Charleston area. Recommendation/Strategy/Action Plan: The City should support and/or undertake feasibility studies of potential renewable energy sources, including wind, solar, tidal, and wave energy. The City should then develop a strategy for supporting appropriate renewable energy projects. Estimated Greenhouse Gas Reductions to be Achieved – In Metric Tons/Year: European experience indicates a large possible displacement of fossil fuels.
Implementation Responsibilities/Assignments: Because of the long-term nature of this recommendation, the Sustainability Director and the Charleston Green Committee should take on this responsibility with the possible support of the City Business Innovation Director. Cost to Implement/Net Savings from Implementation: Cost will be mainly Sustainability Director’s time. Additional Benefits: Embracing renewable energy could foster significant economic development. Timeline for Implementation: Next 5 years.
54

References: MES (College of Charleston) case studies report on Off-shore winds.
E-3C(i): Encourage on-site generation of renewable energy (City property). Summary of Specific Issues: To make dramatic reductions in power use and associated climate impacts, it may be necessary to change the City’s policy for acquiring power for its own facilities. Recommendation/Strategy/Action Plan: A City-financed study should address the technical and legal feasibility of on-site renewable energy facilities for City buildings, as well as off-grid retrofits for specific building functions such as solar lighting, space heating, and hot water heating. A further target is conversion from air-source heat pumps to ground- or water-sourced systems, which operate more efficiently.
Estimated Greenhouse Gas Reductions to be Achieved – In Metric Tons/Year: None until the study’s recommendations are implemented. Implementation Responsibilities/Assignments: The Sustainability Director should manage the survey of City-owned facilities. Cost to Implement/Net Savings from Implementation: The cost of this feasibility study would be modest, whether undertaken by a consultant or City employees. Much of the information needed is readily available.
Additional Benefits: Public education regarding viability of alternative energy technology. Timeline for Implementation: This is an important “first step” and should be
implemented immediately because of its low cost. An RFP could be developed within 60 days, a study could be completed in 6 months, and implementation could take place over two to five years depending on study results and budget constraints.
References: Kansas City E-3C(ii): Encourage on-site generation of renewable energy (private property). Summary of Specific Issues: The actions of private property owners have a large impact on energy use. Photovoltaic solar power generation for home or commercial consumption or grid feed-in, solar space heating, and solar hot water heating can substantially reduce greenhouse gas emissions.
Recommendation/Strategy/Action Plan: City staff should: • Examine city ordinances and work with
SCE&G to reduce obstacles to, and create incentives for, the installation of energy-generating devices on private property (e.g. net metering, interconnection standards);
• Work with Charleston County Housing
Authority and the Department of Housing and Community Development to apply for renewable energy grants for low-cost public housing;
• Investigate financing mechanisms that
allow homeowners to amortize the upfront costs of renewable energy generation by utilizing the municipal bond market (e.g. a renewable energy finance district);
• Provide via the City website timely
information about state and federal
55
incentives for solar and other renewable energy installations.
Implementation Responsibilities/Assignments: Sustainability Director working together with the Housing Authority and City Department of Housing and Community Development. Cost to Implement/Net Savings from Implementation: Minimal cost for City staff time. Additional Benefits: Public education regarding viability of alternative energy technology. Timeline for Implementation: Can begin immediately. References: Kansas City
E4. TRANSMIT AND DELIVER ELECTRICITY EFFICIENTLY Summary of Specific Issues: A “Smart Grid” uses available technologies to make the nation’s electrical grid work more efficiently and increase reliability. Increased efficiency of energy delivery reduces consumer’s electrical bills and decreases greenhouse gas emissions associated with energy generation. Household energy monitoring devices linked to a smart grid will help household to make better energy usage decisions, because the consumer can postpone energy-intensive activities until off-peak hours when energy costs less. The “Smart Grid” technology is fully compatible with on-site renewable energy generation. A Smart Grid is used with DSM (Recommendation E-2A) to reduce energy consumption and save money in many cities, including Miami, Florida and Austin, Texas. Recommendation/Strategy/Action Plan: The City should work with SCE&G to bring Smart Grid technology to Charleston. The City can encourage SCE&G to follow the lead of Duke Energy, which is trying to bring Smart Grid
technology to all its customers. The City should ask the South Carolina Public Service Commission to help introduce Smart Grid technology to South Carolina. Implementation Responsibilities/Assignments: The Sustainability Director and Charleston business leaders should work with the state and SCE&G to bring Smart Grid technology to Charleston. Cost to Implement/Net Savings from Implementation: Costs would accrue mainly to SCE&G, but are offset by a reduction of the number of standby generation facilities that will be needed. Additional Benefits: A Smart Grid will encourage the use of on-site renewable energy devices; encourage conservation; and enhance Charleston’s “green” reputation.
E5. ENCOURAGE THE PUBLIC TO PARTICIPATE Summary of Specific Issues: Ultimately, the effectiveness of an energy-efficiency campaign depends on how many individuals and businesses participate. It is therefore essential to include an education and public relations campaign that can address a broad range of stakeholders. Recommendation/Strategy/Action Plan: The City should build or enhance partnerships with a range of interested parties, including utilities, local and regional government entities, and nonprofit groups to establish and implement an education and training program on energy and the environment. Implementation Responsibilities/Assignments: The Sustainability Director should manage this process and work with the Charleston Chamber of Commerce, the County School Board, local colleges, and neighborhood committees, among others.
56

Cost to Implement/Net Savings from Implementation: The only cost to the City would be the Sustainability Director’s time and the preparation of public relations materials. Additional Benefits: Enhanced City leadership. Timeline for Implementation: Planning of the program could begin immediately. References: Educational activities are common to all City energy and greenhouse gas reduction plans examined by the Energy Subcommittee.
57

58

28. The three to six degree difference is based on tabulation of local data by Green Committee members. The federal Environmental Protection Agency states that annual mean air temperature of a city with one million people or more can be 1.8 to 5.4 degrees Farenheit warmer than surrounding areas, with a much greater differential of 22 degrees Farenheit on clear calm nights. See “Heat Island Effect,” U.S. Environmental Protection Agency (2009), http://www.epa.gov/heatisland/.
29. Under the agreement, participating cities agree to (1) meet or beat the Kyoto Protocol target of reducing greenhouse gas emissions by 7% from 1990 levels by 2012; (2) urge federal and state governments to do the same; and (3) urge the federal government to pass bipartisan greenhouse gas reduction legislation establishing a national emission trading system. See “U.S. Conference of Mayors Climate Protection Agreement,” http://www.usmayors.org/climateprotection/agreement.htm.
30. Specifically, the Green Committee was charged with (1) Providing solutions to ensure a prosperous community that will sustain a healthy citizenry and a healthy planet; (2) Inspiring individuals and organizations to make Charleston a model of health and ecologically sustainability; and (3) Working with City government, businesses, nonprofits, and others to protect and enhance Charleston’s environment and quality of life. See City of Charleston Earth Day Resolution, April 2008, http://www.charlestoncity.info/shared/docs/0/42208greenresolution.pdf; see also Charleston Green Committee website, http://charlestongreencommittee.com/missionstatement.html.
Better Buildings 1. See “Unlocking Energy Efficiency in the U.S. Economy,” McKinsey & Company (2009),
http://www.mckinsey.com/clientservice/electricpowernaturalgas/us_energy_efficiency/.
2. See “Green Building Research,” U.S. Green Building Council, http://www.usgbc.org/DisplayPage.aspx?CMSPageID=1718.
3. See summary of “Nation Under Siege: Sea Level Rise at our Doorstep,” Architecture 2030 at 4 (2007), (http://www.architecture2030.org/pdfs/coastal_impact_summary.pdf.
4. See “Promotion of Green Building: Local Government Land Use and Building Code Incentives and Mandates,” Institute of Green Professionals (3 August 2009), http://www.consilienceblog.org/consilience-the-blog/2009/8/3/future-of-green-building-where-is-it-going.html.
5. See “Case Studies,” Architecture 2030, http://www.architecture2030.org/current_situation/case_studies.php.
6. See “Green Building Principles – Environmental Impact,” Smart Communities Network (2004), http://www.smartcommunities.ncat.org/buildings/envirimp.shtml.
7. See “Green Building Principles – Resource Conservation, Smart Communities Network (2004), http://www.smartcommunities.ncat.org/buildings/rescon.shtml.
Better Buildings Recommendations 1. Guidance on achieving these goals along with a blueprint for implementation and
numerous resources may be found at www.architecture2030.org.
155

Cleaner Energy 1. [i] With 61% of the state’s electrical power coming from coal, nuclear energy contributes
31%, natural gas/oil 5%, hydropower 2%, and non-hydropower renewable less than 1%. See “Energy Policy Report,” South Carolina Regulation of Public Utilities Review Committee (2009) at 6, http://www.scstatehouse.gov/citizensinterestpage/EnergyIssuesAndPolicies/FinalPURCEnergyReport.pdf.
2. [ii] Charleston is primarily served by South Carolina Electric and Gas, which generates electricity using 66%coal, 19% nuclear, 11% natural gas, and 4% hydroelectric. See “SCE&G Quick Facts” retrieved August 2009, http://www.sceg.com/NR/rdonlyres/26ADE7BE-0699-41C8-84C7 32C488E5292A/0/SCEGQuickFacts.pdf.
3. [iii] See “Cost Benefit Analysis: Replacing Ontario’s Coal-Fired Electricity Generation,” Ontario Ministry of Energy (2005), www.mei.gov.cn.ca/English/pdf/electricity/coal_cost_benefit_analysis_april2005.pdf.
4. [iv] See “Clean-Energy Investments Create Jobs in South Carolina” Political Economy Research Institute
5. (2009), http://images2.americanprogress.org/CAP/2009/06/factsheets/peri_sc.pdf; “Green Economic Recovery Program: Impacts on South Carolina,” Political Economy Research Institute (2008), http://images2.americanprogress.org/CAP/2008/09/peri_sc.pdf; “South Carolina’s Road to Energy Independence,” Blue-Green Alliance (2007), http://www.bluegreenalliance.org/assets/pdf/SC-Report.pdf; “Clean Energy: Jobs for America’s Future,” World Wildlife Fund (2001), http://www.worldwildlife.org/climate/Publications/WWFBinaryitem4931.pdf .Relative to spending on fossil fuels, clean-energy investments create 2.6 times more jobs for people with college degrees or above; 3 times more jobs for people with some college; and 3.6 times more jobs for people with high school degrees or less. See “Clean-Energy Investments Create Jobs in South Carolina” Political Economy Research Institute (2009), http://images2.americanprogress.org/CAP/2009/06/factsheets/peri_sc.pdf.
6. [v] See “Clean-Energy Investments Create Jobs in South Carolina” Political Economy Research Institute (2009), http://images2.americanprogress.org/CAP/2009/06/factsheets/peri_sc.pdf.
7. [vi] See “State Energy Data System,” U.S. Energy Information Administration (2005), http://www.eia.doe.gov/emeu/states/hf.jsp?incfile=sep_sum/plain_html/sum_ex_tot.html
8. [vii] See “Don’t Get Burned: The Risks of Investing in New Coal-Fired Generating Facilities,” Interfaith Center on Corporate Economics (2008) at 20, http://www.iccr.org/news/press_releases/pdf%20files/DontGetBurned08.pdf.
9. [viii] See “Levelized Cost of Energy Analysis: Version 2.0,” Lazard (2008), http://www.narucmeetings.org/
10. Presentations/2008%20EMP%20Levelized%20Cost%20of%20Energy%20-%20Master%20June%202008%20(2).pdf. Beyond its modest price tag, energy efficiency has other benefits. A recent study showed that investment in energy efficiency, as opposed to fossil fuel power plants, would give consumers in Virginia a net savings of $2.2 billion annually. It would also create nearly 10,000 new jobs, growing the state’s economy by $882 million per year. See “Energizing Virginia: Efficiency First,” American Council for an Energy Efficient Economy (2008), https://salsa.democracyinaction.org/o/423/images/
156

energyefficiency_va.pdf.
11. [ix] See “Energy Policy Report,” State Regulation of Public Utilities Review Committee (2009) at 5, http://www.scstatehouse.gov/citizensinterestpage/EnergyIssuesAndPolicies/FinalPURCEnergyReport.pdf.
12. [x] See “2008 State Energy Efficiency Scorecard,” American Council for an Energy-Efficient Economy, http://www.aceee.org/pubs/e086_es.pdf.
13. [xi] A utility in Colorado has committed to reducing consumption by an impressive 1.4% in 2013. Also, Vermont utilities reduced energy consumption by approximately 5%, and peak demand by approximately 6%, between 1991 and 1997. See “Comments on Energy and Energy Policies in South Carolina,” SC Coastal Conservation League (2008) at 12-13 and cites therein, http://www.scstatehouse.gov/citizensinterestpage/EnergyIssuesAndPolicies/CommentsReceived/Coastal%20Conservation%20League%20Comments.pdf; see also “Powering Down in Juneau,” Berkeley Lab News Center (2009), http://www.lbl.gov/publicinfo/newscenter/features/2008/EETD-alaska.html. (Juneau, Alaska residents voluntarily reduce peak power usage by 40% during an eight-week crisis in electrical power delivery).
14. [xii] Duke Energy’s goal is consistent with a unanimous recommendation by the state’s Climate, Energy, and Commerce Advisory Committee (CECAC). See id. at 14 and cites therein.
15. [xiii] See “Energy Policy Report,” South Carolina Regulation of Public Utilities Review Committee (2009) at 6,
16. http://www.scstatehouse.gov/citizensinterestpage/EnergyIssuesAndPolicies/FinalPURCEnergyReport.pdf.
17. [xiv] See “Los Angeles Will End Use of Coal Fired Power,” Reuters (2 July 2009), http://www.reuters.com/article/GCA-GreenBusiness/idUSTRE56165X20090702.
18. [xv] See “Austin Energy Raises Green Energy Goal,” News 8 Austin (4 Sept 2009), http://news8austin.com/content/your_news/default.asp?ArID=251247.
19. [xvi] See “Renewable Energy,” Grand Rapids, Michigan official site, retrieved August 2009, mhttp://www.ci.grand-rapids.mi.us/index.pl?page_id=9143.
20. [xvii] See “Offshore Wind Farms and the Environment,” Danish Energy Authority (2006) at 3, http://www.bluewaterwind.com/pdfs/havvindm_korr_16nov_UK.pdf.
21. [xviii] See “An Offshore Wind Power Industrial Cluster for South Carolina,” Clemson University Restoration Institute (2009) at 3, http://www.scribd.com/doc/14832620/Charleston-SC-Offshore-Wind-Ins-Trust-Rial-Hub-White-Paper.
22. [xix] Id.
23. [xx] The U.S. Department of Energy predicts that South Carolina could generate 1,000 to 5,000 megawatts of energy from offshore wind. See “Energy Efficiency and Renewable Energy,” U.S. Department of Energy (2009) at 10, http://www.windpoweringamerica.gov/pdfs/20_percent_wind_2.pdf. This represents 4% to more than 20% of the state’s current peak summer electrical capacity, according to an e-mail exchange with Dr. Nicholas Rigas of the Clemson University Restoration Institute on 15 Sept 2009. Peak summer capacity is the maximum amount of electricity that can be put on the state’s grid during peak hours.
157

24. [xxi] See “An Offshore Wind Power Industrial Cluster for South Carolina,” Clemson University Restoration Institute (2009) at 4, http://www.scribd.com/doc/14832620/Charleston-SC-Offshore-Wind-Ins-Trust-Rial-Hub-White-Paper.
Cleaner Energy Recommendations 1. See http://apps1.eere.energy.gov/states/maps/renewable_portfolio_states.cfm.
2. See http://www.energy.ca.gov/renewables/index.html.
3. See http://www.reuters.com/article/GCA-GreenBusiness/idUSTRE56165X20090702.
4. See http://www.ci.grand-rapids.mi.us/index.pl?page_id=9143.
Sustainable Communities
1. Studying a 600-acre property in Mt. Pleasant, scientists from Clemson University and elsewhere looked at the impact on clean water from two possible development scenarios: conventional sprawl, and a more clustered design that minimized pavement and kept buildings away from the water’s edge. The sprawl design produced 43% more stormwater runoff than the clustered design. Also, in the sprawl design, the runoff contained three times as many pollutants. See “The Belle Hall Study,” Dover, Kohl & Partners (1996), http://www.doverkohl.com/files/pdf/Belle%20Hall_low%20res.pdf.
2. See “Modeling and Predicting Future Urban Growth in the Charleston Area,” Strom Thurmond Institute of Government & Public Affairs, Clemson University (2003), http://www.strom.clemson.edu/teams/dctech/urban.html.
3. See “Land Conversion in South Carolina: State Makes Top Ten List,” Jim Self Center on the Future, Clemson University (2000) at 2-3, http://www.strom.clemson.edu/publications/london/conversion.pdf.
4. See “Gasoline Consumption Per Capita,” Statemaster.Com (2001 source, retrieved August 2009) http://www.statemaster.com/graph/ene_gas_con_percap-energy-gasoline-consumption-per-capita.
5. See “Growing Cooler: The Evidence on Urban Development and Climate Change,” Urban Land Institute (2007), at 8-9, http://www.smartgrowthamerica.org/documents/growingcoolerCH1.pdf.
6. Id.
7. Id.
8. See “The Valuation of the World’s Ecosystem Services and Natural Capital,” Nature, v. 387 (15 May 1997) at 253-260.
Sustainable Communities Recommendations 1. See, e.g., http://www.transect.org/.
2. See http://www.lightimprint.org/.
158