Energy Conservation in Lebanon
24
INTERNATIONAL JOURNAL OF ENERGY RESEARCH Int. J. Energy Res., 22, 523—546 (1998) ENERGY CONSERVATION OF RESIDENTIAL BUILDINGS IN BEIRUT N. GHADDAR*,s AND A. BSATt Mechanical Engineering Department, Faculty of Engineering and Architecture, American University of Beirut, Beirut, Lebanon SUMMARY Energy conservation measures on buildings have a significant role to play in reducing the burden of the energy bill on the Lebanese economy. The residential sector is one of various sectors that energy measures can be applied to. Such measures include the use of insulation materials, double-glazed windows, shading, efficient air-conditioning systems, economical lighting and reduction of infiltration rates. It is demonstrated through detailed energy analysis of typical residential and office buildings that strict conservation is benificial on the micro- and macro-economic levels. A code of practice is suggested to establish acceptable standards for energy use in residential buildings and ranking is done of energy measures based on economical indices. ( 1998 John Wiley & Sons, Ltd. KEY WORDS energy conservation; building codes; conservation measures; energy consumption in Lebanon 1. INTRODUCTION Energy in the form of electricity is being used in buildings for the comfort of the inhabitants, specially for artificial lighting, air-conditioning and other building equipment. Lebanon, in the absence of rich natural resources of energy, has to depend on imported oil for its energy use. The Lebanese imported oil bill to run power plants in 1994 was about $200 million and is estimated to reach $400 million when electricity is delivered 24 h of the day. The residential sector consumes about 47% of the total electricity produced, while the industrial sector consumes about 25% based on pre-war data of 1974 (EDL, 1974). There is no reason to believe that the pre-war figure is reduced in the post-war era. With increased population and energy demand, buildings still remain the largest consumer of energy and will be singled out for the present study as a target for energy conservation. For the country to meet the demands, a set of conservation standards for building designs should be implemented backed by incentives for building owners to comply with the new standards. The economic growth and recovery and construction efforts are essentially forcing more demands on energy use in the country. Building more power plants and buying more foreign oil to run them is not an economically feasible solution for the long-term development, particularly when most of the consumption is taking place in the residential sector. So energy conservation and regulation on all levels will become the most important factor for meeting the future demand. Effectiveness of the conservation measures and ranking may differ from measures taken in other countries depending on local weather conditions, available local building materials and on energy use patterns in the country. In this work, a survey is done to get prices on typical building materials, glass, insulation materials, lighting equipment and AC systems. Energy patterns used in typical buildings are also surveyed. A detailed *Correspondence to: Prof. Nasreen Ghaddar, Faculty of Engineering and Architecture, American University of Beirut, P.O. Box 11-0236, Beirut, Lebanon. Email: farah@aub.edu.lb sAssociate Professor of Mechanical Engineering. t Senior Mechanical Engineering Student. CCC 0363—907X/98/060523— 24$17.50 Received 10 February 1997 ( 1998 John Wiley & Sons, Ltd. Accepted 20 May 1997
-
Upload
ahmad-bsat -
Category
Documents
-
view
59 -
download
5
Transcript of Energy Conservation in Lebanon

INTERNATIONAL JOURNAL OF ENERGY RESEARCH
Int. J. Energy Res., 22, 523—546 (1998)
ENERGY CONSERVATION OF RESIDENTIAL BUILDINGSIN BEIRUT
N. GHADDAR*,s AND A. BSATt
Mechanical Engineering Department, Faculty of Engineering and Architecture, American University of Beirut, Beirut, Lebanon
SUMMARY
Energy conservation measures on buildings have a significant role to play in reducing the burden of the energy bill on theLebanese economy. The residential sector is one of various sectors that energy measures can be applied to. Such measuresinclude the use of insulation materials, double-glazed windows, shading, efficient air-conditioning systems, economicallighting and reduction of infiltration rates. It is demonstrated through detailed energy analysis of typical residential andoffice buildings that strict conservation is benificial on the micro- and macro-economic levels. A code of practice issuggested to establish acceptable standards for energy use in residential buildings and ranking is done of energy measuresbased on economical indices. ( 1998 John Wiley & Sons, Ltd.
KEY WORDS energy conservation; building codes; conservation measures; energy consumption in Lebanon
1. INTRODUCTION
Energy in the form of electricity is being used in buildings for the comfort of the inhabitants, specially forartificial lighting, air-conditioning and other building equipment. Lebanon, in the absence of rich naturalresources of energy, has to depend on imported oil for its energy use. The Lebanese imported oil bill to runpower plants in 1994 was about $200 million and is estimated to reach $400 million when electricity isdelivered 24 h of the day. The residential sector consumes about 47% of the total electricity produced, whilethe industrial sector consumes about 25% based on pre-war data of 1974 (EDL, 1974). There is no reason tobelieve that the pre-war figure is reduced in the post-war era. With increased population and energy demand,buildings still remain the largest consumer of energy and will be singled out for the present study as a targetfor energy conservation. For the country to meet the demands, a set of conservation standards for buildingdesigns should be implemented backed by incentives for building owners to comply with the new standards.The economic growth and recovery and construction efforts are essentially forcing more demands on energyuse in the country. Building more power plants and buying more foreign oil to run them is not aneconomically feasible solution for the long-term development, particularly when most of the consumption istaking place in the residential sector. So energy conservation and regulation on all levels will become themost important factor for meeting the future demand.
Effectiveness of the conservation measures and ranking may differ from measures taken in other countriesdepending on local weather conditions, available local building materials and on energy use patterns in thecountry. In this work, a survey is done to get prices on typical building materials, glass, insulation materials,lighting equipment and AC systems. Energy patterns used in typical buildings are also surveyed. A detailed
*Correspondence to: Prof. Nasreen Ghaddar, Faculty of Engineering and Architecture, American University of Beirut, P.O. Box11-0236, Beirut, Lebanon. Email: [email protected] Professor of Mechanical Engineering.tSenior Mechanical Engineering Student.
CCC 0363—907X/98/060523—24$17.50 Received 10 February 1997( 1998 John Wiley & Sons, Ltd. Accepted 20 May 1997

analysis of energy consumption for lighting and air-conditioning systems can be performed using theU.S.-certified energy analysis program Micro-DOE2.1E. The program allows us to perform intensivemathematical manipulations in order to arrive at the annual energy consumption of a building with a widevariety of potential energy conservation measures (DOE, 1993). This is followed by an economic model foroptimization and sensitivity cost analysis with emphasis on the national economy as well as the consumer.Finally, a set of recommendations is provided with a brief discussion on energy conservation measuresenforcement.
2. THE USE OF ENERGY IN LEBANESE BUILDINGS
Energy is being used in buildings for the comfort and convenience of inhabitants including artificial lighting,air conditioning and vertical transportation. Energy use for space cooling in Lebanese buildings dominatesother uses during the summer months, particularly during peak electrical demand hours. To demonstrate thecooling and heating requirements for buildings, the number of degree-days of cooling (base 23°C) and ofheating (base 18°C) are shown in Figure 1 for each month of the year with the corresponding monthlyaveraged ambient temperature. In Figure 2, the heating and cooling requirements for one of our studiedbuildings is shown. As seen in Figures 1 and 2, the cooling load is more significant than the heating load andtaking conservation measures for reducing cooling loads makes more sense.
In general, the factors that affect cooling energy consumption in a building include thermal conductiongains through building envelop and glass, thermal radiation gains through glass windows, infiltration,
Figure 1. The number of degree-days of cooling (base 23°C) and of heating (base 18°C) for each month of the year with thecorresponding monthly averaged ambient temperature
524 N. GHADDAR AND A. BSAT
Int. J. Energy Res., 22, 523—546 (1998) ( 1998 John Wiley & Sons, Ltd.
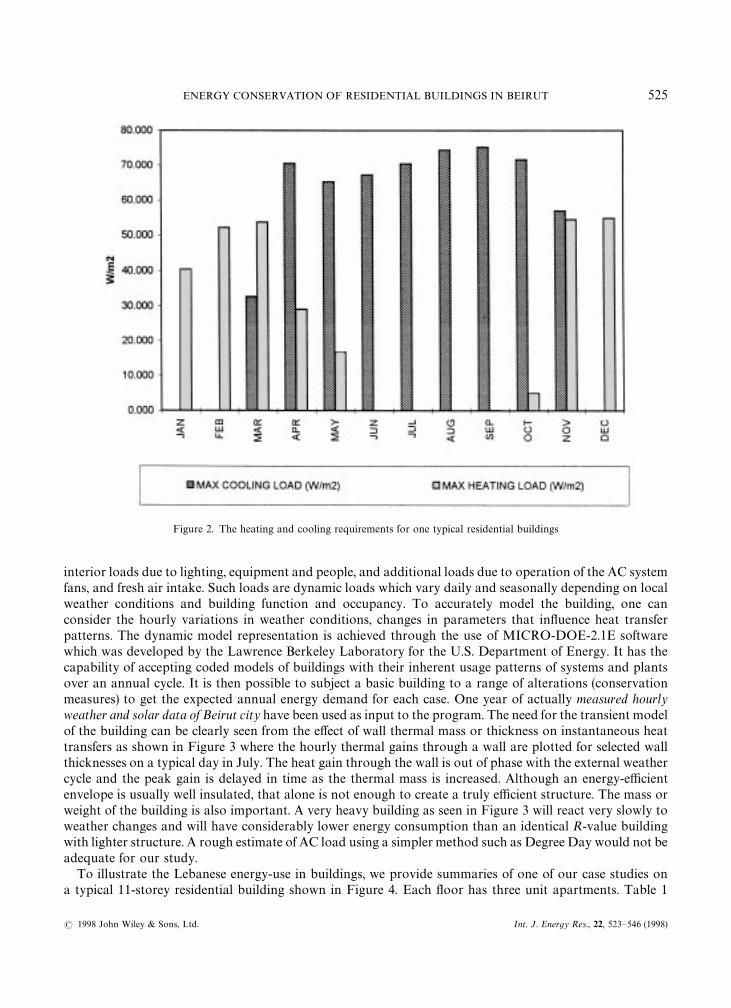
Figure 2. The heating and cooling requirements for one typical residential buildings
interior loads due to lighting, equipment and people, and additional loads due to operation of the AC systemfans, and fresh air intake. Such loads are dynamic loads which vary daily and seasonally depending on localweather conditions and building function and occupancy. To accurately model the building, one canconsider the hourly variations in weather conditions, changes in parameters that influence heat transferpatterns. The dynamic model representation is achieved through the use of MICRO-DOE-2.1E softwarewhich was developed by the Lawrence Berkeley Laboratory for the U.S. Department of Energy. It has thecapability of accepting coded models of buildings with their inherent usage patterns of systems and plantsover an annual cycle. It is then possible to subject a basic building to a range of alterations (conservationmeasures) to get the expected annual energy demand for each case. One year of actually measured hourlyweather and solar data of Beirut city have been used as input to the program. The need for the transient modelof the building can be clearly seen from the effect of wall thermal mass or thickness on instantaneous heattransfers as shown in Figure 3 where the hourly thermal gains through a wall are plotted for selected wallthicknesses on a typical day in July. The heat gain through the wall is out of phase with the external weathercycle and the peak gain is delayed in time as the thermal mass is increased. Although an energy-efficientenvelope is usually well insulated, that alone is not enough to create a truly efficient structure. The mass orweight of the building is also important. A very heavy building as seen in Figure 3 will react very slowly toweather changes and will have considerably lower energy consumption than an identical R-value buildingwith lighter structure. A rough estimate of AC load using a simpler method such as Degree Day would not beadequate for our study.
To illustrate the Lebanese energy-use in buildings, we provide summaries of one of our case studies ona typical 11-storey residential building shown in Figure 4. Each floor has three unit apartments. Table 1
ENERGY CONSERVATION OF RESIDENTIAL BUILDINGS IN BEIRUT 525
( 1998 John Wiley & Sons, Ltd. Int. J. Energy Res., 22, 523—546 (1998)

Figure 3. Hourly thermal gains through a wall verses selected concrete wall thicknesses on a typical day in July
provides data on the so-called base case which reflects the pre-conservation building practices in Lebanon.Assuming typical values for the properties of building materials used as well as schedules for daily activities inthe building, the hourly performance of the building for an entire meteorological year is calculated. Duringthe peak cooling load hour of the year, the contribution of various factors to the cooling and heating loads isshown in Figure 5. Figure 6 shows the monthly peak electrical loads needed for cooling, heating and internaluse. In Figure 7, the annual electrical energy consumption is shown. The energy consumption in this samplebuilding for the base case is relatively high. The peak electrical demand for cooling is 43)5 Wm~2 of livingspace for middle floors and 60 Wm~2 for the roof floor, while the annual energy consumption is178)4 kWhm~2 for a middle floor and 220 kWhm~2 for a roof floor. The shown patterns of energyutilization of this sample building are typical to most residential buildings in Beirut. In commercial and officebuildings, the schedules and internal loads will be different.
3. PARAMETRIC ENERGY ANALYSIS
In this section, the impact of applying energy conservation measures on both the peak demand and annualenergy consumption is investigated. Many buildings of different floor areas and different orientations havebeen studied and analysed, but only three buildings are presented in detail, two of which are residentialbuildings (building A and building B) and the third is an office building (building C). Each of the buildings isanalysed for a base case of pre-conservation state with envelope construction and materials given in Table 1.The geometric specification of buildings B and C are given in Table 2. The building parameters that hadgreatest impact on energy use were those affecting the solar gain, wall conduction and lighting loads. Themeasures taken for energy conservation involve the use of massive walls, wall and roof insulation, the use ofdifferent glass type, reduction of glass area, changing of glass type and lighting type. Air-infilteration gains
526 N. GHADDAR AND A. BSAT
Int. J. Energy Res., 22, 523—546 (1998) ( 1998 John Wiley & Sons, Ltd.

Figure 4. Floor plan of residential building A
through cracks in window seals, air openning and exterior doors are not considered as one of the variable inthis study. It is assumed that all doors and windows of air-conditioned spaces are designed and constructedto minimize air leakage so as to reduce energy wastage. In new buildings in Lebanon, the practice has been
ENERGY CONSERVATION OF RESIDENTIAL BUILDINGS IN BEIRUT 527
( 1998 John Wiley & Sons, Ltd. Int. J. Energy Res., 22, 523—546 (1998)

Table 1. Input data on 11-storey building (A) of base-case pre-conservation system
Parameter Description
Floor height 9)644 ft"2)93 mArea/floor 3 units per floor of total area"1733 ft2#175 ft2#2057 ft2"5547 ft2"515)33 m2External wall area not 2628)278 ft2"244 m2
including glassRoof area 5547 ft2"515)33 m2Window area/floor 978 ft2"90)87 m2No. of windows and doors 23Wall construction 10 cm hollow concrete blocks with 1)5 cm mortar cement on both sidesFloor construction 20 cm thick concrete slab with 1)5 cm mortar cement, 3 cm sand aggregate and 2 cm thick
terrazzo tilesRoof construction 20 cm thick concrete slab with 1)5 cm mortar cement on the insideInterior walls 10 cm hollow concrete blocks with 1)5 cm mortar cement on both sidesGlass Float clear single-pane glass with 6 mm thickness and average conductanceLighting Incandescent lighting 1)5 W ft~2 (16 Watt m~2)No. of occupants/floor 4#6#4"14 persons
500 Btu per person. hour heat gainSystem 1. Packaged single-zone system/apartment
2. Heat pumpDesign temperature Design heating temperature"72°F
Design cooling temperature"76°FThermostat Two-position on/offInfiltration 0)66 air-changes h~1
Figure 5. Various components contribution to the peak cooling and heating loads
528 N. GHADDAR AND A. BSAT
Int. J. Energy Res., 22, 523—546 (1998) ( 1998 John Wiley & Sons, Ltd.

Figure 6. Monthly peak electrical loads for cooling, heating and internal use
actually to use aluminum-frame windows and doors that are very well sealed compared to wooden frames.The infiltration load in the summers of Beirut does not pose a serious problem because the temperaturedifference between indoor and outdoor conditions is generally just a few degrees and the human sense ofdiscomfort comes from the high humidity in the air. Another factor that undermines infiltration effect is thelow wind speed that dominates the summer weather unlike winter months.
Surveying the Lebanese market, the following materials are available for use in construction of buildings:(a) hollow concrete blocks in four standard thicknesses of 10 cm (base), 12, 15 and 20 cm, (b) single-pane glassin three standard types of clear float, heat absorbing and reflective glass all of 6 mm thickness, (c) Double-pane glass in three standard types of clear in but clear out, heat absorbing out or reflective out,(d) aluminium frames for single and double panes, (e) insulation materials including expanded polystyreneboards and rockwool insulation and finally (f ) incandescent bulbs, fluorescent bulbs, economic fluorescentbulbs. Table 3 gives a list of 41 different cases for detailed energy analysis on residential and office buildings.Single-effect cases are 31 cases where only one parameter is changed at a time including 22 combinations forwall layers, 2 different cases for the roof layers, 2 cases for lights type and 5 cases for the glass effect. Tenmultiple-effect cases are considered representing different combinations of various measures. The buildingsimulation model in DOE2)1E, which assumed that each apartment is a separate thermal zone, calculates thethermal loads in each apartment, sizes the AC equipment according to our specifications and calculates thepeak cooling load as well as the peak electrical demand and the electrical consumption of all electrical devicesand systems present in each unit of the studied building. The AC equipment is assumed to be on continuouslywhile the office building AC is operated only during working hours. The peak cooling load determines thecapacity of air-conditioning equipment while the peak electrical load corresponds to the maximum electricityused to drive the AC equipment and depends on equipment efficiency. The annual electrical energy
ENERGY CONSERVATION OF RESIDENTIAL BUILDINGS IN BEIRUT 529
( 1998 John Wiley & Sons, Ltd. Int. J. Energy Res., 22, 523—546 (1998)

Figure 7. Annual electrical energy consumption of building A
Table 2. The geometric specification of buildings B and C
Parameter Residential building B Office building C6 floors (3 units/floor) 8 floors (4 units/floor)
Floor height 9)842 ft"3 m 9)186 ft"2.8 mArea/floor 1158#1100)9#1051)5" 2281)78 ft2"211)98 m2
3310)4 ft2"307)658 m2External wall area/floor 2743 ft2"255 m2 1430 ft2"132)9 m2
excluding glassRoof area 3544 ft2"329 m2 2281)78 ft2"211)98 m2Window area 719 ft2"66)8 m2 325)42 ft2"30)23 m2No. of glass windows and doors 23 15Lighting Incandescent lighting Fluorescent lighting
1)5 W ft~2 (16 Wm~2)People 12System Packaged single-zone Packaged single-zone
system/unit system/unitHeat pump/unit Heat pump/unit
consumption is also calculated and is directly added to the building operating expenses. In DOE-2 analysis,the energy performance is typically done for the roof floor, a typical mid-floor and a ground floor. The resultsof the mid-floor are multiplied by the number of mid-floors in the building.
530 N. GHADDAR AND A. BSAT
Int. J. Energy Res., 22, 523—546 (1998) ( 1998 John Wiley & Sons, Ltd.
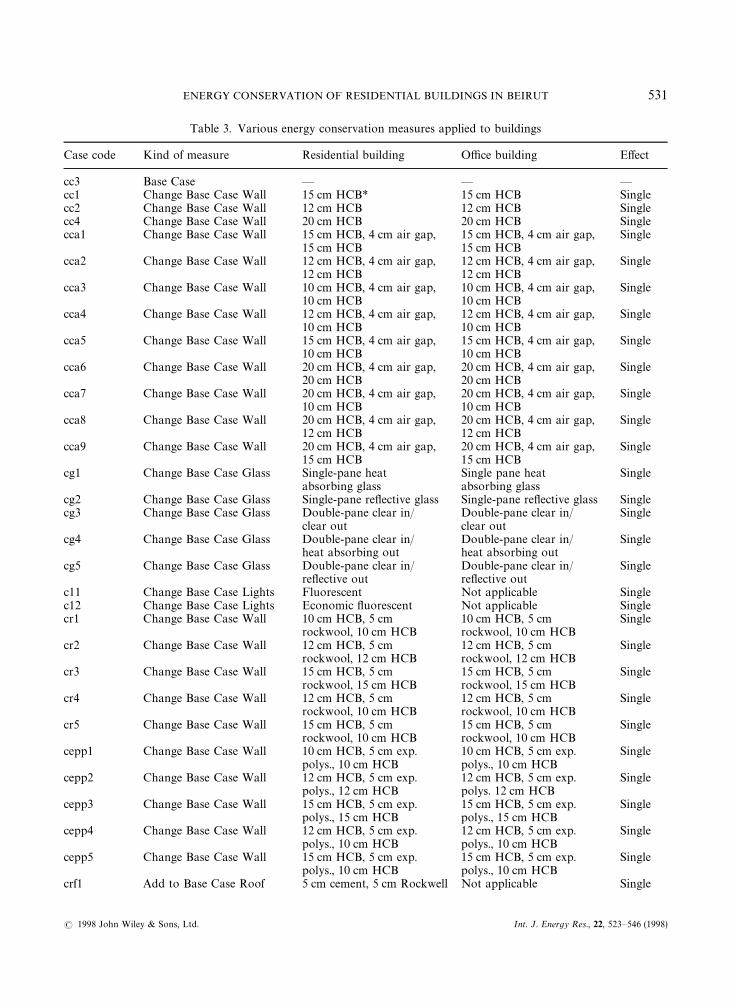
Table 3. Various energy conservation measures applied to buildings
Case code Kind of measure Residential building Office building Effect
cc3 Base Case — — —cc1 Change Base Case Wall 15 cm HCB* 15 cm HCB Singlecc2 Change Base Case Wall 12 cm HCB 12 cm HCB Singlecc4 Change Base Case Wall 20 cm HCB 20 cm HCB Singlecca1 Change Base Case Wall 15 cm HCB, 4 cm air gap, 15 cm HCB, 4 cm air gap, Single
15 cm HCB 15 cm HCBcca2 Change Base Case Wall 12 cm HCB, 4 cm air gap, 12 cm HCB, 4 cm air gap, Single
12 cm HCB 12 cm HCBcca3 Change Base Case Wall 10 cm HCB, 4 cm air gap, 10 cm HCB, 4 cm air gap, Single
10 cm HCB 10 cm HCBcca4 Change Base Case Wall 12 cm HCB, 4 cm air gap, 12 cm HCB, 4 cm air gap, Single
10 cm HCB 10 cm HCBcca5 Change Base Case Wall 15 cm HCB, 4 cm air gap, 15 cm HCB, 4 cm air gap, Single
10 cm HCB 10 cm HCBcca6 Change Base Case Wall 20 cm HCB, 4 cm air gap, 20 cm HCB, 4 cm air gap, Single
20 cm HCB 20 cm HCBcca7 Change Base Case Wall 20 cm HCB, 4 cm air gap, 20 cm HCB, 4 cm air gap, Single
10 cm HCB 10 cm HCBcca8 Change Base Case Wall 20 cm HCB, 4 cm air gap, 20 cm HCB, 4 cm air gap, Single
12 cm HCB 12 cm HCBcca9 Change Base Case Wall 20 cm HCB, 4 cm air gap, 20 cm HCB, 4 cm air gap, Single
15 cm HCB 15 cm HCBcg1 Change Base Case Glass Single-pane heat Single pane heat Single
absorbing glass absorbing glasscg2 Change Base Case Glass Single-pane reflective glass Single-pane reflective glass Singlecg3 Change Base Case Glass Double-pane clear in/ Double-pane clear in/ Single
clear out clear outcg4 Change Base Case Glass Double-pane clear in/ Double-pane clear in/ Single
heat absorbing out heat absorbing outcg5 Change Base Case Glass Double-pane clear in/ Double-pane clear in/ Single
reflective out reflective outc11 Change Base Case Lights Fluorescent Not applicable Singlec12 Change Base Case Lights Economic fluorescent Not applicable Singlecr1 Change Base Case Wall 10 cm HCB, 5 cm 10 cm HCB, 5 cm Single
rockwool, 10 cm HCB rockwool, 10 cm HCBcr2 Change Base Case Wall 12 cm HCB, 5 cm 12 cm HCB, 5 cm Single
rockwool, 12 cm HCB rockwool, 12 cm HCBcr3 Change Base Case Wall 15 cm HCB, 5 cm 15 cm HCB, 5 cm Single
rockwool, 15 cm HCB rockwool, 15 cm HCBcr4 Change Base Case Wall 12 cm HCB, 5 cm 12 cm HCB, 5 cm Single
rockwool, 10 cm HCB rockwool, 10 cm HCBcr5 Change Base Case Wall 15 cm HCB, 5 cm 15 cm HCB, 5 cm Single
rockwool, 10 cm HCB rockwool, 10 cm HCBcepp1 Change Base Case Wall 10 cm HCB, 5 cm exp. 10 cm HCB, 5 cm exp. Single
polys., 10 cm HCB polys., 10 cm HCBcepp2 Change Base Case Wall 12 cm HCB, 5 cm exp. 12 cm HCB, 5 cm exp. Single
polys., 12 cm HCB polys. 12 cm HCBcepp3 Change Base Case Wall 15 cm HCB, 5 cm exp. 15 cm HCB, 5 cm exp. Single
polys., 15 cm HCB polys., 15 cm HCBcepp4 Change Base Case Wall 12 cm HCB, 5 cm exp. 12 cm HCB, 5 cm exp. Single
polys., 10 cm HCB polys., 10 cm HCBcepp5 Change Base Case Wall 15 cm HCB, 5 cm exp. 15 cm HCB, 5 cm exp. Single
polys., 10 cm HCB polys., 10 cm HCBcrf1 Add to Base Case Roof 5 cm cement, 5 cm Rockwell Not applicable Single
ENERGY CONSERVATION OF RESIDENTIAL BUILDINGS IN BEIRUT 531
( 1998 John Wiley & Sons, Ltd. Int. J. Energy Res., 22, 523—546 (1998)

Table 3. Continued
Case code Kind of measure Residential building Office building Effect
crf2 Add to Base Case Roof 5 cm cement, 5 cm exp. polys. Not applicable Singlecm1 Multiple measure cc4#cg2#cl1 cc4#cg2 Multiplecm2 Multiple measure cca4#cg2#cl1 cca4#cg2 Multiplecm3 Multiple measure cr1#cg2#cl1 cr1#cg2 Multiplecm4 Multiple measure cepp1#cg2#cl1 cepp1#cg2 Multiplecm5 Multiple measure cc4#cg6#cl1 cc4#cg6 Multiplecm6 Multiple measure cca4#cg6#cl1 cca4#cg6 Multiplecm7 Multiple measure cr1#cg6#cl1 cr1#cg6 Multiplecm8 Multiple measure cepp1#cg6#cl1 cepp1#cg6 Multiplecm9 Multiple measure cm8#crf1 Not applicable Multiplecm10 Multiple measure cm8#crf21 Not applicable Multiple
*Hollow Concrete Block
Figure 8(a) shows the peak cooling loads per unit area of living space for each building type for single-effectmeasures and Figure 8(b) shows the peak cooling load with multiple-effect measures. The peak electrical loadfor each building type is shown in Figure 9(a) for single-effect measures and in Figure 9(b) for multiple-effectmeasures. The annual electrical energy consumption per unit area of living space for the various conservationmeasures of building A is shown for a mid-floor in Figure 10(a) and for a roof floor in Figure 10(b). Fromthese figures, it is clear that some measures are quite effective in reducing energy consumption over the basecase. The decrease in equipment size is not directly proportional to the decrease in cooling load, but reflectedsavings in total energy use are approximately 30—45%. The selection of best measures to use cannot be madefrom the shown data of electrical consumption alone. The optimization process is based on economicalgrounds and cost effectiveness analysis which is presented in the next section.
4. ECONOMIC ANALYSIS AND OPTIMIZATION
Applying energy conservation measures to a building is a capital investment. For a given measure to beappealing to the consumer, it must have a reasonable payback period to offset the initial investment.However, on the national level, benefits are maximized through reductions in installed electrical-generationcapacity. Through economical analysis, the best measures to apply can be determined on bases of thenational benefit as well as the consumer benefit. Many possible scenarios will be investigated to arrive atacceptable standards for energy use in buildings. The important variables used in the analysis are the initialcost of the investment, the initial customer savings in electrical installation charges, the initial customersavings due to reductions in AC capacity and the annual savings in electricity.
From the government point of view it is customary to define the so-called National Performance Index,NPI, representing the net present worth of any set of energy conservation measures (DOE, 1993). NPI isdefined as follows.
NPI ($)"Savings due to reduction in required generation capacity#Savings due to reductions in installed AC capacity!Investment cost in energy conservation measure#Present worth value of annual energy saving at the real cost of electricity generation over the
building lifetime (1)
The cost of generation capacity (i.e. generator price/generator capacity) is approximately $ 700 per kWinstalled. Then, by definition, the best set of measures is the one that maximizes NPI subject to the constraint
532 N. GHADDAR AND A. BSAT
Int. J. Energy Res., 22, 523—546 (1998) ( 1998 John Wiley & Sons, Ltd.

Figure 8(a). The resultant peak cooling loads per unit area of living space for each building type for the single-effect measures’ cases
EN
ER
GY
CO
NSE
RV
AT
ION
OF
RE
SID
EN
TIA
LB
UIL
DIN
GS
INB
EIR
UT
533
(1998
John
Wiley
&Sons,
Ltd
.Int.
J.E
nergyR
es.,22,523—
546(1998)

Figure 8(b). The resultant peak cooling loads per unit area of living space for each building type for the multiple-effect measures’ cases
that the consumer simple pay-back period is less than 5 yr. The consumer simple pay-back period iscalculated as follows:
Consumer SPBP"(A!B!C)/D (2)
where A is the cost of initial investment in conservation measures, B the initial consumer savings in electricalinstallation charges, C the initial consumer savings due to reductions in installed AC capacity and D theannual savings due to reduced electricity consumption at the consumer price. Another parameter that isdefined for the consumer is also the net present worth of the investment given by
NPW"#Savings due to reduction in installed electrical installation#Savings due to reduction in installed AC capacity!Investment cost in energy conservation measure#Present worth value of annual energy saving at consumer price over the building lifetime (3)
The set of measures that maximizes NPW will maximize the consumer benefits and it is usually defined as theCustomer Index. The difference between NPI and NPW is reflected in the difference between consumer priceof electricity and its cost. The Lebanese electricity pricing scheme is given in Table 4. Maximization of NP¼
does not necessarily maximize NPI for building units that consume more than 500 kwh yr~1.The cost of investment of conservation measures is obtained according to the Lebanese market prices for
materials and labour. The most complex calculations are for building Hollow Concrete Block walls anda model is postulated for the wall cost of investment in U.S. Dollar as follows:
COI)#"
"0)102068AW#210)87R
W!379)132 (4)
The coefficients for the above formulae are calculated using multi-variable least-squares method for variousbuildings and are found to vary slightly from one building to another. In effect those coefficients representsa statistical average of the coefficients over various buildings with a correlation coefficient between 0)95 and0)978 indicating how good the cost estimation is from the actual one.
534 N. GHADDAR AND A. BSAT
Int. J. Energy Res., 22, 523—546 (1998) ( 1998 John Wiley & Sons, Ltd.
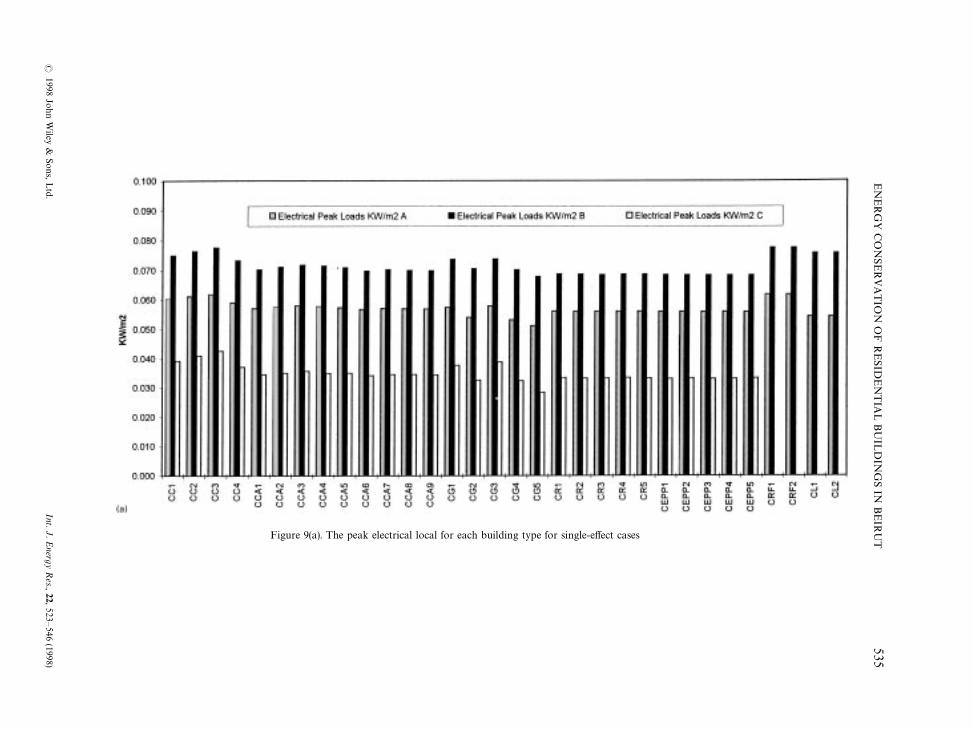
Figure 9(a). The peak electrical local for each building type for single-effect cases
EN
ER
GY
CO
NSE
RV
AT
ION
OF
RE
SID
EN
TIA
LB
UIL
DIN
GS
INB
EIR
UT
535
(1998
John
Wiley
&Sons,
Ltd
.Int.
J.E
nergyR
es.,22,523—
546(1998)

Figure 9(b). The peak electrical load for each building type for multiple-effect cases
After generating the DOE-2 simulations, the above-defined indices are calculated for buildings A, B andC under various single-effect conservation measures for wall, glass and lighting listed in Table 3. Then indicesfor combined measures (see Table 3) are calculated so that optimization can be obtained at the maximumNPI subject to the constraints that the simple payback period is less than five years.
4.1. Cost effectiveness results
For all buildings considered in the study, the building lifetime is taken as 20 yr, the interest rate for NPIcalculation is taken as 4%, the interest rate for NPW is 8% and the escalation rate of other costs is 1%.
4.1.1. Residential buildings. Figure 11a shows the national performance index per unit area of living space ofthe residential buildings A and B, NPI, for the various single-effect wall, glass and lighting measures. The bestwall measures for A and B are the cases of 10 cm double-layer wall of HCB with a middle layer of 5 cm ofexpanded polystyrene for A (case cepp3, R
W"11)4176 h ft2 °F/BTU.in), and double layer of 20 and 15 HCB
with 4 cm air gap for B (case cca9, RW"5 h ft2 °F/BTU.in). Those wall layers give an NPI index between 25
and 30 $ m~2. The single-pane reflective-coated glass is the measure that gives highest NPI reaching thevalue of about 40$ m~2. The lighting installation has the greatest effect on the annual energy savings withtheir NPI reaching values of 65 $m~2 when using economic fluorescents. Figure 11(b) shows the nationalperformance index per unit area of living space of residential buildings A and B for the multiple effectmeasures. The NPI of the multiple-effect measures is not the simple sum of each single effect of each measure.The NPI for residential buildings of the considered set of multiple-effect measures ranges from 120 to136 $m~2 corresponding to a maximum total NPI of $753 577 for building A and $241 281 for building B.
536 N. GHADDAR AND A. BSAT
Int. J. Energy Res., 22, 523—546 (1998) ( 1998 John Wiley & Sons, Ltd.

Figure 10. Annual electrical energy consumption per unit area of living space for the various conservation measure cases of (a)a mid-floor in building A; (b) the top floor in building A
ENERGY CONSERVATION OF RESIDENTIAL BUILDINGS IN BEIRUT 537
( 1998 John Wiley & Sons, Ltd. Int. J. Energy Res., 22, 523—546 (1998)

The measures for maximum NPI for both buildings were the same recommending the use of 10 or 12 cmdouble-layer wall of HCB with a middle layer of 5 cm of expanded polystyrene, fluorescent lighting andreflective single-pane glass (case cm4) and with roof slab having an additional 5 cm cement ad 5 cm ofexpanded polystyrene.
From the consumer side, the simple pay-back period and the net present worth need to be evaluated.Figure 12 shows the NPW per unit area of living space of all measured cases of Table 3 applied to buildingsA and B. The single-effect measures that maximize NPI for residential buildings are seen to be the same asthose which maximize the NPW unless the electricity consumption exceeds 500 kwh. For multiple-effectmeasures, the best case for maximum NPW is the same as NPI except that a double-pane clear glassin/reflective glass out is to be used also adding 5 cm insulation to the roof and 5 cm cement (case cm9). Thedifference in max NPI and NPW is about 1)09 $m~2 in investment cost to the consumer.
Table 4. Electricity pricing scheme
Margin Real cost of electricity production Consumer price(kwh) (cents kwh~1) (cents kwh~1)
1st 100 8 22nd 200 8 33rd 100 8 54th 100 8 7Above 500 8 12
Figure 11 (a). The national performance index per unit area of living space of the residential buildings A and B, NPI, for the varioussingle effect wall, glass and lighting measures
538 N. GHADDAR AND A. BSAT
Int. J. Energy Res., 22, 523—546 (1998) ( 1998 John Wiley & Sons, Ltd.

Figure 11(b). The national performance index per unit area of living space of residential buildings A and B for the multiple effectmeasures
The choice of best measures can be refined further by looking at the pay-back period of the giveninvestment. In Figure 13, the SPBP is plotted for the various cases of measures applied to buildings A and B.Some measures have a negative or zero pay-back period indicating that the cost of investment is totally offsetby the savings due to reduction in AC size and/or reduction in electrical installation. Those measures includethe cases of cca3, cca4, cca5, cg1, cg2, cm1 and cm2 (see Table 3). Measures with SPBP less than 1 yr are shortterm investments and their benefit is almost immediate (cases of cc4, cca1, cca7, cca8, cca9, c11, c12, cm3 and cm4).The remaining measures have a long term investment with SPBP(5 yr except for the case of double-paneclear in/clear out glass which has a pay-back period of about 10 yr. The optimal set of measures forresidential building for maximum NPI and/or NPW already satisfy the constraint of SPBP(5 yr.
In order to allow some compromise in the choice of wall materials for the customer, a sensitivity analysiscan be done to test the variations of NPI and NPW with respect to changes in R-values near optimalsolutions while having other measures fixed. Figure 14 shows the change of NPI and NPW per unit area ofliving space as the R-value of the wall is increased from the base case of R
W"1)278 (h ft2 °F/BTU.in) while
glass and lighting are kept at their optimal values for residential buildings. It is clear that the changes NPIand NPW are very sensitive to variations in R
Wfor R
W(9(hr ft2 °F/BTU.in) while for R
W'9 NPI and
NPW are slightly affected. So the customer has some freedom in choosing the wall material as long as it isclose to the optimal value. Sensitivities of glass type and lighting cannot be performed since those variablesare discrete and any changes in their type affects the indices significantly.
In residential buildings, as the number of floors increases, NPI is expected to increase as also seen in Figure15. However, the simple pay-back period remains the same, but the annual electricity consumption per unitarea decreases slightly for all the buildings. This is because the roof effect becomes less significant withincrease in the number of floors.
ENERGY CONSERVATION OF RESIDENTIAL BUILDINGS IN BEIRUT 539
( 1998 John Wiley & Sons, Ltd. Int. J. Energy Res., 22, 523—546 (1998)
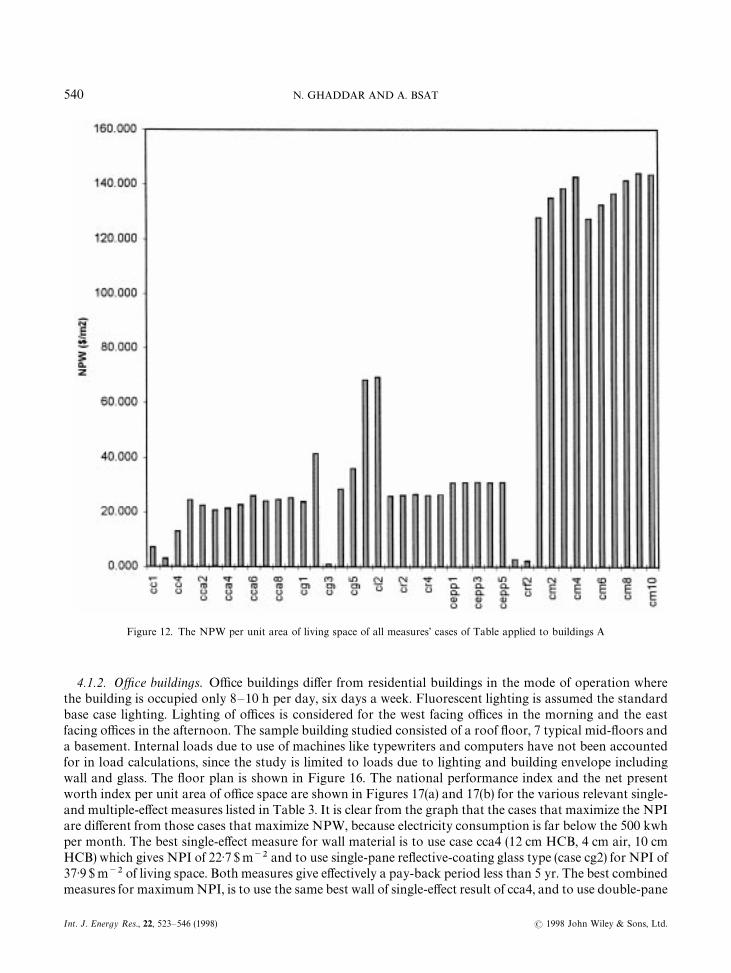
Figure 12. The NPW per unit area of living space of all measures’ cases of Table applied to buildings A
4.1.2. Office buildings. Office buildings differ from residential buildings in the mode of operation wherethe building is occupied only 8—10 h per day, six days a week. Fluorescent lighting is assumed the standardbase case lighting. Lighting of offices is considered for the west facing offices in the morning and the eastfacing offices in the afternoon. The sample building studied consisted of a roof floor, 7 typical mid-floors anda basement. Internal loads due to use of machines like typewriters and computers have not been accountedfor in load calculations, since the study is limited to loads due to lighting and building envelope includingwall and glass. The floor plan is shown in Figure 16. The national performance index and the net presentworth index per unit area of office space are shown in Figures 17(a) and 17(b) for the various relevant single-and multiple-effect measures listed in Table 3. It is clear from the graph that the cases that maximize the NPIare different from those cases that maximize NPW, because electricity consumption is far below the 500 kwhper month. The best single-effect measure for wall material is to use case cca4 (12 cm HCB, 4 cm air, 10 cmHCB) which gives NPI of 22)7 $m~2 and to use single-pane reflective-coating glass type (case cg2) for NPI of37)9$ m~2 of living space. Both measures give effectively a pay-back period less than 5 yr. The best combinedmeasures for maximum NPI, is to use the same best wall of single-effect result of cca4, and to use double-pane
540 N. GHADDAR AND A. BSAT
Int. J. Energy Res., 22, 523—546 (1998) ( 1998 John Wiley & Sons, Ltd.

Figure 13. The SPBP is plotted for the various cases of measures applied to (a) building A; (b) building B
reflective coated glass giving an NPI of 63)69 $ m~2 of living space. Figure 18 shows the simple pay-backperiod of all measures. The cases for zero or negative pay-back period are cc1, cc4, cca3, cca4, cca2, cca5, cg1,cg2, cm1 and cm2. The cases with less than 5 yr pay-back period are cc2, cca1, cca7, cca8, and cm4.
ENERGY CONSERVATION OF RESIDENTIAL BUILDINGS IN BEIRUT 541
( 1998 John Wiley & Sons, Ltd. Int. J. Energy Res., 22, 523—546 (1998)

Figure 14. The change of NPI and NPW per unit area of living space as the R-value of the wall is increased from the base case ofR
W"1)278 (hr ft2 °F/BTU.in) while glass and lighting are kept at their optimal values for residential buildings
5. ENERGY CODE-OF-PRACTICE
The objective of any code-of-practice is to establish standards which are easy to implement and enforce.Materials needed for any of the measures must be available in the local market to reduce the cost ofinvestment. The results of our analysis have indicated the following:
(a) There is a strong correlation between peak-load reductions and annual energy consumption. The twomost important measures are the use of insulation and massive walls and improved glazing systems.
(b) There is an indication that increasing the value of thermal insulation past 10 or 12 (hr ft2 °F/BTU.in)will only affect the net national benefits slightly.
The minimum acceptable configuration for residential building walls will be the cases of cc4, cca1, cca2,cca3, cca4, cca5, cca7, cca8 or cca9 of Table 3. The minimum acceptable configuration for glass is single-paneheat-absorbing glass or single-pane reflective glass particularly for south and southwest facing windows.Flourecent lighting should be used. In multiple-effect measures the minimum acceptable are the cases:(a) case cm1 of 20 cm HCB, flourecent lighting and single-pane reflective coating glass and (b) case cm2 of12 cm HCB, 4 cm air, 10 cm HCB, flourecent lighting and single-pane reflective-coating glass. For officebuildings also cases of cm1 and cm2 should be applied since that they have negative pay-back period.Actually, all measures having less than one year pay-back period should be used as the minimum acceptablemeasures regardless of the socio-economic class of the occupants. Noting also that the building constructionmust use well sealed windows and doors to minimize air-infiltration load. Optimal multiple measures shouldbe the ultimate goal. When the pay-back period is between 1 and 5 yr, the enforcement of energy measureswill be affected by the socio-economic status of the building occupants who may not be able to afford theimmediate cost of the investment. In those cases governmental loans may be a good solution to encouragethe long-term investment and maximize national and consumer benefits.
542 N. GHADDAR AND A. BSAT
Int. J. Energy Res., 22, 523—546 (1998) ( 1998 John Wiley & Sons, Ltd.

Figure 15. NPI of various measures applied to residential buildings for different number of floors
To give flexibility to building designers and insure proper enforcement, an upper ceiling should be set onthe peak cooling load, PCL, and the peak electrical consumption, PEL, per unit area of living space.According to our results on residential building for middle floors a value of 150—200 Btuh~1m~2 of livingspace can be set for the peak cooling load and a value of 25—30 Wm2 of living space can be set for the peakelectrical load for the AC. For top floor, the allowed values of PCL and PEL are 200—250 Btuh~1m~2 and30—35 wattm~2 of living space, respectively. Office buildings have maximum allowed values of PCL as150—180 Btuh~1m~2 for middle floor and 250—270 Btuh~1m~2 for a roof floor and the PEL as20—25 Wm~2 for middle floor and 35—40 Wm~2 for a roof floor. With these limits, the size of the permittedelectrical installation to the building is regulated to the set capacity of the code. Additional increase in thiscapacity should have a large surcharge on the building owner close to the cost of investment of some of theenergy measures.
A formula for calculations of the peak electrical load based on extensive simulations can be provided for allcontractors, designers and government enforcement agencies. The peak electrical demand for residentialbuildings is given by
PEL"PCL]C1#¸
S]C
2#¸
%]C
3#C
4(5)
where PEL is the peak electric load (kW), ¸Sis the Living space area in sqft, ¸
%is the kW sqft~1 used for
illumination, PCL is the peak cooling load, C1"0)135211, C
2"0)000674, C
3"0)818711 and C
4"2)764.
The coefficients of the model equation varied very slightly between different buildings. Actually such
ENERGY CONSERVATION OF RESIDENTIAL BUILDINGS IN BEIRUT 543
( 1998 John Wiley & Sons, Ltd. Int. J. Energy Res., 22, 523—546 (1998)

Figure 16. Plan of the office building C
544N
.GH
AD
DA
RA
ND
A.B
SA
T
Int.J.E
nergyR
es.,22,523—546
(1998)(
1998Jo
hn
Wiley
&Sons,L
td.

Figure 17. (a) The national performance index per unit area of office space for the various relevant single- and multiple-effect measureslisted in Table 3. (b) The net present worth index per unit area of office space for the various relevant single- and multiple-effect measures
listed in Table 3
formulae can help in rating the buildings such that when PEL per unit area exceeds a certain limit even in thedesign stage, a surcharge would be applied as an additional tax.
ENERGY CONSERVATION OF RESIDENTIAL BUILDINGS IN BEIRUT 545
( 1998 John Wiley & Sons, Ltd. Int. J. Energy Res., 22, 523—546 (1998)

Figue 18. The simple pay-back period of all measures for office building C
6. CONCLUSION AND RECOMMENDATIONS
Based on present market conditions in Lebanon, energy conservation deployment on a large scale can savethe country from the addition of large amounts of generating capacities and corresponding amounts ofair-conditioning devices. The key factor is the use of insulation and massive walls, better glazing and shading,fluorescent lighting and efficient AC systems. The recommended set of measures outlined in this paper arenot based merely on absolute energy savings, but are based on an economic analysis that optimizes thegovernmental, consumer and national benefits. Also, the environmental impact of the measures will be veryimportant due to reduced generation capacity (less sulphur and carbon oxides emissions) and less use ofenergy reduces also the use of certain refrigerants that are harmful to the ozone layer. Other types ofbuildings like hospitals, schools, shopping centres and public buildings can be included in future studies.
Another important aspect of conservation measures in buildings is related to strict specifications onperformance of AC/heating systems to be used and their power rating. A comparative study aiming towardsrecommending best alternatives of system installations in different types of buildings so that a complementaryefficiency code can be developed. Future work should address the problem of the effect of insulating pipingsystems. AC ducts, replacing old equipment by higher-efficiency models and the use of heat-recovery systems.
ACKNOWLEDGEMENTS
This work was supported by the Lebanese National Research Council For Scientific Research. The authoralso wishes to acknowledge the help of Mr Mohamed Shihab in preparing the figures.
REFERENCES
EDL (1974). Electricite De Liban, Annual report.DOE (1993). DOE-2 Reference Manual, Parts 1 and 2 (version 2.1E) U.S. Department of Commerce, National Technical information Service.Debs A. S., ‘Energy conservation in Kuwaiti buildings’, KFAS Proc. Int. Symp. on Energy Conservation Measures, Kuwait. (1983).
546 N. GHADDAR AND A. BSAT
Int. J. Energy Res., 22, 523—546 (1998) ( 1998 John Wiley & Sons, Ltd.