ENERGY 2008 AnalystAnalyst ReviewReview
40
The following discussions contain certain “forward‐looking statements” as defined by the Private Securities Litigation Reform Act of 1995 including, without limitation, estimates, expectations, plans and goals regarding Apache’s production, reserves, financings, acquisitions, exploration and exploitation prospects, energy prices, operating costs, and results of operations. Such forward‐looking statements involve estimates, assumptions and uncertainties. No assurance can be given that Apache’s expectations or goals will be realized, and actual results may differ materially from those expressed in the forward‐looking statements. For reconciliations of non‐GAAP financial measures, see our web site www.apachecorp.com. ENERGY ENERGY 2008 Analyst Review 2008 Analyst Review Tim Wall Regional VP Australia Tim Wall Regional VP Australia
Transcript of ENERGY 2008 AnalystAnalyst ReviewReview

The following discussions contain certain “forward‐looking statements” as defined by the Private Securities Litigation Reform Act of 1995 including, without limitation, estimates, expectations, plans and goals regarding Apache’s production, reserves, financings, acquisitions, exploration and exploitation prospects, energy prices, operating costs, and results of operations. Such forward‐looking statements involve estimates, assumptions and uncertainties. No assurance can be given that Apache’s expectations or goals will be realized, and actual results may differ materially from those expressed in the forward‐looking statements. For reconciliations of non‐GAAP financial measures, see our web site www.apachecorp.com.
ENERGYENERGY
2008 Analyst Review2008 Analyst Review
Tim WallRegional VP Australia
Tim WallRegional VP Australia
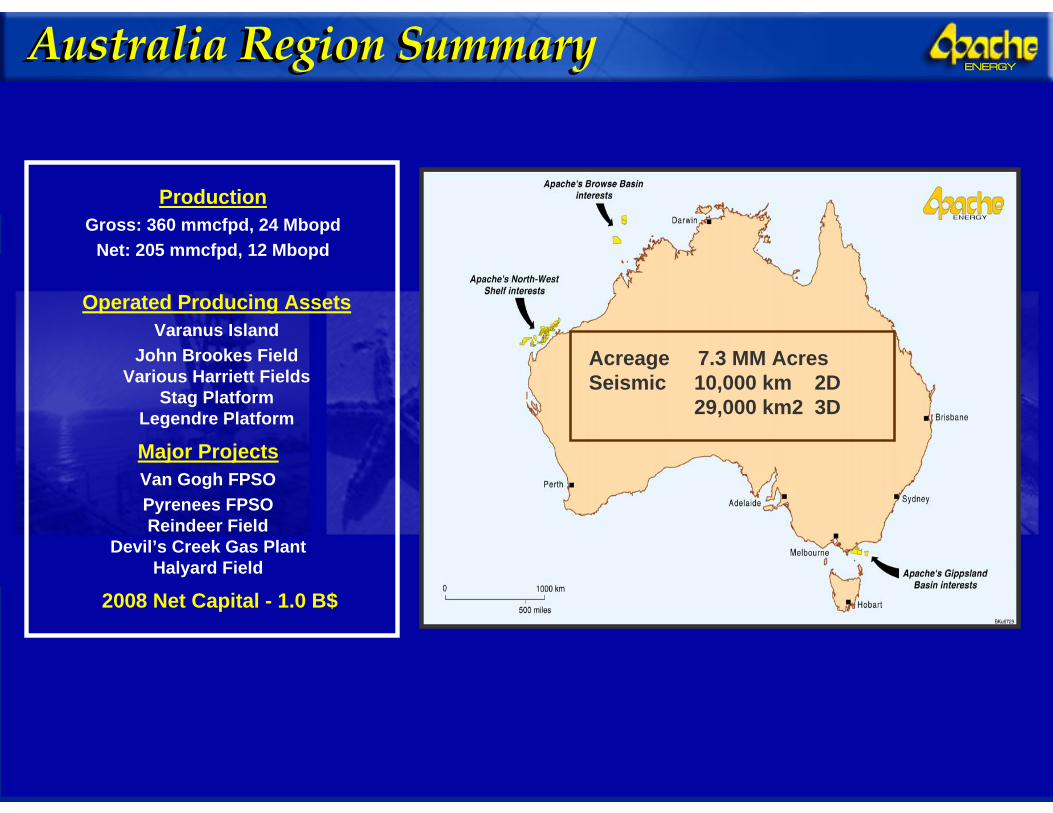
ENERGYENERGYAustralia Region SummaryAustralia Region Summary
Acreage 7.3 MM AcresSeismic 10,000 km 2D
29,000 km2 3D
ProductionGross: 360 mmcfpd, 24 Mbopd
Net: 205 mmcfpd, 12 Mbopd
2008 Net Capital - 1.0 B$
Operated Producing AssetsVaranus Island
John Brookes FieldVarious Harriett Fields
Stag PlatformLegendre Platform
Major ProjectsVan Gogh FPSOPyrenees FPSOReindeer Field
Devil’s Creek Gas PlantHalyard Field

ENERGYENERGYWell Positioned Acreage InventoryWell Positioned Acreage Inventory
Gippsland Basin - Vic/P 59
Browse Basin – AC/P 37, 42,43Dampier & Barrow Basins1.15 MM acres Gross
1.90 MM acres Gross1.5 MM acres Gross
2.75 MM acres Gross
Exmouth Basin
ENERGYENERGYOperating PhilosophyOperating Philosophy
Project Execution - Deliver Current Projects at Cost and on Schedule
High Impact Exploration - Continue with an Aggressive, High-Reserve-Potential
Exploration ProgramProject Development
- Maintain a Significant Project InventoryBuild Domestic Gas Market Position
- Continue Contracting into Strong Domestic Western Australia Gas Market

ENERGYENERGYWA Gas Market UpdateWA Gas Market Update
Western Australia’s Gas Demand - Concentrated in mining, power-generation and
alumina sectorsStrong Growth Forecast for the Mining and Power Sectors
- Power-generation capacity requirements increasing from 2011
- New mining projects and expansions scheduled for 2010-11 onward
Significant Un-Contracted Demand - Forecast to be 7-8 Tcf through 2030
Strong Gas Prices- Prices have risen substantially over the past
12-18 months
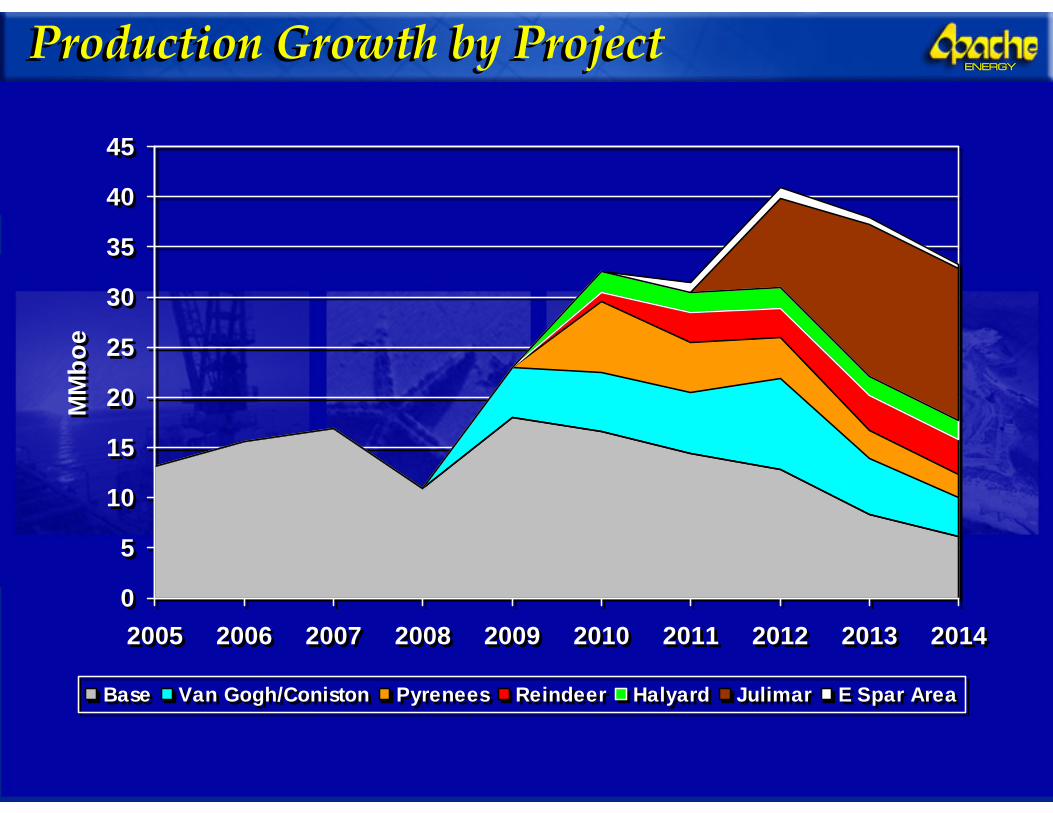
ENERGYENERGYProduction Growth by ProjectProduction Growth by Project
0
5
10
15
20
25
30
35
40
45
2005 2006 2007 2008 2009 2010 2011 2012 2013 2014
MM
boe
Base Van Gogh/Coniston Pyrenees Reindeer Halyard Julimar E Spar Area
0
5
10
15
20
25
30
35
40
45
2005 2006 2007 2008 2009 2010 2011 2012 2013 2014
MM
boe
Base Van Gogh/Coniston Pyrenees Reindeer Halyard Julimar E Spar Area

ENERGYENERGYInvesting for the FutureInvesting for the Future
319 341 307 331 313434
1,055
531
187249
1761330
500
1,000
1,500
2003 2004 2005 2006 2007 2008(E)
$MM
LLICapital
Lease Level Income vs CapexLease Level Income vs Capex
Note: Lease level income = revenue - operating expense – transportation expense - severance taxes

ENERGYENERGYVaranus UpdateVaranus Update
June 3, 2008- Explosion at Varanus Island Facility NW Australia shut down production
from the facility (320 mmcfpd, 8,000 bopd)- Both sales-gas export lines and facilities were damaged
August 6, 2008- John Brookes facility and 16” sales-gas export line re-instated- 2/3 of pre-incident production back online (220 mmcfpd, 2,300 bopd)
October 15, 2008- Harriett Alpha line re-instated to tanks. Increasing oil production by
1,400 bopd.November, 2008
- Harriet Facilities Train 3 back online- Plant back at full pre-incident rates. (320 mmcfpd, 8,000 bopd)
January, 2009- Full plant re-instated.
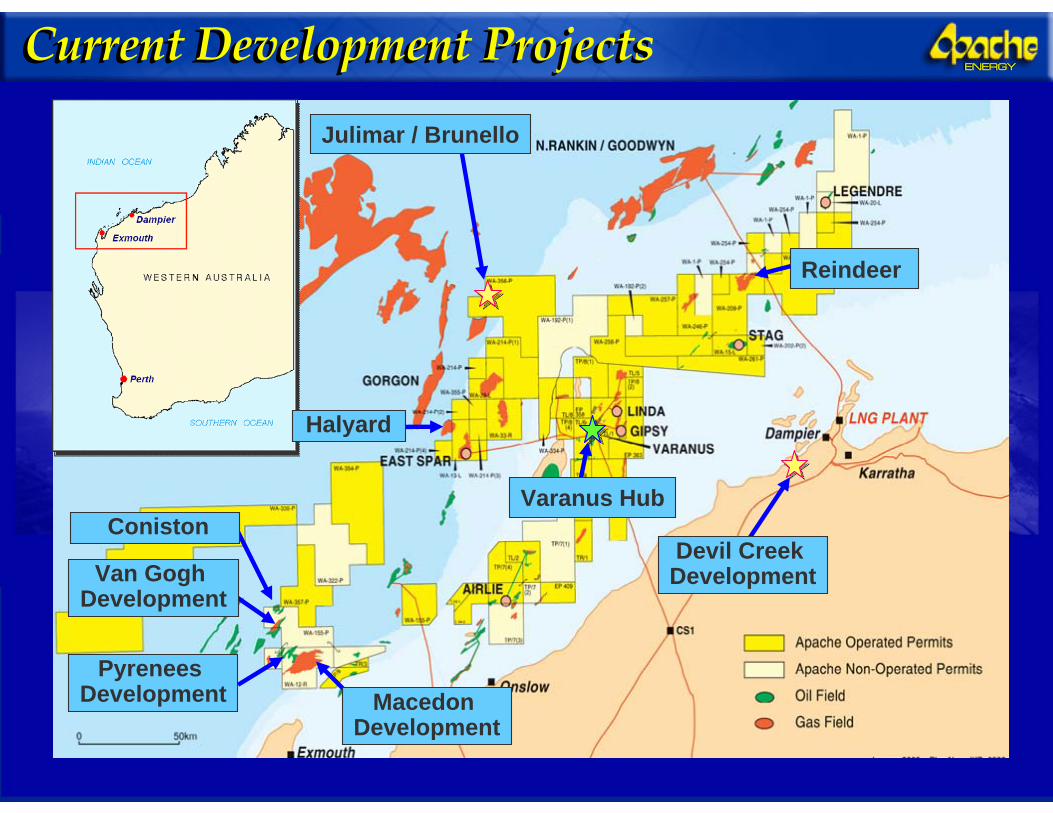
ENERGYENERGYCurrent Development ProjectsCurrent Development Projects
Pyrenees Development
Reindeer
Devil Creek Development
Varanus Hub
Julimar / Brunello
Halyard
Macedon Development
Van Gogh Development
Coniston

ENERGYENERGYDevelopment Project TimetableDevelopment Project Timetable

ENERGYENERGY
First Oil Target = Q2 2009Overall Progress = 85%Apache = 52.5% Inpex = 47.5%P50 Reserves = 59 MMbblsPeak Rate = 63,000 bopdCapital Cost = $546 MMRate of Return = 56%
First Oil Target = Q2 2009Overall Progress = 85%Apache = 52.5% Inpex = 47.5%P50 Reserves = 59 MMbblsPeak Rate = 63,000 bopdCapital Cost = $546 MMRate of Return = 56%
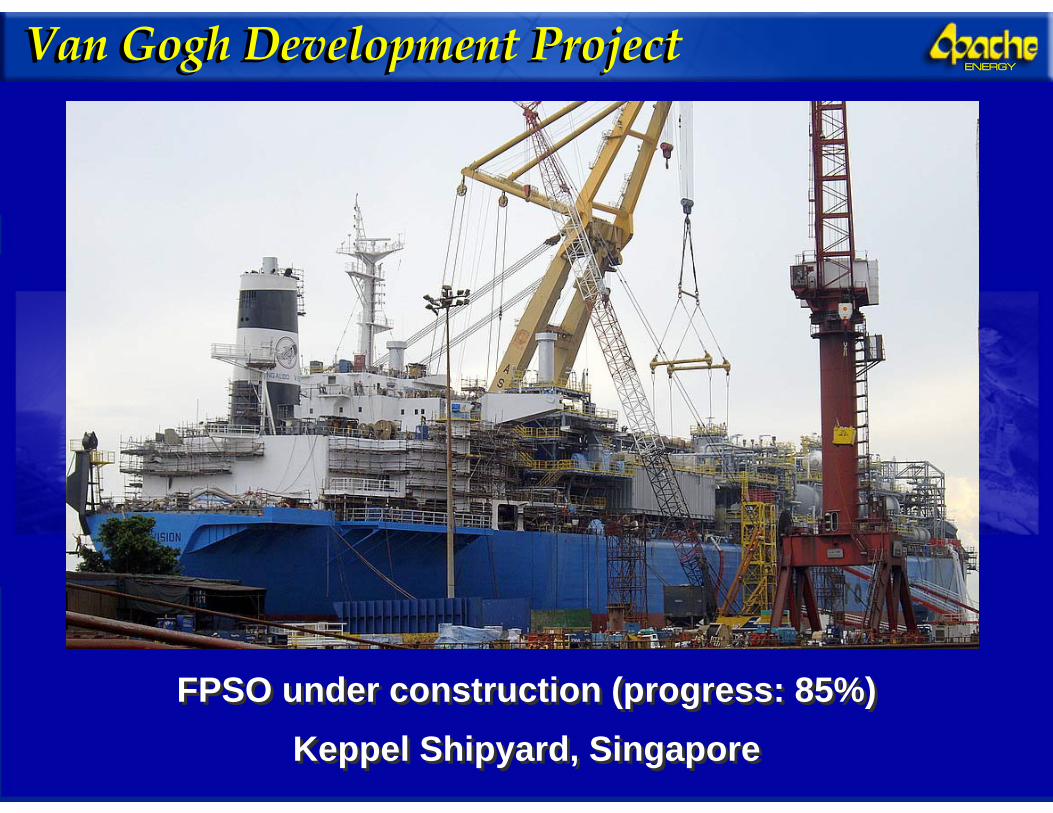
Van Gogh Development ProjectVan Gogh Development Project
ENERGYENERGYVan Gogh Development ProjectVan Gogh Development Project
FPSO under construction (progress: 85%) Keppel Shipyard, Singapore
FPSO under construction (progress: 85%) Keppel Shipyard, Singapore
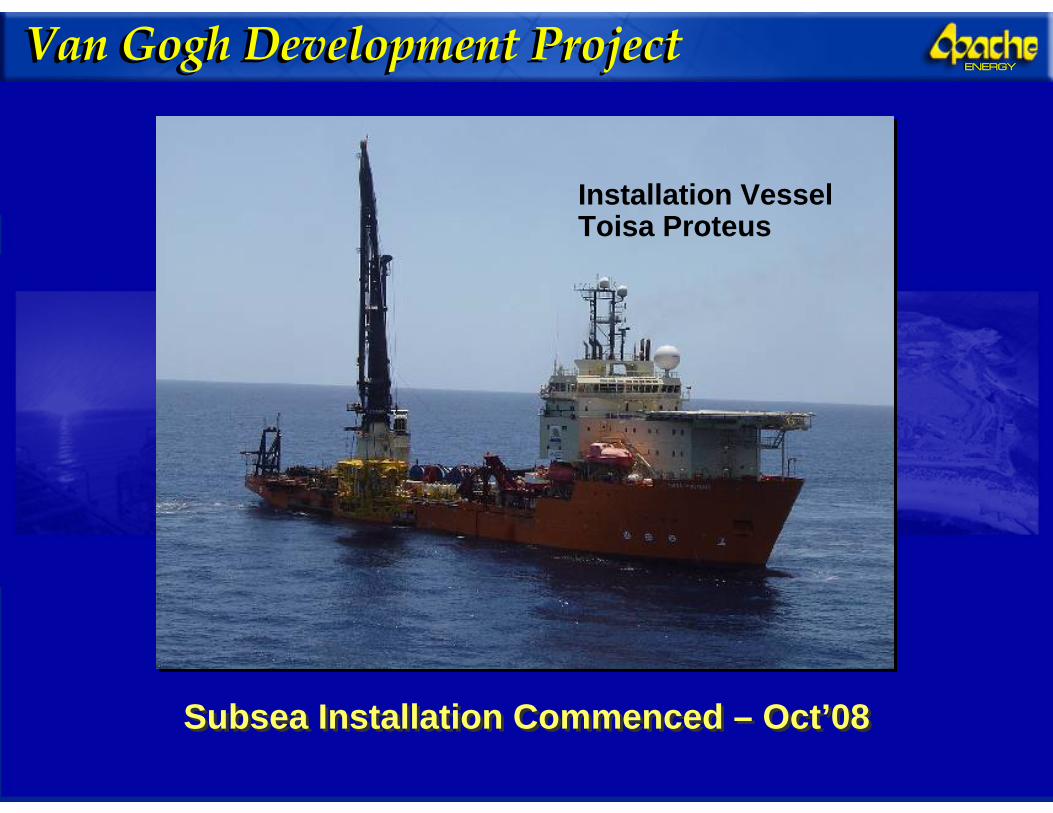
ENERGYENERGYVan Gogh Development ProjectVan Gogh Development Project
Subsea Installation Commenced – Oct’08Subsea Installation Commenced – Oct’08
Installation Vessel Toisa Proteus
ENERGYENERGY
-130
5-1
275
-1285-1280
-1255
-1260
-1250
CONISTON-1
Derwent-1 050208
Derwent-1H 050208
Windermere-1H
Grasmere-1H 240608
CRUMMOCK-1 (P)
NOVARA-1
GOC
GOC
GOC
GO
C
GOC
GOC
GOC
GOC
GO
C
GOCGOC
GOC
GOC
OWC
OWC
OW
C
OWCO
WC
OW
C
OWC
OWC
OWC
OWC
OWC
OWC
OWC
OWC
OWC
0 500 1000 1500 2000m
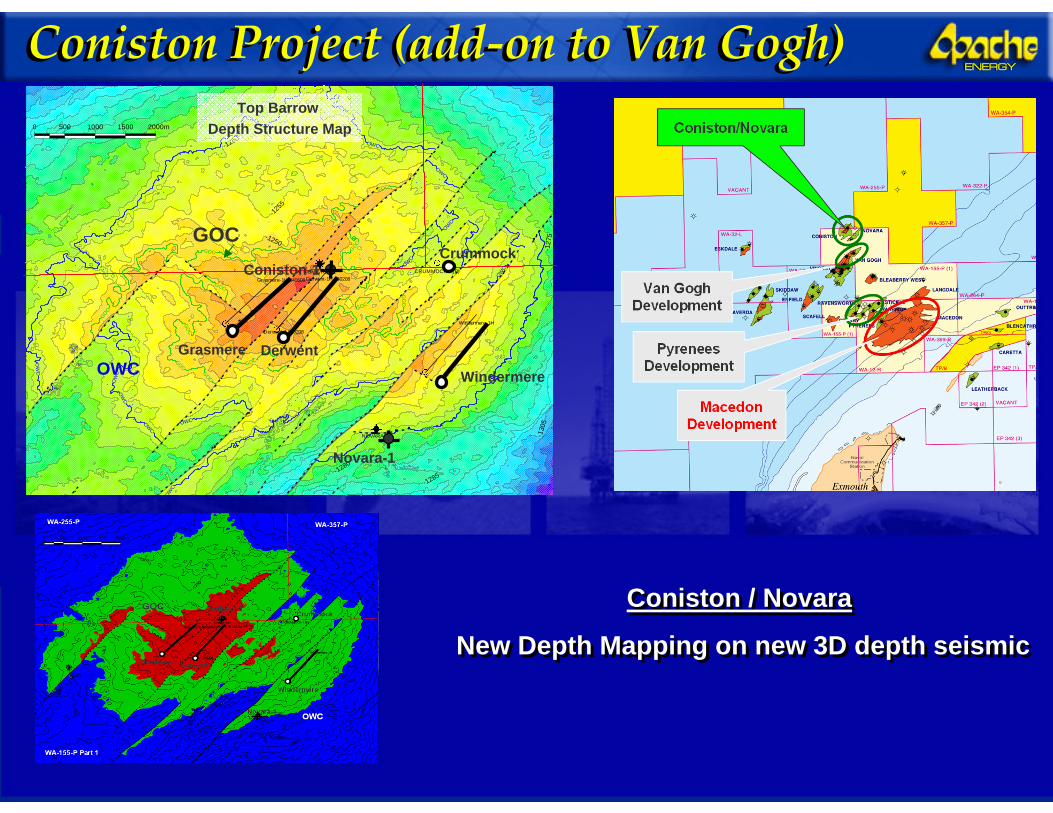
Coniston Project (add‐on to Van Gogh)Coniston Project (add‐on to Van Gogh)Top Barrow
Depth Structure Map
Coniston / Novara
New Depth Mapping on new 3D depth seismic
Coniston / Novara
New Depth Mapping on new 3D depth seismic
GOC
OWC Windermere
DerwentGrasmere
Coniston-1
Novara-1
Crummock
ENERGYENERGY
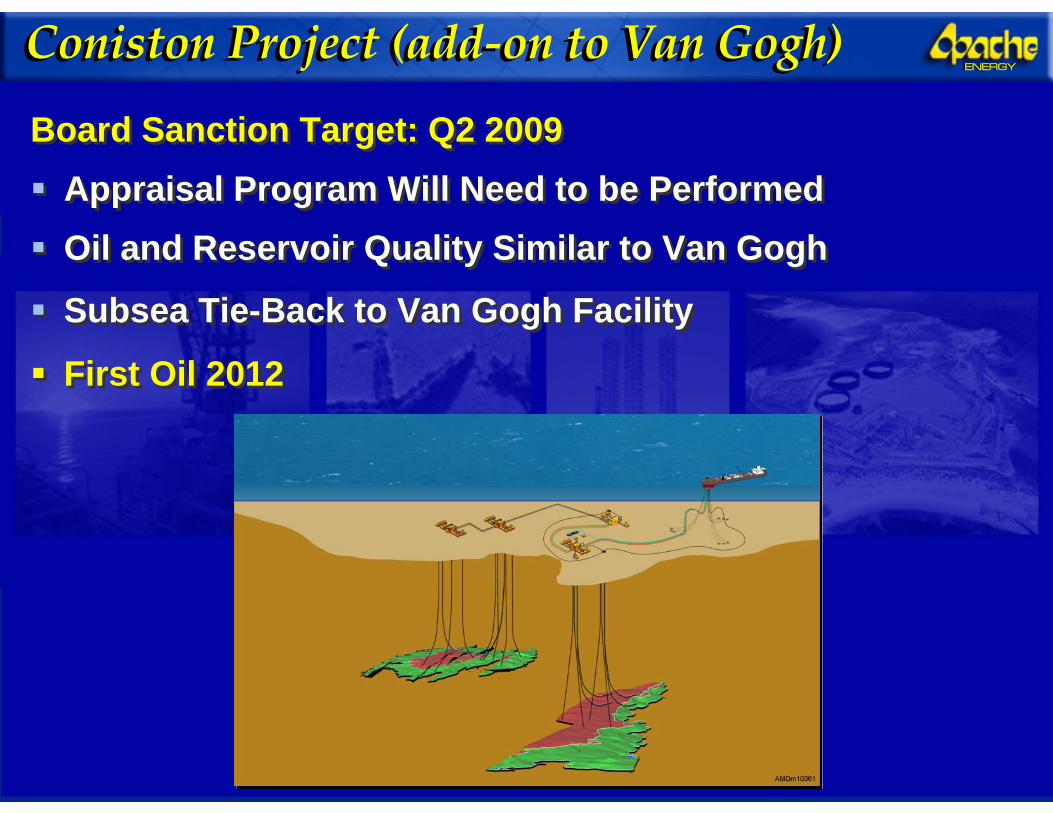
Board Sanction Target: Q2 2009Appraisal Program Will Need to be PerformedOil and Reservoir Quality Similar to Van Gogh
Subsea Tie-Back to Van Gogh Facility
First Oil 2012
Board Sanction Target: Q2 2009Appraisal Program Will Need to be PerformedOil and Reservoir Quality Similar to Van Gogh
Subsea Tie-Back to Van Gogh Facility
First Oil 2012
Coniston Project (add‐on to Van Gogh)Coniston Project (add‐on to Van Gogh)
ENERGYENERGY
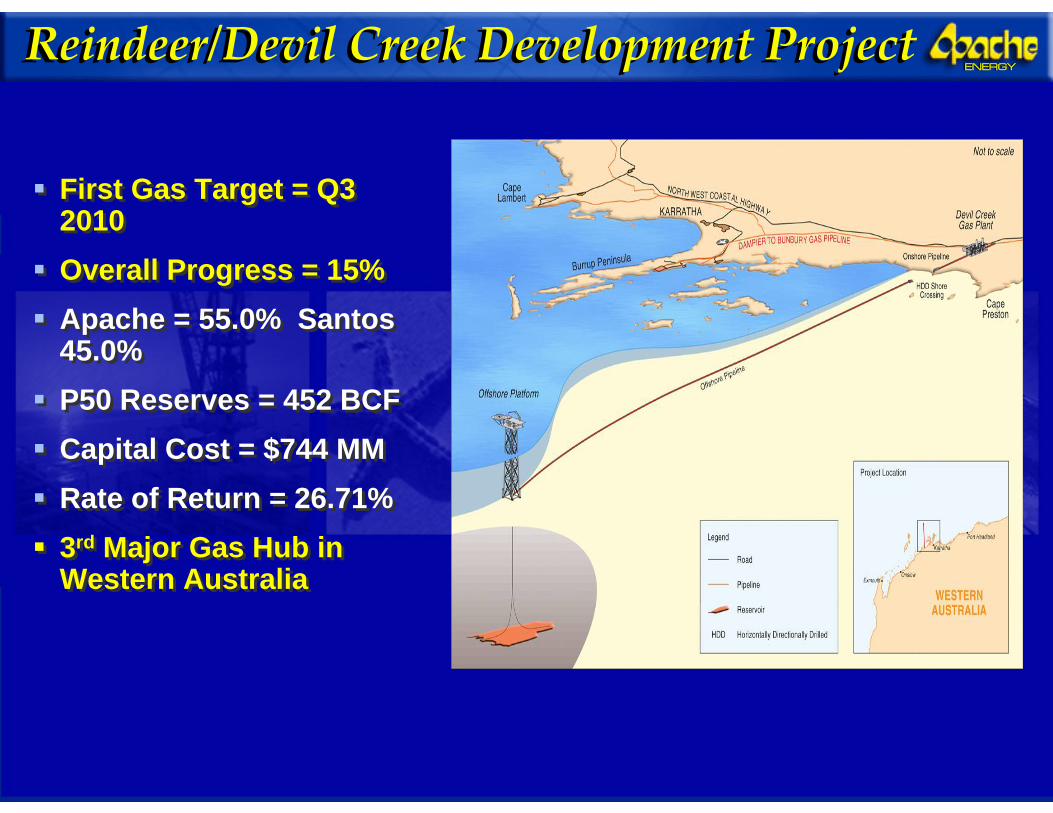
First Gas Target = Q3 2010Overall Progress = 15% Apache = 55.0% Santos 45.0%P50 Reserves = 452 BCFCapital Cost = $744 MMRate of Return = 26.71%3rd Major Gas Hub inWestern Australia
First Gas Target = Q3 2010Overall Progress = 15% Apache = 55.0% Santos 45.0%P50 Reserves = 452 BCFCapital Cost = $744 MMRate of Return = 26.71%3rd Major Gas Hub inWestern Australia
Reindeer/Devil Creek Development ProjectReindeer/Devil Creek Development Project

ENERGYENERGYReindeer/Devil Creek Development ProjectReindeer/Devil Creek Development Project
Reindeer Platform (Model)Reindeer Platform (Model)
Devil Creek Plant – Establishment of Accommodation Village
Devil Creek Plant – Establishment of Accommodation Village
ENERGYENERGYHalyard Development ProjectHalyard Development Project
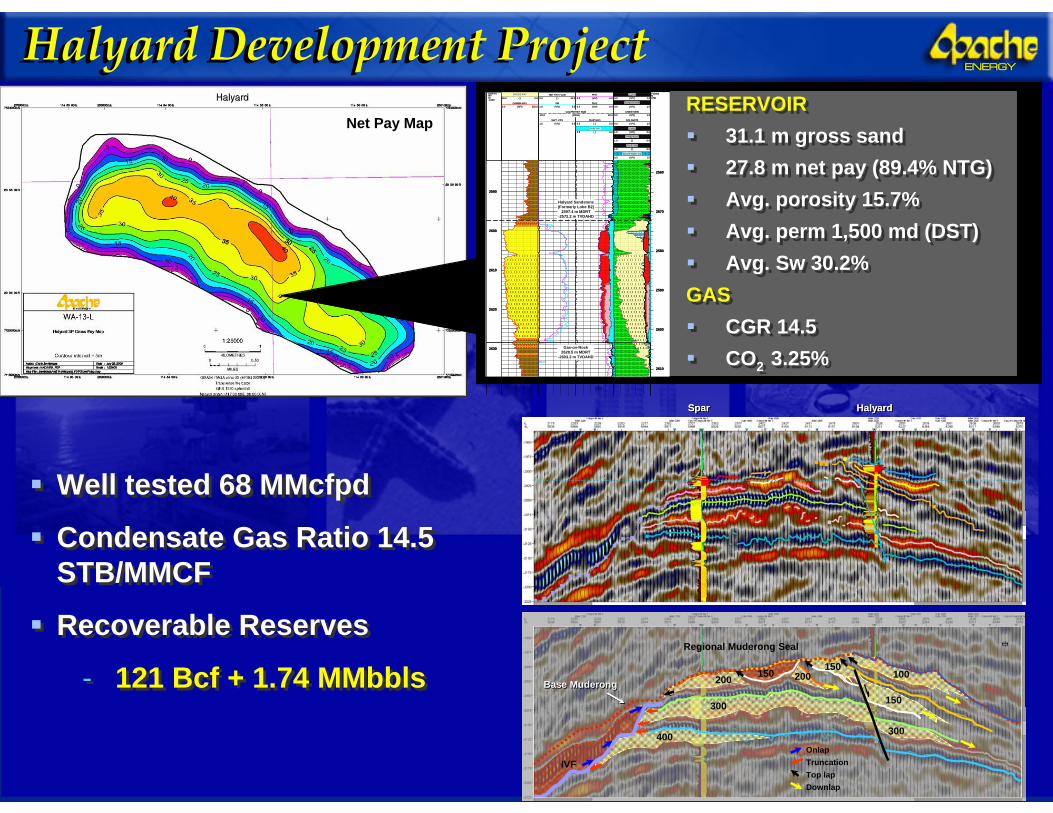
RESERVOIR31.1 m gross sand27.8 m net pay (89.4% NTG)Avg. porosity 15.7%Avg. perm 1,500 md (DST)Avg. Sw 30.2%
GASCGR 14.5 CO2 3.25%
RESERVOIR31.1 m gross sand27.8 m net pay (89.4% NTG)Avg. porosity 15.7%Avg. perm 1,500 md (DST)Avg. Sw 30.2%
GASCGR 14.5 CO2 3.25%
GROSS PAY( )30.0 0.0
GAMMA RAY(API)0.0 250.0
NET PAY FLAG( )0.0 30.0
SW(V/V)1.0 0.0
CALIPER-BIT SIZE(INCH)-20.0 20.0
SWT -CPX(V/V)1.0 0.0
PHIT(V/V)0.5 0.0
PHIE(V/V)0.5 0.0
PHIE*SXO( )0.5 0.0
PHIE*SW( )0.5 0.0
CLAY(V/V)0.0 1.0
SANDSTONE(V/V)0.0 1.0
LIMESTONE(V/V)0.0 1.0
DOLOMITE(V/V)0.0 1.0
PHIE(V/V)1.0 0.0
PHIE*SXO( )1.0 0.0
PHIE*SW( )1.0 0.0
Bound Water Vol(V/V)0.0 1.0
DEPTHRTM1:200
TVDSSMAHD
2590
2600
2610
2620
2630
2560
2570
2580
2590
2600
2610
Halyard Sandstone(Formerly Lobe B2)
2597.4 m MDRT-2572.2 m TVDAHD
Gas-on-Rock2628.5 m MDRT
-2603.3 m TVDAHD
Net Pay Map
Well tested 68 MMcfpd
Condensate Gas Ratio 14.5 STB/MMCF
Recoverable Reserves
- 121 Bcf + 1.74 MMbbls
Well tested 68 MMcfpd
Condensate Gas Ratio 14.5 STB/MMCF
Recoverable Reserves
- 121 Bcf + 1.74 MMbblsRegional Muderong Seal
300
200 200150150
150
300
IVF
400
100
OnlapTruncationTop lapDownlap
Base MuderongBase Muderong
SparSpar HalyardHalyard
Regional Muderong Seal
300
200 200150150
150
300
IVF
400
100
OnlapTruncationTop lapDownlap
Base MuderongBase Muderong
SparSpar HalyardHalyard
ENERGYENERGYHalyard Development ProjectHalyard Development Project
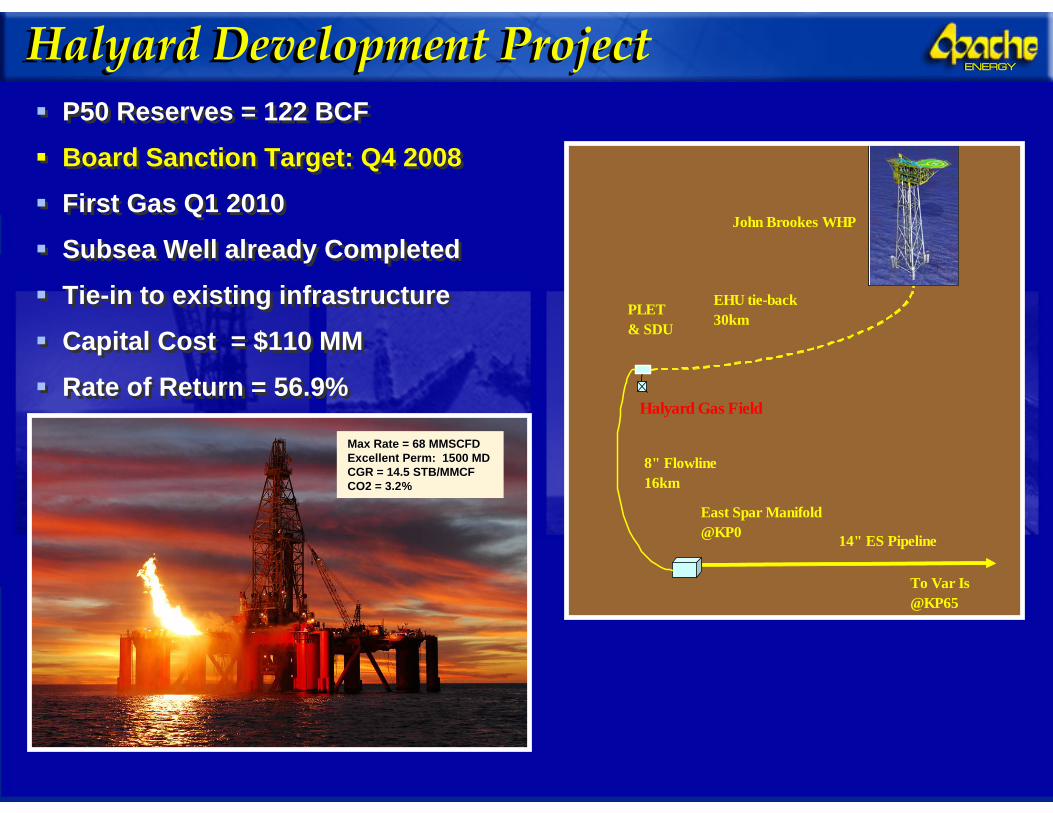
P50 Reserves = 122 BCF
Board Sanction Target: Q4 2008
First Gas Q1 2010
Subsea Well already Completed
Tie-in to existing infrastructure
Capital Cost = $110 MM
Rate of Return = 56.9%
P50 Reserves = 122 BCF
Board Sanction Target: Q4 2008
First Gas Q1 2010
Subsea Well already Completed
Tie-in to existing infrastructure
Capital Cost = $110 MM
Rate of Return = 56.9%
Max Rate = 68 MMSCFDMax Rate = 68 MMSCFDExcellent Perm: 1500 MDExcellent Perm: 1500 MDCGR = 14.5 STB/MMCF CGR = 14.5 STB/MMCF CO2 = 3.2%CO2 = 3.2%
East Spar Manifold@KP0 14" ES Pipeline
EHU tie-back30km
8" Flowline16km
To Var Is@KP65
Halyard Gas Field
PLET& SDU
John Brookes WHP

ENERGYENERGYJulimar/ Brunello Development ProjectJulimar/ Brunello Development Project
Board Sanction Target: Q2 2009
Pre-FEED design work complete for development options
- LNG: sub-sea tie-back to a riser platform
- Full domestic gas production: via Devil Creek
Board Sanction Target: Q2 2009
Pre-FEED design work complete for development options
- LNG: sub-sea tie-back to a riser platform
- Full domestic gas production: via Devil Creek
First Gas 2012 – 13200 – 400 MMcfpd
First Gas 2012 – 13200 – 400 MMcfpd
LNG Dom GasLNG

ENERGYENERGYJulimar –Brunello Development ProjectJulimar –Brunello Development Project
Gas well
2009 Brunello Location2009 Julimar Location
Dry well
Brokenwood
Balnaves
CurrentReserve Estimate
2 - 4 TCF

ENERGYENERGYJulimar Appraisal: Brokenwood‐1 (P) / ST1Julimar Appraisal: Brokenwood‐1 (P) / ST1
B9 Sand B9 Gas B8 Sand B8 Gas
OHST
B9B9
B8B8
G40G40
Brokenwood-1/B9Brokenwood-1/B9 Brokenwood-1/B8Brokenwood-1/B8GrothGroth
ApacheApacheOperatorOperator65%65%Apache %Apache %
~3104 to ~3104 to 3152 m3152 m
Depth to Depth to ObjectiveObjective
~140m~140mWater Water DepthDepth
Crestal well on the B9 followed by sidetrack Crestal well on the B9 followed by sidetrack downdipdowndip on B8 and B9on B8 and B9
Play Play Concept :Concept :
Exploration Exploration / Appraisal/ Appraisal
Well typeWell typeWAWA--356356--PPPermitPermit
296 Bcf296 BcfHigh confidence in the B8/B9 High confidence in the B8/B9
amplitude and inferences from the amplitude and inferences from the regional water gradientregional water gradient
Best Best EstimateEstimate

ENERGYENERGYJulimar Appraisal: Balnaves‐1 (P)Julimar Appraisal: Balnaves‐1 (P)
B20 Sand B20 Gas B10 Sand B10 Gas
1 km
B10B10
B20B20
ApacheApacheOperatorOperator65%65%Apache %Apache %
3229 m3229 mDepth to Depth to ObjectiveObjective
139m139mWater Water DepthDepth
Crestal well on the B20 followed by sidetrack Crestal well on the B20 followed by sidetrack downdipdowndip on the B10 and the B20on the B10 and the B20
Play Play Concept :Concept :
Exploration Exploration / Appraisal/ Appraisal
Well typeWell typeWAWA--356356--PPPermitPermit
281 Bcf281 BcfHigh confidence in the B10 High confidence in the B10
amplitude and inferences from amplitude and inferences from the regional water gradientthe regional water gradient
Best Best EstimateEstimate

ENERGYENERGY
First Oil Target = Q1 2010
Overall Progress = 40%
Apache = 29.0% BHP Billiton (Operator) 71%
P50 Reserves = 143 MMbbls
Peak Rate = 90,000 bopd
Capital Cost = $1.86 B
ROR = 20.2%
First Oil Target = Q1 2010
Overall Progress = 40%
Apache = 29.0% BHP Billiton (Operator) 71%
P50 Reserves = 143 MMbbls
Peak Rate = 90,000 bopd
Capital Cost = $1.86 B
ROR = 20.2%
Pyrenees Development ProjectPyrenees Development Project

ENERGYENERGYPyrenees Development ProjectPyrenees Development Project
FPSO in Dry Dock - Dalian China (Modec)FPSO in Dry Dock - Dalian China (Modec)
The following discussions contain certain “forward‐looking statements” as defined by the Private Securities Litigation Reform Act of 1995 including, without limitation, estimates, expectations, plans and goals regarding Apache’s production, reserves, financings, acquisitions, exploration and exploitation prospects, energy prices, operating costs, and results of operations. Such forward‐looking statements involve estimates, assumptions and uncertainties. No assurance can be given that Apache’s expectations or goals will be realized, and actual results may differ materially from those expressed in the forward‐looking statements. For reconciliations of non‐GAAP financial measures, see our web site www.apachecorp.com.
ENERGYENERGY
ExplorationExploration
October 2008October 2008
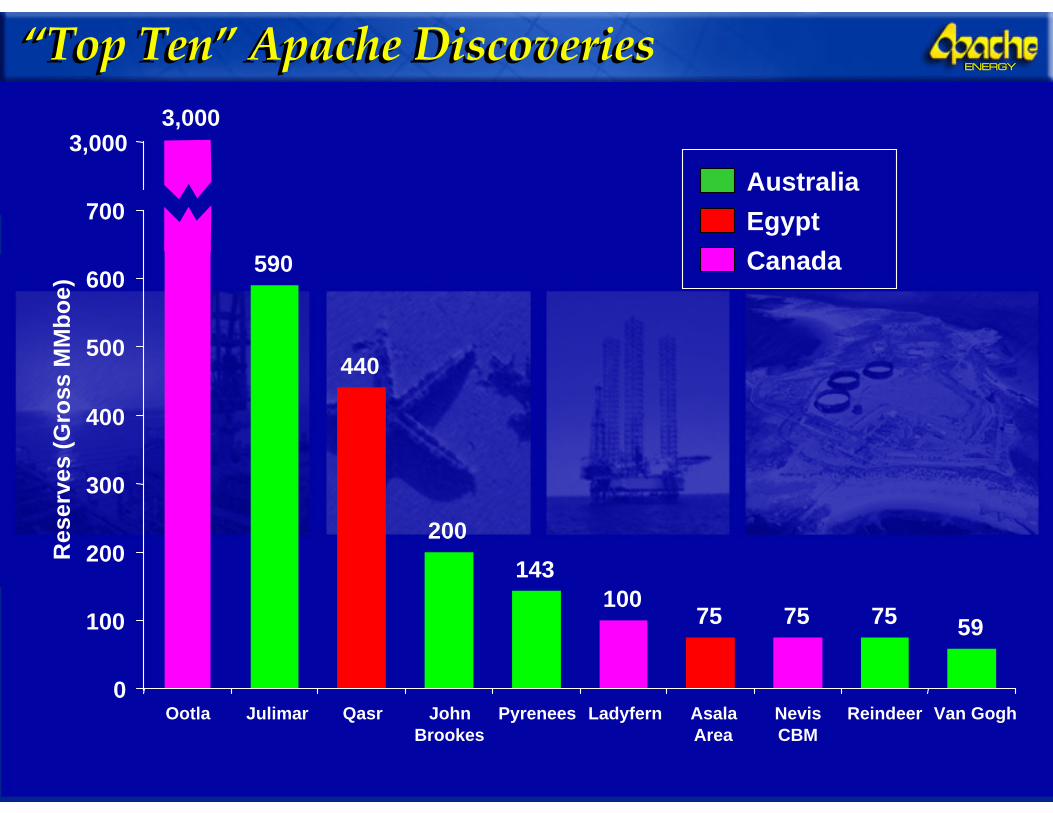
ENERGYENERGY“Top Ten” Apache Discoveries“Top Ten” Apache Discoveries
AustraliaEgyptCanada
3,000
590
440
200143
10075 75 75 59
0
100
200
300
400
500
600
700
3,000
Ootla Julimar Qasr JohnBrookes
Pyrenees Ladyfern AsalaArea
NevisCBM
Reindeer Van Gogh
Res
erve
s (G
ross
MM
boe)

ENERGYENERGYSeismic Acquisition: Key to ExplorationSeismic Acquisition: Key to Exploration
2008/2009 Acquisition Campaign
11,672 km² 3D 53.33 MM$ US
ACP 37Canis 3D/Ursa 3DCanis 3D/Ursa 3D
West Anchor/Grimalkin 3DWest Anchor/Grimalkin 3D

ENERGYENERGYAustralian Prospect InventoryAustralian Prospect Inventory
ExmouthExmouth
BrowseBrowse
GippslandGippsland
BarrowBarrow
DampierDampier
N=28Upside Gross Reserves: 2107 MMboeUpside Gross Reserves: 2107 MMboe
0 50 100 150 200 250
Fangtooth-1Arlo-1
Palmerston-1Dory-1
Rosella-2Elver-1
Galileo South-1Beefsteak-1
Scafell East-1Madfish-1Hermit-1
Brokenwood-1Argonauta-1Saffron-N-1Balnaves-1Derwent-1 Echinoid-1Maitland -4
Julimar Central-1Monarca-1
Julimar North-1Scafell-2
Parnassus-1Gustavo-1
Julimar-SW-1Hurricane-3
Boom-1Beam-1
MMboe

ENERGYENERGYGippsland Basin Exploration ProgramGippsland Basin Exploration Program
1
2
3
ENERGYENERGY
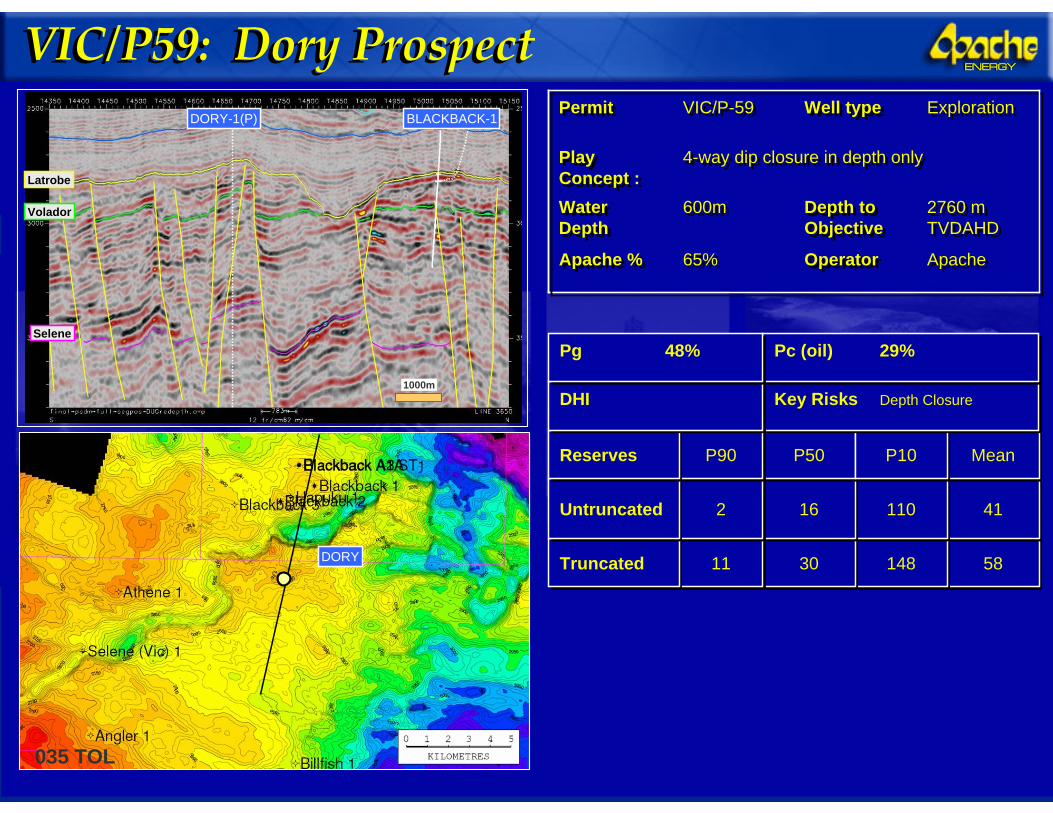
DORY
VIC/P59: Dory ProspectVIC/P59: Dory Prospect
585814814830301111TruncatedTruncated
4141110110161622UntruncatedUntruncated
MeanMeanP50P50 P10P10P90P90ReservesReserves
Key Risks Depth ClosureKey Risks Depth ClosureDHIDHI
Pc (oil) 29%Pc (oil) 29%Pg 48%Pg 48%
ApacheApacheOperatorOperator65%65%Apache %Apache %
2760 m TVDAHD2760 m TVDAHD
Depth to ObjectiveDepth to Objective
600m600mWater DepthWater Depth
4-way dip closure in depth only4-way dip closure in depth onlyPlay Concept :Play Concept :
ExplorationExplorationWell typeWell typeVIC/P-59VIC/P-59PermitPermitDORY-1(P)
Selene
Volador
Latrobe
BLACKBACK-1
1000m
035 TOL

ENERGYENERGYVIC/P59: Elver Prospect VIC/P59: Elver Prospect
51.351.3126.3126.329.129.110.610.6TruncatedTruncated
39.539.5103.5103.518.818.83.43.4UntruncatedUntruncated
MeanMeanP50P50 P10P10P90P90ReservesReserves
Key Risks Depth ClosureKey Risks Depth ClosureDHIDHI
Pc (oil) 21%Pc (oil) 21%Pg 33%Pg 33%
ApacheApacheOperatorOperator65%65%Apache %Apache %
3150 m TVDAHD3150 m TVDAHD
Depth to ObjectiveDepth to Objective
700m700mWater DepthWater Depth
4-way dip closure in depth only4-way dip closure in depth onlyPlay Concept :Play Concept :
ExplorationExplorationWell typeWell typeVic/P59Vic/P59PermitPermitELVER-1(P)
Selene
Volador
Latrobe
1000m
IGB
GB
066 VLD
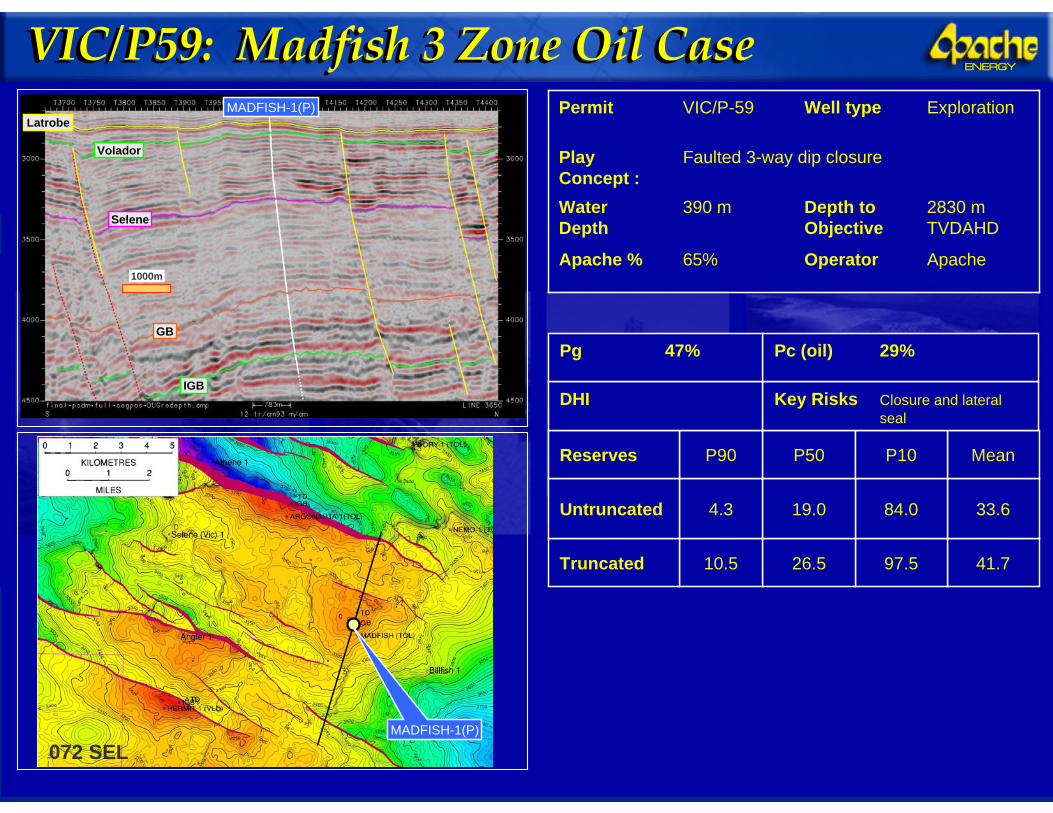
ENERGYENERGYVIC/P59: Madfish 3 Zone Oil CaseVIC/P59: Madfish 3 Zone Oil Case
41.797.526.510.5Truncated
33.684.019.04.3Untruncated
MeanP50 P10P90Reserves
Key Risks Closure and lateral seal
DHI
Pc (oil) 29%Pg 47%
ApacheOperator65%Apache %
2830 m TVDAHD
Depth to Objective
390 mWater Depth
Faulted 3-way dip closurePlay Concept :
ExplorationWell typeVIC/P-59Permit
MADFISH-1(P)
072 SEL
MADFISH-1(P)Latrobe
Selene
IGB
GB
Volador
1000m
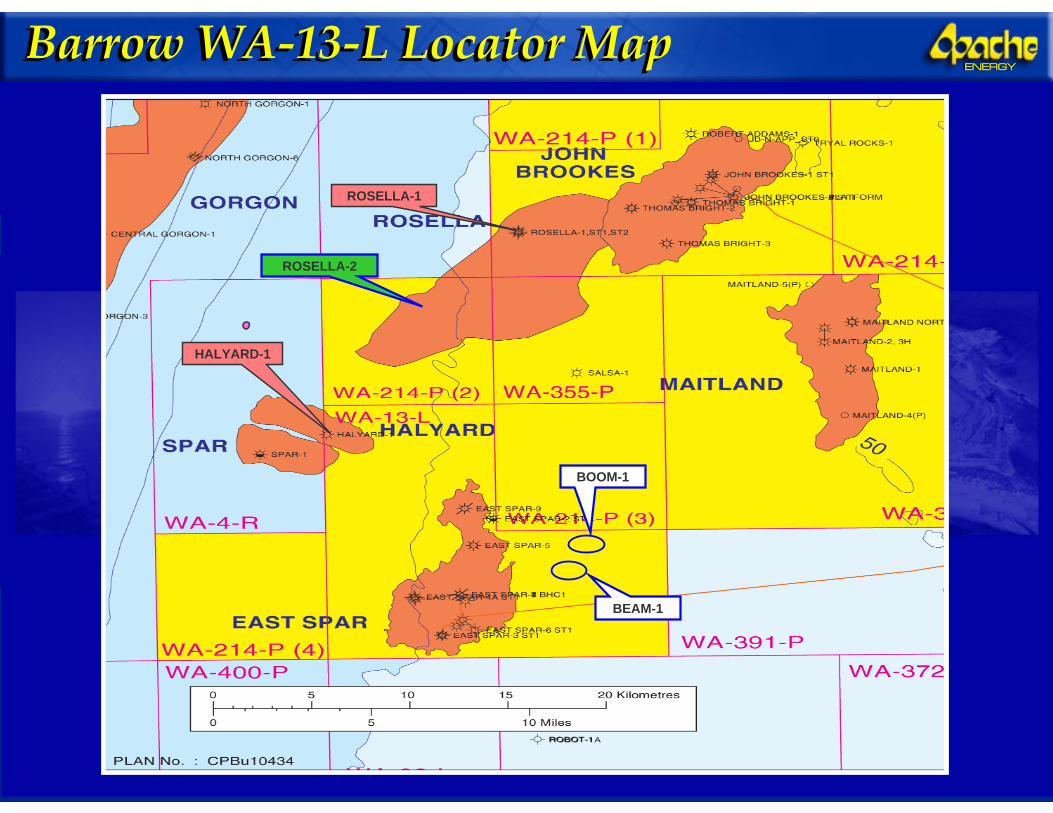
ENERGYENERGYBarrow WA‐13‐L Locator MapBarrow WA‐13‐L Locator Map
HALYARD-1
ROSELLA-1
ROSELLA-2
BEAM-1
BOOM-1
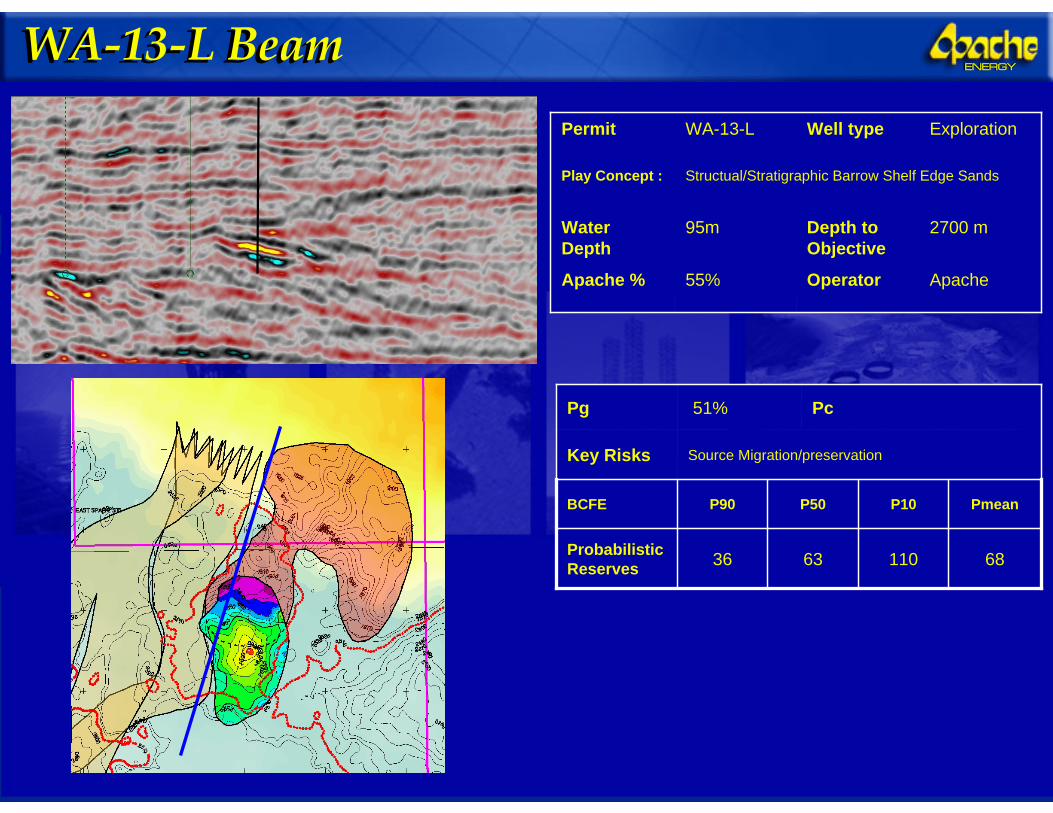
ENERGYENERGYWA‐13‐L BeamWA‐13‐L Beam
681106336Probabilistic Reserves
PmeanP50 P10P90BCFE
Source Migration/preservationKey Risks
Pc51%Pg
ApacheOperator55%Apache %
2700 mDepth to Objective
95mWater Depth
Structual/Stratigraphic Barrow Shelf Edge SandsPlay Concept :
ExplorationWell typeWA-13-LPermit

ENERGYENERGYWA‐13‐L: Boom‐1 ProspectWA‐13‐L: Boom‐1 Prospect
113199100 50Probabilistic Reserves
PmeanP50 P10P90BCFE
Source Migration/preservationKey Risks
Pc51%Pg
ApacheOperator55%Apache %
2700 mDepth to Objective
95mWater Depth
Structural/Stratigraphic Barrow Shelf Edge SandsPlay Concept :
ExplorationWell typeWA-13-LPermit

ENERGYENERGYBrowse Basin: AC/P‐37 Location MapBrowse Basin: AC/P‐37 Location Map
CRUX
PUFFIN
Arlo
ENERGYENERGY
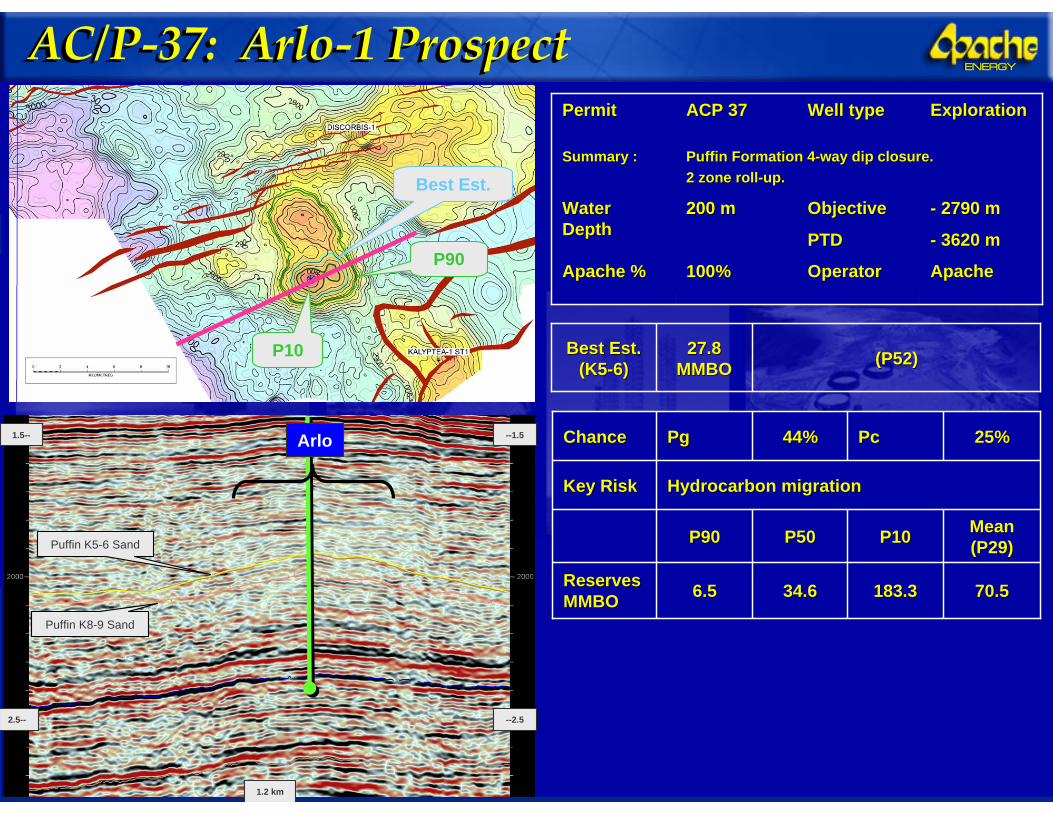
ApacheApacheOperatorOperator100100%%Apache %Apache %
-- 27902790 mm
-- 3620 m3620 m
ObjectiveObjective
PTDPTD
200200 mmWater Water DepthDepth
Puffin Formation 4Puffin Formation 4--way dip closure. way dip closure. 2 zone roll2 zone roll--up.up.
Summary :Summary :
ExplorationExplorationWell typeWell typeACP 37ACP 37PermitPermit
25%25%PcPc44%44%PgPgChanceChance
Hydrocarbon migrationHydrocarbon migrationKey RiskKey Risk
70.570.5183.3183.334.634.66.56.5Reserves Reserves MMBOMMBO
Mean Mean (P(P2929))P50P50 P10P10P90P90
27.8 27.8 MMBOMMBO (P52)(P52)Best Est.Best Est.
(K5(K5--6)6)
Best Est.
P90
P10
Puffin K5-6 Sand
--1.5
--2.52.5--
1.5--
1.2 km
AC/P‐37: Arlo‐1 ProspectAC/P‐37: Arlo‐1 Prospect
Puffin K8-9 Sand
Arlo

ENERGYENERGYAchieving Sustained GrowthAchieving Sustained Growth
0
5
10
15
20
25
30
35
40
2007 2008* 2009 2010 2011 2012 2013
MM
boe
Gas ComponentOil Component
0
5
10
15
20
25
30
35
40
2007 2008* 2009 2010 2011 2012 2013
MM
boe
Gas ComponentOil Component
Production ‐ Annual Net MMboe
Future Growth PotentialFuture Growth Potential
Increased Capital InvestmentIncreased Capital Investment
Production to increase by 124% (2007 to 2013)
Production to increase by 124% (2007 to 2013)*
* Includes impact of Varanus Island pipeline incident* Includes impact of Varanus Island pipeline incident
*
Note: Includes planned and proposed development projects plus 1 high chance of success exploration project

The following discussions contain certain “forward‐looking statements” as defined by the Private Securities Litigation Reform Act of 1995 including, without limitation, estimates, expectations, plans and goals regarding Apache’s production, reserves, financings, acquisitions, exploration and exploitation prospects, energy prices, operating costs, and results of operations. Such forward‐looking statements involve estimates, assumptions and uncertainties. No assurance can be given that Apache’s expectations or goals will be realized, and actual results may differ materially from those expressed in the forward‐looking statements. For reconciliations of non‐GAAP financial measures, see our web site www.apachecorp.com.
ENERGYENERGY
2008 Analyst Review2008 Analyst Review
Tim WallRegional VP Australia
Tim WallRegional VP Australia