Pakistan Energy YearBook 2008
123
Pakistan Energy Yearbook 2008 Ministry of Petroleum and Natural Resources Hydrocarbon Development Institute of Pakistan Islamabad, December 2008
description
Pakistan Energy
Transcript of Pakistan Energy YearBook 2008

Pakistan Energy Yearbook
2008
Ministry of Petroleum and Natural Resources Hydrocarbon Development Institute of Pakistan
Islamabad, December 2008

PAKISTAN ENERGY YEARBOOK 2008 An official annual publication of the Government of Pakistan, Ministry of Petroleum & Natural Resources. December 2008. Compiled by: Basit Ali Khan, Computer Programmer with the assistance of Syed Zeeshan Ahmad Naqvi, Computer Data Assistant, Hydrocarbon Development Institute of Pakistan. Published by: Hydrocarbon Development Institute of Pakistan #18, Street 6, Sector H-9/1, P.O. Box 1308, Islamabad. Phone: +(92 51) 925-8301, 925-8302. Fax: +(92 51) 925-8310. E-mail: [email protected] [email protected] Title Cover designed by: Syed Zeeshan Ahmed Naqvi, Computer Data Assistant, Hydrocarbon Development Institute of Pakistan. Printed by:

Page No.Foreword ................................. i Introduction ................................. 1
Part 1 ENERGY SITUATION
Table: 1.1 Primary Energy Supplies By-Source ................................. 3Table: 1.2 Final Energy Consumption By-Source ................................. 3Table: 1.3 Primary Energy Balance Sheet 2007-08 ................................. 4Table: 1.4 Energy Balances 2002-03 to 2007-08 ................................. 5Table: 1.5 Energy Consumption By-Sector ................................. 6Table: 1.5.1 Energy Consumption By-Fuel in Domestic Sector ................................. 6Table: 1.5.2 Energy Consumption By-Fuel in Commercial Sector ................................. 6Table: 1.5.3 Energy Consumption By-Fuel in Industrial Sector ................................. 7Table: 1.5.4 Energy Consumption By-Fuel in Agriculture Sector ................................. 7Table: 1.5.5 Energy Consumption By-Fuel in Transport Sector ................................. 7Table: 1.5.6 Energy Consumption By-Fuel in Other Government Sector ................................. 8Table: 1.6 Fossil Fuels Consumption in Thermal Power Generation ................................. 8Table: 1.7 Energy and Non-Energy Uses of Gas in Fertilizer Sector ................................. 8
Part 2 OIL
Table: 2.1 Crude Oil Reserves as on June 30, 2008 ................................. 11Table: 2.2 Crude Oil Production by Field ................................. 14Table: 2.2.1 Crude Oil Production by Company ................................. 16Table: 2.3 Refining Capacities ................................. 17Table: 2.4 Crude Oil Processed by Refineries ................................. 17Table: 2.5 Oil Refineries Production ................................. 18Table: 2.5.1 Production by Attock Refinery Ltd. ................................. 19Table: 2.5.2 Production by Bosicor Refinery Ltd. ................................. 20Table: 2.5.3 Production by Dhodak Refinery Ltd. ................................. 21Table: 2.5.4 Production by National Refinery Ltd. ................................. 22Table: 2.5.5 Production by Pak-Arab Refinery Ltd. ................................. 23Table: 2.5.6 Production by Pakistan Refinery Ltd. ................................. 24Table: 2.5.7 Production by ENAR Petroleum Refining Facility (EPRF) ................................. 25Table: 2.6 Consumption of Petroleum Products By-Fuel ................................. 26Table: 2.7 Consumption of Petroleum Energy Products By-Sector ................................. 27Table: 2.8 Consumption of Petroleum Energy Products By-Province ................................. 27Table: 2.9 Petroleum Products Consumption By Sector (2007-08) ................................. 28Table: 2.10 Sectoral Consumption of POL Products By Province (2007-08) ................................. 29Table: 2.11 Import of Crude Oil ................................. 31Table: 2.12 Import of Petroleum Products ................................. 31Table: 2.13 Export of Crude Oil and Petroleum Products ................................. 32Table: 2.14 Bunkering of Petroleum Products ................................. 33Table: 2.15.1 HOBC Sale Prices ................................. 34Table: 2.15.2 Gasoline (Regular) Sale Prices ................................. 37Table: 2.15.3 Kerosene Sale Prices ................................. 41Table: 2.15.4 High Speed Diesel Oil Sale Prices ................................. 45Table: 2.15.5 Light Diesel Oil Sale Prices ................................. 49Table: 2.16 Furnace Oil Prices after Deregulation ................................. 53
Part 3 GAS
Table: 3.1 Natural Gas Reserves as on June 30, 2008 ................................. 57Table: 3.1.1 Associated Gas Reserves as on June 30, 2008 ................................. 60Table: 3.2 Natural Gas Production By-Type ................................. 61Table: 3.3 Natural Gas Production By-Company ................................. 62Table: 3.4 Non-Associated Gas Production By-Field ................................. 63Table: 3.4.1 Associated Gas Production By-Field ................................. 66Table: 3.5 LPG Supplies By-Source ................................. 67Table: 3.6 LPG Consumption By-Sector ................................. 67
Cont'd/….
CONTENTS

Table: 3.7 LPG Consumption By-Region 2007-08 ................................. 68Table: 3.8 Natural Gas Consumption By-Sector ................................. 69Table: 3.9 Natural Gas Consumption By-Province 2007-08 ................................. 69Table: 3.10 By-Source Gas Supplies to Fertilizer & Power Sectors ................................. 70Table: 3.11 Cumulative Number of Gas Consumers ................................. 71Table: 3.12 Natural Gas Distribution and Services Network ................................. 71Table: 3.13 Natural Gas Prices ................................. 72
Part 4 COAL
Table: 4.1 Pakistan Coal Reserves / Resources as on June 30, 2008 ................................. 73Table: 4.1.1 Thar Coal Reserves / Resources ................................. 74Table: 4.2 Production of Coal By-Field ................................. 75Table: 4.3 Imports of Coal ................................. 75Table: 4.4 Consumption of Indigenous Coal By-Sector ................................. 76Table: 4.5 PMDC's Average Selling Price of Coal ................................. 76
Part 5 ELECTRICITY
Table: 5.1 Installed Capacity of Electricity Generation ................................. 79Table: 5.2 Gross Generation of Electricity By-Source ................................. 81Table: 5.3 Thermal Electricity Generation By-Fuel ................................. 81Table: 5.4 Fuel Consumption for Thermal Power Generation ................................. 81Table: 5.5 Electricity Consumption By-Sector ................................. 82Table: 5.6 Electricity Consumption By-Province ................................. 82Table: 5.7 Sectoral Electricity Consumption By-Province (2007-08) ................................. 83Table: 5.8 Auxiliary Consumption By-Source ................................. 83Table: 5.9 Electricity Balances ................................. 83Table: 5.10 Energy Data of Hydel Power Stations (2007-08) ................................. 85Table: 5.11 Energy Data of Thermal Power Stations (2007-08) ................................. 86
Part 6 RENEWABLE ENERGY
Renewable Energy in Pakistan ................................. 87Table: 6.1 Electricity Generation by Renewable Enegry Projects (2007-08) ................................. 94
Part 7 APPENDICES
Appendix: 7.1 Oil & Gas Exploratory Wells Drilled in Pakistan ................................. 95Appendix: 7.2 Oil & Gas Appraisal/Development Wells Drilled in Pakistan ................................. 106Appendix: 7.3 Unit Conversions ................................. 119Appendix: 7.4 Gross Calorific Values ................................. 120Appendix: 7.5 Abbreviations Used ................................. 121
LIST OF FIGURES
Figure 1.1 Primary Energy Supplies By-Source ................................. 9Figure 1.2 Energy Consumption By-Sector ................................. 9Figure 2.1 Crude Oil Production ................................. 16Figure 2.2 Production By Oil Refineries 2007-08 ................................. 21Figure 2.3 Petroleum Products Consumption By-Sector ................................. 30Figure 2.4 Import of Selected Petroleum Products ................................. 30Figure 3.1 Natural Gas Production ................................. 61Figure 3.2 Natural Gas Consumption By-Sector ................................. 68Figure 3.3 Natural Gas Prices ................................. 70Figure 4.1 Coal Production ................................. 74Figure 4.2 Coal Consumption By-Sector ................................. 77Figure 5.1 Electricity Installed Capacity as on June 30, 2008 ................................. 80Figure 5.2 Electricity Generation 2007-08 ................................. 80Figure 5.3 Electricity Consumption By-Sector ................................. 84
Cont'd/….
CONTENTS (Cont'd)

Figure 7.1 Exploratory & Development Wells Drilled from 1991-92 to 2007-08 ................................. 105Figure 7.2 Drilling Activity in Pakistan as on June 30, 2008 ................................. 105
ADVERTISING SECTION ................................. 123
CONTENTS (Cont'd)

Table: 1.1PRIMARY ENERGY SUPPLIES BY SOURCE
Unit: TOE% Share
Source 2002-03 2003-04 2004-05 2005-06 2006-07 2007-08 ACGR
Oil 1/ 18,016,214 15,221,024 16,329,979 16,411,834 18,188,280 19,206,441 1.3%38.3% 29.9% 29.4% 28.3% 30.0% 30.5%
Gas 20,590,425 25,254,481 27,953,380 29,202,362 29,322,338 29,872,105 7.7%43.8% 49.7% 50.3% 50.3% 48.4% 47.5%
LPG 2/ 181,661 205,526 251,789 400,430 470,998 418,952 18.2%0.4% 0.4% 0.5% 0.7% 0.8% 0.7%
Coal 2,519,881 3,300,491 4,227,842 4,049,654 4,426,678 5,783,844 18.1%5.4% 6.5% 7.6% 7.0% 7.3% 9.2%
Hydro Electricity 3/ 5,335,041 6,431,312 6,127,429 7,366,452 7,626,755 6,851,955 5.1%11.3% 12.6% 11.0% 12.7% 12.6% 10.9%
Nuclear Electricity 3/ 415,242 420,135 667,234 592,887 546,159 734,537 12.1%0.9% 0.8% 1.2% 1.0% 0.9% 1.2%
Imported Electricity 4/ 85 17,418 26,050 34,775 40,781 47,550 254.0%0.0% 0.0% 0.0% 0.1% 0.1% 0.1%
TOTAL: 47,058,550 50,850,387 55,583,703 58,058,395 60,621,989 62,915,385 6.0%100.0% 100.0% 100.0% 100.0% 100.0% 100.0%
Annual growth rate 4.38% 8.06% 9.31% 4.45% 4.42% 3.78%
1/ Excluding petroleum products exports and bunkering.2/ Include imports and production from field plants.3/ Converted @ 10,000 Btu/kWh to represent primary energy equivalent of hydro and nuclear electricity as if this was generated by using fossil fuels.4/ WAPDA imported electricity from Iran since Oct-2002.
Table: 1.2FINAL ENERGY CONSUMPTION BY SOURCE
Unit: TOESource 2002-03 2003-04 2004-05 2005-06 2006-07 2007-08 ACGR
Oil 1/ 10,865,717 11,145,365 11,710,920 10,877,601 10,575,330 11,528,722 1.2%41.3% 38.5% 36.5% 32.0% 29.4% 29.3%
Gas 2/ 9,109,870 10,067,245 11,637,566 13,325,251 14,701,024 15,881,990 11.8%34.6% 34.7% 36.2% 39.3% 40.8% 40.3%
Coal 2/ 1,691,274 2,703,906 3,310,512 3,611,490 4,149,041 5,404,715 26.2%6.4% 9.3% 10.3% 10.6% 11.5% 13.7%
Electricity 3/ 4,288,227 4,682,063 4,994,560 5,505,555 5,921,635 5,977,697 6.9%16.3% 16.2% 15.6% 16.2% 16.4% 15.2%
LPG 352,766 380,370 450,379 625,792 658,225 619,944 11.9%1.3% 1.3% 1.4% 1.8% 1.8% 1.6%
TOTAL: 26,307,854 28,978,949 32,103,936 33,945,689 36,005,255 39,413,069 8.4%Annual growth rate 2.77% 10.15% 10.78% 5.74% 6.07% 9.46%
1/ Excluding consumption for power generation.2/ Excluding consumption for power generation and feedstock.3/ @ 3412 Btu/kWh being the actual energy content of electricity.

Unit: TOEPetroleum Products Liquefied
Natural Gas @ Non Petroleum TotalRaw Gas Processed Gas Total Gas Crude Oil Energy Energy Gas Coal Hydro Nuclear Electricity
* ** *** *** ***ENERGY SUPPLIES
a Indigenous Production of Primary Energy 29,872,685 29,872,685 3,434,811 392,769 1,845,036 6,851,955 734,537 43,131,794b Imports 8,708,331 9,157,914 25,711 3,938,808 47,550 21,878,315c Exports & Bunkers 0 -1,716,041 0 -1,716,041d Stock Changes # -580 -81,277 -258,228 -39,069 472 -378,682e Net Primary Energy Supplies (a+b+c+d) 29,872,685 29,872,105 12,061,865 7,183,645 -39,069 418,952 5,783,844 6,851,955 734,537 47,550 62,915,384
TRANSFORMATIONS
f Gas Processing Plants -25,267,635 23,983,883 -1,283,173 -1,283,173g Petroleum Refineries -11,973,259 10,840,351 559,314 232,382 -341,212h Electric Power Stations -2,371,938 -6,120,982 -8,492,919 -6,910,062 -7,040 -72,568 -6,851,955 -734,537 7,790,644 -15,278,438j Energy Transformed (f+g+h) -9,776,092 -11,973,259 3,930,288 552,274 232,382 -72,568 -6,851,955 -734,537 7,790,644 -16,902,823
PRIMARY ENERGY BALANCE SHEET 2007-08Table: 1.3
DIVERSIONS
k Transport & Distribution Losses -709,703 -1,557,682 -2,267,385l Auxiliary Consumption of Energy Sector -358,694 -102,664 0 -33,784 -300,354 -795,496
m Consumption for Non-Energy Uses -1,779,152 -1,366,474 -3,145,626 -447,921 -306,560 -3,900,107n Spare By-product Electricity from PASMIC -2,462 -2,462o Statistical Differences -88,606 517,453 -65,284 2,394 365,958p Final Energy Use (e+j+k+l+m+n+o) 15,881,990 0 11,528,722 0 619,944 5,404,715 0 0 5,977,697 39,413,069
SECTORAL USES OF FINAL ENERGY
q Domestic 4,774,412 124,781 401,786 447 2,744,868 8,046,294r Commercial 793,367 208,378 453,782 1,455,527s Industrial (t+u+v+w) 8,628,979 1,082,885 5,404,268 1,688,171 16,804,303t Brick Kiln 1,682,540u Cement 298,025 3,721,727v Fertilizer 453,961 329,019 782,979
w1 Pakistan Steel Mills 395,483w2 General Industry 7,152,491x Agriculture 113,889 689,948 803,837y Transport 1,685,232 9,881,537 625 11,567,394z Other Government 325,631 9,779 400,302 735,712@ Includes accociated and non-associated gases.
* Raw Gas includes gas supplied by production companies to gas distribution companies and directly to major consumers like power and fertilizer plants.** Processed Gas includes gas supplied after processing by gas distribution companies to various consumers. `
*** Hydro and Nuclear energy inputs for electricity generation are expressed in terms of equivalent primary energy at 10,000 Btu/kWh, whereas electricity generated in power plants and supplied to consumers isexpressed in terms of actual energy content viz. 3,412 Btu/kWh.
# + for withdrawl from stocks and - for addition to stocks.

Table: 1.4
Unit:
ENERGY BALANCES 2002-03 TO 2007-08
TOE
Source 2002-03 2003-04 2004-05 2005-06 2006-07 2007-08 ACGR
OIL PRODUCTS (ENERGY)Opening Stock 773,461 568,591 743,592 773,565 780,994 960,646 4.4%
Prod. from ARL, DRL 1/ 1,710,472 1,621,806 1,865,745 1,881,279 1,839,971 1,916,632 2.3%
Prod. from Other* Refineries 1/ 7,393,787 8,153,813 8,682,970 8,677,632 8,543,813 8,923,719 3.8%
Petroleum Products Imports 8,533,607 5,383,198 5,854,150 6,169,808 8,422,347 9,157,914 1.4%
Gross Supply 18,411,328 15,727,409 17,146,457 17,502,283 19,587,125 20,958,911 2.6%
Refineries Own Use -120,465 -116,833 -119,647 -117,620 -105,121 -102,664 -3.1%
Exports/Bunkers -1,013,614 -1,075,749 -1,287,133 -1,616,501 -1,701,251 -1,716,041 11.1%
Power Plants -5,868,192 -2,672,432 -3,366,043 -4,110,527 -6,566,628 -6,910,062 3.3%
Closing Stock -568,591 -743,592 -773,565 -780,994 -960,646 -1,218,874 16.5%
Net Supply 10,840,466 11,118,80 4 11,600,068 10,876,642 10,253,479 11,011,26 9 0.3%
T & D Losses & Stat. Diff. 25,251 26,562 110,852 959 321,852 517,453 82.9%
Net Consumption 10,865,717 11,145,365 11,710,920 10,877,601 10,575,330 11,528,722 1.2%
O
GASpening Stock in Pipeline 64,773 73,416 79,261 86,240 88,535 91,850 7.2%
Processed by SSGC 2/ 5,878,867 7,582,966 8,081,920 8,514,962 8,516,755 9,463,467 10.0%
Direct Supplies 3/ 12,446,384 14,972,218 16,945,524 17,875,864 18,200,152 18,750,050 8.5%
Associated Gas 4/ 417,428 398,205 486,007 615,102 458,061 375,416 -2.1%
Closing Stock in Pipeline -73,416 -79,261 -86,240 -88,535 -91,850 -92,429 4.7%
Gross Supply 18,734,036 22,947,544 25,506,471 27,003,634 27,171,654 28,588,353 8.8%
Used for Compression, etc. -236,538 -267,984 -284,304 -273,100 -321,504 -358,694 8.7%
Feedstock for Fertilizer -2,745,637 -2,842,095 -2,938,731 -3,033,832 -2,989,825 -3,145,626 2.8%
Power Plants -6,440,342 -9,463,538 -10,305,897 -9,978,369 -8,640,208 -8,492,919 5.7%
Net Supply 9,311,519 10,373,928 11,977,539 13,718,333 15,220,118 16,591,114 12.2%
T & D Losses & Stat. Diff. -201,648 -306,683 -339,973 -393,082 -519,094 -709,124 28.6%
Net Consumption 9,109,870 10,067,245 11,637,566 13,325,251 14,701,024 15,881,990 11.8%
O
LPGpening Stock 1,566 1,293 1,223 1,543 1,041 2,178 6.8%
Indigenous Production 383,751 411,448 445,760 603,536 630,728 625,151 10.3%
Imports 19,474 37,867 43,808 26,808 70,962 25,711 5.7%
Closing Stock -1,293 -1,223 -1,543 -1,041 -2,178 -1,706 5.7%
Gross Supply 403,498 449,385 489,248 630,847 700,553 651,334 10.1%
Refineries Own Use -35,147 -33,714 -33,265 -34,823 -30,621 -33,784 -0.8%
Net Supply 368,351 415,671 455,983 596,024 669,932 617,550 10.9%
T & D Losses & Stat. Diff. -15,585 -35,301 -5,604 29,768 -11,707 2,394 -168.8%
Net Consumption 352,766 380,370 450,379 625,792 658,225 619,944 11.9%
Indi
COALgenous Production 1,481,604 1,465,452 2,052,056 2,179,357 1,629,817 1,845,036 4.5%
Imports 1,038,277 1,835,040 2,175,786 1,870,297 2,796,861 3,938,808 30.6%
Gross Supply 2,519,881 3,300,491 4,227,842 4,049,654 4,426,678 5,783,844 18.1%
Power Plants -91,101 -82,765 -80,481 -66,812 -73,551 -72,568 -4.4%
Feedstock for Coke -737,506 -513,820 -836,849 -371,352 -204,087 -306,560 -16.1%
Net Supply 1,691,274 2,703,906 3,310,512 3,611,490 4,149,041 5,404,715
Net Consumption 1,691,274 2,703,906 3,310,512 3,611,490 4,149,041 5,404,715 26.2%
H
ELECTRICITY 5/
ydel Generation 1,820,293 2,194,336 2,090,653 2,513,402 2,602,216 2,337,858 5.1%
Thermal Generation 4,201,556 4,244,829 4,655,293 4,909,432 5,209,876 5,202,166 4.4%
Nuclear Generation 141,679 143,348 227,657 202,290 186,347 250,621 12.1%
Gross Generation 6,163,528 6,582,513 6,973,603 7,625,125 7,998,439 7,790,644 4.8%
Auxiliary Consumption -244,850 -247,665 -268,981 -282,002 -295,060 -300,354 4.2%
Net Generation 5,918,678 6,334,848 6,704,622 7,343,123 7,703,378 7,490,291 4.8%
Net purchases from PASMIC 1,861 289 -5,668 -16,551 -11,157 -2,462 -205.8%
Net Supply 5,920,539 6,335,137 6,698,954 7,326,572 7,692,221 7,487,829 4.8%
Imports 85 17,418 26,050 34,775 40,781 47,550 254.0%
Total Net Supply 5,920,624 6,352,555 6,725,004 7,361,347 7,733,002 7,535,379 4.9%
T & D Losses & Stat. Diff. -1,632,397 -1,670,492 -1,730,444 -1,855,792 -1,811,367 -1,557,682 -0.9%
Net Consumption 4,288,227 4,682,063 4,994,560 5,505,555 5,921,635 5,977,697 6.9%
Net Su
TOTAL ENERGYpply 28,132,148 30,947,445 34,043,055 36,129,060 37,984,791 41,112,476 7.9%
T & D Losses & Stat. Diff. -1,808,794 -1,950,613 -1,959,566 -2,247,914 -2,008,609 -1,749,352 -0.7%
Net Consumption 26,307,854 28,978,949 32,103,936 33,945,689 36,005,255 39,413,069 8.4%1/ Excluding LPG production. ARL, DRL & Enar refine only local crudes, Bosicor & PARCO refine only imported crudes while PRL & NRL refine both
2/ Since 2001-02, gas processed/withdrawn by SSGCL and supplied to sourthern distribution systems from Sui, Badin etc. areas
3/ Direct supplies to thermal & fertilizer plants and non-associated gas from fields other than (2)
4/ Production from oilfields in north. Production of associated gas from Badin area is processed by SSGC and is included in (2)
5/ @ 3412 Btu/kWh.
* Bosicor, NRL, PARCO, PRL

Table: 1.5
Unit:
ENERGY CONSUMPTION BY SECTOR
TOE
Sector 2002-03 2003-04 2004-05 2005-06 2006-07 2007-08 ACGR
Domestic 6,092,468 6,278,918 6,812,535 7,054,587 7,605,145 8,046,294 5.7%
Commercial 851,857 927,633 1,080,235 1,247,992 1,377,247 1,455,527 11.3%
Industrial 9,313,278 11,098,642 12,759,957 14,654,360 15,792,049 16,804,303 12.5%
Agriculture 694,783 734,202 717,151 732,699 767,266 803,837 3.0%
Transport 8,771,365 9,281,160 10,071,427 9,493,667 9,721,183 11,567,394 5.7%
Other Govt. 584,103 658,393 662,631 762,384 742,364 735,712 4.7%
Total: 26,307,854 28,978,949 32,103,936 33,945,689 36,005,255 39,413,069 8.4%
Note: See tables 1.5.1 to 1.5.6 for details and explanations.
Unit:
Table: 1.5.1
Energy Consumption in Domestic Sector
TOE
Source 2002-03 2003-04 2004-05 2005-06 2006-07 2007-08 ACGR
Oil 291,449 238,773 198,841 132,716 109,502 124,781 -15.6%
Gas 3,592,094 3,631,072 4,027,210 4,003,955 4,341,475 4,774,412 5.9%
LPG 284,510 303,716 338,693 416,102 438,908 401,786 7.1%
Electricity * 1,923,919 2,104,889 2,247,791 2,501,813 2,714,814 2,744,868 7.4%
Coal 497 468 0 0 445 447 -2.1%
Total: 6,092,468 6,278,918 6,812,535 7,054,587 7,605,145 8,046,294 5.7%
Annual growth rate 3.34% 3.06% 8.50% 3.55% 7.80% 5.80%
* @ 3412 Btu/kWh.
Unit:
Table: 1.5.2
Energy Consumption in Commercial Sector
TOE
Source 2002-03 2003-04 2004-05 2005-06 2006-07 2007-08 ACGR
LPG 56,793 61,134 111,686 177,884 206,341 208,378 29.7%
Gas 532,964 566,093 636,268 684,886 734,180 793,367 8.3%
Electricity * 262,101 300,407 332,281 385,222 436,727 453,782 11.6%
Total: 851,857 927,633 1,080,235 1,247,992 1,377,247 1,455,527 11.3%
Annual growth rate 5.28% 8.90% 16.45% 15.53% 10.36% 5.68%
* @ 3412 Btu/kWh.

Table: 1.5.3
Unit:
Energy Consumption in Industrial Sector
TOE
Source 2002-03 2003-04 2004-05 2005-06 2006-07 2007-08 ACGR
Oil 1,584,771 1,481,873 1,533,234 1,703,633 1,623,346 1,082,885 -7.3%
Gas * 4,719,928 5,499,005 6,402,126 7,726,502 8,304,528 8,628,979 12.8%
Electricity ** 1,317,802 1,414,326 1,514,085 1,612,735 1,715,579 1,688,171 5.1%
Coal 1,690,777 2,703,437 3,310,512 3,611,490 4,148,596 5,404,268 26.2%
Total: 9,313,278 11,098,642 12,759,957 14,654,360 15,792,049 16,804,303 12.5%
Annual growth rate 5.79% 19.17% 14.97% 14.85% 7.76% 6.41%
* Includes energy consumption in fertilizer production. Also refer to Table 1.7.
** @ 3412 Btu/kWh.
Unit:
Table: 1.5.4
Energy Consumption in Agricultural Sector
TOE
Source 2002-03 2003-04 2004-05 2005-06 2006-07 2007-08 ACGR
Oil * 204,842 191,080 148,008 85,351 101,406 113,889 -11.1%
Electricity ** 489,941 543,122 569,143 647,349 665,861 689,948 7.1%
Total: 694,783 734,202 717,151 732,699 767,266 803,837 3.0%
Annual growth rate 0.44% 5.67% -2.32% 2.17% 4.72% 4.77%
* HSD consumption for tractors in agriculture sector is not separately available and is included in the transport sector. Agriculturesector represents LDO only.
** @ 3412 Btu/kWh.
Unit:
Table: 1.5.5
Energy Consumption in Transport Sector
TOE
Source 2002-03 2003-04 2004-05 2005-06 2006-07 2007-08 ACGR
Aviation Fuel 445,907 494,216 547,048 563,985 542,700 436,928 -0.4%
Motor Spirit 1,138,269 1,291,339 1,390,407 1,227,579 1,188,565 1,522,251 6.0%
HOBC 8,462 8,507 8,248 7,336 7,380 8,335 -0.3%
Kerosene 456 458 984 623 679 497 1.7%
HSD 6,899,630 7,111,674 7,532,857 6,763,639 6,650,979 7,907,464 2.8%
LDO 556 533 5,095 723 0 140 -24.2%
Furnace Oil 12,408 2,623 13,845 18,831 9,068 5,921 -13.8%
Electriciry * 792 735 981 1,042 971 625 -4.6%
Natural Gas ** 264,885 371,075 571,961 909,908 1,320,841 1,685,232 44.8%
Total: 8,771,365 9,281,160 10,071,427 9,493,667 9,721,183 11,567,394 5.7%
Annual growth rate 1.84% 5.81% 8.51% -5.74% 2.40% 18.99%
* @ 3412 Btu/kWh. Includes railway traction.
** Compressed Natural Gas (CNG).

Table: 1.5.6
Unit:
Energy Consumption in Other / Government Sector
TOE
Source 2002-03 2003-04 2004-05 2005-06 2006-07 2007-08 ACGR
Oil 278,967 324,288 332,352 373,184 341,705 325,631 3.1%
Electricity * 293,672 318,585 330,279 357,394 387,683 400,302 6.4%
LPG 11,464 15,520 ** 31,806 12,975 9,779 -3.1%
Total: 584,103 658,393 662,631 762,384 742,364 735,712 4.7%
Annual growth rate -25.71% 12.72% 0.64% 15.05% -2.63% -0.90%
* @ 3412 Btu/kWh. Also include bulk supplies and street light.
** Included in Commercial Sector.
Unit:
Table: 1.6
FOSSIL FUELS CONSUMPTION IN THERMAL POWER GENERATION
TOE
Source 2002-03 2003-04 2004-05 2005-06 2006-07 2007-08 ACGR
Oil 5,868,192 2,672,432 3,366,043 4,110,527 6,566,628 6,910,062 3.3%
Gas 6,440,342 9,463,538 10,305,897 9,978,369 8,640,208 8,492,919 5.7%
Coal 91,101 82,765 80,481 66,812 73,551 72,568 -4.4%
Total: 12,399,635 12,218,735 13,752,422 14,155,708 15,280,387 15,475,550 4.5%
Annual growth rate 1.06% -1.46% 12.55% 2.93% 7.95% 1.28%
Unit:
Table: 1.7
ENERGY AND NON-ENERGY USES OF GAS IN FERTILIZER SECTOR*
TOE
Source 2002-03 2003-04 2004-05 2005-06 2006-07 2007-08 ACGR
Feedstocks 2,745,637 2,842,095 2,938,731 3,033,832 2,989,825 3,145,626 2.8%
Energy Use 779,054 793,123 797,852 842,662 786,437 782,979 0.1%
Total: 3,524,691 3,635,217 3,736,582 3,876,494 3,776,262 3,928,605 2.2%
Annual growth rate 1.68% 3.14% 2.79% 3.74% -2.59% 4.03%

PRIMARY ENERGY SUPPLIES BY SOURCE
47.1
62.8
0.0
10.0
20.0
30.0
40.0
50.0
60.0
70.0Million TOE
Oil LPG Gas Coal Hydro & Nuc.
Figure 1.1
38.3%
0.4%
43.8%
12.2%
12.2%
9.2%
47.6%
30.6%
0.4%
Domestic23.2%
Commercial3.2%
Industrial35.4%
Agriculture2.6% Transport
33.3%
Other Govt.2.2%
Figure 1.2
ENERGY CONSUMPTION BY SECTOR(Excluding fuels consumed in thermal power generation)
2002-03
Total: 26.3 Million TOE
2007-08
Total: 39.4 Million TOE
Domestic20.4%
Commercial3.7%
Industrial42.6%
Agriculture2.0%
Transport29.3%
Other Govt.1.9%
5.4%
2007-082002-03

CRUDE OIL RESERVES AS ON JUNE 30, 2008Unit: Million US Barrels
Original BalanceFIELD Operator Recoverable Cumulative Recoverable
Company Reserves Production Reserves
1 Savi Ragha (c) BG Balochistan 1.350 1.3502 Zamzama (c) BHP Sindh 11.677 4.048 7.6293 Manzalai MOL NWFP 29.000 0.506 28.4944 Makori " NWFP 30.000 1.434 28.5665 Bagla OGDC Sindh 0.070 0.0706 Bhal Syedan (c) " Punjab 0.360 0.280 0.0807 Bhulan Shah " Sindh 0.190 0.023 0.1678 Bobi (c) " Sindh 11.564 4.728 6.8369 Buzdar North (c) " Sindh 0.030 0.023 0.00710 Chak-2 " Sindh 0.600 0.029 0.57111 Chak-7A " Sindh 0.200 0.20012 Chak-63 " Sindh 3.700 0.049 3.65113 Chak-63 SE " Sindh 0.194 0.19414 Chak-66 " Sindh 0.100 0.10015 Chak-66 NE " Sindh 2.860 2.86016 Chak-5 Dim South " Sindh 0.550 0.380 0.17017 Chak-Naurang " Punjab 7.627 5.669 1.95818 Chanda " NWFP 15.555 6.104 9.45119 Chandio " Sindh 0.080 0.08020 Dakhni (c) " Punjab 11.937 5.223 6.71421 Dars & Dars Deep " Sindh 10.227 10.22722 Daru (c) " Sindh 0.730 0.512 0.21823 Dhamraki " Sindh 1.344 0.875 0.46924 Dhodak (c) " Punjab 23.860 11.828 12.03225 Hakeem Daho " Sindh 2.400 2.40026 Fimkassar " Punjab 15.290 13.260 2.03027 Jakhro " Sindh 0.414 0.41428 Jhal Magsi South " Balochistan 0.027 0.02729 Kal " Punjab 8.426 7.070 1.35630 Kunar " Sindh 16.379 14.168 2.21131 Kunar Deep " Sindh 5.777 5.77732 Lala Jamali " Sindh 0.500 0.50033 Lashari Centre " Sindh 11.024 9.811 1.21334 Lashari South (c) " Sindh 0.130 0.043 0.08735 Mela " NWFP 23.859 2.018 21.84136 Missakaswal " Punjab 10.480 9.686 0.79437 Missan " Sindh 1.451 0.821 0.63038 Mithrao " Sindh 1.040 0.355 0.68539 Moolan North " Sindh 1.604 0.082 1.52240 Norai Jagir " Sindh 0.764 0.260 0.50441 Nur " Sindh 0.060 0.06042 Nim & Nim West " Sindh 0.411 0.41143 Palli " Sindh 0.250 0.107 0.14344 Pasakhi, Pasakhi NE & Deep " Sindh 37.015 26.993 10.02245 Qadirpur " Sindh 10.114 2.518 7.59646 Rajian " Punjab 8.105 6.403 1.70247 Resham " Sindh 0.500 0.053 0.44748 Sadkal (c) " Punjab 5.405 4.547 0.85849 Sono " Sindh 19.244 14.731 4.51350 Tando Alam " Sindh 22.560 15.662 6.89851 Tando Allah Yar & North " Sindh 1.122 0.007 1.11552 Thora " Sindh 31.200 17.613 13.58753 Toot " Punjab 16.007 12.862 3.14554 Unar " Sindh 0.426 0.426
Contd.....
Table: 2.1

Original BalanceFIELD Operator Recoverable Cumulative Recoverable
Company Reserves Production Reserves55 Ali OPII Sindh 0.080 0.050 0.03056 Ahmad " Sindh 0.070 0.07057 Bhangali " Punjab 3.760 3.700 0.06058 Dhurnal " Punjab 50.280 50.120 0.16059 Kamal North " Sindh 0.840 0.320 0.52060 Naimat Basal " Sindh 0.620 0.360 0.26061 Siraj South " Sindh 0.480 0.460 0.02062 Ratana (c) " Punjab 1.450 1.370 0.08063 Rahim " Sindh 0.840 0.020 0.82064 Umar " Sindh 0.790 0.79065 Bilal North " Sindh 0.090 0.0700 0.02066 Balkassar POL Punjab 35.200 34.560 0.64067 Dhulian " Punjab 42.630 41.890 0.74068 Joyamair " Punjab 7.630 7.63069 Khaur " Punjab 4.310 4.210 0.10070 Meyal " Punjab 41.650 40.780 0.87071 Minwal " Punjab 3.740 0.810 2.93072 Pariwali " Punjab 7.230 5.880 1.35073 Pindori " Punjab 55.000 21.980 33.02074 Turkwal " Punjab 2.580 2.58075 Adhi (c) PPL Punjab 55.100 21.049 34.05176 Adam " Sindh 1.9 1.90077 Akri North BP Sindh 6.100 5.838 0.26278 Ali Zaur " Sindh 0.842 0.567 0.27579 Bachal " Sindh 0.028 0.02880 Bari " Sindh 2.385 2.260 0.12581 Bhatti (c) " Sindh 3.289 2.454 0.83582 Bukhari (c) & Bukhari Deep " Sindh 1.630 1.626 0.00483 Buzdar, Buzdar S. & S.Deep " Sindh 3.248 1.762 1.48684 Dabhi & Dabhi South " Sindh 9.106 7.620 1.48685 Dabhi North " Sindh 7.498 5.872 1.62686 Duphri " Sindh 0.518 0.379 0.13987 Fateh Shah & Fateh Shah North " Sindh 0.012 0.010 0.00288 Ghungro " Sindh 10.452 6.956 3.49689 Golarchi (c) " Sindh 0.264 0.222 0.04290 Halipota " Sindh 1.687 1.336 0.35191 Jabo (c) " Sindh 4.031 2.602 1.42992 Jagir " Sindh 7.356 4.668 2.68893 Jalal " Sindh 0.296 0.290 0.00694 Jhaberi " Sindh 0.440 0.44095 Jhaberi South " Sindh 0.363 0.172 0.19196 Junathi South " Sindh 0.034 0.03497 Jogwani (Duphri-4) Sindh 0.059 0.042 0.01798 Kato (c) " Sindh 0.364 0.273 0.09199 Keyhole G " Sindh 1.511 0.668 0.843
100 Khaskheli " Sindh 13.648 12.091 1.557101 Khorewah (c) & Khorewah Deep " Sindh 2.144 1.760 0.384102 Koli (c) " Sindh 0.439 0.423 0.016103 Laghari " Sindh 21.413 21.407 0.006104 Liari & Liari Deep " Sindh 8.113 7.872 0.241105 Mahi " Sindh 0.023 0.023106 Matli (c) " Sindh 0.286 0.283 0.003107 Mazari " Sindh 22.909 22.503 0.406108 Mazari South & Deep " Sindh 25.613 22.404 3.209109 Meyun Ismail & M.I. Deep " Sindh 0.997 0.977 0.020110 Missri " Punjab 0.018 0.003 0.015
Contd.....
Crude Oil Reserves (Contd.)

Original BalanceFIELD Operator Recoverable Cumulative Recoverable
Company Reserves Production Reserves
111 Mukhdumpur (c) & M'pur Deep (c) " Sindh 0.542 0.443 0.099112 Muban " Sindh 0.938 0.383 0.555113 Nari " Sindh 0.075 0.065 0.010114 Paniro " Sindh 1.279 1.022 0.257115 Pir (c) " Sindh 0.065 0.065116 Raj " Sindh 0.008 0.005 0.003117 Rajo " Sindh 0.428 0.175 0.253118 Rind (c) " Sindh 1.617 1.517 0.100119 Sakhi, Sakhi Deep & S. Deep " Sindh 10.517 5.010 5.507120 Shah Dino " Sindh 0.587 0.470 0.117121 Sonro (c) " Sindh 4.351 3.434 0.917122 Tajedi BP Sindh 2.982 2.459 0.523123 Tando Ghulam Ali " Sindh 0.141 0.141124 Tangri " Sindh 12.923 11.300 1.623125 Turk (c) & Turk deep (c) " Sindh 2.540 2.234 0.306126 Zaur West " Sindh 0.025 0.022 0.003127 Zaur, Zaur Deep & Zaur South " Sindh 7.676 5.171 2.505
TOTAL: Million Barrels 935.869 609.191 326.678 Million TOE 125.55 81.73 43.83
Of which: BG 1.350 1.350BHP 11.677 4.048 7.629MOL 59.000 1.940 57.060OGDC 343.762 194.793 148.969OPI 59.300 57.260 2.040POL 199.970 160.320 39.650PPL 57.000 21.049 35.951BP 203.810 169.781 34.029
(c) Condensate.Source: DGPC.
Crude Oil Reserves (Contd.)

Table: 2.2CRUDE OIL PRODUCTION BY FIELD
Unit: U.S. BarrelsProvince/Field Operator 2002-03 2003-04 2004-05 2005-06 2006-07 2007-08 ACGR
BALOCHISTAN Uch OGDCL 2,372 9,301 13,367 12,346 12,714 Sui PPL 14,866 13,211 10,290 11,144 12,294 13,399 -2.1%Balochistan Total: 14,866 15,583 19,591 24,511 24,640 26,113 11.9%NWFP Chanda OGDCL 1,005,896 958,025 1,887,302 2,058,926 Mela OGDCL 298,165 1,721,515 Makori MOL 144,255 517,543 771,595 Manzalai " 55,043 161,214 156,978 137,231NWFP Total: 1,060,939 1,263,494 2,859,988 4,689,267PUNJAB: Rodho Dewan Pet. 38,832 Balkassar POL 140,766 125,071 116,481 124,655 138,436 140,231 -0.1% Dhulian " 62,126 51,622 39,430 50,512 40,593 36,725 -10.0% Joyamair " 28,699 18,998 16,468 10,409 10,045 9,644 -19.6% Khaur " 1,859 1,460 2,964 619 1,650 2,135 2.8% Meyal " 509,571 312,556 206,847 248,318 281,827 244,425 -13.7% Minwal " 61,101 39,942 68,305 22,866 23,602 22,962 -17.8% Pariwali " 325,694 291,421 391,714 834,891 741,242 728,495 17.5% Pindori " 2,071,396 2,875,358 2,388,881 3,398,111 1,930,655 1,081,567 -12.2% Turkwal " 233,631 80,917 533,350 83,016 63,044 51,823 -26.0% Bhalsyedan OGDCL 47,360 33,082 18,893 6,691 4,543 8,531 -29.0% Chak Naurang " 171,490 164,295 158,612 149,352 139,150 124,115 -6.3% Dakhni " 189,676 210,392 355,364 413,315 381,037 464,623 19.6% Dhodak " 858,816 887,350 899,963 942,283 896,495 569,031 -7.9% Fimkassar " 199,747 195,140 190,412 176,175 151,230 126,361 -8.8% Kal " 557,042 559,291 574,832 586,238 413,371 181,265 -20.1% Missa Keswal " 233,371 144,012 126,743 115,131 80,646 68,559 -21.7% Rajian " 444,722 430,410 642,409 540,582 425,547 520,940 3.2% Sadkal " 173,621 79,517 58,236 42,140 47,517 36,917 -26.6% Toot " 81,543 90,518 114,965 114,861 111,548 92,473 2.5% Bhangali OPII 148,525 67,464 48,086 32,478 30,765 29,900 -27.4% Dhurnal " 384,256 252,030 202,230 165,047 133,064 104,329 -23.0% Ratana " 24,497 46,841 40,321 35,814 34,935 29,468 3.8% Adhi PPL 1,163,111 1,428,537 1,284,142 1,254,831 1,776,050 1,804,204 9.2%Punjab Total: 8,112,620 8,386,224 8,481,476 9,348,335 7,856,992 6,517,555 -4.3%SINDH: Zamzama BHP 194,405 602,811 625,305 655,857 732,056 959,616 37.6% Kadanwari ENI 25,607 18,501 968 1,036 1,109 1,363 -44.4% Bhit " 76,482 119,429 114,681 123,915 123,237 Bhullan Shan OGDC 15,304 1,221 6,148 Bobi " 5,210 885,789 952,675 1,127,768 1,389,220 Chak-2 " 24,985 1,368 Chak-63 " 4,490 42,705 Chak-66 NE " 91,456 Daru " 72,988 74,816 47,035 98,848 43,712 Kunnar " 1,244,161 1,463,921 1,487,739 1,598,160 1,681,041 2,034,803 10.3% Lashari Centre & South " 375,768 277,428 365,875 683,795 835,433 798,939 16.3% Missan " 49,010 54,219 151,936 123,878 76,904 88,650 12.6% Moolan N " 83,777 Noorai Jagir " 42,346 10,500 37,189 44,455 Palli " 1,165 Pasakhi " 1,020,926 832,250 1,610,405 1,523,310 1,348,147 1,026,005 0.1% Pasakhi North " 381,455 372,270 374,945 205,125 219,998 335,205 -2.6% Pasakhi North East " 269,416 437,010 Qadirpur " 112,231 205,520 383,590 378,480 371,893 358,582 26.2% Resham " 51,475 Sono " 285,747 201,843 672,895 888,558 1,450,124 1,330,653 36.0% Tando Alam " 441,499 688,043 663,085 390,156 401,570 648,022 8.0% Thora " 871,417 730,070 633,479 600,255 547,928 492,292 -10.8%
Contd./...

Crude Oil Production (contd.)Province/Field Operator 2002-03 2003-04 2004-05 2005-06 2006-07 2007-08 ACGR Miano OMV 3,394 15,411 35,625 35,260 30,725 34,449 59.0% Ali OPII 26,048 22,757 4,770 Bilal " 44,281 117,170 83,136 Bilal North " 18,345 35,145 19,144 Kamal North " 71,813 250,547 Kausar " 241 Naimat Basal " 49,323 84,431 79,776 78,696 66,805 Siraj South " 28,434 65,323 78,580 46,774 16 Rahim " 9,268 10,390 Umer " 229,879 246,498 98,951 100,408 98,986 Usman " 387 Rehmat Petronas 8,207 38,055 30,265 25,200 Kandhkot PPL 14,780 10,926 12,396 13,331 11,471 13,339 -2.0% Mazarani " 20,549 22,461 25,487 23,698 21,151 Akri North BP 459,557 356,366 303,288 151,451 102,553 82,379 -29.1% Ali Zaur " 52,296 273,476 134,435 80,364 42,290 Bari " 20,697 21,452 20,353 14,547 6,786 1,409 -41.6% Bhatti/Nakurji " 204,191 159,985 134,148 123,494 70,535 50,315 -24.4% Bukhari " 32,444 14,960 19,565 15,471 16,367 13,763 -15.8% Bukhari Deep " 5,182 6,585 15,725 Buzdar " 54,100 42,646 43,397 58,331 58,229 68,329 4.8% Buzdar South " 9,005 3,669 -16.4% Buzdar South Deep " 59,620 60,968 176,369 103,225 81,013 72,372 4.0% Dabhi, Dabhi N. & S. " 1,273,606 542,693 241,419 111,542 93,069 125,500 -37.1% Duphri " 198 12,518 104,127 159,275 110,758 254.4% Fateh Shah " 2,097 209 50 Fateh Shah North " 2,700 4,719 356 Ghungro " 938,919 547,707 302,826 235,342 144,036 99,627 -36.2% Golarchi " 7,272 3,402 15,417 10,285 2,472 931 -33.7% Halipota " 30,839 53,912 69,474 69,757 Jabo " 321,118 361,003 188,452 317,496 348,217 260,780 -4.1% Jagir " 532,280 409,035 225,365 138,230 79,597 68,842 -33.6% Jalal " 8,936 34,425 Jogwani " 297 7,381 14,038 20,748 Jhaberi, Jhaberi South " 85,899 8,339 43,735 49,631 30,139 13,219 -31.2% Junathi South " 532 1,727 4,199 Kato " 9,157 352 127 11,181 9,507 12,171 5.9% Keyhole-G " 16,218 356,134 186,990 26,949 4,371 5,975 -18.1% Khaskheli " 186,537 190,469 176,078 153,844 116,215 89,040 -13.7% Khorewah & K.Deep " 117,566 101,356 89,019 75,899 45,608 36,646 -20.8% Laghari " 81,991 64,124 58,436 37,031 33,085 40,382 -13.2% Liari " 415,795 140,136 47,806 38,411 37,856 40,347 -37.3% Liari Deep " 36,874 17,852 14,615 9,495 8,564 8,317 -25.8% Makhdumpur " 23,715 17,748 12,766 8,727 3,038 8,266 -19.0% Mazari " 229,077 190,372 104,180 21,327 31,082 45,991 -27.5% Mazari South " 647,976 465,884 425,861 346,227 296,573 208,267 -20.3% Mazari South Deep " 298,683 288,686 324,135 272,276 386,489 440,306 8.1% M.Ismail & M.Ismail Deep " 41,449 30,179 31,110 13,648 10,327 34,224 -3.8% Missri " 3,397 Muban " 51,975 57,643 40,954 35,710 37,685 27,473 -12.0% Nari " 1,709 371 55,364 Paniro " 29,242 29,850 13,599 67,155 61,227 15.9% Pir " 1,411 2,146 Raj " 4,348 706 Rajo " 40,223 6,568 23,019 4,057 371 -60.8% Rind " 253,322 316,878 165,148 147,561 134,768 111,004 -15.2% Sakhi, Sakhi S & S. Deep " 391,713 559,101 357,931 220,584 188,452 132,321 -19.5% Shah Dino " 20,416 145,839 170,273 108,893 32,764 14,681 -6.4% Sonro " 739,018 587,801 403,093 308,647 375,128 407,798 -11.2% Tajedi " 116,839 78,003 69,787 85,748 58,041 57,509 -13.2% Tangri " 1,565,309 739,212 244,804 303,728 180,405 117,473 -40.4%
Contd./...

Crude Oil Production (contd.)Province/Field Operator 2002-03 2003-04 2004-05 2005-06 2006-07 2007-08 ACGR
Tando Ghulam Ali " 33,250 62,908 45,000
Turk &Turk Deep " 62,482 101,568 106,395 68,579 47,506 54,556 -2.7%
Zaur " 755,406 953,763 827,204 396,559 326,616 191,985 -24.0%
Zaur Deep " 18,377 12,012 2 4,625 6,667 6,797 -18.0%
Zaur South & West " 127,281 117,346 199,163 148,064 135,385
Sindh Total: 15,330,358 14,223,136 14,556,774 13,299,290 13,873,101 14,370,147 -1.3%
Grand Total: Barrels 23,457,844 22,624,943 24,118,780 23,935,630 24,614,721 25,603,082 1.8%
TOE 3,147,014 3,035,275 3,235,683 3,211,112 3,302,216 3,434,811
Barrels Per Day 64,268 61,817 66,079 65,577 67,438 69,954
Average growth Rate 1.13% -3.81% 6.89% -0.76% 2.84% 3.73%
Source: DGPC.
Table: 2.2.1CRUDE OIL PRODUCTION BY COMPANY
Unit: U.S. Barrels Per Day
Operator/Company 2002-03 2003-04 2004-05 2005-06 2006-07 2007-08 ACGR
BHP 533 1,647 1,713 1,797 2,006 2,622 37.5%
POL 9,411 10,375 10,319 13,078 8,852 6,333 -7.6%
ENI 70 260 330 317 343 340 37.1%
MOL 151 837 1,848 2,483
OGDC 21,629 21,322 31,350 31,511 36,332 41,397 13.9%
OPII 1,527 1,841 1,882 1,587 1,865 1,907 4.6%
OMV 9 42 98 97 84 94 58.9%
Petronas 22 104 83 69
BP 27,822 22,305 16,572 12,675 11,029 9,541 -19.3%
Dewan Petroleum 106
PPL 3,268 4,025 3,642 3,575 4,996 5,060 9.1%
Total: 64,268 61,817 66,079 65,577 67,438 69,954
Source: DGPC.
CRUDE OIL PRODUCTION
54,40657,549 58,276 56,284 54,756 55,723 57,762
63,547 64,26961,817
66,079 65,577 67,43869,954
94-95 95-96 96-97 97-98 98-99 99-00
0
20,000
40,000
60,000
80,000Barrels Per Day
OGDC OPII BP POL PPL Others
Figure 2.1
00-01 01-02 03-0402-03 05-0604-05 06-07 07-08

Table: 2.3
Unit: Million Tonnes/Year
REFINING CAPACITIES AS ON 30TH JUNE
Refinery 2003 2004 2005 2006 2007 2008 ACGR
Attock Refinery 1.66 1.66 1.80 1.82 1.82 1.96 --
Bosicor Refinery - 1.50 1.50 1.50 1.50 1.50 --
Dhodak Refinery 0.12 0.12 0.12 0.12 0.12 0.12 --
ENAR Petrotech Refinery 0.12 0.12 0.11
National Refinery 2.80 2.80 2.70 2.71 2.71 2.71 --
Pak-Arab Refinery 4.50 4.50 4.50 4.50 4.50 4.50 --
Pakistan Refinery 2.25 2.15 2.20 2.10 2.10 2.10 --
Total: 11.33 12.73 12.82 12.87 12.87 13.00 2.8%
Source: DG (Oil).
Unit: Tonnes
Table: 2.4
CRUDE OIL PROCESSED BY REFINERIES
TOE
Refinery 2002-03 2003-04 2004-05 2005-06 2006-07 2007-08 ACGR
Attock Refinery 1,691,076 1,631,448 1,885,407 1,870,744 1,836,244 1,926,779 2.6%
1,691,076 1,631,448 1,885,407 1,870,744 1,836,244 1,926,779
Bosicor Refinery - 164,928 536,983 673,537 712,240 817,739
170,503 555,114 696,303 736,218 845,345
Dhodak Refinery * 97,677 100,001 101,490 105,406 100,918 64,164 -8.1%
97,677 100,001 101,490 105,406 100,918 64,164
ENAR Petrotech Refinery 94,242 99,797
91,763 97,172
National Refinery 2,581,595 2,602,335 2,741,948 2,769,636 2,792,545 2,733,798 1.2%
2,655,291 2,679,678 2,820,682 2,851,154 2,871,498 2,810,119
Pak-Arab Refinery 3,198,714 3,921,569 3,913,373 3,787,429 3,723,769 3,868,218 3.9%
3,306,831 4,042,011 4,031,029 3,903,939 3,836,655 3,987,467
Pakistan Refinery 2,188,077 2,049,746 2,154,971 2,143,928 1,983,317 2,179,497 -0.1%
2,246,815 2,109,410 2,223,374 2,210,826 2,042,603 2,242,213
Total: 9,757,139 10,470,027 11,334,172 11,350,680 11,243,275 11,689,992 3.7%
9,997,690 10,733,052 11,617,097 11,638,372 11,515,899 11,973,259
Annual growth rate 1.83% 7.31% 8.25% 0.15% -0.95% 3.97%
* Dhodak refinery processes condensate produced at Dhodak field. Also see footnote of Table 2.5.4.
Source: Oil Refineries & OGDC.

Table: 2.5
Unit: Tonnes
OIL REFINERIES PRODUCTION
TOE
Energy Products 2002-03 2003-04 2004-05 2005-06 2006-07 2007-08 ACGR
Motor Spirit 1,063,154 1,279,347 1,325,922 1,186,403 1,218,137 1,337,324 4.7%
1,135,874 1,366,854 1,416,615 1,267,553 1,301,458 1,428,797
Kerosene 284,208 240,632 202,742 208,838 207,373 219,208 -5.1%
293,189 248,236 209,149 215,437 213,926 226,135
HOBC 11,879 11,085 9,947 9,225 9,772 10,104 -3.2%
12,630 11,786 10,576 9,808 10,390 10,743
HSD 2,720,049 3,051,146 3,440,161 3,283,141 3,235,050 3,562,352 5.5%
2,859,588 3,207,670 3,616,641 3,451,566 3,401,008 3,745,100
LDO 216,603 210,834 163,044 135,591 147,753 134,985 -9.0%
225,657 219,647 169,859 141,259 153,929 140,627
FO 3,062,955 3,057,843 3,131,706 3,357,833 3,192,649 3,324,062 1.6%
2,982,399 2,977,422 3,049,342 3,269,522 3,108,682 3,236,639
Aviation Fuels 857,073 996,957 1,184,897 1,258,365 1,165,280 1,008,585 3.3%
886,889 1,031,763 1,226,052 1,300,292 1,205,685 1,045,781
Naphtha 662,705 666,644 796,032 845,632 925,409 942,090 7.3%
708,034 712,242 850,481 903,473 988,707 1,006,529
LPG 205,044 225,399 219,483 212,974 212,178 214,791 0.9%
221,837 243,859 237,459 230,417 229,555 232,382
Energy Products Total: 9,083,670 9,739,887 10,473,934 10,498,002 10,313,601 10,753,500 3.4%
9,326,096 10,019,479 10,786,173 10,789,327 10,613,340 11,072,733
Annual growth rate 0.62% 7.22% 7.54% 0.23% -1.76% 4.27%
Non-Energy Products
Lube Oil 176,578 178,887 187,892 199,327 206,121 202,983 2.8%
Solvent Oil 2,097 2,674 1,561 578 10,017 13,137 44.3%
MTT 16,729 14,200 14,043 12,560 13,899 8,148 -13.4%
JBO 4,200 4,871 6,095 3,911 4,270 4,555 1.6%
Asphalt 227,938 294,798 307,108 295,996 276,481 295,856 5.4%
Process Oil 10 288 936 1,421 1,596 1,824
Carbon Oil 6,678 - - -
Wax 3,456 3,808 6,141 4,604 7,013 9,874 23.4%
Sulphur 19,169 24,358 22,388 21,228 17,964 17,661 -1.6%
P.M.B. - 4,333 3,565 6,301 8,209 5,276
Non-Energy Products Total: 456,855 528,217 549,729 545,926 545,570 559,314 4.1%
Annual growth rate 19.68% 15.62% 4.07% -0.69% -0.07% 2.52%
Total Products: 9,540,525 10,268,104 11,023,663 11,043,928 10,859,171 11,312,814 3.5%
Annual growth rate 1.39% 7.63% 7.36% 0.18% -1.67% 4.18%
CRUDE PROCESSED
Local 2,640,258 2,688,234 2,963,615 2,839,085 3,104,132 3,231,663 4.1%
Imported 7,116,881 7,781,793 8,370,557 8,511,595 8,139,143 8,458,329 3.5%
Total Crude: 9,757,139 10,470,027 11,334,172 11,350,680 11,243,275 11,689,992 3.7%
Note: See tables 2.5.1 to 2.5.5 for production by each refinery.
Source: Oil Refineries.

Table 2.5.1
Unit: Tonnes
Production by Attock Refinery Ltd.
TOE
Energy Products 2002-03 2003-04 2004-05 2005-06 2006-07 2007-08 ACGR
Motor Spirit 247,345 280,582 328,560 275,410 293,560 338,891 6.5%
264,263 299,774 351,034 294,248 313,640 362,071
Kerosene 78,653 60,526 65,262 58,028 62,476 64,234 -4.0%
81,138 62,439 67,324 59,862 64,450 66,264
HSD 386,314 388,633 420,628 422,430 440,316 522,640 6.2%
406,132 408,570 442,206 444,101 462,904 549,451
LDO 10,317 6,910 3,021 2,259 4,065 4,467 -15.4%
10,748 7,199 3,147 2,353 4,235 4,654
FO 476,869 390,228 482,994 494,094 448,377 439,025 -1.6%
464,327 379,965 470,291 481,099 436,585 427,479
Aviation Fuels 165,706 190,217 249,296 252,756 223,392 203,841 4.2%
171,543 196,938 258,188 261,696 232,594 212,142
Naphtha 195,330 150,672 155,608 211,898 204,098 210,923 1.5%
208,691 160,978 166,252 226,392 218,058 225,350
LPG 5,211 7,277 8,215 6,996 8,014 6,357 4.1%
5,638 7,873 8,888 7,569 8,670 6,878
Energy Products Total: 1,565,745 1,475,045 1,713,584 1,723,871 1,684,298 1,790,378 2.7%
1,612,480 1,523,735 1,767,330 1,777,320 1,741,136 1,854,289
Non-Energy Products
Lube Oil -
Asphalt 57,800 85,467 87,736 82,747 56,874 60,330 0.9%
Solvent Oil 2,097 2,674 1,561 578 639 1,031 -13.2%
MTT 10,184 12,262 12,937 12,560 13,899 8,148 -4.4%
JBO 4,200 4,871 6,095 3,911 4,270 4,555 1.6%
P.M.B. - 4,333 3,565 6,301 8,209 5,276
Non-Energy Products Total: 74,281 109,607 111,894 106,097 83,891 79,340 1.3%
Total Products: 1,640,026 1,584,652 1,825,478 1,829,968 1,768,189 1,869,718 2.7%
Annual growth rate 1.82% -3.38% 15.20% 0.25% -3.38% 5.74%
CRUDE PROCESSED
Local 1,691,076 1,631,448 1,885,407 1,870,744 1,836,244 1,926,779 2.6%
Imported - - - - - -
Total Crude: 1,691,076 1,631,448 1,885,407 1,870,744 1,836,244 1,926,779 2.6%
Source: Attock Refinery Ltd.

Table: 2.5.2
Unit: Tonnes
Production by Bosicor Refinery Ltd.
TOE
Energy Products 2002-03 2003-04 2004-05 2005-06 2006-07 2007-08 ACGR
Naphtha - 26,345 42,793 36,706 29,202 44,700
28,147 45,720 39,217 31,199 47,757
MS - - 37,753 51,643 53,378 49,858
40,335 55,175 57,029 53,268
Kerosene - 1,739 900
1,794 928
HSD - 52,715 180,491 241,934 234,727 280,331
55,419 189,750 254,345 246,768 294,712
LDO - 847 3,027 3,143 3,143 4,045
882 3,154 3,274 3,274 4,214
FO - 81,555 259,452 318,970 354,543 396,144
79,410 252,628 310,581 345,219 385,725
LPG 17 684 2,755
18 740 2,981
Total: 163,201 524,416 652,413 675,677 777,833
165,653 532,516 662,611 684,230 788,658
Non-Energy Products
Solvent Oil - - - - 9,378 12,106
Non-Energy Products Total: 9,378 12,106
Total Products: 163,201 524,416 652,413 685,055 789,939
Annual growth rate 221.33% 24.41% 5.00% 15.31%
CRUDE PROCESSED
Local - - 550 - 2,836 1,008
Imported - 164,928 536,433 673,537 709,404 816,731
Total Crude: 164,928 536,983 673,537 712,240 817,739
Source: Bosicor Refinery Limited.

Table: 2.5.3
Unit: Tonnes
Production by Dhodak Refinery Ltd.
TOE
Energy Products 2002-03 2003-04 2004-05 2005-06 2006-07 2007-08 ACGR
Motor Spirit - - - - 753
804
Kerosene 15,275 16,072 14,474 13,263 12,597 7,989 -12.2%
15,758 16,580 14,931 13,682 12,995 8,241
HSD 8,840 7,799 7,432 9,320 9,580 5,683 -8.5%
9,293 8,200 7,813 9,798 10,072 5,974
Naphtha 73,548 75,969 79,145 82,410 79,033 50,732 -7.2%
78,579 81,165 84,559 88,047 84,439 54,202
Total: 97,663 99,840 101,051 104,993 101,210 65,156 -7.8%
103,630 105,944 107,303 111,527 107,505 69,221
CRUDE PROCESSED
Local 97,677 100,001 101,490 105,406 100,918 64,164 -8.1%
Total Crude: 97,677 100,001 101,490 105,406 100,918 64,164 -8.1%
Source: OGDCL.
PRODUCTION BY OIL REFINERIES
2007-08
MS+HOBC11.9%
Kerosene1.9%
Diesel Oil32.7%
FO29.4%
Aviation Fuels8.9%
Naphtha8.3%
Non-Energy4.9%
LPG1.9%
Total: 11.31 Million Tonnes
Figure 2.2

Table: 2.5.4
Unit: Tonnes
Production by National Refinery Ltd.
TOE
Energy Products 2002-03 2003-04 2004-05 2005-06 2006-07 2007-08 ACGR
Motor Spirit 137,417 157,576 157,837 130,765 141,746 137,243 0.0%
146,816 168,354 168,633 139,709 151,441 146,630
Kerosene 23,342 13,827 5,127 7,568 7,974 14,643 -8.9%
24,080 14,264 5,289 7,807 8,226 15,106
HSD 737,443 754,558 827,407 805,805 794,118 847,869 2.8%
775,274 793,267 869,853 847,143 834,856 891,365
LDO 176,701 154,813 106,332 94,182 101,547 93,582 -11.9%
184,087 161,284 110,777 98,119 105,792 97,494
FO 582,725 577,822 564,683 641,974 587,871 507,992 -2.7%
567,399 562,625 549,832 625,090 572,410 494,632
Aviation Fuels 191,416 203,673 222,028 232,481 238,661 178,233 -1.4%
198,143 211,116 230,131 240,009 247,642 184,902
Naphtha 240,869 275,339 358,394 314,570 338,440 348,336 7.7%
257,344 294,172 382,908 336,087 361,589 372,162
LPG 15,239 17,797 19,722 16,882 19,827 15,192 -0.1%
16,487 19,255 21,337 18,265 21,451 16,436
Energy Products Total: 2,105,152 2,155,405 2,261,530 2,244,227 2,230,184 2,143,090 0.4%
2,169,631 2,224,337 2,338,760 2,312,229 2,303,408 2,218,726
Non-Energy Products
JBO - - - - -
Lube Oil 176,578 178,887 187,892 199,327 206,121 202,983 2.8%
Asphalt 170,138 209,331 219,372 213,249 219,607 235,526 6.7%
Process Oil 10 288 936 1,421 1,596 1,824 183.3%
Carbon Oil 6,678 - - -
BTX - - - 5 -5 -11
Wax 3,456 3,808 6,141 4,604 7,013 9,874 23.4%
Non-Energy Products Total: 356,860 392,314 414,341 418,606 434,332 450,196 4.8%
Total Products: 2,462,012 2,547,719 2,675,871 2,662,833 2,664,516 2,593,286 1.0%
Annual growth rate 3.72% 3.48% 5.03% -0.49% 0.06% -2.67%
Crude Processed
Local 401,241 314,066 412,536 357,870 456,651 475,787 3.5%
Imported 2,180,354 2,288,269 2,329,412 2,411,766 2,335,894 2,258,011 0.7%
Total Processed 2,581,595 2,602,335 2,741,948 2,769,636 2,792,545 2,733,798 1.2%
Source: National Refinery Ltd.

Table: 2.5.5
Unit: Tonnes
Production by Pak-Arab Refinery Ltd.
TOE
Energy Products 2002-03 2003-04 2004-05 2005-06 2006-07 2007-08 ACGR
Motor Spirit 528,268 712,281 670,936 597,433 632,995 702,732 5.9%
564,402 761,001 716,828 638,297 676,292 750,799
Kerosene 139,914 125,938 91,447 106,099 102,325 106,543 -5.3%
144,335 129,918 94,337 109,452 105,558 109,910
HOBC 11,879 11,085 9,947 9,225 9,772 10,104 -3.2%
12,630 11,786 10,576 9,808 10,390 10,743
HSD 913,411 1,275,541 1,373,277 1,253,677 1,255,738 1,314,500 7.6%
960,269 1,340,976 1,443,726 1,317,991 1,320,157 1,381,934
LDO 29,585 48,264 50,664 36,007 38,998 32,891 2.1%
30,822 50,281 52,782 37,512 40,628 34,266
FO 1,110,927 1,138,016 938,858 988,891 975,299 1,018,623 -1.7%
1,081,710 1,108,086 914,166 962,883 949,649 991,833
Aviation Fuels 279,650 352,677 451,923 472,831 405,765 382,409 6.5%
288,487 363,822 466,204 487,772 418,587 395,097
LPG 135,291 147,894 146,667 145,633 147,381 150,300 2.1%
146,371 160,007 158,679 157,560 159,452 162,610
Total Products: 3,148,925 3,811,696 3,733,719 3,609,796 3,568,273 3,718,102 3.4%
3,229,025 3,925,876 3,857,297 3,721,276 3,680,713 3,837,191
Non-Energy Products
Sulphur 19,169 24,358 22,388 21,228 17,964 17,661 -1.6%
Non-Energy Products Total: 19,169 24,358 22,388 21,228 17,964 17,661 -1.6%
Total Products: 3,168,094 3,836,054 3,756,107 3,631,024 3,586,237 3,735,763 3.4%
Crude Processed
Local 358,187 432,421 340,377 383,937 340,138
Imported 3,198,714 3,563,382 3,480,952 3,447,052 3,339,832 3,528,080 2.0%
Total Processed 3,198,714 3,921,569 3,913,373 3,787,429 3,723,769 3,868,218 3.9%
Source: Pak-Arab Refinery Ltd.

Table: 2.5.6
Unit: Tonnes
Production by Pakistan Refinery Ltd.
TOE
Energy Products 2002-03 2003-04 2004-05 2005-06 2006-07 2007-08 ACGR
Motor Spirit 150,124 128,908 130,836 131,152 96,458 107,847 -6.4%
160,392 137,725 139,785 140,123 103,056 115,224
Kerosene 27,024 22,530 25,532 23,880 17,308 19,003 -6.8%
27,878 23,242 26,339 24,635 17,855 19,603
HSD 674,041 571,900 630,926 549,975 479,587 568,494 -3.3%
708,619 601,238 663,293 578,189 504,190 597,658
FO 892,434 870,222 885,719 913,904 804,349 942,207 1.1%
868,963 847,335 862,425 889,868 783,195 917,427
Aviation Fuels 220,301 250,390 261,650 300,297 285,061 231,536 1.0%
228,716 259,887 271,529 310,814 294,069 240,678
Naphtha 152,958 138,319 160,092 200,048 240,342 252,167 10.5%
163,420 147,780 171,042 213,731 256,781 269,415
LPG 49,303 52,431 44,879 43,446 36,272 40,187 -4.0%
53,341 56,725 48,555 47,004 39,243 43,478
Energy Products Total: 2,166,185 2,034,700 2,139,634 2,162,702 1,959,377 2,161,441 0.0%
2,211,330 2,073,933 2,182,967 2,204,364 1,998,388 2,203,483
Non-Energy Products
MTT 6,545 1,938 1,106 - - -
Non-Energy Products Total: 6,545 1,938 1,106
Total Products: 2,172,730 2,036,638 2,140,740 2,162,702 1,959,377 2,161,441 -0.1%
Annual growth rate 18.09% -6.26% 5.11% 1.03% -9.40% 10.31%
CRUDE PROCESSED
Local 450,264 284,532 131,211 164,688 229,304 323,990 -6.4%
Imported 1,737,813 1,765,214 2,023,760 1,979,240 1,754,013 1,855,507 1.3%
Total Crude: 2,188,077 2,049,746 2,154,971 2,143,928 1,983,317 2,179,497 -0.1%
Source: Pakistan Refinery Ltd.

Table: 2.5.7
Unit: Tonnes
Production by ENAR Petroleum Refining Facility (EPRF)
TOE
Energy Products 2002-03 2003-04 2004-05 2005-06 2006-07 2007-08 ACGR
Naphtha - - - - 34,294 35,232
36,640 37,642
Kerosene - - - - 4,693 6,796
4,841 7,011
HSD - - - - 20,984 22,835
22,060 24,006
FO - - - - 22,210 20,071
21,626 19,543
Aviation Fuels - - - - 12,401 12,566
12,793 12,963
Total: 94,582 97,500
97,960 101,165
CRUDE PROCESSED
Local - - - - 94,242 99,797
Imported - - - - - -
Total Crude: 94,242 99,797
Source: DG(Oil).

Table: 2.6
Unit: Tonnes
PETROLEUM ENERGY PRODUCTS CONSUMPTION BY FUEL
TOE
Energy Products 2002-03 2003-04 2004-05 2005-06 2006-07 2007-08 ACGR
Aviation Fuels 570,435 640,809 716,920 718,537 715,766 575,493 0.2%
591,323 664,374 743,379 744,716 742,287 596,674
Motor Spirit 87 RON 1,086,708 1,232,576 1,320,596 1,178,743 1,138,878 1,449,864 5.9%
1,161,039 1,316,884 1,410,925 1,259,369 1,216,777 1,549,035
HOBC 11,634 11,099 9,942 8,787 9,008 9,706 -3.6%
12,369 11,800 10,570 9,342 9,577 10,319
Kerosene 311,708 258,899 232,447 235,540 210,895 228,610 -6.0%
321,558 267,080 239,792 242,983 217,559 235,834
HSD 6,980,981 7,253,375 7,684,996 7,299,135 7,246,776 8,225,663 3.3%
7,339,105 7,625,473 8,079,236 7,673,581 7,618,536 8,647,640
LDO 220,654 200,735 153,871 126,070 137,200 115,197 -12.2%
229,877 209,126 160,303 131,340 142,935 120,012
Furnace Oil 7,269,834 3,823,620 4,552,488 5,059,872 7,388,608 7,475,886 0.6%
7,078,637 3,723,059 4,432,758 4,926,797 7,194,288 7,279,270
Energy Products-Total: 16,451,954 13,421,113 14,671,260 14,626,684 16,847,131 18,080,419 1.9%
16,733,909 13,817,797 15,076,964 14,988,128 17,141,959 18,438,785
Annual growth rate -3.00% -18.42% 9.31% -0.30% 15.18% 7.32%
Unit: Tonnes
Non-Energy Products 2002-03 2003-04 2004-05 2005-06 2006-07 2007-08 ACGR
Asphalt 229,277 264,670 293,353 459,778 443,682 289,440 4.8%
JBO 4,230 5,414 6,092 3,915 4,185 4,414 0.9%
MTT 16,411 14,298 14,791 13,070 13,586 8,055 -13.3%
Solvent Oil 8,119 7,152 5,338 18,021 10,324 13,300 10.4%
Carbon Oil 1,455 - - - - -
Process Oil 10 - - 1,182 1,452 1,659 178.0%
Lubes 118,875 121,156 132,113 134,192 124,136 129,633 1.7%
Greases 1,197 1,134 1,343 1,490 1,417 1,420 3.5%
Non-Energy Total: 379,574 413,824 453,030 631,648 598,782 447,921 3.4%
Annual growth rate 24.72% 9.02% 9.47% 39.43% -5.20% -25.19%
Source: OCAC.

Table: 2.7
Unit: Tonnes
PETROLEUM ENERGY PRODUCTS CONSUMPTION BY SECTOR
TOE
Sector 2002-03 2003-04 2004-05 2005-06 2006-07 2007-08 ACGR
Domestic 282,521 231,459 192,750 128,651 106,148 120,961 -15.6%
291,449 238,773 198,841 132,716 109,502 124,781
Industrial * 1,604,068 1,493,080 1,542,398 1,681,517 1,595,981 1,071,191 -7.8%
1,584,771 1,481,873 1,533,234 1,703,633 1,623,346 1,082,885
Agriculture ** 196,747 183,506 142,062 81,896 97,232 109,351 -11.1%
204,842 191,080 148,008 85,351 101,406 113,889
Transport *** 8,082,273 8,464,042 9,024,783 8,156,831 7,981,893 9,384,482 3.0%
8,505,689 8,909,350 9,498,485 8,582,717 8,399,371 9,881,537
Power 6,019,958 2,739,763 3,452,581 4,218,982 6,740,559 7,083,933 3.3%
5,868,192 2,672,432 3,366,043 4,110,527 6,566,628 6,910,062
Other Government 266,387 309,263 316,686 358,807 325,318 310,501 3.1%
278,967 324,288 332,352 373,184 341,705 325,631
Total: 16,451,954 13,421,113 14,671,260 14,626,684 16,847,131 18,080,419 1.9%
16,733,909 13,817,797 15,076,964 14,988,128 17,141,959 18,438,785
Annual growth rate -3.00% -18.42% 9.31% -0.30% 15.18% 7.32%
* Include consumption in cement manufacturing industry:
Tonnes 367,898 296,605 250,428 207,614 209,775 152,014 -16.2%
TOE 359,942 290,816 245,750 204,420 206,116 149,452
** HSD consumption for tractors in agriculture sector is not separately available and is included in the transport sector. Agriculture
sector represents LDO on 10,431,996 10,681,350 11,218,679 10,407,702 10,106,572 10,996,486
*** Include MTBE used in road transport.
Source: OCAC.
Unit:
Table: 2.8
PETROLEUM ENERGY PRODUCTS CONSUMPTION BY PROVINCE
TOE
Province 2002-03 2003-04 2004-05 2005-06 2006-07 2007-08 ACGR
Punjab 9,760,023 7,938,372 8,592,985 8,192,878 9,454,915 10,174,269 0.8%
Sindh 4,544,408 3,547,229 4,051,824 4,262,858 4,213,195 4,619,081 0.3%
NWFP 1,146,391 1,241,454 1,290,377 1,305,763 1,502,377 1,649,405 7.5%
Balochistan 1,134,647 889,518 918,548 1,085,153 1,838,082 1,845,742 10.2%
A.J. Kashmir 148,439 201,224 223,229 141,476 133,390 150,288 0.2%
Total: 16,733,909 13,817,797 15,076,964 14,988,128 17,141,959 18,438,785 2.0%
Annual growth rate -2.90% -17.43% 9.11% -0.59% 14.37% 7.57%
Source: OCAC.

Table: 2.9PETROLEUM PRODUCTS CONSUMPTION BY SECTOR (2007-08)
Unit: TonnesTOE
Energy Products Domestic Industry Agriculture Transport Power Other Govt. Total
Aviation Fuel - - - 423,544 - 151,949 575,493436,928 159,746 596,674
Motor Spirit - 7,581 - 1,424,795 215 17,273 1,449,8648,100 1,522,251 230 18,454 1,549,035
HOBC - 36 - 7,840 - 1,830 9,70638 8,335 0 1,946 10,319
Kerosene 120,916 86,862 0 482 - 20,350 228,610124,737 89,607 0 497 0 20,993 235,834
HSD * - 435,289 0 7,521,606 159,976 108,792 8,225,6630 457,619 0 7,907,464 168,183 114,373 8,647,640
LDO - 4,952 108,867 134 35 1,209 115,1975,159 113,418 140 36 1,260 120,012
Furnace Oil 45 536,471 484 6,081 6,923,707 9,098 7,475,88644 522,362 471 5,921 6,741,614 8,859 7,279,270
Energy Products-Total: 120,961 1,071,191 109,351 9,384,482 7,083,933 310,501 18,080,419124,781 1,082,885 113,889 9,881,537 6,910,062 325,631 18,438,785
80.15%Unit: Tonnes
Non-Energy Products Domestic Industry Agriculture Transport Power Others Total
Asphalt 0 226,559 - - - 62,881 289,440
JBO - 4,414 - 0 0 - 4,414
MTT - 8,047 - 8 - 0 8,055
Solvent Oil - 13,300 - 0 0 - 13,300
Process Oil - 1,659 - - - - 1,659
Lubes - 39,016 0 80,224 7,026 3,367 129,633
Greases - 1,295 - 65 14 46 1,420
Non-Energy Total: 0 294,290 0 80,297 7,040 66,294 447,921
* HSD consumption for tractors in agriculture sector is not separately available and is included in the transport sector. Agriculture sector represents LDO only.Source: OCAC.

Table: 2.10SECTORAL CONSUMPTION OF POL PRODUCTS BY PROVINCE (2007-08)
Unit: TonnesTOE
Energy Products Domestic Industry Agriculture Transport Power Other Govt. Total
Punjab 86,036 573,840 101,450 5,131,082 3,997,678 84,985 9,975,07188,755 580,645 105,658 5,406,918 3,903,793 88,501 10,174,269
Sindh 18,865 302,315 6,666 2,564,444 1,450,097 167,817 4,510,20419,459 306,462 6,945 2,696,579 1,412,951 176,685 4,619,081
N.W.F.P. 13,746 152,805 1,152 1,349,525 1,835 56,520 1,575,58314,180 152,645 1,200 1,420,252 1,923 59,205 1,649,405
Balochistan 1,941 35,343 83 204,133 1,634,323 1,179 1,877,0022,002 35,892 86 215,127 1,591,395 1,239 1,845,742
Azad Kashmir 373 6,888 0 135,298 - 0 142,559385 7,241 0 142,661 - 0 150,288
Energy Products-Total: 120,961 1,071,191 109,351 9,384,482 7,083,933 310,501 18,080,419124,781 1,082,885 113,889 9,881,537 6,910,062 325,631 18,438,785
Unit: TonnesNon-Energy Products Domestic Industry Agriculture Transport Power Others Total
Punjab - 175,145 0 43,857 4,142 24,109 247,253Sindh 0 101,856 - 25,905 2,069 19,379 149,209N.W.F.P. - 14,311 - 5,866 547 10,608 31,332Balochistan - 2,680 - 3,870 282 6,882 13,714Azad Kashmir - 298 - 799 - 5,316 6,413
Non-Energy Total: 0 294,290 0 80,297 7,040 66,294 447,921
Source: OCAC.

Table: 2.11
Unit: Qty. in Tonnes
IMPORT OF CRUDE OIL
Qty. in TOE
(Value in Million US$)
Refinery 2002-03 2003-04 2004-05 2005-06 2006-07 2007-08 ACGR
Bosicor Refinery - 211,333 546,378 696,348 712,719 790,760
220,167 564,846 719,885 736,809 817,488
(50.19) (168.25) (304.37) (323.88) (550.59)
Pakistan Refinery 1,020,558 781,385 854,828 910,574 783,679 849,852 -3.6%
1,055,053 807,796 883,721 941,351 810,167 878,577
(201.61) (178.81) (284.85) (413.49) (367.07) (567.72)
National Refinery 3,240,942 2,472,785 2,373,681 2,393,069 2,365,249 2,223,469 -7.3%
3,350,486 2,556,365 2,453,911 2,473,955 2,445,194 2,298,622
(636.79) (559.41) (733.59) (1,042.43) (1,087.35) (1,518.52)
PARCO 2,881,473 4,369,758 4,502,413 4,600,579 4,364,385 4,559,532 9.6%
2,978,867 4,517,456 4,654,595 4,756,079 4,511,901 4,713,644
(562.09) (1,012.63) (1,418.90) (2,042.51) (1,998.44) (3,104.03)
Total: 7,142,973 7,835,261 8,277,300 8,600,570 8,226,032 8,423,613 3.4%
7,384,405 8,101,783 8,557,073 8,891,269 8,504,072 8,708,331
(1,400.49) (1,801.04) (2,605.58) (3,802.81) (3,776.74) (5,740.86)
Annual growth rate of Qty. 0.96% 9.69% 5.64% 3.91% -4.35% 2.40%
Source: Oil refineries, OCAC, DG(Oil).
294,305 364,863
IMPORT OF PETROLEUM PRODUCTS
Table: 2.12
Unit: Qty. in Tonnes
Qty. in TOE
(Value in Million US$)
Products 2002-03 2003-04 2004-05 2005-06 2006-07 2007-08 ACGR
100/LL 48,680 121,499
0 0 0 50,729 126,614
(31.83) (122.75)
HSD 4,103,623 4,504,053 4,219,632 4,103,787 3,972,081 4,507,873 1.9%
4,314,139 4,735,111 4,436,09 9 4,314,311 4,175,849 4,739,127
(936.28) (1,192.02) (1,707.85) (2,205.60) (2,282.89) (3,863.08)
High Sulphur Furnace Oil 4,067,964 665,592 1,456,353 1,905,614 4,109,776 3,921,425 -0.7%
3,960,977 648,087 1,418,051 1,855,496 4,001,689 3,818,292
(707.71) (125.51) (290.41) (643.02) (1,283.00) (1,913.94)
Low Sulphur Furnace Oil * 265,474 - - - 199,322 346,906 5.5%
258,492 194,080 337,782
(51.74) (73.65) (199.76)
Motor Spirit - - - - 127,386
136,099
(106.44)
Total: 8,437,061 5,169,645 5,675,985 6,009,401 8,329,859 9,025,089 1.4%
8,533,607 5,383,198 5,854,150 6,169,808 8,422,347 9,157,914
(1,695.73) (1,317.53) (1,998.26) (2,848.62) (3,671.36) (6,205.97)
Annual growth rate of Qty. -6.49% -38.73% 9.79% 5.87% 38.61% 8.35%
* For convenience of calculations, the conversion factors for HSFO and LSFO has been assumed as same.
Source: DG(Oil). 13,004,906
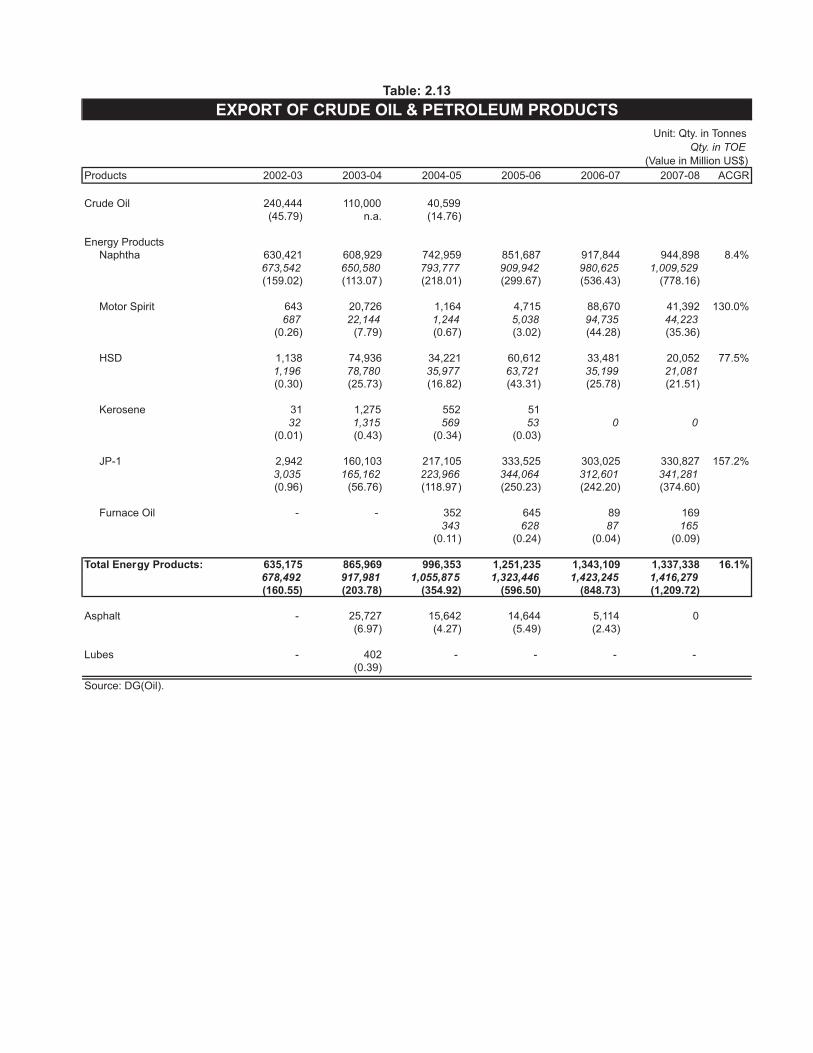
EXPORT OF CRUDE OIL & PETROLEUM PRODUCTS
Unit: Qty. in Tonnes
Qty. in TOE
(Value in Million US$)
Products 2002-03 2003-04 2004-05 2005-06 2006-07 2007-08 ACGR
Crude Oil 240,444 110,000 40,599
(45.79) n.a. (14.76)
Energy Products
Naphtha 630,421 608,929 742,959 851,687 917,844 944,898 8.4%
673,542 650,580 793,777 909,942 980,625 1,009,529
(159.02) (113.07) (218.01) (299.67) (536.43) (778.16)
Motor Spirit 643 20,726 1,164 4,715 88,670 41,392 130.0%
687 22,144 1,244 5,038 94,735 44,223
(0.26) (7.79) (0.67) (3.02) (44.28) (35.36)
HSD 1,138 74,936 34,221 60,612 33,481 20,052 77.5%
1,196 78,780 35,977 63,721 35,199 21,081
(0.30) (25.73) (16.82) (43.31) (25.78) (21.51)
Kerosene 31 1,275 552 51
32 1,315 569 53 0 0
(0.01) (0.43) (0.34) (0.03)
JP-1 2,942 160,103 217,105 333,525 303,025 330,827 157.2%
3,035 165,162 223,966 344,064 312,601 341,281
(0.96) (56.76) (118.97) (250.23) (242.20) (374.60)
Furnace Oil - - 352 645 89 169
343 628 87 165
(0.11) (0.24) (0.04) (0.09)
Total Energy Products: 635,175 865,969 996,353 1,251,235 1,343,109 1,337,338 16.1%
678,492 917,981 1,055,875 1,323,446 1,423,245 1,416,279
(160.55) (203.78) (354.92) (596.50) (848.73) (1,209.72)
Asphalt - 25,727 15,642 14,644 5,114 0
(6.97) (4.27) (5.49) (2.43)
Lubes - 402 - - - -
(0.39)
Source: DG(Oil).
Table: 2.13

Table: 2.14
Unit: Qty. in Tonnes
BUNKERING OF PETROLEUM PRODUCTS
Qty. in TOE
(Value in Million US$)
Products 2002-03 2003-04 2004-05 2005-06 2006-07 2007-08 ACGR
JP-1 275,588 138,451 162,731 206,724 171,032 164,390 -9.8%
284,297 142,826 167,873 213,256 176,437 169,585
(84.19) (45.38) (79.23) (144.77) (123.58) (164.12)
Motor Spirit 5,345 368 594 - - -
5,711 393 635
(2.11) (0.16) (0.34)
Kerosene 1,384 - - - - 12 -61.3%
1,428 12
(0.41) (0.01)
HSD 31,654 2,573 22,418 15,904 4,929 283 -61.1%
33,278 2,705 23,568 16,720 5,182 298
(9.44) (1.04) (11.29) (12.50) (3.09) (0.29)
LDO 244 273 666 8,125 12,954 12,209 118.7%
254 284 694 8,465 13,495 12,719
(0.09) (0.09) (0.21) (4.36) (7.04) (7.07)
Furnace Oil 10,429 11,871 39,527 56,089 85,131 120,313 63.1%
10,155 11,559 38,487 54,614 82,892 117,149
(2.53) (2.15) (9.20) (19.80) (27.81) (59.48)
Total: 324,644 153,536 225,936 286,842 274,046 297,207 -1.8%
335,122 157,767 231,257 293,055 278,006 299,763
(98.77) (48.82) (100.27) (181.43) (161.52) (230.97)
Source: DG(Oil).

Unit: Rupees/Litre
Petroleum OMCs Inland Price
Effective Ex-Refinery Customs/ Develop'nt Distribution Dealer's Freight Differencial Fixed
Date Price Exise Duty Levy Margin Commission Margin Claim GST Sale Price
01.07.2001 14.88 0.88 13.10 0.90 1.17 2.87 5.07 38.86
16.07.2001 14.03 0.88 13.10 0.88 1.13 2.87 4.93 37.82
01.08.2001 13.73 0.88 13.10 0.87 1.12 2.87 4.89 37.46
16.08.2001 13.91 0.88 13.10 0.87 1.13 2.87 4.91 37.67
01.09.2001 13.61 0.88 13.10 0.81 1.05 0.85 4.55 34.85
16.09.2001 14.23 0.88 13.10 0.83 1.07 0.85 4.64 35.60
01.10.2001 13.91 0.88 13.10 0.85 1.09 1.90 4.76 36.49
16.10.2001 12.27 0.88 13.10 0.80 1.03 1.90 4.50 34.48
01.11.2001 11.92 0.88 13.10 0.80 1.03 2.11 4.48 34.32
16.11.2001 11.43 0.88 13.10 0.78 1.01 2.11 4.40 33.71
01.12.2001 10.82 0.88 13.10 0.76 0.99 2.11 4.30 32.96
16.12.2001 10.86 0.88 13.10 0.76 0.99 2.07 4.30 32.96
01.01.2002 11.29 0.88 13.35 0.78 1.01 2.07 4.41 33.79
16.01.2002 11.45 0.88 13.35 0.79 1.02 2.07 4.43 33.99
01.02.2002 11.51 0.88 13.35 0.79 1.02 2.01 4.43 33.99
16.02.2002 12.08 0.88 13.35 0.80 1.04 2.01 4.52 34.68
01.03.2002 12.24 0.88 13.35 0.81 1.05 2.01 4.55 34.89
16.03.2002 13.53 0.88 13.35 0.91 1.13 2.02 4.77 36.59
02.04.2002 14.16 0.88 12.62 0.98 1.16 2.02 4.77 36.59
16 04 2002 14 83 0 88 11 85 1 04 1 20 2 02 4 77 36 59
Table: 2.15.1
HOBC SALE PRICE
01.05.2002 13.96 0.88 12.47 1.10 1.24 2.17 4.77 36.59
16.05.2002 13.77 0.88 13.69 1.20 1.31 2.17 4.95 37.97
01.06.2002 13.83 0.88 13.69 1.27 1.35 2.32 5.00 38.34
16.06.2002 13.19 0.88 13.69 1.32 1.37 2.37 4.92 37.74
01.07.2002 13.40 0.88 13.69 1.34 1.53 2.37 4.98 38.19
16.07.2002 13.31 0.88 13.69 1.33 1.52 2.37 4.97 38.07
01.08.2002 13.52 0.88 13.69 1.34 1.53 2.37 5.00 38.33
16.08.2002 13.42 0.88 13.69 1.34 1.54 2.52 5.01 38.40
01.09.2002 13.74 0.88 13.69 1.35 1.55 2.52 5.06 38.79
20.09.2002 14.13 0.88 13.51 1.37 1.57 2.57 5.10 39.13
02.10.2002 14.34 0.88 13.30 1.37 1.57 2.57 5.10 39.13
16.10.2002 14.18 0.88 14.25 1.40 1.60 2.57 5.23 40.11
01.11.2002 13.84 0.88 14.25 1.39 1.59 2.57 5.18 39.70
16.11.2002 13.05 0.88 12.63 1.28 1.46 2.57 4.78 36.65
01.12.2002 13.00 0.88 11.20 1.20 1.37 2.22 4.48 34.35
16.12.2002 13.63 0.88 11.20 1.22 1.39 2.13 4.57 35.02
01.01.2003 14.83 0.88 11.20 1.27 1.45 2.03 4.75 36.41
16.01.2003 14.94 0.88 11.20 1.27 1.46 2.03 4.77 36.55
01.02.2003 15.18 0.88 11.20 1.28 1.46 2.03 4.80 36.83
16.02.2003 16.44 0.88 11.20 1.33 1.52 2.03 5.01 38.41
01.03.2003 17.43 0.88 11.20 1.37 1.57 2.03 5.17 39.65
16.03.2003 18.49 0.88 11.20 1.44 1.64 2.10 5.36 41.11
01.04.2003 14.97 0.88 11.20 1.30 1.49 2.61 4.87 37.32
16.04.2003 12.78 0.88 11.20 1.21 1.38 2.64 4.51 34.60
01.05.2003 12.43 0.88 11.20 1.20 1.36 2.64 4.46 34.17
16.05.2003 11.77 0.88 11.20 1.13 1.29 1.90 4.23 32.40
Contd/...

Petroleum OMCs Inland Price
Effective Ex-Refinery Customs/ Develop'nt Distribution Dealer's Freight Differencial Fixed
Date Price Exise Duty Levy Margin Commission Margin Claim GST Sale Price
01.06.2003 12.77 0.88 11.20 1.17 1.34 1.90 4.39 33.65
16.06.2003 13.53 0.88 11.20 1.20 1.37 1.82 4.50 34.50
01.07.2003 13.81 0.88 11.20 1.22 1.39 1.82 4.55 34.87
16.07.2003 14.13 0.88 11.20 1.25 1.43 2.21 4.67 35.77
01.08.2003 14.13 0.88 11.20 1.25 1.43 2.21 4.67 35.77
16.08.2003 14.43 0.88 11.20 1.25 1.43 1.96 4.67 35.82
01.09.2003 14.53 0.88 11.20 1.26 1.44 2.00 4.70 36.01
16.09.2003 14.19 0.88 11.20 1.25 1.43 2.25 4.68 35.88
01.10.2003 13.72 0.88 11.20 1.23 1.41 2.25 4.60 35.29
16.10.2003 14.70 0.88 11.20 1.25 1.43 1.74 4.68 35.88
01.11.2003 15.16 0.88 11.20 1.27 1.45 1.74 4.76 36.46
16.11.2003 15.36 0.88 11.20 1.28 1.46 1.74 4.79 36.71
01.12.2003 15.90 0.88 11.20 1.30 1.49 1.74 4.88 37.39
16.12.2003 15.84 0.88 11.20 1.31 1.50 2.03 4.91 37.67
01.01.2004 16.28 0.88 10.28 1.31 1.50 2.51 4.91 37.67
16.01.2004 17.66 0.88 10.28 1.38 1.57 2.51 5.14 39.42
01.02.2004 17.54 0.88 10.28 1.37 1.57 2.51 5.12 39.27
07.02.2004 17.54 0.88 10.28 1.37 1.57 2.51 5.12 39.27
16.02.2004 15.96 0.88 11.20 1.34 1.53 2.51 5.01 38.43
01.03.2004 16.51 0.88 11.20 1.35 1.55 2.20 5.05 38.74
16.03.2004 16.85 0.88 11.20 1.36 1.55 2.05 5.08 38.97
HOBC SALE PRICE (Continued)
01.04.2004 16.78 0.88 11.20 1.34 1.53 1.59 5.00 38.32
16.04.2004 17.23 0.88 11.20 1.37 1.57 2.00 5.14 39.39
01.05.2004 17.88 0.88 11.20 1.43 1.63 2.52 5.33 40.87
16.05.2004 18.61 0.88 9.30 1.43 1.63 3.69 5.33 40.87
01.06.2004 19.30 0.88 8.39 1.43 1.63 3.91 5.33 40.87
16.06.2004 18.42 0.88 9.27 1.43 1.63 3.91 5.33 40.87
01.07.2004 17.74 0.88 10.13 1.43 1.63 3.73 5.33 40.87
16.07.2004 17.84 0.88 10.05 1.43 1.63 3.71 5.33 40.87
01.08.2004 18.71 0.88 9.18 1.43 1.63 3.71 5.33 40.87
16.08.2004 20.67 0.88 1.43 1.63 10.93 5.33 40.87
01.09.2004 21.41 0.88 1.43 1.63 10.93 -0.74 5.33 40.87
16.09.2004 20.36 0.88 1.43 1.63 11.24 5.33 40.87
01.10.2004 21.51 0.88 1.43 1.63 11.24 -1.15 5.33 40.87
16.10.2004 21.51 0.88 1.43 1.63 11.24 -1.15 5.33 40.87
01.11.2004 21.51 0.88 1.43 1.63 11.24 -1.15 5.33 40.87
16.11.2004 21.51 0.88 1.43 1.63 11.24 -1.15 5.33 40.87
01.12.2004 21.51 0.88 1.43 1.63 11.24 -1.15 5.33 40.87
16.12.2004 20.50 0.88 1.13 1.53 1.75 12.24 5.70 43.73
01.01.2005 19.82 0.88 2.50 1.56 1.78 12.23 5.82 44.59
16.01.2005 19.09 0.88 10.76 1.56 1.78 4.70 5.82 44.59
02.02.2005 20.60 0.88 12.52 1.65 1.89 3.61 6.17 47.32
16.02.2005 21.12 0.88 10.09 1.65 1.89 5.52 6.17 47.32
01.03.2005 22.40 0.88 10.10 1.71 1.95 5.52 6.38 48.94
16.03.2005 23.65 0.88 1.76 2.02 5.52 10.10 6.59 50.52
01.04.2005 24.71 0.88 1.76 2.02 4.26 10.30 6.59 50.52
16.04.2005 24.68 0.88 1.76 2.02 4.56 10.03 6.59 50.52
01.05.2005 23.52 0.88 1.76 2.02 4.56 11.19 6.59 50.52
Contd/...

Petroleum OMCs Inland Price Diff.
Effective Ex-Refinery Customs/ Develop'nt Distribution Dealer's Freight Claim of Fixed
Date Price Exise Duty Levy Margin Commission Margin OCAC GST Sale Price
17.05.2005 22.17 0.88 1.76 2.02 4.56 12.54 6.59 50.52
01.06.2005 21.58 0.88 1.76 2.02 2.61 15.08 6.59 50.52
16.06.2005 21.80 0.88 1.76 2.02 2.61 14.86 6.59 50.52
01.07.2005 22.97 0.88 1.90 2.17 2.67 16.65 7.09 54.33
16.07.2005 23.26 0.88 1.90 2.17 2.67 16.36 7.09 54.33
01.08.2005 23.57 0.88 1.90 2.17 2.67 16.05 7.09 54.33
16.08.2005 25.52 0.88 1.90 2.17 2.67 14.10 7.09 54.33
01.09.2005 27.01 0.88 2.04 2.33 2.67 15.85 7.62 58.40
16.09.2005 28.68 0.88 2.04 2.33 2.67 14.18 7.62 58.40
01.10.2005 27.76 0.88 2.19 2.51 2.67 18.57 8.19 62.77
16.10.2005 26.99 0.88 2.19 2.51 2.67 19.34 8.19 62.77
01.11.2005 26.45 0.88 13.30 2.19 2.51 2.67 6.58 8.19 62.77
16.11.2005 25.22 0.88 21.11 2.19 2.51 2.67 8.19 62.77
01.12.2005 24.67 0.88 21.66 2.19 2.51 2.67 8.19 62.77
16.12.2005 25.42 0.88 20.91 2.19 2.51 2.67 8.19 62.77
01.01.2006 25.21 0.88 21.12 2.19 2.51 2.67 8.19 62.77
16.01.2006 25.95 0.88 20.38 2.19 2.51 2.67 8.19 62.77
01.02.2006 27.19 0.88 19.14 2.19 2.51 2.67 8.19 62.77
16.02.2006 26.83 0.88 19.50 2.19 2.51 2.67 8.19 62.77
01.03.2006 26.96 0.88 19.37 2.19 2.51 2.67 8.19 62.77
16.03.2006 27.95 0.88 13.06 1.77 2.03 2.67 6.22 8.19 62.77
01 04 2006 28 48 0 88 18 75 1 77 2 03 2 67 8 19 62 77
HOBC SALE PRICE (Continued)
01.04.2006 28.48 0.88 18.75 1.77 2.03 2.67 8.19 62.77
16.04.2006 29.24 0.88 17.81 1.77 2.03 2.85 8.19 62.77
01.05.2006 30.66 0.88 16.09 1.84 2.10 4.85 8.46 64.88
16.05.2006 31.08 0.88 15.67 1.84 2.10 4.85 8.46 64.88
01.06.2006 30.25 0.88 16.50 1.84 2.10 4.85 8.46 64.88
16.06.2006 30.96 0.88 16.26 1.84 2.10 4.38 8.46 64.88
01.07.2006 31.29 0.88 16.54 1.84 2.10 3.77 8.46 64.88
16.07.2006 32.70 0.88 15.83 1.84 2.10 3.07 8.46 64.88
01.08.2006 32.68 0.88 17.65 1.84 2.10 1.27 8.46 64.88
16.08.2006 31.93 0.88 18.40 1.84 2.10 1.27 8.46 64.88
01.09.2006 30.76 0.88 19.77 1.84 2.10 1.07 8.46 64.88
16.09.2006 28.50 0.88 22.03 1.84 2.10 1.07 8.46 64.88
01.10.2006 26.84 0.88 23.69 1.84 2.10 1.07 8.46 64.88
16.10.2006 26.90 0.88 23.63 1.84 2.10 1.07 8.46 64.88
01.11.2006 26.92 0.88 23.61 1.84 2.10 1.07 8.46 64.88
16.11.2006 27.18 0.88 23.35 1.84 2.10 1.07 8.46 64.88
01.12.2006 27.60 0.88 22.43 1.84 2.10 1.57 8.46 64.88
16.12.2006 28.77 0.88 19.37 1.84 2.10 3.46 8.46 64.88
01.01.2007 28.54 0.88 19.30 1.84 2.10 3.76 8.46 64.88
16.01.2007 26.68 0.88 21.46 1.84 2.10 3.46 8.46 64.88
01.02.2007 26.47 0.88 22.07 1.84 2.10 3.06 8.46 64.88
16.02.2007 28.34 0.88 20.00 1.84 2.10 3.26 8.46 64.88
01.03.2007 29.25 0.88 18.39 1.84 2.10 3.96 8.46 64.88
16.03.2007 31.65 0.88 14.49 1.84 2.10 5.46 8.46 64.88
01.04.2007 31.79 0.88 14.36 1.84 2.10 5.45 8.46 64.88
16.04.2007 33.45 0.88 12.70 1.84 2.10 5.45 8.46 64.88
01.05.2007 35.56 0.88 12.59 1.84 2.10 3.45 8.46 64.88
16.05.2007 34.41 0.88 13.74 1.84 2.10 3.45 8.46 64.88
01.06.2007 35.56 0.88 12.59 1.84 2.10 3.45 8.46 64.88
10.06.2007 35.56 13.47 1.84 2.10 3.45 8.46 64.88
Contd/...

Petroleum OMCs Inland Price Diff.
Effective Ex-Refinery Customs/ Develop'nt Distribution Dealer's Freight Claim of Fixed
Date Price Exise Duty Levy Margin Commission Margin OCAC GST Sale Price
16.06.2007 33.96 15.57 1.84 2.10 2.95 8.46 64.88
01.07.2007 33.73 16.36 1.84 2.10 2.39 8.46 64.88
16.07.2007 35.05 15.04 1.84 2.10 2.39 8.46 64.88
01.08.2007 34.32 15.56 1.84 2.10 2.60 8.46 64.88
16.08.2007 33.22 17.01 1.84 2.10 2.25 8.46 64.88
25.08.2007 33.22 18.29 1.24 1.42 2.25 8.46 64.88
01.09.2007 32.98 18.76 1.23 1.40 2.05 8.46 64.88
16.09.2007 33.85 15.89 1.32 1.51 3.85 8.46 64.88
01.10.2007 35.48 12.50 1.43 1.63 5.38 8.46 64.88
16.10.2007 35.97 12.23 1.44 1.64 5.14 8.46 64.88
01.11.2007 37.86 9.66 1.52 1.74 5.64 8.46 64.88
16.11.2007 40.69 5.81 1.65 1.88 6.39 8.46 64.88
02.12.2007 41.79 4.37 1.69 1.94 6.63 8.46 64.88
16.12.2007 40.89 7.49 1.59 1.82 4.63 8.46 64.88
01.01.2008 41.90 6.40 1.63 1.86 4.63 8.46 64.88
17.01.2008 43.23 2.06 1.77 2.02 7.34 8.46 64.88
01.02.2008 42.07 6.50 1.63 1.86 4.36 8.46 64.88
17.02.2008 42.55 5.99 1.64 1.88 4.36 8.46 64.88
01.03.2008 44.85 6.26 1.77 2.03 5.86 9.11 69.88
16.03.2008 45.62 9.14 1.82 2.08 6.36 9.75 74.77
01.04.2008 45.39 9.23 1.82 2.08 6.50 9.75 74.77
18 04 2008 46 55 11 14 1 84 2 10 6 00 10 14 77.77
HOBC SALE PRICE (Continued)
. . . . . . . . .
01.05.2008 49.62 10.22 1.95 2.23 6.21 10.54 80.77
16.05.2008 52.76 4.69 2.13 2.44 8.21 10.54 80.77
01.06.2008 58.83 2.29 2.61 10.87 (4.37) 10.54 80.77
21.06.2008 57.97 2.29 2.61 7.60 (0.24) 10.54 80.77
29.06.2008 58.83 2.29 2.61 10.87 (4.37) 10.54 80.77
01.07.2008 61.25 1.52 2.44 2.79 8.60 12.26 88.86
Source: DG(Oil).
Unit: Rupees/Litre
Petroleum OMCs Inland Price
Effective Ex-Refinery Customs/ Develop'nt Distribution Dealer's Freight Differencial Fixed
Date Price Exise Duty Levy Margin Commission Margin Claim GST Sale Price
01.07.2001 14.57 0.88 11.40 0.73 1.01 0.80 4.41 33.81
16.07.2001 13.72 0.88 11.40 0.71 0.98 0.80 4.27 32.76
01.08.2001 13.42 0.88 11.40 0.70 0.97 0.80 4.23 32.40
16.08.2001 13.38 0.88 11.40 0.70 0.97 0.80 4.22 32.35
01.09.2001 13.09 0.88 11.40 0.69 0.95 0.50 4.13 31.64
16.09.2001 13.69 0.88 11.40 0.70 0.97 0.59 4.23 32.46
01.10.2001 13.38 0.88 11.40 0.70 0.97 0.90 4.23 32.46
16.10.2001 11.77 0.88 11.40 0.66 0.92 0.90 3.98 30.51
01.11.2001 11.43 0.88 11.40 0.66 0.91 1.03 3.95 30.26
16.11.2001 10.95 0.88 11.40 0.64 0.89 1.03 3.87 29.66
01.12.2001 10.35 0.88 11.40 0.62 0.86 0.88 3.75 28.74
16.12.2001 10.37 0.88 11.40 0.62 0.86 0.86 3.75 28.74
Contd/...
Table: 2.15.2
GASOLINE SALE PRICE

Unit: Rupees/Litre
Petroleum OMCs Inland Price
Effective Ex-Refinery Customs/ Develop'nt Distribution Dealer's Freight Differencial Fixed
Date Price Exise Duty Levy Margin Commission Margin Claim GST Sale Price
01.01.2002 10.81 0.88 11.65 0.64 0.89 0.86 3.86 29.59
16.01.2002 10.97 0.88 11.65 0.65 0.89 0.86 3.89 29.79
01.02.2002 11.03 0.88 11.65 0.65 0.89 0.80 3.89 29.79
16.02.2002 11.60 0.88 11.65 0.66 0.91 0.71 3.96 30.37
01.03.2002 11.75 0.88 11.65 0.66 0.92 0.67 3.98 30.51
16.03.2002 13.03 0.88 11.65 0.76 1.00 0.67 4.20 32.19
02.04.2002 13.65 0.88 10.93 0.83 1.03 0.67 4.20 32.19
16.04.2002 14.31 0.88 10.15 0.89 1.07 0.69 4.20 32.19
01.05.2002 13.45 0.88 10.66 0.95 1.11 0.94 4.20 32.19
16.05.2002 13.25 0.88 11.99 1.05 1.18 0.94 4.39 33.68
01.06.2002 13.32 0.88 11.99 1.12 1.22 0.99 4.43 33.95
16.06.2002 12.68 0.88 11.99 1.16 1.23 1.02 4.34 33.30
01.07.2002 12.89 0.88 11.99 1.18 1.35 1.02 4.40 33.71
16.07.2002 12.80 0.88 11.99 1.18 1.34 1.02 4.38 33.59
01.08.2002 13.01 0.88 11.99 1.18 1.35 1.02 4.41 33.84
16.08.2002 12.92 0.88 11.99 1.19 1.36 1.17 4.43 33.94
01.09.2002 13.23 0.88 11.99 1.20 1.37 1.17 4.48 34.32
20.09.2002 13.61 0.88 11.83 1.21 1.39 1.22 4.52 34.66
02.10.2002 13.82 0.88 11.62 1.21 1.39 1.22 4.52 34.66
16.10.2002 13.66 0.88 12.55 1.25 1.43 1.22 4.65 35.64
01 11 2002 13 33 0 88 12 55 1 23 1 41 1 22 4 59 35 21
GASOLINE SALE PRICE (Continued)
. . . . . . . . . .
16.11.2002 12.55 0.88 10.93 1.12 1.28 1.22 4.20 32.18
01.12.2002 12.50 0.88 9.50 1.06 1.21 1.15 3.95 30.25
16.12.2002 13.12 0.88 9.50 1.08 1.24 1.15 4.05 31.02
01.01.2003 14.31 0.88 9.50 1.13 1.29 1.15 4.24 32.50
16.01.2003 14.41 0.88 9.50 1.14 1.30 1.15 4.26 32.64
01.02.2003 14.66 0.88 9.50 1.15 1.31 1.16 4.30 32.96
16.02.2003 15.89 0.88 9.50 1.20 1.38 1.16 4.50 34.51
01.03.2003 16.87 0.88 9.50 1.24 1.43 1.16 4.66 35.74
16.03.2003 17.92 0.88 9.50 1.30 1.48 1.19 4.84 37.11
01.04.2003 14.45 0.88 9.50 1.16 1.33 1.61 4.34 33.27
16.04.2003 12.30 0.88 9.50 1.07 1.22 1.62 3.99 30.58
01.05.2003 11.95 0.88 9.50 1.05 1.20 1.62 3.93 30.13
16.05.2003 11.30 0.88 9.50 1.01 1.15 1.27 3.77 28.88
01.06.2003 12.29 0.88 9.50 1.05 1.20 1.27 3.93 30.12
16.06.2003 13.03 0.88 9.50 1.08 1.22 1.10 4.02 30.83
01.07.2003 13.31 0.88 9.50 1.09 1.24 1.10 4.07 31.19
16.07.2003 13.62 0.88 9.50 1.10 1.26 1.05 4.11 31.52
01.08.2003 13.62 0.88 9.50 1.10 1.26 1.05 4.11 31.52
16.08.2003 13.92 0.88 9.50 1.10 1.26 0.83 4.12 31.61
01.09.2003 14.02 0.88 9.50 1.10 1.27 0.88 4.15 31.80
16.09.2003 13.69 0.88 9.50 1.09 1.25 0.83 4.09 31.33
01.10.2003 13.22 0.88 9.50 1.07 1.22 0.83 4.01 30.73
16.10.2003 14.19 0.88 9.50 1.12 1.28 0.88 4.18 32.03
01.11.2003 14.64 0.88 9.50 1.14 1.30 0.88 4.25 32.59
16.11.2003 14.83 0.88 9.50 1.15 1.31 0.94 4.29 32.90
01.12.2003 15.37 0.88 9.50 1.17 1.34 0.94 4.38 33.58
Contd/...

Unit: Rupees/Litre
Petroleum OMCs Inland Price
Effective Ex-Refinery Customs/ Develop'nt Distribution Dealer's Freight Differencial Fixed
Date Price Exise Duty Levy Margin Commission Margin Claim GST Sale Price
16.12.2003 15.31 0.88 9.50 1.18 1.35 1.15 4.41 33.78
01.01.2004 15.74 0.88 8.63 1.18 1.35 1.59 4.41 33.78
16.01.2004 17.10 0.88 8.63 1.24 1.41 1.59 4.63 35.48
01.02.2004 16.98 0.88 8.63 1.23 1.41 1.59 4.61 35.33
07.02.2004 16.98 0.88 8.63 1.23 1.41 1.59 4.61 35.33
16.02.2004 15.43 0.88 9.50 1.20 1.37 1.59 4.50 34.47
01.03.2004 15.97 0.88 9.50 1.21 1.39 1.31 4.54 34.80
16.03.2004 16.30 0.88 9.50 1.21 1.39 0.94 4.53 34.75
01.04.2004 16.24 0.88 9.50 1.21 1.38 0.85 4.51 34.57
16.04.2004 16.68 0.88 9.50 1.23 1.41 1.06 4.61 35.37
01.05.2004 17.32 0.88 9.50 1.29 1.47 1.64 4.82 36.92
16.05.2004 18.04 0.88 8.41 1.29 1.47 2.01 4.82 36.92
01.06.2004 18.72 0.88 7.59 1.29 1.47 2.15 4.82 36.92
16.06.2004 17.85 0.88 8.46 1.29 1.47 2.15 4.82 36.92
01.07.2004 17.18 0.88 9.27 1.29 1.47 2.01 4.82 36.92
16.07.2004 17.28 0.88 9.19 1.29 1.47 1.99 4.82 36.92
01.08.2004 18.13 0.88 8.34 1.29 1.47 1.99 4.82 36.92
16.08.2004 20.06 0.88 0.00 1.29 1.47 8.40 4.82 36.92
01.09.2004 20.79 0.88 0.00 1.29 1.47 8.40 -0.73 4.82 36.92
16.09.2004 19.76 0.88 0.00 1.29 1.47 8.70 4.82 36.92
GASOLINE SALE PRICE (Continued)
01.10.2004 20.88 0.88 0.00 1.29 1.47 8.70 -1.12 4.82 36.92
16.10.2004 20.88 0.88 0.00 1.29 1.47 8.70 -1.12 4.82 36.92
01.11.2004 20.88 0.88 0.00 1.29 1.47 8.70 -1.12 4.82 36.92
16.11.2004 20.88 0.88 0.00 1.29 1.47 8.70 -1.12 4.82 36.92
01.12.2004 20.88 0.88 0.00 1.29 1.47 8.70 -1.12 4.82 36.92
16.12.2004 19.89 0.88 0.92 1.38 1.58 9.70 5.15 39.50
01.01.2005 19.22 0.88 2.30 1.41 1.61 9.70 5.27 40.39
16.01.2005 18.50 0.88 8.11 1.41 1.61 4.61 5.27 40.39
02.02.2005 19.99 0.88 9.30 1.48 1.69 3.52 5.53 42.39
16.02.2005 20.51 0.88 6.89 1.48 1.69 5.41 5.53 42.39
01.03.2005 21.77 0.88 6.89 1.53 1.75 5.41 5.73 43.96
16.03.2005 23.00 0.88 0.00 1.59 1.82 5.41 6.89 5.94 45.53
01.04.2005 24.04 0.88 0.00 1.59 1.82 2.49 8.77 5.94 45.53
16.04.2005 24.01 0.88 0.00 1.59 1.82 2.95 8.34 5.94 45.53
01.05.2005 22.87 0.88 0.00 1.59 1.82 2.95 9.48 5.94 45.53
17.05.2005 21.53 0.88 0.00 1.59 1.82 2.95 10.82 5.94 45.53
01.06.2005 20.95 0.88 0.00 1.59 1.82 2.09 12.26 5.94 45.53
16.06.2005 21.17 0.88 0.00 1.59 1.82 2.09 12.04 5.94 45.53
01.07.2005 22.33 0.88 1.71 1.95 2.14 13.55 6.38 48.94
16.07.2005 22.61 0.88 1.71 1.95 2.14 13.27 6.38 48.94
01.08.2005 22.91 0.88 1.71 1.95 2.14 12.97 6.38 48.94
16.08.2005 24.83 0.88 1.71 1.95 2.14 11.05 6.38 48.94
01.09.2005 26.29 0.88 1.84 2.10 2.14 12.50 6.86 52.61
16.09.2005 27.94 0.88 1.84 2.10 2.14 10.85 6.86 52.61
01.10.2005 27.03 0.88 1.97 2.25 2.14 14.68 7.34 56.29
16.10.2005 26.28 0.88 1.97 2.25 2.14 15.43 7.34 56.29
01.11.2005 25.75 0.88 9.64 1.97 2.25 2.14 6.32 7.34 56.29
Contd/...

Unit: Rupees/Litre
Petroleum OMCs Inland Price
Effective Ex-Refinery Customs/ Develop'nt Distribution Dealer's Freight Differencial Fixed
Date Price Exise Duty Levy Margin Commission Margin Claim GST Sale Price
16.11.2005 24.54 0.88 17.17 1.97 2.25 2.14 7.34 56.29
01.12.2005 24.00 0.88 17.71 1.97 2.25 2.14 7.34 56.29
16.12.2005 24.74 0.88 16.97 1.97 2.25 2.14 7.34 56.29
01.01.2006 24.53 0.88 17.18 1.97 2.25 2.14 7.34 56.29
16.01.2006 25.26 0.88 16.45 1.97 2.25 2.14 7.34 56.29
01.02.2006 26.48 0.88 15.23 1.97 2.25 2.14 7.34 56.29
16.02.2006 26.12 0.88 15.59 1.97 2.25 2.14 7.34 56.29
01.03.2006 26.25 0.88 15.46 1.97 2.25 2.14 7.34 56.29
16.03.2006 27.23 0.88 9.85 1.59 1.82 2.14 5.44 7.34 56.29
01.04.2006 27.75 0.88 14.77 1.59 1.82 2.14 7.34 56.29
16.04.2006 28.50 0.88 13.86 1.59 1.82 2.30 7.34 56.29
01.05.2006 29.89 0.88 12.72 1.63 1.87 3.18 7.53 57.70
16.05.2006 30.31 0.88 12.30 1.63 1.87 3.18 7.53 57.70
01.06.2006 29.49 0.88 13.12 1.63 1.87 3.18 7.53 57.70
16.06.2006 30.19 0.88 12.61 1.63 1.87 2.99 7.53 57.70
01.07.2006 30.51 0.88 12.67 1.63 1.87 2.61 7.53 57.70
16.07.2006 31.90 0.88 12.15 1.63 1.87 1.74 7.53 57.70
01.08.2006 31.88 0.88 12.50 1.63 1.87 1.41 7.53 57.70
16.08.2006 31.14 0.88 13.24 1.63 1.87 1.41 7.53 57.70
01.09.2006 29.99 0.88 15.08 1.63 1.87 0.72 7.53 57.70
GASOLINE SALE PRICE (Continued)
16.09.2006 27.77 0.88 17.30 1.63 1.87 0.72 7.53 57.70
01.10.2006 26.13 0.88 18.94 1.63 1.87 0.72 7.53 57.70
16.10.2006 26.19 0.88 18.88 1.63 1.87 0.72 7.53 57.70
01.11.2006 26.21 0.88 18.86 1.63 1.87 0.72 7.53 57.70
16.11.2006 26.47 0.88 18.60 1.63 1.87 0.72 7.53 57.70
01.12.2006 26.87 0.88 17.79 1.63 1.87 1.13 7.53 57.70
16.12.2006 28.03 0.88 15.86 1.63 1.87 1.90 7.53 57.70
01.01.2007 27.80 0.88 15.75 1.63 1.87 2.24 7.53 57.70
16.01.2007 25.97 0.88 14.85 1.52 1.74 1.74 7.00 53.70
01.02.2007 25.76 0.88 15.35 1.52 1.74 1.45 7.00 53.70
16.02.2007 27.60 0.88 13.30 1.52 1.74 1.66 7.00 53.70
01.03.2007 28.50 0.88 11.77 1.52 1.74 2.29 7.00 53.70
16.03.2007 30.86 0.88 8.40 1.52 1.74 3.30 7.00 53.70
01.04.2007 31.00 0.88 8.36 1.52 1.74 3.20 7.00 53.70
16.04.2007 32.64 0.88 6.71 1.52 1.74 3.21 7.00 53.70
01.05.2007 34.72 0.88 5.19 1.52 1.74 2.65 7.00 53.70
16.05.2007 33.59 0.88 6.19 1.52 1.74 2.78 7.00 53.70
01.06.2007 34.72 0.88 5.19 1.52 1.74 2.65 7.00 53.70
10.06.2007 34.72 6.07 1.52 1.74 2.65 7.00 53.70
16.06.2007 33.14 8.18 1.52 1.74 2.12 7.00 53.70
01.07.2007 32.91 8.85 1.52 1.74 1.68 7.00 53.70
16.07.2007 34.22 7.85 1.52 1.74 1.37 7.00 53.70
01.08.2007 33.50 8.48 1.52 1.74 1.46 7.00 53.70
16.08.2007 32.41 9.79 1.52 1.74 1.24 7.00 53.70
25.08.2007 32.41 10.52 1.18 1.35 1.24 7.00 53.70
01.09.2007 32.18 11.03 1.16 1.33 1.00 7.00 53.70
16.09.2007 33.03 9.06 1.23 1.40 1.98 7.00 53.70
Contd/...

Unit: Rupees/Litre
Petroleum OMCs Inland Price
Effective Ex-Refinery Customs/ Develop'nt Distribution Dealer's Freight Differencial Fixed
Date Price Exise Duty Levy Margin Commission Margin Claim GST Sale Price
01.10.2007 34.63 6.63 1.30 1.49 2.65 7.00 53.70
16.10.2007 35.12 6.21 1.32 1.51 2.54 7.00 53.70
01.11.2007 36.98 3.95 1.39 1.59 2.79 7.00 53.70
16.11.2007 39.76 2.29 1.45 1.65 1.55 7.00 53.70
02.12.2007 40.84 0.99 1.49 1.70 1.68 7.00 53.70
16.12.2007 39.95 1.12 1.48 1.70 2.45 7.00 53.70
01.01.2008 40.95 0.04 1.52 1.74 2.45 7.00 53.70
17.01.2008 42.26 1.52 1.74 3.93 (2.75) 7.00 53.70
01.02.2008 41.12 1.52 1.74 2.33 (0.01) 7.00 53.70
17.02.2008 41.59 1.52 1.74 2.28 (0.43) 7.00 53.70
01.03.2008 43.85 0.57 1.64 1.88 3.10 7.66 58.70
16.03.2008 44.61 3.04 1.68 1.92 3.37 8.19 62.81
01.04.2008 44.38 3.22 1.67 1.91 3.44 8.19 62.81
18.04.2008 45.53 4.89 1.70 1.95 3.16 8.58 65.81
01.05.2008 48.55 4.23 1.81 2.07 3.17 8.98 68.81
16.05.2008 51.63 0.80 1.92 2.20 3.28 8.98 68.81
01.06.2008 57.58 1.95 2.23 5.22 (7.15) 8.98 68.81
21.06.2008 56.74 1.95 2.23 3.95 (5.04) 8.98 68.81
29.06.2008 57.58 1.95 2.23 5.22 (7.15) 8.98 68.81
01.07.2008 59.98 2.12 2.43 4.48 (3.76) 10.44 75.69
GASOLINE SALE PRICE (Continued)
Source: DG(Oil)
Unit: Rupees/Litre
Petroleum OMCs Inland Price
Effective Ex-Refinery Customs/ Develop'nt Distribution Dealer's Freight Differencial Fixed
Date Price Exise Duty Levy Margin Commission Margin Claim GST Sale Price
01.07.2001 12.57 2.15 0.24 0.56 2.33 17.85
16.07.2001 12.26 2.15 0.24 0.56 2.28 17.49
01.08.2001 11.49 2.15 0.23 0.56 2.16 16.59
16.08.2001 11.81 2.15 0.23 0.56 2.21 16.96
01.09.2001 12.20 2.15 0.24 0.54 2.27 17.40
16.09.2001 13.31 2.15 0.25 0.52 2.43 18.66
01.10.2001 12.55 2.15 0.25 1.03 2.40 18.38
16.10.2001 10.75 2.15 0.22 1.03 2.12 16.27
01.11.2001 9.99 2.15 0.20 0.65 1.95 14.94
16.11.2001 9.52 2.15 0.20 0.65 1.88 14.40
01.12.2001 8.73 2.15 0.18 0.60 1.75 13.41
16.12.2001 8.75 2.15 0.18 0.58 1.75 13.41
01.01.2002 8.99 2.40 0.19 0.58 1.82 13.98
16.01.2002 9.41 2.40 0.20 0.58 1.89 14.48
01.02.2002 9.41 2.40 0.20 0.58 1.89 14.48
16.02.2002 9.23 2.40 0.19 0.55 1.86 14.23
01.03.2002 9.25 2.40 0.19 0.53 1.86 14.23
16.03.2002 9.84 2.40 0.25 0.53 1.95 14.97
02.04.2002 10.42 1.77 0.30 0.53 1.95 14.97
Contd/...
Table: 2.15.3
KEROSENE SALE PRICE

Unit: Rupees/Litre
Petroleum OMCs Inland Price
Effective Ex-Refinery Customs/ Develop'nt Distribution Dealer's Freight Differencial Fixed
Date Price Exise Duty Levy Margin Commission Margin Claim GST Sale Price
16.04.2002 11.03 1.10 0.35 0.54 1.95 14.97
01.05.2002 10.53 1.30 0.40 0.79 1.95 14.97
16.05.2002 10.92 2.74 0.48 0.79 2.24 17.17
01.06.2002 10.87 2.74 0.53 0.79 2.24 17.17
16.06.2002 10.33 2.49 0.57 0.82 2.13 16.34
01.07.2002 10.94 2.49 0.60 0.82 2.23 17.08
16.07.2002 10.43 0.63 2.49 0.60 0.82 2.25 17.22
01.08.2002 10.77 0.65 2.49 0.61 0.82 2.30 17.64
16.08.2002 10.70 0.64 2.49 0.62 0.85 2.30 17.60
01.09.2002 11.30 0.68 2.49 0.64 0.90 2.40 18.41
20.09.2002 12.74 1.83 0.65 0.96 2.43 18.61
02.10.2002 13.27 1.30 0.65 0.96 2.43 18.61
16.10.2002 13.30 1.83 0.67 0.96 2.51 19.27
01.11.2002 12.60 2.49 0.67 0.96 2.51 19.23
16.11.2002 11.58 3.28 0.66 0.96 2.47 18.95
01.12.2002 11.38 3.35 0.66 1.09 2.47 18.95
16.12.2002 11.58 3.35 0.67 1.15 2.51 19.26
01.01.2003 12.72 3.35 0.72 1.21 2.70 20.70
16.01.2003 12.65 3.35 0.72 1.21 2.69 20.62
01.02.2003 13.20 3.35 0.75 1.24 2.78 21.32
KEROSENE SALE PRICE (continued)
16.02.2003 14.52 3.35 0.80 1.24 2.99 22.90
01.03.2003 15.28 3.35 0.83 1.24 3.11 23.81
16.03.2003 15.93 3.35 0.86 1.27 3.21 24.62
01.04.2003 12.53 3.35 0.73 1.70 2.75 21.06
16.04.2003 10.81 3.35 0.66 1.72 2.48 19.02
01.05.2003 11.00 3.35 0.67 1.72 2.51 19.25
16.05.2003 10.76 3.35 0.65 1.35 2.42 18.53
01.06.2003 10.98 3.35 0.66 1.35 2.45 18.79
16.06.2003 11.19 3.35 0.66 1.17 2.46 18.83
01.07.2003 11.14 3.35 0.65 1.17 2.45 18.76
16.07.2003 11.20 3.35 0.66 1.20 2.46 18.87
01.08.2003 11.76 3.35 0.68 1.20 2.55 19.54
16.08.2003 12.49 3.35 0.70 0.98 2.63 20.15
01.09.2003 12.92 3.35 0.72 1.02 2.70 20.71
16.09.2003 12.34 3.35 0.70 1.06 2.62 20.07
01.10.2003 11.88 3.35 0.68 1.06 2.55 19.52
16.10.2003 12.78 3.35 0.71 1.02 2.68 20.54
01.11.2003 13.49 3.35 0.74 1.04 2.79 21.41
16.11.2003 13.55 3.35 0.75 1.02 2.80 21.47
01.12.2003 14.13 3.35 0.77 1.02 2.89 22.16
16.12.2003 14.31 3.35 0.78 1.02 2.92 22.38
01.01.2004 14.47 2.91 0.78 1.30 2.92 22.38
16.01.2004 15.17 2.91 0.81 1.30 3.03 23.22
01.02.2004 15.45 2.91 0.82 1.30 3.07 23.55
07.02.2004 15.45 2.91 0.82 1.30 3.07 23.55
16.02.2004 13.87 3.35 0.77 1.30 2.89 22.18
01.03.2004 14.22 3.35 0.78 1.14 2.92 22.41
Contd/...

Unit: Rupees/Litre
Petroleum OMCs Inland Price
Effective Ex-Refinery Customs/ Develop'nt Distribution Dealer's Freight Differencial Fixed
Date Price Exise Duty Levy Margin Commission Margin Claim GST Sale Price
16.03.2004 13.96 3.35 0.77 1.03 2.87 21.98
01.04.2004 14.40 3.35 0.76 0.60 2.87 21.98
16.04.2004 14.67 3.35 0.80 1.18 3.00 23.00
01.05.2004 16.56 2.91 0.84 0.56 3.13 24.00
16.05.2004 17.94 0.80 0.84 1.29 3.13 24.00
01.06.2004 17.88 0.73 0.84 1.42 3.13 24.00
16.06.2004 16.79 1.82 0.84 1.42 3.13 24.00
01.07.2004 16.72 1.93 0.84 1.38 3.13 24.00
16.07.2004 17.83 0.78 0.84 1.42 3.13 24.00
01.08.2004 18.98 0.84 1.05 3.13 24.00
16.08.2004 20.22 0.84 -0.19 3.13 24.00
01.09.2004 21.23 0.84 -1.20 3.13 24.00
16.09.2004 20.74 0.84 -0.71 3.13 24.00
01.10.2004 22.68 0.84 -2.65 3.13 24.00
16.10.2004 22.68 0.84 -2.65 3.13 24.00
01.11.2004 22.68 0.84 -2.65 3.13 24.00
16.11.2004 22.68 0.84 -2.65 3.13 24.00
01.12.2004 22.10 0.84 -2.07 3.13 24.00
16.12.2004 19.88 0.70 0.89 0.70 3.33 25.50
01.01.2005 19.74 1.30 0.91 0.69 3.40 26.04
KEROSENE SALE PRICE (continued)
16.01.2005 19.00 1.53 0.91 1.20 3.40 26.04
02.02.2005 21.14 0.53 0.94 0.90 3.53 27.04
16.02.2005 21.12 0.55 0.94 0.90 3.53 27.04
01.03.2005 22.59 0.97 0.77 3.65 27.98
16.03.2005 25.71 0.97 0.77 -3.12 3.65 27.98
01.04.2005 27.49 0.97 1.54 -5.87 3.65 27.78
16.04.2005 29.08 0.97 2.17 -7.89 3.65 27.98
01.05.2005 28.36 0.97 2.17 -7.17 3.65 27.98
17.05.2005 26.63 0.97 2.17 -5.44 3.65 27.98
01.06.2005 24.82 0.97 1.56 -3.02 3.65 27.98
16.06.2005 26.86 0.97 1.56 -5.06 3.65 27.98
01.07.2005 28.58 1.03 1.59 -5.52 3.85 29.53
16.07.2005 28.75 1.03 1.59 -5.69 3.85 29.53
01.08.2005 27.85 1.03 1.59 -4.79 3.85 29.53
16.08.2005 29.34 1.03 1.59 -6.28 3.85 29.53
01.09.2005 30.88 1.08 1.59 -6.59 4.04 31.00
16.09.2005 31.91 1.08 1.59 -7.62 4.04 31.00
01.10.2005 31.17 1.15 1.59 -5.33 4.29 32.87
16.10.2005 32.03 1.15 1.59 -6.19 4.29 32.87
01.11.2005 28.88 1.15 1.59 -3.04 4.29 32.87
16.11.2005 25.84 1.15 1.59 4.29 32.87
01.12.2005 26.29 1.15 1.59 -0.45 4.29 32.87
16.12.2005 27.31 1.15 1.59 -1.47 4.29 32.87
01.01.2006 29.39 1.15 1.59 -3.55 4.29 32.87
16.01.2006 29.77 1.15 1.59 -3.93 4.29 32.87
01.02.2006 31.03 1.15 1.59 -5.19 4.29 32.87
16.02.2006 30.74 1.15 1.59 -4.90 4.29 32.87
Contd/...

Unit: Rupees/Litre
Petroleum OMCs Inland Price
Effective Ex-Refinery Customs/ Develop'nt Distribution Dealer's Freight Differencial Fixed
Date Price Exise Duty Levy Margin Commission Margin Claim GST Sale Price
01.03.2006 30.08 1.15 1.59 -4.24 4.29 32.87
16.03.2006 30.84 0.96 1.59 -4.81 4.29 32.87
01.04.2006 31.45 0.96 1.59 -5.42 4.29 32.87
16.04.2006 32.82 0.96 1.75 -6.95 4.29 32.87
01.05.2006 35.91 1.04 2.62 -8.94 4.60 35.23
16.05.2006 35.47 1.04 2.62 -8.50 4.60 35.23
01.06.2006 34.34 1.04 2.62 -7.37 4.60 35.23
16.06.2006 35.40 1.04 2.50 -8.31 4.60 35.23
01.07.2006 34.77 1.04 2.15 -7.33 4.60 35.23
16.07.2006 35.38 1.04 1.76 -7.55 4.60 35.23
01.08.2006 36.15 1.04 0.89 -7.45 4.60 35.23
16.08.2006 36.63 1.04 0.89 -7.93 4.60 35.23
01.09.2006 36.08 1.04 0.78 -7.27 4.60 35.23
16.09.2006 34.83 1.04 0.78 -6.02 4.60 35.23
01.10.2006 31.30 1.04 0.78 -2.49 4.60 35.23
16.10.2006 30.53 1.04 0.78 -1.72 4.60 35.23
01.11.2006 30.22 1.04 0.78 -1.41 4.60 35.23
16.11.2006 29.86 1.04 0.78 -1.05 4.60 35.23
01.12.2006 30.48 1.04 1.06 -1.95 4.60 35.23
16.12.2006 32.20 1.04 2.04 -4.65 4.60 35.23
KEROSENE SALE PRICE (continued)
01.01.2007 31.38 1.04 2.33 -4.12 4.60 35.23
16.01.2007 28.81 1.04 1.88 -1.10 4.60 35.23
01.02.2007 27.93 0.01 1.04 1.65 4.60 35.23
16.02.2007 28.94 1.04 1.81 -1.16 4.60 35.23
01.03.2007 29.02 1.04 2.15 -1.58 4.60 35.23
16.03.2007 30.38 1.04 2.84 -3.63 4.60 35.23
01.04.2007 30.66 1.04 2.96 -4.03 4.60 35.23
16.04.2007 32.81 1.04 2.98 -6.20 4.60 35.23
01.05.2007 33.89 1.04 1.91 -6.21 4.60 35.23
16.05.2007 33.47 1.04 1.91 -5.79 4.60 35.23
01.06.2007 33.89 1.04 1.91 -6.21 4.60 35.23
10.06.2007 31.96 1.04 1.91 -4.28 4.60 35.23
16.06.2007 31.91 1.04 1.67 -3.99 4.60 35.23
01.07.2007 32.91 1.04 1.47 -4.79 4.60 35.23
16.07.2007 33.45 1.04 1.47 -5.33 4.60 35.23
01.08.2007 34.03 1.04 1.51 -5.95 4.60 35.23
16.08.2007 33.18 1.04 1.32 -4.91 4.60 35.23
25.08.2007 33.18 1.04 1.32 -4.91 4.60 35.23
01.09.2007 32.32 1.04 1.18 -3.91 4.60 35.23
16.09.2007 33.90 1.04 1.35 -5.66 4.60 35.23
01.10.2007 35.44 1.04 3.22 -9.07 4.60 35.23
16.10.2007 35.58 1.04 3.19 -9.18 4.60 35.23
01.11.2007 38.18 1.04 3.49 -12.08 4.60 35.23
16.11.2007 43.02 1.04 3.95 -17.38 4.60 35.23
02.12.2007 44.07 1.04 4.01 -18.49 4.60 35.23
16.12.2007 41.46 1.04 2.80 -14.67 4.60 35.23
01.01.2008 42.29 1.04 2.80 -15.50 4.60 35.23
17.01.2008 43.27 1.04 4.22 -17.90 4.60 35.23
01.02.2008 41.03 1.04 2.75 -14.19 4.60 35.23
Contd/...

Unit: Rupees/Litre
Petroleum OMCs Inland Price
Effective Ex-Refinery Customs/ Develop'nt Distribution Dealer's Freight Differencial Fixed
Date Price Exise Duty Levy Margin Commission Margin Claim GST Sale Price
17.02.2008 42.27 1.04 2.71 -15.39 4.60 35.23
01.03.2008 45.71 1.14 3.65 -16.82 5.05 38.73
16.03.2008 48.90 1.22 3.96 -18.05 5.41 41.44
01.04.2008 51.52 1.22 3.63 -20.34 5.41 41.44
18.04.2008 53.99 1.22 3.36 -22.54 5.41 41.44
01.05.2008 58.36 1.22 3.21 -26.76 5.41 41.44
16.05.2008 62.63 1.22 4.32 -32.14 5.41 41.44
01.06.2008 73.63 1.22 5.29 -44.11 5.41 41.44
21.06.2008 69.43 1.22 4.22 -38.84 5.41 41.44
29.06.2008 73.63 1.22 5.29 -44.11 5.41 41.44
01.07.2008 70.58 1.45 4.77 -33.93 6.86 49.73
Source: DG(Oil).
Unit: Rupees/LitrePetroleum OMCs Inland Price
Effective Ex-Refinery Customs/ Develop'nt Distribution Dealer's Freight Differencial Fixed
Date Price Exise Duty Levy Margin Commission Margin Claim GST Sale Price
01.07.2001 12.22 0.25 1.56 0.35 0.55 0.95 2.38 18.26
16.07.2001 11.93 0.25 1.56 0.34 0.53 0.95 -0.08 2.32 17.80
01.08.2001 11.80 0.25 1.56 0.34 0.53 0.95 -0.19 2.29 17.53
Table: 2.15.4
HIGH SPEED DIESEL OIL SALE PRICE
KEROSENE SALE PRICE (continued)
. . . . . . . . . . .
16.08.2001 11.32 0.25 1.56 0.32 0.50 0.95 -0.35 2.18 16.73
01.09.2001 11.38 0.25 2.06 0.34 0.53 0.88 0.01 2.32 17.77
16.09.2001 11.74 0.25 2.06 0.35 0.55 0.89 -0.02 2.37 18.19
01.10.2001 12.39 0.25 2.06 0.37 0.58 1.04 2.50 19.19
16.10.2001 10.87 0.25 2.06 0.33 0.52 1.04 2.26 17.33
01.11.2001 10.29 0.25 2.06 0.32 0.50 1.01 2.16 16.59
16.11.2001 9.72 0.25 2.06 0.29 0.45 1.01 -0.66 1.97 15.09
01.12.2001 9.29 0.25 2.06 0.28 0.44 0.93 -0.38 1.93 14.80
16.12.2001 8.04 0.25 2.06 0.24 0.38 0.90 -0.73 1.67 12.81
01.01.2002 7.97 0.25 2.81 0.28 0.43 0.90 -0.06 1.89 14.47
16.01.2002 8.25 0.25 2.81 0.29 0.45 0.90 0.19 1.97 15.11
01.02.2002 8.29 0.25 2.81 0.28 0.44 0.88 -0.13 1.92 14.74
16.02.2002 8.47 0.25 2.81 0.29 0.46 0.87 0.14 1.99 15.28
01.03.2002 8.75 0.25 2.81 0.30 0.47 0.87 0.14 2.04 15.63
16.03.2002 8.84 0.25 2.81 0.47 0.55 0.88 -0.21 2.04 15.63
02.04.2002 9.95 0.25 1.05 0.47 0.55 0.88 0.44 2.04 15.63
16.04.2002 10.48 0.25 0.00 0.47 0.55 0.88 0.96 2.04 15.63
01.05.2002 10.40 0.25 0.99 0.47 0.55 0.98 -0.05 2.04 15.63
16.05.2002 10.79 0.25 2.41 0.55 0.64 0.98 0.28 2.39 18.29
01.06.2002 10.84 0.25 3.15 0.57 0.67 1.01 0.13 2.49 19.11
16.06.2002 10.57 0.00 3.01 0.57 0.67 1.04 0.67 2.48 19.01
01.07.2002 11.50 2.76 0.68 0.78 1.04 0.12 2.53 19.41
16.07.2002 10.43 1.04 2.76 0.67 0.77 1.04 0.12 2.52 19.35
01.08.2002 10.34 1.03 2.76 0.66 0.76 1.04 2.49 19.08
16.08.2002 10.26 1.03 2.89 0.66 0.76 1.04 -0.05 2.49 19.08
01.09.2002 10.47 1.05 2.89 0.68 0.78 1.07 2.54 19.48
20.09.2002 12.09 2.49 0.69 0.79 1.12 2.58 19.76
Contd/...

Unit: Rupees/Litre
Petroleum OMCs Inland Price
Effective Ex-Refinery Customs/ Develop'nt Distribution Dealer's Freight Differencial Fixed
Date Price Exise Duty Levy Margin Commission Margin Claim GST Sale Price
02.10.2002 12.53 2.05 0.69 0.79 1.12 2.58 19.76
16.10.2002 13.03 2.52 0.73 0.84 1.12 2.74 20.98
01.11.2002 13.27 3.07 0.77 0.88 1.12 2.87 21.98
16.11.2002 12.59 3.28 0.75 0.85 1.12 2.79 21.38
01.12.2002 11.28 3.50 0.70 0.80 1.12 2.61 20.01
16.12.2002 11.43 3.50 0.71 0.81 1.13 2.64 20.22
01.01.2003 12.16 3.50 0.74 0.85 1.13 2.76 21.14
16.01.2003 12.63 3.50 0.76 0.87 1.13 2.83 21.72
01.02.2003 12.62 3.50 0.76 0.87 1.14 2.83 21.72
16.02.2003 13.93 3.50 0.82 0.93 1.14 3.05 23.37
01.03.2003 15.27 3.50 0.88 1.00 1.14 3.27 25.06
16.03.2003 15.90 3.50 0.91 1.04 1.20 3.38 25.93
01.04.2003 14.66 3.50 0.86 0.98 1.33 3.20 24.53
16.04.2003 12.06 3.50 0.74 0.85 1.35 2.78 21.28
01.05.2003 11.22 3.50 0.71 0.81 1.35 2.64 20.23
16.05.2003 11.08 3.50 0.69 0.79 1.25 2.60 19.91
01.06.2003 11.08 3.50 0.69 0.79 1.25 2.60 19.91
16.06.2003 11.24 3.50 0.70 0.80 1.17 2.61 20.02
01.07.2003 11.47 3.50 0.71 0.81 1.17 2.65 20.31
16.07.2003 11.32 3.50 0.69 0.79 1.02 2.60 19.92
HIGH SPEED DIESEL OIL SALE PRICE (Continued)
01.08.2003 11.41 3.50 0.70 0.80 1.02 2.61 20.04
16.08.2003 12.01 3.50 0.72 0.82 0.82 2.68 20.55
01.09.2003 12.56 3.50 0.75 0.85 0.88 2.78 21.32
16.09.2003 12.85 3.50 0.76 0.87 0.92 2.84 21.74
01.10.2003 12.27 3.50 0.73 0.84 0.92 2.74 21.00
16.10.2003 12.31 3.50 0.73 0.84 0.96 2.75 21.09
01.11.2003 13.00 3.50 0.77 0.88 0.96 2.87 21.98
16.11.2003 13.03 3.50 0.77 0.88 1.13 2.90 22.21
01.12.2003 13.57 3.50 0.80 0.91 1.13 2.99 22.90
16.12.2003 13.30 3.50 0.79 0.91 1.31 2.97 22.78
01.01.2004 13.90 2.73 0.79 0.91 1.48 2.97 22.78
16.01.2004 14.75 2.73 0.83 0.95 1.48 3.11 23.85
01.02.2004 14.75 2.73 0.83 0.95 1.48 3.11 23.85
07.02.2004 15.80 1.68 0.83 0.95 1.48 3.11 23.85
16.02.2004 14.91 2.50 0.83 0.95 1.48 3.10 23.77
01.03.2004 14.65 2.98 0.83 0.95 1.26 3.10 23.77
16.03.2004 14.69 2.98 0.83 0.95 1.22 3.10 23.77
01.04.2004 14.52 2.98 0.82 0.94 1.12 3.06 23.44
16.04.2004 14.86 3.00 0.84 0.96 1.23 3.13 24.02
01.05.2004 15.42 2.62 0.85 0.97 1.33 3.18 24.37
16.05.2004 16.84 1.02 0.85 0.97 1.51 3.18 24.37
01.06.2004 17.16 0.58 0.85 0.97 1.63 3.18 24.37
16.06.2004 16.80 0.94 0.85 0.97 1.63 3.18 24.37
01.07.2004 16.57 1.24 0.85 0.97 1.56 3.18 24.37
16.07.2004 16.71 1.01 0.85 0.97 1.65 3.18 24.37
01.08.2004 18.13 0.85 0.97 1.24 3.18 24.37
16.08.2004 19.94 0.85 0.97 -0.57 3.18 24.37
Contd/...

Unit: Rupees/Litre
Petroleum OMCs Inland Price
Effective Ex-Refinery Customs/ Develop'nt Distribution Dealer's Freight Differencial Fixed
Date Price Exise Duty Levy Margin Commission Margin Claim GST Sale Price
01.09.2004 20.60 0.85 0.97 -1.23 3.18 24.37
16.09.2004 20.54 0.85 0.97 -1.17 3.18 24.37
01.10.2004 21.75 0.85 0.97 -2.38 3.18 24.37
16.10.2004 22.25 0.85 0.97 -2.88 3.18 24.37
01.11.2004 23.15 0.85 0.97 -3.78 3.18 24.37
16.11.2004 22.81 0.85 0.97 -3.44 3.18 24.37
01.12.2004 21.91 0.85 0.97 -2.54 3.18 24.37
16.12.2004 20.50 0.91 1.04 0.12 3.39 25.96
01.01.2005 20.05 0.65 0.91 1.05 0.13 3.42 26.21
16.01.2005 18.85 0.65 0.91 1.05 1.33 3.42 26.21
02.02.2005 19.96 0.38 0.95 1.08 1.25 3.54 27.16
16.02.2005 21.20 0.95 1.08 0.39 3.54 27.16
01.03.2005 21.60 0.44 0.98 1.12 0.39 3.68 28.21
16.03.2005 24.62 1.02 1.16 0.39 -1.92 3.79 29.06
01.04.2005 26.07 1.02 1.16 1.19 -4.17 3.79 29.06
16.04.2005 27.00 1.02 1.16 1.66 -5.57 3.79 29.06
01.05.2005 25.68 1.02 1.16 1.66 -4.25 3.79 29.06
17.05.2005 25.02 1.02 1.16 1.66 -3.59 3.79 29.06
01.06.2005 23.77 1.02 1.16 1.35 -2.03 3.79 29.06
16.06.2005 26.20 1.02 1.16 1.35 -4.46 3.79 29.06
HIGH SPEED DIESEL OIL SALE PRICE (Continued)
01.07.2005 28.87 1.11 1.27 1.40 -5.05 4.14 31.74
16.07.2005 29.43 1.11 1.27 1.40 -5.61 4.14 31.74
01.08.2005 28.72 1.11 1.27 1.40 -4.90 4.14 31.74
16.08.2005 28.04 1.11 1.27 1.40 -4.22 4.14 31.74
01.09.2005 29.40 1.21 1.38 1.40 -3.31 4.51 34.59
16.09.2005 31.45 1.21 1.38 1.40 -5.36 4.51 34.59
01.10.2005 30.32 1.30 1.48 1.40 -2.17 4.85 37.18
16.10.2005 30.85 1.30 1.48 1.40 -2.70 4.85 37.18
01.11.2005 29.07 1.30 1.48 1.40 -0.92 4.85 37.18
16.11.2005 25.84 2.31 1.30 1.48 1.40 4.85 37.18
01.12.2005 25.24 2.91 1.30 1.48 1.40 4.85 37.18
16.12.2005 25.23 2.92 1.30 1.48 1.40 4.85 37.18
01.01.2006 26.83 1.32 1.30 1.48 1.40 4.85 37.18
16.01.2006 27.38 0.77 1.30 1.48 1.40 4.85 37.18
01.02.2006 28.08 0.07 1.30 1.48 1.40 4.85 37.18
16.02.2006 27.44 0.71 1.30 1.48 1.40 4.85 37.18
01.03.2006 27.50 0.65 1.30 1.48 1.40 4.85 37.18
16.03.2006 29.60 1.05 1.20 1.40 -0.92 4.85 37.18
01.04.2006 30.48 1.05 1.20 1.40 -1.80 4.85 37.18
16.04.2006 32.98 1.05 1.20 1.53 -4.43 4.85 37.18
01.05.2006 35.15 1.10 1.25 1.85 -5.67 5.05 38.73
16.05.2006 35.64 1.10 1.25 1.85 -6.16 5.05 38.73
01.06.2006 34.92 1.10 1.25 1.85 -5.44 5.05 38.73
16.06.2006 35.45 1.10 1.25 1.75 -5.87 5.05 38.73
01.07.2006 35.89 1.10 1.25 1.54 -6.10 5.05 38.73
16.07.2006 36.09 1.10 1.25 1.28 -6.04 5.05 38.73
01.08.2006 36.57 1.10 1.25 0.98 -6.22 5.05 38.73
16.08.2006 35.99 1.10 1.25 0.98 -5.64 5.05 38.73
Contd/...

Unit: Rupees/Litre
Petroleum OMCs Inland Price
Effective Ex-Refinery Customs/ Develop'nt Distribution Dealer's Freight Differencial Fixed
Date Price Exise Duty Levy Margin Commission Margin Claim GST Sale Price
01.09.2006 36.22 1.10 1.25 0.94 -5.83 5.05 38.73
16.09.2006 34.82 1.10 1.25 0.94 -4.43 5.05 38.73
01.10.2006 30.98 1.10 1.25 0.94 -0.59 5.05 38.73
16.10.2006 29.98 0.41 1.10 1.25 0.94 5.05 38.73
01.11.2006 30.15 0.24 1.10 1.25 0.94 5.05 38.73
16.11.2006 29.16 1.23 1.10 1.25 0.94 5.05 38.73
01.12.2006 29.99 0.23 1.10 1.25 1.11 5.05 38.73
16.12.2006 29.96 1.10 1.25 1.37 5.05 38.73
01.01.2007 29.64 0.16 1.10 1.25 1.53 5.05 38.73
16.01.2007 27.99 1.12 1.07 1.22 1.41 4.92 37.73
01.02.2007 27.42 1.79 1.07 1.22 1.31 4.92 37.73
16.02.2007 29.47 1.07 1.22 1.38 -0.33 4.92 37.73
01.03.2007 29.52 1.07 1.22 1.62 -0.62 4.92 37.73
16.03.2007 30.11 1.07 1.22 1.93 -1.52 4.92 37.73
01.04.2007 30.62 1.07 1.22 1.75 -1.85 4.92 37.73
16.04.2007 32.80 1.07 1.22 1.75 -4.03 4.92 37.73
01.05.2007 34.51 1.07 1.22 1.62 -5.61 4.92 37.73
16.05.2007 34.06 1.07 1.22 1.66 -5.20 4.92 37.73
01.06.2007 34.51 1.07 1.22 1.62 -5.61 4.92 37.73
10.06.2007 34.51 1.07 1.22 1.62 -5.61 4.92 37.73
16.06.2007 34.25 1.07 1.22 1.48 -5.21 4.92 37.73
01 07 2007 34 71 1 07 1 22 1 18 4 92 37 73
HIGH SPEED DIESEL OIL SALE PRICE (Continued)
-5.37 .
16.07.2007 35.37 1.07 1.22 1.18 -6.03 4.92 37.73
01.08.2007 36.40 1.07 1.22 1.30 -7.18 4.92 37.73
16.08.2007 35.30 1.07 1.22 1.24 -6.02 4.92 37.73
25.08.2007 35.30 1.07 1.22 1.24 -6.02 4.92 37.73
01.09.2007 34.67 1.07 1.22 1.22 -5.37 4.92 37.73
16.09.2007 36.47 1.07 1.22 1.38 -7.33 4.92 37.73
01.10.2007 38.82 1.07 1.22 1.59 -9.89 4.92 37.73
16.10.2007 38.68 1.07 1.22 1.48 -9.64 4.92 37.73
01.11.2007 40.28 1.07 1.22 1.65 -11.41 4.92 37.73
16.11.2007 44.58 1.07 1.22 1.86 -15.92 4.92 37.73
02.12.2007 45.68 1.07 1.22 1.98 -17.14 4.92 37.73
16.12.2007 43.54 1.07 1.22 1.64 -14.66 4.92 37.73
01.01.2008 45.64 1.07 1.22 1.64 -16.76 4.92 37.73
17.01.2008 47.39 1.07 1.22 2.30 -19.17 4.92 37.73
01.02.2008 45.11 1.07 1.22 1.69 -16.50 4.92 37.51
17.02.2008 45.63 1.07 1.22 1.67 -16.78 4.92 37.73
01.03.2008 49.24 1.17 1.33 1.94 -17.83 5.38 41.23
16.03.2008 52.65 1.25 1.43 2.03 -18.99 5.76 44.13
01.04.2008 56.30 1.25 1.43 1.86 -22.47 5.76 44.13
18.04.2008 56.80 1.33 1.52 1.79 -20.46 6.15 47.13
01.05.2008 63.56 1.42 1.62 1.53 -24.54 6.54 50.13
16.05.2008 66.50 1.42 1.62 1.86 -27.81 6.54 50.13
01.06.2008 75.46 1.42 1.62 2.16 -37.07 6.54 50.13
21.06.2008 75.42 1.42 1.62 2.08 -36.95 6.54 50.13
29.06.2008 75.46 1.42 1.62 2.16 -37.07 6.54 50.13
01.07.2008 77.42 1.55 1.77 2.22 -35.42 7.60 55.14
Source: DG(Oil)

Unit: Rupees/Litre
Petroleum OMCs Inland Price
Effective Ex-Refinery Customs/ Develop'nt Distribution Dealer's Freight Differencial Fixed
Date Price Exise Duty Levy Margin Commission Margin Claim GST Sale Price
01.07.2001 11.69 0.04 0.83 0.21 1.25 2.10 16.13
16.07.2001 11.53 0.04 0.83 0.22 1.25 2.08 15.95
01.08.2001 10.86 0.04 0.83 0.21 1.25 1.98 15.17
16.08.2001 11.18 0.04 0.83 0.21 1.25 2.03 15.54
01.09.2001 11.33 0.04 0.83 0.21 1.25 2.05 15.71
16.09.2001 11.83 0.04 0.83 0.22 1.26 2.13 16.31
01.10.2001 11.72 0.04 0.83 0.22 1.30 2.12 16.23
16.10.2001 10.22 0.04 0.83 0.20 1.30 1.89 14.48
01.11.2001 9.75 0.04 0.83 0.19 1.38 1.83 14.02
16.11.2001 9.22 0.04 0.83 0.18 1.38 1.75 13.40
01.12.2001 8.18 0.04 0.83 0.16 1.21 1.56 11.98
16.12.2001 7.87 0.04 0.83 0.16 1.15 1.51 11.56
01.01.2002 8.26 0.04 1.08 0.17 1.15 1.61 12.31
16.01.2002 8.40 0.04 1.08 0.17 1.15 1.63 12.47
01.02.2002 8.46 0.04 1.08 0.17 1.09 1.63 12.47
16.02.2002 8.75 0.04 1.08 0.17 1.08 1.67 12.79
01.03.2002 8.93 0.04 1.08 0.18 1.07 1.70 13.00
16.03.2002 9.64 0.04 1.08 0.24 1.05 1.81 13.86
02.04.2002 10.24 0.04 0.43 0.29 1.05 1.81 13.86
Table: 2.15.5
LIGHT DIESEL OIL SALE PRICE
. . . . . . . . .
16.04.2002 10.62 0.04 0.00 0.34 1.05 1.81 13.86
01.05.2002 10.62 0.04 0.34 0.39 1.12 1.88 14.39
16.05.2002 10.82 0.04 1.42 0.46 1.12 2.08 15.94
01.06.2002 10.94 0.04 1.42 0.52 1.15 2.11 16.18
16.06.2002 10.66 0.00 1.21 0.54 1.22 2.04 15.67
01.07.2002 11.11 1.17 0.57 1.22 2.11 16.18
16.07.2002 10.54 0.63 1.17 0.57 1.22 2.12 16.25
01.08.2002 10.47 0.63 1.17 0.56 1.22 2.11 16.16
16.08.2002 10.30 0.62 1.17 0.56 1.24 2.08 15.97
01.09.2002 10.85 0.65 1.17 0.58 1.23 2.17 16.65
20.09.2002 11.94 0.96 0.59 1.23 2.21 16.93
02.10.2002 12.21 0.69 0.59 1.23 2.21 16.93
16.10.2002 12.69 0.96 0.62 1.23 2.33 17.83
01.11.2002 12.53 1.17 0.62 1.23 2.33 17.88
16.11.2002 11.49 1.17 0.58 1.23 2.17 16.64
01.12.2002 10.99 1.20 0.56 1.30 2.11 16.16
16.12.2002 11.05 1.20 0.56 1.31 2.12 16.24
01.01.2003 12.18 1.20 0.61 1.31 2.30 17.60
16.01.2003 12.12 1.20 0.61 1.31 2.29 17.53
01.02.2003 12.76 1.20 0.64 1.31 2.39 18.30
16.02.2003 13.83 1.20 0.69 1.31 2.55 19.58
01.03.2003 14.58 1.20 0.71 1.31 2.67 20.47
16.03.2003 14.88 1.20 0.73 1.41 2.73 20.95
01.04.2003 12.80 1.20 0.65 1.56 2.43 18.64
16.04.2003 11.14 1.20 0.58 1.59 2.18 16.69
01.05.2003 10.88 1.20 0.57 1.59 2.14 16.38
16.05.2003 10.74 1.20 0.56 1.49 2.10 16.09
Contd/...

Unit: Rupees/Litre
Petroleum OMCs Inland Price
Effective Ex-Refinery Customs/ Develop'nt Distribution Dealer's Freight Differencial Fixed
Date Price Exise Duty Levy Margin Commission Margin Claim GST Sale Price
01.06.2003 10.88 1.20 0.57 1.49 2.12 16.26
16.06.2003 11.05 1.20 0.57 1.32 2.12 16.26
01.07.2003 11.21 1.20 0.57 1.32 2.15 16.45
16.07.2003 11.23 1.20 0.56 1.00 2.10 16.09
01.08.2003 11.34 1.20 0.56 1.00 2.12 16.22
16.08.2003 11.94 1.20 0.58 0.80 2.18 16.70
01.09.2003 12.12 1.20 0.59 0.86 2.22 16.99
16.09.2003 12.13 1.20 0.59 0.95 2.23 17.10
01.10.2003 11.58 1.20 0.57 0.95 2.15 16.45
16.10.2003 12.13 1.20 0.60 1.15 2.26 17.34
01.11.2003 12.58 1.20 0.62 1.16 2.33 17.89
16.11.2003 12.46 1.20 0.62 1.26 2.33 17.87
01.12.2003 12.87 1.20 0.64 1.26 2.40 18.37
16.12.2003 12.67 1.20 0.65 1.68 2.43 18.63
01.01.2004 13.36 0.44 0.65 1.75 2.43 18.63
16.01.2004 14.19 0.44 0.68 1.75 2.56 19.62
01.02.2004 14.74 0.44 0.71 1.75 2.65 20.29
07.02.2004 14.74 0.44 0.71 1.75 2.65 20.29
16.02.2004 13.61 1.20 0.69 1.75 2.59 19.84
01.03.2004 13.88 1.20 0.69 1.54 2.60 19.91
LIGHT DIESEL OIL SALE PRICE (continued)
16.03.2004 13.74 1.20 0.69 1.54 2.58 19.75
01.04.2004 13.64 1.20 0.68 1.39 2.54 19.45
16.04.2004 13.96 1.20 0.70 1.55 2.61 20.02
01.05.2004 14.73 1.20 0.73 1.64 2.75 21.05
16.05.2004 15.94 0.73 1.63 2.75 21.05
01.06.2004 16.01 0.73 1.56 2.75 21.05
16.06.2004 15.69 0.31 0.73 1.56 2.75 21.04
01.07.2004 15.51 0.49 0.73 1.57 2.75 21.05
16.07.2004 16.05 0.73 1.52 2.75 21.05
01.08.2004 17.24 0.73 0.33 2.75 21.05
16.08.2004 18.44 0.73 0.13 -1.00 2.75 21.05
01.09.2004 19.19 0.73 0.13 -1.75 2.75 21.05
16.09.2004 18.79 0.73 0.13 -1.35 2.75 21.05
01.10.2004 20.00 0.73 0.13 -2.56 2.75 21.05
16.10.2004 20.00 0.73 0.13 -2.56 2.75 21.05
01.11.2004 20.00 0.73 0.13 -2.56 2.75 21.05
16.11.2004 20.00 0.73 0.13 -2.56 2.75 21.05
01.12.2004 19.93 0.73 0.13 -2.49 2.75 21.05
16.12.2004 18.18 0.78 0.53 2.92 22.41
01.01.2005 18.35 0.25 0.80 0.53 2.99 22.92
16.01.2005 17.55 0.25 0.80 1.33 2.99 22.92
02.02.2005 18.97 0.25 0.85 1.09 3.17 24.33
16.02.2005 19.52 0.85 0.79 3.17 24.33
01.03.2005 20.39 0.88 0.79 3.31 25.37
16.03.2005 22.86 0.92 0.79 -1.62 3.44 26.39
01.04.2005 24.16 0.92 1.22 -3.35 3.44 26.39
16.04.2005 24.87 0.92 2.03 -4.87 3.44 26.39
01.05.2005 24.01 0.92 2.03 -4.01 3.44 26.39
Contd/...

Unit: Rupees/Litre
Petroleum OMCs Inland Price
Effective Ex-Refinery Customs/ Develop'nt Distribution Dealer's Freight Differencial Fixed
Date Price Exise Duty Levy Margin Commission Margin Claim GST Sale Price
17.05.2005 23.25 0.92 2.03 -3.25 3.44 26.39
01.06.2005 22.55 0.92 1.59 -2.11 3.44 26.39
16.06.2005 24.99 0.92 1.59 -4.55 3.44 26.39
01.07.2005 26.79 0.97 1.61 -5.16 3.63 27.84
16.07.2005 27.44 0.97 1.61 -5.81 3.63 27.84
01.08.2005 25.92 0.97 1.61 -4.29 3.63 27.84
16.08.2005 26.45 0.97 1.61 -4.82 3.63 27.84
01.09.2005 27.30 1.02 1.61 -4.52 3.81 29.22
16.09.2005 28.78 1.02 1.61 -6.00 3.81 29.22
01.10.2005 28.32 1.08 1.61 -4.08 4.04 30.97
16.10.2005 28.51 1.08 1.61 -4.27 4.04 30.97
01.11.2005 26.48 1.08 1.61 -2.24 4.04 30.97
16.11.2005 23.83 0.41 1.08 1.61 4.04 30.97
01.12.2005 23.75 0.49 1.08 1.61 4.04 30.97
16.12.2005 23.85 0.39 1.08 1.61 4.04 30.97
01.01.2006 24.86 1.08 1.61 -0.62 4.04 30.97
16.01.2006 25.67 1.08 1.61 -1.43 4.04 30.97
01.02.2006 26.76 1.08 1.61 -2.52 4.04 30.97
16.02.2006 25.92 1.08 1.61 -1.68 4.04 30.97
01.03.2006 26.41 1.08 1.61 -2.17 4.04 30.97
16.03.2006 28.16 0.91 1.61 -3.75 4.04 30.97
01 04 2006 28 79 0 91 1 61 -4 38 4 04 30 97
LIGHT DIESEL OIL SALE PRICE (continued)
. . . . . . . .
16.04.2006 30.97 0.91 1.77 -6.72 4.04 30.97
01.05.2006 33.21 0.96 2.21 -8.06 4.25 32.57
16.05.2006 32.62 0.96 2.21 -7.47 4.25 32.57
01.06.2006 32.07 0.96 2.21 -6.92 4.25 32.57
16.06.2006 32.59 0.96 2.20 -7.43 4.25 32.57
01.07.2006 32.50 0.96 2.05 -7.19 4.25 32.57
16.07.2006 32.89 0.96 1.85 -7.38 4.25 32.57
01.08.2006 32.89 0.96 1.69 -7.22 4.25 32.57
16.08.2006 32.88 0.96 1.69 -7.21 4.25 32.57
01.09.2006 32.02 0.96 1.65 -6.31 4.25 32.57
16.09.2006 30.51 0.96 1.65 -4.80 4.25 32.57
01.10.2006 27.12 0.96 1.65 -1.41 4.25 32.57
16.10.2006 27.08 0.96 1.65 -1.37 4.25 32.57
01.11.2006 27.30 0.96 1.65 -1.59 4.25 32.57
16.11.2006 26.56 0.96 1.65 -0.85 4.25 32.57
01.12.2006 27.01 0.96 1.85 -1.50 4.25 32.57
16.12.2006 26.97 0.96 2.26 -1.87 4.25 32.57
01.01.2007 26.64 0.96 2.40 -1.68 4.25 32.57
16.01.2007 25.18 0.96 2.21 -0.03 4.25 32.57
01.02.2007 24.97 0.26 0.96 2.13 4.25 32.57
16.02.2007 27.09 0.96 2.18 -1.91 4.25 32.57
01.03.2007 26.49 0.96 2.31 -1.44 4.25 32.57
16.03.2007 27.53 0.96 2.59 -2.76 4.25 32.57
01.04.2007 28.30 0.96 2.72 -3.66 4.25 32.57
16.04.2007 30.54 0.96 2.72 -5.90 4.25 32.57
01.05.2007 31.70 0.96 2.28 -6.62 4.25 32.57
16.05.2007 31.03 0.96 2.28 -5.95 4.25 32.57
01.06.2007 31.70 0.96 2.28 -6.62 4.25 32.57
Contd/...

Unit: Rupees/Litre
Petroleum OMCs Inland Price
Effective Ex-Refinery Customs/ Develop'nt Distribution Dealer's Freight Differencial Fixed
Date Price Exise Duty Levy Margin Commission Margin Claim GST Sale Price
10.06.2007 29.90 0.96 2.28 -4.82 4.25 32.57
16.06.2007 29.43 0.96 2.17 -4.24 4.25 32.57
01.07.2007 30.11 0.96 0.00 -4.85 4.25 30.47
16.07.2007 30.84 0.96 2.10 -5.58 4.25 32.57
01.08.2007 31.46 0.96 2.14 -6.24 2.25 30.57
16.08.2007 30.70 0.96 2.06 -5.40 4.25 32.57
25.08.2007 30.70 0.96 2.06 -5.40 4.25 32.57
01.09.2007 30.03 0.96 1.94 -4.61 4.25 32.57
16.09.2007 32.03 0.96 2.02 -6.69 4.25 32.57
01.10.2007 33.65 0.96 2.74 -9.03 4.25 32.57
16.10.2007 33.60 0.96 2.79 -9.03 4.25 32.57
01.11.2007 35.68 0.96 2.89 -11.21 4.25 32.57
16.11.2007 39.07 0.96 3.04 -14.75 4.25 32.57
02.12.2007 39.83 0.96 3.00 -15.47 4.25 32.57
16.12.2007 37.88 0.96 2.59 -13.11 4.25 32.57
01.01.2008 39.47 0.96 2.59 -14.70 4.25 32.57
17.01.2008 40.86 0.96 2.80 -16.30 4.25 32.57
01.02.2008 38.58 0.96 2.50 -13.72 4.25 32.57
17.02.2008 39.51 0.96 2.49 -14.64 4.25 32.57
01.03.2008 42.87 1.06 2.74 -15.30 4.70 36.07
16.03.2008 45.62 1.13 2.83 -16.02 5.03 38.59
01 04 2008 47 98 1 13 3 02 -18 57 5 03 38 59
LIGHT DIESEL OIL SALE PRICE (continued)
. . . . . . . .
18.04.2008 49.65 1.22 2.93 -17.63 5.42 41.59
01.05.2008 54.36 1.31 2.80 -19.70 5.82 44.59
16.05.2008 58.17 1.31 3.15 -23.86 5.82 44.59
01.06.2008 67.58 1.31 3.53 -33.65 5.82 44.59
21.06.2008 64.68 1.31 3.34 -30.56 5.82 44.59
29.06.2008 67.58 1.31 3.53 -33.65 5.82 44.59
01.07.2008 66.73 1.43 3.52 -29.40 6.77 49.05
Source: DG(Oil).

Unit: Rupees/Tonne
Effective Date Landed Cost 15% Sales Tax Price of Imported Oil
13.07.2001 9,304.35 1,395.65 10,700.00
30.07.2001 9,533.04 1,429.96 10,963.00
15.08.2001 9,809.57 1,471.44 11,281.01
01.09.2001 10,133.04 1,519.96 11,653.00
16.09.2001 10,473.04 1,570.96 12,044.00
01.10.2001 10,809.57 1,621.44 12,431.01
16.10.2001 10,320.00 1,548.00 11,868.00
01.11.2001 9,412.17 1,411.83 10,824.00
16.11.2001 8,494.78 1,274.22 9,769.00
01.12.2001 7,875.65 1,181.35 9,057.00
16.12.2001 8,001.74 1,200.26 9,202.00
01.01.2002 8,109.57 1,216.44 9,326.01
16.01.2002 8,021.74 1,203.26 9,225.00
01.02.2002 7,898.26 1,184.74 9,083.00
16.02.2002 8,058.28 1,208.74 9,267.02
01.03.2002 8,228.70 1,234.31 9,463.01
16.03.2002 8,860.00 1,329.00 10,189.00
01.04.2002 9,421.74 1,413.26 10,835.00
16.04.2002 10,232.17 1,534.83 11,767.00
01.05.2002 10,149.57 1,522.44 11,672.01
16.05.2002 10,400.00 1,560.00 11,960.00
01.06.2002 10,756.52 1,613.48 12,370.00
16.06.2002 10,540.00 1,581.00 12,121.00
01.07.2002 10,143.48 1,521.52 11,665.00
16.07.2002 10,284.35 1,542.65 11,827.00
01.08.2002 10,511.30 1,576.70 12,088.00
16.08.2002 10,458.26 1,568.74 12,027.00
02.09.2002 10,897.39 1,634.61 12,532.00
16.09.2002 11,528.70 1,729.31 13,258.01
01.10.2002 11,406.09 1,710.91 13,117.00
16.10.2002 11,297.39 1,694.61 12,992.00
01.11.2002 10,780.00 1,617.00 12,397.00
16.11.2002 9,896.52 1,484.48 11,381.00
02.12.2002 9,569.57 1,435.44 11,005.01
16.12.2002 10,436.52 1,565.48 12,002.00
01.01.2003 10,436.52 1,565.48 12,002.00
16.01.2003 10,910.43 1,636.56 12,546.99
01.02.2003 10,857.39 1,628.61 12,486.00
17.02.2003 12,547.83 1,882.17 14,430.00
01.03.2003 13,021.74 1,953.26 14,975.00
17.03.2003 12,405.22 1,860.78 14,266.00
01.04.2003 11,199.13 1,679.87 12,879.00
15.04.2003 9,960.00 1,494.00 11,454.00
02.05.2003 9,715.65 1,457.35 11,173.00
16.05.2003 10,099.13 1,514.87 11,614.00
02.06.2003 10,267.83 1,540.17 11,808.00
16.06.2003 10,267.83 1,540.17 11,808.00
Contd/…..
Table: 2.16
(PSO Price Ex-Karachi)
DEREGULATED FURNACE OIL SALE PRICE

Unit: Rupees/Tonne
Effective Date Imported Oil Local Refineries
01.07.2003 12,622.00 12,437.25
16.07.2003 13,273.00 13,012.25
01.08.2003 13,273.00 12,882.30
16.08.2003 12,796.00 12,460.25
01.09.2003 12,796.00 12,135.95
16.09.2003 12,796.00 12,236.00
01.10.2003 12,796.00 11,702.40
16.10.2003 12,796.00 12,365.95
01.11.2003 12,796.00 12,219.90
16.11.2003 12,796.00 11,874.90
01.12.2003 12,796.00 11,854.20
16.12.2003 12,796.00 11,773.70
01.01.2004 12,796.00 11,694.35
16.01.2004 12,796.00 11,749.55
01.02.2004 12,796.00 12,517.75
16.02.2004 12,796.00 12,265.90
01.03.2004 12,796.00 11,692.05
16.03.2004 12,796.00 11,692.05
01.04.2004 12,796.00 11,496.55
16.04.2004 12,796.00 12,032.45
01.05.2004 13,112.00 12,713.25
17.05.2004 13,966.00 13,320.45
01.06.2004 14,255.40 13,948.35
16.06.2004 13,359.06 13,359.06
01.07.2004 13,300.33
16.07.2004 13,590.86 13,590.86
01.08.2004 13,828.00 13,828.00
16.08.2004 14,608.36 14,113.95
01.09.2004 14,235.86 14,235.86
16.09.2004 13,696.50 13,696.50
01.10.2004 13,696.50 13,696.50
11.10.2004 13,696.50 13,696.50
16.10.2004 14,810.00 14,810.00
01.11.2004 15,471.44 15,471.44
16.11.2004 14,593.50 14,593.50
01.12.2004 13,989.75 13,989.75
16.12.2004 13,989.75 13,246.85
01.01.2005 13,989.75 13,754.00
16.01.2005 14,034.60 14,034.60
01.02.2005 15,343.30 15,343.30
16.02.2005 15,443.35 15,443.35
01.03.2005 15,887.05 15,536.62
16.03.2005 15,897.60 15,897.60
01.04.2005 16,994.70 16,994.70
16.04.2005 18,209.10 18,209.10
01.05.2005 19,159.00
16.05.2005 19,225.75
01.06.2005 19,032.50
16.06.2005 19,484.45
Contd/…..
Furnace Oil Sale Price (continued)

Unit: Rupees/Tonne
Effective Date Imported Oil
Ex-ZOT Ex-Keamari
01.07.2005 - 20,427.45 20,260.70
16.07.2005 - 21,065.70 20,898.95
01.08.2005 19,428.82 20,012.30 19,845.55
16.08.2005 - 20,844.90 20,678.15
01.09.2005 22,839.54 22,466.40 22,299.65
16.09.2005 23,698.05 23,703.80 23,537.05
01.10.2005 23,684.16 23,690.00 23,523.25
16.10.2005 23,684.16 23,208.15 23,041.40
01.11.2005 23,227.70 23,058.65 22,891.90
16.11.2005 22,962.63 22,758.50 22,591.75
01.12.2005 22,962.63 21,733.85 21,567.10
16.12.2005 22,962.63 21,818.95 21,652.20
01.01.2006 22,962.63 20,810.40 20,643.65
16.01.2006 22,962.63 21,614.25 21,447.50
24.01.2006 22,736.75 21,614.25 21,447.50
01.02.2006 22,736.75 23,960.25 23,787.75
04.02.2006 24,045.93 23,960.25 23,787.75
16.02.2006 24,045.93 25,079.20 24,912.45
01.03.2006 24,829.56 24,681.30 24,514.55
16.03.2006 25,706.24 25,599.00 25,432.25
01.04.2006 25,532.16 25,668.00 25,501.25
11.04.2006 25,901.05 25,668.00 25,501.25
16.04.2006 25,901.05 25,940.55 25,773.80
22.04.2006 26,521.50 25,940.55 25,773.80
01.05.2006 26,854.80 26,991.65 26,824.90
16.05.2006 26,854.80 26,795.00 26,628.25
01.06.2006 25,479.80 26,080.85 25,914.10
16.06.2006 25,219.45 25,364.40 25,197.65
01.07.2006 24,182.29 24,224.75 24,058.00
16.07.2006 24,993.78 25,102.20 24,935.45
21.07.2006 26,446.50 25,102.20 24,935.45
01.08.2006 26,446.50 25,789.90 25,623.15
16.08.2006 25,602.07 25,470.20 25,303.45
01.09.2006 23,331.79 23,339.25 23,246.10
16.09.2006 21,348.66 21,531.45 21,364.70
01.10.2006 20,297.05 20,598.80 20,432.05
16.10.2006 21,457.79 21,209.45 21,042.70
01.11.2006 21,378.75 21,751.10 21,584.35
16.11.2006 21,755.37 21,739.60 21,572.85
01.12.2006 21,087.27 20,527.50 20,360.75
16.12.2006 21,087.27 21,234.75 21,068.00
01.01.2007 21,177.25 21,344.00 21,177.25
16.01.2007 20,529.80 20,696.55 20,529.80
01.02.2007 20,462.08 20,314.75 20,148.00
16.02.2007 22,789.84 22,602.10 22,435.35
01.03.2007 21,851.83 21,432.55 21,265.80
16.03.2007 22,531.31 22,311.15 22,144.40
01.04.2007 23,022.07 23,126.50 22,959.75
16.04.2007 25,337.02 25,142.45 24,975.70
01.05.2007 25,885.50 25,451.80 25,285.05
16.05.2007 25,876.22 25,889.95 25,723.20
01.06.2007 25,758.33 25,742.75 25,576.00
16.06.2007 25,647.69 25,742.75 25,576.00
01.07.2007 27,062.06 27,134.25 26,967.50
16.07.2007 27,966.29 27,908.20 27.741.45
01.08.2007 29,040.27 29,124.90 28,958.15
16.08.2007 28,839.63 28,862.70 28,695.95
01.09.2007 27,546.34 27,566.65 27,399.90
16.0 .2007 28,804.05 28,853.50 28,686.75
Contd/…..
Local Reficeries
Furnace Oil Sale Price (continued)
9

Unit: Rupees/Tonne
Effective Date Imported Oil
Ex-ZOT Ex-Keamari
Local Reficeries
Furnace Oil Sale Price (continued)
01.10.2007 30,008.79 30,095.50 29,928.75
16.10.2007 30,187.07 30,294.45 30,127.70
02.11.2007 34,556.68 34,651.80 34,485.05
16.11.2007 40,448.97 38,640.00 38,473.25
01.12.2007 36,971.35 37,569.35 37,402.60
16.12.2007 35,121.00 35,152.05 34,985.30
01.01.2008 35,748.90 35,846.65 35,679.90
16.01.2008 37,737.25 37,671.70 37,504.95
01.02.2008 35,223.35 35,252.90 35,076.15
16.02.2008 35,581.00 35,669.55 35,502.80
01.03.2008 36,650.50 36,791.95 36,625.20
16.03.2008 38,703.25 38729.7 38,562.95
01.04.2008 38,771.10 38,794.10 38,627.35
16.04.2008 40,319.00 40,352.35 40,185.60
01.05.2008 44,101.35 43,230.27 43,050.25
16.05.2008 48,723.20 46,364.02 46,184.00
01.06.2008 50,764.45 52,229.55 52,037.50
16.06.2008 48,984.25 50,112.81 49,920.35
Source: PSO.
* Local Refineries: NRL, PRL, Bosicor.
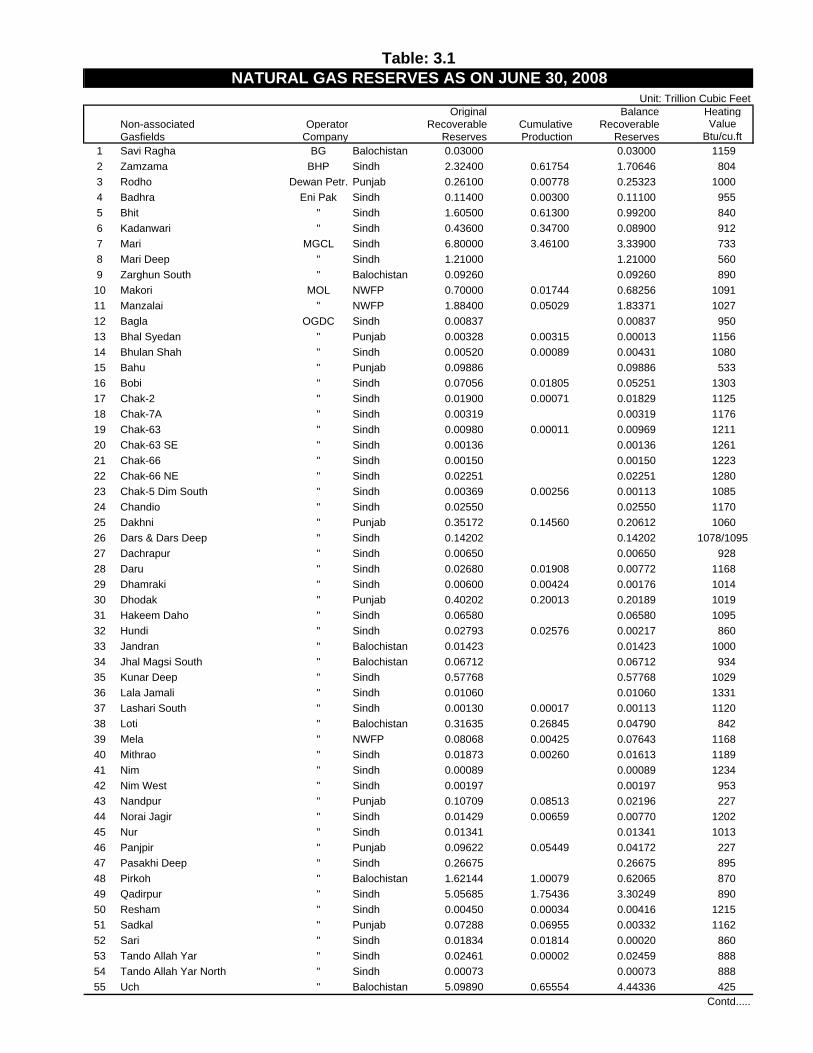
Unit: Trillion Cubic FeetOriginal Balance Heating
Non-associated Operator Recoverable Cumulative Recoverable ValueGasfields Company Reserves Production Reserves Btu/cu.ft
1 Savi Ragha BG Balochistan 0.03000 0.03000 1159 2 Zamzama BHP Sindh 2.32400 0.61754 1.70646 804 3 Rodho Dewan Petr. Punjab 0.26100 0.00778 0.25323 1000 4 Badhra Eni Pak Sindh 0.11400 0.00300 0.11100 955 5 Bhit " Sindh 1.60500 0.61300 0.99200 840 6 Kadanwari " Sindh 0.43600 0.34700 0.08900 912 7 Mari MGCL Sindh 6.80000 3.46100 3.33900 733 8 Mari Deep " Sindh 1.21000 1.21000 560 9 Zarghun South " Balochistan 0.09260 0.09260 890 10 Makori MOL NWFP 0.70000 0.01744 0.68256 1091 11 Manzalai " NWFP 1.88400 0.05029 1.83371 1027 12 Bagla OGDC Sindh 0.00837 0.00837 950 13 Bhal Syedan " Punjab 0.00328 0.00315 0.00013 1156 14 Bhulan Shah " Sindh 0.00520 0.00089 0.00431 1080 15 Bahu " Punjab 0.09886 0.09886 533 16 Bobi " Sindh 0.07056 0.01805 0.05251 1303 17 Chak-2 " Sindh 0.01900 0.00071 0.01829 1125 18 Chak-7A " Sindh 0.00319 0.00319 1176 19 Chak-63 " Sindh 0.00980 0.00011 0.00969 1211 20 Chak-63 SE " Sindh 0.00136 0.00136 1261 21 Chak-66 " Sindh 0.00150 0.00150 1223 22 Chak-66 NE " Sindh 0.02251 0.02251 1280 23 Chak-5 Dim South " Sindh 0.00369 0.00256 0.00113 1085 24 Chandio " Sindh 0.02550 0.02550 1170 25 Dakhni " Punjab 0.35172 0.14560 0.20612 1060 26 Dars & Dars Deep " Sindh 0.14202 0.14202 1078/109527 Dachrapur " Sindh 0.00650 0.00650 928 28 Daru " Sindh 0.02680 0.01908 0.00772 1168 29 Dhamraki " Sindh 0.00600 0.00424 0.00176 1014 30 Dhodak " Punjab 0.40202 0.20013 0.20189 1019 31 Hakeem Daho " Sindh 0.06580 0.06580 1095 32 Hundi " Sindh 0.02793 0.02576 0.00217 860 33 Jandran " Balochistan 0.01423 0.01423 1000 34 Jhal Magsi South " Balochistan 0.06712 0.06712 934 35 Kunar Deep " Sindh 0.57768 0.57768 1029 36 Lala Jamali " Sindh 0.01060 0.01060 1331 37 Lashari South " Sindh 0.00130 0.00017 0.00113 1120 38 Loti " Balochistan 0.31635 0.26845 0.04790 842 39 Mela " NWFP 0.08068 0.00425 0.07643 1168 40 Mithrao " Sindh 0.01873 0.00260 0.01613 1189 41 Nim " Sindh 0.00089 0.00089 1234 42 Nim West " Sindh 0.00197 0.00197 953 43 Nandpur " Punjab 0.10709 0.08513 0.02196 227 44 Norai Jagir " Sindh 0.01429 0.00659 0.00770 1202 45 Nur " Sindh 0.01341 0.01341 1013 46 Panjpir " Punjab 0.09622 0.05449 0.04172 227 47 Pasakhi Deep " Sindh 0.26675 0.26675 895 48 Pirkoh " Balochistan 1.62144 1.00079 0.62065 870 49 Qadirpur " Sindh 5.05685 1.75436 3.30249 890 50 Resham " Sindh 0.00450 0.00034 0.00416 1215 51 Sadkal " Punjab 0.07288 0.06955 0.00332 1162 52 Sari " Sindh 0.01834 0.01814 0.00020 860 53 Tando Allah Yar " Sindh 0.02461 0.00002 0.02459 888 54 Tando Allah Yar North " Sindh 0.00073 0.00073 888 55 Uch " Balochistan 5.09890 0.65554 4.44336 425
Contd.....
Table: 3.1NATURAL GAS RESERVES AS ON JUNE 30, 2008

Unit: Trillion Cubic FeetOriginal Balance Heating
Non-associated Operator Recoverable Cumulative Recoverable ValueGasfields Company Reserves Production Reserves Btu/cu.ft
56 Unar " Sindh 0.03435 0.03435 1034 57 Miano OMV Sindh 0.54200 0.34200 0.20000 920 58 Sawan " Sindh 1.50000 0.70800 0.79200 913 59 Ali OPII Sindh 0.01181 0.00639 0.00542 1045 60 Ahmad " Sindh 0.01292 0.00048 0.01244 851 61 Bilal " Sindh 908 62 Bilal North " Sindh 0.00296 0.00234 0.00062 898 63 Kamal North " Sindh 0.00353 0.00105 0.00248 1234 64 Kausar " Sindh 0.08994 0.06718 0.02276 947 65 Naimat Basal " Sindh 0.03483 0.02226 0.01257 977 66 Siraj South " Sindh 0.01595 0.01535 0.00060 946 67 Umar " Sindh 0.00479 0.00479 1168 68 Usman " Sindh 953 69 Rahim " Sindh 0.00030 0.00003 0.0002770 Ratana " Punjab 0.03437 0.03280 0.00157 1073 71 Badar PEL Sindh 0.03360 0.01286 0.02074 576 72 Kandara " Sindh 1.72500 1.72500 152 73 Khanpur " Sindh 0.02366 0.00398 0.01968 851 74 Hamza " Sindh 0.02260 0.02260 632 75 Hasan " Sindh 0.11715 0.03463 0.08252 639 76 Sadiq " Sindh 0.01188 0.00222 0.00966 654 77 Adhi PPL Punjab 0.50900 0.13900 0.37000 1250 78 Adam " Sindh 0.03700 0.03700 1162 79 Kandhkot " Sindh 1.68000 0.71500 0.96500 835 80 Mazarani " Sindh 0.18300 0.02000 0.16300 1010 81 Sui & Sui Deep " Balochistan 12.62500 9.35900 3.26600 975 82 Rehmat PETRONAS Sindh 0.10119 0.03019 0.07100 1040 83 Mehar " Sindh 0.40300 0.40300 1000 84 Chachar Tullow Sindh 0.10100 0.00485 0.09615 796 85 Sara " Sindh 0.03000 0.02697 0.00303 802 86 Suri " Sindh 0.03200 0.02766 0.00434 807 87 Bhatti & Nakurji BP Sindh 0.09773 0.08499 0.01275 1066 88 Bukhari & Bukhari Deep " Sindh 0.10142 0.10118 0.00025 1216 89 Buzdar & Buzdar South " Sindh 0.23882 0.13854 0.10028 943 90 Buzdar South Deep " Sindh 0.00776 0.00528 0.00248 975 91 Fateh Shah & F.S. North " Sindh 0.02365 0.00436 0.01929 1051 92 Golarchi " Sindh 0.08180 0.07230 0.00951 1021 93 Jabo " Sindh 0.01625 0.00885 0.00740 902 94 Jalal " Sindh 0.03039 0.02519 0.00520 1049 95 Jhaberi " Sindh 0.00896 0.00896 734 96 Jogwani (Duphri-4) " Sindh 0.03945 0.02328 0.01617 937 97 Junathi South " Sindh 0.00462 0.00462 1020 98 Kato " Sindh 0.00787 0.00632 0.00156 1225 99 Khorewah " Sindh 0.16879 0.14384 0.02495 1068
100 Khorewah Deep " Sindh 0.00774 0.00753 0.00021 1049 101 Koli " Sindh 0.01785 0.01629 0.00156 1023 102 Liari Deep " Sindh 0.00680 0.00544 0.00136 1101 103 Mahi " Sindh 0.00488 0.00488 1028 104 Missri " Sindh 0.00352 0.00184 0.00168 753 105 Mukhdumpur " Sindh 0.05781 0.04907 0.00873 1104 106 Mukhdumpur Deep " Sindh 0.02505 0.01748 0.00756 865 107 Matli " Sindh 0.04914 0.04912 0.00002 1012 108 Pir " Sindh 0.00799 0.00777 0.00022 1045 109 Raj " Sindh 0.00548 0.00381 0.00167 966
Contd.....
Natural Gas Reserves (Contd.)

Unit: Trillion Cubic FeetOriginal Balance Heating
Non-associated Operator Recoverable Cumulative Recoverable ValueGasfields Company Reserves Production Reserves Btu/cu.ft
110 Rind " Sindh 0.00251 0.00251 899 111 Sakhi Deep " Sindh 0.04061 0.02374 0.01687 1021 112 Sakhi South Deep " Sindh 0.01511 0.00944 0.00567 1032 113 Shah Dino BP Sindh 0.00072 0.00044 0.00028 820 114 Sonro " Sindh 0.02243 0.01690 0.00552 900 115 Tando Ghulam Ali " Sindh 0.00559 0.00379 0.00180 917 116 Turk " Sindh 0.17077 0.15732 0.01345 1118 117 Turk Deep " Sindh 0.11507 0.08369 0.03137 936 118 Zaur " Sindh 0.03173 0.02622 0.00552 1221 119 Zaur Deep " Sindh 0.01404 0.01339 0.00065 1109 120 Zaur West " Sindh 0.00047 0.00047 1127 121 Zaur South " Sindh 0.00105 0.00074 0.00031 1279
"ASSOCIATED GASES * 1.34285 0.98713 0.35572 TOTAL: TCF 52.94324 23.15343 29.78981 Normalized TCF at 900 btu/cu.ft. 49.00656 23.34731 25.65925 Million TOE 1,052.77 501.55 551.22
* See table 3.1.1 for details.Source: DGPC.
Natural Gas Reserves (Contd.)

Unit: Trillion Cubic FeetOriginal Balance Heating
Field Name Operator Recoverable Cumulative Recoverable ValueReserves Production Reserves Btu/cu.ft
1 Buzdar North OGDCL Sindh 0.00015 0.00001 0.00014 1319 2 Chak Naurang " Punjab 0.00050 0.00050 n.a.3 Chanda " NWFP 0.04892 0.01485 0.03407 1150 4 Fimkassar " Punjab 0.01607 0.01224 0.00383 1250 5 Jakhro " Sindh 0.00731 0.00731 845 6 Kal " Punjab 0.00250 0.00201 0.00050 1326 7 Kunar " Sindh 0.06758 0.01364 0.05394 1202 8 Lashari Centre " Sindh 0.00403 0.00250 0.00153 1120 9 Missakaswal " Punjab 0.02942 0.02075 0.00867 1220 10 Missan " Sindh 0.00005 0.00003 0.00002 1078 11 Pali " Sindh 0.00019 0.00002 0.00017 953 12 Pasaki " Sindh 0.00916 0.00656 0.00260 1334 13 Rajian " Punjab 0.00161 0.00159 0.00001 1335 14 Sono " Sindh 0.00521 0.00290 0.00232 1553 15 Tando Alam " Sindh 0.00765 0.00337 0.00428 1346 16 Thora " Sindh 0.00663 0.00256 0.00407 1328 17 Toot " Punjab 0.03759 0.03352 0.00407 1127 18 Bhangali OPII Punjab 0.00933 0.00903 0.00030 1420 19 Dhurnal " Punjab 0.12979 0.12915 0.00064 1268 20 Dhulian POL Punjab 0.21718 0.21114 0.00604 1317 21 Meyal " Punjab 0.29700 0.27288 0.02412 1210 22 Pariwali " Punjab 0.10080 0.05497 0.04583 1171 23 Pindori " Punjab 0.17220 0.06656 0.10564 1322 24 Turkwal " Punjab 0.00404 0.00349 0.00055 1386 25 Ali Zaur BP Sindh 0.00273 0.00181 0.00092 1513 26 Bachal " Sindh 0.00199 0.00199 1052 27 Dabhi, Dhabi North & South " Sindh 0.04806 0.04603 0.00203 1017 28 Duphri " Sindh 0.01317 0.00279 0.01039 945 29 Ghunghro " Sindh 0.00099 0.00099 n.a.30 Halipota " Sindh 0.00687 0.00271 0.00415 1115 31 Jagir " Sindh 0.00252 0.00185 0.00068 1253 32 Jhaberi South " Sindh 0.01083 0.00367 0.00716 913 33 Liari " Sindh 0.00280 0.00242 0.00038 1171 34 Mazari * " Sindh 0.02360 0.02078 0.00282 1454 35 M.Ismail Deep " Sindh 0.02873 0.01866 0.01006 1061 36 Nari " Sindh 0.01034 0.00803 0.00231 996 37 Sakhi " Sindh 0.00977 0.00653 0.00324 1450 38 Tajedi " Sindh n.a.39 Tangri " Sindh 0.00557 0.00512 0.00045 1209
TOTAL: TCF 1.34285 0.98713 0.35572 Normalized TCF at 900 btu/cu.ft. 1.83759 1.35800 0.47959 Million TOE 39.48 29.17 10.30
* Includes Mazari South and Mazari South DeepSource: DGPC.
Associated Gas Reserves as on June 30, 2008Table: 3.1.1
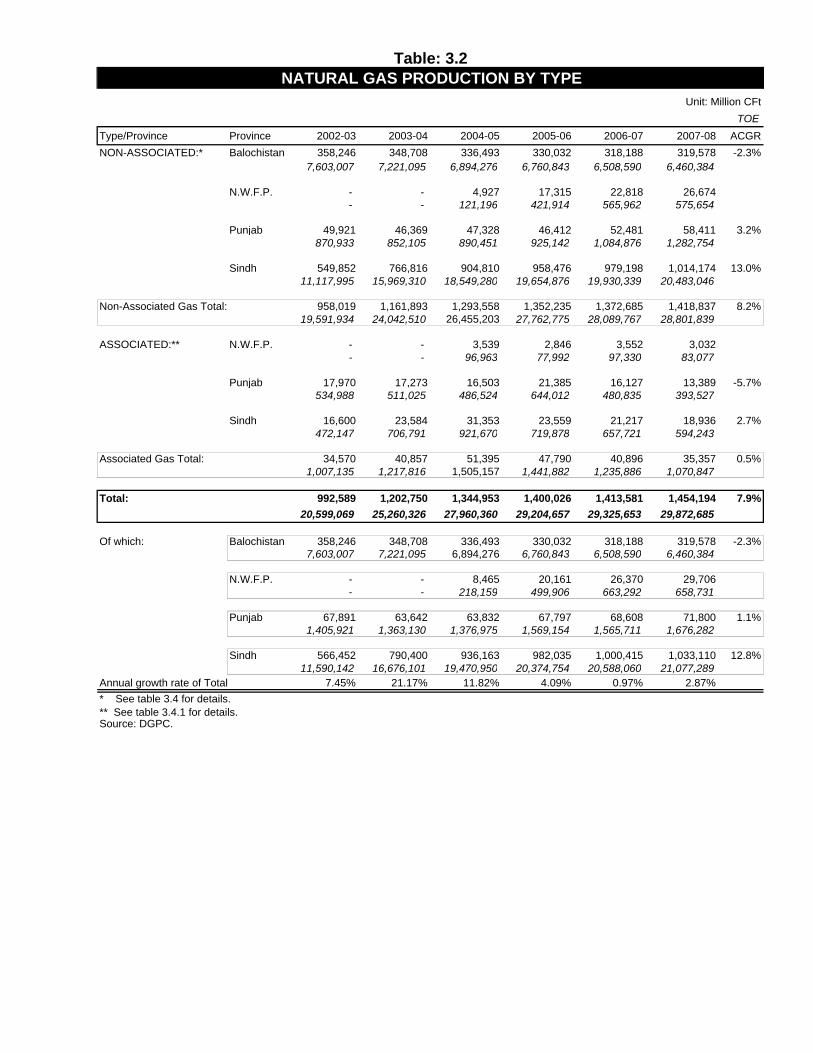
Table: 3.2NATURAL GAS PRODUCTION BY TYPE
Unit: Million CFtTOE
Type/Province Province 2002-03 2003-04 2004-05 2005-06 2006-07 2007-08 ACGRNON-ASSOCIATED:* Balochistan 358,246 348,708 336,493 330,032 318,188 319,578 -2.3%
7,603,007 7,221,095 6,894,276 6,760,843 6,508,590 6,460,384
N.W.F.P. - - 4,927 17,315 22,818 26,674- - 121,196 421,914 565,962 575,654
Punjab 49,921 46,369 47,328 46,412 52,481 58,411 3.2%870,933 852,105 890,451 925,142 1,084,876 1,282,754
Sindh 549,852 766,816 904,810 958,476 979,198 1,014,174 13.0%11,117,995 15,969,310 18,549,280 19,654,876 19,930,339 20,483,046
Non-Associated Gas Total: 958,019 1,161,893 1,293,558 1,352,235 1,372,685 1,418,837 8.2%19,591,934 24,042,510 26,455,203 27,762,775 28,089,767 28,801,839
ASSOCIATED:** N.W.F.P. - - 3,539 2,846 3,552 3,032- - 96,963 77,992 97,330 83,077
Punjab 17,970 17,273 16,503 21,385 16,127 13,389 -5.7%534,988 511,025 486,524 644,012 480,835 393,527
Sindh 16,600 23,584 31,353 23,559 21,217 18,936 2.7%472,147 706,791 921,670 719,878 657,721 594,243
Associated Gas Total: 34,570 40,857 51,395 47,790 40,896 35,357 0.5%1,007,135 1,217,816 1,505,157 1,441,882 1,235,886 1,070,847
Total: 992,589 1,202,750 1,344,953 1,400,026 1,413,581 1,454,194 7.9%20,599,069 25,260,326 27,960,360 29,204,657 29,325,653 29,872,685
Of which: Balochistan 358,246 348,708 336,493 330,032 318,188 319,578 -2.3%7,603,007 7,221,095 6,894,276 6,760,843 6,508,590 6,460,384
N.W.F.P. - - 8,465 20,161 26,370 29,706- - 218,159 499,906 663,292 658,731
Punjab 67,891 63,642 63,832 67,797 68,608 71,800 1.1%1,405,921 1,363,130 1,376,975 1,569,154 1,565,711 1,676,282
Sindh 566,452 790,400 936,163 982,035 1,000,415 1,033,110 12.8%11,590,142 16,676,101 19,470,950 20,374,754 20,588,060 21,077,289
Annual growth rate of Total 7.45% 21.17% 11.82% 4.09% 0.97% 2.87%* See table 3.4 for details.** See table 3.4.1 for details.Source: DGPC.

Table: 3.3NATURAL GAS PRODUCTION BY COMPANY
Unit: Million CFtTOE
Company 2002-03 2003-04 2004-05 2005-06 2006-07 2007-08 ACGRBHP 31,287 90,440 94,273 99,348 111,415 138,872 34.7%
606,968 1,754,536 1,800,607 1,887,616 2,116,880 2,666,344
Dewan Petroleum 8,066192,769
ENI 48,441 125,949 142,140 134,510 140,493 141,469 23.9%1,002,010 2,876,267 2,899,752 2,735,339 2,858,390 2,877,163
MGCL 156,290 159,010 162,263 171,045 172,465 171,418 1.9%2,766,333 2,814,477 2,839,610 2,993,283 3,018,141 2,999,821
MOL - - 4,927 17,315 22,775 22,865- - 121,196 421,914 565,962 575,654
OGDC 273,103 254,708 312,298 309,103 310,163 330,048 3.9%5,018,324 4,529,018 5,732,364 5,709,221 5,733,804 5,941,212
OMV 51,403 153,485 202,298 199,856 195,286 189,321 29.8%1,125,726 3,365,102 4,437,664 4,376,843 4,267,358 4,134,476
OPII 2,854 7,556 23,882 31,414 36,677 28,114 58.0%86,668 189,334 568,042 735,134 831,146 632,128
PEL - 6,014 6,352 8,884 11,453 11,135- 122,084 98,458 134,341 166,365 161,210
Petronas - - 2,405 11,286 9,702 8,800- - 60,136 281,018 240,622 218,241
POL 14,626 15,237 15,162 20,509 15,395 12,765 -2.7%433,754 450,436 446,247 616,617 457,962 374,059
PPL 321,463 302,262 291,494 307,303 303,068 302,795 -1.2%7,352,378 6,964,941 6,712,687 7,044,292 6,980,509 6,975,326
Tullow 10,108 5,574 3,450 1,655 1,080 6,447 -8.6%193,063 106,463 65,888 31,442 20,524 122,672
BP 83,014 82,515 84,009 87,800 83,608 82,080 -0.2%2,013,845 2,087,667 2,177,711 2,237,595 2,067,990 2,001,609
Total: Million CFt 992,589 1,202,750 1,344,953 1,400,026 1,413,581 1,454,194 7.9% TOE 20,599,069 25,260,326 27,960,361 29,204,657 29,325,653 29,872,685 Million CFt/Day 2,719 3,286 3,685 3,836 3,873 3,973Source: DGPC.

Table: 3.4Non-Associated Gas Production By Field
Unit: Million CFtTOE
Field (Province) Operator 2002-03 2003-04 2004-05 2005-06 2006-07 2007-08 ACGR Zamzama (Sindh) BHP 31,287 90,440 94,273 99,348 111,415 138,872 34.7%
606,968 1,754,536 1,800,607 1,887,616 2,116,880 2,666,344
Kadanwari (Sindh) Eni (Pak) 20,247 17,225 25,140 18,640 20,283 19,786 -0.5%435,311 408,233 548,052 406,352 442,169 431,335
Bhit (Sindh) " 28,194 108,724 117,000 115,870 120,210 121,683 34.0%566,699 2,468,035 2,351,700 2,328,987 2,416,221 2,445,828
Mari (Sindh) MGCL 156,290 159,010 162,263 171,045 172,465 171,418 1.9%2,766,333 2,814,477 2,839,610 2,993,283 3,018,141 2,999,821
Makori (NWFP) MOL 616 6,594 10,31416,152 172,752 268,174
Manzalai (NWFP) " 4,927 16,698 16,181 12,550121,196 405,762 393,210 307,480
Bhullan Shah (Sindh) OGDC 619 222 26516,837 5,728 6,837
Bobi (Sindh) " 237 4,5667,371 142,003
Dakhni (Punjab) " 5,136 5,377 7,109 8,205 8,631 12,260 19.0%129,941 136,038 179,854 207,574 218,375 310,178
Daru (Sindh) " 2,753 2,969 1,948 2,551 1,21276,809 82,835 54,344 71,181 33,806
Dhodak (Punjab) " 13,239 13,785 14,300 16,041 15,422 9,836 -5.8%321,708 334,976 347,481 389,790 374,759 239,015
Loti (Balochistan) " 12,874 11,341 11,154 7,078 7,955 10,864 -3.3%258,767 227,954 224,198 142,269 159,891 218,366
Mela (NWFP) " 43 3,8091,200 106,271
Nandpur/Panjpir (Punjab) " 20,274 17,324 16,560 13,460 14,357 12,155 -9.7%109,480 93,550 89,426 72,681 77,526 65,637
Noorai Jagir (Sindh) " 390 246 1,003 1,20511,193 7,067 28,786 34,584
Pirkoh (Balochistan) " 24,171 19,852 16,523 8,208 6,776 6,521 -23.1%517,259 424,833 353,602 175,643 140,941 135,637
Qadirpur (Sindh) " 139,196 116,638 171,736 181,317 183,264 193,174 6.8%2,950,955 2,472,726 3,640,802 3,843,926 3,885,193 4,095,289
Sadkal (Punjab) " 3,564 1,917 1,431 996 1,072 783 -26.1%98,723 53,101 39,652 27,591 29,687 21,689
Sari/Hundi (Sindh) " 1,046 785 840 917 1,055 766 -6.0%21,443 16,093 17,215 18,789 21,617 15,703
Uch (Balochistan) " 49,773 62,863 66,586 67,475 65,363 70,812 7.3%502,707 634,916 672,517 681,494 660,165 715,201
Miano (Sindh) OMV 51,403 57,839 64,494 60,859 50,627 36,431 -6.7%1,125,726 1,260,890 1,405,965 1,332,804 1,113,803 801,489
Sawan (Sindh) " 95,646 137,805 138,997 144,658 152,8892,104,212 3,031,699 3,044,039 3,153,555 3,332,987
Ahmad (Sindh) OPII 4609,340
Ali (Sindh) " 3,008 2,766 61174,900 68,884 15,202
Bilal (Sindh) " 1,537 4,633 2,12433,354 100,544 46,096
Bilal North (Sindh) " 627 1,059 64313,408 22,672 13,761
Kamal North (Sindh) " 264 7737,797 22,790
Contd./...

Non-Associated Gas Production (contd.)Province/Field Operator 2002-03 2003-04 2004-05 2005-06 2006-07 2007-08 ACGR Kausar (Sindh) " 126 6,083 7,357 8,075 6,736
2,848 138,077 166,267 182,492 152,228 Naimat Basal (Sindh) " 3,670 5,744 4,275 4,089 4,373
85,144 137,286 99,613 95,278 101,902 Rahim (Punjab) " 7 21
185 546
Ratana (Punjab) " 587 982 792 675 624 519 -2.4%15,966 26,318 21,373 17,823 15,976 13,283
Siraj South (Sindh) OPII 1,324 2,783 2,069 83830,982 65,127 46,749 18,946
Umar (Sindh) " 266 1,358 1,194 1,055 9257,421 36,526 33,313 29,425 25,816
Usman (Sindh) " 6,107 9,806 12,073 10,765138,618 222,603 274,056 244,372
Adhi (Punjab) PPL 7,121 6,984 7,136 7,036 12,368 14,771 15.7%195,115 208,123 212,665 209,682 368,554 440,184
Block-22 (Sindh) PEL 4,897 6,014 6,352 7,514 5,583 5,412 2.0%76,393 122,084 98,458 115,715 86,539 82,808
Badar (Sindh) " 1,370 5,870 5,72318,626 79,826 78,402
Rahmat (Sindh) Petronas 2,405 11,286 9,702 8,80060,136 281,018 240,622 218,241
Kandhkot (Sindh) PPL 38,003 37,062 37,910 48,573 48,442 52,646 6.7%756,260 737,534 754,409 966,603 964,003 1,047,654
Mazarani (Sindh) " 14 3,564 4,218 4,422 4,164 3,996 209.8%337 85,892 101,654 106,570 100,360 96,308
Sui (Balochistan) " 271,428 254,652 242,230 247,272 238,094 231,381 -3.1%6,324,272 5,933,392 5,643,959 5,761,438 5,547,593 5,391,180
Sara & Suri (Sindh) Tullow 10,108 5,574 3,450 1,655 1,080 1,753 -29.6%193,063 106,463 65,888 31,442 20,524 33,475
Chachar (Sindh) " 4,69589,197
Rodho (Punjab) Dewan Pet. 8,066192,769
Bhatti (Sindh) BP 7,534 7,142 6,731 6,092 3,208 3,013 -16.7%191,364 181,407 170,975 154,727 81,483 76,528
Bukhari (Sindh) " 2,054 1,368 1,862 2,747 1,264 1,222 -9.9%59,566 39,672 54,010 79,669 36,665 35,429
Bukhari Deep (Sindh) " 2,146 2,29954,733 58,612
Buzdar (Sindh) " 13,296 14,955 13,158 14,752 16,383 19,537 8.0%299,160 336,488 296,055 331,913 368,622 439,583
Buzdar S. & S.Deep(Sind " 1,620 198 918 834 579 1,721 1.2%36,450 4,455 20,666 18,772 13,023 38,714
Fateh Shah (Sindh) " 1,021 894 34422,562 22,439 8,644
Fateh Shah North (Sindh " 484 1,245 54910,688 31,260 13,778
Golarchi (Sindh) " 3,964 2,489 4,959 5,565 3,550 1,507 -17.6%96,722 60,732 121,006 135,784 86,622 36,773
Liari Deep (Sindh) " 1,265 1,231 1,400 1,143 1,222 888 -6.8%33,270 32,375 36,825 30,056 32,144 23,360
Jabo (Sindh) " 739 1,217 621 487 557 474 -8.5%15,889 26,166 13,360 10,460 11,973 10,187
Jalal (Sindh) " 712 2,15617,798 53,905
Contd./...

Non-Associated Gas Production (contd.)Province/Field Operator 2002-03 2003-04 2004-05 2005-06 2006-07 2007-08 ACGR
Jhaberi (Sindh) " 5,365 2,564 28793,888 44,870 5,017
Jogwani (Sindh) " 271 7,088 8,502 9,0086,131 156,649 190,440 201,788
Kato (Sindh) " 225 6 3 412 412 432 13.9%6,570 175 87 12,039 12,027 12,603
Khorewah (Sindh) " 9,781 9,539 8,343 7,158 5,118 4,539 -14.2%249,416 243,245 212,750 182,519 130,509 115,734
Khorewah Deep (Sindh) " 521 441 382 399 384 303 -10.2%13,025 11,025 9,551 9,980 9,610 7,585
Makh'pur & Deep (Sindh) BP 3,441 2,260 2,182 2,202 3,883 3,609 1.0%70,885 46,556 44,957 45,365 79,984 74,347
Matli (Sindh) " 720 8917,422 2,159
Missri (Sindh) " 1,90934,369
Pir (Sindh) " 245 185 107 4 206 -3.4%6,101 4,607 2,664 87 5,132
Raj (Sindh) " 2,354 646 354 644 11754,377 14,923 8,179 14,872 2,710
Rind (Sindh) " 261 423 200 89 67 60 -25.4%5,612 9,095 4,297 1,922 1,438 1,299
Sonro (Sindh) " 3,005 2,784 2,766 3,784 3,461 3,025 0.1%64,608 59,856 59,464 81,362 74,405 65,033
Turk (Sindh) " 1,169 1,987 1,960 1,584 1,675 1,540 5.7%31,212 53,053 52,336 42,282 44,709 41,115
Turk Deep (Sindh) " 9,551 9,341 5,935 6,596 4,563 3,159 -19.8%212,987 208,304 132,356 147,097 101,753 70,452
Others* (Sindh) " 24 155 214 1,157 1,729 1,554 130.3%600 3,875 5,356 28,913 43,233 38,849
Total: 958,019 1,065,238 1,293,558 1,352,235 1,372,685 1,418,837 8.2%19,591,934 21,910,268 26,455,203 27,762,775 28,089,767 28,801,839
Annual growth rate 8.34% 11.19% 21.43% 4.54% 1.51% 3.36%
* Others include Paniro, Shah Dino, Tando Ghulam Ali.Source: DGPC.

Associated Gas Production By FieldUnit: Million CFt
Field (Province) Operator 2002-03 2003-04 2004-05 2005-06 2006-07 2007-08 ACGRChanda (NWFP) ODGCL 3,539 2,846 3,552 3,032Bhalsyedian (Punjab) " 539 473 161Missa Keswal (Punjab) " 538 375 165 10Bhangali (Punjab) OPI 1,124 446 292 239 191 156 -32.6%Dhurnal (Punjab) " 1,143 742 724 627 542 468 -16.4%Balkassar (Punjab) POL 18 18 17 20 19 20 2.0%Dhulian (Punjab) " 966 629 588 835 1,116 984 0.4%Meyal (Punjab) " 3,213 2,369 1,983 2,048 1,798 1,439 -14.8%Pariwali (Punjab) " 3,522 3,151 4,102 7,175 6,526 7,025 14.8%Pindori (Punjab) " 6,390 8,894 8,359 10,368 5,888 3,246 -12.7%Turkwal (Punjab) " 517 176 111 63 47 51 -37.1%Akri North (Sindh) BP 80 62 54 38 31 10 -34.2%Ali Zaur (Sindh) " 59 590 676 458 214Dabhi, Dabhi N. (Sindh) " 3,750 3,429 5,054 2,616 1,621 728 -28.0%Dabhi S. (Sindh) " 116 2,218 2,305 1,628 3,060 2,506 84.9%Duphuri (Sindh) " 18 2,930 122 229 357 81.8%Halipota (Sindh) " 49 100 125 232Jagir (Sindh) " 222 160 74 52 38 11 -45.3%Jhaberi South (Sindh) " 431 118 936 1,528 667 27 -42.4%Junathi South (Sindh) " 72 388 179Khaskeli (Sindh) " 101 190 213 164 116 47 -14.2%Laghari (Sindh) " 45 49 47 26 13 15 -20.2%Liari (Sindh) " 122 52 71 11 72 611 38.0%Mazari (Sindh) " 509 1,204 403 69 22 25 -45.2%Mazari S. & S.Deep (Sindh " 623 924 762 424 399 586 -1.2%Meyun Ismail Deep (Sindh) " 1,966 3,805 5,232 2,975 2,814 2,163 1.9%Nari (Sindh) " 129 56Sakhi, Deep & S. Deep (Sin " 580 4,419 6,900 8,266 8,948 8,732 72.0%Tangri (Sindh) " 742 607 143 167 89 95 -33.8%Zaur & West (Sindh) " 5,112 4,591 4,731 3,043 1,751 1,724 -19.5%Zaur Deep (Sindh) " 1,516 603 4 348 447 447 -21.7%Zaur South (Sindh) " 230 218 125 121 219Others (Sindh)** " 466 476 403 1,183 196 189 -16.5%Total: Million CFt 34,570 40,857 51,395 47,790 40,896 35,357 0.5%
TOE 1,009,176 1,217,816 1,505,157 1,441,882 1,235,886 1,070,847Annual growth rate -12.52% 18.19% 25.79% -7.01% -14.43% -13.54%** Includes Bari, Ghungro, Keyhole G, Muban, Rajo, Tajedi, Meyun Ismail.Source: DGPC.
Table: 3.4.1

LPG SUPPLIES BY SOURCE
Unit: TonnesTOE
Source 2002-03 2003-04 2004-05 2005-06 2006-07 2007-08 ACGRAttock Refinery 5,211 7,277 8,215 6,996 8,014 6,357 4.1%Bosicor Refinery 17 684 2,755Pak-Arab Refinery 135,291 147,894 146,667 145,633 147,381 150,300 2.1%Pakistan Refinery 49,303 52,431 44,879 43,446 36,272 40,187 -4.0%National Refinery 15,239 17,797 19,722 16,882 19,827 15,192 -0.1%Refineries Sub-Total: 205,044 225,399 219,483 212,974 212,178 214,791 0.9%
Adhi 23,331 22,559 23,304 24,302 36,462 46,062 14.6%Bilal - - - 6,181 7,304 4,610Bilal North - - - - 1,816 1,441Bobi - - 13,467 18,841 28,204 26,793Bhangali 292 1,183 105 - - - Chanda 5,725 Dakhni 2,565 3,047 5,130 6,045 5,740 6,484 20.4%Dhodak 59,514 65,947 67,337 66,467 64,946 43,710 -6.0%Dhulian 6,462 4,323 4,258 5,584 6,855 5,959 -1.6%Dhurnal 5,948 3,601 309
JJVL - - 22,914 142,480 146,359 149,985
Kamal North 4,554 Kunnar 3,159 6,202 10,277 10,239 13,072 12,729 32.1%Meyal 12,102 9,074 8,244 8,829 8,482 6,536 -11.6%Naimat Basal - - 306 4,850 5,712 5,878Pariwali 9,435 9,372 11,108 19,958 20,037 24,174 20.7%Pindori 24,471 27,768 24,222 24,881 20,787 14,418 -10.0%Rahim 85Ratana 123 1,251 924 734 830 696 41.4%Siraj South - - 374 3,180 1,565Turkwal 2,255 575 128 221 203 244 -35.9%Umar - - 128 2,084 2,432 2,954Field Plants Sub-Total: 149,657 154,903 192,533 344,875 370,804 363,036 19.4%
Imports Sub-Total: 18,000 35,000 40,492 24,779 65,590 23,765 5.7%
Total: 372,701 415,302 452,508 582,628 648,572 601,592 10.0%403,225 449,315 489,568 630,345 701,690 650,862
Annual Growth Rate 4.24% 11.43% 8.96% 28.76% 11.32% -7.24%
Note: Imports for the years 1999-2000 to 2003-04 are estimated.Source: Oil Refineries, DGPC, DGO and DGG.
Table 3.6
Unit: TonnesTOE
Sector 2002-03 2003-04 2004-05 2005-06 2006-07 2007-08 ACGRDomestic 262,973 280,725 313,054 384,603 405,683 371,371 7.1%
Commercial 52,493 56,506 103,231 164,418 190,721 192,604 29.7%
Others 10,596 14,345 29,398 11,993 9,039 -3.1%Total: 326,062 351,576 416,285 578,419 608,397 573,014 11.9%
352,766 380,370 450,379 625,792 658,225 619,944
Source: DG(Gas).
LPG CONSUMPTION BY SECTOR
Table 3.5

Unit: TonnesTOE
Province/Region Domestic Commercial Industrial TotalPunjab 171,204 113,894 7,866 292,964Sindh 50,375 47,633 429 98,437N.WF.P. 50,608 8,513 256 59,377Balochistan 12,274 5,046 188 17,508A.J. Kashmir 24,172 5,305 300 29,777FATA 13,783 4,422 18,205NHA 44,938 6,878 51,816Federal Area 4,017 913 4,930
Total:- 371,371 192,604 9,039 573,014TOE 401,785 208,377 9,779 619,941
Source: DG(Gas).
LPG CONSUMPTION BY-REGION BY-SECTOR 2007-08Table: 3.7

Table: 3.8NATURAL GAS CONSUMPTION BY SECTOR
Unit: Million CFtTOE
Sector 2002-03 2003-04 2004-05 2005-06 2006-07 2007-08 ACGR
Domestic 153,508 155,174 172,103 171,109 185,533 204,035 5.9%3,592,094 3,631,072 4,027,210 4,003,955 4,341,475 4,774,412
Commercial 22,776 24,192 27,191 29,269 31,375 33,905 8.3%532,964 566,093 636,268 684,886 734,180 793,367
Gen. Industries* 152,068 178,942 211,766 263,348 290,214 305,662 15.0%3,558,395 4,187,245 4,955,321 6,162,353 6,791,013 7,152,491
Pakistan Steel Mills 12,900 14,453 14,350 15,498 16,386 16,901 5.6%301,860 338,200 335,790 362,653 383,432 395,483
Cement 3,445 7,711 13,383 15,335 14,686 12,736 29.9%80,619 180,437 313,164 358,834 343,646 298,025
Fertilizer (as Feedstock) 140,975 145,128 149,869 155,258 153,458 160,062 2.6%2,745,637 2,842,095 2,938,731 3,033,832 2,989,825 3,145,626
Fertilizer (as Fuel use) 39,636 40,222 40,540 42,917 40,224 40,001 0.2%779,054 793,123 797,852 842,662 786,437 782,979
Power 335,636 469,738 503,983 490,142 432,607 429,892 5.1%6,440,342 9,463,538 10,305,897 9,978,369 8,640,208 8,492,919
Transport (CNG) 11,320 15,858 24,443 38,885 56,446 72,018 44.8%264,885 371,075 571,961 909,908 1,320,841 1,685,232
Total: 872,265 1,051,418 1,157,628 1,221,762 1,220,929 1,275,212 7.9%18,295,849 22,372,877 24,882,193 26,337,452 26,331,057 27,520,535
Annual growth rate 5.78% 20.54% 10.10% 5.54% -0.07% 4.45% * Includes 5,091 MMcft as Shrinkages at JJVL in 2005-06Source: SNGPL, SSGCL, PPL, MGCL. IPPs.

NATURAL GAS CONSUMPTION 2007-08 BY PROVINCEUnit: Million CFt
TOESectors Punjab N.W.F.P. Sindh Balochistan Total
Domestic 118,648 17,589 59,648 8,150 204,0352,776,354 411,585 1,395,763 190,710 4,774,412
Commercial 21,151 2,314 9,858 582 33,905494,925 54,146 230,677 13,619 793,367
Gen. Industry* 180,446 13,155 111,846 215 305,6624,222,431 307,832 2,617,196 5,031 7,152,491
Pakistan Steel Mills - - 16,901 - 16,901395,483 395,483
Cement 7,155 2,162 3,419 0 12,736167,435 50,586 80,005 0 298,025
Fertilizer (as Feedstock) 108,920 31 51,112 - 160,0622,123,340 722 1,021,564 - 3,145,626
Fertilizer (as Fuel use) 27,782 28 12,191 - 40,001539,712 656 242,612 - 782,979
Power 146,848 - 203,436 79,608 429,8923,219,637 - 4,351,401 921,882 8,492,919
Transport 45,192 9,438 17,198 190 72,0181,057,504 220,849 402,433 4,446 1,685,232
Total:- 656,141 44,717 485,609 88,745 1,275,21214,601,338 1,046,376 10,737,134 1,135,687 27,520,535
* Includes 5,091 MMcft as Shrinkages at JJVL in 2005-06Source: DG(Gas), SNGPL, SSGCL, PPL, MGCL, Tullow, IPPs..
Table: 3.9

Table: 3.10By-Source Gas Supplies to Fertilizer & Power Sectors
Unit: Million CFtTOE
Sector/Source 2002-03 2003-04 2004-05 2005-06 2006-07 2007-08 ACGR
FERTILIZER SECTOR SNGPL 41,315 43,788 42,826 45,399 43,382 45,953 2.2%
966,761 1,024,631 1,002,133 1,062,330 1,015,131 1,075,299
SSGCL 20,379 22,585 25,718 23,825 22,182 26,504 5.4%476,869 528,489 601,801 557,505 519,059 620,194
Mari Gas Field 118,918 118,977 121,866 128,952 128,118 127,606 1.4%2,081,061 2,082,098 2,132,648 2,256,660 2,242,072 2,233,112
Total Fertilizer Sector 180,611 185,350 190,410 198,176 193,682 200,063 2.1%3,524,691 3,635,217 3,736,582 3,876,494 3,776,262 3,928,605
POWER SECTOR SNGPL 90,491 170,756 207,691 189,660 144,550 134,814 8.3%
2,117,478 3,995,690 4,859,963 4,438,040 3,382,459 3,154,657
SSGCL 89,366 136,665 135,253 138,112 127,544 126,766 7.2%2,091,164 3,197,961 3,164,920 3,231,821 2,984,530 2,966,324
Bhalsyedan Gas Field 1,111 471 161 0 0 030,666 13,013 4,436 0 0 0
Kandhkot Gas Field 37,775 36,781 37,615 40,095 37,892 35,836 -1.0%751,720 731,942 748,534 797,899 754,060 713,134
Mari Gas Field 36,984 39,616 39,986 41,649 43,871 43,394 3.2%647,220 693,277 699,747 728,859 767,738 759,397
Nandpur/Panjpir Gas Fi 20,276 17,245 16,604 13,530 13,680 12,033 -9.9%109,490 93,123 89,660 73,062 73,872 64,980
Sara/Suri Gas Fields 10,034 5,519 0 0 0 6,300 -8.9%191,646 105,415 65,228 31,018 20,342 119,869
Uch Gas Field 49,600 62,685 66,674 67,096 65,070 70,748 7.4%500,957 633,117 673,409 677,670 657,207 714,558
Total Power Sector 335,636 469,738 503,983 490,142 432,607 429,892 5.1%6,440,342 9,463,538 10,305,897 9,978,369 8,640,208 8,492,919
Source: DG(Gas), SNGPL, SSGCL, PPL, MGCL, Tullow, IPPs.

Table: 3.11NUMBER OF GAS CONSUMERS AS ON 30TH JUNE
Unit: NumbersProvince / Sector 2003 2004 2005 2006 2007 2008 ACGRNWFP: Domestic 250,749 266,028 289,117 312,044 343,377 375,325 8.4% Commercial 6,545 6,842 7,186 7,446 7,719 8,065 4.3% Industrial 243 296 340 389 463 650 21.7%Total - NWFP: 257,537 273,166 296,643 319,879 351,559 384,040 8.3%Punjab: Domestic 1,882,805 1,997,428 2,148,424 2,329,229 2,525,831 2,760,238 8.0% Commercial 30,927 32,256 34,172 36,473 38,206 41,111 5.9% Industrial 2,426 2,597 2,931 3,384 3,962 4,792 14.6%Total - Punjab: 1,916,158 2,032,281 2,185,527 2,369,086 2,567,999 2,806,141 7.9%Sindh: Domestic 1,510,486 1,577,738 1,621,588 1,683,092 1,755,744 1,866,585 4.3% Commercial 15,909 16,670 17,503 18,298 19,264 20,671 5.4% Industrial 2,366 2,594 2,753 2,939 3,140 3,515 8.2%Total - Sindh: 1,528,761 1,597,002 1,641,844 1,704,329 1,778,148 1,890,771 4.3%Baloch: Domestic 127,703 135,415 145,251 154,403 164,354 179,372 7.0% Commercial 1,438 1,482 1,552 1,640 1,707 1,887 5.6% Industrial 46 44 42 39 44 46 0.0%Total - Balochistan: 129,187 136,941 146,845 156,082 166,105 181,305 7.0%Total: Domestic 3,771,743 3,976,609 4,204,380 4,478,768 4,789,306 5,181,520 6.6% Commercial 54,819 57,250 60,413 63,857 66,896 71,734 5.5% Industrial 5,081 5,531 6,066 6,751 7,609 9,003 12.1%Total - Pakistan: 3,831,643 4,039,390 4,270,859 4,549,376 4,863,811 5,262,257 6.6%
Annual growth rate 2.84% 5.42% 5.73% 6.52% 6.91% 8.19%
Source: SNGPL, SSGCL.
Table: 3.12NATURAL GAS DISTRIBUTION NETWORK AS ON 30TH JUNE
Unit: KilometresProvince / Type 2003 2004 2005 2006 2007 2008 ACGRNWFP: Transmission 508 523 537 563 830 963 13.6% Distribution 4,131 4,353 4,708 5,063 5,568 6,430 9.3% Services 1,287 1,361 1,483 1,616 1,808 1,988 9.1%Total - NWFP: 5,926 6,237 6,728 7,242 8,206 9,381 9.6%Punjab: Transmission 4,867 4,861 5,103 5,152 5,312 5,570 2.7% Distribution 22,487 24,277 27,080 30,372 34,051 40,250 12.3% Services 7,864 8,293 8,921 9,620 10,439 11,283 7.5%Total - Punjab: 35,218 37,431 41,104 45,144 49,802 57,103 10.1%Sindh: Transmission 2,218 2,490 2,703 2,823 2,645 2,665 3.7% Distribution 15,138 15,606 16,321 17,239 18,767 20,181 5.9% Services 4,460 4,625 4,824 5,026 5,267 5,537 4.4%Total - Sindh: 21,816 22,721 23,848 25,088 26,679 28,383 5.4%Baloch: Transmission 668 687 719 719 645 645 -0.7% Distribution 2,934 3,189 3,632 4,204 4,681 5,002 11.3% Services 882 920 973 1,046 1,117 1,191 6.2%Total - Balochistan: 4,484 4,796 5,324 5,969 6,443 6,838 8.8%Total: Transmission 8,261 8,561 9,062 9,257 9,432 9,843 3.6% Distribution 44,690 47,425 51,741 56,878 63,067 71,863 10.0% Services 14,493 15,199 16,201 17,308 18,631 19,999 6.7%Total - Pakistan: 67,444 71,185 77,004 83,443 91,130 101,705 8.6%Annual growth rate 3.80% 5.55% 8.17% 8.36% 9.21% 11.60% Source: SNGPL, SSGCL.

NATURAL GAS CONSUMER PRICES *Unit: See foot-note
Category 1.3.2002 23.7.2002 20.8.200225.10.2002 1.7.2003 1.1.2004 1.7.2004 2.2.2005 1.7.2005 1.1.2006 1.7.2006 1.2.2007 1.1.2008 30.6.2008<---------------------------------------------------------------------------------------- Rs/million Btu -------------------------------------------------------------------------------------
Domestic Slabsi) Upto 1.77 M cu.ft./month 85.03 78.38 78.38 78.38 ii) 1.77 to 3.55 " " * 66.86 66.86 66.86 67.95 69.31 69.31 73.95 73.95 73.95 80.96 89.03 82.07 82.07 82.07 iii) 3.55 to 7.10 " " 100.73 100.73 100.73 102.37 104.42 104.42 111.42 120.61 127.62 147.41 162.07 149.40 149.40 149.40 iv) 7.10 to 10.64 " " 161.16 161.16 161.16 163.78 167.06 167.06 178.25 192.96 204.17 235.84 259.29 239.01 239.01 313.10 v) 10.64 to 14.2 ** " " 201.45 201.45 201.45 213.06 217.32 217.32 231.88 251.01 265.59 306.79 337.30 310.92 310.92 407.31 vi) Above 14.2 ** " " 217.85 217.85 217.85 529.50
Commercial 186.98 186.98 186.98 190.02 193.82 193.82 204.88 221.78 234.67 271.07 298.03 268.23 283.05 370.80 General Industry 166.18 166.18 166.18 168.88 172.26 172.26 182.09 197.11 208.56 240.91 264.87 238.38 251.55 329.54 Captive Power 197.11 208.56 240.91 264.87 238.38 251.55 422.60 Cement 194.68 194.68 222.32 222.32 209.78 209.78 209.78 227.09 240.28 277.55 305.15 305.15 335.67 428.89 CNG Stations 166.18 166.18 166.18 168.88 172.26 172.26 182.09 197.11 208.56 240.91 264.87 238.38 291.36 388.32 Fertilizer
On SNGPL & SSGCL SystemsAs Feed Stock Pak American Fertilize 36.77 36.77 36.77 36.77 36.77 36.77 36.77 36.77 36.77 36.77 36.77 36.77 36.77 36.77 FFC Jorden 36.77 36.77 36.77 36.77 36.77 36.77 36.77 36.77 36.77 36.77 36.77 36.77 36.77 36.77 Dawood / Pak Arab 59.59 59.59 62.57 62.57 67.26 67.26 73.99 73.99 83.24 83.24 91.52 91.52 91.52 91.52 Pak-China / Hazara 63.24 63.24 66.40 66.40 71.38 71.38 78.52 78.52 88.34 88.34 97.11 97.11 97.11 97.11 As Fuel 166.18 166.18 166.18 168.88 172.26 172.26 182.09 197.11 208.56 240.91 264.87 238.38 251.55 329.54 (others) 166.18 166.18 166.18 168.88 172.26 172.26 182.09 182.09 208.56 208.56 264.87 238.38 251.55 329.54
Raw Gas from Mari GasfieldAs Feed Stock FFC/Engro Chemical (New 13.09 13.09 13.09 13.09 13.09 13.09 13.09 FFC/Engro Chemical (Old) 58.74 61.68 61.68 61.68 66.31 66.31 72.94 72.94 82.06 82.06 90.22 90.22 90.22 90.22 Pak Saud 58.74 61.68 61.68 61.68 66.31 66.31 72.94 As Fuel 166.18 166.18 166.18 168.88 172.26 172.26 182.09 182.09 208.56 240.91 264.87 238.38 251.55 329.54
PowerSNGPL/SSGCL Systems 166.18 166.18 166.18 168.88 172.26 172.26 182.09 197.11 208.56 240.91 264.87 238.38 251.55 329.54 Liberty Power Limited 202.98 202.98 190.80 190.80 235.77 226.78 234.33 262.03 303.25 413.46 467.52 445.98 443.06 443.06 Raw Gas for WAPDA from
Sui Gasfield (917 Btu) 145.51 145.51 145.51 Kandhkot Gasfield (866 Btu) 160.54 160.54 160.54 163.15 166.41 166.41 175.90 190.41 201.47 232.72 255.86 230.28 243.00 318.34 Mari Gasfield (754 Btu) 156.14 156.14 156.14 158.68 161.85 161.85 171.08 185.19 195.95 226.34 248.85 223.96 236.64 309.61 Sara/Suri Gasfields 156.14 156.14 156.14 158.68 161.85 161.85 171.08 185.19 195.95 226.34 248.85 223.96 236.64 309.61
Units: Prices are on Rs/million Btu basis since 1st March 2002. Before this, these were on Rs/Mcf basis.* Without General Sales Tax (GST).** Since 25.10.2002, 5th slab has been removed and the 4th slab applied to all above 10.64 M cu.ft. per mon+ Revised on 1st JanuarySources: DG(Gas), OGRA Annual Report 2004-05.
Table: 3.13
Prices Effective From
+ +

PROVINCE Seam Resources (Million Tonnes ) Rank as per Heating Value
Coal Field Thickness Tota l Measured Indicated Inferred Hypothetica Status Moisture Volatile Fixed Ash Total ASTM Range (mmmf)
Range(Metres) Reserves Matter Carbon Sulphur Classification (Btu/lb)
BALOCHISTAN:
Barkhan-Chamala 0.3 - 2.0 6 1 5 Dev. 1.1 - 2.9 24.9-43.5 19.4-47.1 9.1-36.5 3.0-8.5 hvCb to hvAb 12,500 - 14,357
Duki 0.2 - 2.3 50 14 11 25 - Dev. 3.5-11.5 32.0-50.0 28.0-42.0 5.0-38.0 4.0-6.0 SubB to hvAb 10,131 - 14,164
Mach-Abegum 0.6 - 1.3 23 9 - 14 - Dev. 7.1-12.0 34.2-43.0 32.4-41.5 9.6-20.3 3.2-7.4 SubA to hvCb 11,110 - 12,937
Sor Range-
Degari 0.3 - 1.3 50 15 - 19 16 Dev. 3.9-18.9 20.7-37.5 41.0-50.8 4.9-17.2 0.6-5.5 SubA to hvBb 11,245 - 13,900
Pir Ismail Ziarat 0.4 - 0.7 12 2 2 8 - Dev. 6.3-13.2 34.6-41.0 19.3-42.5 10.3-37.5 3.2-7.4 SubA to hvCb 10,786 - 11,996
Khost-Sharig-
Harnai 0.3 - 2.3 76 13 - 63 - Dev. 1.7-11.2 9.3-45.3 25.5-43.8 9.3-34.0 3.5-9.55 SubB to hvAb 9,637 - 15,499
Sub-Total: 217 54 13 134 16
PUNJAB:
Makarwal 0.3 - 2.0 22 5 8 9 - Dev. 2.8-6.0 31.5-48.1 34.9-44.9 6.4-30.8 2.8-6.3 SubA to hvAb 10,688 - 14,029
Salt Range 0.15 - 1.2 213 50 16 2 145 Dev. 3.2-10.8 21.5-38.8 25.7-44.8 12.3-44.2 2.6-10.7 SubC to hvAb 9,472 - 15,801
Sub-Total: 235 55 24 11 145
SINDH:
Lakhra 0.3 - 3.3 1,328 244 629 455 - Dev. 9.7-38.1 18.3-38.6 9.8-38.2 4.3-49 1.2-14.8 LigB to SubC 5,503 - 9,158
Sonda-Thatta 0.3 - 1.5 3,700 60 511 2,197 932 Non-Dev. 22.6-48.0 16.1-36.9 8.9-31.6 2.7-52.0 0.2-15.0 SubC to hvBb 8,878 - 13,555
Jherruck 0.3 - 6.2 1,823 106 810 907 - Non-Dev. 9.0-39.5 20.0-44.2 15.0-58.8 5.0-39.0 0.4-7.7 SubC to hvCb 8,800 - 12,846
Ongar 0.3 - 1.5 312 18 77 217 - Non-Dev. 9.0-39.5 20.0-44.2 15.0-58.8 5.0-39.0 0.4-7.7 LigB to SubA 5,219 - 11,172
Indus East 0.3 - 2.5 1,777 51 170 1,556 - Non-Dev. 9.0-39.5 20.0-44.2 15.0-58.8 5.0-39.0 0.4-7.7 LigA to SubC 7,782 - 8,660
Meting-Jhimpir 0.3 - 1.0 161 10 43 108 - Dev. 26.6-36.6 25.2-34.0 24.1-32.2 8.2-16.8 2.9-5.1 LigA to SubC 7,734 - 8,612
Badin 0.55 - 3.1 850 150 0 200 500 Non-Dev. 11,415 - 11,521
Thar Coal * 0.2 - 22.81 175,506 2,700 9,395 50,706 112,705 Non-Dev. 29.6-55.5 23.1-36.6 14.2-34.0 2.9-11.5 0.4-2.9 LigB to SubA 6,244 - 11,04 5
Sub-Total: 185,457 3,339 11,635 56,346 114,137
NWFP:
Hangu/Orakzai 0.43 - 0.6 82 1.0 4.5 76 - Dev. 0.2-2.5 16.2-33.4 21.8-49.8 5.3-43.3 1.5-9.5 SubA to hvAb 10,500 - 14,149
Cherat/Gulla Khel 0.8 - 1.2 9 0.5 - 8 Dev. 0.1-7.1 14.0-31.2 37.0-76.9 6.1-39.0 1.1-3.5 SubC to hvAb 9,386 - 142,171
Sub-Total: 90 1.5 4.5 84 -
Azad Kashmir
Kotli 0.25 1.0 9 1 1 7 - Dev. 0.2-6.0 5.1-32.0 26.3-69.5 3.3-50.0 0.3-4.8 LigA to hvCb 7,336 - 12,338
Sub-Total: 9 1 1 7 -
Total: 186,007 3,450 11,677 56,582 114,298
* Measured Reserves of Thar have been reduced by GSP after drilling and recalculation to remove overlaps in previous estimates. For Block-wise reserves/reourcses of
please refer to Table 4.1.1
Coal Rank Abbreviations used
hvAb: High volatile A bituminous coa Sub bituminous A coal LigA:Li gnite A coal mmmf:Moist mineral mattaer fre e
hvBb: High volatile B bituminous coa Sub bituminous B coal LigB:Li gnite B coal
hvCb: High volatile C bituminous coal Sub bituminous C coal LigC: Lignite C coal.For definitions of reserves/resources, please refer to footnotes of Table 4.1 .
Source: Geological Survey of Pakistan
Coal Quality Proximate Analysis (%
PAKISTAN COAL RESERVES / RESOURCES AS ON JUNE 30, 2008
Table: 4.1

Specific
Block / Field Area Measured Indicated Inferred Hypothetical
(sq.km.) Drill Holes Reserves Reserves Reserves Resources Total
Block-I (Sinhar Vikian-Varvia) 122.0 41 620 1,918 1,028 - 3,566
Block-II (Singharo Bhitro) 55.0 43 640 944 - - 1,584
Block-III (Saleh Jo Tar) 99.5 41 411 1,337 258 - 2,006
Block-IV (Sonal Ba) 80.0 42 637 1,640 282 - 2,559
Sub-Total (Block I-IV) 356.5 167 2,308 5,839 1,568 - 9,715
Rest of Thar coal field 8,643.5 50 392 3,556 49,138 112,705 165,791
Total (Thar coal field) 9,000.0 217 2,700 9,395 50,706 112,705 175,506
Mineable Reserves: 60% of Measured Reserves.
Measured Reserves: Having a high degree of geological assurance, coal lies within a radius of 0.4 km from
a point of coal measurement.
Indicated Reserves: Having a moderate degree of geological assurance, coal lies within a radius of 0.4 to 1.2 km from
a point of coal measurement.
Inferred Reserves: Having a low degree of geological assurance, coal lies within a radius of 1.2 to 4.8 km from
a point of coal measurement.
Hypothetical Resources: Undiscovered coal resources, generally extention of inferred reserves in which coal lies beyond
4.8 km from a point of coal measurement.
Source: Geological Survey of Pakistan.
Reserves / Resources (Million Tonnes)
Table: 4.1.1
THAR COAL RESERVES / RESOURCES AS ON JUNE 30, 2008
COAL PRODUCTION
3.53
3.04
3.64 3.55
3.163.46
3.17 3.093.33 3.31 3.28
4.594.87
3.64
4.12
93-94 94-95 95-96 96-97 97-98 98-99 99-00
0.00
1.00
2.00
3.00
4.00
5.00
6.00Million Tonnes
Balochistan Sindh Punjab NWFP
Figure 4.1
00-01 01-02 02-03 03-04 05-0604-05 06-07 07-08

Unit: Tonnes
Province/Field 2002-03 2003-04 2004-05 2005-06 2006-07 2007-08 ACGR
BALOCHISTAN:
Sor Range 167,252 145,039 129,172 122,417 119,276 117,681 -6.8%
Degari 62,993 58,552 55,966 47,257 48,229 43,175 -7.3%
Sharigh 157,724 167,128 197,677 265,804 199,153 184,989 3.2%
Sinjidi 196,115 161,410 128,895 121,413 138,009 120,515 -9.3%
Mach 219,649 188,473 302,939 307,539 294,642 293,340 6.0%
Harnai-Khost-
Nasaka-Zardalu 55,608 124,639 143,736 169,086 122,783 93,931 11.1%
Duki 420,929 417,726 436,222 531,929 508,362 564,944 6.1%
Pir Ismail Ziarat 359,890 325,051 350,116 366,090 337,586 318,166 -2.4%
Abegum 69,236 57,730 63,576 27,380 14,928 11,697 -29.9%
Barkhan/Chamalong 48,321 520,185
Sub-Total 1,709,396 1,645,748 1,808,299 1,958,915 1,831,289 2,268,623 5.8%
PUNJAB:
Makerwal/Salt Range 502,326 535,066 544,326 573,684 508,168 553,453 2.0%
Sub-Total 502,326 535,066 544,326 573,684 508,168 553,453 2.0%
SINDH:
Lakhra 1,031,129 900,613 * * 981,250 1,038,926 0.2%
Jhimpir 15,537 10,486 * * 18,652 19,936 5.1%
Sub-Total 1,046,666 911,099 2,000,000 2,010,000 999,902 1,058,862 0.2%
NWFP/FATA
Makerwal/Gulakhel/ 53,198 183,571 234,000 328,560 303,504 242,969 35.5%
Kohat, FATA
Sub-Total 53,198 183,571 234,000 328,560 303,504 242,969 35.5%
Total: Tonnes 3,311,586 3,275,484 4,586,625 4,871,159 3,642,863 4,123,907 4.5%
TOE 1,481,604 1,465,452 2,052,056 2,179,357 1,629,817 1,845,036
Annual growth rate -0.49% -1.09% 40.03% 6.20% -25.22% 13.21%
* Field-wise breakup not available
Source: DG(Minerals),Provincial Directorates of Mineral Development.
Unit 2002-03 2003-04 2004-05 2005-06 2006-07 2007-08 ACGR
Tonnes 1,578,169 2,789,238 3,307,168 2,842,829 4,251,195 5,986,940 30.6%
TOE 1,038,277 1,835,040 2,175,786 1,870,297 2,796,861 3,938,808
Import value (Million Rs) (4,401) (8,345) (15,885) (9,248) (15,720) (15,720)
Annual growth rate of imports 46.05% 76.74% 18.57% -14.04% 49.54% 40.83%
* Includes coal imported by Pak Steel for use as coke.
** Include 458,356 tonnes of metallurgical coke imported by Pak Steel.
Source: Federal Bureau of Statistics, Pakistan Steel Mills Corporation.
PRODUCTION OF COAL BY FIELD
Table: 4.2
Table 4.3
IMPORT OF COAL *
**

Unit: Tonnes
TOE
Sector 2002-03 2003-04 2004-05 2005-06 2006-07 2007-08 ACGR
Domestic 1,111 1,047 - - 994 1,000 -2.1%
497 468 445 447
Brick-Kiln Industry * 2,606,852 2,589,445 3,906,738 4,221,825 3,277,472 3,760,707 7.6%
1,166,305 1,158,518 1,747,875 1,888,845 1,466,341 1,682,540
Cement / Other Industry ** 957,169 2,508,238 2,535,168 2,778,379 4,140,986 5,720,972 43.0%
524,471 1,544,920 1,562,637 1,722,646 2,682,255 3,721,727
Pak Steel*** 1,121,000 781,000 1,272,000 564,450 310,209 465,968 -16.1%
737,506 513,820 836,849 371,352 204,087 306,560
Power (WAPDA) 203,623 184,992 179,887 149,334 164,397 162,200 -4.4%
91,101 82,765 80,481 66,812 73,551 72,568
Total: Tonnes 4,889,755 6,064,722 7,893,793 7,713,988 7,894,058 10,110,847 15.6%
TOE 2,519,881 3,300,491 4,227,842 4,049,654 4,426,678 5,783,844
Annual growth rate 10.91% 24.03% 30.16% -2.28% 2.33% 28.08%
Note: Sectoral consumption data of coal is mostly not available, except for power sector and has, therefore, been estimated.
* Estimated by deducting other uses of indigenous coal from the total production.
** Include indigenous as well as imported coal.
*** Imported coal/coke used as coke in Pak Steel.
Source: Cement Factories, DG(Minerals), FBS, Pak Steel, PMDC, WAPDA.
Table: 4.5
PMDC'S AVERAGE SELLING PRICE OF COAL
Unit: Rupees/Tonne
Mine (Province) 2002-03 2003-04 2004-05 2005-06 2006-07 2007-08
Degari (Balochistan) 2,014.00 2,565.00 3,442.00 3,370.00 3,729.00 4,344.00
Sor Range (Balochistan) 2,166.00 2,706.00 2,612.00 3,960.00 3,956.00 5,359.00
Sharigh (Balochistan) 1,647.00 2,351.00 3,105.00 3,700.00 4,094.00 4,723.00
Lakhra (Sindh) 594.00 691.00 873.00 1,324.00 1,279.00 1,501.00
* Mining operation remained suspended.
Source: PMDC.
Table: 4.4
CONSUMPTION OF COAL BY SECTOR

Figure 4.2
COAL CONSUMPTION BY SECTOR
2002-03
Total: 4.89 Million Tonnes
2007-08
Total: 10.1 Million Tonnes
Cement * 56.6%
Brick Kilns 37.2%
Domestic 0.0%
Coke use 4.6%
Power 1.6%
*Cement 19.6%
Brick Kilns 53.3%
Domestic 0.0%
Coke use 22.9%
Power 4.2%
* Includes other industry also.

Table: 5.1
Unit: MW
INSTALLED CAPACITY OF ELECTRICITY GENERATION AS ON 30TH JUNE
Type/Power Station 2003 2004 2005 2006 2007 2008
A.1 HYDEL (WAPDA):
Tarbela 3,478 3,478 3,478 3,478 3,478 3,478
Ghazi Barotha 1,450 1,450 1,450 1,450 1,450
Mangla 1,000 1,000 1,000 1,000 1,000 1,000
Warsak 240 240 243 243 243 243
Chashma 184 184 184 184 184 184
Malakand 20 20 20 20 0* 0*
Dargai 20 20 20 20 20 20
Rasul 22 22 22 22 22 22
Shadiwal 14 14 14 14 14 14
Chichoki Malian 13 14 14 14 13 13
Nandipur 14 13 13 13 14 14
Kurram Garhi 4 4 4 4 4 4
Renala 1 1 1 1 1 1
Chitral 1 1 1 1 1 1A.2 HYDEL (AJKHEB)
Jagran 30 30 30 30 30 30
Leepa 2
Others 5 5 5 5 5 6Hydel Sub-Total 5,051 6,496 6,499 6,499 6,479 6,480
B.1 THERMAL (WAPDA):
GTPS Shahdra 59 59 59 59
SPS Faisalabad 132 132 132 132 132 132
GTPS Faisalabad 244 244 244 244 244 244
NGPS Multan 130 130 130 195 195 195
TPS Muzaffar Garh 1,350 1,350 1,350 1,350 1,350 1,350
TPS Guddu 1,655 1,655 1,655 1,655 1,655 1,655
GTPS Kotri 174 174 174 174 174 174
TPS Jamshoro 850 850 850 850 850 850
FBC Lakhra 150 150 150 150 150 150
TPS Quetta 35 35 35 35
GTPS Panjgur 32 32 39 39 39 39
TPS Pasni 18 18 17 17 17 17Thermal WAPDA Sub-Total 4 ,735 4,735 4,835 4,900 4,900 4,900
B.2 THERMAL (KESC):
TPS Korangi 316 316 316 316 316 316
GTPS Korangi Town 80 80 80 80 80 80
GTPS Site 100 100 100 100 100 100
TPS Bin Qasim 1,260 1,260 1,260 1,260 1,260 1,260Thermal KESC Sub-Total 1 ,756 1,756 1,756 1,756 1,756 1,756
B.3 THERMAL (IPPs):
AES Lalpir 362 362 362 362 362 362
AES Pak Gen 365 365 365 365 365 365
Altern Energy 10 10.5 10.5 10.5 ** **
Fauji Kabirwala 157 157 157 157 157 157
Gul Ahmed 136 136 136 136 136 136
Habibullah 129 127 129 129 129 129
HUBCO 1,292 1,292 1,292 1,292 1,292 1,292
Japan Power 135 135 135 136 136 136
KAPCO 1,466 1,466 1,466 1,466 1,466 1,466
Kohinoor Energy 131 131 131 131 131 131
Rousch Power 412 450 450 450 450 450
Saba Power 134 134 134 134 134 134
Southern Electric 117 117 117 117 117 117
Tapal Energy 126 126 126 126 126 126
TNB Liberty Power 235 235 235 235 235 235
Uch Power 586 564 586 586 586 586
Thermal Private Sub-Total 5,794 5,808 5,832 5,833 5,822 5,822
C. NUCLEAR:
KANUPP 137 137 137 137 137 137
CHASNUPP 325 325 325 325 325 325
Nuclear Sub-Total 462 462 462 462 462 462
Grand Total: 17,798 19,257 19,384 19,450 19,420 19,420Of which:
Thermal-Total: 12,285 12,299 12,423 12,489 12,478 12,478
Source: AJKHEB, IPPs, KESC, PAEC, WAPDA.
* Decommissioned due to fire incident in November 2006.
** Plant shut down.

ELECTRICITY INSTALLED CAPACITY
BY TYPE
12,10012,969
14,81815,658 15,662
17,399 17,498 17,799 17,798
19,257 19,384 19,450 19,420 19,420
94-95 95-96 96-97 97-98 98-99 99-00
0
5,000
10,000
15,000
20,000
25,000MW
Hydel Thermal (WAPDA) Thermal (KESC) Thermal (IPPs) Nuclear
Figure 5.1
Figure 5.2
ELECTRICITY GENERATION 2007-08
Total: 95,860 GWh
BY COMPANY
BY SOURCE
Nuclear & Imported 3.4%
Hydel 29.9%
Oil 32.1%
Coal 0.1%
Gas 34.3%
WAPDA 51.4%
KESC 8.6% PAEC 3.2%KAPCO 9.6%
Uch 4.5%
Rousch 2.9%
HUBCO 8.0%
Liberty 1.7%
Other IPPs 10.1%
00-01 01-02 02-03
(IncludingAJKHEB 0.1%)
03-04 05-0604-05 06-07 07-08

Table: 5.2
Unit: GWh
GROSS GENERATION AND IMPORT OF ELECTRICITY BY SOURCE
Source 2002-03 2003-04 2004-05 2005-06 2006-07 2007-08 ACGR
Hydel (WAPDA): 22,351 26,944 25,671 30,862 31,953 28,707 8.7%
Thermal: WAPDA 19,574 20,972 22,189 22,508 21,597 20,427 0.9%
KESC 8,808 9,724 9,304 9,130 8,169 8,219 -1.4%
IPPs 23,209 21,426 25,669 28,645 34,206 35,231 8.7%
Thermal-Total: 51,591 52,122 57,162 60,283 63,972 63,877 4.4%
Nuclear: KANUPP 236 78 322 143 189 424 12.5%
CHASNUPP 1,504 1,682 2,473 2,341 2,099 2,653 12.0%
Nuclear- Total: 1,740 1,760 2,795 2,484 2,288 3,077 12.1%
Total Generation 75,682 80,827 85,629 93,629 98,213 95,661 4.8%
Imported:* 0.36 73 109 146 171 199 254.0%
Total Electricity Supply: 75,682 80,900 85,738 93,774 98,384 95,860 4.8%
Of which:
WAPDA 41,925 47,916 47,860 53,370 53,550 49,134 3.2%
Annual growth rate of Total 4.53% 6.80% 5.94% 9.34% 4.90% -2.60%
WAPDA imported electricity from Iran since Oct-2002.
Source: IPPs, PAEC, KESC, WAPDA.Data for KESC is estimated as not available
Unit: GWh
Table: 5.3
THERMAL ELECTRICITY GENERATION BY FUEL
Fuel 2002-03 2003-04 2004-05 2005-06 2006-07 2007-08 ACGR
Coal 231 198 175 129 136 136 -10.0%
Oil 24,353 12,711 13,516 18,868 28,025 30,818 4.8%
Gas 27,006 39,213 43,472 41,286 35,811 32,923 4.0%
Total: 51,591 52,122 57,162 60,283 63,972 63,877 4.4%
Annual growth rate 0.82% 1.03% 9.67% 5.46% 6.12% -0.15%
Source: IPPs, KESC, WAPDA.
Data for KESC is estimated as not available
Unit:
Table: 5.4
FUEL CONSUMPTION FOR THERMAL POWER GENERATION
TOE
Fuel 2002-03 2003-04 2004-05 2005-06 2006-07 2007-08 ACGR
Coal 91,101 82,765 80,481 66,812 73,551 72,568 -4.4%
Furnace Oil 5,779,335 2,608,548 3,308,574 4,076,897 6,741,614 6,741,614 3.1%
Diesel Oil 88,850 63,272 55,899 32,176 168,449 168,449 13.6%
Gas 6,440,342 9,463,538 10,305,897 8,694,561 8,640,101 8,492,919 5.7%
Total: 12,399,628 12,218,124 13,750,851 12,870,446 15,623,715 15,475,550 4.5%
Annual growth rate 1.06% -1.46% 12.54% -6.40% 21.39% -0.95%
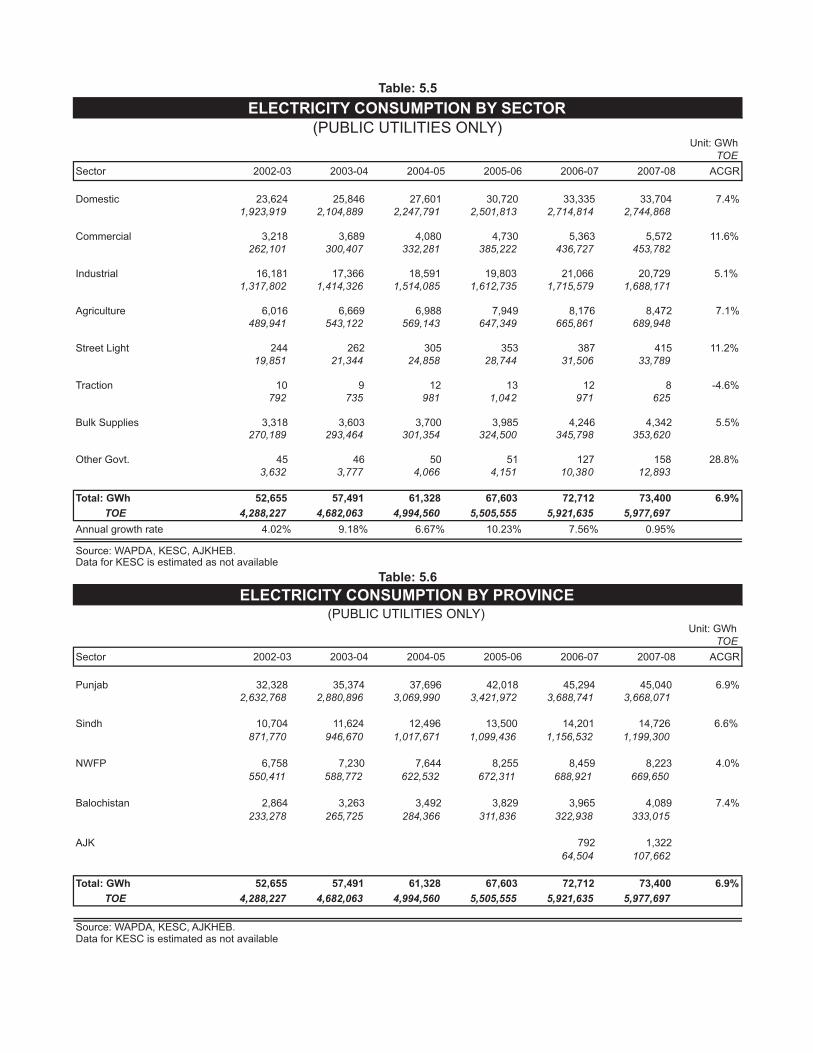
Table: 5.5
ELECTRICITY CONSUMPTION BY SECTOR
(PUBLIC UTILITIES ONLY)Unit: GWh
TOE
Sector 2002-03 2003-04 2004-05 2005-06 2006-07 2007-08 ACGR
Domestic 23,624 25,846 27,601 30,720 33,335 33,704 7.4%
1,923,919 2,104,889 2,247,791 2,501,813 2,714,814 2,744,868
Commercial 3,218 3,689 4,080 4,730 5,363 5,572 11.6%
262,101 300,407 332,281 385,222 436,727 453,782
Industrial 16,181 17,366 18,591 19,803 21,066 20,729 5.1%
1,317,802 1,414,326 1,514,085 1,612,735 1,715,579 1,688,171
Agriculture 6,016 6,669 6,988 7,949 8,176 8,472 7.1%
489,941 543,122 569,143 647,349 665,861 689,948
Street Light 244 262 305 353 387 415 11.2%
19,851 21,344 24,858 28,744 31,506 33,789
Traction 10 9 12 13 12 8 -4.6%
792 735 981 1,042 971 625
Bulk Supplies 3,318 3,603 3,700 3,985 4,246 4,342 5.5%
270,189 293,464 301,354 324,500 345,798 353,620
Other Govt. 45 46 50 51 127 158 28.8%
3,632 3,777 4,066 4,151 10,380 12,893
Total: GWh 52,655 57,491 61,328 67,603 72,712 73,400 6.9%
TOE 4,288,227 4,682,063 4,994,560 5,505,555 5,921,635 5,977,697
Annual growth rate 4.02% 9.18% 6.67% 10.23% 7.56% 0.95%
Source: WAPDA, KESC, AJKHEB.Data for KESC is estimated as not available
Unit: GWh
Table: 5.6
(PUBLIC UTILITIES ONLY)
ELECTRICITY CONSUMPTION BY PROVINCE
TOE
Sector 2002-03 2003-04 2004-05 2005-06 2006-07 2007-08 ACGR
Punjab 32,328 35,374 37,696 42,018 45,294 45,040 6.9%
2,632,768 2,880,896 3,069,990 3,421,972 3,688,741 3,668,071
Sindh 10,704 11,624 12,496 13,500 14,201 14,726 6.6%
871,770 946,670 1,017,671 1,099,436 1,156,532 1,199,300
NWFP 6,758 7,230 7,644 8,255 8,459 8,223 4.0%
550,411 588,772 622,532 672,311 688,921 669,650
Balochistan 2,864 3,263 3,492 3,829 3,965 4,089 7.4%
233,278 265,725 284,366 311,836 322,938 333,015
AJK 792 1,322
64,504 107,662
Total: GWh 52,655 57,491 61,328 67,603 72,712 73,400 6.9%
TOE 4,288,227 4,682,063 4,994,560 5,505,555 5,921,635 5,977,697
Source: WAPDA, KESC, AJKHEB.Data for KESC is estimated as not available

Unit: GWh
TOE
Sector Punjab Sindh N.W.F.P. Balochistan AJK Total
Domestic 20,376.5 6,627.7 5,361.0 431.3 907.8 33,704.2
1,659,458 539,759 436,600 35,122 73,929 2,744,868
Commercial 3,469.8 1,362.2 462.4 108.1 169.5 5,572.0
282,577 110,937 37,660 8,805 13,802 453,782
Industry 14,383.0 4,527.7 1,536.4 153.4 128.6 20,729.0
1,171,347 368,735 125,124 12,491 10,474 1,688,171
Agriculture 4,035.7 786.7 345.2 3,304.3 8,471.9
328,667 64,066 28,112 269,103 689,948
Street Light 221.5 170.9 18.0 4.5 414.9
18,042 13,921 1,463 362 33,789
Traction 7.7 7.7
625 625
Bulk Supplies 2,515.0 1,244.2 495.6 87.2 4,342.1
204,822 101,331 40,362 7,105 353,620
Other Govt. 31.1 6.8 4.0 0.3 116.1 158.3
2,530 551 327 26 9,457 12,893
Total: GWh 45,040.2 14,726.2 8,222.6 4,089.1 1,322.0 73,400.0
TOE 3,668,071 1,199,300 669,650 333,015 107,662 5,870,036
Source: KESC, WAPDA and AJKHEB.
(PUBLIC UTILITIES ONLY)
SECTORAL ELECTRICITY CONSUMPTION BY PROVINCE 2007-08
Table 5.7
Table: 5.8
Unit: MWh
AUXILIARY CONSUMPTION BY SOURCE
Source 2002-03 2003-04 2004-05 2005-06 2006-07 2007-08 ACGR
Hydel 43,742 79,523 76,351 91,793 93,990 86,287 14.6%
Thermal 2,779,891 2,783,920 2,968,360 3,155,264 3,305,629 3,343,264 3.8%
Nuclear 182,872 177,635 258,096 215,638 223,418 258,483 7.2%
Total: 3,006,505 3,041,078 3,302,807 3,462,695 3,623,038 3,688,034 4.2%
Source: IPPs, PAEC, KESC, WAPDA.
Data for KESC is estimated as not available
Unit: GWh
Table: 5.9
(PUBLIC UTILITIES ONLY)
ELECTRICITY BALANCES
Source 2002-03 2003-04 2004-05 2005-06 2006-07 2007-08 ACGR
Total Generation 75,682 80,827 85,629 93,629 98,213 95,661 4.8%
Auxiliary Consumption 3,007 3,041 3,303 3,463 3,623 3,688 4.2%
Net purchases from PASMIC 23 4 (70) (203) (137) (30)
Imported 0 73 109 146 171 199
Net Supply 72,699 77,862 82,365 90,109 94,623 92,142 4.9%
Consumption 52,655 57,491 61,328 67,603 72,712 73,400 6.9%
T & D Losses 20,043 20,371 21,037 22,506 21,912 18,742 -1.3%
(as % of Net Supply) 27.6% 26.2% 25.5% 25.0% 23.2% 20.3% -5.9%

Domestic 44.9%
Commercial 6.1%
Industrial 30.7%Agriculture 11.4%
Bulk Supplies 6.3%
St.Light,Traction & Ot 0.6%
Domestic 45.9%
Commercial 7.6%
Industrial 28.2%
Agriculture 11.5%
Bulk Supplies 5.9%
St.Light,Traction & Ot 0.8%
ELECTRICITY CONSUMPTION BY SECTORFigure 5.3
2007-08
Total: 73,400 GWh
2002-03
Total: 52,655 GWh

Installed Overall
Generation Units Cost of Auxiliary Maximum Minimum Load Capacity Utilization
Power Station Capacity Generated Generation Consum. Load Load Factor Factor Factor
(MW) (GWh) (Ps/KWh) (GWh) (MW) (MW) (%) (%) (%)
A. WAPDA
Tarbela 3,478.0 14,959.18 3,702.0 46.00 106.44 48.97
Ghazi Brotha 1,450.0 6,573.70 1,450.0 51.61 100.00 51.61
Mangla 1,000.0 4,687.33 1,150.0 46.40 115.00 53.36
Warsak 243.0 1,050.04 208.0 57.47 85.61 49.20
Chashma 184.0 987.49 184.0 61.10 100.00 61.10
Dargai 20.0 145.57 18.8 88.15 94.00 82.86
Rasul 22.0 36.57 15.6 26.68 70.91 18.92
Shadiwal 13.5 43.63 8.0 62.09 59.26 36.79
Chichoki Malian 13.2 19.70 7.0 32.04 53.03 16.99
Nandipur 13.8 29.06 8.6 38.46 62.32 23.97
Kurram Garhi 4.0 17.86 4.0 50.83 100.00 50.83
Renala 1.1 3.34 0.9 42.24 81.82 34.56
Chitral 1.0 4.85 1.1 50.22 110.00 55.24
WAPDA Sub-total: 6,443.6 28,558.3 84.287 *
B. AJKHEB
Kathai 1.6 7.21 997.8 0.200 1.6 51.29 100.00 51.29
Kundal Shahi 2.0 3.28 3,017.3 0.100 1.8 20.75 90.00 18.68
Jagran 30.4 130.81 3,365.0 2.000 30.4 48.99 100.00 48.99
Leepa 1.6 5.19 1,965.4 0.150 1.6 36.94 100.00 36.94
Kel 0.4 1.69 563.4 0.050 0.4 47.99 100.00 47.99
AJKHEB Sub-total: 36.0 148.2 2.500
Total: 6,479.6 28,706.5 3,365.0 86.3
Source: WAPDA, AJKHEB.
* Estimated, WAPDA did not provide figures for auxiliary consumption and overall cost of generation.
Table: 5.10
ENERGY DATA OF HYDEL POWER STATIONS (2007-08)

Installed Total OverallGeneration Units Average Cost of Auxiliary Maximum Load Capacity Utilization
Power Station Capacity Gas FO HSD Coal Generated Fuel Cost Generation Consum. Load Factor Factor Factor(MW) (GWh) (GWh) (GWh) (GWh) (GWh) (Ps/KWh) (Ps/KWh) (GWh) (MW) (%) (%) (%)
WAPDAGTPS Shahdra 59 9.94 9.94 668.58 822.43 2.03 29 3.91 49.15 2.84SPS Faisalabad 132 71.1 554.2 625.25 906.53 921.38 54.48 100 71.38 75.76 71.38GTPS Faisalabad 244 534.0 534.04 258.43 301.70 28.69 222 27.46 90.98 29.03NGPS Multan 195 55.5 305.2 360.73 934.74 1,046.30 40.02 80 51.47 41.03 41.18TPS Muzaffar Garh 1,350 461.5 5,456.4 5,917.88 770.99 796.71 527.59 1055 64.03 78.15 53.62TPS Guddu (unit 1-4) 640 2,228.4 54.9 2,283.29 269.98 317.50 165.08 440 59.24 68.75 60.62TPS Guddu (unit 5-13) 1,015 5,781.4 5,781.38 223.89 245.36 108.09 855 77.19 84.24 77.19GTPS Kotri 174 810.2 810.18 288.73 336.72 25.80 141 65.59 81.03 66.06FBC Lakhra 150 136.4 136.35 185.30 584.13 37.11 42 37.06 28.00 38.91TPS Jamshoro 850 2,453.4 1,445.5 3,898.95 449.40 487.16 374.64 850 52.36 100.00 60.97TPS Quetta 35 68.1 68.06 361.70 368.37 1.63 28 27.75 80.00 31.08TPS Pasni 17 0.0 0.04 3,355.87 25,777.84 0.15 5 0.09 29.41 0.03GTPS Panjgur 39 1.2 1.23 1,548.45 3,251.03 0.19 14 1.01 35.90 0.52
WAPDA Sub-total: 4,900 12,473.5 7,816.2 1.3 136.4 20,427.33 468.01 502.42 1,365.49KESCTPS Korangi 316 600.6 31.6 632.21 504.31 n.a. 66.93 165 43.74 52.22 22.84GTPS Korangi Town 80 248.9 2.5 251.44 595.31 n.a. 13.11 75 38.27 93.75 35.88GTPS Site 100 343.1 3.5 346.53 463.07 n.a. 14.49 78 50.72 78.00 39.56TPS Bin Qasim 1,260 5,171.4 1,817.0 6,988.33 319.24 n.a. 544.27 1060 75.26 84.13 63.31
KESC Sub-total: 1,756 6,364.0 1,848.6 6.0 8,218.51 347.99 638.79PRIVATE SECTORAES Lalpir, M.Garh 362 1,884.0 1,883.96 395.98 n.a. 129.23 350.0 n.a. n.a. 55.00AES Pak Gen, M.Garh 365 2,061.8 2,061.83 319.13 n.a. 139.30 350.0 n.a. n.a. 59.10Altern Energy 10.5 n.a. n.a. n.a. n.a. n.a. n.a. n.a. n.a. Fauji Kabirwala 157 1,201.0 1,201.00 197.08 287.46 33.46 157.0 93.34 88.24 92.92Gul Ahmed, Karachi 136 968.6 968.63 n.a. n.a. 25.26 128.1 97.06 81.52 91.44Habibullah 129 1.0 0.0 1.00 214,094.72 n.a. 0.02 129.2 96.97 86.13 86.13HUBCO, Hub 1,292 7,635.0 7,635.00 698.52 n.a. 430.00 1,200.0 68.35 79.60 85.80Japan Power 135.6 525.8 2.6 528.48 n.a. n.a. 22.98 120.5 53.1 47.7 77.80KAPCO, Kot Addu 1,466 4,099.5 4,412.2 629.1 9,140.79 n.a. n.a. 277.83 1,575.0 75.00 88 85.50Kohinoor Energy, Lahore 131 911.9 911.94 n.a. n.a. 30.05 124.0 98.61 81.02 85.58Rousch Power 450 2,815.8 5.3 2,821.07 195.99 n.a. 49.28 395.0 91.96 90.36 99.72Saba Power 134 862.8 862.82 n.a. n.a. 43.72 125.6 83.39 74.27Southern Electric 117 381.8 381.76 n.a. n.a. 23.77 119.5Tapal Energy, Karachi 126 860.6 0.1 860.72 n.a. n.a. 12.98 123.5 79.34 78.50 98.02TNB Liberty Power 235 1,636.3 1,636.25 413.61 n.a. 47.40 229.0 87.73 99.60 88.08Uch Power 586 4,331.8 4.4 4,336.20 n.a. n.a. 73.70 610.0 90.80 91.90 91.90
IPPs Sub-total: 5,833 14,085.3 20,504.6 641.5 35,231.44 264.73 1,338.98Total Thermal: 12,489 32,922.8 30,169.4 648.7 136.4 63,877.28 340.45 3,343.26Source: IPPs, KESC, WAPDA.n.a.: Not available
Units Generated From
Table: 5.11ENERGY DATA OF THERMAL POWER STATIONS (2007-08)

RENEWABLE ENERGY IN PAKISTAN
1 Wind Power 1.1 Mega Wind Power Generation Projects at Gharo, Sindh
Letter of Intent (LOI) Eleven (11) LOIs were issued by AEDB to national and international companies for generation of 50 MW each from wind, taking the total to ninety seven (97) LOIs issued so far.
Land Allocation 8,827 acres of land in Jhimpir, District Thatta were allocated to seven (07) investors, taking the total to 33,976 acres allocated to twenty two (22) investors so far.
Tariff
One company, M/s Zorlu Enerji Pakistan Ltd. (Turkey), applied for Tariff Determination to NEPRA and was awarded tariff by NEPRA (US Cents 10.49 per kWh). So far tariff has been awarded to three IPPs by NEPRA.
Energy Purchase Agreement (EPA) / Implementation Agreement (IA)
The leading investors initiated negotiations on the standard draft EA, prepared by AEDB, with NTDC for the finalization of the EPA. M/s Zorlu Enerji initialed the EPA after negotiations with WAPDA / NTDC on 7th February 2008. Negotiations for the finalization of IA with AEDB have also been initiated by the IPPs.
Performance Guarantee
M/s Zorlu Enerji has submitted the Performance Guarantee to AEDB for acquisition of the Letter of Support (LOS).
2 National Biodiesel Programme
Realizing the importance of biodiesel, AEDB has initiated National Biodiesel Programme. Drawing on other countries’ successful experiences e.g. Germany, USA, India, etc., AEDB formulated POLICY RECOMMENDATIONS FOR THE USE OF BIODIESEL AS AN ALTERNATIVE FUEL IN PAKISTAN which are primarily aimed at reducing the country’s fuel import bill, promoting further the demand for biodiesel raw material which will be the primary commodity for biodiesel production (alongside regular diesel) and a cleaner environment. The Economic Coordination Committee (ECC) of the Federal Cabinet has approved the Policy Recommendations for Use of Biodiesel as an Alternative Fuel in its meeting held on 15th February 2008. Salient features of the approved Policy are as follows;
I. Ministry of Water & Power in coordination with AEDB shall be the apex coordinating and facilitating body for the National Bio-Diesel Programme.

II. Gradual introduction of bio-diesel fuel blends with petroleum diesel so as to achieve a minimum share of 5% by volume of the total Diesel consumption in the country by the year 2015 and 10% by 2025.
III. Oil Marketing Companies (OMCs) to purchase Bio-Diesel (B-100) from Bio-Diesel
manufacturers; and sell this Bio-Diesel blended with Petroleum Diesel (starting with B-5) at their Points of Sale.
IV. Ministry of Petroleum & Natural Resources shall come up with the fuel quality
standards for B-100 and blends up to B-20.
V. OGRA shall regulate the pricing mechanism of various blends of Bio-Diesel (B-5, B-10 etc.) and ensure its cost-competitiveness with Petroleum Diesel.
VI. The Government shall provide buy back guarantees to Biodiesel producers at a price determined by OGRA, by making it mandatory for public sector vehicles running on diesel to use Biodiesel.
VII. All imported plant, machinery, equipment and specific items used in the production
of Bio-Diesel shall be exempted from Customs Duty, Income Tax and Sales Tax. 3 PSDP Projects undertaken by AEDB F.Y. (2007-08)
3.1 Pilot Project of Production Plant of Biodiesel
Village of Goth Umar Din Arain, in Tehsil Ghora Bari District Thatta was selected in consultation with Government of Sindh and WAPDA. The load requirements of the village were finalized in consultation with the village committee, and a project was designed to satisfy their needs. The project envisaged provision of electricity through a diesel generator run on blends of Bio diesel, the blend to gradually increase to B100 on the basis of availability of feedstock. The project has been successfully completed and the village is provided electricity for 5 hours a day. Each house has three energy savers and a bracket fan, while the mosque has two energy savers, two bracket fans, charging system for the PA equipment, and a pump for lifting the water to the mosque’s storage tank. A building has been constructed which houses a 15 KVA generator, a locally manufactured oil expeller, a locally designed/ patented and fabricated esterification plant, associated equipment/ stores, and has been stored with sufficient seeds to provide bio diesel till locally grown seeds become available.
A village electricity committee has been constituted, trained and empowered to run the system on a self sustainable basis. The committee collects the monthly charges, maintains and operates the system. A group of village personnel have been trained in making of bio diesel and operating the generator/ distribution system.
4. Biomass / Waste to Energy
AEDB has taken the initiative in the promotion of Biomass and Waste to Energy in Pakistan and progressed as follows:

AEDB has issued various Letters of Intent (LOI) in the field of Biomass / Waste to Energy.
First LOI was issued to Almoiz Industries Ltd (AIL) for producing 20 MW electricity in September 2005. Almoiz Industries Ltd. is a “Captive cum grid spillover” (i.e. for self-use and sale to utility) power producing sugar unit having an installed capacity of 27 MW. 12MW of electricity fulfills the “internal requirement” whereas up to 15MW of electricity is for “export” to the grid, for which a Power Purchase Agreement (PPA) has been signed with PESCO.
Another LoI has been issued to a New Zealand based firm M/S Clean Energy
Development Ltd for a biogas project at Landhi, Karachi. AEDB is actively working for the biogas, Landhi Cattle Colony, Karachi Project. Its pilot project has to be funded by New Zealand Aid (NZAID) with local engineering partners, National Engineering Corporation (NEC). Waste from 400,000 cattle in the area would be utilized to generate electricity and high grade organic fertilizer. The pilot phase of the project (250 kW) has been initiated and the full scale plant will generate up to 50 MW of electricity and 1500 tons of organic fertilizer per day. Commissioning of the Pilot Project is expected by 30th August 2008.
An LOI has also been issued to Canadian based firm M/S Abbott Energy &
Environment for establishing 5 MW waste to energy plant at Peshawar. The investor is in the process for completing the feasibility study.
PPA has been signed between M/s Shakarganj Mills Limited & FESCO for the production of 8 MW electricity through biogas in April 2008. Out of which, 6 MW electricity will be distributed to grid in a very short time. More than 3 Textile Industries in the adjacent area will benefit through this generated power. AEDB is also fully supporting & facilitating Sugar mills in the country for the production of electricity from bagasse and biogas.
5. Solar Street Lights
AEDB has facilitated the private sector in developing solar street lights. Solar street / search lights have been installed in Central Park, Gawadar, POL Depot, Taraki & Liaqat Bagh, Rawalpindi through the private sector. Two LED solar street / search lights have been installed outside the parking lot at Prime Minister’s Secretarist for demonstration purpose.
6 International collaboration
6.1 Asian Development Bank (ADB)
A Project Preparatory Technical Assistance (PPTA) was offered by ADB in November, 2004 to analyse the renewable energy potential in each province and conduct feasibility studies of sample subprojects for financing under an ADB commercial lending scheme. AEDB was designated as the Executing Agency (EA), while the relevant departments in each province served as the Implementing Agencies (IAs).

6.1.1 Progress on Asian Development Bank Renewable Energy Development Sector Investment Program
No. Name of Project Location Capacity
& Cost
CoD
Status
LoI Date Land Acquisition Tariff*
A Sarhad Hydel Devleopment Organization (SHYDO) Government of NWFP
1 DaraI Khawar Swat 36 MW Rs. 3075 M 31 Dec 2011 Not Applicable In Process US C 4.183
2 Ranolia Kohistan 12 MW Rs. 1077 M 31 Dec 2011 Not Applicable In Process US C 3.486
3 Machai Canal Mardan 2.6 MW Rs. 318 M 31 Dec 2011 Not Applicable In Process US C 4.538
B Punjab Power Management Unit (PPMU), Irrigation & Power Department Punjab
1 Chianwali District Gujranwala
5.4 MW Rs. 827 M 31 Dec 2011 Not Applicable In Process US C 4.541
2 Deg Out-Fall District Sheikhpura 5.0 MW Rs. 675 M 31 Dec 2011 Not Applicable In Process US C 4.881
3 Pakpattan Canal District Pakpattan 3.2 MW Rs. 462 M 31 Dec 2011 Not Applicable In Process US C 4.206
4 Okara District Okara 4.0 MW Rs. 693 M 31 Dec 2011 Not Applicable In Process US C 5.065
5 Marala District Sia Ikot 7.2 MW Rs.1,064 M 31 Dec 2011 Not Applicable In Process US C 4.489
In January, 2006, after conducting Technical, Financial & Economic analyses of 05 hydel sites in Punjab and 03 hydel sites in NWFP, the following high-head and low-head hydel sites were selected as suitable for loan financing:- NWFP
(a) Ranolia (11.5 MW) (b) Daral Khwar (35 MW) (c) Machai (3.5 MW)

Punjab
(a) UCC Main Lower near Gujranwala (4.8 MW) (b) Deg Fall Sheikhpura (5.5 MW) (c) Pakpattan Canal (3.3 MW) (d) LBDC Okara (5 MW) (e) UCCM Marala (11.5 MW) The cost of eight subprojects in NWFP and Punjab identified under the first set of subprojects were estimated as $145.0 million while $80.0 and $65.0 million for NWFP and Punjab provinces, respectively. The Government requested ADB to finance up to 80% of the total cost. AEDB will be the Executing Agency (EA) for coordination and facilitation at the federal level, while the NWFP and Punjab governments will be the Executing Agencies at the provincial level. SHYDO will be the implementing agency in NWFP and the Punjab IPD will be the implementing agency (IA) in Punjab province. • Based on the investment potential of RE in Pakistan, ADB agreed to provide $
510.0 million under a Multi-tranche Finance Facility (MFF) for a period of 10 years (2007-2017) for Renewable Energy Development Sector Investment Program (REDSIP). The amount remaining after the approved projects would be available for any new Public or Public-Private RE projects that fit the ADB given selection criteria. The first tranche will be of $ 115 Million which includes $ 10 million of ADF loan.
• The loan became effective on 29 November, 2007 after obtaining Government
approval. Delay was due to revision of PC-1 and subsequently in obtaining approvals from CDWP and ECNEC.
• The loan is financing three major areas:-
− Construction of 3 hydropower projects in NWFP and 5 hydropower
projects in Punjab. − Preparation of feasibility studies for 3 new sites in NWFP and 5 new sites
in Punjab. − Capacity Development.
• The PC-1s for the 08 subprojects were approved by CDWP on 19th October,
2006. The Loan Negotiations took place in Islamabad on 30-31 October, 2006 and concluded with a signing ceremony between GoP and ADB.
• Four hydropower projects from the Northern Areas amounting to about 54 MW
are currently being considered for the Second Tranche loan. A public sector 50 MW Wind Farm is also being seen as a potential project under the REDSIP financing facility.

TA for Renewable Energy Policy Formulation and Capacity Development of the AEDB
• The goal of the TA is to facilitate the process of the development of Renewable Energy Policy of Pakistan. The purpose of the Policy is to expedite the process of developing indigenous, non-polluting, and renewable sources of energy to help meet Pakistan’s power shortage and improve the quality and reliability of the power system, including such issues in rural areas.
6.2 German Agency for Technical Cooperation (GTZ)
GTZ provided technical expertise and capacity building in
Rural Electrification
Centre of Excellence for Renewable Energy and Environment (CEREE) at the Balochistan University of IT and Management Sciences
Solar Thermal Appliances and Solar Legislation
Wind Power Generation. International and domestic experts were made available to develop PPA and IA documents for Wind Energy Generation. Legal experts were also provided to carry out the legal vetting of documents.
Clean Development Mechanism (CDM
National Renewable Energy Policy
Micro-Mini Hydel Projects
Establishing International Linkages
Energy Efficiency
Energy Conservation Fund (ECF) 6.3 UNDP / GEF Projects
• The first UNDP/GEF funded project relates to the “Sustainable Development of Utility Scale Wind power Production”. This is a two year project with a GEF funding of $ 3.1 million. The project aims to design an overall policy package to facilitate investment in wind energy, whereby providing a competitive enabling framework and corresponding incentive tailored for a market-on-grid wind energy production.
• The second UNDP project is $ 25,000 GEF funded PDF-A study relating to Productive use of Renewable energy through micro hydel projects has recently been signed. It is planned to start the project in Chitral area which is based on micro-hydel systems in the range of 100 – 300 KW per unit. About 43 locations have been identified of which 5 have been short listed for this study. A medium size project will ensue after completion of PDF-A and once investment funds are arranged.
6.4 EU-Asia Invest Program
• The EU Asia Invest program is a European Union funded initiative for the period of one year (May 2007 to July 2008) to boost private investment in the field of renewable

energy technologies in Pakistan. The selected areas for intervention are solar, wind and small hydro.
• The main activities under the program are:
Market information; Capacity building seminars; Companies match making in Pakistan;
• The partners of the program are:
Alternative Energy Development Board (AEDB) German Solar Industries Association (BSW) Estonian Wind Power Association (EWPA) European Small Hydropower Association (ESHA)
• The other Associates are:
German Agency for Technical Cooperation (GTZ- Pakistan) German Wind Energy Association (BWE)
• The total project volume amounts to € 188,000 out which €150,000 is being contributed
by EU while the remaining will come from the partners.
• A total of two capacity building seminars-cum-workshops were planned. The 1st one on Wind Farm Development was held from 6th to 10th August, 2007 at Karachi and the other workshop on Off-grid PV Solar Systems was held in Islamabad from 28th to 30th April, 2008.
6.5 World Bank Project
The World Bank had approved a study which is currently being undertaken by their consultants to develop an adequate policy and governance framework for off-grid rural electrification by assessing the effectiveness of socio-economic factors and governance structures in existing off-grid rural electrification projects and exploring and testing sustainable decentralized service-delivery models for future large-scale off-grid rural electrification in Pakistan.
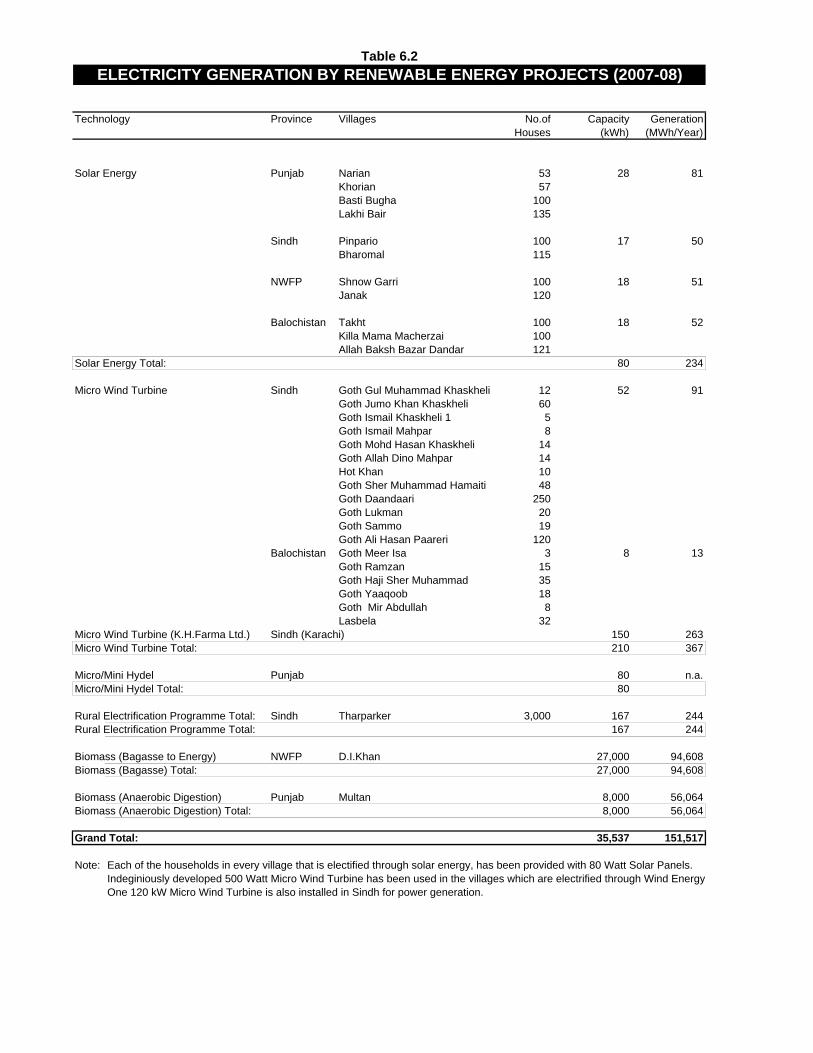
Technology Province Villages No.of Capacity GenerationHouses (kWh) (MWh/Year)
Solar Energy Punjab Narian 53 28 81Khorian 57Basti Bugha 100Lakhi Bair 135
Sindh Pinpario 100 17 50Bharomal 115
NWFP Shnow Garri 100 18 51Janak 120
Balochistan Takht 100 18 52Killa Mama Macherzai 100Allah Baksh Bazar Dandar 121
Solar Energy Total: 80 234
Micro Wind Turbine Sindh Goth Gul Muhammad Khaskheli 12 52 91Goth Jumo Khan Khaskheli 60Goth Ismail Khaskheli 1 5Goth Ismail Mahpar 8Goth Mohd Hasan Khaskheli 14Goth Allah Dino Mahpar 14Hot Khan 10Goth Sher Muhammad Hamaiti 48Goth Daandaari 250Goth Lukman 20Goth Sammo 19Goth Ali Hasan Paareri 120
Balochistan Goth Meer Isa 3 8 13Goth Ramzan 15Goth Haji Sher Muhammad 35Goth Yaaqoob 18Goth Mir Abdullah 8Lasbela 32
Micro Wind Turbine (K.H.Farma Ltd.) Sindh (Karachi) 150 263Micro Wind Turbine Total: 210 367
Micro/Mini Hydel Punjab 80 n.a.Micro/Mini Hydel Total: 80
Rural Electrification Programme Total: Sindh Tharparker 3,000 167 244Rural Electrification Programme Total: 167 244
Biomass (Bagasse to Energy) NWFP D.I.Khan 27,000 94,608Biomass (Bagasse) Total: 27,000 94,608
Biomass (Anaerobic Digestion) Punjab Multan 8,000 56,064Biomass (Anaerobic Digestion) Total: 8,000 56,064
Grand Total: 35,537 151,517
Note: Each of the households in every village that is electified through solar energy, has been provided with 80 Watt Solar Panels.Indeginiously developed 500 Watt Micro Wind Turbine has been used in the villages which are electrified through Wind EnergyOne 120 kW Micro Wind Turbine is also installed in Sindh for power generation.
ELECTRICITY GENERATION BY RENEWABLE ENERGY PROJECTS (2007-08)Table 6.2

Appendix: 7.1
Sr. Well KBE TD Completion Completion
No. Well Name # Operator Spud Date Province (Ft.) (Ft.) Zone/Formation Date Status
1 Kundal 1 PUN 0/0/1868 Punjab Abandoned
2 Sadkal 1 GOI 0/0/1870 Punjab Abandoned
3 Sadkal 2 GOI 0/0/1870 Punjab Abandoned
4 Sadkal 3 GOI 0/0/1870 Punjab Abandoned
5 Sadkal 4 GOI 0/0/1870 Punjab Abandoned
6 Sadkal 5 GOI 0/0/1870 Punjab Abandoned
7 Khattan 3 TOWN 0/0/1884 Baloch. Abandoned
8 Khattan 1 TOWN 0/0/1885 Baloch. Abandoned
9 Khattan 2 TOWN 0/0/1885 Baloch. Abandoned
10 Khattan 7 TOWN 0/0/1885 Baloch. Abandoned
11 Khattan 4 TOWN 0/0/1887 Baloch. Abandoned
12 Khattan 5 TOWN 0/0/1888 Baloch. Abandoned
13 Khattan 6 TOWN 0/0/1888 Baloch. Abandoned
14 Khattan 8 TOWN 0/0/1889 Baloch. Abandoned
15 Khattan 9 TOWN 0/0/1889 Baloch. Abandoned
16 Khattan 10 TOWN 0/0/1889 Baloch. Abandoned
17 Khattan 11 TOWN 0/0/1889 Baloch. Abandoned
18 Spintangi 1 GOB 0/0/1890 Baloch. Abandoned
19 Khattan 12 TOWN 0/0/1891 Baloch. Abandoned
20 Khattan 13 TOWN 0/0/1891 Baloch. Abandoned
21 Sukur 1 GOI 0/0/1893 Sindh Abandoned
22 Kundal 2 PUN 20-Sep-00 Punjab 640 Abandoned
23 Jaba 1 TOWN 27-Sep-05 Punjab Abandoned
24 Jaba 2 TOWN 03-Nov-05 Punjab Abandoned
25 Golra 1 I P S 15-Sep-13 Punjab Abandoned
26 Golra 2 I P S 04-Nov-13 Punjab Abandoned
27 Khaur 1 POL 08-Sep-14 Punjab 4,239 Sakessar 01-Mar-15 Oil
28 Chandragup 1 BOC 01-Jan-16 Baloch. 2,660 Abandoned
29 Chappar-1 1 BOC 20-May-16 Baloch. Abandoned
30 Pir-1 1 BOC 26-Nov-16 Baloch. Abandoned
31 Dhulian 1 POL 21-Aug-18 Punjab 1378 2,018 01-Feb-21 Abandoned
32 Khabakki 1 IBPC 30-Oct-20 Punjab 1,045 01-Jan-22 Abandoned
33 Dhulian 2 POL 01-Nov-21 Punjab 2,779 01-Sep-24 Abandoned
34 Gabhir 1 POL 26-Nov-22 Punjab 1670 1,969 Abandoned
35 Jhatla 1 WPC 30-Oct-23 Punjab 1740 7,957 01-Jan-25 Abandoned
36 Dhulian 3 POL 09-Feb-24 Punjab 3,301 01-May-25 Abandoned
37 Khairpur 1 BOC 29-Oct-25 Sindh 4,512 01-Jul-26 Abandoned
38 Dalwati 1 BOC 05-Sep-27 Punjab 1386 3,662 Abandoned
39 Ganda Kas 1 BOC 01-Jan-30 Punjab 1398 3,002 Abandoned
40 Dalwati 2 BOC 29-Sep-30 Punjab 750 3,662 Abandoned
41 Khairi Murat 1 POL 28-Oct-30 Punjab 1614 532 27-Dec-30 Abandoned
42 Khairi Murat 3 POL 02-Jan-31 Punjab 1614 1,056 03-Mar-31 Abandoned
43 Khairi Murat 4 POL 01-Apr-31 Punjab 1614 755 31-May-31 Abandoned
44 Khairi Murat 5 POL 30-Jun-31 Punjab 1614 1,414 29-Aug-31 Abandoned
45 Khairi Murat 6 POL 29-Sep-31 Punjab 1614 994 28-Nov-31 Abandoned
46 Khairi Murat 7 POL 22-Dec-31 Punjab 1614 827 20-Feb-32 Abandoned
47 Babai 1 IBPC 03-Sep-32 Punjab 1815 7,712 Abandoned
48 Khairi Murat 2 POL 02-Nov-32 Punjab 1614 1,070 01-Jan-33 Abandoned
49 Ganda Kas 2 BOC 01-Jan-33 Punjab Abandoned
50 Dhulian 4 POL 01-May-33 Punjab 1324 3,465 17-Apr-34 Abandoned
51 Dhulian 5 POL 04-Oct-34 Punjab 1306 8,508 21-Jan-36 Abandoned
52 Chor Lakki 2 IBPC 01-Jan-36 Punjab 1050 4,000 01-Jan-38 Abandoned
53 Bokra 1 POL 26-Jan-36 Punjab 4,000 Abandoned
54 Chorlakki 1 IBPC 27-Feb-36 Punjab 1050 2,251 01-Jan-38 Abandoned
55 Dhulian 6 POL 05-May-36 Punjab 1339 8,268 Ranikot 15-May-37 Oil
56 Ganda Kas 3 BOC 01-Jan-38 Punjab Abandoned
57 Drigh Road 1 BOC 05-Jan-39 Sindh 242 10,906 07-Nov-56 Abandoned
58 Ganda Kas 1 IBPC 22-Nov-39 Punjab Abandoned
59 Meyal 1A POL 29-Oct-42 Punjab 8,491 20-Nov-44 Abandoned
60 Uchhri 1 POL 25-Feb-43 Punjab 8,445 17-Feb-44 Abandoned
61 Joya Mair 1 POL 25-Oct-43 Punjab 1670 6,900 Chorgali/Sakessar 01-Jan-44 Oil
62 Balkassar 1A POL 04-Apr-45 Punjab 1782 8,399 Chorgali/Sakessar 01-Jan-46 Oil
63 Meyal 2A POL 18-May-45 Punjab 10,502 14-Nov-45 Abandoned
64 Bokra 2 POL 19-May-45 Punjab 1850 6,365 30-Apr-46 Abandoned
65 Chakwal 1 BOC 08-Jul-46 Punjab 1387 8,740 01-Jul-48 Abandoned
66 Meyal 3A BOC 01-Jul-47 Punjab 1440 8,219 Datta 13-Mar-48 Abandoned
67 Lakhra 1B BOC 25-May-48 Sindh 332 12,666 29-Apr-50 Abandoned
68 Sui 1 PPL 10-Oct-51 Baloch. 800 10,048 Sui Main Lst. 02-Nov-52 Gas
69 Bains 1 POL 18-Dec-51 Punjab 1736 3,599 23-Sep-53 Abandoned
70 Dhariala 1P POL 17-Jan-52 Punjab 2884 8,517 18-Apr-52 Abandoned
Note: Boldtype indicate discoveries. Contd./...
(IN CHRONOLOGICAL ORDER)
OIL & GAS EXPLORATORY WELLS DRILLED IN PAKISTAN

Sr. Well KBE TD Completion Completion
No. Well Name # Operator Spud Date Province (Ft.) (Ft.) Zone/Formation Date Status
71 Chak Naurang 1 BOC 20-Mar-52 Punjab 1830 7,700 17-Apr-53 Abandoned
72 Bains 2 POL 13-Nov-52 Punjab 1736 11,136 17-Sep-55 Abandoned
73 Zin 1 PPL 23-Jan-53 Baloch. 3566 6,383 26-Jun-54 Gas
74 Uch 1 PPL 15-Feb-55 Baloch. 388 11,001 Lower Goru 30-Sep-55 Gas
75 Karsal 1 POL 02-May-55 Punjab 1385 12,750 Chorgali/Sakessar 07-May-57 Oil
76 Dhak 1 Hunt 05-May-56 Baloch. 21 8,407 26-Oct-56 Abandoned
77 Kech Band 1 Hunt 15-May-56 Baloch. Abandoned
78 Digh 1X Stanvac 21-May-56 Sindh 40 10,908 11-Jul-56 Abandoned
79 Jhatla 1P POL 06-Jul-56 Punjab 1919 6,546 19-Apr-57 Abandoned
80 Karachi 1 PPL 07-Aug-56 Sindh 194 9,968 31-Jul-57 Abandoned
81 Khairpur 2 PPL 14-Sep-56 Sindh 602 11,014 06-Apr-57 Gas
82 Dhak 2 Hunt 10-Nov-56 Baloch. 20 14,614 17-Mar-57 Abandoned
83 Adhi 1 PPL 14-Dec-56 Punjab 1794 2,098 - 21-Feb-57 Abandoned
84 Mari 1 ESSO 29-Dec-56 Sindh 248 11,110 Habib Rahi Lst. 01-Aug-57 Gas
85 Sari Singh 1 Hunt 28-Apr-57 Sindh 882 10,176 30-Aug-57 Abandoned
86 Kalar Kahar 1 POL 20-May-57 Punjab 2126 7,130 15-Jul-58 Abandoned
87 Talhar 1X Stanvac 23-May-57 Sindh 48 10,785 21-Sep-57 Abandoned
88 Nandrakhi 1 POL 06-Jul-57 Punjab 2221 3,419 30-Sep-58 Abandoned
89 Sunbak 1 Hunt 09-Sep-57 Sindh 370 6,339 14-Oct-57 Abandoned
90 Bannh 1 PPL 15-Oct-57 Baloch. 492 13,002 29-Apr-58 Abandoned
91 Sanni 1 PPL 15-Oct-57 Baloch. Abandoned
92 Mirpurbataro 1X Stanvac 15-Oct-57 Sindh 42 10,012 03-Feb-58 Abandoned
93 Lakhra 1 Hunt 20-Oct-57 Sindh 322 11,892 14-Mar-58 Abandoned
94 Adhi 2 PPL 07-Nov-57 Punjab 1856 3,760 - 01-Apr-58 Abandoned
95 Giandari 1 PSOC 26-Feb-58 Punjab 1226 12,005 08-Sep-58 Abandoned
96 Lakhra 2 Hunt 19-Mar-58 Sindh 358 3,931 01-Apr-58 Abandoned
97 Lakhra 3 Hunt 06-Apr-58 Sindh 400 3,901 17-Apr-58 Abandoned
98 Lakhra 4 Hunt 24-Apr-58 Sindh 266 3,950 07-May-58 Abandoned
99 Jacobabad 1 PPL 08-May-58 Sindh 183 3,265 19-May-58 Abandoned
100 Phulji 1 Hunt 29-May-58 Sindh 158 12,186 03-Sep-58 Abandoned
101 Nabisar 1 Stanvac 15-Jun-58 Sindh 99 10,023 17-Sep-58 Abandoned
102 Jacobabad 2 PPL 12-Jun-58 Sindh 185 5,814 16-Jul-58 Abandoned
103 Mazarani 1 PPL 21-Aug-58 Sindh 289 10,112 17-Jan-59 Gas
104 Badhra 1 Hunt 07-Oct-58 Sindh 21-Feb-59 Abandoned
105 Karampur 1 Shell 27-Dec-58 Punjab 467 9,958 09-Apr-59 Abandoned
106 Chak Belikhan 1 POL 21-Jan-59 Punjab 1591 1,421 12-Ma y-59 Abandoned
107 Kandhkot 1 PPL 07-Mar-59 Sindh 241 6,821 Sui Main Lst. 12-Apr-59 Gas
108 Phulji 2 Hunt 23-Mar-59 Sindh 8,321 25-Apr-59 Abandoned
109 Karachi 2 PPL 26-Apr-59 Sindh 194 12,946 25-Nov-59 Abandoned
110 Mahesian 1 POL 01-Jun-59 Punjab 1247 10,785 13-May-60 Abandoned
111 Chak Belikhan 2 POL 19-Oct-59 Pun jab 1,499 12-Dec-59 Abandoned
112 Domanda 1 PPL 26-Nov-59 Punjab 2372 11,183 21-Apr-60 Abandoned
113 Dasori 1 PPL 15-Dec-60 Sindh 74 11,152 20-Mar-61 Abandoned
114 Tanwin 1 POL 19-Jan-61 Pun jab 1762 14,745 23-Feb-62 Abandoned
115 Badin 1X Stanvac 03-Sep-61 Sindh 37 9,005 05-Nov-61 Abandoned
116 Kech Band 1 Tide 20-Mar-62 Sindh 10,988 17-Dec-62 Abandoned
117 Chharat Gib 2 OGDC 06-Jul-63 Punjab 25-May-64 Abandoned
118 Chharat Gib 1 OGDC 16-Jul-63 Punjab 30-Dec-63 Abandoned
119 Chharat Gib 3 OGDC 22-Jul-63 Punjab 30-Aug-63 Abandoned
120 Chak Belikhan 3 POL 25-Jul-63 Punjab 1526 12,904 27-Apr-64 Abandoned
121 Dabbo Creek 1 Sun Oil 20-Nov-63 Offshore 62 14,286 08-Aug-64 Abandoned
122 Patiani Creek 1 Sun Oil 19-Aug-64 Sindh 61 8,725 22-Oct-64 Abandoned
123 Korangi Creek 1 Sun Oil 25-Oct-64 Offshore 52 13,583 21-Feb-65 Abandoned
124 Toot 1 OGDC 02-Nov-64 Punjab 1077 14,646 13-Sep-67 Oil
125 Kundian 1 PPL 27-Jan-65 Punjab 683 7,087 03-Apr-65 Abandoned
126 Sari 1 OGDC 30-Jul-65 Sindh 825 4,856 Ranikot 05-Apr-66 Gas
127 Adhi 3 PPL 18-Oct-65 Punjab 1761 10,736 - 23-Dec-66 Abandoned
128 Mari x-7 ESSO 19-Feb-66 Sindh 2,576 24-Feb-66 Gas
129 Kot Sarang 1 OGDC 22-Jul-66 Punjab 1388 13,627 - 09-May-68 Abandoned
130 Adhi 4 PPL 22-Apr-67 Punjab 1815 6,692 - 06-Dec-67 Abandoned
131 Penir 1 OGDC 12-Oct-67 Sindh 1437 8,964 07-Jun-68 Abandoned
132 Meyal 1P POL 04-Nov-67 Punjab 1230 12,514 Chorgali/Sakessar 04-Nov-68 Oil/Gas
133 Kand 1 OGDC 17-Sep-68 Punjab 670 7,874 - 30-Apr-69 Abandoned
134 Pezu 1 PPL 09-Nov-68 Punjab 1106 7,294 02-Apr-69 Abandoned
135 Nuryal 1 OGDC 28-May-69 Punjab 1199 15,768 - 10-Aug-71 Abandoned
136 Hundi 1 OGDC 21-Sep-69 Sindh 1091 7,888 Ranikot 10-Mar-71 Gas
137 Karang Gib 1 OGDC 03-Jan-69 Punjab 2925 3,546 - 10-Apr-71 Abandoned
138 Marwat 1 PPL 23-Aug-70 Punjab 1933 7,251 20-Dec-70 Abandoned
139 Gadularo 1 OGDC 06-Jun-71 Sindh 736 6,098 - 16-Feb-72 Abandoned
140 Dhadambar 1 OGDC 01-Dec-71 Punjab 1151 9,820 - 22-Dec-77 Abandoned
141 Kothar 1 OGDC 08-Aug-72 Sindh 997 6,236 - 27-Jul-73 Gas
142 Indus Marine 1A Winter 12-Sep-72 Offshore 35 9,322 14-Dec-72 Abandoned
143 Indus Marine 1B Winter 15-Dec-72 Offshore 35 12,482 14-Mar-73 Abandoned
144 Rodho 1 OGDC 26-Dec-72 Punjab 1910 620 04-Dec-73 Abandoned
145 Rodho 2 OGDC 15-Jan-73 Punjab 1905 8,100 22-Dec-74 Gas
Note: Boldtype indicate discoveries. Contd./...
OIL & GAS EXPLORATORY WELLS (Contd.)

Sr. Well KBE TD Completion Completion
No. Well Name # Operator Spud Date Province (Ft.) (Ft.) Zone/Formation Date Status
146 Sarai Sidhu 1 Amoco 02-Dec-73 Punjab 476 10,762 16-Feb-74 Abandoned
147 Tola 1 Amoco 27-Feb-74 Punjab 479 6,000 14-Mar-74 Abandoned
148 Jhatpat 1 Amoco 06-Apr-74 Baloch. 200 15,303 20-Sep-74 Abandoned
149 Kamiab 1 Amoco 15-Oct-74 Punjab 535 7,541 21-Nov-74 Abandoned
150 Budhuana 1 Amoco 04-Dec-74 Punjab 504 4,198 15-Dec-74 Abandoned
151 Jandran 1 Amoco 15-Jan-75 Baloch. 4403 8,054 27-Jul-75 Gas
152 Garr koh 1 MAR 04-Mar-75 Baloch. 177 11,887 25-Aug-75 Abandoned
153 Indus Marine 1C Winter 04-Mar-75 Offshore 35 6,372 13-May-75 Abandoned
154 TadriMain 1 Amoco 30-Sep-75 Baloch. 3638 5,990 12-Dec-75 Abandoned
155 Pirkoh 1 OGDC 25-Oct-75 Baloch. 236 9,187 Ranikot 30-Dec-77 Gas
156 Sakhi Sarwar 1 Amoco 10-Jan-76 Punjab 782 15,030 13-Oct-76 Abandoned
157 Jal pari 1A MAR 30-Dec-76 Offshore 66 6,585 13-Feb-77 Abandoned
158 Adhi 5 PPL 01-Aug-77 Punjab 1775 9,219 Salt Range 12-Feb-78 Gas/Cond.
159 Karak 1 TEX 04-Aug-77 Punjab 2761 14,629 23-Apr-78 Abandoned
160 Kotrum 1 OGDC 16-Dec-77 Punjab 1685 15,742 - 18-Aug-79 Abandoned
161 Karachi South 1A Husky 26-Feb-78 Offshore 52 11,002 09-May-78 Abandoned
162 Dhodak 1 OGDC 12-Jun-75 Punjab 1685 6,998 Pab 17-Dec-77 Condensate
163 Dhermund 1 OGDC 30-Dec-78 Punjab 1390 14,212 - 10-Jan-79 Abandoned
164 Patar 1 UTP 16-Jan-79 Sindh 32 10,100 - 14-Mar-79 Abandoned
165 Tarai 1 UTP 26-Mar-79 Sindh 40 10,200 - 06-Jun-79 Abandoned
166 Mianwala 1 Amoco 16-Jun-79 Punjab 1486 15,807 03-Mar-80 Abandoned
167 Qazian 1X Gulf 20-Oct-79 Punjab 1508 8,140 03-Aug-80 Abandoned
168 Surjan 1 OGDC 12-Dec-79 Sindh 1106 11,861 27-Se p-81 Abandoned
169 Fimkassar 1X Gulf 21-Aug-80 Punjab 1772 11,465 08-Jun-81 Oil
170 Damiri 1 UTP 10-Oct-80 Sindh 50 12,360 - 06-Feb-81 Abandoned
171 Bahawalpur East 1 Shell 19-Dec-80 Punjab 443 9,922 17-Feb-81 Abandoned
172 Khaur-Oxy 1 OXY 18-Jan-81 Punjab 1630 9,306 06-Feb-82 Abandoned
173 Hayal 1 OGDC 01-Feb-81 Punjab 1764 8,698 - 27-Dec-81 Abandoned
174 Jati 1 UTP 18-Feb-81 Sindh 36 10,109 - 07-May-81 Abandoned
175 Marot 1 Shell 22-Feb-81 Punjab 469 8,517 17-Apr-81 Abandoned
176 Khaskeli 1 UTP 14-May-81 Sindh 59 8,529 Lower Goru-A2 02-Jul-81 Oil
177 Balkassar 1 OXY 23-Jun-81 Punjab 1757 10,270 07-Oct-81 Abandoned
178 Tarai 2 UTP 30-Dec-81 Sindh 34 3,055 - 11-Jan-82 Abandoned
179 Dakhni 1 OGDC 11-Mar-82 Punjab 1088 16,241 Chorgali 20-Aug-83 Gas/Cond.
180 Jhal 1 BP 12-May-82 Baloch. 256 16,405 09-Dec-82 Abandoned
181 Bhadmi 1 UTP 29-Oct-82 Sindh 14 12,512 - 25-Jan-83 Abandoned
182 Warnali 1 Shell 11-Nov-82 Punjab 709 9,213 09-Jan-83 Abandoned
183 Sanni 1 BP 04-Jan-83 Baloch. 509 4,170 19-Jan-83 Abandoned
184 Lilla 1 Shell 21-Jan-83 Punjab 699 6,319 07-Mar-83 Abandoned
185 Dari 1 UTP 01-Feb-83 Sindh 45 8,000 - 22-Mar-83 Abandoned
186 Pabbi Hill 1 Shell 18-Mar-83 Punjab 1317 10,624 11-Jul-83 Abandoned
187 Kathar 1 OGDC 25-Mar-83 Sindh 80 12,080 - 21-Sep-83 Abandoned
188 Laghari 1 UTP 31-Aug-83 Sindh 62 3,400 _ 27-Sep-83 Oil
189 Dhurnal 1 OXY 25-Oct-83 Punjab 1684 13,438 Chorgali/Sakessar 08-May-84 Oil
190 Kario 1 UTP 27-Oct-83 Sindh 72 6,301 - 24-Nov-83 Abandoned
191 Golarchi 1 UTP 14-Dec-83 Sindh 39 6,400 Lower Goru 28-Jan-84 Gas
192 Tando Alam 1 OGDC 28-Jan-84 Sindh 79 8,203 08-Jun-84 Oil
193 Nizamani 1 UTP 31-Jan-84 Sindh 91 6,000 - 23-Feb-84 Abandoned
194 Akai 1 UTP 25-Feb-84 Sindh 62 3,600 - 08-Mar-84 Abandoned
195 Jhol 1 UTP 12-Apr-84 Sindh 46 4,650 - 30-May-84 Abandoned
196 Nuryal 2 OGDC 17-Mar-84 Punjab 1207 16,076 - 24-Oct-84 Abandoned
197 Nandpur 1 OGDC 24-Apr-84 Punjab 466 6,923 Kingriali 29-Jun-84 Gas
198 Tajedi 1 UTP 02-May-84 Sindh 33 5,880 Lower Goru 26-May-84 Oil
199 Dhandi 1 OGDC 25-May-84 Punjab 253 5,400 - 30-Jul-84 Abandoned
200 Makhrah 1 UTP 28-May-84 Sindh 45 4,089 - 11-Jun-84 Abandoned
201 Walhar 1 UTP 06-Jun-84 Sindh 62 5,500 - 30-Jun-84 Abandoned
202 Mazari 1 UTP 27-Jul-84 Sindh 84 6,600 - 29-Aug-84 Abandoned
203 Talpur 1 UTP 01-Sep-84 Sindh 77 4,733 - 19-Sep-84 Abandoned
204 Dabhi 1 UTP 21-Sep-84 Sindh 66 6,200 Lower Goru 23-Oct-84 Oil/Gas
205 Panjpir 1 OGDC 02-Oct-84 Punjab 467 6,956 Samana Suk Lst. 03-Apr-85 Gas
206 Gharhari 1 UTP 14-Nov-84 Sindh 30 6,295 - 13-Dec-84 Abandoned
207 Shahdadpur 1 OGDC 20-Nov-84 Sindh 114 13,452 27-Jun-85 Abandoned
208 Alipur 1 UTP 27-Nov-84 Sindh 67 5,667 - 15-Dec-84 Abandoned
209 Loti 1 OGDC 05-Dec-84 Baloch. 3067 7,389 Pab 31-May-85 Gas
210 Nari 1 UTP 15-Dec-84 Sindh 40 6,900 - 30-Jan-85 Gas
211 Rarri 1 UTP 17-Dec-84 Sindh 28 6,711 - 13-Jan-85 Abandoned
212 Junathi 1 UTP 14-Jan-85 Sindh 56 6,000 - 04-Feb-85 Abandoned
213 Kot Sarang 2 OGDC 24-Jan-85 Punjab 14,233 08-Oct-85 Abandoned
214 Rajo 1 UTP 02-Mar-85 Sindh 27 5,885 - 22-Mar-85 Abandoned
215 Akri 1 UTP 22-Mar-85 Sindh 34 5,910 - 14-Apr-85 Abandoned
216 Sonro 1 UTP 30-Jul-85 Sindh 63 4,348 Lower Goru 09-Aug-85 Gas/Cond.
217 Turk 1 UTP 15-Apr-85 Sindh 53 6,954 - 21-May-85 Oil/Gas
218 Mazari 2 UTP 23-May-85 Sindh 63 4,750 Lower Goru 12-Jun-85 Oil
219 South Mazari 1 UTP 13-Jun-85 Sindh 61 4,803 Lower Goru 30-Jun-85 Oil
220 Kaku 1 OGDC 09-Jul-85 Sindh 79 8,471 - 27-Aug-85 Abandoned
Note: Boldtype indicate discoveries. Contd./...
OIL & GAS EXPLORATORY WELLS (Contd.)

Sr. Well KBE TD Completion Completion
No. Well Name # Operator Spud Date Province (Ft.) (Ft.) Zone/Formation Date Status
221 Machi 1 OGDC 18-Aug-85 Sindh 69 8,514 - 10-Oct-85 Abandoned
222 Bukhari 1 UTP 27-Aug-85 Sindh 55 10,001 Lower Goru 10-Jan-86 Gas
223 Babar 1 OGDC 24-Sep-85 Sindh 79 12,001 - 30-Apr-86 Abandoned
224 Pakcan 1 OGDC 27-Sep-85 Offshore 59 12,142 - 01-Feb-86 Abandoned
225 Pariwali 1 OXY 09-Nov-85 Punjab 1469 17,450 - 26-May-86 Oil/Gas
226 Paniro 1 UTP 16-Nov-85 Sindh 58 3,050 - 24-Nov-85 Abandoned
227 Sann 1 OGDC 17-Nov-85 Sindh 449 12,360 30-May-86 Abandoned
228 Chak Naurang 1A OGDC 06-Jan-86 Punjab 1826 8,816 Khewra 20-Aug-86 Oil
229 Afiband 1 OGDC 25-Jan-86 Punjab 2826 6,627 27-Jul-86 Abandoned
230 Dabhi South 1 UTP 30-Mar-86 Sindh 63 5,975 Lower Goru 20-Apr-86 Gas
231 Zindapir 1 OGDC 20-Mar-86 Punjab 1313 14,456 07-Apr-87 Abandoned
232 Matli 1 UTP 21-Apr-86 Sindh 65 6,000 Lower Goru 10-May-86 Oil/Gas
233 Jabo 1 UTP 12-May-86 Sindh 26 7,309 Lower Goru 15-Jun-86 Gas
234 Ghotana 1 OGDC 15-May-86 Sindh 82 7,881 Lower Goru 05-Aug-86 Oil
235 Haji 1 UTP 16-Jun-86 Sindh 27 5,500 07-Jul-86 Abandoned
236 Makhdumpur 1 UTP 16-Aug-86 Sindh 43 8,493 Lower Goru 14-Sep-86 Gas
237 Liari 1 UTP 30-Sep-86 Sindh 70 7,520 - 23-Oct-86 Oil
238 Piranwal 1 OGDC 24-Nov-86 Punjab 470 8,439 - 02-Jan-87 Abandoned
239 Halipota 1 UTP 25-Nov-86 Sindh 69 7,602 Lower Goru 19-Dec-86 Oil/Gas
240 Lashari 1 OGDC 11-Dec-86 Sindh 78 8,366 - 08-Mar-87 Abandoned
241 Lashari South 1 OGDC 23-Mar-87 Sindh 79 7,395 Lower Goru 02-Jun-87 Condensate
242 Injra 1 OGDC 15-Jun-87 Punjab 1110 15,549 - 26-A pr-88 Abandoned
243 Thora 1 OGDC 15-Jun-87 Sindh 83 7,281 27-Jul-87 Oil
244 Kunar 1 OGDC 04-Aug-87 Sindh 76 7,225 Lower Goru 14-Nov-87 Abandoned
245 Palari 1 OGDC 06-Sep-87 Sindh 299 11,900 - 30-Aug-88 Abandoned
246 Ghunghro 1 UTP 14-Sep-87 Sindh 30 8,500 Lower Goru 31-Jan-88 Oil
247 Baz 1 AS 20-Nov-87 Sindh 36 7,575 11-Jan-88 Abandoned
248 Kunar East 1 OGDC 28-Nov-87 Sindh 73 7,762 - 16-Jan-88 Abandoned
249 Sono 1 OGDC 24-Dec-87 Sindh 80 7,622 Lower Goru 06-Feb-88 Oil
250 Ratana 1 OXY 14-Jan-88 Punjab 1481 17,210 Patala 05-Oct-89 Gas/Cond.
251 Kunar 2 OGDC 01-Feb-88 Sindh 75 6,992 Lower Goru 14-Apr-88 Oil
252 Pir 1 UTP 02-Feb-88 Sindh 51 9,022 Lower Goru 12-Mar-88 Gas
253 Paniro 2 UTP 12-Feb-88 Sindh 61 7,400 Lower Goru 12-Mar-88 Oil
254 Bobi 1 OGDC 02-Mar-88 Sindh 92 9,514 Lower Goru 31-May-88 Gas/Cond.
255 Lashari-C 1 OGDC 05-Mar-88 Sindh 7,061 11-Apr-88 Oil
256 Duphri 1 UTP 26-Mar-88 Sindh 43 3,638 Lower Goru 09-Mar-88 Oil
257 Lashari East 1 OGDC 14-May-88 Sindh 67 7,398 - 07-Jul-88 Abandoned
258 Bari 1 UTP 29-May-88 Sindh 53 3,700 - 06-Jun-88 Abandoned
259 Fimkassar 1A OGDC 01-Jun-88 Punjab 1787 9,374 Murree 04-Dec-88 Abandoned
260 Khorewah 1 UTP 09-Jun-88 Sindh 50 6,850 Lower Goru 09-Jul-88 Gas/Cond.
261 Mol 1 CNW 12-Jun-88 Sindh 866 9,941 02-Oct-88 Abandoned
262 Baki Ilkim 1 OGDC 21-Jun-88 Sindh 186 12,848 22-Nov-88 Abandoned
263 Erazi 1 UTP 11-Jul-88 Sindh 51 5,842 _ 25-Jul-88 Abandoned
264 Jalwal 1 POL 28-Jul-88 Punjab 1139 14,820 03-Dec-89 Abandoned
265 North Akri 1 UTP 03-Sep-88 Sindh 39 10,790 Lower Goru-B 04-Nov-88 Oil
266 Daru 1 OGDC 12-Oct-88 Sindh 65 8,409 Lower Goru 22-Jan-89 Gas/Cond.
267 Ranger 1 ROL 16-Oct-88 Sindh 29 8,470 13-Nov-88 Abandoned
268 Bagla 1 Philips 22-Oct-88 Sindh 43 9,262 09-Dec-88 Gas
269 Thora East 1 OGDC 22-Nov-88 Sindh 7,130 09-Jan-89 Oil
270 Loti South 1 OGDC 10-Nov-88 Baloch. 1305 5,364 09-Jan-89 Abandoned
271 Bhal Saydan 1 OGDC 12-Dec-88 Punjab 1581 13,150 MAR 06-Feb-90 Condensate
272 Shakardara 1 OGDC 28-Jan-89 N.W.F.P. 2018 14,922 27-Mar-90 Abandoned
273 Babu 1 UTP 28-Jan-89 Sindh 64 7,447 - 03-Apr-89 Abandoned
274 Tando Ghulam Ali 1 UTP 03-Mar-89 Sindh 68 10,110 Lower Goru 18-Apr-8 9 Gas/Cond.
275 Bhangali 1 OXY 10-Mar-89 Punjab 1822 13,307 Sakessar 05-Oct-89 Oil
276 Fimkassar 1 OGDC 16-Apr-89 Punjab 1777 10,109 Patala 16-Sep-89 Oil
277 Jamali 1 UTP 22-Apr-89 Sindh 51 8,571 - 27-May-89 Abandoned
278 Kadanwari 1 Lasmo 25-Apr-89 Sindh 228 13,095 18-Sep-89 Gas
279 Rais 1 OGDC 03-Apr-89 Sindh 88 8,481 - 03-Jun-89 Abandoned
280 Koli 1 UTP 16-May-89 Sindh 49 5,549 Lower Goru 03-Jun-89 Gas/Cond.
281 Arbi 1 UTP 30-May-89 Sindh 35 7,709 - 15-Jun-89 Abandoned
282 Sirani 1 UTP 18-Jun-89 Sindh 30 6,535 - 04-Jul-89 Abandoned
283 Kato 1 UTP 22-Jun-89 Sindh 62 7,950 Lower Goru 10-Sep-89 Gas/Cond.
284 Pasahki 1 OGDC 14-Jun-89 Sindh 77 7,156 Lower Goru 15-Aug-89 Oil
285 Chakri 1 UTP 11-Aug-89 Sindh 61 8,300 - 22-Sep-89 Abandoned
286 Baki Ilkim 2 OGDC 22-Sep-89 Sindh 210 14,226 18-May-90 Abandoned
287 Bhatti 1 UTP 12-Oct-89 Sindh 37 6,800 Lower Goru 05-Nov-89 Oil/Gas
288 Pasahki North 1 OGDC 06-Nov-89 Sindh 71 7,208 Lower Goru 16-Dec-89 Oil
289 Rind 1 UTP 15-Dec-89 Sindh 57 3,857 Lower Goru 27-Dec-89 Oil/Gas
290 Sher 1 Philips 17-Dec-88 Sindh 42 11,500 18-Apr-89 Abandoned
291 Darbula 1 OGDC 20-Dec-89 Punjab 578 5,090 Salt Range 12-Jan-90 Abandoned
292 Sadaf 1 OXY 22-Dec-89 Offshore 49 13,058 - 08-Mar-90 Abandoned
293 Shero 1 UTP 28-Dec-89 Sindh 73 6,400 - 11-Jan-90 Abandoned
294 Khokhar 1 OGDC 08-Jan-90 Sindh 73 8,366 - 18-Apr-90 Abandoned
295 Qadirpur 1 OGDC 15-Jan-90 Sindh 248 5,138 Sui Main Lst. 23-Mar-90 Gas
Note: Boldtype indicate discoveries. Contd./...
OIL & GAS EXPLORATORY WELLS (Contd.)

Sr. Well KBE TD Completion Completion
No. Well Name # Operator Spud Date Province (Ft.) (Ft.) Zone/Formation Date Status
296 Lashari East 1 OGDC 03-Feb-90 Sindh 6,854 24-Apr-90 Oil
297 Rip 1 UTP 21-Feb-90 Sindh 46 3,646 _ 28-Feb-90 Abandoned
298 Akri North 3 UTP 12-Mar-90 Sindh 6,500 24-Mar-90 Abandoned
299 Judge 1 Lasmo 25-Apr-90 Sindh 187 12,131 24-Sep-90 Abandoned
300 Turkwal 1 OGDC 06-Jun-90 Punjab 1675 10,534 16-Jan-91 Abandoned
301 Bobi South 1 OGDC 08-Jul-90 Sindh 90 9,692 25-Sep-90 Abandoned
302 Pir Patho 1 Cant. 26-Jul-90 Sindh 52 10,705 25-Sep-90 Abandoned
303 Palijani 1 OGDC 30-Aug-90 Sindh 92 8,525 - 07-Nov-90 Abandoned
304 Chonai 1 PCPI 02-Sep-90 N.W.F.P. 1269 12,796 22-Dec-90 Abandoned
305 Sultan 1 PCPI 07-Sep-90 Sindh 186 8,360 05-Oct-90 Abandoned
306 Gorwar 1 Lasmo 05-Oct-90 Sindh 203 11,836 11-Jan-91 Gas shows
307 Kandra 1 Premier 09-Oct-90 Sindh 216 7,460 22-Nov-90 Gas
308 Dhumraki 1 OGDC 21-Oct-90 Sindh 94 9,557 14-Jan-91 Condensate
309 Messa Keswal 1 OGDC 22-Nov-90 Punjab 1518 7,220 Kingriali 13-Oct-91 Oil
310 Pindori 1 OXY 22-Nov-90 Punjab 1614 13,920 18-MaSak./Chor./Pat./Lok y-91 Oil
311 Noor 1 OGDC 05-Dec-90 Sindh 46 9,180 03-May-91 Gas
312 Qadirpur(Deep) X-2 OGDC 07-Feb-91 Sindh 5,207 09-Apr-91 Abandoned
313 Manjhu 1 Premier 12-Feb-91 Sindh 315 11,720 19-Mar-91 Abandoned
314 Buzdar 1 OGDC 18-Mar-91 Sindh 60 5,092 26-Apr-91 Gas
315 Allah Dino 1 OGDC 22-May-91 Sindh 89 8,266 08-Aug-91 Abandoned
316 M.Ismail 1 OGDC 03-Jun-91 Sindh 69 9,082 14-Jul-91 Oil
317 Sadkal 1 OGDC 26-Jun-91 Punjab 29 13,770 09-Jun-92 Condensate
318 Bobi_N 1 OGDC 30-Jun-91 Sindh 94 9,344 11-Aug-91 Abandoned
319 Tolanj 1 Amoco 09-Aug-91 N.W.F.P. 2449 10,161 24-Nov-91 Abandoned
320 Adiani 1 Lasmo 10-Aug-91 Sindh 218 11,915 30-Nov-91 Abandoned
321 Almani 1 OGDC 05-Sep-91 Sindh 68 6,898 08-Nov-91 Abandoned
322 Khajari 1 OGDC 24-Nov-91 Sindh 59 11,475 04-May-92 Abandoned
323 Waku 1 OGDC 27-Dec-91 Sindh 69 8,361 09-Mar-92 Abandoned
324 Saro 1 OGDC 18-Jan-92 Punjab 547 3,410 21-Feb-92 Abandoned
325 Shaik Nadin 1 Cant. 05-Feb-92 Sindh 29 5,509 28-Feb-92 Abandoned
326 Sadaki 1 OGDC 10-Apr-92 Sindh 29 8,859 02-Nov-92 Abandoned
327 Ahmedpur 1 POL 23-Apr-92 Punjab 376 8,630 05-Jun-92 Abandoned
328 Ichrie 1 OGDC 12-May-92 Punjab 121 10,820 09-Oct-92 Abandoned
329 Jhalar 1 UTP 20-May-92 Sindh 46 4,300 01-Jun-92 Abandoned
330 Nak-Band 1 OGDC 25-May-92 N.W.F.P. 951 9,934 01-A pr-93 Abandoned
331 Miran 1 OGDC 30-Jun-92 Sindh 126 13,639 30-Jan-93 Abandoned
332 Sakrand 1 OGDC 30-Jun-92 Sindh 124 14,098 07-Feb-93 Abandoned
333 Drigri 1 OGDC 02-Sep-92 Sindh 1,066 28-Nov-92 Abandoned
334 Mahi 1 UTP 11-Sep-92 Sindh 49 6,557 27-Sep-92 Condensate
335 Sandiki 1 UTP 09-Oct-92 Sindh 1,854 12-Oct-92 Abandoned
336 Sagyun 1 OGDC 14-Oct-92 Sindh 13,928 13-May-93 Abandoned
337 Bari 2 UTP 21-Oct-92 Sindh 3,028 30-Oct-92 Oil
338 Nakurji 1 UTP 10-Nov-92 Sindh 6,536 30-Nov-92 Gas
339 Kahi 1 Amoco 05-Dec-92 N.W.F.P. 6,910 25-Jan-93 Abandoned
340 N.Mazari 1 UTP 07-Dec-92 Sindh 4,826 15-Dec-92 Abandoned
341 Kashmore 1 OGDC 22-Jan-93 Sindh 8,905 27-Apr-93 Abandoned
342 Buzdar-N 1 OGDC 24-Jan-93 Sindh 5,250 03-Mar-93 Oil
343 Sumari 1 Amoco 06-Feb-93 N.W.F.P. 4,810 03-Mar-93 Abandoned
344 Ramak 1 Lasmo 10-Feb-93 N.W.F.P. 14,617 23-A pr-93 Abandoned
345 Thora-N 1 OGDC 06-Mar-93 Sindh 7,678 08-May-93 Abandoned
346 Pirshah 1 OGDC 03-Apr-93 Sindh 6,332 16-Apr-93 Abandoned
347 Gotki 1 Can-Oxy 15-Apr-93 Sindh 5,250 03-May-93 Abandoned
348 Mubarik 1 OGDC 18-Apr-93 Sindh 11,221 10-Se p-93 Abandoned
349 Esakhel 1 OGDC 16-May-93 Punjab 15,355 31-Oct-93 Abandoned
350 Bukerani 1 OGDC 14-Jun-93 Punjab 8,048 26-Jul-93 Abandoned
351 Miano 1 OMV 16-Jun-93 Sindh 13,222 11-Nov-93 Gas
352 Jaffar 1 OGDC 30-Jun-93 Punjab 13,846 23-Apr-94 Abandoned
353 Bachal 1 UTP 15-Jul-93 Sindh 5,000 22-Jul-93 Oil/Gas
354 Dal 1 UTP 29-Jul-93 Sindh 5,899 09-Aug-93 Abandoned
355 Pirkoh-E 1 OGDC 07-Aug-93 Baloch. 7,087 16-Sep-93 Abandoned
356 Odejani 1 UTP 14-Aug-93 Sindh 3,258 18-Aug-93 Abandoned
357 Tangri 1 UTP 21-Aug-93 Sindh 7,956 30-Oct-93 Abandoned
358 S.Mazari.Deep 1 UTP 21-Sep-93 Sindh 7,510 08-Oct-93 Oil
359 Beghari 1 OGDC 02-Oct-93 Sindh 7,917 05-Feb-94 Abandoned
360 Odejani-A 1 UTP 01-Nov-93 Sindh 3,199 08-Nov-93 Abandoned
361 Jalal 1 UTP 23-Oct-93 Sindh 5,801 05-Nov-93 Gas
362 Rajian 1 OGDC 09-Nov-93 Punjab 12,140 16-Aug-94 Oil
363 Buzdar-South 1 UTP 12-Nov-93 Sindh 5,000 24-Nov-93 Gas/Cond.
364 Qubba 1 UTP 13-Nov-93 Sindh 5,699 25-Nov-93 Abandoned
365 Buland 1 UTP 27-Nov-93 Sindh 2,651 04-Dec-93 Gas
366 Zaur 1 UTP 24-Dec-93 Sindh 6,749 02-Jan-94 Oil/Gas
367 Chak-Meyun 1 OGDC 10-Jan-94 Punjab 11,024 16-Oct-94 Abandoned
368 Badar 1 Premier 20-Jan-94 Sindh 5,279 11-Feb-94 Gas
369 Fort-Abbas 1 OGDC 24-Jan-94 Punjab 5,417 10-Mar-95 Abandoned
370 Tando Alam Dee p 1 OGDC 24-Jan-94 Sindh 10,860 30-Jun-94 Abandoned
Note: Boldtype indicate discoveries. Contd./...
OIL & GAS EXPLORATORY WELLS (Contd.)

Sr. Well KBE TD Completion Completion
No. Well Name # Operator Spud Date Province (Ft.) (Ft.) Zone/Formation Date Status
371 Savi-Ragha 1 B.G. 28-Jan-94 Baloch. 9,768 15-Jun-94 Gas/Cond.
372 Khoso 1 UTP 06-Feb-94 Sindh 9,899 14-Mar-94 Abandoned
373 Dabbar 1 Albion 20-Mar-94 Baloch. 4,505 28-Apr-94 Abandoned
374 Bukhari-E 1 UTP 27-Mar-94 Sindh 7,349 12-Apr-94 Abandoned
375 Liari Deep 1 UTP 21-Apr-94 Sindh 11,470 08-Jun-94 Gas
376 Lako 1 OGDC 28-Apr-94 Sindh 7,029 07-Jul-94 Abandoned
377 Sara 1 Tullow 27-May-94 Sindh 10,450 08-Aug-94 Gas
378 Sabzal 1 OGDC 10-Jun-94 Sindh 11,913 15-Sep-96 Abandoned
379 Sohro 1 OGDC 27-Jun-94 Sindh 6,454 04-Aug-94 Abandoned
380 Chak-5 Dim 1 OGDC 27-Jun-94 Sindh 11,812 11-Oct-94 Condensate
381 Tando G. Ali (North) 1 UTP 24-Nov-94 Sindh 3,501 29-Nov-94 Abandoned
382 Kundi 1 PPL 05-Dec-94 N.W.F.P. 20,998 18-Dec-95 Abandoned
383 Buland 2 UTP 07-Dec-94 Sindh 2,727 13-Dec-94 Abandoned
384 Makhdumpur Deep 1 UTP 07-Dec-94 Sindh 11,716 28-Jan-95 Gas
385 Tangri 2 UTP 16-Dec-94 Sindh 7,901 14-Jan-95 Oil
386 Jhol North 1 UTP 20-Dec-94 Sindh 4,301 02-Jan-95 Suspended
387 Jakheji 1 UTP 08-Jan-95 Sindh 3,799 16-Jan-95 Abandoned
388 Bari South 1 UTP 20-Jan-95 Sindh 2,999 31-Jan-95 Abandoned
389 Chachar 1 Tullow 28-Jan-95 Sindh 5,912 28-Mar-95 Gas
390 Kal 1 OGDC 12-Feb-95 Punjab 9,154 16-May-95 Oil
391 Tarai Deep 2 UTP 12-Feb-95 Sindh 10,306 17-Apr-95 Abandoned
392 Badar South 1 Premier 14-Mar-95 Sindh 5,250 01-Apr-95 Suspended
393 Khipro 1 OMV 26-Mar-95 Sindh 13,741 31-Aug-95 Gas
394 Kalu 1 Tullow 13-Apr-95 Sindh 4,823 12-May-95 Abandoned
395 Khorewah Deep 1 UTP 29-Apr-95 Sindh 9,449 28-Jun-95 Gas
396 Kadiqazi 1 UTP 22-May-95 Sindh 3,045 29-May-95 Abandoned
397 Charo 1 Tullow 23-May-95 Sindh 4,397 19-Jun-95 Gas
398 Pir Bari 1 OGDC 20-Jun-95 Sindh 5,594 23-Jul-95 Abandoned
399 Paniari 1 OGDC 26-Jun-95 Sindh 10,926 25-Sep-95 Abandoned
400 Amirpur 1 OGDC 28-Jun-95 Punjab 9,932 04-Jan-96 Oil
401 Shahab 1 OGDC 30-Jun-95 Punjab 5,473 19-Oct-95 Abandoned
402 Zaur Deep 1 UTP 05-Jul-95 Sindh 10,499 08-Aug-95 Gas
403 Jakhri 1 UTP 07-Jul-95 Sindh 6,017 27-Jul-95 Abandoned
404 Buland 3 UTP 19-Aug-95 Sindh 2,700 31-Aug-95 Abandoned
405 Buzdar South Deep 1 UTP 01-Sep-95 Sindh 11,251 25-Oct-95 Gas
406 Gulan 1 B.G. 14-Nov-95 Baloch. 12,327 17-Apr-96 Abandoned
407 Shahab-A 1 OGDC 15-Nov-95 Punjab 13,843 22-Aug-96 Testing
408 Chak-5 Dim South 1 OGDC 30-Nov-95 Sindh 9,541 22-Feb-96 Condensate
409 Palli 1 OGDC 22-Dec-95 Sindh 6,515 01-Jun-96 Oil
410 Chatha 1 OGDC 24-Jan-96 Punjab 13,124 19-Aug-96 Abandoned
411 Domani 1 OGDC 05-Feb-96 Sindh 3,652 06-Mar-96 Abandoned
412 Nari Deep 1 UTP 20-Feb-96 Sindh 10,174 04-Apr-96 Abandoned
413 Dauki 1 UTP 21-Feb-96 Sindh 3,593 03-Mar-96 Abandoned
414 Kachelo-X 1 PPL 23-Feb-96 Sindh 1,095 11-May-96 Abandoned
415 Bhit 1 Lasmo 11-Mar-96 Sindh 6,034 09-Jun-96 Abandoned
416 Indus 1 Premier 06-Apr-96 Sindh 3,629 11-Jun-96 Abandoned
417 Satiari 1 OGDC 13-Apr-96 Sindh 5,761 13-May-96 Abandoned
418 Doti 1 UTP 18-Apr-96 Sindh 6,004 04-May-96 Abandoned
419 Jagir 1 UTP 31-May-96 Sindh 7,556 22-Jun-96 Oil
420 Jandran-X 1 OGDC 31-May-96 Baloch. 3,829 Parh Lst. 23-Aug-96 Abandoned
421 Sakhi 1 UTP 28-Jun-96 Sindh 8,701 07-Aug-96 Oil/Gas
422 Bijnot 1 OGDC 28-Jun-96 Punjab 6,280 28-Aug-96 Abandoned
423 Sara West 1 Tullow 19-Jul-96 Sindh 9,991 14-Sep-96 Suspended
424 Indus-B 1 Premier 08-Aug-96 Sindh 4,597 08-Aug-96 Abandoned
425 Minwal-X 1 POL 09-Sep-96 Punjab 7,149 10-Dec-96 Oil
426 Kallar-X 1 PPL 10-Oct-96 Punjab 21,053 Kuldana 03-Nov-97 Abandoned
427 Kalachitta 1 OGDC 21-Nov-96 Punjab 12,959 Lockhart 18-Dec-97 Abandoned
428 Raj 1 UTP 10-Dec-96 Sindh 12,060 Upper Goru 27-Dec-96 Gas
429 Mithro 1 UTP 14-Dec-96 Sindh 7,999 17-Jan-97 Abandoned
430 Bhit 2 Lasmo 20-Dec-96 Sindh 6,782 01-Apr-97 Gas
431 Mari Deep 1 MGCL 01-Jan-97 Sindh 13,505 Chiltan 11-Jul-97 Gas
432 Dabbar 2 CONOCO 02-Jan-97 Baloch. 4,905 11-Feb-97 Abandoned
433 Khuda Dad 1 POL 04-Jan-97 Punjab 16,978 Murree 28-Nov-97 Abandoned
434 Nurpur A SHELL 24-Feb-97 Punjab 6,644 15-Jun-97 Abandoned
435 Dhok Kamal Shah 1 OGDC 03-Mar-97 Punjab 5,942 Murree 14-Jun-97 Suspended
436 Miriwah 1 BG 04-Mar-97 Baloch. 6,578 23-May-97 Abandoned
437 Keyhole 1 UTP 07-Mar-97 Sindh 9,751 27-Apr-97 Abandoned
438 Muban 1 UTP 08-Mar-97 Sindh 2,553 16-Mar-97 Oil
439 Kandero 1 UTP 12-Apr-97 Sindh 8,498 01-May-97 Abandoned
440 Harno 1 OGDC 17-May-97 Punjab 10,502 Murree 10-Feb-98 Abandoned
441 Marvi 1 UTP 22-May-97 Sindh 16,998 Salt Range 05-May-98 Abandoned
442 Jandran-X 2 OGDC 04-Jun-97 Baloch. 3,609 Parh Lst. 11-Aug-97 Gas
443 Meting 1 Tullow 16-Jun-97 Sindh 14,075 Chiltan 26-Dec-97 Abandoned
444 Sumot Ghar 1 OGDC 20-Jun-97 Baloch. 5,577 Mughalkot 14-Sep-97 Abandoned
445 Diaal 1 OPPI 26-Jun-97 Punjab 12,244 Salt Range 24-Dec-97 Abandoned
Note: Boldtype indicate discoveries. Contd./...
OIL & GAS EXPLORATORY WELLS (Contd.)

Sr. Well KBE TD Completion Completion
No. Well Name # Operator Spud Date Province (Ft.) (Ft.) Zone/Formation Date Status
446 Khararo 1 OMV 11-Jul-97 Sindh 10,171 05-Oct-97 Abandoned
447 Hathungo 1 Premier 24-Jul-97 Sindh 1,509 07-Aug-97 Abandoned
448 Turkwal 1 POL 12-Aug-97 Punjab 5,288 26-Dec-97 Oil
449 Tarai Deep 3 UTP 05-Sep-97 Sindh 10,748 11-Nov-97 Abandoned
450 Duljan 1 BG 08-Sep-97 Sindh 11,877 01-Jan-98 Abandoned
451 Suri 1 Tullow 21-Sep-97 Sindh 4,068 11-Nov-97 Gas
452 Sawan 1 OMV 17-Oct-97 Sindh 11,768 04-Feb-98 Gas
453 Mari Deep 2 MGCL 29-Oct-97 Sindh 12,798 17-Feb-98 Gas
454 Tando Allahyar 1 OGDCL 16-Nov-97 Sindh 5,741 20-Jan-98 Oil/Gas
455 Keyhole G 1 UTP 24-Nov-97 Sindh 6,699 25-Dec-97 Oil
456 Damiri 1 Hunt 30-Nov-97 Sindh 10,815 16-May-98 Abandoned
457 Choti 1 OGDCL 06-Dec-97 Punjab 14,619 Sui Main Lst. 02-Jun-98 Abandoned
458 Mehro 1 UTP 20-Dec-97 Sindh 5,197 06-Jan-98 Abandoned
459 Tarai South 1 UTP 29-Dec-97 Sindh 3,599 28-Jan-98 Abandoned
460 Sakhi Deep 1 UTP 05-Jan-98 Sindh 9,856 19-May-98 Gas/Oil
461 Nareri 1 UTP 08-Jan-98 Sindh 5,298 23-Jan-98 Abandoned
462 Jakhro 1 OGDCL 09-Jan-98 Sindh 9,852 16-Apr-98 Gas/Cond.
463 Zamzama 1 BHP 15-Jan-98 Sindh 1,292 01-Jun-98 Gas
464 Jandran X 3 OGDCL 27-Jan-98 Baloch. 5,102 15-Jun-98 Suspended
465 Daud X 1 PPL 28-Jan-98 Sindh 10,778 01-Apr-98 Abandoned
466 Mataro 2 UTP 29-Jan-98 Sindh 4,199 07-Feb-98 Abandoned
467 Hamza X 1 PPL 05-Feb-98 Sindh 4,417 05-Apr-98 Gas
468 Meyn Ismail Deep 1 UTP 27-Feb-98 Sindh 10,781 29-Jun-98 Gas
469 Nizmani 2 UTP 03-Mar-98 Sindh 6,050 16-Mar-98 Abandoned
470 Kharnhak 1 Hycarbex 16-Mar-98 Sindh 8,252 24-May-98 Abandoned
471 Sakhi South East 1 UTP 18-Mar-98 Sindh 6,500 01-Apr-98 Abandoned
472 Dhabi North 1 UTP 03-Apr-98 Sindh 6,395 23-Apr-98 Oil
473 Daiwal 1 OGDCL 06-Apr-98 Punjab 16,240 Khewra Sst. 26-Mar-99 Abandoned
474 Misan 1 OGDCL 01-May-98 Sindh 6,922 29-Jun-98 Oil
475 Turkwal Deep 1 POL 23-May-98 Punjab 14,508 Suspended
476 Sher 2 Hunt 30-May-98 Sindh 6,750 Abandoned
477 Zarghum South 1 Premier 04-Jun-98 Baloch. 7,126 Chiltan 13-Sep-98 Gas
478 Dhok Kemal Shah 1A OGDCL 16-Jun-98 Punjab 13,189 Margalla Hill 23-Apr-99 Suspended
479 Ranpethani 1 OGDCL 30-Jun-98 Sindh 3,822 Parh Fm. 24-Jul-98 Abandoned
480 Sui Deep 1 PPL 01-Jul-98 Baloch. 15,463 Chiltan 07-Mar-99 Gas
481 Khudadad Re-entry 1 POL 10-Aug-98 Punjab 17,608 24-Jun-99 Abandoned
482 Badhra 2 Lasmo 18-Sep-98 Sindh 11,467 Lower Goru 26-Feb-99 Gas
483 Musa Goth 1 OGDCL 13-Nov-98 Sindh 4,108 Lower Goru 07-Dec-98 Abandoned
484 Chanda 1 OGDCL 03-Dec-98 N.W.F.P. 15,709 Oil & Gas
485 Gajwaro 1 OMV 08-Jan-99 Sindh 11,804 Lower Goru 28-Feb-99 Abandoned
486 David 1 Hycarbex 07-Feb-99 Sindh 3,622 21-Feb-99 Abandoned
487 Hassan X-1 PPL 20-Feb-99 Sindh 3,714 Sui Upper Lst. 24-Mar-99 Gas
488 David 1A Hycarbex 05-Apr-99 Sindh 3,579 28-Apr-99 Abandoned
489 Mir 1 OGDCL 21-Apr-99 Sindh 5,741 Lower Goru 08-Jun-99 Abandoned
490 Chak 255 1 OGDCL 01-May-99 Punjab 9,843 Abandoned
491 Burzi 1 OGDCL 30-Jun-99 Baloch. 9,029 Goru 03-Jul-00 Abandoned
492 Basira 1 BG 30-Jun-99 Sindh 11,204 Lower Goru 11-Au g-99 Abandoned
493 Charrat North 1 OGDCL 30-Jul-99 Punjab 1,512 12,974 Samana Suk 06-May-00 Abandoned
494 Sadkal C Deep 1 OGDCL 30-Jul-99 Punjab Abandoned
495 Turkwal Deep X-2 POL 11-Aug-99 Sindh 56 N/A
496 Miranabad 1 OGDCL 17-Sep-99 Sindh 72 6,732 Lower Goru 29-Oct-99 Abandoned
497 Pasni 1 OCEAN 11-Oct-99 Offshore 94 11,710 05-Jan-00 Abandoned
498 Jiwanwala 1 OGDCL 14-Oct-99 Punjab 431 6,909 Shinwari 17-Nov-99 Abandoned
499 Garhi 1 OGDCL 05-Nov-99 Punjab Abandoned
500 Chandesri 1 OGDCL 27-Dec-99 Punjab Abandoned
501 Jhaberi 1 UTP 13-Jan-00 Sindh 60 4,700 21-Jan-00 Gas
502 Chanda Deep 1 OGDCL 27-Jan-00 N.W.F.P. Abandoned
503 Gwadar 1 OCEAN 31-Jan-00 Offshore 90 12,500 23-Mar-00 Abandoned
504 Sadiq X-1 PPL 16-Feb-00 Sindh 240 3,839 Sui Main Lst. 17-Nov-99 Gas
505 Junathi South 1 UTP 17-Mar-00 Sindh 57 5,820 25-Mar-00 Oil/Gas
506 Andhar 1 Lasmo 20-May-00 Baloch. Abandoned
507 Dureji 1 Premier 25-Jun-00 Baloch. 8,025 13-Aug-00 Abandoned
508 Yusuf X-1 PPL 27-Jun-00 Sindh 213 Abandoned
509 Suji 1 OMV 16-Jul-00 Punjab 394 8,615 Basement 29-Sep-00 Pluged & Abd.
510 Khokhar South 1 OGDCL 18-Jul-00 Sindh 69 6,890 Lower Goru 26-Aug-00 Pluged & Abd.
511 Khan 1 Tullow 16-Sep-00 Sindh 285 4,491 U. Goru 29-Sep-00 Abandoned
512 Southern Sindh X-1 POL 05-Oct-00 Sindh 16 10,276 Chiltan 20-Nov-00 Abandoned
513 Khairgarh 1 Tullow 12-Oct-00 Sindh 256 4,593 U. Goru 25-Nov-00 Pluged & Abd.
514 Dabhi Deep 1 UTP 17-Oct-00 Sindh 72 8,632 Lower Goru 22-Nov-00 Pluged & Abd.
515 Bhit MughalKot 1 Lasmo 18-Oct-00 Sindh 9,744 Pluged & Abd.
516 Gupchani 1 Tullow 16-Nov-00 Sindh 108 10,863 Lower Goru 27-Dec-00 Pluged & Abd.
517 Sabzal 1 POGC 16-Nov-00 Punjab 256 11,581 Sembar 26-Jan-01 Pluged & Abd.
518 Jacobabad 3 Hycarbex 27-Nov-00 Sindh 5,551 Pluged & Abd.
519 East Diwana 1 Lasmo 13-Jan-01 Baloch. 10,709 Pluged & Abd.
520 Rajo 2 UTP 16-Jan-01 Sindh 30 5,000 Lower Goru EPT*
Note: Boldtype indicate discoveries. Contd./...
OIL & GAS EXPLORATORY WELLS (Contd.)

Sr. Well KBE TD Completion Completion
No. Well Name # Operator Spud Date Province (Ft.) (Ft.) Zone/Formation Date Status
521 Lalian 1 Tullow 31-Jan-01 Sindh 318 3,215 Fort Munro 11-Feb-01 Pluged & Abd.
522 Uch Deep 1 OGDCL 19-Feb-01 Baloch. 335 5,755 Blowout
523 Rehmat 1 Petronas 25-May-01 Sindh 184 11,601 Gas
524 Uch Deep 1A OGDCL 26-May-01 Baloch. 4,308 Drilling
525 Goth Bachal 1 OGDCL 30-Jun-01 Sindh 95 11,483 Abandoned
526 Kausar 1 OPI 01-Aug-03 Sindh 102 13,219 Gas
527 Tuba 1 OPI 21-Aug-01 Sindh 104 8,947 Lower Goru 19-Sep-01 Pluged & Abd.
528 Khushbakht 1 Petronas 02-Sep-01 Sindh 165 9,613 Lower Goru 11-Dec-01 Pluged & Abd.
529 Zarghun North 1 Premier 23-Nov-01 Baloch. 11,913 Pluged & Abd.
530 Chak 63 1 OGDCL 22-Dec-01 Sindh 9,843 Oil/Gas
531 Chak 66 NE-1 OGDCL 07-Feb-02 Sindh 9,839 Gas/Cond.
532 Manzalai 1 MOL 06-Feb-02 N.W.F.P. 15,010 Gas/Cond.
533 Abri 1 OGDCL 07-Mar-02 Sindh 8,806 Pluged & Abd.
534 Ganmbat 1 OMV 21-Mar-02 Sindh 11,142 Lower Goru 03-Mar-02 Pluged & Abd.
535 Feteh 1 OGDCL 25-Apr-02 Sindh 9,843 Pluged & Abd.
536 Chak 2 1 OGDCL 10-Jun-02 Sindh 10,006 Gas/Cond.
537 Jhaberi South 1 BP 15-Jun-02 Sindh 58 6,099 Oil
538 Resham 1 OGDCL 18-Jun-02 Sindh 107 10,006 04-Aug-02 Gas/Cond.
539 Garhi X-1 OGDCL 12-Jun-02 Punjab 13,307 Active
540 Benir 2 Premier 30-Jun-02 Sindh 1,181 Pluged & Abd.
541 Boski 1 OGDCL 11-Jul-02 Punjab 14,429 Pluged & Abd.
542 Barkat 1 OPI 02-Aug-02 Sindh 8,999 Lower Goru 14-Sep-02 Pluged & Abd.
543 Khanpur X-1 PPL 01-Sep-02 Sindh 4,035 Oct-02 Gas
544 Norai Jagir 1 OGDCL 02-Sep-02 Sindh 7,300 Lower Goru 11-Oct-02 Gas/Cond.
545 Kamal 1 OPI 04-Sep-02 Sindh 9,639 Lower Goru 03-Jan-03 Suspended
546 Marjan 1 OPI 15-Sep-02 Sindh 8,651 Lower Goru 17-Nov-02 Suspended
547 Chak-3 1 OGDCL 18-Sep-02 Sindh 10,006 Lower Goru 26-Oct-02 Pluged & Abd.
548 Hallel 1 Lasmo 25-Sep-02 Sindh 10,978 Pluged & Abd.
549 Hakeem Daho 1 OGDCL 27-Sep-02 Sindh 10,531 Lower Goru 16-Nov-02 Oil/Gas
550 Noorie 1 OPI 29-Sep-02 Sindh 10,476 Lower Goru 18-Dec-02 Pluged & Abd.
551 Chak-43 1 OGDCL 08-Oct-02 Sindh 10,072 Lower Goru 20-Nov-02 Pluged & Abd.
552 Dosa X-1 POL 07-Oct-02 Punjab 15,466 Pluged & Abd.
553 Bahadur 1 OGDCL 12-Oct-02 Sindh 6,184 Lower Goru 15-Nov-02 Pluged & Abd.
554 Naimat Basal 1 OPI 13-Nov-02 Sindh 11,840 Lower Goru 20-Feb-03 Gas/Cond.
555 Bhullan Shah 1 OGDCL 14-Nov-02 Sindh 7,877 Lower Goru 23-Dec-02 Gas/Cond.
556 Chak-7A 1 OGDCL 23-Nov-02 Sindh 10,006 Jan-03 Gas/Cond.
557 Kashmiri Goth 1 OGDCL 16-Dec-02 Sindh 10,256 05-Mar-03 Pluged & Abd.
558 Khabar 1 OGDCL 12-Jan-03 Sindh 11,253 Pluged & Abd.
559 Zirkani 1 PKP 18-Jan-03 Sindh 9,235 Pluged & Susp.
560 Mehar 1 Petronas 01-Dec-03 Sindh 12,556 Gas/Cond.
561 Began 1 OGDCL 02-Feb-03 Sindh 5,118 Pluged & Abd.
562 Siraj 1 OPI 05-Mar-03 Sindh 10,649 Lower Goru 13-May-03 Pluged & Abd.
563 Gadap 1 BP 27-Apr-03 Sindh 7,611 Lower Goru 09-May-03 Pluged & Abd.
564 Rehan 1 Petronas 15-May-03 Sindh 11,401 Suspended
565 Shah Dino 1 BP 01-Aug-03 Sindh 6,952 Oil
566 Naimat North 1 OPI 25-May-03 Sindh 12,001 Suspended
567 Siraj South 1 OPI 01-Aug-03 Sindh 10,558 Gas/Cond.
568 Lakarai 1 OGDCL 02-Jun-03 Sindh 8,366 Pluged & Abd.
569 Shadani 1 OGDCL 07-Jun-03 Punjab 11,814 Pluged & Abd.
570 Raj East 1 BP 17-Jun-03 Sindh 7,010 Pluged & Abd.
571 Dars 1 OGDCL 01-Aug-03 Sindh 7,119 Gas/Cond.
572 Basharat 1 Petronas 29-Jun-03 Sindh 14,436 Pluged & Abd.
573 Mehran 1 BP 10-Jul-03 Sindh 11,204 16-Oct-03 Pluged & Abd.
574 Khasarwari 1 OMV 19-Jul-03 Sindh 11,647 01-Sep-03 Pluged & Abd.
575 Dangi 1 OGDCL 05-Aug-03 Sindh 13,625 22-Nov-03 Pluged & Abd.
576 Inaam Basal 1 OPI 22-Aug-03 Sindh 10,154 14-Oct-03 Suspended
577 Rehman 1 OPI 29-Aug-03 Sindh 12,522 06-Nov-03 Pluged & Abd.
578 Shahpur 1 OPI 24-Sep-03 Sindh 11,653 02-Feb-04 Pluged & Abd.
579 Zaur South 1 BP 21-Oct-03 Sindh 6,850 30-Oct-03 Oil
580 Usman 1 OPI 29-Oct-03 Sindh 12,899 20-Jan-04 Gas
581 Jhal Magsi South 1 OGDCL 19-Nov-03 Baloch. 238 14,075 Dunghan Dec-04 Gas
582 Umar 1 OPI 18-Dec-03 Sindh 10,039 16-Feb-04 Oil
583 Kandra 3 PEL 21-Dec-03 Sindh 2,175 Suspended
584 Lala Jamali 1 OGDCL 26-Dec-03 Sindh 11,155 24-Feb-04 Gas/Cond.
585 Talib 1 BP 17-Feb-04 Sindh 7,899 29-Feb-04 Pluged & Abd.
586 Ramadan 1 PAIGE 20-Feb-04 Baloch. 14,856 Suspended
587 Tuba Deep 1 OPI 28-Feb-04 Sindh 11,995 19-Apr-04 Pluged & Abd.
588 Fateh Shah 1 BP 04-Mar-04 Sindh 8,817 19-Mar-04 Gas
589 Inayat 1 BP 13-Mar-04 Sindh 8,202 02-Apr-04 Pluged & Abd.
590 Makori 1 MOL 16-Mar-04 NWFP 2,117 14,131 Tredian Jan-05 Oil/Gas Cond.
591 Aulia 1 OGDCL 27-Mar-04 Sindh 12,228 Suspended
592 Ali Zaur 1 BP 03-Apr-04 Sindh 6,867 15-Apr-04 Oil
593 Sidiq 1 OPI 12-Apr-04 Sindh 10,545 06-Jul-04 Suspended
594 Bhan 1 ENI 15-Apr-04 Sindh 10,177 19-May-04 Pluged & Abd.
595 Dars West 1 OGDCL 23-Apr-04 Sindh 72 6,893 Lower Goru Jul-04 Gas/Cond.
Note: Boldtype indicate discoveries. Contd./...
OIL & GAS EXPLORATORY WELLS (Contd.)

Sr. Well KBE TD Completion Completion
No. Well Name # Operator Spud Date Province (Ft.) (Ft.) Zone/Formation Date Status
596 Chung 1 PKP 03-May-04 Sindh 6,644 Pluged & Abd.
597 PakG2 1 TOTAL 12-May-04 Offshore 15,584 Pluged & Abd.
598 Ali 1 OPI 19-May-04 Sindh 107 11,001 Lower Goru Jul-04 Gas/Cond.
599 Pasakhi Deep 1 OGDCL 27-May-04 Sindh 96 13,648 Chiltan Feb-05 Gas/Cond.
600 Dhubi 1 OGDCL 17-Jun-04 Sindh 10,335 Plugged & Abd.
601 Drabo Kas 1 OGDCL 27-Jun-04 Sindh 14,436 Plugged & Abd.
602 Fateh Shah North 1 BP 07-Aug-04 Sindh 45 8,770 Lower Goru Oct-04 Gas
603 Fatima 1 OPI 12-Aug-04 Sindh 106 7,185 Lower Goru Plugged & Abd.
604 Jumman Shah 1 OGDCL 04-Sep-04 Sindh 12,467 Plugged & Abd.
605 Bilal North 1 OPI 19-Oct-04 Sindh 110 10,361 Lower Goru Gas/Cond.
606 Malukani 1 OGDCL 17-Dec-04 Sindh 108 10,827 Plugged & Abd.
607 Mehar North 1 Petronas 27-Dec-04 Sindh 13,025 Plugged & Abd.
608 Saba 1 OGDCL 29-Dec-04 Punjab 13,484 Plugged & Abd.
609 Dewan 1 Rally Energy 02-Jan-05 Punjab 9,049 Mar-05 Gas/Cond.
610 Mari SML 1 MGCL 16-Feb-05 Sindh 230 4,160 Sui Main L.st. Apr-05 Gas
611 Pasni X-2 PPL 18-Feb-05 Offshore 89 13,123 Plugged & Abd.
612 Chak 63 South East 1 OGDCL 19-Mar-05 Sindh 10,499 May-05 Gas/Cond.
613 Haseeb 1 Hycarbex 25-Mar-05 Sindh 4,944 May-05 Gas
614 Ali Sahib 1 OGDCL 30-Mar-05 Punjab 465 6,726 Plugged & Abd.
615 Mela 1 OGDCL 11-Apr-05 NWFP 11,119 Sep-06 Oil/Gas
616 Bilal 1 OPI 18-Apr-05 Sindh 10,344 Jun-05 Gas/Cond.
617 Duljan Re-entry 1 OMV 06-May-05 Sindh 12,943 Suspended
618 Tando A.Y North 1 OGDCL 11-Jun-05 Sindh 5,643 Oil/Gas
619 Sachal 1 OPI 21-Jun-05 Sindh 10,607 Plugged & Abd.
620 Amir Wali 1 OGDCL 28-Jun-05 Punjab 6,726 Plugged & Abd.
621 Nara 1 OMV 17-Jul-05 Sindh 12060 Lower Goru 20-Sep-05 Pluged & Abd.
622 Kunar Deep 1 OGDCL 20-Jul-05 Sindh 10974 Sembar 17-Nov-05 Gas/Cond.
623 Maliri 1 Premier 11-Aug-05 Sindh 2989 Pab Formation 06-Sep-05 Pluged & Abd.
624 Jhal Magsi North 1 OGDCL 01-Sep-05 Baloch. 13747 Dunghan 26-Jan-06 Pluged & Abd.
625 Lashari Deep 1 OGDCL 21-Sep-05 Sindh 10833 Sembar 22-Dec-05 Pluged & Abd.
626 Nim 1 OGDCL 23-Sep-05 Sindh 10860 Gas/Cond.
627 Ziarat 1 MGCL 28-Sep-05 Baloch. 3445 Chiltan 28-Dec-05 Gas
628 Bhagan Wali 1 OGDCL 31-Oct-05 Punjab 15,748 Plugged & Abd.
629 Dars Deep 1 OGDCL 07-Nov-05 Sindh 11,115 Sembar 30-Jan-06 Gas/Cond.
630 Jander 1 OGDCL 20-Nov-05 Punjab 6,742 Kingriali 27-Dec-05 Pluged & Abd.
631 Ballo Uthwal 1 OGDCL 05-Dec-05 Punjab 12,274 Testing
632 Sono South 1 OGDCL 30-Dec-05 Sindh 8,038 Lower Goru 19-Feb-06 Pluged & Abd.
633 Bukhari Deep 1 BP 09-Jan-06 Sindh 8,560 Lower Goru 05-Feb-06 Gas
634 Kunner West 1 OGDCL 01-Feb-06 Sindh 12,090 Plugged & Abd.
635 Bahu 1 OGDCL 06-Feb-06 Punjab 9,633 Gas
636 Shahpur Chakar 1 Tullow 21-Feb-06 Sindh 11,109 Pluged & Abd.
637 Pasakhi North East 1 OGDCL 05-Mar-06 Sindh 12,411 Oil
638 Barhun 1 OGDCL 28-Mar-06 Sindh 11,811 Plu gged & Abd.
639 Al-Ali 1 Hycarbex 25-Apr-06 Sindh 3,763 Temp. Suspen'd
640 Sumari Deep X 1 MOL 07-May-06 NWFP 7,621 Plugged & Abd.
641 Dakhni Deep 1 OGDCL 12-May-06 Punjab 13,356 Gas/Cond.
642 Qadirpur Deep 1 OGDCL 13-May-06 Sindh 13,337 Drilling
643 Siraj North 1 OPII 31-May-06 Sindh 10,427 Suspended
644 Sakhi South Deep 1 BP 29-May-06 Sindh 9,360 Gas
645 Norai Jagir East 1 OGDCL 07-Jun-06 Sindh 11,319 Drilling
646 Unar 1 OGDCL 22-Jun-06 Sindh 13,451 Gas/Cond.
647 Sari Deep 1 OGDCL 19-Jun-06 Sindh 4,275 Drilling
648 Chak12 1 OGDCL 25-Jun-06 Punjab 6,988 Plugged & Abd.
649 Nim West 1 OGDCL 28-Jun-06 Sindh 11,516 Gas
650 Bagh X 1 OGDCL 28-Jun-06 Punjab 4,587 Plugged & Abd.
651 Sarang X 1 PPL 29-Jun-06 Punjab 12,713 Drilling
652 Khario 1 OGDCL 30-Jun-06 Sindh 11,257 Drilling
653 Chak 66 NE 1 OGDCL 30-Jun-06 Sindh 11,270 Drilling
654 Ahmad 1 OPII 26-Jul-06 Sindh 13,127 Lower Goru 20-Sep-06 Gas
655 Chak 14 1 OGDCL 15-Aug-06 Sindh 11,565 Lower Goru 25-Dec-06 Plugged & Abd.
656 Kahi Deep X 1 MOL 15-Aug-06 NWFP 6,890 Plugged & suspd
657 Hashim 1 POL 27-Sep-06 Sindh 11,824 Plugged & Abd.
658 Saqib 1 Petronas 21-Oct-06 Sindh 5,705 Plugged & suspd
659 Michko 1 OMV 28-Oct-06 Sindh 11,220 Lower Goru 21-Jan-06 Plugged & Abd.
660 Mami Khel 1 MOL 28-Oct-06 NWFP 13,451 Gas/Cond.Mar-08661 Kamal North 1 OPII 06-Nov-06 Sindh 9,888 Lower Goru 10-Dec-06 Gas/Cond.
662 Thora Deep 1 OGDCL 21-Nov-06 Sindh 12,815 Sembar 27-Apr-07 Gas/Cond.
663 Kunar West 1A 1 OGDCL 02-Dec-06 Sindh 13,337 Chiltan 05-Apr-07 Gas/Cond.
664 Zaur West 1 BP 11-Dec-06 Sindh 7,303 Lower Goru 26-Dec-06 Gas/Cond.
665 Chandio 1 OGDCL 13-Dec-06 Sindh 12,008 19-Mar-07 Gas/Cond.
666 Dhachrapur 1 OGDCL 14-Dec-06 Sindh 11,516 Sembar 28-Mar-07 Gas
667 Jadu 1 OGDCL 30-Dec-06 Sindh 9,843 Plugged & Abd.
Note: Boldtype indicate discoveries. Contd./...
OIL & GAS EXPLORATORY WELLS (Contd.)
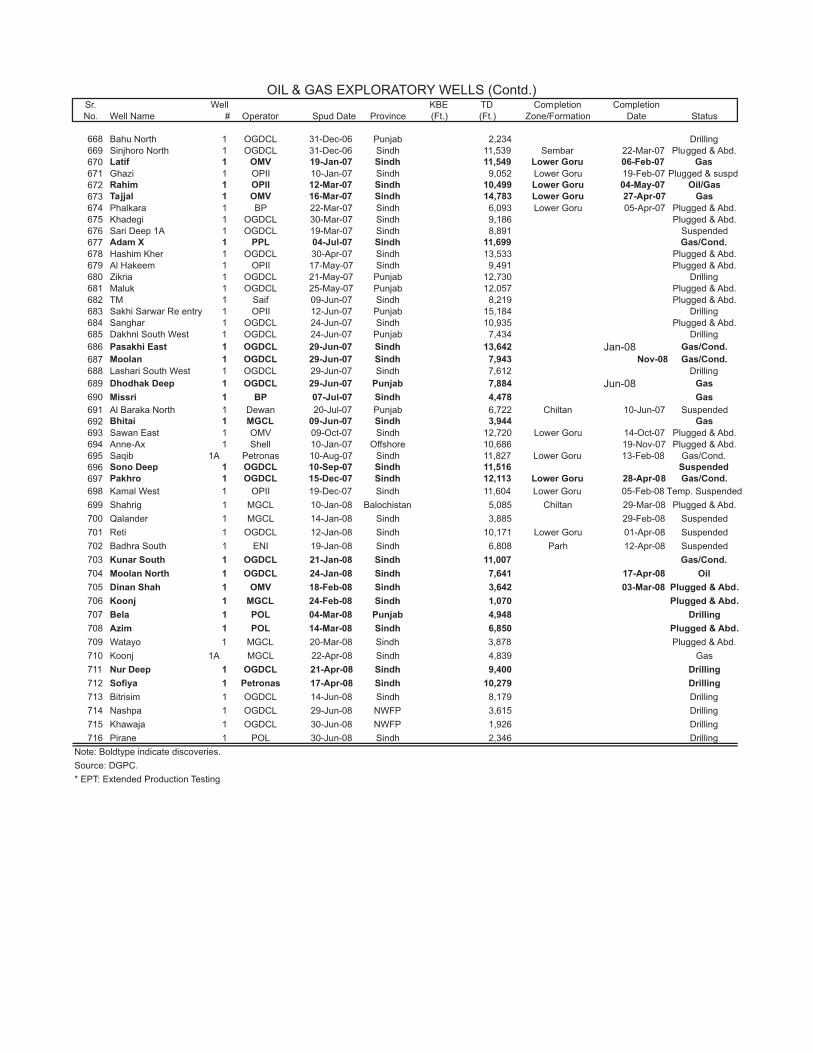
Sr. Well KBE TD Completion Completion
No. Well Name # Operator Spud Date Province (Ft.) (Ft.) Zone/Formation Date Status
668 Bahu North 1 OGDCL 31-Dec-06 Punjab 2,234 Drilling
669 Sinjhoro North 1 OGDCL 31-Dec-06 Sindh 11,539 Sembar 22-Mar-07 Plugged & Abd.
670 Latif 1 OMV 19-Jan-07 Sindh 11,549 Lower Goru 06-Feb-07 Gas
671 Ghazi 1 OPII 10-Jan-07 Sindh 9,052 Lower Goru 19-Feb-07 Plugged & suspd
672 Rahim 1 OPII 12-Mar-07 Sindh 10,499 Lower Goru 04-May-07 Oil/Gas
673 Tajjal 1 OMV 16-Mar-07 Sindh 14,783 Lower Goru 27-Apr-07 Gas
674 Phalkara 1 BP 22-Mar-07 Sindh 6,093 Lower Goru 05-Apr-07 Plugged & Abd.
675 Khadegi 1 OGDCL 30-Mar-07 Sindh 9,186 Plugged & Abd.
676 Sari Deep 1A 1 OGDCL 19-Mar-07 Sindh 8,891 Suspended
677 Adam X 1 PPL 04-Jul-07 Sindh 11,699 Gas/Cond.
678 Hashim Kher 1 OGDCL 30-Apr-07 Sindh 13,533 Plugged & Abd.
679 Al Hakeem 1 OPII 17-May-07 Sindh 9,491 Plugged & Abd.
680 Zikria 1 OGDCL 21-May-07 Punjab 12,730 Drilling
681 Maluk 1 OGDCL 25-May-07 Punjab 12,057 Plugged & Abd.
682 TM 1 Saif 09-Jun-07 Sindh 8,219 Plugged & Abd.
683 Sakhi Sarwar Re entry 1 OPII 12-Jun-07 Punjab 15,184 Drilling
684 Sanghar 1 OGDCL 24-Jun-07 Sindh 10,935 Plugged & Abd.
685 Dakhni South West 1 OGDCL 24-Jun-07 Punjab 7,434 Drilling
686 Pasakhi East 1 OGDCL 29-Jun-07 Sindh 13,642 Gas/Cond.Jan-08687 Moolan 1 OGDCL 29-Jun-07 Sindh 7,943 Nov-08 Gas/Cond.
688 Lashari South West 1 OGDCL 29-Jun-07 Sindh 7,612 Drilling
689 Dhodhak Deep 1 OGDCL 29-Jun-07 Punjab 7,884 GasJun-08
690 Missri 1 BP 07-Jul-07 Sindh 4,478 Gas
691 Al Baraka North 1 Dewan 20-Jul-07 Punjab 6,722 Chiltan 10-Jun-07 Suspended
692 Bhitai 1 MGCL 09-Jun-07 Sindh 3,944 Gas
693 Sawan East 1 OMV 09-Oct-07 Sindh 12,720 Lower Goru 14-Oct-07 Plugged & Abd.
694 Anne-Ax 1 Shell 10-Jan-07 Offshore 10,686 19-Nov-07 Plugged & Abd.
695 Saqib 1A Petronas 10-Aug-07 Sindh 11,827 Lower Goru 13-Feb-08 Gas/Cond.
696 Sono Deep 1 OGDCL 10-Sep-07 Sindh 11,516 Suspended
697 Pakhro 1 OGDCL 15-Dec-07 Sindh 12,113 Lower Goru 28-Apr-08 Gas/Cond.
698 Kamal West 1 OPII 19-Dec-07 Sindh 11,604 Lower Goru 05-Feb-08 Temp. Suspended
699 Shahrig 1 MGCL 10-Jan-08 Balochistan 5,085 Chiltan 29-Mar-08 Plugged & Abd.
700 Qalander 1 MGCL 14-Jan-08 Sindh 3,885 29-Feb-08 Suspended
701 Reti 1 OGDCL 12-Jan-08 Sindh 10,171 Lower Goru 01-Apr-08 Suspended
702 Badhra South 1 ENI 19-Jan-08 Sindh 6,808 Parh 12-Apr-08 Suspended
703 Kunar South 1 OGDCL 21-Jan-08 Sindh 11,007 Gas/Cond.
704 Moolan North 1 OGDCL 24-Jan-08 Sindh 7,641 17-Apr-08 Oil
705 Dinan Shah 1 OMV 18-Feb-08 Sindh 3,642 03-Mar-08 Plugged & Abd.
706 Koonj 1 MGCL 24-Feb-08 Sindh 1,070 Plugged & Abd.
707 Bela 1 POL 04-Mar-08 Punjab 4,948 Drilling
708 Azim 1 POL 14-Mar-08 Sindh 6,850 Plugged & Abd.
709 Watayo 1 MGCL 20-Mar-08 Sindh 3,878 Plugged & Abd.
710 Koonj 1A MGCL 22-Apr-08 Sindh 4,839 Gas
711 Nur Deep 1 OGDCL 21-Apr-08 Sindh 9,400 Drilling
712 Sofiya 1 Petronas 17-Apr-08 Sindh 10,279 Drilling
713 Bitrisim 1 OGDCL 14-Jun-08 Sindh 8,179 Drilling
714 Nashpa 1 OGDCL 29-Jun-08 NWFP 3,615 Drilling
715 Khawaja 1 OGDCL 30-Jun-08 NWFP 1,926 Drilling
716 Pirane 1 POL 30-Jun-08 Sindh 2,346 Drilling
Note: Boldtype indicate discoveries.
Source: DGPC.
* EPT: Extended Production Testing
OIL & GAS EXPLORATORY WELLS (Contd.)

1421
2821 21 23
34
13 16 18 14
32 2919
33 3627
2218
2225 23 23
13
1919
3130
45
24
28
31
4153
91-92 92-93 93-94 94-95 95-96 96-97 97-98 98-99
0
20
40
60
80
100No. of Wells
Exploratory Development
OIL & GAS EXPLORATIONAs on July 1, 2008
Exploratory Wells 716
Development Wells 931
Sedimentary Area: 827,268 sq km
Expl. Drilling Density One well per 1376 sq km
Discoveries: 213
Oil 67
Gas/condensate 146
Overall Success Rate: 1 : 3.4
•
•
•
•
•
–
–
•
Figure 7.2
EXPLORATORY AND DEVELOPMENT WELLS DRILLED
Figure 7.1
00-01 02-03 04-0501-02 03-0499-00 05-06 06-07 07-08

Appendix: 7.2
OIL & GAS APPRAISAL/DEVELOPMENT WELLS DRILLED IN PAKISTAN(FIELD-WISE IN ALPHABETICAL ORDER)
Sr. KBE TD Completion
No. Name No Operator Spud Date Province (Ft.) (Ft.) Zone/Formation Compln. Date Status
1 Adhi 6 PPL 01-Sep-79 Punjab 1726 5,036 - 27-Feb-80 Abandoned
2 Adhi 7 PPL 30-Mar-81 Punjab 1770 9,242 Khewra/Tobra 30-Aug-81 Oil
3 Adhi 8 PPL 14-Dec-81 Punjab 1730 5,078 - 22-Feb-82 Abandoned
4 Adhi 9 PPL 24-Jan-83 Punjab 1857 9,514 Khewra/Tobra 02-Mar-84 Oil
5 Adhi 10 PPL 23-May-88 Punjab 1863 9,613 Khewra/Tobra 28-Dec-88 Oil
6 Adhi 11 PPL 04-Feb-89 Punjab 1747 9,452 Khewra/Tobra 14-Sep-89 Oil
7 Adhi 12 PPL 07-Aug-96 Punjab 10,306 29-Mar-97 Gas/Condensate
8 Adhi 13 PPL 14-Aug-01 Punjab 8,599 Oil/Gas
9 Adhi 14 PPL 21-Aug-02 Punjab 11,155 Oil
10 Adhi 15 PPL 01-Aug-03 Punjab 8,376 30-Mar-04 Gas/Cond.
11 Adhi 16 PPL 11-Jun-04 Punjab 9,229 Gas/Cond.
12 Adhi 17 PPL 28-Mar-05 Punjab 1,752 7,463 16-Sep-05 Oil & Gas
13 Adhi 18 PPL 03-Jan-06 Punjab 9,331 Oil/Gas
14 Akri North 2 UTP 07-Nov-89 Sindh 37 5,950 Lower Goru-B 25-Nov-89 Oil
15 Akri North 3 UTP 12-Mar-90 Sindh 36 6,500 - 24-Mar-90 Abandoned
16 Akri North 4 UTP 02-Apr-00 Sindh 37 5,795 14-Apr-00 Oil
17 Akri North 5 UTP 14-Mar-01 Sindh 38 5,853 Lower Goru 23-Mar-01 Oil
18 Akri North 6 UTP 30-Mar-01 Sindh 38 5,951 Lower Goru 07-Apr-01 Oil
19 Bachal 2 UTP 01-Dec-94 Sindh 4,954 10-Dec-94 Abandoned
20 Badhra 3 Lasmo 04-Feb-03 Sindh 4,134 Plugged & Abd.
21 Bagla 2 OGDCL 06-Jun-08 Sindh 2,018 Drilling
22 Bahu 2 OGDCL 28-Dec-06 Punjab 6,316 Kingriali 07-Mar-07 Gas
23 Bahu 3 OGDCL 15-Apr-07 Punjab 6,332 Temp. Suspended
24 Bahu 4 OGDCL 13-Jun-08 Punjab 669 Drilling
25 Balkassar 2A POL 14-Dec-46 Punjab 1742 4,643 Chorgali/Sakessa 15-Feb-47 Abandoned
26 Balkassar 3A POL 30-Mar-47 Punjab 1726 8,219 Chorgali/Sakessa 01-May-48 Oil
27 Balkassar 4A AOC 20-Sep-47 Punjab 1745 8,711 Chorgali/Sakessa 01-May-48 Oil
28 Balkassar 2B BOC 02-Feb-48 Punjab 1745 8,214 02-May-49 Oil
29 Balkassar 5A AOC 14-Sep-48 Punjab 1742 8,304 Chorgali/Sakessa 02-May-49 Oil
30 Balkassar 3B BOC 09-Jan-49 Punjab 1761 8,937 10-Jan-50 Abandoned
31 Balkassar 6A AOC 02-Apr-49 Punjab 1762 8,219 Chorgali/Sakessa 03-May-50 Oil
32 Balkassar 4B BOC 27-Jan-50 Punjab 1716 8,609 30-Aug-51 Oil
33 Balkassar 7A AOC 10-Jun-50 Punjab 1749 8,275 Chorgali/Sakessa 07-Mar-51 Oil
34 Balkassar 6 PPL 23-May-51 Punjab 1781 8,431 - 25-Jan-52 Abandoned
35 Balkassar 7 PPL 01-Aug-52 Punjab 1719 8,441 17-Jan-53 Oil
36 Balkassar 8 PPL 17-Mar-53 Punjab 1696 8,200 07-Apr-55 Abandoned
37 Balkassar 9 PPL 14-Jul-53 Punjab 1715 8,750 14-Feb-54 Abandoned
38 Balkassar 5 PPL 15-Nov-53 Punjab 1744 8,808 21-Apr-54 Abandoned
39 Balkassar 10 PPL 10-May-54 Punjab 1723 8,430 25-Aug-55 Oil
40 Balkassar 2 OXY 19-Aug-93 Punjab 8,199 18-Oct-93 Abandoned
41 Balkassar POL 1 POL 16-Dec-04 Punjab 1,823 8,899 Oil
42 Bari 3 UTP 05-Jul-93 Sindh 2,976 13-Jul-93 Oil
43 Bari 4 UTP 18-Jan-94 Sindh 2,661 29-Jan-94 Abandoned
44 Bari 5 UTP 25-Nov-96 Sindh 2,474 30-Nov-96 Abandoned
45 Bhal Saydan 2 OGDC 08-Mar-90 Punjab 1641 15,098 - 31-May-90 Abandoned
46 Bhangali 2 OXY 04-Nov-89 Punjab 1777 12,805 Sakessar 04-Mar-90 INJ
47 Bhatti 2 UTP 30-Jan-90 Sindh 45 6,245 - 17-Feb-90 Oil/Gas
48 Bhatti 3 UTP 18-Sep-91 Sindh 8,550 26-Oct-91 Gas
49 Bhatti 4 BP 16-Feb-02 Sindh 50 7,927 Lower Goru 07-Mar-02 Temp. Abandoned
50 Bhatti 5 BP 06-Aug-02 Sindh 5,755 Lower Goru 16-Aug-02 Suspended
51 Bhatti 6 BP 03-Oct-04 Sindh 47 6,168 Lower Goru Gas
52 Bhit 3 Lasmo 10-Mar-98 Sindh 9,268 Gas
53 Bhit 4 Lasmo 25-Jun-98 Sindh 6,611 Pab 22-Aug-98 Abandoned
54 Bhit 5 Lasmo 17-Nov-98 Sindh 1,975 02-Jan-99 Suspended
55 Bhit 7 Lasmo 10-Feb-02 Sindh 31 7,044 Pab 14-Mar-02 Gas
56 Bhit 8 Lasmo 08-Jun-02 Sindh 1,962 Plugged & Suspended
57 Bhit WDW 1 Lasmo 03-Dec-01 Sindh 31 6,890 Pab 11-Jan-02 Completed
58 Bhit 9 Lasmo 12-Jul-02 Sindh 7,116 Gas
59 Bhit 12 Eni 24-Apr-06 Sindh 6,765 29-May-06 Suspended
60 Bhit 11 Eni 12-Oct-07 Sindh 7,103 Pab 20-Nov-07 Gas
61 Bobi 2 OGDC 26-Dec-88 Sindh 89 9,521 Lower Goru 14-Feb-89 Condensate
62 Bobi 3 OGDC 20-Jun-89 Sindh 90 9,567 Lower Goru 15-Aug-89 Condensate
63 Bobi 4 OGDC 27-Mar-92 Sindh 82 9,016 05-Jun-92 Gas
64 Bobi 5 OGDC 05-Oct-93 Sindh 8,990 20-Nov-93 Abandoned
65 Bobi 6 OGDC 03-Dec-94 Sindh 8,875 24-Jan-95 Condensate
66 Bobi 7 OGDC 15-Mar-97 Sindh 9,023 21-Jun-97 Abandoned
67 Bobi 8 OGDC 18-Jun-97 Sindh Active
68 Bobi 9 OGDCL 24-Aug-03 Sindh 8,747 03-Oct-03 Gas/Cond.
69 Bukhari 2 UTP 07-Jul-86 Sindh 59 6,450 - 31-Jul-86 Gas
70 Bukhari 3 UTP 14-Jan-88 Sindh 58 6,558 - 11-Feb-88 Gas
Note: Shaded area indicate wells drilled in current year Contd./...

APPRAISAL/DEVELOPMENT WELLS (Contd.)Sr. KBE TD Completion
No. Name No Operator Spud Date Province (Ft.) (Ft.) Zone/Formation Compln. Date Status
71 Bukhari 4 UTP 28-Aug-93 Sindh 6,549 20-Sep-93 Gas
72 Bukhari Deep 2 BP 05-Oct-07 Sindh 10,312 Lower Goru 16-Nov-07 Gas
73 Bukhari SWD 1 UTP 28-Feb-96 Sindh 4,631 07-Mar-96 Water Inj.
74 Buzdar S.Deep 2 UTP 29-May-97 Sindh Active
75 Buzdar South 2 BP 07-Jan-08 Sindh 5,220 Lower Goru 21-Jan-08 Oil & Gas
76 Buzdar South Deep 3 BP 13-May-04 Sindh 6,985 26-May-04 Oil & Gas77 Buzdar S. Deep 4 BP 29-Mar-05 Sindh 79 7,451 14-Apr-05 Oil & Gas
78 Buzdar South SWD 1 BP 08-Nov-05 Sindh 3,097 Completed
79 Chachar 2 Tullow 21-May-06 Sindh 4,806 08-Jun-06 Gas
80 Chachar 3 Tullow 17-Jun-06 Sindh 4,974 23-Jul-06 Gas
81 Chak Naurang 2 OGDC 26-Sep-85 Punjab 1811 7310 Khewra 03-Apr-87 Oil
82 Chak Naurang 3 OGDC 09-Nov-87 Punjab 1824 9,357 Khewra 03-May-88 Oil
83 Chak Naurang 4 OGDC 25-May-88 Punjab 1857 9,138 Lockhart 12-Nov-88 Oil
84 Chak2 2 OGDCL 21-Mar-04 Sindh 11,220 Gas/Cond.
85 Chak2 3 OGDCL 08-Nov-04 Sindh 117 10,499 Lower Goru Temp. Abandoned
86 Chak-5 Dim South 2 OGDC 18-Dec-97 Sindh 9,843 20-Mar-97 Abandoned
87 Chak-63 3 OGDC 21-Mar-03 Sindh 11,368 Oil & Gas
88 Chak-63 4 OGDCL 05-May-04 Sindh 11,647 Gas/Cond.
89 Chanda 2 OGDCL 16-May-05 NWFP 16,371 24-Apr-06 Oil & Gas
90 Chanda 3 OGDCL 29-Jun-07 NWFP 7,218 Drilling
91 Dabhi 2 UTP 05-Feb-85 Sindh 66 5,861 - 01-Mar-85 Oil/Gas
92 Dabhi 3 UTP 01-Jul-85 Sindh 63 6,000 - 22-Jul-85 Oil/Gas
93 Dabhi 4 UTP 01-Aug-86 Sindh 63 5,840 Lower Goru 14-Aug-86 Oil/Gas
94 Dabhi 5 UTP 04-Jun-99 Sindh 5,804 Lower Goru 15-Jun-99 Oil
95 Dabhi 6 UTP 21-Jun-99 Sindh 5,801 Lower Goru 21-Jun-99 Oil
96 Dabhi 7 UTP 09-Sep-01 Sindh 69 5,801 Lower Goru 20-Jan-02 Oil
97 Dabhi North 2 UTP 30-Oct-98 Sindh 6,348 Lower Goru 17-Nov-98 Oil
98 Dabhi North 3 UTP 24-Dec-99 Sindh 71 6,265 05-Jan-00 Oil
99 Dabhi North 4 BP 19-Feb-02 Sindh 71 6,273 Lower Goru 25-Feb-02 Abandoned
100 Dakhni 2 OGDC 07-Oct-83 Punjab 1052 14,797 Chorgali 12-Jun-84 Condensate
101 Dakhni 3 OGDC 09-Jul-84 Punjab 1008 15,145 29-Mar-85 Condensate
102 Dakhni 4 OGDC 30-Apr-85 Punjab 948 15,093 Lockhart 17-Jan-86 Condensate
103 Dakhni 5 OGDC 10-Jun-86 Punjab 989 15,349 Lockhart 20-Jun-87 Condensate
104 Dakhni 6 OGDC 18-Oct-86 Punjab 1079 15,795 07-Dec-87 Abandoned
105 Dakhni 7 OGDC 08-Dec-95 Punjab 2,717 28-Mar-96 Abandoned
106 Dakhni 7-A OGDC 26-Sep-96 Punjab 14,921 Lockhart 22-Aug-98 Abandoned
107 Dakhni 8 OGDCL 08-Mar-04 Punjab 14,993 Gas/Cond.
108 Dakhni 9 OGDCL 15-Dec-04 Punjab 1,019 14,764 Suspended
109 Dakhni 10 OGDCL 07-May-06 Punjab 13,648 Drilling
110 Dakhni Deep 2 OGDCL 20-Jun-07 Punjab 7,352 Drilling
111 Dakhni Deep 3 OGDCL 24-Jun-07 Punjab 3,878 Drilling
112 Daru 2 OGDC 11-May-89 Sindh 181 8,662 Lower Goru 14-Aug-89 Condensate
113 Daru 3 OGDC 01-Sep-89 Sindh 65 8,435 Lower Goru 15-Dec-89 Condensate
114 Dewan 2 Rally 10-Apr-05 Punjab 8,661 Gas
115 Dewan 3 Dewan 18-Jun-08 Punjab 4,081 Drilling
116 Dewan 5 Dewan 11-Mar-07 Punjab 1,631 Plugged & Abd.
117 Dewan 5A Dewan 27-Aug-07 Punjab 10,843 Chiltan 18-Jan-08 Gas
118 Dhodak 2 OGDC 01-Apr-78 Punjab 1716 9,846 Parh Ls. 30-Jun-79 Condensate
119 Dhodak 3 OGDC 18-May-79 Punjab 1817 10,039 Sembar 03-May-80 Condensate
120 Dhodak 4 OGDC 18-Nov-81 Punjab 1986 8,167 Pab 04-Jan-83 Abandoned
121 Dhodak 5 OGDC 31-May-88 Punjab 1694 8,015 Pab 24-Oct-88 Condensate
122 Dhodak 6 OGDC 23-Nov-88 Punjab 2267 8,301 Pab 03-Apr-89 Condensate
123 Dhodak 7 OGDC 01-Jul-89 Punjab 2133 8,212 Pab 06-Nov-89 Condensate
124 Dhodak 8 OGDC 22-Dec-91 Punjab 1422 7,390 06-Apr-92 Condensate
125 Dhodak 9 OGDCL 29-Jun-04 Punjab 7,884 Condensate
126 Dhodak 10 OGDCL 19-Oct-05 Punjab 7,303 29-May-06 Plugged & Abd.
127 Dhodak 10A OGDCL 30-Dec-06 Punjab 7,267 Gas/Cond.
128 Dhulian 7 POL 21-Jan-37 Punjab 1289 7,658 04-Nov-37 Oil
129 Dhulian 9 POL 01-Nov-37 Punjab 1283 8,898 Lockhart 31-Oct-41 Oil
130 Dhulian 11 POL 11-Nov-37 Punjab 1312 8,285 Ranikot 11-Jul-38 Oil
131 Dhulian 10 POL 28-Apr-38 Punjab 1355 7,779 10-Jan-39 Abandoned
132 Dhulian 13 POL 22-Jun-38 Punjab 1309 7,737 Lockhart 26-Jan-42 Abandoned
133 Dhulian 12 POL 10-Sep-38 Punjab 1299 7,674 Lockhart 18-Jun-40 Oil
134 Dhulian 17 POL 14-Nov-38 Punjab 1352 7,825 Lockhart 20-Jul-42 Oil
135 Dhulian 19 POL 10-Oct-39 Punjab 1342 8,170 Lockhart 04-Apr-40 Oil
136 Dhulian 16 POL 31-Jan-40 Punjab 1329 8,439 Ranikot 27-Jul-40 Oil
137 Dhulian 42 POL 26-Sep-61 Punjab 1355 9,613 Ranikot/Datta 01-Aug-62 Oil/Gas
138 Dhulian 43 POL 24-Jun-62 Punjab 1411 12,428 Sakessar 17-May-63 Oil/Gas
139 Dhulian 44 POL 06-Apr-64 Punjab 1299 9,577 Ranikot/Datta 17-May-64 Oil/Gas
140 Dhulian 45 POL 19-Oct-64 Punjab 1388 9,508 Ranikot/Datta 18-May-05 Oil/Gas
141 Dhulian 46 POL 12-Sep-65 Punjab 1345 9,656 Ranikot/Datta 12-Sep-65 Oil/Gas
142 Dhulian 8 POL 10-Oct-37 Punjab 20-Jul-38 Abandoned
143 Dhulian 18 POL 13-Apr-39 Punjab 1339 7,933 Lockhart 19-Jan-40 Abandoned
144 Dhulian 15 POL 09-Jul-39 Punjab 1312 7,753 Lockhart 06-Mar-40 Oil
Note: Shaded area indicate wells drilled in current year Contd./...

APPRAISAL/DEVELOPMENT WELLS (Contd.)Sr. KBE TD Completion
No. Name No Operator Spud Date Province (Ft.) (Ft.) Zone/Formation Compln. Date Status
145 Dhulian 14 POL 28-May-40 Punjab 1335 7,897 Lockhart 08-Sep-41 Oil
146 Dhulian 20 POL 04-Aug-40 Punjab 1348 7,796 Lockhart 15-Feb-41 Oil
147 Dhulian 21 POL 28-Dec-40 Punjab 1358 - 11-Nov-41 Abandoned
148 Dhulian 22 POL 22-Jan-41 Punjab 1355 7,812 Lockhart 11-Nov-41 Oil
149 Dhulian 23 POL 25-Jun-41 Punjab 1280 7,956 Lockhart 20-Sep-42 Abandoned
150 Dhulian 24 POL 04-Dec-41 Punjab 1289 8,262 Ranikot 21-Sep-42 Oil
151 Dhulian 25 POL 06-Sep-42 Punjab 1322 7,701 Lockhart 13-Apr-43 Oil
152 Dhulian 26 POL 09-Nov-42 Punjab 1312 7,756 Lockhart 10-Mar-43 Oil
153 Dhulian 27 POL 05-May-43 Punjab 1270 7,655 Lockhart 13-Jan-44 Abandoned
154 Dhulian 28 POL 31-Jul-43 Punjab 1365 7,966 Ranikot 01-Apr-44 Oil
155 Dhulian 29 POL 07-Feb-44 Punjab 1299 7,678 Lockhart 23-Oct-44 Oil
156 Dhulian 31 POL 02-Mar-44 Punjab 1355 8,465 - 05-Dec-44 Abandoned
157 Dhulian 30 POL 05-Jun-44 Punjab 1283 7,674 Lockhart 27-Jan-45 Oil
158 Dhulian 32 POL 20-Nov-44 Punjab 1306 7,655 Lockhart 09-Apr-45 Oil
159 Dhulian 33 POL 27-Dec-44 Punjab 1283 Lockhart 17-Oct-45 Oil160 Dhulian 34 POL 29-Apr-45 Punjab 1345 Lockhart 05-Sep-46 Oil
161 Dhulian 35 POL 05-Sep-46 Punjab 1342 - 05-Sep-46 Abandoned
162 Dhulian 36 AOC 01-Jan-48 Punjab 1358 7,901 Lockhart 26-Mar-50 Oil/Gas
163 Dhulian 37 POL 06-Jun-53 Punjab 1358 9,252 13-Mar-55 Oil/Gas
164 Dhulian 1P POL 22-May-56 Punjab 1388 9,945 01-Nov-60 Abandoned
165 Dhulian 38 POL 31-Jan-58 Punjab 1303 8,970 Patala/? 01-May-59 Oil/Gas
166 Dhulian 39 POL 31-Mar-59 Punjab 1342 9,105 Datta 01-Jul-60 Oil/Gas
167 Dhulian 40 POL 19-May-59 Punjab 1273 2,992 13-May-60 Abandoned
168 Dhulian 41 POL 23-May-60 Punjab 1270 9,331 01-Jul-60 Oil/Gas
169 Dhulian 2P POL 25-Feb-61 Punjab 1306 9,731 Ranikot/Datta 01-May-62 Oil/Gas
170 Dhulian 3P POL 28-May-62 Punjab 1375 10,325 01-Dec-62 Abandoned
171 Dhurnal 2 OXY 01-Jul-84 Punjab 1624 14,808 Cho/Sak/Wargal/Pat 26-Feb-85 Oil
172 Dhurnal 3 OXY 19-Mar-85 Punjab 1670 16,045 Cho/Sak/Wargal/Pat 08-Nov-85 Oil
173 Dhurnal 4 OXY 09-Apr-86 Punjab 1631 15,300 Chorgali/Sakessa 27-Apr-85 INJ
174 Dhurnal 5 OXY 15-Nov-86 Punjab 1555 14,654 Cho/Sak/Wargal/Pat 04-Jun-87 INJ
175 Dhurnal 6 OXY 08-Sep-87 Punjab 1661 13,775 Cho/Sak/Wargal/Pat 10-May-88 Oil
176 Dhurnal 7 OXY 20-Sep-88 Punjab 1693 14,680 Chor/Sakes/Patala 18-Feb-89 INJ
177 Duphri 2 UTP 10-Sep-89 Sindh 46 3,046 Lower Goru 23-Sep-89 Gas
178 Duphri 4 BP 20-Oct-04 Sindh 45 7,520 Lower Goru Gas
179 Duphri 3 BP 31-Jul-05 Sindh 1,915 Lower Goru 05-Aug-05 Oil
180 Duphri 5 BP 15-Feb-06 Sindh 2,858 Lower Goru 21-Feb-06 Gas
181 Duphri 6 BP 24-Mar-08 Sindh 2,956 Lower Goru 30-Mar-08 Oil
182 Duphri SWD 1 BP 23-Sep-06 Sindh 1,585 Completed
183 Fimkassar 2 OGDC 07-Feb-90 Punjab 1762 10,089 - 13-Oct-90 Oil
184 Fimkassar 3 OGDC 26-Sep-94 Punjab 10,545 19-May-95 Water Injection
185 Fimkassar 4 OGDCL 29-Jul-03 Punjab 11,319 Abandoned
186 Ghotana 2 OGDC 11-Sep-86 Sindh 79 7,300 Lower Goru 24-Nov-86 Oil
187 Ghotana 3 OGDCL 26-Dec-97 Sindh 6,972 18-Feb-98 Abandoned
188 Ghunghro 2 UTP 29-Apr-89 Sindh 28 5,150 Lower Goru 14-May-89 Oil
189 Ghunghro 3 UTP 08-May-96 Sindh 4,872 28-May-96 Oil
190 Ghunghro 4 UTP 21-Sep-00 Sindh 27 5,000 Lower Goru 28-Sep-00 Oil
191 Ghunghro 5 UTP 03-Jan-01 Sindh 27 4,977 Lower Goru 09-Jan-01 Oil
192 Ghunghro 6 UTP 01-Feb-01 Sindh 27 5,000 Lower Goru 11-Feb-01 Oil
193 Ghunghro 7 UTP 19-Feb-01 Sindh 27 5,203 Lower Goru 24-Feb-01 Oil
194 Ghunghro SW-1 UTP 07-Nov-96 Sindh 2,054 19-Nov-96 Completed
195 Ghunghro SW-2 BP 31-Dec-01 Sindh 2,359 Completed
196 Ghunghro 8 BP 05-Mar-05 Sindh 28 4,623 Lower Goru 10-Mar-05 Oil
197 Ghunghro 9 BP 29-Jul-07 Sindh 13,753 Lower Goru 07-Aug-08 Oil
198 Golarchi 2 UTP 10-Mar-84 Sindh 59 6,505 - 10-Apr-84 Gas
199 Golarchi 3 UTP 15-Mar-88 Sindh 45 11,594 Lower Goru-C 14-May-88 Gas
200 Golarchi 4 BP 15-Sep-04 Sindh 26 6,503 Lower Goru Gas
201 Hakeem Daho 2 OGDCL 04-Aug-04 Sindh 112 10,827 Lower Goru Gas Condensate
202 Halipota 2 UTP 05-Apr-89 Sindh 66 6,567 Lower Goru 26-Apr-89 Oil/Gas
203 Halipota 3 BP 12-Oct-06 Sindh 6,604 Lower Goru 24-Dec-06 Oil/Gas
204 Hamza X 2 00-Jan-00 25-Jan-04 Sindh 4,272 Gas/Sus
205 Hassan 2 PEL 01-Jan-05 Sindh 220 4,396 Mughal Kot 02-Mar-05 Gas
206 Hassan 3 PEL 18-Sep-07 Sindh 3,353 Gas
207 Hundi 2 OGDC 01-Jan-72 Sindh 943 5,285 - 10-Apr-72 Gas
208 Hundi 3 OGDC 27-Nov-73 Sindh 938 5,086 Ranikot 20-May-74 Gas
209 Hundi 4 OGDC 09-Dec-74 Sindh 1077 5,020 Ranikot 15-Apr-75 Gas
210 Jabo 2 UTP 21-Feb-00 Sindh 26 6,900 04-Mar-00 Oil/Gas
211 Jabo 3 UTP 26-Aug-00 Sindh 27 6,900 Lower Goru 09-Sep-00 Gas
212 Jabo 4 BP 04-Dec-02 Sindh 6,900 Lower Goru 18-Dec-02 Oil
213 Jabo 5 BP 03-Apr-03 Sindh 6,814 Lower Goru 14-Apr-03 Oil
214 Jabo SWD 1 BP 02-Dec-03 Sindh 2,182 10-Dec-03 Completed
215 Jabo SWD 2 BP 05-Dec-07 Sindh 2,249 Completed
216 Jabo 6 BP 27-Sep-05 Sindh 8,648 Lower Goru 15-Oct-05 Oil/Gas
217 Jabo 7 BP 19-Apr-06 Sindh 7,031 Lower Goru 10-May-06 Plugged & Abd.
218 Jabo 8 BP 13-Feb-07 Sindh 6,778 Lower Goru 23-Feb-07 Oil
Note: Shaded area indicate wells drilled in current year Contd./...

APPRAISAL/DEVELOPMENT WELLS (Contd.)Sr. KBE TD Completion
No. Name No Operator Spud Date Province (Ft.) (Ft.) Zone/Formation Compln. Date Status
219 Jabo 9 BP 17-Dec-07 Sindh 6,937 Lower Goru 03-Jan-08 Oil
220 Jagir 2 UTP 15-Oct-99 Sindh 73 7,475 04-Nov-99 Oil
221 Jagir 3 UTP 09-Nov-00 Sindh 75 7,552 Lower Goru 03-Dec-00 Oil
222 Jagir (WIW) 4 UTP 15-Apr-01 Sindh 74 6,978 Completed
223 Jakhro 2 OGDCL 30-Jun-04 Sindh 10,827 Abandoned
224 Jalal 2 UTP 19-Jan-95 Sindh 5,624 05-Feb-95 Gas
225 Jalal D BP 02-Nov-06 Sindh 8,527 Lower Goru 27-Nov-06 Gas
226 Jalal D2 BP 22-Apr-08 Sindh 9,719 Drilling
227 Jhal Magsi South 2 OGDCL 31-Dec-06 Baloch. 14,065 Drilling
228 Jogwani 2 BP 22-Dec-05 Sindh 2,805 Lower Goru 28-Dec-05 Gas
229 Jogwani 3 BP 02-Dec-07 Sindh 2,830 Lower Goru 09-Dec-07 Gas
230 Joya Mair 2 POL 27-Aug-44 Punjab 1663 7,051 Chorgali/Sakessa 28-Apr-45 Oil
231 Joya Mair 3 POL 01-Dec-45 Punjab 1641 9,016 30-Apr-46 Abandoned
232 Joya Mair 4 POL 12-Jun-85 Punjab 1745 8,682 Chorgali/Sakessa 11-Dec-85 Oil
233 Kadanwari 3 Lasmo 01-Feb-91 Sindh 186 11,410 17-Apr-91 Gas
234 Kadanwari 4 Lasmo 27-Apr-91 Sindh 164 11,600 13-Jul-91 Gas
235 Kadanwari 5 Lasmo 16-Feb-94 Sindh 11,401 27-Apr-94 Abandoned
236 Kadanwari 6 Lasmo 30-Jun-94 Sindh 11,585 27-Aug-94 Gas
237 Kadanwari 7 Lasmo 22-Sep-94 Sindh 11,392 29-Nov-94 Gas
238 Kadanwari 8 Lasmo 02-Mar-95 Sindh 11,231 24-May-95 Abandoned
239 Kadanwari 9 Lasmo 19-Apr-97 Sindh 11,112 Goru 16-Aug-97 Gas
240 Kadanwari 10 Lasmo 28-Jun-98 Sindh 11,631 Lower Goru 31-Aug-98 Gas
241 Kadanwari 11 Lasmo 05-Aug-00 Sindh 11,594 Gas
242 Kadanwari 12 Lasmo 18-May-01 Sindh 11,260 Gas
243 Kadanwari 13 Lasmo 14-Jul-01 Sindh 60 11,719 Lower Goru 06-Sep-01 Suspended244 Kadanwari 4updip Lasmo 06-Apr-02 Sindh 11,516 Plugged & Abandoned
245 Kadanwari 14 ENI 14-Sep-03 Sindh 11,499 06-Nov-03 Gas
246 Kandanwari 15 Eni 04-Feb-06 Sindh 11,201 Lower Goru 10-Mar-06 Gas
247 Kandanwari 16 Eni 08-Jan-07 Sindh 11,549 Plugged & Suspended
248 Kandanwari 17 Eni 11-Jun-08 Sindh 4,364 Gas
249 Kandanwari 18 Eni 28-Feb-07 Sindh 11,631 Gas
250 Kal 2 OGDC 11-Nov-95 Punjab 8,892 09-Feb-96 Oil
251 Kal 3 OGDC 31-Dec-07 Punjab 9,236 Oil
252 Kandhkot 2 PPL 08-Jan-71 Sindh 243 5,100 Sui Main Ls. 17-Feb-71 Gas
253 Kandhkot 3 PPL 14-Jan-85 Sindh 253 4,922 Sui Main Ls. 16-Feb-85 Gas
254 Kandhkot 4 PPL 29-Mar-85 Sindh 249 4,806 Sui Main Ls. 25-Apr-85 Gas
255 Kandhkot 5 PPL 16-May-85 Sindh 256 4,593 Sui Main Ls. 21-Jun-85 Gas
256 Kandhkot 6 PPL 24-Jul-85 Sindh 244 4,624 Sui Main Ls. 08-Sep-85 Gas
257 Kandhkot 7 PPL 11-Sep-85 Sindh 245 4,852 Sui Main Ls. 05-Oct-85 Gas
258 Kandhkot 8 PPL 22-Oct-85 Sindh 235 4,925 Sui Main Ls. 10-Dec-85 Gas
259 Kandhkot 9 PPL 14-Dec-85 Sindh 249 4,757 Sui Main Ls. 01-Feb-86 Gas
260 Kandhkot 10 PPL 20-Feb-86 Sindh 246 4,439 Sui Main Ls. 08-Mar-86 Gas
261 Kandhkot 11 PPL 21-Mar-86 Sindh 236 4,636 Sui Main Ls. 16-Apr-86 Gas
262 Kandhkot 12 PPL 03-May-86 Sindh 239 4,741 Sui Main Ls. 21-May-86 Gas
263 Kandhkot 13 PPL 03-Jun-86 Sindh 239 4,741 Sui Main Ls. 26-Jun-86 Gas
264 Kandhkot 14 PPL 03-Jul-86 Sindh 244 4,708 Sui Main Ls. 28-Jul-86 Gas
265 Kandhkot 15 PPL 15-Nov-86 Sindh 251 4,430 Sui Main Ls. 13-Dec-86 Gas
266 Kandhkot 16 PPL 31-Dec-86 Sindh 251 4,495 Sui Main Ls. 27-Jan-87 Gas
267 Kandhkot 20 PPL 12-Jan-87 Sindh 270 14,606 Sui Main Ls. 17-Aug-87 Gas
268 Kandhkot 17 PPL 01-Feb-87 Sindh 243 4,646 Sui Main Ls. 19-Feb-87 Gas
269 Kandhkot 18 PPL 02-Mar-87 Sindh 250 4,626 Sui Main Ls. 25-Mar-87 Gas
270 Kandhkot 19 PPL 06-Apr-87 Sindh 243 4,538 Sui Main Ls. 24-Apr-87 Gas
271 Kandhkot 22 PPL 09-Feb-96 Sindh 3,215 Gas
272 Kandhkot 21 PPL 09-Jun-98 Sindh 5,059 Gas
273 Kandhkot 23 PPL 19-Oct-00 Sindh 248 5,226 Sui Main Ls. 03-Jan-01 Gas
274 Kandhkot 24 PPL 18-Sep-03 Sindh 5,217 08-Dec-03 Gas
275 Kandhkot 25 PPL 01-Apr-05 Sindh 4,606 Gas
276 Kandhkot 26 PPL 25-Oct-07 Sindh 6,250 Gas
277 Kandhkot 27 PPL 04-Mar-08 Sindh 5,518 Gas
278 Kandra 2 Premier 05-Sep-96 Sindh 2,165 06-Oct-96 Suspended
279 Karsal 2 POL 30-Sep-57 Punjab 1362 12,675 14-Dec-58 Abandoned
280 Karsal 3 POL 15-May-59 Punjab 1341 11,665 07-Nov-59 Oil
281 Karsal 4 POL 21-Jul-60 Punjab 1251 12,222 28-Apr-61 Abandoned
282 Kato 2 BP 27-Feb-06 Sindh 2,818 Suspended
283 Kato 3 BP 17-Aug-06 Sindh 7,753 Lower Goru 05-Sep-06 Gas
284 Keyhole-G 2 BP 02-Jun-03 Sindh 5,902 Oil
285 Keyhole-G-SWD 1 BP 25-Jun-03 Sindh 2,185 Completed
286 Khanpur 2 PEL 03-Dec-07 Sindh 3,248 Gas
287 Khaskeli 2 UTP 02-Nov-81 Sindh 45 3,606 Lower Goru-A1 03-Dec-81 Oil
288 Khaskeli 3 UTP 05-Dec-81 Sindh 45 3,520 Lower Goru-A1/2 17-Dec-81 Oil
289 Khaskeli 4 UTP 14-Jan-82 Sindh 45 3,666 Lower Goru-A1/2 20-Feb-82 Oil
290 Khaskeli 5 UTP 21-Feb-82 Sindh 45 3,700 Lower Goru-A1 17-Mar-82 Oil
291 Khaskeli 6 UTP 18-Sep-82 Sindh 55 3,780 Lower Goru-A1 07-Oct-82 Oil
292 Khaskeli 7 UTP 11-Oct-82 Sindh 55 3,675 Lower Goru-A1 21-Oct-82 Oil
Note: Shaded area indicate wells drilled in current year Contd./...

APPRAISAL/DEVELOPMENT WELLS (Contd.)Sr. KBE TD Completion
No. Name No Operator Spud Date Province (Ft.) (Ft.) Zone/Formation Compln. Date Status
292 Khaskeli 7 UTP 11-Oct-82 Sindh 55 3,675 Lower Goru-A1 21-Oct-82 Oil
293 Khaskeli 8 UTP 28-Mar-83 Sindh 53 6,990 _ 02-May-83 Abandoned
294 Khaskeli 9 UTP 30-Jun-83 Sindh 43 3,800 Lower Goru-A1/2 03-Aug-83 INJ
295 Khaskeli 11 UTP 28-Jun-84 Sindh 67 3,600 Lower Goru-A1/2 01-Aug-84 Oil
296 Khaskeli 10 UTP 16-Jul-84 Sindh 67 3,815 Lower Goru 26-Jul-84 Oil
297 Khaskeli 12 UTP 20-May-85 Sindh 48 3,610 Lower Goru 01-Jun-85 Oil
298 Khaskeli 13 UTP 14-Mar-88 Sindh 47 4,700 _ 24-Mar-88 Oil
299 Khaskeli 14 UTP 01-Nov-92 Sindh 51 3,651 09-Nov-92 Abandoned
300 Khaskeli 15 BP 19-Nov-03 Sindh 3,806 24-Nov-03 Oil
301 Khaskeli 16 BP 31-Dec-04 Sindh 52 3,488 Lower Goru 04-Jan-05 Oil
302 Khaur 176 AOC 11-Feb-50 Punjab 1532 5,440 Sakessar 01-Apr-51 Oil
303 Khaur 396 POL 08-Oct-54 Punjab 1601 6,733 08-May-55 Abandoned
304 Khaur 238 POL 01-Jul-60 Punjab 21-Jan-61 Oil
305 Khaur POL 1 POL 07-Mar-07 Punjab 13,753 Plugged & Abandoned
306 Khorewah 2 UTP 04-Nov-89 Sindh 49 6,950 Lower Goru 27-Nov-89 Gas
307 Khorewah 3 UTP 07-Dec-93 Sindh 6,802 24-Dec-93 Gas
308 Khorewah 4 UTP 16-Jun-94 Sindh 6,611 01-Jul-94 Gas
309 Khorewah Deep 2 BP 29-Apr-08 Sindh 10,517 Drilling
310 Khost 2 MGCL 25-Apr-08 Baloch. 3,967 Oil
311 Koli 2 UTP 02-Dec-89 Sindh 49 4,950 Lower Goru 15-Dec-89 Oil/Gas
312 Kothar 2 OGDC 21-Feb-89 Sindh 988 6,384 - 02-Aug-89 Abandoned
313 Kunar 3 OGDC 11-Jan-89 Sindh 76 6,759 Lower Goru 20-Feb-89 Oil
314 Kunar 4 OGDC 13-Sep-89 Sindh 76 6,726 - 15-Oct-89 Abandoned
315 Kunar 5 OGDC 16-Sep-91 Sindh 78 6,557 09-Nov-91 Oil
316 Kunar 6 OGDC 09-Feb-03 Sindh 6,414 Oil
317 Kunar 7 OGDC 30-Mar-08 Sindh 6,398 Lower Goru 01-May-08 Gas/Cond.
318 Kunar 8 OGDC 30-Jun-08 Sindh 5,518 Drilling
319 Kunnar Deep 2 OGDCL 03-Mar-06 Sindh 10,886 13-May-06 Gas/Cond.
320 Kunnar Deep 3 OGDCL 30-Dec-06 Sindh 10,833 Sembar 23-Mar-07 Gas/Cond.
321 Kunnar Deep 4 OGDCL 18-Jan-07 Sindh 11,076 Sembar 15-Apr-07 Oil
322 Kunnar Deep 5 OGDCL 17-Nov-07 Sindh 10,938 Sembar 25-Feb-08 Gas/Cond.
323 Kunnar Deep 6 OGDCL 14-Mar-08 Sindh 10,879 Gas/Cond.
324 Kunnar Deep 7 OGDCL 05-Mar-08 Sindh 10,902 01-May-08 Gas/Cond.
325 Kunnar Deep 8 OGDCL 29-Jun-08 Sindh 5,784 01-May-08 Gas/Cond.
326 Kundahu 1 OMV 15-Mar-96 Sindh 12,222 Drilling
327 Laghari 2 UTP 27-Nov-83 Sindh 68 2,740 Lower Goru 09-Dec-83 Oil
328 Laghari 3 UTP 16-May-84 Sindh 67 2,750 Lower Goru 30-May-84 Oil
329 Laghari 4 UTP 02-Jul-84 Sindh 69 4,565 Lower Goru 25-Jul-84 Oil
330 Laghari 5 UTP 03-Jun-85 Sindh 55 2,740 Lower Goru 11-Jun-85 Oil
331 Laghari 6 UTP 23-Jul-85 Sindh 54 2,734 Lower Goru 29-Jun-85 Oil
332 Laghari 7 UTP 20-Dec-86 Sindh 55 2,750 Lower Goru 26-Dec-86 Oil
333 Laghari 8 UTP 17-Sep-96 Sindh 2,749 30-Sep-96 Oil
334 Lashari Centre 2 OGDC 01-Jan-90 Sindh 69 7,372 - 19-Apr-90 Abandoned
335 Lashari Centre 3 OGDC 10-Mar-94 Sindh 6,693 19-Apr-94 Oil
336 Lashari Centre 4 OGDC 30-Jun-99 Sindh 71 6,778 Lower Goru 18-Aug-99 Water Injection
337 Lashari Center 5 OGDCL 29-Aug-05 Sindh 7,448 14-Sep-05 Oil
338 Lashari Center 6 OGDCL 11-Dec-06 Sindh 7,087 Lower Goru 29-Jan-07 Oil
339 Lashari South 2 OGDC 06-Mar-88 Sindh 66 7,070 Lower Goru 17-Apr-88 Condensate
340 Latif 2 OMV 25-Apr-08 Sindh 11,444 Gas
341 Liari 2 UTP 19-Nov-88 Sindh 78 9,275 01-Jan-89 Oil
342 Liari 3 UTP 27-Nov-98 Sindh 6,946 22-Dec-98 Oil
343 Liari 4 UTP 31-Jan-00 Sindh 74 7,000 12-Feb-00 Oil/Gas
344 Liari 5 UTP 11-Dec-00 Sindh 74 7,001 Lower Goru 24-Dec-00 Oil
345 Loti 2 OGDC 12-Jun-85 Baloch. 3231 7,418 Pab 25-Dec-85 Gas
346 Loti 3 OGDC 04-Jan-86 Baloch. 2942 7,071 Pab 25-Jan-87 Gas
347 Loti 4 OGDC 24-Nov-86 Baloch. 2549 6,234 Pab 19-Feb-87 Gas
348 Loti 5 OGDC 26-Mar-87 Baloch. 3051 6,844 Pab 14-Jul-87 Gas
349 Loti 7 OGDC 12-May-87 Baloch. 2753 7,103 Pab 27-Jul-87 Gas
350 Loti 8 OGDC 13-Aug-87 Baloch. 2848 6,595 Ranikot 12-Oct-87 Gas
351 Loti 6 OGDC 27-Aug-87 Baloch. 3087 7,061 Pab 16-Nov-87 Gas
352 Loti 10 OGDC 26-Oct-87 Baloch. 2584 5,364 Sui Main Ls. 05-Dec-87 Gas
353 Loti 9 OGDC 21-Dec-87 Baloch. 2348 5,036 Sui Main Ls. 03-Feb-88 Gas
354 Loti 11 OGDC 17-Feb-88 Baloch. 2151 5,394 Sui Main Ls. 06-May-88 Gas
355 Loti 12 OGDC 30-May-88 Baloch. 2145 5,040 Sui Main Ls. 25-Jun-88 Gas
356 Loti 14 OGDC 15-Jul-88 Baloch. 3248 6,916 Pab 29-Oct-88 Gas
357 Loti 15 OGDC 05-Sep-90 Baloch. 2870 1,911 24-Jan-91 Abandoned
358 Loti 16 OGDC 14-Feb-91 Baloch. 6,677 24-Apr-91 Gas
359 Loti 17 OGDC 26-May-91 Baloch. 2976 6,620 02-Nov-91 Gas
360 Loti 18 OGDC 24-Nov-91 Baloch. 2554 6,393 20-Mar-92 Gas
361 Makhdumpur 2 UTP 08-Aug-87 Sindh 42 8,000 Lower Goru 11-Sep-87 Gas
362 Makhdumpur Deep 2 BP 20-Jan-06 Sindh 11,201 Lower Goru 25-Mar-06 Gas
363 Makori 2 MOL 02-May-08 NWFP 8,048 Drilling
364 Manzalai 2 MOL 21-Feb-05 NWFP 2,465 14,409 12-Mar-06 Oil & Gas
365 Manzalai 3 MOL 26-Mar-06 NWFP 15,978 Oil/Gas
Note: Shaded area indicate wells drilled in current year Contd./...

APPRAISAL/DEVELOPMENT WELLS (Contd.)Sr. KBE TD Completion
No. Name No Operator Spud Date Province (Ft.) (Ft.) Zone/Formation Compln. Date Status
366 Manzalai 4 MOL 17-Dec-06 NWFP 13,766 Gas Condensate
367 Manzalai 5 MOL 02-Feb-08 NWFP 13,425 Drilling
368 Manzalai 6 MOL 29-Jun-07 NWFP 10,292 Drilling
369 Mari 26 MGCL 12-Oct-85 Sindh 244 2,435 Habib Rahi Ls. 01-Nov-85 Gas
370 Mari 44 MGCL 17-Oct-85 Sindh 249 2,489 Habib Rahi Ls. 26-Oct-85 Gas
371 Mari 34 MGCL 28-Oct-85 Sindh 248 2,558 Habib Rahi Ls. 05-Nov-85 Gas
372 Mari 33 MGCL 07-Nov-85 Sindh 245 2,461 Habib Rahi Ls. 13-Nov-85 Gas
373 Mari 35 MGCL 12-Nov-85 Sindh 247 2,502 Habib Rahi Ls. 23-Nov-85 Gas
374 Mari 28 MGCL 15-Nov-85 Sindh 245 2,448 Habib Rahi Ls. 23-Nov-86 Gas
375 Mari 30 MGCL 19-Nov-85 Sindh 242 2,475 Habib Rahi Ls. 28-Nov-85 Gas
376 Mari 25 MGCL 31-Dec-85 Sindh 248 2,501 Habib Rahi Ls. 06-Jan-86 Gas
377 Mari 37 MGCL 05-Jan-86 Sindh 247 2,590 Habib Rahi Ls. 10-Jan-86 Gas
378 Mari 52 MGCL 24-Jan-86 Sindh 239 2,636 Habib Rahi Ls. 29-Jan-86 Gas
379 Mari 45 MGCL 31-Jan-86 Sindh 245 2,630 Habib Rahi Ls. 24-Mar-86 Gas
380 Mari 61 MGCL 18-Apr-93 Sindh 2,510 24-Apr-93 Gas
381 Mari 62 MGCL 26-Apr-93 Sindh 2,477 02-May-93 Gas
382 Mari 63 MGCL 04-May-93 Sindh 2,500 09-May-93 Gas
383 Mari 57 MGCL 11-May-93 Sindh 2,490 15-May-93 Gas
384 Mari 58 MGCL 22-May-93 Sindh 2,490 26-May-93 Gas
385 Mari 56 MGCL 29-May-93 Sindh 2,484 01-Jun-93 Gas
386 Mari 54 MGCL 04-Jun-93 Sindh 2,471 07-Jun-93 Gas
387 Mari 55 MGCL 09-Jun-93 Sindh 2,421 16-Jun-93 Gas
388 Mari 2 MGCL 01-Sep-57 Sindh 221 10,468 Habib Rahi Ls. 30-Nov-57 Abandoned
389 Mari 3 MGCL 27-May-59 Sindh 250 9,628 Habib Rahi Ls. 20-Sep-60 Gas
390 Mari 4 MGCL 12-Nov-65 Sindh 251 2,390 Habib Rahi Ls. 21-Dec-65 Gas
391 Mari 5 MGCL 31-Dec-65 Sindh 244 2,598 Habib Rahi Ls. 16-Jan-66 Gas
392 Mari 6 MGCL 25-Jan-66 Sindh 250 2,598 Habib Rahi Ls. 12-Feb-66 Gas
393 Mari 7 MGCL 19-Feb-66 Sindh 250 2,575 Habib Rahi Ls. 24-Feb-66 Gas
394 Mari 8 MGCL 02-Mar-66 Sindh 247 2,458 Habib Rahi Ls. 11-Mar-66 Gas
395 Mari 9 MGCL 17-Mar-66 Sindh 246 2,451 Habib Rahi Ls. 26-Jun-66 Gas
396 Mari 10 MGCL 08-Oct-77 Sindh 246 2,573 Habib Rahi Ls. 04-Nov-77 Gas
397 Mari 11 MGCL 07-Nov-77 Sindh 240 2,626 Habib Rahi Ls. 24-Nov-77 Gas
398 Mari 12 MGCL 26-Nov-77 Sindh 242 2,458 Habib Rahi Ls. 08-Dec-77 Gas
399 Mari 13 MGCL 10-Dec-77 Sindh 245 2,440 Habib Rahi Ls. 20-Dec-77 Gas
400 Mari 14 MGCL 22-Dec-77 Sindh 248 2,455 Habib Rahi Ls. 31-Dec-77 Gas
401 Mari 15 MGCL 02-Jan-78 Sindh 242 2,365 Habib Rahi Ls. 10-Jan-78 Gas
402 Mari 16 MGCL 13-Jan-78 Sindh 242 2,403 Habib Rahi Ls. 20-Jan-78 Gas
403 Mari 17 MGCL 04-Feb-78 Sindh 242 2,420 Habib Rahi Ls. 12-Feb-78 Gas
404 Mari 23 MGCL 09-Apr-81 Sindh 247 2,475 Habib Rahi Ls. 08-Jul-81 Gas
405 Mari 18 MGCL 06-May-81 Sindh 247 2,484 Habib Rahi Ls. 21-May-81 Gas
406 Mari 24 MGCL 22-May-81 Sindh 248 2,550 Habib Rahi Ls. 31-May-81 Gas
407 Mari 19 MGCL 02-Jun-81 Sindh 245 2,550 Habib Rahi Ls. 12-Jun-81 Gas
408 Mari 20 MGCL 14-Jun-81 Sindh 244 2,480 Habib Rahi Ls. 25-Jun-81 Gas
409 Mari 21 MGCL 06-Jul-81 Sindh 247 2,450 Habib Rahi Ls. 14-Jul-81 Gas
410 Mari 22 MGCL 16-Jul-81 Sindh 241 2,494 Habib Rahi Ls. 23-Jul-81 Gas
411 Mari 27 MGCL 01-Nov-85 Sindh 250 2,461 Habib Rahi Ls. 30-Jan-86 Gas
412 Mari 36 MGCL 21-Nov-85 Sindh 247 2,653 Habib Rahi Ls. 02-Dec-85 Gas
413 Mari 31 MGCL 30-Nov-85 Sindh 245 2,485 Habib Rahi Ls. 06-Dec-85 Gas
414 Mari 41 MGCL 02-Dec-85 Sindh 246 2,454 Habib Rahi Ls. 21-Dec-85 Gas
415 Mari 29 MGCL 03-Dec-85 Sindh 248 2,454 Habib Rahi Ls. 09-Dec-85 Gas
416 Mari 32 MGCL 08-Dec-85 Sindh 246 2,432 Habib Rahi Ls. 16-Dec-85 Gas
417 Mari 50 MGCL 13-Dec-85 Sindh 242 2,558 Habib Rahi Ls. 18-Dec-85 Gas
418 Mari 43 MGCL 21-Dec-85 Sindh 251 2,609 Habib Rahi Ls. 29-Dec-85 Gas
419 Mari 49 MGCL 23-Dec-85 Sindh 243 2,515 Habib Rahi Ls. 28-Dec-85 Gas
420 Mari 48 MGCL 30-Dec-85 Sindh 246 2,557 Habib Rahi Ls. 14-Jan-86 Gas
421 Mari 47 MGCL 07-Jan-86 Sindh 248 2,489 Habib Rahi Ls. 13-Jan-86 Gas
422 Mari 38 MGCL 11-Jan-86 Sindh 246 2,384 Habib Rahi Ls. 16-Jan-86 Gas
423 Mari 46 MGCL 14-Jan-86 Sindh 247 2,482 Habib Rahi Ls. 20-Jan-86 Gas
424 Mari 39 MGCL 17-Jan-86 Sindh 247 2,385 Habib Rahi Ls. 22-Jan-86 Gas
425 Mari 51 MGCL 31-Jan-86 Sindh 242 2,484 Habib Rahi Ls. 16-Feb-86 Gas
426 Mari 53 MGCL 08-Feb-86 Sindh 247 2,462 Habib Rahi Ls. 08-Mar-86 Gas
427 Mari E-2 MGCL 18-Feb-86 Sindh 235 2,620 Habib Rahi Ls. 12-Mar-86 Gas
428 Mari E-3 MGCL 27-Feb-86 Sindh 249 2,631 Habib Rahi Ls. 05-Mar-86 Gas
429 Mari E-1 MGCL 07-Mar-86 Sindh 63 5,975 Lower Goru 20-Apr-86 Gas
430 Mari 59 MGCL 01-Apr-93 Sindh 2,431 09-Apr-93 Gas
431 Mari 60 MGCL 10-Apr-93 Sindh 2,435 18-Apr-93 Gas
432 Mari 64 MGCL 12-Apr-94 Sindh 2,474 23-Apr-94 Gas
433 Mari 65 MGCL 26-Apr-94 Sindh 2,484 05-May-94 Gas
434 Mari 67 MGCL 07-May-94 Sindh 2,477 15-May-94 Gas
435 Mari E-5 MGCL 18-May-94 Sindh 2,556 26-May-94 Gas
436 Mari E-7 MGCL 02-Jun-94 Sindh 2,651 13-Jun-94 Abandoned
437 Mari E-4 MGCL 18-Jun-94 Sindh 2,592 27-Jun-94 Gas
438 Mari E-6 MGCL 01-Jul-94 Sindh 2,569 10-Jul-94 Abandoned
439 Mari E-89 MGCL 16-Jul-94 Sindh 2,435 01-Aug-94 Gas
Note: Shaded area indicate wells drilled in current year Contd./...

APPRAISAL/DEVELOPMENT WELLS (Contd.)Sr. KBE TD Completion
No. Name No Operator Spud Date Province (Ft.) (Ft.) Zone/Formation Compln. Date Status
440 Mari E-40 MGCL 05-Aug-95 Sindh 2,464 01-Aug-94 Gas
441 Mari 90 MGCL 21-Dec-02 Sindh 2,485 Gas
442 Mari 70 MGCL 15-Jan-03 Sindh 2,485 Gas
443 Mari 71 MGCL 19-Jan-03 Sindh 2,485 Gas
444 Mari 72 MGCL 01-Feb-03 Sindh 2,486 13-Feb-03 Gas
445 Mari 73 MGCL 15-Feb-03 Sindh 2,550 26-Feb-03 Gas
446 Mari 74 MGCL 28-Feb-03 Sindh 2,485 08-Mar-03 Gas
447 Mari 76 MGCL 10-Mar-03 Sindh 2,485 18-Mar-03 Gas
448 Mari 75 MGCL 19-Mar-03 Sindh 2,485 31-Mar-03 Gas
449 Mari 77 MGCL 01-Apr-03 Sindh 2,485 Gas
450 Mari 81 MGCL 11-Apr-03 Sindh 2,487 18-Apr-03 Gas
451 Mari 80 MGCL 20-Apr-03 Sindh 2,485 27-Apr-03 Gas
452 Mari 79 MGCL 29-Apr-03 Sindh 2,485 06-May-03 Gas
453 Mari 86 MGCL 07-May-03 Sindh 2,490 Gas
454 Mari 83 MGCL 10-May-03 Sindh 2,486 17-May-03 Gas
455 Mari 84 MGCL 19-May-03 Sindh 2,485 26-May-03 Gas
456 Mari 82 MGCL 27-May-03 Sindh 2,530 Gas
457 Mari 78 MGCL 04-Jun-03 Sindh 2,484 Gas
458 Mari PKL 1 MGCL 06-Dec-06 Sindh 1,831 Pirkoh Lime st. 22-Dec-06 Gas
459 Mari PKL 2 MGCL 06-Jan-07 Sindh 1,831 Pirkoh Lime st. 23-Jan-07 Plugged & Abd.
460 Mari PKL 3 MGCL 25-Dec-06 Sindh 1,896 Pirkoh Lime st. 03-Jan-07 Gas
461 Mari Deep 4 MGCL 06-Dec-00 Sindh 251 9,498 Lower Goru 08-Feb-01 Gas
462 Mari Deep 3 MGCL 19-Dec-00 Sindh 251 9,501 Lower Goru 18-Feb-01 Gas
463 Mari Deep 6 MGCL 18-Feb-01 Sindh 253 9,301 Lower Goru 30-Mar-01 Gas
464 Mari Deep 9 MGCL 07-Apr-01 Sindh 251 7,802 Gas
465 Mari Deep 10 MGCL 29-May-01 Sindh 251 9,596 Gas
466 Mari Deep 11 MGCL 19-Jul-01 Sindh 264 9,524 Habib Rahi 16-Sep-01 Gas
467 Mari Water Disposal MGCL 18-Sep-94 Sindh 1,595 25-Sep-94 Water Injection
468 Mari Deep 12 MGCL 24-Jan-04 Sindh 9,613 02-Apr-04 Gas
469 Matli 2 UTP 11-Apr-89 Sindh 64 5,800 Lower Goru 08-May-89 Gas
470 Matli 3 UTP 04-Jun-89 Sindh 65 6,065 Lower Goru 20-Jun-89 Oil
471 Matli 4 UTP 27-Apr-92 Sindh 5,801 18-May-92 Gas
472 Mazarani 2 Hunt 19-Jan-90 Sindh 279 9,875 Laki 21-May-90 Gas
473 Mazarani 3 Hunt 31-May-90 Sindh 425 6,686 Laki 22-Aug-90 Gas
474 Mazarani 4 PPL 03-Jun-07 Sindh 6,644 Drilling
475 Mazari 3 UTP 09-Aug-85 Sindh 67 4,750 Lower Goru 26-Aug-85 Oil
476 Mazari 4 UTP 16-Sep-86 Sindh 70 4,257 Lower Goru 29-Sep-86 Oil
477 Mazari 5 UTP 14-Nov-86 Sindh 66 4,300 Lower Goru 24-Nov-86 Oil
478 Mazari 6 UTP 01-Mar-90 Sindh 68 4,200 Lower Goru 10-Mar-90 Oil
479 Mazari 7 UTP 14-Nov-90 Sindh 67 4,282 - 27-Nov-90 Oil
480 Mazari 8 UTP 30-Sep-95 Sindh 4,200 09-Sep-95 Oil
481 Mazari 9 BP 13-Dec-01 Sindh 72 4,199 Lower Goru 18-Dec-01 Oil
482 Mazari South 2 UTP 06-Nov-85 Sindh 62 4,221 Lower Goru 15-Nov-85 Oil
483 Mazari South 3 UTP 08-Jan-89 Sindh 62 4,462 Lower Goru 26-Jan-89 Oil
484 Mazari South 4 UTP 25-Sep-89 Sindh 65 4,250 - 07-Oct-89 Oil
485 Mazari South 5 UTP 09-Oct-90 Sindh 4,413 21-Oct-90 Oil
486 Mazari South 6 UTP 27-Dec-93 Sindh 4,400 07-Jan-94 W/INJ
487 Mazari South 7 UTP 22-Aug-99 Sindh 66 4,100 31-Aug-99 Oil
488 Mazari South 8 UTP 06-Oct-00 Sindh 64 4,199 Lower Goru 15-Oct-00 Oil
489 Mazari South 9 UTP 26-Oct-00 Sindh 64 4,301 Lower Goru 02-Nov-00 Oil
490 Mazari South 10 UTP 30-Aug-01 Sindh 4,150 Oil
491 Mazari South 11 BP 17-Jan-08 Sindh 7,187 Lower Goru 06-Feb-08 Oil
492 Mazari SWD 2 UTP 27-Mar-97 Sindh 2,202 09-Apr-97 Completed
493 Mazari SWD 3 BP 09-Apr-02 Sindh 2,360 Completed as WIW
494 Mazari South Deep 2 UTP 09-Oct-98 Sindh 1,821 24-Oct-98 Oil
495 Mazari South Deep 3 UTP 01-Nov-98 Sindh 1,897 26-Nov-98 Oil
496 Mazari South Deep 4 UTP 08-Jul-99 Sindh 64 6,200 24-Jul-99 Oil
497 Mazari South Deep 5 UTP 04-Aug-99 Sindh 69 5,700 16-Aug-99 Oil
498 Mazari South Deep 6 BP 02-Feb-02 Sindh 67 6,201 09-Feb-02 Oil
499 Mazari South Deep 7 BP 19-Jul-06 Sindh 0 6,155 Lower Goru 01-Aug-06 Oil
500 Mehar 2 Petronas 25-Jun-05 Sindh 13,917 21-Nov-05 Gas Condensate
501 Mela 2 OGDC 28-May-07 NWFP 7,776 Drilling
502 Mela 3 OGDC 18-Jun-07 NWFP 2,825 Drilling
503 Messa Keswal 2 OGDC 27-Oct-91 Punjab 1462 7,216 13-Sep-92 Oil
504 Messa-Keswal 3 OGDC 10-Oct-92 Punjab 7,382 01-Apr-93 Oil
505 Messa-Keswal 4 OGDC 02-Aug-93 Punjab 7,271 03-Sep-94 Abandoned
506 Meyal 2P POL 30-Sep-69 Punjab 1309 13,600 Chor/Sakes/Raniko 02-Jan-71 Oil/Gas
507 Meyal 3P POL 15-Jun-72 Punjab 1378 12,720 Chorgali/Sakessa 21-Jul-73 Oil/Gas
508 Meyal 4P POL 19-Nov-74 Punjab 1411 12,638 Chorgali/Sakessa 15-Nov-75 Oil/Gas
509 Meyal 6P POL 03-Dec-75 Punjab 1345 13,423 Datta 16-Sep-76 Oil/Gas
510 Meyal 7P POL 26-Dec-76 Punjab 1421 14,210 Datta 11-Jun-77 Oil/Gas
511 Meyal 5P POL 06-Jan-79 Punjab 1381 14,098 Datta 06-May-80 Oil/Gas
512 Meyal 8P POL 10-May-80 Punjab 1421 12,501 Sakessar/Datta 18-Jun-81 Oil/Gas
Note: Shaded area indicate wells drilled in current year Contd./...

APPRAISAL/DEVELOPMENT WELLS (Contd.)Sr. KBE TD Completion
No. Name No Operator Spud Date Province (Ft.) (Ft.) Zone/Formation Compln. Date Status
513 Meyal 9P POL 14-Aug-81 Punjab 1230 12,848 03-Dec-81 Oil/Gas
514 Meyal 10P POL 21-Jan-82 Punjab 1296 14,121 Sakessar/Datta 19-Nov-82 Oil/Gas
515 Meyal 11P POL 04-Jun-82 Punjab 1453 2,946 05-Mar-83 Abandoned
516 Meyal 12P POL 12-Dec-82 Punjab 1352 12,300 Sakessar/Datta 01-Jul-83 Oil/Gas
517 Meyal 13P POL 31-Mar-84 Punjab 1352 14,505 Sakessar/Datta 01-Jan-85 Oil/Gas
518 Meyal 14P POL 02-Dec-89 Punjab 1467 13,026 Sakessar 06-Jan-91 Oil/Gas
519 Meyal 15 POL 31-Dec-91 Punjab 1489 12,847 INJ
520 Meyal 16 POL 08-Jul-96 Punjab 13,196 23-Mar-97 Oil
521 Meyal 17 POL 06-May-05 Punjab 13,661 Oil & Gas
522 Meyun Ismail 2 OGDC 02-Dec-91 Sindh 73 7,869 01-Mar-92 Oil
523 Meyun Ismail 3 OGDC 17-Aug-97 Sindh 7,976 29-Sep-97 Suspended
524 Meyun Ismail 4 OGDC 07-Aug-98 Sindh 7,526 22-Sep-98 Abandoned
525 Miano 2 OMV 17-Aug-94 Sindh 11,641 11-Dec-94 Gas
526 Miano 3 OMV 21-Dec-94 Sindh 11,352 16-Mar-95 Abandoned
527 Miano 4 OMV 22-Aug-96 Sindh 11,572 16-Oct-96 Abandoned
528 Miano 5 OMV 06-Jan-00 Sindh 216 11,155 07-Feb-00 Gas
529 Miano 6 OMV 06-Aug-02 Sindh 10,942 Lower Goru 05-Sep-02 Plugged & Susp.
530 Miano 7 OMV 02-Mar-03 Sindh 11,171 26-Apr-03 Gas
531 Miano 8 OMV 29-Jun-04 Sindh 11,358 Gas
532 Miano 9 OMV 07-Oct-05 Sindh 11,106 Lower Goru 04-Nov-05 Gas
533 Miano 10 OMV 12-Jan-06 Sindh 11,844 Lower Goru 17-Feb-06 Gas
534 Miano 11 OMV 31-May-07 Sindh 11,155 Gas
535 Muban 2 UTP 02-Dec-98 Sindh 771 08-Dec-98 Oil
536 Missri South 1 BP 08-Apr-08 Sindh 3,966 Suspended
537 Nakurji 2 BP 29-Dec-01 Sindh 50 6,063 Lower Goru 08-Jan-02 Gas
538 Nandpur 2 OGDC 05-Oct-84 Punjab 466 6,975 Kingriali 25-Dec-84 Gas
539 Nandpur 3 OGDC 17-Dec-85 Punjab 477 6,949 Kingriali 31-May-86 Gas
540 Nandpur 4 OGDC 02-Jul-86 Punjab 474 6,991 Kingriali 19-Oct-86 Gas
541 Nandpur 5 OGDC 17-Mar-87 Punjab 463 7,054 Kingriali 21-Jul-87 Gas
542 Nandpur 6 OGDC 12-Mar-91 Punjab 461 7,377 08-Jun-91 Gas
543 Nandpur 7 OGDC 08-May-92 Punjab 471 6,803 27-Jul-92 Gas
544 Nandpur 8 OGDC 23-Sep-92 Punjab 5,959 18-Nov-92 Gas
545 Nandpur 9 OGDCL 28-Mar-02 Punjab 467 6,496 Gas
546 Nandpur 10 OGDCL 29-Jun-08 Punjab 5,413 Drilling
547 Nari 2 UTP 27-Feb-86 Sindh 44 6,492 Lower Goru 27-Feb-86 Oil
548 Nari 3 UTP 01-Dec-93 Sindh 6,401 17-Dec-93 Gas
549 Pab 1 PPL 23-Apr-00 Baloch. 804 7,612 Gas
550 Pab 2 PPL 02-Dec-99 Baloch. 741 Gas
551 Paniro 3 UTP 28-Nov-89 Sindh 59 2,560 - 05-Dec-89 Abandoned
552 Paniro 4 UTP 29-Sep-96 Sindh 2,500 07-Oct-96 Abandoned
553 Paniro 5 UTP 14-Dec-98 Sindh 732 19-Dec-98 Oil
554 Paniro 6 UTP 25-Dec-98 Sindh 732 30-Dec-98 Oil
555 Paniro 7 UTP 08-Sep-99 Sindh 61 2,400 14-Sep-99 Oil
556 Panjpir 2 OGDC 25-Apr-85 Punjab 463 6,237 SUK 11-Jul-85 Gas
557 Panjpir 3 OGDC 27-Jan-86 Punjab 470 6,300 SUK 07-Apr-86 Gas
558 Panjpir 4 OGDC 03-May-86 Punjab 478 6,300 SUK 12-Jul-86 Gas
559 Panjpir 5 OGDC 08-Dec-96 Punjab 6,234 31-Jan-97 Suspended
560 Panjpir 6 OGDC 29-Mar-07 Punjab 7,123 Gas
561 Panjpir 7 OGDC 07-May-08 Punjab 5,404 Drilling
562 Pariwali 2 POL 20-Dec-97 Punjab 16,182 Oil
563 Pariwali 3 POL 22-Oct-99 Punjab 1213 Dhak Pass Oil/Gas
564 Pariwali 4 POL 09-May-01 Punjab 1791 16,329 Oil/Gas
565 Pariwali 5 POL 03-Jul-04 Punjab 16,201 Oil & Gas
566 Pariwali 6 POL 14-Jan-06 Punjab 15,725 Drilling
567 Pariwali 7 POL 23-Nov-07 Punjab 15,758 Drilling
568 Pasahki 2 OGDC 13-Jun-90 Sindh 73 7,062 - 22-Aug-90 Oil
569 Pasahki 3 OGDCL 18-Dec-97 Sindh 6,742 21-Mar-98 Oil
570 Pasahki 4 OGDCL 09-Dec-01 Sindh 78 6,916 Oil
571 Pasahki 5 OGDCL 07-May-08 Sindh 6,663 Gas/Cond.
572 Pindori 2 OXY 09-Mar-92 Punjab 1602 13,895 16-Nov-92 Oil
573 Pindori 3 POL 08-Oct-94 Punjab 13,557 15-Apr-95 Oil
574 Pindori 4 POL 18-Dec-98 Punjab 13,245 05-Jul-99 Oil&Gas
575 Pindori 5 POL 11-Jul-00 Punjab 1578 12,720 Plugged & Abandoned
576 Pindori 5A POL 21-Apr-02 Punjab 13,878 Oil
577 Pindori 6 POL 16-Sep-04 Punjab 14,275 Oil & Gas
578 Pindori 7 POL 16-Nov-07 Punjab 7,132 Drilling
579 Pindori WIW 1 POL 13-Jan-06 Punjab 14,215 Completed
580 Pindori WIW 2 POL 05-Apr-06 Punjab 7,556 Drilling
581 Pindori WIW 2A POL 31-Dec-06 Punjab 13,783 Drilling
582 Pir 2 UTP 11-Oct-96 Sindh 8,222 05-Nov-96 Gas
583 Pirkoh 2 OGDC 01-Sep-81 Baloch. 393 8,137 13-Aug-82 Abandoned
584 Pirkoh 4 OGDC 15-May-82 Baloch. 3553 8,167 04-Aug-83 Gas
585 Pirkoh 3 OGDC 08-Aug-82 Baloch. 3653 7,891 Mughal Kot 25-Dec-82 Gas
Note: Shaded area indicate wells drilled in current year Contd./...

APPRAISAL/DEVELOPMENT WELLS (Contd.)Sr. KBE TD Completion
No. Name No Operator Spud Date Province (Ft.) (Ft.) Zone/Formation Compln. Date Status
586 Pirkoh 2A OGDC 11-Mar-83 Baloch. 3667 7,888 Ranikot 17-Mar-84 Gas
587 Pirkoh 5 OGDC 23-Oct-83 Baloch. 3692 7,865 Ranikot 27-Feb-84 Gas
588 Pirkoh 6 OGDC 01-Mar-84 Baloch. 3626 7,891 Pab 10-Nov-84 Gas
589 Pirkoh 7 OGDC 01-Jun-84 Baloch. 3646 7,907 Ranikot 10-Aug-84 Gas
590 Pirkoh 8 OGDC 27-Oct-84 Baloch. 3576 8,038 05-Jan-85 Gas
591 Pirkoh 9 OGDC 10-Feb-85 Baloch. 3560 8,203 28-Apr-85 Gas
592 Pirkoh 10 OGDC 03-Jun-85 Baloch. 3601 7,874 15-Sep-85 Gas
593 Pirkoh 11 OGDC 04-Nov-85 Baloch. 3484 7,399 16-Mar-86 Gas
594 Pirkoh 12 OGDC 30-Mar-86 Baloch. 3479 7,878 06-Jul-86 Gas
595 Pirkoh 13 OGDC 26-Jul-86 Baloch. 3470 7,710 Ranikot 23-May-87 Gas
596 Pirkoh 16 OGDC 25-Sep-86 Baloch. 3361 8,075 Ranikot 27-Feb-87 Gas
597 Pirkoh 15 OGDC 22-Dec-86 Baloch. 3210 8,961 Ranikot 12-May-87 Gas
598 Pirkoh 14 OGDC 02-May-87 Baloch. 3395 8,954 Ranikot 01-Sep-87 Gas
599 Pirkoh 17 OGDC 22-May-87 Baloch. 3342 7,831 16-Jul-87 Gas
600 Pirkoh 18 OGDC 31-Jul-87 Baloch. 2974 8,774 15-Sep-87 Gas
601 Pirkoh 19 OGDC 25-Sep-87 Baloch. 3501 8,971 15-Dec-87 Gas
602 Pirkoh 21 OGDC 04-Oct-87 Baloch. 3542 9,049 11-Dec-87 Gas
603 Pirkoh 20 OGDC 31-Dec-87 Baloch. 3638 9,125 15-Apr-88 Gas
604 Pirkoh 23 OGDC 03-Mar-88 Baloch. 3513 8,965 03-May-88 Gas
605 Pirkoh 24 OGDC 04-May-88 Baloch. 3552 7,809 Ranikot 20-Jun-88 Gas
606 Pirkoh 22 OGDC 10-May-88 Baloch. 3399 8,847 15-Jun-88 Gas
607 Pirkoh 26 OGDC 26-Jun-88 Baloch. 3271 8,862 19-Aug-88 Gas
608 Pirkoh 25 OGDC 09-Jul-88 Baloch. 3338 8,843 25-Aug-88 Gas
609 Pirkoh 27 OGDC 30-Aug-88 Baloch. 3523 7,707 Ranikot 19-Nov-88 Gas
610 Pirkoh 28 OGDC 16-Sep-88 Baloch. 3617 7,874 Ranikot 08-Jan-89 Gas
611 Pirkoh 29 OGDC 26-Nov-88 Baloch. 3301 2,118 04-Jan-89 Abandoned
612 Pirkoh 31 OGDC 18-Jan-89 Baloch. 2994 7,038 Pab 20-Mar-89 Gas
613 Pirkoh 30 OGDC 01-Feb-89 Baloch. 3626 7,763 28-Jun-89 Gas
614 Pirkoh 29A OGDC 03-Apr-89 Baloch. 3310 7,563 Ranikot 01-Sep-89 Gas
615 Pirkoh 32 OGDC 01-Jul-89 Baloch. 3513 1,648 23-Nov-89 Abandoned
616 Pirkoh 33 OGDC 29-Nov-89 Baloch. 2896 8,393 11-Feb-90 Gas
617 Pirkoh 34 OGDC 12-Dec-89 Baloch. 3487 9,049 26-Jun-90 Gas
618 Pirkoh 35 OGDC 23-Feb-90 Baloch. 2604 8,256 12-Apr-90 Gas
619 Pirkoh 36 OGDC 24-Apr-90 Baloch. 2798 6,993 06-Jun-90 Gas
620 Pirkoh 37 OGDC 25-Jun-90 Baloch. 3632 6,918 19-Aug-90 Gas
621 Pirkoh 32A OGDC 14-Jul-90 Baloch. 3512 7,869 L RAN/PAB 26-Oct-90 Gas
622 Pirkoh 38 OGDC 04-Sep-90 Baloch. 2820 7,085 15-Oct-90 Gas
623 Pirkoh 39 OGDC 31-Oct-90 Baloch. 2791 6,787 L RAN/PAB 02-Dec-91 Gas
624 Pirkoh 40 OGDC 26-Nov-90 Baloch. 3307 7,878 Ranikot 12-Jan-91 Gas
625 Pirkoh 41 OGDC 12-Dec-90 Baloch. 3222 6,885 07-Jan-91 Gas
626 Pirkoh 42 OGDC 24-Jan-91 Baloch. 3288 7,377 23-Feb-91 Gas
627 Pirkoh 43 OGDC 25-Feb-91 Baloch. 3310 7,869 06-May-91 Gas
628 Pirkoh 44-A OGDC 09-Jun-91 Baloch. 7,189 12-Aug-91 Gas
629 Pirkoh 45 OGDC 05-Jun-91 Baloch. 3243 7,869 24-Aug-91 Gas
630 Pirkoh 44 OGDC 11-May-91 Baloch. 2656 7,184 24-Aug-91 Gas
631 Pirkoh 46 OGDC 26-Aug-91 Baloch. 2397 6,659 11-Oct-91 Gas
632 Pirkoh 47 OGDC 03-Oct-91 Baloch. 2758 7,049 17-Nov-91 Gas
633 Pirkoh 48 OGDC 23-Oct-91 Baloch. 3026 7,377 18-Dec-91 Gas
634 Pirkoh 49 OGDC 14-Dec-91 Baloch. 3379 7,807 04-Feb-92 Gas
635 Pirkoh 50 OGDC 04-Jan-92 Baloch. 3361 7,639 25-Feb-92 Gas
636 Pirkoh 51 OGDC 13-Mar-92 Baloch. 3109 7,610 08-May-92 Gas
637 Pirkoh 52 OGDC 26-Mar-92 Baloch. 3233 7,538 20-May-92 Gas
638 Pirkoh 53 OGDC 09-Jun-92 Baloch. 2272 6,607 01-Aug-92 Gas
639 Qadirpur 2 OGDC 05-Apr-90 Sindh 249 4,622 Sui Main Ls. 18-May-90 Gas
640 Qadirpur 3 OGDC 24-Apr-91 Sindh 259 4,607 04-Jun-91 Gas
641 Qadirpur 4 OGDC 20-May-91 Sindh 261 4,607 18-Jun-91 Gas
642 Qadirpur 5 OGDC 15-Jan-93 Sindh 4,662 04-Mar-93 Gas
643 Qadirpur 6 OGDC 22-May-93 Sindh 4,626 08-Jul-93 Gas
644 Qadirpur Water 1 OGDC 26-Oct-94 Sindh 2,297 14-Nov-94 Water Injection
645 Qadirpur Water 2 OGDC 29-Nov-94 Sindh 2,297 16-Dec-94 Water Injection
646 Qadirpur 7 OGDC 09-Jan-95 Sindh 4,577 24-Feb-95 Gas
647 Qadirpur 8 OGDC 15-Jan-95 Sindh 6,263 25-Feb-95 Gas
648 Qadirpur 9 OGDC 11-Mar-95 Sindh 4,577 11-May-95 Gas
649 Qadirpur 10 OGDC 16-Mar-95 Sindh 4,554 07-May-95 Gas
650 Qadirpur 11 OGDC 08-Apr-95 Sindh 4,613 09-Jun-95 Gas
651 Qadirpur 12 OGDC 19-Apr-95 Sindh 6,116 19-Jun-95 Gas
652 Qadirpur 13 OGDC 18-Nov-95 Sindh 4,531 08-Jan-96 Gas
653 Qadirpur 14 OGDC 25-Nov-95 Sindh 6,122 29-Jan-96 Gas
654 Qadirpur 15 OGDC 03-Mar-96 Sindh 5,863 15-Jun-96 Gas
655 Qadirpur 16 OGDC 05-Jan-97 Sindh 4,528 11-Mar-97 Gas
656 Qadirpur 17 OGDCL 04-Mar-98 Sindh 4,593 04-May-98 Suspended
657 Qadirpur 19 OGDCL 23-Jun-00 Sindh 261 5,755 Gas
658 Qadirpur 18 OGDCL 03-Oct-01 Sindh 271 6,286 Plugged & Abandoned
659 Qadirpur 21 OGDCL 30-Jun-03 Sindh 5,538 Gas
Note: Shaded area indicate wells drilled in current year Contd./...
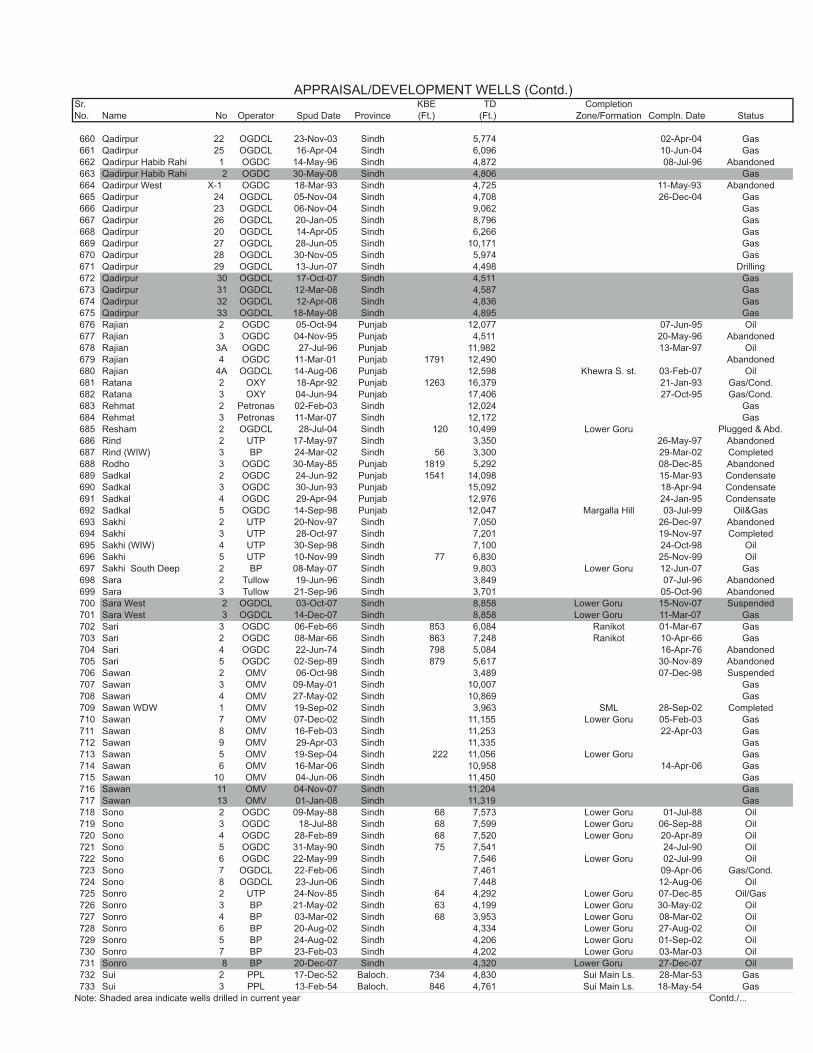
APPRAISAL/DEVELOPMENT WELLS (Contd.)Sr. KBE TD Completion
No. Name No Operator Spud Date Province (Ft.) (Ft.) Zone/Formation Compln. Date Status
660 Qadirpur 22 OGDCL 23-Nov-03 Sindh 5,774 02-Apr-04 Gas
661 Qadirpur 25 OGDCL 16-Apr-04 Sindh 6,096 10-Jun-04 Gas
662 Qadirpur Habib Rahi 1 OGDC 14-May-96 Sindh 4,872 08-Jul-96 Abandoned
663 Qadirpur Habib Rahi 2 OGDC 30-May-08 Sindh 4,806 Gas
664 Qadirpur West X-1 OGDC 18-Mar-93 Sindh 4,725 11-May-93 Abandoned
665 Qadirpur 24 OGDCL 05-Nov-04 Sindh 4,708 26-Dec-04 Gas
666 Qadirpur 23 OGDCL 06-Nov-04 Sindh 9,062 Gas
667 Qadirpur 26 OGDCL 20-Jan-05 Sindh 8,796 Gas
668 Qadirpur 20 OGDCL 14-Apr-05 Sindh 6,266 Gas
669 Qadirpur 27 OGDCL 28-Jun-05 Sindh 10,171 Gas
670 Qadirpur 28 OGDCL 30-Nov-05 Sindh 5,974 Gas
671 Qadirpur 29 OGDCL 13-Jun-07 Sindh 4,498 Drilling
672 Qadirpur 30 OGDCL 17-Oct-07 Sindh 4,511 Gas
673 Qadirpur 31 OGDCL 12-Mar-08 Sindh 4,587 Gas
674 Qadirpur 32 OGDCL 12-Apr-08 Sindh 4,836 Gas
675 Qadirpur 33 OGDCL 18-May-08 Sindh 4,895 Gas
676 Rajian 2 OGDC 05-Oct-94 Punjab 12,077 07-Jun-95 Oil
677 Rajian 3 OGDC 04-Nov-95 Punjab 4,511 20-May-96 Abandoned
678 Rajian 3A OGDC 27-Jul-96 Punjab 11,982 13-Mar-97 Oil
679 Rajian 4 OGDC 11-Mar-01 Punjab 1791 12,490 Abandoned
680 Rajian 4A OGDCL 14-Aug-06 Punjab 12,598 Khewra S. st. 03-Feb-07 Oil
681 Ratana 2 OXY 18-Apr-92 Punjab 1263 16,379 21-Jan-93 Gas/Cond.
682 Ratana 3 OXY 04-Jun-94 Punjab 17,406 27-Oct-95 Gas/Cond.
683 Rehmat 2 Petronas 02-Feb-03 Sindh 12,024 Gas
684 Rehmat 3 Petronas 11-Mar-07 Sindh 12,172 Gas
685 Resham 2 OGDCL 28-Jul-04 Sindh 120 10,499 Lower Goru Plugged & Abd.
686 Rind 2 UTP 17-May-97 Sindh 3,350 26-May-97 Abandoned
687 Rind (WIW) 3 BP 24-Mar-02 Sindh 56 3,300 29-Mar-02 Completed
688 Rodho 3 OGDC 30-May-85 Punjab 1819 5,292 08-Dec-85 Abandoned
689 Sadkal 2 OGDC 24-Jun-92 Punjab 1541 14,098 15-Mar-93 Condensate
690 Sadkal 3 OGDC 30-Jun-93 Punjab 15,092 18-Apr-94 Condensate
691 Sadkal 4 OGDC 29-Apr-94 Punjab 12,976 24-Jan-95 Condensate
692 Sadkal 5 OGDC 14-Sep-98 Punjab 12,047 Margalla Hill 03-Jul-99 Oil&Gas
693 Sakhi 2 UTP 20-Nov-97 Sindh 7,050 26-Dec-97 Abandoned
694 Sakhi 3 UTP 28-Oct-97 Sindh 7,201 19-Nov-97 Completed
695 Sakhi (WIW) 4 UTP 30-Sep-98 Sindh 7,100 24-Oct-98 Oil
696 Sakhi 5 UTP 10-Nov-99 Sindh 77 6,830 25-Nov-99 Oil
697 Sakhi South Deep 2 BP 08-May-07 Sindh 9,803 Lower Goru 12-Jun-07 Gas
698 Sara 2 Tullow 19-Jun-96 Sindh 3,849 07-Jul-96 Abandoned
699 Sara 3 Tullow 21-Sep-96 Sindh 3,701 05-Oct-96 Abandoned
700 Sara West 2 OGDCL 03-Oct-07 Sindh 8,858 Lower Goru 15-Nov-07 Suspended
701 Sara West 3 OGDCL 14-Dec-07 Sindh 8,858 Lower Goru 11-Mar-07 Gas
702 Sari 3 OGDC 06-Feb-66 Sindh 853 6,084 Ranikot 01-Mar-67 Gas
703 Sari 2 OGDC 08-Mar-66 Sindh 863 7,248 Ranikot 10-Apr-66 Gas
704 Sari 4 OGDC 22-Jun-74 Sindh 798 5,084 16-Apr-76 Abandoned
705 Sari 5 OGDC 02-Sep-89 Sindh 879 5,617 30-Nov-89 Abandoned
706 Sawan 2 OMV 06-Oct-98 Sindh 3,489 07-Dec-98 Suspended
707 Sawan 3 OMV 09-May-01 Sindh 10,007 Gas
708 Sawan 4 OMV 27-May-02 Sindh 10,869 Gas
709 Sawan WDW 1 OMV 19-Sep-02 Sindh 3,963 SML 28-Sep-02 Completed
710 Sawan 7 OMV 07-Dec-02 Sindh 11,155 Lower Goru 05-Feb-03 Gas
711 Sawan 8 OMV 16-Feb-03 Sindh 11,253 22-Apr-03 Gas
712 Sawan 9 OMV 29-Apr-03 Sindh 11,335 Gas
713 Sawan 5 OMV 19-Sep-04 Sindh 222 11,056 Lower Goru Gas
714 Sawan 6 OMV 16-Mar-06 Sindh 10,958 14-Apr-06 Gas
715 Sawan 10 OMV 04-Jun-06 Sindh 11,450 Gas
716 Sawan 11 OMV 04-Nov-07 Sindh 11,204 Gas
717 Sawan 13 OMV 01-Jan-08 Sindh 11,319 Gas
718 Sono 2 OGDC 09-May-88 Sindh 68 7,573 Lower Goru 01-Jul-88 Oil
719 Sono 3 OGDC 18-Jul-88 Sindh 68 7,599 Lower Goru 06-Sep-88 Oil
720 Sono 4 OGDC 28-Feb-89 Sindh 68 7,520 Lower Goru 20-Apr-89 Oil
721 Sono 5 OGDC 31-May-90 Sindh 75 7,541 24-Jul-90 Oil
722 Sono 6 OGDC 22-May-99 Sindh 7,546 Lower Goru 02-Jul-99 Oil
723 Sono 7 OGDCL 22-Feb-06 Sindh 7,461 09-Apr-06 Gas/Cond.
724 Sono 8 OGDCL 23-Jun-06 Sindh 7,448 12-Aug-06 Oil
725 Sonro 2 UTP 24-Nov-85 Sindh 64 4,292 Lower Goru 07-Dec-85 Oil/Gas
726 Sonro 3 BP 21-May-02 Sindh 63 4,199 Lower Goru 30-May-02 Oil
727 Sonro 4 BP 03-Mar-02 Sindh 68 3,953 Lower Goru 08-Mar-02 Oil
728 Sonro 6 BP 20-Aug-02 Sindh 4,334 Lower Goru 27-Aug-02 Oil
729 Sonro 5 BP 24-Aug-02 Sindh 4,206 Lower Goru 01-Sep-02 Oil
730 Sonro 7 BP 23-Feb-03 Sindh 4,202 Lower Goru 03-Mar-03 Oil
731 Sonro 8 BP 20-Dec-07 Sindh 4,320 Lower Goru 27-Dec-07 Oil
732 Sui 2 PPL 17-Dec-52 Baloch. 734 4,830 Sui Main Ls. 28-Mar-53 Gas
733 Sui 3 PPL 13-Feb-54 Baloch. 846 4,761 Sui Main Ls. 18-May-54 Gas
Note: Shaded area indicate wells drilled in current year Contd./...

APPRAISAL/DEVELOPMENT WELLS (Contd.)Sr. KBE TD Completion
No. Name No Operator Spud Date Province (Ft.) (Ft.) Zone/Formation Compln. Date Status
734 Sui 4 PPL 23-May-54 Baloch. 726 4,853 Sui Main Ls. 21-Aug-54 Gas
735 Sui 5 PPL 24-Jul-54 Baloch. 758 4,752 Sui Main Ls. 03-Sep-54 Gas
736 Sui 6 PPL 18-Sep-54 Baloch. 662 4,744 Sui Main Ls. 23-Oct-54 Gas
737 Sui 7 PPL 03-May-60 Baloch. 777 4,452 Sui Main Ls. 28-Jul-60 Gas
738 Sui 8 PPL 15-Aug-64 Baloch. 732 4,520 Sui Main Ls. 06-Oct-64 Gas
739 Sui 9 PPL 30-Oct-64 Baloch. 748 4,452 Sui Main Ls. 26-Jan-65 Gas
740 Sui 10 PPL 07-Apr-65 Baloch. 830 4,400 Sui Main Ls. 29-Jun-65 Gas
741 Sui 11 PPL 14-Jul-65 Baloch. 870 4,445 Sui Main Ls. 06-Sep-65 Gas
742 Sui 12 PPL 15-Jun-66 Baloch. 858 4,415 Sui Main Ls. 15-Aug-66 Gas
743 Sui 13 PPL 02-Sep-66 Baloch. 753 4,355 Habib Rahi Ls. 21-Nov-66 Gas
744 Sui 14 PPL 04-Jan-68 Baloch. 736 4,330 Sui Main Ls. 16-Feb-68 Gas
745 Sui 15 PPL 05-May-68 Baloch. 774 4,326 17-Jun-68 Gas
746 Sui 16 PPL 28-Feb-70 Baloch. 595 4,875 Sui Main Ls. 15-Apr-70 Gas
747 Sui 17 PPL 26-Apr-71 Baloch. 729 4,480 27-May-71 Gas
748 Sui 18 PPL 06-Nov-73 Baloch. 770 4,338 28-Dec-73 Gas
749 Sui 19 PPL 04-Feb-74 Baloch. 739 4,373 15-Mar-74 Gas
750 Sui 20 PPL 10-Nov-75 Baloch. 854 4,606 Sui Main Ls. 23-Jan-76 Gas
751 Sui 21 PPL 26-Feb-76 Baloch. 805 4,555 Sui Main Ls. 26-Apr-76 Gas
752 Sui 22 PPL 01-Oct-76 Baloch. 810 4,920 Sui Main Ls. 17-Jan-77 Gas
753 Sui 23 PPL 08-Feb-77 Baloch. 803 4,913 Sui Main Ls. 12-Jun-77 Gas
754 Sui 24 PPL 15-Mar-79 Baloch. 812 4,562 Sui Main Ls. 20-Apr-79 Gas
755 Sui 25 PPL 20-Feb-80 Baloch. 758 4,916 Sui Main Ls. 01-Apr-80 Gas
756 Sui 26 PPL 15-May-80 Baloch. 777 4,934 Sui Main Ls. 19-Jul-80 Gas
757 Sui 27 PPL 06-Oct-80 Baloch. 845 5,155 Sui Main Ls. 07-Nov-80 Gas
758 Sui 28 PPL 09-Feb-81 Baloch. 587 6,229 Sui Main Ls. 02-Apr-81 Gas
759 Sui 29 PPL 19-May-81 Baloch. 807 5,463 Sui Main Ls. 26-Jun-81 Gas
760 Sui 30 PPL 19-Aug-81 Baloch. 836 5,266 Sui Main Ls. 28-Sep-81 Gas
761 Sui 31 PPL 16-Nov-81 Baloch. 794 5,318 Sui Main Ls. 07-Jan-82 Gas
762 Sui 32 PPL 15-Feb-82 Baloch. 728 5,281 Sui Main Ls. 06-Apr-82 Gas
763 Sui 33 PPL 05-Jun-82 Baloch. 746 5,267 Sui Main Ls. 09-Aug-82 Gas
764 Sui 34 PPL 07-Oct-82 Baloch. 806 5,351 Sui Main Ls. 13-Dec-82 Gas
765 Sui 35 PPL 28-Jan-83 Baloch. 806 5,402 Sui Main Ls. 16-Apr-83 Gas
766 Sui 37 PPL 24-Jun-83 Baloch. 813 5,320 Sui Main Ls. 27-Aug-83 Gas
767 Sui 36 PPL 06-Jul-83 Baloch. 810 6,578 Sui Main Ls. 15-Oct-83 Gas
768 Sui 38 PPL 26-Aug-83 Baloch. 828 4,641 Sui Main Ls. 23-Sep-83 Gas
769 Sui 40 PPL 06-Oct-83 Baloch. 773 4,933 Sui Main Ls. 22-Nov-83 Gas
770 Sui 42 PPL 19-Dec-83 Baloch. 798 4,956 Sui Main Ls. 30-Jan-84 Gas
771 Sui 43 PPL 09-Feb-84 Baloch. 728 4,728 Sui Main Ls. 09-May-84 Gas
772 Sui 39 PPL 03-Mar-84 Baloch. 831 4,989 Sui Main Ls. 13-Apr-84 Gas
773 Sui 45 PPL 25-May-84 Baloch. 708 4,523 Sui Main Ls. 03-Jul-84 Gas
774 Sui 41 PPL 07-Jun-84 Baloch. 716 4,874 Sui Main Ls. 25-Jul-84 Gas
775 Sui 44 PPL 15-Jul-84 Baloch. 683 4,496 Sui Main Ls. 15-Aug-84 Gas
776 Sui 47 PPL 26-Aug-84 Baloch. 598 4,757 Sui Main Ls. 27-Sep-84 Gas
777 Sui 46 PPL 13-Sep-84 Baloch. 656 4,815 Sui Main Ls. 18-Oct-84 Gas
778 Sui 48 PPL 07-Oct-84 Baloch. 678 4,513 Sui Main Ls. 15-Nov-84 Gas
779 Sui 49 PPL 26-Nov-84 Baloch. 670 4,478 Sui Main Ls. 22-Dec-84 Gas
780 Sui 52 PPL 06-Dec-84 Baloch. 805 4,724 Sui Main Ls. 14-Jan-85 Gas
781 Sui 51 PPL 04-Jan-85 Baloch. 697 4,511 Sui Main Ls. 08-Feb-85 Gas
782 Sui 54 PPL 18-Feb-85 Baloch. 805 4,617 Sui Main Ls. 12-Mar-85 Gas
783 Sui 55 PPL 10-Mar-85 Baloch. 853 4,665 Sui Main Ls. 17-Apr-85 Gas
784 Sui 53 PPL 24-Mar-85 Baloch. 837 4,205 Sui Main Ls. 15-Apr-85 Gas
785 Sui 57 PPL 30-Apr-85 Baloch. 817 4,977 Sui Main Ls. 13-Jun-85 Gas
786 Sui 50 PPL 01-May-85 Baloch. 841 4,088 Sui Upper Ls. 02-Jul-85 Gas
787 Sui 59 PPL 29-Jun-85 Baloch. 782 4,596 Sui Main Ls. 23-Jul-85 Gas
788 Sui 58 PPL 28-Jul-85 Baloch. 753 4,567 Sui Main Ls. 12-Sep-85 Gas
789 Sui 60 PPL 05-Aug-85 Baloch. 822 4,636 Sui Main Ls. 15-Sep-85 Gas
790 Sui 61 PPL 23-Sep-85 Baloch. 667 4,482 Sui Main Ls. 21-Oct-85 Gas
791 Sui 56 PPL 30-Sep-85 Baloch. 783 4,268 Sui Main Ls. 03-Nov-85 Gas
792 Sui 62 PPL 05-Nov-85 Baloch. 767 4,928 Sui Main Ls. 08-Dec-85 Gas
793 Sui 63 PPL 21-Nov-85 Baloch. 831 4,990 Sui Main Ls. 07-Jan-86 Gas
794 Sui 64 PPL 21-Dec-85 Baloch. 741 4,892 Sui Main Ls. 26-Jan-86 Gas
795 Sui 65 PPL 30-Jan-86 Baloch. 886 5,046 Sui Main Ls. 22-Mar-86 Gas
796 Sui 66 PPL 02-Feb-86 Baloch. 808 4,967 Sui Main Ls. 10-Mar-86 Gas
797 Sui 67 PPL 22-Mar-86 Baloch. 757 4,921 Sui Main Ls. 20-Apr-86 Gas
798 Sui 69 PPL 16-Apr-86 Baloch. 805 4,372 Sui Main Ls. 25-May-86 Gas
799 Sui 70 PPL 04-Jun-86 Baloch. 782 4,941 Sui Main Ls. 03-Jul-86 Gas
800 Sui 68 PPL 14-Jun-86 Baloch. 822 4,098 Sui Main Ls. 02-Aug-86 Gas
801 Sui 71 PPL 11-Jul-86 Baloch. 801 4,261 Sui Upper Ls. 08-Aug-86 Gas
802 Sui 73 PPL 17-Aug-86 Baloch. 631 4,173 Sui Upper Ls. 11-Sep-86 Gas
803 Sui 72 PPL 10-Sep-86 Baloch. 687 4,145 Sui Upper Ls. 13-Oct-86 Gas
804 Sui 74 PPL 22-Sep-86 Baloch. 727 4,320 Sui Upper Ls. 15-Oct-86 Gas
805 Sui 76 PPL 27-Oct-86 Baloch. 587 4,194 Sui Upper Ls. 18-Nov-86 Gas
806 Sui 75 PPL 06-Nov-86 Baloch. 727 4,372 Sui Upper Ls. 09-Dec-86 Gas
807 Sui 77 PPL 25-Feb-87 Baloch. 735 4,895 Sui Upper Ls. 30-Jul-87 Gas
Note: Shaded area indicate wells drilled in current year Contd./...

APPRAISAL/DEVELOPMENT WELLS (Contd.)Sr. KBE TD Completion
No. Name No Operator Spud Date Province (Ft.) (Ft.) Zone/Formation Compln. Date Status
808 Sui 78 PPL 13-Nov-87 Baloch. 542 4,091 Sui Upper Ls. 04-Dec-87 Gas
809 Sui 79 PPL 24-Mar-88 Baloch. 727 4,193 Sui Upper Ls. 17-Apr-88 Gas810 Sui 80 PPL 01-Aug-88 Baloch. 732 4,180 Sui Upper Ls. 01-Nov-88 Gas
811 Sui 81 PPL 18-Feb-89 Baloch. 722 4,267 Sui Upper Ls. 23-Mar-89 Gas
812 Sui 82 PPL 06-May-89 Baloch. 679 4,255 Sui Upper Ls. 28-May-89 Gas
813 Sui 83 PPL 03-Jul-89 Baloch. 722 4,104 Sui Upper Ls. 28-Jul-89 Gas
814 Sui 84 PPL 18-Nov-89 Baloch. 657 4,360 Sui Upper Ls. 17-Dec-89 Gas
815 Sui 85 PPL 01-Feb-90 Baloch. 710 4,167 Sui Upper Ls. 26-Feb-90 Gas
816 Sui 86 PPL 23-May-90 Baloch. 762 4,254 Sui Upper Ls. 26-Dec-90 Gas
817 Sui Effluent 1 PPL 08-Aug-01 Baloch. 753 1,243 Dozkushtak 27-Aug-01 Completed as SWD
818 Suri 2 Tullow 09-Jan-02 Sindh 252 4,035 Gas
819 Tajedi 2 UTP 27-Oct-84 Sindh 38 6,015 Lower Goru 24-Nov-84 Oil
820 Tando Alam 5 OGDC 13-Jul-85 Sindh 69 7,940 Lower Goru 04-Sep-85 Oil
821 Tando Alam 2 OGDC 17-Jul-84 Sindh 79 7,546 21-Oct-84 Oil
822 Tando Alam 4 OGDC 29-Apr-85 Sindh 70 7,704 Lower Goru 29-Jun-85 Oil
823 Tando Alam 7 OGDC 13-Oct-85 Sindh 68 7,720 Lower Goru 10-Dec-85 Oil
824 Tando Alam 6 OGDC 24-Dec-85 Sindh 69 8,206 Lower Goru 03-Mar-86 Oil
825 Tando Alam 3 OGDC 24-Dec-84 Sindh 72 7,645 04-Apr-85 Oil
826 Tando Alam 11 OGDC 05-Oct-86 Sindh 68 7,720 09-Nov-86 Abandoned
827 Tando Alam 13 OGDC 21-Jan-87 Sindh 69 8,285 26-Feb-87 Abandoned
828 Tando Alam 10 OGDC 12-Aug-86 Sindh 70 7,891 05-May-86 Abandoned
829 Tando Alam 14 OGDC 05-Apr-87 Sindh 72 8,088 16-May-87 Abandoned
830 Tando Alam 8 OGDC 16-Mar-86 Sindh 68 7,792 Lower Goru 05-Jun-86 Oil
831 Tando Alam 12 OGDC 15-Jan-87 Sindh 70 7,858 Lower Goru 19-Mar-87 Oil
832 Tando Alam 15 OGDC 29-Jul-90 Sindh 70 7,426 Lower Goru 16-Feb-91 Abandoned
833 Tando Alam 9 OGDC 17-Jun-86 Sindh 70 8,203 Lower Goru 28-Jul-86 Oil
834 Tando Alam 17 OGDC 13-Jun-07 Sindh 2,720 Drilling
835 Tando Alam 16 OGDC 20-Jun-07 Sindh 7,953 Drilling
836 Tando Alam 16A OGDC 13-Mar-08 Sindh 7,874 Gas/Cond.
837 Tando Alam 18 OGDC 14-Jun-07 Sindh 7,874 Oil & Gas
838 Tando Alam 20 OGDC 23-Jun-07 Sindh 7,884 Oil & Gas
839 Tando Alam 19 OGDC 27-Jun-07 Sindh 2,986 Drilling
840 Tando Allahyar 2 OGDCL 22-Jun-98 Sindh 2,818 Gas
841 Tando Allahyar 3 OGDCL 22-May-99 Sindh 5,249 Lower Goru 20-Jun-99 Oil
842 Tando Allahyar 4 OGDCL 14-Sep-99 Sindh 69 5,518 Lower Goru 10-Oct-99 Oil
843 Tando Ghulam Ali 2 UTP 14-Jan-90 Sindh 63 5,363 _ 24-Jan-90 Gas
844 Tangri 3 UTP 01-Jun-95 Sindh 7,651 22-Jun-95 Oil
845 Tangri 4 UTP 20-Jan-96 Sindh 7,632 18-Feb-96 Oil
846 Tangri 5 UTP 07-Mar-96 Sindh 7,776 14-Apr-96 Abandoned
847 Tangri 6 UTP 28-Jul-97 Sindh 7,388 27-Oct-97 Oil
848 Tangri 7 UTP 19-Sep-00 Sindh 78 7,430 04-Oct-00 Oil
849 Tangri 8 UTP 23-Apr-00 Sindh 70 7,620 16-May-00 Water Inj.
850 Tangri (WIW) 9 UTP 21-Jun-01 Sindh 7,904 Inj.
851 Tangri 10 UTP 14-Aug-01 Sindh 77 7,552 Lower Goru 22-Aug-01 Completed as WIW
852 Tangri 11 UTP 19-Jul-01 Sindh 7,418 Oil
853 Tangri 12 BP 12-Aug-05 Sindh 7,494 Lower Goru 23-Aug-05 Oil
854 Thora 4 OGDC 14-Apr-89 Sindh 75 6,907 24-May-89 Oil
855 Thora 5 OGDC 28-Dec-06 Sindh 7,251 Lower Goru 03-Feb-07 Temp. suspended
856 Thora 6 OGDC 26-May-07 Sindh 6,759 Gas/Condensate
857 Thora 7 OGDC 28-Jun-08 Sindh 6,795 Drilling
858 Thora 2 OGDC 01-Nov-87 Sindh 82 7,448 07-Dec-87 Oil
859 Thora 3 OGDC 03-Aug-88 Sindh 66 6,975 21-Oct-88 Oil
860 Thora Deep 2 OGDC 22-May-08 Sindh 9,970 Drilling
861 Thora WDW 1 OGDCL 06-Dec-04 Sindh 75 3,274 Completed as WDW
862 Toot 2 OGDC 17-Feb-68 Punjab 1158 16,092 19-Mar-70 Abandoned
863 Toot 3 OGDC 15-Feb-70 Punjab 1103 7,226 01-Jul-70 JKD
864 Toot 4 OGDC 24-Oct-70 Punjab 1103 14,626 Datta 10-Jul-72 Oil
865 Toot 5 OGDC 17-Oct-72 Punjab 1076 14,617 Datta 13-Feb-74 Oil
866 Toot 6 OGDC 15-May-74 Punjab 1100 14,879 Datta 10-Mar-76 Oil
867 Toot 7 OGDC 02-Jan-77 Punjab 1068 15,306 Kingriali 17-Jun-78 Oil
868 Toot 9 OGDC 29-Jan-78 Punjab 1121 15,191 CSD 30-Mar-79 Oil
869 Toot 8 OGDC 02-Apr-78 Punjab 1078 13,693 Sakessar 13-Aug-79 JKD
870 Toot 10 OGDC 11-Jun-78 Punjab 1072 14,144 Lockhart 05-Aug-79 JKD
871 Toot 10A OGDC 12-Sep-79 Punjab 1072 15,076 Datta 11-Sep-80 Oil
872 Toot 11 OGDC 14-Jan-80 Punjab 951 14,994 Sakessar 27-Jan-82 Oil
873 Toot 12 OGDC 15-Nov-80 Punjab 1140 14,863 Datta 12-Feb-82 Oil
874 Toot 13 OGDC 04-Jun-81 Punjab 1010 11,195 Murree 05-Apr-82 Abandoned
875 Toot 14 OGDC 10-Mar-82 Punjab 1075 14,771 Datta 06-Jan-83 Oil
876 Toot 15 OGDC 24-Apr-82 Punjab 1099 14,883 Datta 01-Dec-82 Oil
877 Toot 16 OGDC 28-Dec-82 Punjab 1043 14,889 Datta 11-Jan-84 Oil
878 Toot 17 OGDC 18-Feb-83 Punjab 1120 14,824 Datta 08-Jan-84 Oil
879 Toot 18 OGDC 14-Nov-83 Punjab 1108 15,109 Datta 08-Jul-84 Oil
880 Toot 19 OGDC 31-Aug-84 Punjab 1072 8,567 Sakessar 25-Aug-86 Oil
881 Toot 1A OGDC 07-Feb-01 Punjab 1053 15,039 31-Dec-01 Suspended
Note: Shaded area indicate wells drilled in current year Contd./...

APPRAISAL/DEVELOPMENT WELLS (Contd.)Sr. KBE TD Completion
No. Name No Operator Spud Date Province (Ft.) (Ft.) Zone/Formation Compln. Date Status
882 Turk 2 UTP 11-Jan-86 Sindh 46 6,650 Lower Goru 26-Feb-86 Oil/Gas
883 Turk 3 UTP 24-Oct-86 Sindh 50 6,670 Lower Goru 13-Nov-86 Oil/Gas
884 Turk 4 UTP 07-Jul-87 Sindh 52 6,990 Lower Goru 07-Aug-87 Gas
885 Turk 5 UTP 19-May-88 Sindh 53 11,053 Lower Goru 30-Jul-88 Gas
886 Turk 6 UTP 15-Aug-91 Sindh 60 6,800 02-Sep-91 Oil/Gas
887 Turk SWD 1 UTP 11-Mar-96 Sindh 1,506 20-Mar-96 Water Inj.
888 Turk Deep 1 UTP 30-Sep-94 Sindh 10,850 29-Nov-94 Gas
889 Turk Deep 2 UTP 23-Jul-00 Sindh 56 8,510 Lower Goru 05-Sep-00 Gas
890 Turk Deep 3 BP 20-Nov-03 Sindh 10,226 21-Jan-04 Gas
891 Uch 2 OGDC 16-Jul-87 Baloch. 318 4,748 Sui Main Ls. 09-Dec-87 Gas
892 Uch 3 OGDC 07-Mar-88 Baloch. 387 6,027 Sui Main Ls. 24-May-88 Gas
893 Uch 4 OGDC 27-Aug-88 Baloch. 325 6,149 08-Oct-88 Abandoned
894 Uch 5 OGDC 28-Nov-88 Baloch. 378 5,004 31-Dec-88 Abandoned
895 Uch 6 OGDC 28-Feb-89 Baloch. 479 5,994 Sui Main Ls. 05-Jun-89 Gas
896 Uch 7 OGDC 18-Jul-92 Baloch. 4,659 29-Oct-92 Gas
897 Uch 8 OGDC 28-Dec-92 Baloch. 4,718 27-Feb-93 Gas
898 Uch 9 OGDC 18-May-94 Baloch. 4,620 18-Aug-94 Gas
899 Uch 10 OGDC 16-Oct-94 Baloch. 4,541 01-Dec-94 Gas
900 Uch 11 OGDC 06-Dec-95 Baloch. 4,593 04-Jan-96 Gas
901 Uch 14 OGDC 23-Jan-96 Baloch. 4,935 11-Mar-96 Gas
902 Uch 15 OGDC 21-Mar-96 Baloch. 4,610 17-Jul-96 Gas
903 Uch 17 OGDC 03-Apr-96 Baloch. 4,587 01-Jun-96 Gas
904 Uch 12 OGDC 01-Jun-96 Baloch. 4,528 06-Jul-96 Gas
905 Uch 18 OGDC 30-Jun-96 Baloch. 4,561 10-Aug-96 Gas
906 Uch 16 OGDC 14-Sep-96 Baloch. 4,462 09-Dec-96 Gas
907 Uch 13 OGDC 31-Dec-96 Baloch. 4,495 28-Mar-97 Gas
908 Zamzama 2 BHP 01-Feb-99 Sindh 12,904 Pab 08-May-99 Gas
909 Zamzama 3 BHP 15-Jul-02 Sindh 13,228 Pab 14-Sep-02 Gas
910 Zamzama 4 BHP 13-Oct-02 Sindh 12,133 03-Jan-03 Gas
911 Zamzama 5 BHP 04-Feb-03 Sindh 12,700 31-Mar-03 Gas
912 Zamzama North 1 BHP 16-Apr-03 Sindh 13,110 Suspended
913 Zarghun South 2 Premier 31-Dec-99 Baloch. 9,465 04-Mar-00 Suspended
914 Zamzama East 1 BHP 09-Sep-03 Sindh 13,291 25-Oct-03 Gas
915 Zaur 2 UTP 28-Jul-95 Sindh 7,002 15-Aug-95 Abandoned
916 Zaur 3 UTP 09-Mar-01 Sindh 70 6,978 Lower Goru 23-Mar-01 Oil
917 Zaur 4 UTP 06-Apr-01 Sindh 70 6,903 Lower Goru 22-Mar-01 Oil
918 Zaur 5 BP 12-Nov-01 Sindh 70 7,000 Lower Goru 26-Nov-01 Oil
919 Zaur 6 BP 21-Jan-02 Sindh 6,952 Lower Goru 02-Feb-02 Oil
920 Zaur 7 BP 10-Sep-02 Sindh 6,532 Lower Goru 23-Sep-02 Oil
921 Zaur 8 BP 22-Oct-02 Sindh 5,820 Lower Goru 05-Nov-02 Suspended
922 Zaur 9 BP 12-Mar-03 Sindh 10,212 Lower Goru 24-Mar-03 Oil
923 Zaur 10 BP 14-Jul-03 Sindh 6,850 24-Jul-03 Oil
924 Zaur 11 BP 29-Dec-03 Sindh 6,926 12-Jan-04 Oil
925 Zaur 12 BP 22-Jun-04 Sindh 6,388 Oil
926 Zaur 14 BP 26-Aug-08 Sindh 6,958 Lower Goru 10-Sep-07 Gas
927 Zaur 15 BP 25-Feb-08 Sindh 7,456 Lower Goru 12-Mar-08 Oil
928 Zaur WIW 13 BP 21-Nov-05 Sindh 7,064 Lower Goru 08-Dec-05 Completed as WIW
929 Zaur WSW 1 BP 14-Dec-05 Sindh 1,906 Completed as WSW
930 Zaur Deep 2 UTP 10-Dec-00 Sindh 68 8,402 Sui Main Ls. 30-Dec-00 Gas
931 Zaur Deep 3 UTP 06-May-01 Sindh 70 8,556 Gas
Note: Shaded area indicate wells drilled in current year
Source: DGPC.

Appendix: 7.3
Tonne Barrel Tonne Tonne MWh MWh
UNIT CONVERSIONS
Million M cft Tonne Crude Crude Local Imported Primary Final
Btu Gas FO Oil Oil Coal Coal Electricity Electricity
1 million Btu = 1 1.02 0.025 0.024 0.178 0.053 0.036 0.100 0.293
1 MM cft Pipeline Gas = 980 1,000 24.024 23.392 174.363 0.052 0.036 0.098 0.287
1 tonne FO = 40.792 41.62 1 0.974 7.258 2.176 1.480 4.079 11.955
1 tonne Crude oil = 41.895 42.75 1.027 1 7.454 2.235 1.520 4.190 12.279
1 barrel Crude oil = 5.620 5.74 0.138 0.134 1 0.300 0.204 0.562 1.647
1 tonne Local Coal = 18.74 19.13 0.460 0.447 3.335 1 0.680 1.874 5.494
1 tonne Imported Coal = 27.56 28.13 0.676 0.658 4.904 1.471 1 2.756 8.079
1 MWh Primary Elect. = 10.0 10.20 0.245 0.239 1.779 0.534 0.363 1 2.931
1 MWh Final Elect. = 3.412 3.48 0.084 0.081 0.607 0.182 0.124 0.341 1

Appendix: 7.4
Gas Million Btu Giga Joule TOE/
GROSS CALORIFIC VALUES
per MMCFT per MMCFT MMCFT
Sui Standard Natural Gas 980 1033.9 23.4
Badin & Condensates Average 1,047 1104.6 25.0
For Btu values of all other field gases, please see Table 3.1.
Oil Million Btu Giga Joule TOE/
per Tonne per Tonne Tonne
Indigenous Crude Oil 41.895 44.20 1.0000
Imported Crude Oil 43.313 45.7 1.0338
Avgas 43.659 46.1 1.0421
JP-1 43.218 45.6 1.0316
JP-4 44.144 46.6 1.0537
Motor Spirit 44.761 47.2 1.0684
HOBC 44.541 47.0 1.0632
HSD 44.045 46.5 1.0513
LDO 43.648 46.0 1.0418
Furnace Oil 40.792 43.0 0.9737
Kerosene 43.218 45.6 1.0316
Nephtha 44.761 47.2 1.0684
LPG 45.326 47.8 1.0819
MTBE 34.128 36.0 0.8146
Electricity Million Btu Giga Joule TOE/
per GWh per GWh GWh
As Primary Energy Input for Hydro/Nuclear 10,000 10,550 238.69
As Final Energy 3,412 3,600 81.44
Coal Million Btu Giga Joule TOE/
per Tonne per Tonne Tonne
Indigenous 18.74 19.8 0.4474
Imported 27.56 29.1 0.6579

Appendix 7.5
LIST OF ABBREVIATIONS
ACGR Annual Compound Growth Rate
AJKHEB Azad Jammu & Kashmir Hydro Electric Board
ARL Attock Refinery Limited
BP BP Pakistan Exploration & Production Inc.
BTU British Thermal Unit
BTX Benzyne Toulene Xylene
CFt Cubic Feet
CNG Compressed Natural Gas
DGG Directorate General of Gas
DGM Directorate General of Minerals
DGO Directorate General of Oil
DGPC Directorate General of Petroleum Concessions
DPL Dewan Petroleum (Pvt) Limited
DRL Dhodak Refinery Limited
FBS Federal Bureau of Statistics
FO Furnace oil
GSP Geological Survey of Pakistan
GTPS Gas Turbine Power Station
GWh Giga Watt Hour
HDIP Hydrocarbon Development Institute of Pakistan
HOBC High Octane Blending Component
HSD High Speed Diesel Oil
HSFO High Sulphur Furnace Oil
HUBCO The Hub Power Company
Hunt Hunt International Petroleum Company
JBO Jute Batch Oil
JJVL
JP-1, JP-4 Aviation Fuels
KANUPP Karachi Nuclear Power Plant
KAPCO Kot Addu Power Company
KESC Karachi Electricity Supply Corporation
LASMO Lasmo Oil Pakistan Limited
LDO Light Diesel Oil
LHFO Low Sulphur Furnace Oil
LPG Liquefied Petroleum Gas
MGCL Mari Gas Company Limited
MTBE Methyl Tertiary Butyl Ether
MTT Mineral Turpentine
MW Mega Watt
MWh Mega Watt Hour
n.a. Not Available
NGPS Natural Gas Power Station
NRL National Refinery Limited
NWFP North Western Frontier Province
OCAC Oil Companies Advisory Committee
OGDC Oil & Gas Development Company
OTPS Oil Thermal Power Station
OXY Occidental of Pakistan Inc.
PAEC Pakistan Atomic Energy Commission
PARCO Pak-Arab Refinery Company Limited
PASMIC Pakistan Steel Mills Corporation
PMDC Pakistan Mineral Development Corporation
POL Pakistan Oilfields Limited
PPL Pakistan Petroleum Limited
PRL Pakistan Refinery Limited
Ps Paisa
Qty Quantity
RON Research Octane Number
SNGPL Sui Northern Gas Pipelines Limited
SPS Steam Power StationContd./...

SSGCL Sui Southern Gas Company Limited
T & D Transmission & Distribution
TCF Trillion Cubic Feet
TEL Tapal Energy Limited
TOE Tonnes of Oil Equivalent.
Tonne Metric Tonne
TPS Thermal Power Station
US United States
UTP Union Texas Pakistan Inc.
WAPDA Pakistan Water & Power Development Authority, Lahore.
ZOT
LIST OF ABBREVIATIONS (Contd.)