Energetic costs of mange in wolves estimated from infrared ...
13
University of Wollongong University of Wollongong Research Online Research Online Faculty of Science, Medicine and Health - Papers: part A Faculty of Science, Medicine and Health January 2016 Energetic costs of mange in wolves estimated from infrared thermography Energetic costs of mange in wolves estimated from infrared thermography Paul Cross U.S. Geological Survey Emily Almberg Pennsylvania State University C G. Haase University of Florida Peter J. Hudson Huck Institutes of Life Sciences Shane K. Maloney University of Western Australia See next page for additional authors Follow this and additional works at: https://ro.uow.edu.au/smhpapers Recommended Citation Recommended Citation Cross, Paul; Almberg, Emily; Haase, C G.; Hudson, Peter J.; Maloney, Shane K.; Metz, M C.; Munn, Adam J.; Nugent, P; Putzeys, O; Stahler, D R.; Stewart, A C.; and Smith, D W., "Energetic costs of mange in wolves estimated from infrared thermography" (2016). Faculty of Science, Medicine and Health - Papers: part A. 4090. https://ro.uow.edu.au/smhpapers/4090 Research Online is the open access institutional repository for the University of Wollongong. For further information contact the UOW Library: [email protected]
Transcript of Energetic costs of mange in wolves estimated from infrared ...

University of Wollongong University of Wollongong
Research Online Research Online
Faculty of Science, Medicine and Health - Papers: part A Faculty of Science, Medicine and Health
January 2016
Energetic costs of mange in wolves estimated from infrared thermography Energetic costs of mange in wolves estimated from infrared thermography
Paul Cross U.S. Geological Survey
Emily Almberg Pennsylvania State University
C G. Haase University of Florida
Peter J. Hudson Huck Institutes of Life Sciences
Shane K. Maloney University of Western Australia
See next page for additional authors
Follow this and additional works at: https://ro.uow.edu.au/smhpapers
Recommended Citation Recommended Citation Cross, Paul; Almberg, Emily; Haase, C G.; Hudson, Peter J.; Maloney, Shane K.; Metz, M C.; Munn, Adam J.; Nugent, P; Putzeys, O; Stahler, D R.; Stewart, A C.; and Smith, D W., "Energetic costs of mange in wolves estimated from infrared thermography" (2016). Faculty of Science, Medicine and Health - Papers: part A. 4090. https://ro.uow.edu.au/smhpapers/4090
Research Online is the open access institutional repository for the University of Wollongong. For further information contact the UOW Library: [email protected]

Energetic costs of mange in wolves estimated from infrared thermography Energetic costs of mange in wolves estimated from infrared thermography
Abstract Abstract Parasites, by definition, extract energy from their hosts and thus affect trophic and food web dynamics even when the parasite may have limited effects on host population size. We studied the energetic costs of mange (Sarcoptes scabiei) in wolves (Canis lupus) using thermal cameras to estimate heat losses associated with compromised insulation during the winter. We combined the field data of known, naturally infected wolves with a data set on captive wolves with shaved patches of fur as a positive control to simulate mange-induced hair loss. We predict that during the winter in Montana, more severe mange infection increases heat loss by around 5.2-12 MJ per night (1,240-2,850 kcal, or a 65-78% increase) for small and large wolves, respectively, accounting for wind effects. To maintain body temperature would require a significant proportion of a healthy wolf's total daily energy demands (18-22 MJ/day). We also predict how these thermal costs may increase in colder climates by comparing our predictions in Bozeman, Montana to those from a place with lower ambient temperatures (Fairbanks, Alaska). Contrary to our expectations, the 14°C differential between these regions was not as important as the potential differences in wind speed. These large increases in energetic demands can be mitigated by either increasing consumption rates or decreasing other energy demands. Data from GPS-collared wolves indicated that healthy wolves move, on average, 17 km per day, which was reduced by 1.5, 1.8, and 6.5 km for light, medium, and severe hair loss. In addition, the wolf with the most hair loss was less active at night and more active during the day, which is the converse of the movement patterns of healthy wolves. At the individual level, mange infections create significant energy demands and altered behavioral patterns, this may have cascading effects on prey consumption rates, food web dynamics, predator-prey interactions, and scavenger communities.
Publication Details Publication Details Cross, P., Almberg, E. S., Haase, C. G., Hudson, P. J., Maloney, S. K., Metz, M. C., Munn, A. J., Nugent, P., Putzeys, O., Stahler, D. R., Stewart, A. C. & Smith, D. W. (2016). Energetic costs of mange in wolves estimated from infrared thermography. Ecology, 97 (8), 1938-1948.
Authors Authors Paul Cross, Emily Almberg, C G. Haase, Peter J. Hudson, Shane K. Maloney, M C. Metz, Adam J. Munn, P Nugent, O Putzeys, D R. Stahler, A C. Stewart, and D W. Smith
This journal article is available at Research Online: https://ro.uow.edu.au/smhpapers/4090
1938
Ecology, 97(8), 2016, pp. 1938–1948© 2016 by the Ecological Society of America
Energetic costs of mange in wolves estimated from infrared thermography
P. C. Cross,1,10 E. s. AlmbErg,1,2 C. g. HAAsE,3 P. J. Hudson,2 s. K. mAlonEy,4 m. C. mEtz,5 A. J. munn,6 P. nugEnt,7 o. PutzEys,8 d. r. stAHlEr,5 A. C. stEwArt,9 And d. w. smitH5
1U.S. Geological Survey, Northern Rocky Mountain Science Center, 2327 University Way, Suite 2, Bozeman, Montana 59715 USA2Department of Biology, Center for Infectious Disease Dynamics, The Huck Institutes of the Life Sciences, Pennsylvania State
University, University Park, Pennsylvania USA3School of Natural Resources and Environment, University of Florida, Gainesville, Florida 32611 USA
4School of Anatomy, Physiology, and Human Biology, University of Western Australia, Crawley, Western Australia 6009 Australia5Yellowstone Wolf Project, Yellowstone National Park, Wyoming USA
6School of Biological Sciences, University of Wollongong, Northfields Avenue, Wollongong, New South Wales 2522 Australia7NWB Sensors, Inc., Bozeman, Montana 59718 USA
8Chemical and Biological Engineering Department, Montana State University, Bozeman, Montana 59717 USA9Wyoming Game and Fish Department, Pinedale, Wyoming 82941 USA
Abstract. Parasites, by definition, extract energy from their hosts and thus affect trophic and food web dynamics even when the parasite may have limited effects on host population size. We studied the energetic costs of mange (Sarcoptes scabiei) in wolves (Canis lupus) using thermal cameras to estimate heat losses associated with compromised insulation during the winter. We combined the field data of known, naturally infected wolves with a data set on captive wolves with shaved patches of fur as a positive control to simulate mange- induced hair loss. We predict that during the winter in Montana, more severe mange infection increases heat loss by around 5.2–12 MJ per night (1,240–2,850 kcal, or a 65–78% increase) for small and large wolves, respectively, accounting for wind effects. To maintain body temperature would require a significant proportion of a healthy wolf’s total daily energy demands (18–22 MJ/day). We also predict how these thermal costs may increase in colder climates by comparing our predictions in Bozeman, Montana to those from a place with lower ambient temperatures (Fairbanks, Alaska). Contrary to our expectations, the 14°C differential between these regions was not as important as the potential differences in wind speed. These large increases in energetic demands can be mitigated by either increasing consumption rates or decreasing other energy demands. Data from GPS- collared wolves indicated that healthy wolves move, on average, 17 km per day, which was reduced by 1.5, 1.8, and 6.5 km for light, medium, and severe hair loss. In addition, the wolf with the most hair loss was less active at night and more active during the day, which is the converse of the movement patterns of healthy wolves. At the individual level, mange infections create significant energy demands and altered behavioral patterns, this may have cascading effects on prey consumption rates, food web dynamics, predator- prey interactions, and scavenger communities.
Key words: energy; metabolic costs; parasitism; trophic dynamics.
introduCtion
Homeothermic animals, including wolves, maintain a relatively constant internal body temperature by bal-ancing the rate of heat gain with the rate of heat loss (Scholander 1955, Koteja 2000). Cellular metabolism is the major route of heat gain for endotherms, and can result in high energetic costs in cold climates (Jessen 2001). Endothermic vertebrates have resting and maximal levels of oxygen consumption (a measure of energy expenditure)
that are on average five to ten times higher than ecto-therms of the same body size (Bennett and Ruben 1979).
Many cold- adapted endotherms have a wide thermo-neutral zone of ambient conditions, within which they can maintain body temperature without large increases in heat production due to insulating layers of feathers, hair, or fat (McNab 1974, Rubner 1982). Some parasites can affect the hair or feather covering of an endotherm, and will affect the host’s heat balance. Thus parasites that reduce insulation are then likely to induce thermal costs in addition to direct energy extraction and immu-nological costs. In addition, canids have an aerobic scope and field metabolic rate that is higher than other mam-mals (Nagy 1994, Schmidt- Nielsen 1997). Thus, addi-tional energy requirements due to disease may result in
Manuscript received 20 July 2015; revised 4 February 2016; accepted 10 February 2016; final version received 11 March 2016. Corresponding Editor: H. U. Wittmer.
10E-mail: [email protected]
August 2016 1939ENERGETIC COSTS OF MANGE
corresponding pressure to increase their energy intake. In this study, we estimated the thermal costs of sarcoptic mange (Sarcoptes scabiei) to Gray wolves (Canis lupus) in Yellowstone National Park (YNP).
Although maintaining body temperature in winter cli-mates is a major portion of the endothermic energy budget, most methods for estimating energy expenditure are not easily applied to large mammals in a field setting (Tomlinson et al. 2014). Accelerometer technology has been used in large carnivores to estimate the energetic costs of movement (e.g., Williams et al. 2014), but this does not account for the thermoregulatory portion of the energy budget. Here we used infrared thermography (IRT) on captive and wild wolves to estimate the increase in energy expenditure that is required when the thermal insulation provided by the fur is reduced by an ectopar-asite. IRT measures the wavelength of infrared radiation that is emitted from an object, which can be converted to surface temperature using the laws of physics (Speakman and Ward 1998, McCafferty 2007). Surface temperature is a major determinant of the amount of energy that is lost to the environment, because heat loss is proportional to the gradient between surface temper-ature of the object, or animal, and the environmental temperature (Scholander et al. 1950, Scholander 1955). Cameras equipped with IRT allow for surface tempera-ture to be measured remotely without disturbing the animal or its behavior, making IRT a noninvasive method to understand the energy balance of wild animals (McCafferty 2007). IRT has been used for some disease diagnosis applications, but its application has been lim-ited due to the need to observe animals at close distances (Arenas et al. 2002, Rainwater- Lovett et al. 2009). We circumvented this problem by developing a remotely- triggered IRT camera, which to our knowledge, is the first time the technology has been used remotely to study the costs of parasitism in a wildlife system.
Sarcoptic mange is an infectious disease of the skin caused by the mite Sarcoptes scabiei, which burrows into the host’s epidermis where it feeds and lays eggs. This causes severe irritation, skin lesions, secondary infec-tions, and hair loss (Bornstein et al. 2001). Mange is a chronic infection whereby wolves can be infected for several months to over a year but often recover (Almberg et al. 2012). Sarcoptic mange was introduced into the Northern Rockies in 1905 by state wildlife veterinarians in an attempt to help eradicate local wolf and coyote populations (Jimenez et al. 2010). With the successful extirpation of wolves from the Northern Rockies, the mite is thought to have persisted among regional furbear-ers such as coyotes and foxes. Mange re- emerged in wolves of YNP in 2007 and rapidly spread across the park (Almberg et al. 2012). The prevalence of mange- induced hair loss from 2008 to present oscillated season-ally from around 5% to 20%, with peak prevalence during winter (Almberg et al. 2015). Mange status is correlated with wolf mortality rates, but only in small packs, or packs with many infected individuals, suggesting that the
additional energy cost of infection to an individual may be compensated by living and hunting with noninfected individuals (Almberg et al. 2015). Many wolves in YNP are individually known and routinely observed, making this a rare wildlife system where disease symptoms are directly and routinely (e.g., monthly) quantified on known individuals over many years.
In this paper, we combine several datasets into an inte-grative analysis of the energy costs of mange- induced hair loss, and thereby heat loss, in wolves. We first present data using captive wolves and IRT that allow us to create a robust model of sensible heat loss in healthy wolves across a range of ambient conditions. By shaving fur from body sections on captive wolves, we simulate mange- induced hair loss and quantify the subsequent increases in heat loss. We then compare this captive dataset to more intermittent data obtained from thermal imagery in the field of both healthy and mange- infected wolves. Using these two datasets, we then extrapolate to the projected energy demands over the course of a winter in nearby Bozeman, Montana and compare these to Fairbanks, Alaska. We propose that mange costs are likely to be exacerbated by colder climates. Additional thermal costs might be mitigated by altered activity patterns; therefore we assessed whether mange- infected wolves reduced their movement rate or altered their activity pattern. We con-clude with calculations of how these potential increases in energy demands induced by a parasite may affect wolf, elk, and scavenger dynamics.
mEtHods
Infrared thermography and heat losses
Infrared images of four captive adult wolves (two male, two female) at the Grizzly and Wolf Discovery Center (GWDC) in West Yellowstone, Montana were recorded in October 2010 (using a Jenoptik 640 × 480 pixel VarioCAM with ± 1.5°C accuracy) and November 2011 through February 2012 (using a 1,344 × 784 pixel FLIR SC8340 with ± 2°C accuracy). We shaved two 10 × 5 cm patches of hair on two otherwise healthy wolves in October 2010 and November 2011 to simulate the hair loss that occurs with mange. Shaved patches were located on the inner and outer legs, front shoulder, and hind-quarters, which are regions where mange- induced hair loss is common (Fig. 1).
We took images of wolves at distances ranging from 3 to 30 m after sunset or before sunrise to avoid any effects of solar radiation on the IRT measurement of surface tem-perature. We photographed the captive wolves on 16 eve-nings, covering a range of ambient temperatures from −30°C to 5°C. Multiple photos were taken of each individ-ual to obtain a good image of each side and body part. We then waited several hours to allow the ambient temperature to change by several degrees before another set of images was taken. We weighed and took body measurements of each captive wolf at the start of each study period. These

1940 Ecology, Vol. 97, No. 8P. C. CROSS ET AL.
wolves, which weighed between 35 and 59 kg, spanned the range of body sizes found in YNP. We then calculated the surface area of these wolves using the length and girth measurements of each body part and assuming each was cylindrical. These estimates closely matched more detailed measurements where we placed tissue paper on four wolf pelts and two taxidermic mounts and then calculated sur-face area using image analysis software.
We recorded infrared images of wild wolves in the northern range of YNP during the 2012 to 2013 winter using a custom infrared camera set up that was based on an uncooled FLIR PathFindIR sensor (320 × 240 pixels, 19 mm lens, and 36° field of view). The camera was bat-tery powered, permitting the remote acquisition of images after installation at a management- related carcass
dump site along with a weather station and two standard motion- triggered cameras to aid in identifying known wolves. The weather station recorded ambient tempera-ture, relative humidity, solar radiation, and wind speed/direction at 5- min intervals using a CR1000 datalogger, HMP35 temperature and relative humidity probe, Kipp & Zonen CM3 pyranometer, and RM Young 05103 wind monitor (Campbell Scientific, Logan, Utah, USA).
To calibrate the infrared images, we installed two cop-per plates 7 m from the camera (Fig. 1). Each plate was painted with Krylon Flat White Spray Paint #1502 (Sherwin Williams, Cleveland, Ohio, USA), which had an emissivity of 0.99. One plate was unheated while the other was heated electrically such that its temperature remained approximately (but measured precisely) 20°C above that of the unheated plate. We recorded the temperature at the center of each plate via a temperature sensor (LM35, Texas Instruments, Dallas, Texas, USA) at 5- min inter-vals. We then used the temperatures of these two plates to perform a two- point radiometric field calibration of the camera (Appendix S1). This additional calibration of the uncooled sensor increased the precision of the temperature estimates from ±7°C to within ±2°C. As in the captive study, we used only infrared images that were recorded during darkness. By identifying individual wolves using the traditional cameras, we avoided the potential circular-ity of using IRT to diagnose mange induced hair loss and simultaneously estimate the associated energy costs.
We processed the thermal videos in MATLAB (Mathworks Inc. 2012) to calibrate the field IRT and extract still images. We then delineated the following body regions using ImageJ (Schneider et al. 2012): neck (NK), trunk (TR), front inner leg (FRIL), front outer leg (FROL), back inner leg (BKIL), back outer leg (BKOL), and tail (TL; Fig. 1). These regions excluded the periph-eral edges of each body part to avoid viewing angle dis-tortions that can affect temperature measurements from IRT. Shaved regions on captive wolves were delineated and analyzed as separate body regions.
We defined sensible heat loss as the sum of conductive heat loss, free and forced convective heat loss, and radia-tive heat loss. We ignored conductive heat losses from the foot to the ground as this is likely to be the same between infected and healthy wolves. We considered only convec-tive and radiative heat loss from each body region to the environment, which we modeled according to Monteith and Unsworth (2008; see Appendix S1 for details). Radiative heat losses are related to ground and effective sky temperatures, which we accounted for in our analyses (Appendix S1). Our heat loss estimates, which were based on average temperatures of the body region, were not sub-stantively different than if we calculated heat losses on a pixel- by- pixel basis (data not shown).
Observational and movement data
Wolves were collared and monitored as part of YNP’s wolf monitoring program, which captures an average of
Fig. 1. Thermal imagery of field (A) and captive (B) wolves showing the delineation of some body regions (FROL = front outer leg, FRIL = front inner leg, BKOL = back outer leg, BKIL = back inner leg), as well as the shaved patches on captive wolves. The remotely triggered thermal camera and weather station are shown in (C). Both the wolves in panels A and C were infected with mange.
August 2016 1941ENERGETIC COSTS OF MANGE
23 wolves per year across all the known packs in the park. At the time of collaring, sex, age (based on tooth wear), weight, and body condition were recorded, a blood sam-ple was taken, and the body was examined for ectopar-asites, including signs of S. scabiei infection. Capture and handling protocols were approved by the U.S. National Park Service and are in accordance with recommenda-tions from the American Society of Mammalogists (Sikes and Gannon 2011). For the duration of the project from 2010 through 2013, we monitored each known (i.e., radio- collared or uniquely identifiable) wolf approxi-mately monthly using ground and air observations and categorized their degree of hair loss as healthy, Type I (1–5% hair loss), Type II (6–50% hair loss), Type III (≥50% hair loss) following Pence et al. (1983) and Almberg et al. (2015). To connect these whole- body direct observations to the thermal imagery, which was on a body- part by body- part basis, we needed to catego-rize the extent of hair loss specific to each body region and side of the animal. We did this using known wolves for which we had photos of all body regions and recorded mange status monthly via direct observations or photos, and categorized each body part (and side of the animal) as healthy, low hair loss (1–33%, n = 9), medium hair loss (34–66%, n = 9), and high hair loss (67–100%, n = 5). We used the median amount of hair loss for each body part to create a prototypical wolf for each level of mange severity that was then used in the predictions of energy costs.
We expected that infected wolves may mitigate their thermal costs by moving less, which will reduce the met-abolic costs of exercise and heat loss by convection. We used data from GPS collars (Lotek 7000 SU) deployed in the northern range of YNP from 2007 to 2013 to estimate the distances moved per day and the timing of movement during the day. The number of locations acquired by the GPS collars was not constant over time and across individuals. We excluded days where there were <11 locations and accounted for the potential effects of more frequent sampling by including the num-ber of fixes as a covariate in our statistical models. We excluded wolves with <100 locations. The resulting dataset had 3,869 locations from 25 wolves in 15 packs across 1,647 days. To account for the distances moved up and down hills we used ArcGIS10 (ESRI 2014) 3D Analyst to calculate the surface distances moved by join-ing the wolf location data to a 30 m- resolution elevation layer.
Statistical analyses and predictions
We used linear regression to estimate how the mean surface temperature of body parts in each thermal image was associated with the ambient temperature (°C), the body region, amount of hair loss (none, low, medium, and high), site (YNP vs. GWDC, i.e., field vs. captive), and their interactions. Not all combinations of hair loss and body regions were well- sampled across a wide range
of ambient conditions (Appendix S2), both because the field data were opportunistic observations and because mange- induced hair loss tends to occur more frequently on the legs rather than on the neck or trunk. We inves-tigated several models where body regions and hair loss categories were aggregated in different ways to avoid overfitting. For body regions, we started with categories for the neck, trunk, back inner leg, front inner leg, back outer leg, and front outer leg. We also condensed this to neck, truck, outer legs, and inner legs. Hair loss catego-ries were confounded with site because captive wolves did not have mange and field wolves were not shaved. Therefore, we combined these two factors into a single categorical covariate. In some cases, we constrained interaction terms to be the same across levels of a covar-iate. For example, the relationship between surface tem-perature and ambient temperature was assumed, in some models, to be the same for high hair loss in mange- infected wolves and shaved patches on captive wolves where there was more extensive data. We compared mod-els based upon AIC and R2. There was no strong evidence of any nonlinearity in the functional relationship between ambient and surface temperatures and the residuals were normally distributed. All analyses were conducted in R version 3.2.2 (R Development Core Team 2015).
We conducted analyses of both cumulative daily move-ments as well as hourly movements of wolves using linear mixed models using lme4 in R (Bates et al. 2015). We included age (pup, yearling, and adult), sex, year (cate-gorical), month (categorical), mange status (healthy, type I, type II, and type III), and individual as covariates. We considered individual a “random” effect. Individual wolves were nested within packs and we seldom had more than one GPS collar per pack. As a result, we accounted for “pack” effects through the individual effect. Daily and hourly movement distances were highly right- skewed and the residual variances increased with the mean. We conducted statistical analyses using both the raw move-ment data as well as the log- transformed distances (Appendix S3). We present the results using the raw movement data in the main text because cumulative movement over time, and the associated energy expend-iture, is better predicted by the arithmetic mean than other measures of central tendency. Our conclusions, and the statistical significance of the results, were the same regardless of the transformation. Confidence intervals for the mixed effect models were constructed using 1,000 bootstrap samples.
Our primary interest was the potential effects of mange status on total daily movement rates across the entire year as well as whether mange affected the daily timing of movements during the colder winter months. We hypothesized that during the winter months wolves with more hair loss may move more during the day and would remain in more sheltered areas during the night. For the hourly analyses, we subset the data to only include November to March locations and categorized the hour of day as: Daytime (11:00am to 3:00 pm), Nighttime

1942 Ecology, Vol. 97, No. 8P. C. CROSS ET AL.
(10:00 pm to 5:00 am), and Twilight (6:00 am–10:00 am and 4:00 pm to 9:00 pm).
We hypothesized that the thermal costs of mange would be much higher in colder years and in colder regions. Temperature across the day could varied by around 20°C, which could markedly affect projected energy demands, so we used hourly temperature and wind speed data from Bozeman, Montana and Fairbanks, Alaska from 2005 to 2014 for our predictions. Data for Fairbanks were taken from the airport via the U.S. Climate Reference Network (Diamond et al. 2013). Hourly data were not available for a similar timespan within YNP, so we used data from the Optical Remote Sensor Laboratory in Bozeman, Montana, which is about 100 km from the main study area in YNP (http://orsl.montana.edu/weather/zert). We limited our predic-tions to the nighttime hours from 10 pm to 6 am local time and from November through March to avoid extrapolating to ambient conditions that were outside of those we recorded in our captive and field studies. We
used the constrained statistical model to predict surface temperature given the ambient temperature and wind speed. Then we calculated the heat flux (W/m2) and total heat loss (W), which we could summarize by animals of different size and mange status.
rEsults
Energy costs
We collected 4,382 images (376 from wolves in the field and 4,006 from captive wolves) of body regions between 2010 and 2013 (Videos S1–S3). The tails of healthy wolves were difficult to identify in the field thermal imagery because healthy tails were close to ambient tem-perature. Thus we excluded the tail from our analyses. We acquired images from captive wolves across ambient temperatures ranging from −31°C to 6°C. Field images spanned a range from −12°C to 6°C (Fig. 2; Appendix S2). Mange Type I individuals generally had low hair
Fig. 2. Heat loss (W/m2) from healthy captive wolves as a function of the ambient temperature (°C) and body region (BKIL = back inner leg, FRIL = front inner leg, BKOL = back outer leg, FROL = front outer leg). Each symbol represents a different individual.
August 2016 1943ENERGETIC COSTS OF MANGE
loss on the BKIL and BKOL regions and were healthy elsewhere. Type II individuals had medium hair loss on the FROL, BKIL, BKOL, and trunk regions, while the FRIL had low hair loss. The necks on Type II individuals were not observed to have any hair loss. Type III indi-viduals had low hair loss on the neck, medium hair loss on the trunk, FROL and BKIL, and high hair loss on the FRIL and BKOL (Appendix S2).
Our heat flux estimates were higher on the inner and outer legs then the better insulated neck and trunk regions (Fig. 2). On the inner legs, heat flux increased with decreasing ambient temperature, but there was a wide range of environmental temperature where the heat loss was relatively stable. Heat flux increased slightly on the trunk and neck in warmer conditions (Fig. 2). Total heat loss (W), rather than heat flux (W/m2), was similar across body regions after accounting for the surface area associated with each body region. The exception was the neck, which had very low heat losses (Appendix S2). These heat flux estimates were based on the IRT meas-ured temperature differential between the surface of the wolf and the ambient conditions, and thus account for localized differences in blood flow and insulation across the different body regions.
We had four captive and five YNP wolves in our ther-mal imagery dataset. Heat flux appeared very similar among the captive wolves (Fig. 2); however, the largest captive wolf (59 kg) had almost double the total heat loss of the three smaller wolves (35–37 kg) due to differences in total surface area (Appendix S2). An analysis of just the captive data indicated that the exclusion of wolf identity (as a fixed effect) was statistically significant ( F- stat = 2.99, df = 3, P- value = 0.03), but the model R2 only declined from 0.9541 to 0.9439, so we ignored this effect in our other analyses.
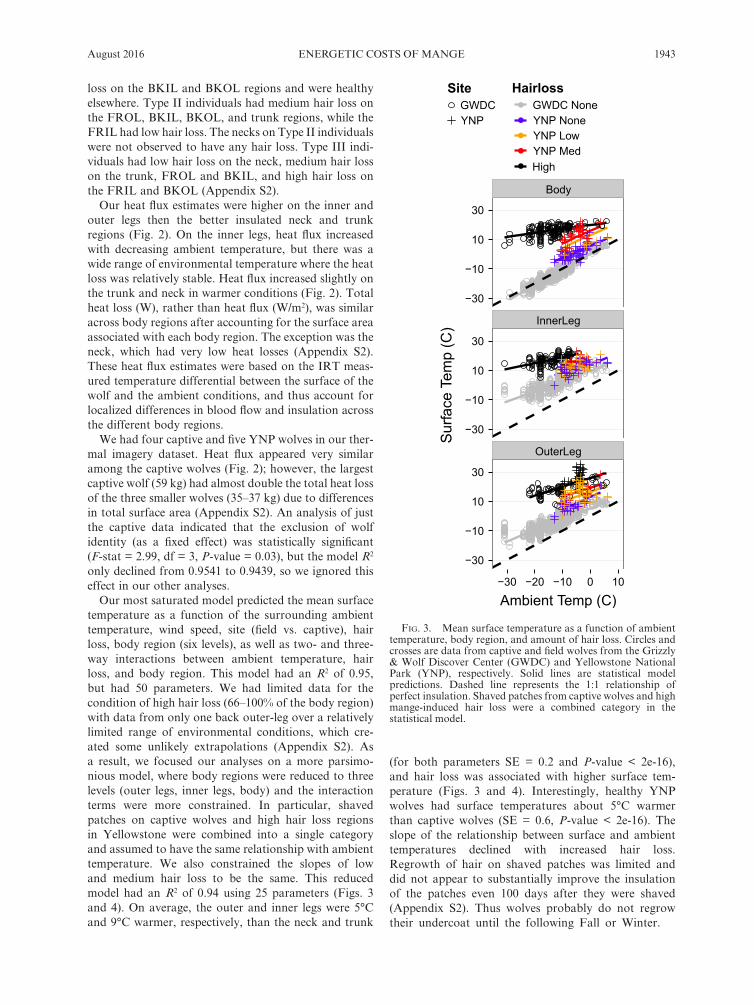
Our most saturated model predicted the mean surface temperature as a function of the surrounding ambient temperature, wind speed, site (field vs. captive), hair loss, body region (six levels), as well as two- and three- way interactions between ambient temperature, hair loss, and body region. This model had an R2 of 0.95, but had 50 parameters. We had limited data for the condition of high hair loss (66–100% of the body region) with data from only one back outer- leg over a relatively limited range of environmental conditions, which cre-ated some unlikely extrapolations (Appendix S2). As a result, we focused our analyses on a more parsimo-nious model, where body regions were reduced to three levels (outer legs, inner legs, body) and the interaction terms were more constrained. In particular, shaved patches on captive wolves and high hair loss regions in Yellowstone were combined into a single category and assumed to have the same relationship with ambient temperature. We also constrained the slopes of low and medium hair loss to be the same. This reduced model had an R2 of 0.94 using 25 parameters (Figs. 3 and 4). On average, the outer and inner legs were 5°C and 9°C warmer, respectively, than the neck and trunk
(for both parameters SE = 0.2 and P- value < 2e- 16), and hair loss was associated with higher surface tem-perature (Figs. 3 and 4). Interestingly, healthy YNP wolves had surface temperatures about 5°C warmer than captive wolves (SE = 0.6, P- value < 2e- 16). The slope of the relationship between surface and ambient temperatures declined with increased hair loss. Regrowth of hair on shaved patches was limited and did not appear to substantially improve the insulation of the patches even 100 days after they were shaved (Appendix S2). Thus wolves probably do not regrow their undercoat until the following Fall or Winter.
Fig. 3. Mean surface temperature as a function of ambient temperature, body region, and amount of hair loss. Circles and crosses are data from captive and field wolves from the Grizzly & Wolf Discover Center (GWDC) and Yellowstone National Park (YNP), respectively. Solid lines are statistical model predictions. Dashed line represents the 1:1 relationship of perfect insulation. Shaved patches from captive wolves and high mange- induced hair loss were a combined category in the statistical model.

1944 Ecology, Vol. 97, No. 8P. C. CROSS ET AL.
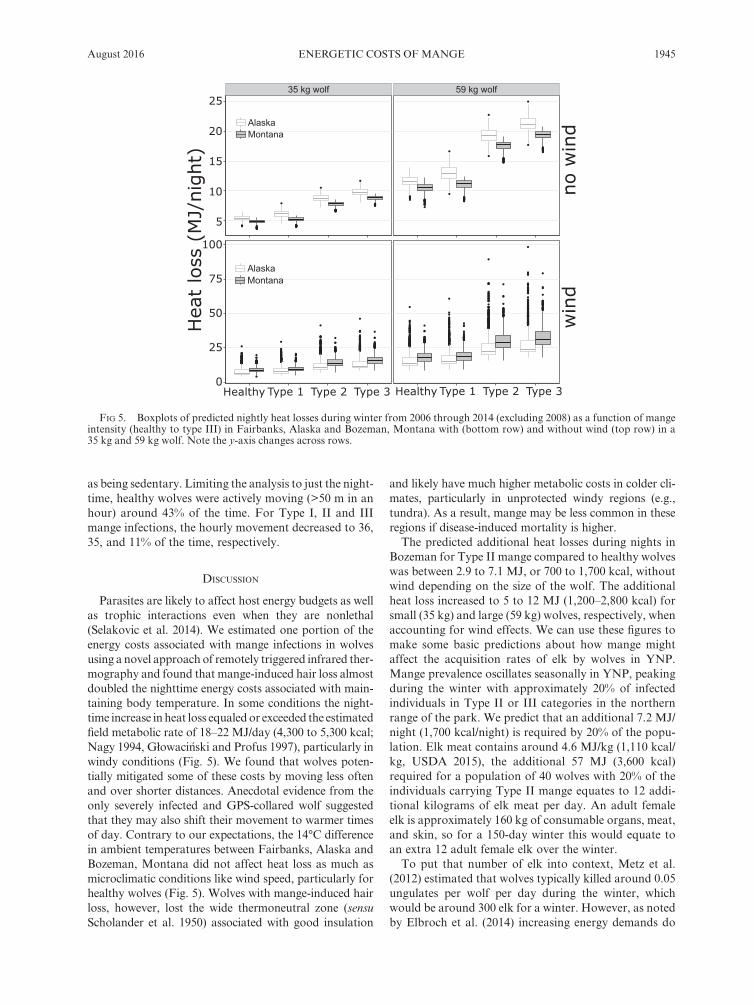
Nighttime temperatures in Fairbanks, Alaska were about 14°C lower than at Bozeman, Montana during the winters of 2006 to 2014 (excluding 2008). Wind speeds, however, were higher at the Bozeman station (an average of 1.1 m/s in Fairbanks compared to 2.3 m/s in Bozeman; Appendix S2). Using the statistical model to predict wolf surface temperature we then calculated predicted heat losses. We predict a minimal effect of Type I mange on nighttime heat loss (Fig. 4). A larger wolf (59 kg, surface area = 2.3 m2) would have around twice the heat loss of a smaller wolf (35 kg, surface area = 0.99 m2). Despite the lower temperatures in Fairbanks, however, we pre-dict only 27% higher nightly heat loss at Fairbanks com-pared to Bozeman for a healthy wolf in the absence of wind (Fairbanks = 4.4 MJ vs. Bozeman = 3.5 MJ for a small wolf; or 9.2 vs 7.3 MJ for a large wolf). With wind, however, the predicted average nighttime heat loss was around 11% higher at Bozeman than Fairbanks (Fairbanks = 6.9 JM vs. Bozeman = 7.8 MJ for a small wolf; 13 vs. 15 MJ for a large wolf; Fig. 5). In addition, a Type II mangy wolf in Bozeman had predicted heat loss that was 66% to 78% higher than a healthy wolf, for small and large wolves respectively. A Type III infection almost doubled the predicted heat losses (healthy = 7.8 MJ vs. Type III = 15 MJ for small wolves; or 15 vs. 30 MJ for large wolves; Fig. 5). As a comparison, estimates of the
daily field metabolic rates for average- sized wolves range from 18 to 22 MJ (4,300–5,300 kcal; Nagy 1994, Głowacinski and Profus 1997).
Movement
More intense hair loss was associated with decreased daily movement (km) after accounting for age, sex, indi-vidual, year, and month. Compared to healthy wolves Type I hair loss was associated with 1.5 km less move-ment per day (β = −1.47 ± 0.59 SE). Type II individuals moved 1.8 km less (β = −1.78 ± 0.77 SE), and Type III moved 6.5 km less per day (β = −6.5 ± 29 SE; Appendix S3). All contrasts were statistically significant based upon 1000 bootstrap samples except for the differences between Type I and Type II (Appendix S3). We note, however, that the Type III effect was estimated from a single indi-vidual that was initially captured as healthy in the winter of 2008, progressed to Type I over the summer and then Type II and III during the winter of 2009 (Fig. 6). When this wolf was the most severely infected their movement pattern shifted to be more active during the daytime (Fig. 6; Appendix S3). Finally, we assessed whether healthy wolves spent a larger fraction of time moving, and so would potentially have been exposed more to the elements. We categorized moving <50 m within an hour
Fig. 4. Parameter estimates from the constrained model. T represents ambient temperature (°C) Some categories, such as low and medium hair loss, and shaved patches and high hair loss, were combined on higher- order interaction terms. Thick and thin lines represent one and two standard deviations, respectively.
August 2016 1945ENERGETIC COSTS OF MANGE
as being sedentary. Limiting the analysis to just the night-time, healthy wolves were actively moving (>50 m in an hour) around 43% of the time. For Type I, II and III mange infections, the hourly movement decreased to 36, 35, and 11% of the time, respectively.
disCussion
Parasites are likely to affect host energy budgets as well as trophic interactions even when they are nonlethal (Selakovic et al. 2014). We estimated one portion of the energy costs associated with mange infections in wolves using a novel approach of remotely triggered infrared ther-mography and found that mange- induced hair loss almost doubled the nighttime energy costs associated with main-taining body temperature. In some conditions the night-time increase in heat loss equaled or exceeded the estimated field metabolic rate of 18–22 MJ/day (4,300 to 5,300 kcal; Nagy 1994, Głowacinski and Profus 1997), particularly in windy conditions (Fig. 5). We found that wolves poten-tially mitigated some of these costs by moving less often and over shorter distances. Anecdotal evidence from the only severely infected and GPS- collared wolf suggested that they may also shift their movement to warmer times of day. Contrary to our expectations, the 14°C difference in ambient temperatures between Fairbanks, Alaska and Bozeman, Montana did not affect heat loss as much as microclimatic conditions like wind speed, particularly for healthy wolves (Fig. 5). Wolves with mange- induced hair loss, however, lost the wide thermoneutral zone (sensu Scholander et al. 1950) associated with good insulation
and likely have much higher metabolic costs in colder cli-mates, particularly in unprotected windy regions (e.g., tundra). As a result, mange may be less common in these regions if disease- induced mortality is higher.
The predicted additional heat losses during nights in Bozeman for Type II mange compared to healthy wolves was between 2.9 to 7.1 MJ, or 700 to 1,700 kcal, without wind depending on the size of the wolf. The additional heat loss increased to 5 to 12 MJ (1,200–2,800 kcal) for small (35 kg) and large (59 kg) wolves, respectively, when accounting for wind effects. We can use these figures to make some basic predictions about how mange might affect the acquisition rates of elk by wolves in YNP. Mange prevalence oscillates seasonally in YNP, peaking during the winter with approximately 20% of infected individuals in Type II or III categories in the northern range of the park. We predict that an additional 7.2 MJ/night (1,700 kcal/night) is required by 20% of the popu-lation. Elk meat contains around 4.6 MJ/kg (1,110 kcal/kg, USDA 2015), the additional 57 MJ (3,600 kcal) required for a population of 40 wolves with 20% of the individuals carrying Type II mange equates to 12 addi-tional kilograms of elk meat per day. An adult female elk is approximately 160 kg of consumable organs, meat, and skin, so for a 150- day winter this would equate to an extra 12 adult female elk over the winter.
To put that number of elk into context, Metz et al. (2012) estimated that wolves typically killed around 0.05 ungulates per wolf per day during the winter, which would be around 300 elk for a winter. However, as noted by Elbroch et al. (2014) increasing energy demands do
Fig 5. Boxplots of predicted nightly heat losses during winter from 2006 through 2014 (excluding 2008) as a function of mange intensity (healthy to type III) in Fairbanks, Alaska and Bozeman, Montana with (bottom row) and without wind (top row) in a 35 kg and 59 kg wolf. Note the y- axis changes across rows.

1946 Ecology, Vol. 97, No. 8P. C. CROSS ET AL.
not always translate into increased kill rates because while wolves may offset these costs by killing prey more frequently, they could also scavenge more often, or more fully consume carcasses. A 4% increase in energy require-ments at the population level is a relatively modest increase despite large individual costs, mostly due to the relatively low prevalence of intense mange infections.
It is ironic that a parasite originally introduced to help eradicate wolves may increase their effects upon prey populations a century later and is potentially one more in a long list of unintended consequences in wildlife man-agement. The increased effect on prey may be offset, however, by mange- induced wolf mortalities if those disease- associated mortalities are additive. We did not account for daytime heat losses, immunological costs, potential increases in prevalence and intensity, and the plethora of other chronic parasites affecting wolves that are also likely to increase the energy demands of wolves with potential cascading effects on their prey or the asso-ciated scavenger community (Wilmers et al. 2003).
The use of IRT in captive and field settings revealed a number of interesting aspects for further research. First, the surface temperature of our captive wolves was lower than field wolves by several degrees. We do not believe that the difference could be due to differences in equipment, because our calibration procedures using cold and hot plates of known temperature within the image minimized potential errors and bias. Instead, the differences between captive and field wolves may be due to better insulation in the captive wolves (either better insulating pelage or more subcutaneous fat insulation) or lower activity levels and metabolic rates in the captive wolves prior to them passing in front of the camera. In addition, areas on the outer leg with intense mange- induced hair loss had higher surface temperatures than the shaved patches of healthy captive wolves (Fig. 3). This could be due to differences in subcu-taneous fat or be related to inflammation associated with the infection. Due to the limited amount of field data on high hair loss, we combined these observations with those from the shaved patches, which potentially biases our ener-getic calculations in a more conservative direction. Second, heat flux increased with increasing ambient temperatures for the trunk and neck portions of captive wolves (Fig. 2), which may be due to physiological factors such as vasodi-lation. Third, there were some cases where the surface of the trunk and neck areas of the captive wolves were colder than the ambient air temperature. This phenomenon was also noted by McCafferty et al. (2013) as being due to radi-ative cooling. With sky and ground temperatures being used in our calculations of radiative heat flux, however, our heat flux estimates were always positive (i.e. from the animal to the environment; Fig. 2).
There are a number of caveats associated with these analyses that warrant discussion. Our sample size of indi-viduals (both captive and field) was relatively small. However, individual differences explained <1% of the variation in surface temperature, and we would not expect large differences in body temperature given that we were accounting for the extent of hair loss, and we were adjust-ing for surface area in our total heat loss calculations. Our analyses assumed that a wolf remained still and exposed to the elements throughout the evening. Seeking shelter from the wind is an obvious behavioral mitigation strategy. The GPS data indicated that wolves were active for around 43% of the evening, and that for the wolf that
Fig. 6. Hourly and daily movements of GPS collared wolves from November to March. (A) Mean hourly distance moved by hair loss category, where hour zero represents midnight. (B) Model predictions of hourly movement based on an adult female wolf in January 2012. Lines represent standard errors based upon 1000 bootstrapped samples that included the variation among individuals. Daytime was from 11:00 am to 3:00 pm. Nighttime was from 10:00 pm to 5:00 am and twilight was all other hours. (C) Boxplot of daily movement distances for the one individual that progressed through all four mange categories.
August 2016 1947ENERGETIC COSTS OF MANGE
progressed to Type III, activity patterns shifted to the daytime. These behavioral mitigation strategies are likely to come with their own consequences. For example, we have seen wolves with intense mange infections that have remained standing while others have slept on the ground, perhaps to minimize conductive heat losses. Finally, we did not incorporate daytime energy losses in our predic-tions because we would then have had to account for the amount of time spent in and out of sunlight, and the effect of coat color and insulation on radiant heat gains (Dawson et al. 2014). Variation in coat color in wolves is an important avenue for further research and has been hypothesized that radiant heat gain underlies the latitu-dinal gradient in wolf coat color (Harcourt 2009).
Parasites are seldom explicitly included in the trophic dynamics of wildlife systems, and when they are most of the focus has been on the prey populations and interac-tions of parasitism and predation on the dynamics of the prey population (Packer et al. 2003, Ostfeld and Holt 2004, Miller et al. 2008, Duffy et al. 2011, Møller et al. 2012). We show here that parasites of predators are also likely to affect predator- prey dynamics and trophic interactions, an interaction that has seldom been studied in this context (but see Wilmers et al. 2006). The additional energy demands imposed by parasites should be reflected in lower trophic levels by altering the consumption of prey by pred-ators, even if predator abundance remains unaffected. This study is one of the first of its kind to link metabolic ecology demands with environmental conditions and parasitism, as well as the first to use an IRT in a remotely deployed wildlife setting. As a result, many of our conclu-sions are tentative and some are extrapolated predictions based on a number of assumptions. Our intent, however, is to prompt further research into how chronic infections may alter trophic dynamics, and provide an example of one approach to integrating metabolic costs into our understanding of such predator- prey systems.
ACKnowlEdgmEnts
We thank P. Cryan, H. Wittmer, and T. Williams for their comments on earlier versions of this paper. C Anton, N Bowersock, MR Ebinger, B Raymond, E Stahler, K Cassidy, B Cassidy all assisted with field data collection. Any use of trade, product, or firm names is for descriptive purposes only and does not imply endorsement by the U.S. Government. This study was supported in part by National Park Service and U.S. Geological Survey through the Park Oriented Biological Support Program, the National Science Foundation grants DEB- 0613730, and DEB- 1245373, and many donors through the Yellowstone Park Foundation. We also thank significant donors to the Yellowstone Wolf Project: an anonymous donor, Annie and Bob Graham and Frank and Kay Yeager.
litErAturE CitEd
Almberg, E. S., P. C. Cross, A. P. Dobson, D. W. Smith, and P. J. Hudson. 2012. Parasite invasion following host reintro-duction: a case study of Yellowstone’s wolves. Philosophical Transactions of the Royal Society B: Biological Sciences 367:2840–2851.
Almberg, E. S., P. C. Cross, A. P. Dobson, D. W. Smith, M. C. Metz, D. R. Stahler, and P. J. Hudson. 2015. Social living mitigates the costs of a chronic illness in a cooperative carni-vore. Ecology Letters 18:660–667.
Arenas, A. J., F. Gómez, R. Salas, P. Carrasco, C. Borge, A. Maldonado, D. J. O’Brien, and F. J. Martínez-Moreno. 2002. An evaluation of the application of infrared thermal imaging to the tele- diagnosis of sarcoptic mange in the Spanish ibex (Capra pyrenaica). Veterinary Parasitology 109:111–117.
Bates, D. M., M. Maechler, B. M. Bolker, and S. C. Walker. 2015. lme4: linear mixed-effects models using Eigen and S4. http://CRAN.R-project.org/package=lme4
Bennett, A. F., and J. A. Ruben. 1979. Endothermy and activity in vertebrates. Science 206:649–654.
Bornstein, S., T. Morner, W. M. Samuel, E. S. Williams, and I. K. Barker. 2001. Sarcoptes scabiei and sarcoptic mange. Pages 107–115 in W. M. Samuels, M. J. Pybus, and A. A. Kocan, editors. Infectious diseases of wild mammals. Second edition. Iowa State University Press, Ames, Iowa, USA.
Dawson, T. J., K. Webster, and S. K. Maloney. 2014. The fur of mammals in exposed environments; Do crypsis and thermal needs necessarily conflict? The polar bear and marsupial koala compared. Journal of Comparative Physiology B 184:273–284.
Diamond, H. J., et al. 2013. U.S. climate reference network after one decade of operations: status and assessment. Bulletin of the American Meterological Society 94:489–498.
Duffy, M. A., J. M. Housley, R. M. Penczykowski, C. E. Cáceres, and S. R. Hall. 2011. Unhealthy herds: indirect effects of predators enhance two drivers of disease spread. Functional Ecology 25:945–953.
Elbroch, L. M., M. L. Allen, B. H. Lowrey, and H. U. Wittmer. 2014. The difference between killing and eating: ecological shortcomings of puma energetic models. Ecosphere 5:53.
ESRI. 2014. ArcGIS desktop: release 10. ESRI, Redlands, California, USA.
Głowacinski, Z., and P. Profus. 1997. Potential impact of wolves (Canis lupus) on prey populations in eastern Poland. Biological Conservation 80:99–106.
Harcourt, A. H. 2009. White wolves can stand the heat. Science 5931:1141–1143.
Jessen, C. 2001. Temperature regulation in humans and other mammals. Springer-Verlag, Berlin, Germany.
Jimenez, M. D., E. E. Bangs, C. Sime, and V. J. Asher. 2010. Sarcoptic mange found in wolves in the Rocky Mountains in western United States. Journal of Wildlife Diseases 46: 1120–1125.
Koteja, P. 2000. Energy assimilation, parental care and the evo-lution of endothermy. Proceedings of the Royal Society B- Biological Sciences 267:479–484.
Mathworks Inc. 2012. MATLAB. The Mathworks, Inc., Natwick, Massachusetts, USA.
McCafferty, D. J. 2007. The value of infrared thermography for research on mammals: previous applications and future direc-tions. Mammal Review 37:207–223.
McCafferty, D. J., C. Gilbert, A.-M. Thierry, J. Currie, Y. Le Maho, and A. Ancel. 2013. Emperor penguin body surfaces cool below air temperature. Biology Letters 9:20121192.
McNab, B. K. 1974. The energetics of endotherms. The Ohio Journal of Science 74:370–380.
Metz, M. C., D. W. Smith, J. A. Vucetich, D. R. Stahler, and R. O. Peterson. 2012. Seasonal patterns of predation for gray wolves in the multi- prey system of Yellowstone National Park. Journal of Animal Ecology 81:553–563.
Miller, M. W., H. M. Swanson, L. L. Wolfe, F. G. Quartarone, S. L. Huwer, C. H. Southwick, and P. M. Lukacs. 2008. Lions and prions and deer demise. PLoS ONE 3:e4019.
1948 Ecology, Vol. 97, No. 8P. C. CROSS ET AL.
Møller, A. P., J. M. Peralta-Sánchez, J. T. Nielsen, E. López-Hernández, and J. J. Soler. 2012. Goshawk prey have more bacteria than non- prey. Journal of Animal Ecology 81: 403–410.
Monteith, J. L., and M. Unsworth. 2008. Principles of environmental physics, Third edition. Elsevier, Burlington, Massachusetts, USA.
Nagy, K. A. 1994. Field bioenergetics of mammals—What determines field metabolic rates? Australian Journal of Zoology 42:43–53.
Ostfeld, R. S., and R. D. Holt. 2004. Are predators good for your health? Evaluating evidence for top- down regulation of zoonotic disease reservoirs. Frontiers in Ecology and the Environment 2:13–20.
Packer, C., R. D. Holt, P. J. Hudson, K. D. Lafferty, and A. P. Dobson. 2003. Keeping the herds healthy and alert: implica-tions of predator control for infectious disease. Ecology Letters 6:797–802.
Pence, D. B., L. A. Windberg, B. C. Pence, and R. Sprowls. 1983. The epizootiology and pathology of sarcoptic mange in coyotes, Canis latrans, from south Texas. Journal of Parasitology 69:1100–1115.
R Development Core Team. 2015. R: a language and environ-ment for statistical computing. R Foundation for Statistical Computing, Vienna, Austria.
Rainwater-Lovett, K., J. M. Pacheco, C. Packer, and L. L. Rodriguez. 2009. Detection of foot- and- mouth disease virus infected cattle using infrared thermography. Veterinary Journal 180:317–324.
Rubner, M. 1982. The laws of energy conservation in nutrition. Academic Press Inc, New York, New York, USA.
Schmidt-Nielsen, K. 1997. Animal physiology: adaptation and environment. Fifth edition. Cambridge University Press, Cambridge UK.
Schneider, C. A., W. S. Rasband, and K. W. Eliceiri. 2012. NIH Image to ImageJ: 25 yr of image analysis. Nature Methods 9:671–675.
Scholander, P. F. 1955. Evolution of climatic adaptation in homeotherms. Evolution 9:15–26.
Scholander, P. F., R. Hock, V. Walters, F. Johnson, and L. Irving. 1950. Heat regulation in some arctic and tropical mammals and birds. The Biological Bulletin 99:237–258.
Selakovic, S., P. C. de Ruiter, and H. Heesterbeek. 2014. Infectious disease agents mediate interaction in food webs and ecosystems. Proceedings of the Royal Society B- Biological Sciences 281:20132709.
Sikes, R. S., W. L. Gannon, and the Animal Care and Use Committee of the American Society of Mammalogists. 2011. Guidelines of the American society of mammalogists for the use of wild mammals in research. Journal of Mammalogy 92:235–253.
Speakman, J. R., and S. Ward. 1998. Infrared thermography: principles and applications. Zoology 101:224–232.
Tomlinson, S., S. G. Arnall, A. Munn, S. D. Bradshaw, S. K. Maloney, K. W. Dixon, and R. K. Didham. 2014. Appli-cations and implications of ecological energetics. Trends in Ecology & Evolution 29:280–290.
USDA. 2015. US Department of Agriculture, Agricultural Research Service, Nutrient Data Laboratory. National Nutrient Database for Standard Reference, Release 28. Version current: September 2015. http://www.ars.usda.gov/nea/bhnrc/ndl
Williams, T. M., L. Wolfe, T. Davis, T. Kendall, B. Richter, Y. Wang, C. Bryce, G. H. Elkaim, and C. C. Wilmers. 2014. Instantaneous energetics of puma kills reveal advantage of felid sneak attacks. Science 346:81–85.
Wilmers, C. C., R. L. Crabtree, D. W. Smith, K. M. Murphy, and W. M. Getz. 2003. Trophic facilitation by introduced top predators : grey wolf subsidies to scavengers in Yellowstone National Park. Journal of Animal Ecology 72:909–916.
Wilmers, C. C., E. Post, R. O. Peterson, and J. A. Vucetich. 2006. Predator disease out- break modulates top- down, bottom- up and climatic effects on herbivore population dynamics. Ecology Letters 9:383–389.
suPPorting inFormAtion
Additional supporting information may be found in the online version of this article at http://onlinelibrary.wiley.com/doi/10.1890/15-1346.1/suppinfo