EnerCom Conference - Amazon Web Services · 2014-08-18 · EnerCom Conference Rick Muncrief...
16
EnerCom Conference Rick Muncrief President & CEO, WPX Energy August 19, 2014
Transcript of EnerCom Conference - Amazon Web Services · 2014-08-18 · EnerCom Conference Rick Muncrief...

EnerCom Conference Rick Muncrief
President & CEO, WPX Energy
August 19, 2014
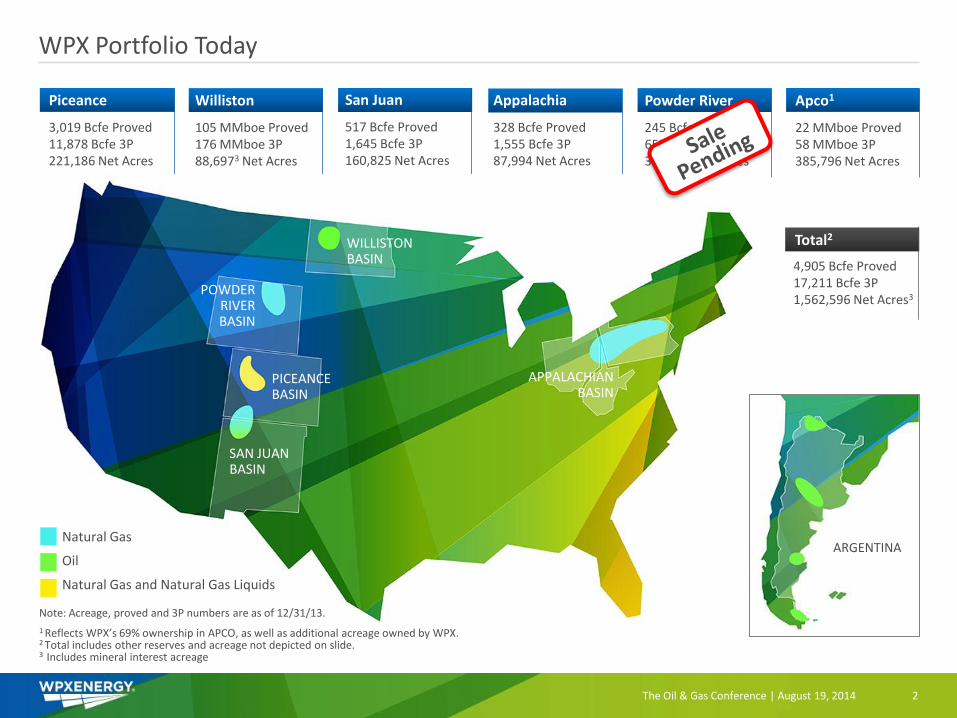
WPX Portfolio Today
The Oil & Gas Conference | August 19, 2014 2
Piceance
3,019 Bcfe Proved 11,878 Bcfe 3P 221,186 Net Acres
Williston
105 MMboe Proved 176 MMboe 3P 88,6973 Net Acres
Powder River
245 Bcfe Proved 657 Bcfe 3P 360,002 Net Acres
Apco1
22 MMboe Proved 58 MMboe 3P 385,796 Net Acres
Total Domestic
4,905 Bcfe Proved 17,211 Bcfe 3P 1,562,596 Net Acres3
Total2
San Juan
517 Bcfe Proved 1,645 Bcfe 3P 160,825 Net Acres
POWDER RIVER BASIN
PICEANCE BASIN
SAN JUAN BASIN
APPALACHIAN BASIN
WILLISTON BASIN
Natural Gas
Oil
Natural Gas and Natural Gas Liquids
Note: Acreage, proved and 3P numbers are as of 12/31/13.
1 Reflects WPX’s 69% ownership in APCO, as well as additional acreage owned by WPX. 2 Total includes other reserves and acreage not depicted on slide. 3 Includes mineral interest acreage
ARGENTINA
Appalachia
328 Bcfe Proved 1,555 Bcfe 3P 87,994 Net Acres

Industry Recognition and Awards
3 The Oil & Gas Conference | August 19, 2014
40+Awards
Innovation Colorado Oil and Gas
Drilling Innovation Award
Excellence Oil and Gas Investor
Best Discovery Award
Involvement Community Involvement
Award

2nd Quarter Highlights
Domestic oil production up 57% 2Q ’14 vs. 2Q ’13
► Domestic oil production grew 23% 2Q ’14 vs. 1Q ’14
Adjusted EBITDAX increased 40% 2Q ’14 vs. 2Q ’13
► Domestic oil revenue grew 60% quarter over quarter
Adding nearly 200 locations in the Williston
► Premium location adds in the highest quality rock in the play
Increasing San Juan Gallup spuds from 29 to 40
► ~40% increase in spuds without increasing rig count
Increased full year oil production guidance by 10%
4 The Oil & Gas Conference | August 19, 2014

Piceance Basin
5 The Oil & Gas Conference | August 19, 2014
More than 12,000 drillable locations
Excess infrastructure
Access to premium market
#1 Energy Producer in Colorado

Piceance Operations
Currently running 9 rigs
2nd quarter net production 691 MMcfe/d
► Natural gas 584 MMcf/d
► NGL 15.8 Mbbl/d
► Oil 2.0 Mbbl/d
Lowest-cost operator
► 34% less D&C capital cost1
► 57% less operating lifting cost2
State-of-the-art water management system
Successful Ryan Gulch 10-acre density
Exploratory efforts in the Niobrara
¹Utilizing data from eight 2012 Rulison field non-op wells 2Utilizing data from 215 Valley non-op wells – total well expense
6 The Oil & Gas Conference | August 19, 2014
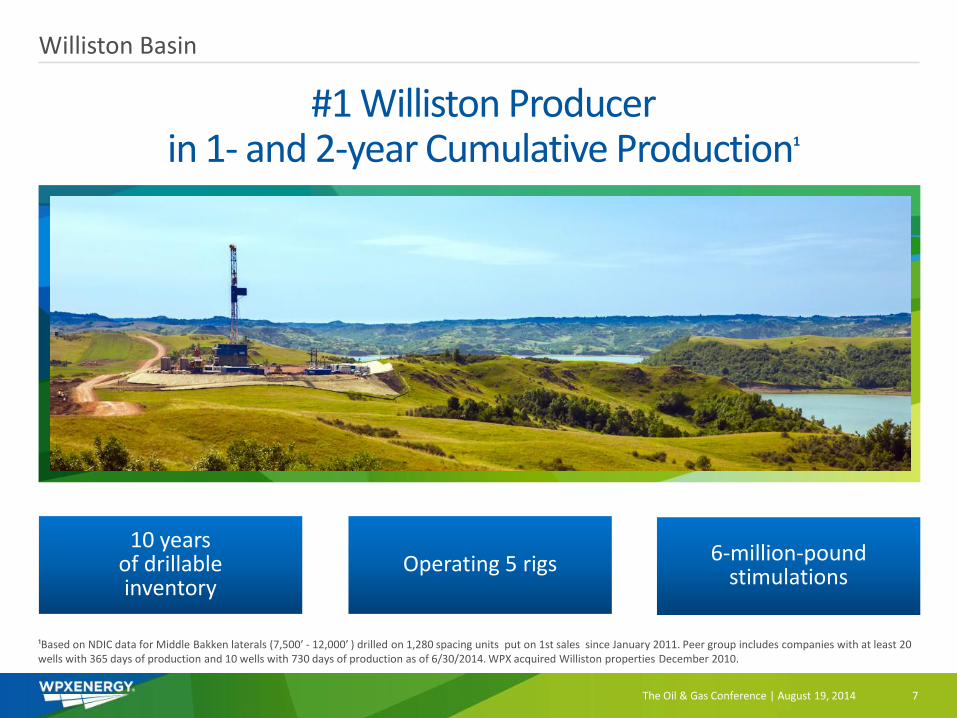
Williston Basin
#1 Williston Producer in 1- and 2-year Cumulative Production1
7 The Oil & Gas Conference | August 19, 2014
10 years of drillable inventory
Operating 5 rigs 6-million-pound stimulations
¹Based on NDIC data for Middle Bakken laterals (7,500’ - 12,000’ ) drilled on 1,280 spacing units put on 1st sales since January 2011. Peer group includes companies with at least 20 wells with 365 days of production and 10 wells with 730 days of production as of 6/30/2014. WPX acquired Williston properties December 2010.

The Oil & Gas Conference | August 19, 2014 8
1-Yr and 2-Yr Cumulative Production per Well1 (Based on productive days)
Average 365-day cumulative production per well of 140.9 Mbo, 64% higher than the peer average
Average 730-day cumulative production per well of 224.2 Mbo, 62% higher than the peer average
WPX is #1 in Middle Bakken Cumulative Production
Peer 2-Yr Cumulative Production per Well
Peer 1-Yr Cumulative Production per Well
WPX 2-Yr Cumulative Production per Well
WPX 1-Yr Cumulative Production per Well
0.00
50,000.00
100,000.00
150,000.00
200,000.00
250,000.00
WP
X
ZAV
AN
NA
SLA
WSO
N
WH
ITIN
G
BU
RLI
NG
TON
QEP
EN
ERG
Y
SM E
NER
GY
MA
RA
THO
N
NEW
FIEL
D
CO
NTI
NEN
TAL
EOG
RES
OU
RC
ES
DEN
BU
RY
ON
SHO
RE
HES
S
OA
SIS
HU
NT
ZEN
ERG
Y
XTO
EN
ERG
Y
HR
C O
PER
ATI
NG
PET
RO
-HU
NT
MU
REX
PET
RO
LEU
M
OX
Y U
SA
SAM
SON
RES
OU
RC
ES
Peer 2-Yr Avg Peer 1-Yr Avg
¹Based on NDIC data for Middle Bakken laterals (7,500’ - 12,000’ ) drilled on 1,280 spacing units put on 1st sales since January 2011. Peer group includes companies with at least 20 wells with 365 days of production and 10 wells with 730 days of production as of 6/30/2014. WPX acquired Williston properties December 2010.

San Juan Basin
#1 Returns in the WPX Portfolio
9 The Oil & Gas Conference | August 19, 2014
Rapidly growing oil production
Diversified product mix
Over 30 years’ experience

0
10
20
30
40
50
60
70
0 100 200 300 400 500 600
Avg
Gro
ss C
um
ula
tive
Oil
Pro
du
ctio
n (
Mb
bl)
Days
2013 Spuds
2014 Spuds
13 Wells 15 Wells
San Juan Gallup 2014 Well Performance Exceeding 2013
The Oil & Gas Conference | August 19, 2014 10
Improving oil production from 2013 to 2014
► Average gross cumulative oil production grew by ~40%
► First 140 days of production
~40% Increase from 2013 to 2014
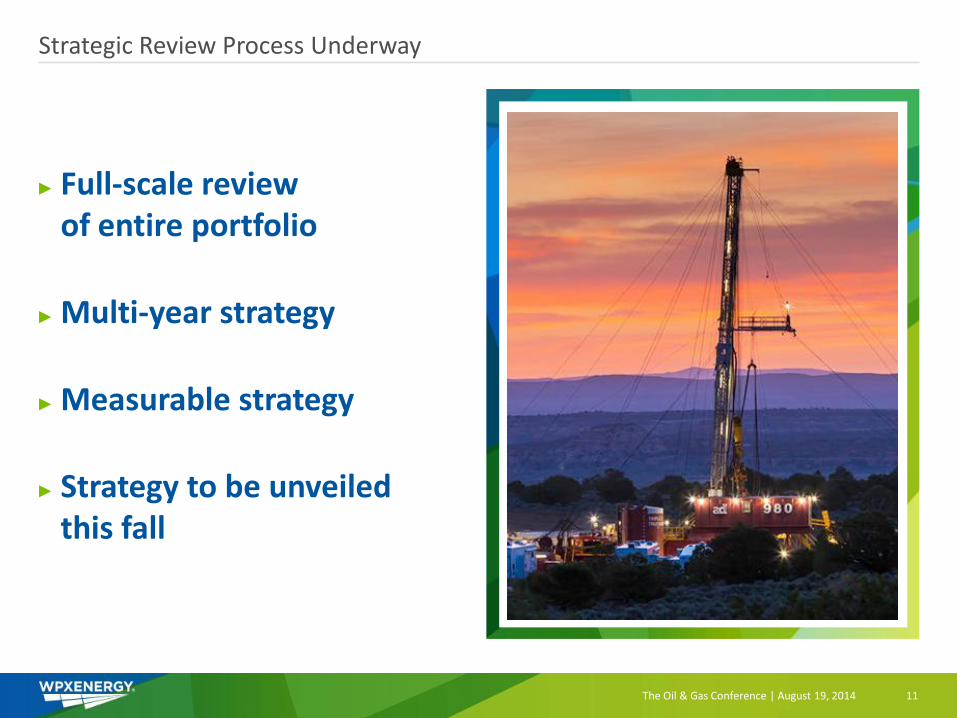
Strategic Review Process Underway
► Full-scale review of entire portfolio
► Multi-year strategy
► Measurable strategy
► Strategy to be unveiled this fall
11 The Oil & Gas Conference | August 19, 2014

Historical Commodity Snapshot
In recent years, oil and natural gas have been range bound
► Since 2011, 81% of days were over $90/bbl; 87% of days were under $105
► Since 2011, 81% of days were over $3/MBtu; 98% of days were under $5
WTI
$/b
bl
12 The Oil & Gas Conference | August 19, 2014
$1.00
$3.00
$5.00
$7.00
$9.00
$11.00
$13.00
$30.00
$50.00
$70.00
$90.00
$110.00
$130.00
$150.00
Jan
-07
M
ar-0
7
May
-07
Ju
l-0
7
Sep
-07
N
ov-
07
Ja
n-0
8
Mar
-08
M
ay-0
8
Jul-
08
Se
p-0
8
No
v-0
8
Jan
-09
M
ar-0
9
May
-09
Ju
l-0
9
Sep
-09
N
ov-
09
Ja
n-1
0
Mar
-10
M
ay-1
0
Jul-
10
Se
p-1
0
No
v-1
0
Jan
-11
M
ar-1
1
May
-11
Ju
l-1
1
Sep
-11
N
ov-
11
Ja
n-1
2
Mar
-12
M
ay-1
2
Jul-
12
Se
p-1
2
No
v-1
2
Jan
-13
M
ar-1
3
May
-13
Ju
l-1
3
Sep
-13
N
ov-
13
Ja
n-1
4
Mar
-14
M
ay-1
4
Jul-
14
Natu
ral Gas $
/MB
tu
Oil
Gas
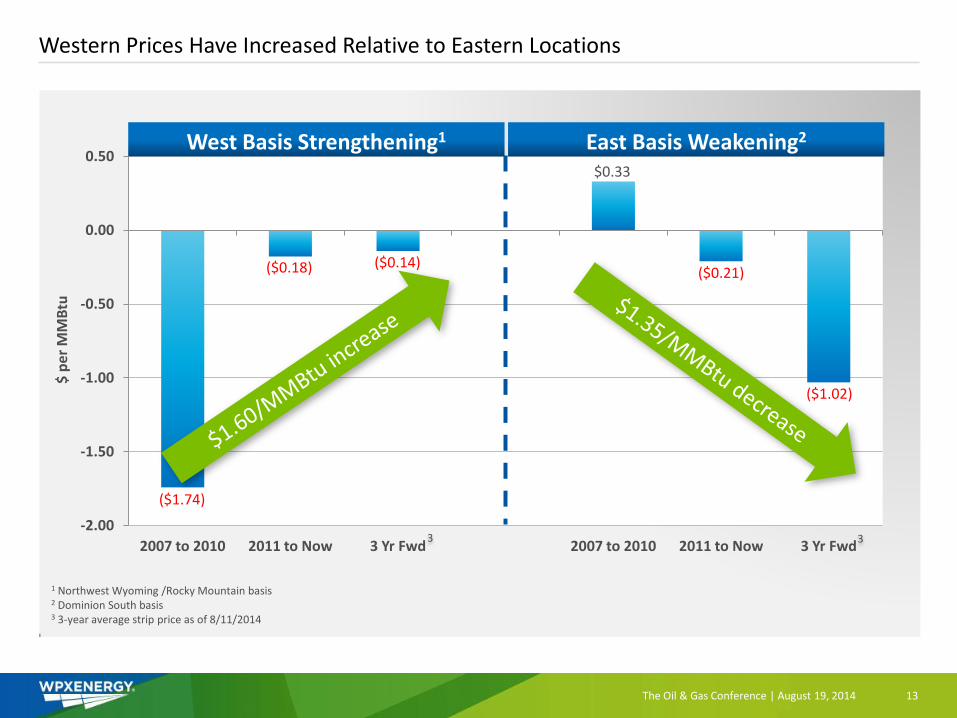
Western Prices Have Increased Relative to Eastern Locations
13 The Oil & Gas Conference | August 19, 2014
1 Northwest Wyoming /Rocky Mountain basis 2 Dominion South basis 3 3-year average strip price as of 8/11/2014
-2.00
-1.50
-1.00
-0.50
0.00
0.50
2007 to 2010 2011 to Now 3 Yr Fwd 2007 to 2010 2011 to Now 3 Yr Fwd
($1.74)
($0.18) ($0.14)
$0.33
($0.21)
($1.02)
West Basis Strengthening1 East Basis Weakening2
$ p
er M
MB
tu
3 3

Shifting to Pure Play E&P Mindset
“We are building one culture, one organization, one mission.”
14 The Oil & Gas Conference | August 19, 2014
More Nimble
View Asset Base in
New Way
Focus on Profitability
Greater Risk
Tolerance

WPX Long-Term Vision Coming Into Focus
The Oil & Gas Conference | August 19, 2014 15
Company Strategy
Integrity Scalability Identity

The Oil & Gas Conference | August 19, 2014 16