En Presentation Merrill Lynch Oct2011 Presentation Banco Sabadell (1)
36
Banco Sabadell BoAML Banki ng & Insurance CEO Conference Jaime Guardi ola, Consejero Delegado October 5 th , 2011
Transcript of En Presentation Merrill Lynch Oct2011 Presentation Banco Sabadell (1)
8/3/2019 En Presentation Merrill Lynch Oct2011 Presentation Banco Sabadell (1)
http://slidepdf.com/reader/full/en-presentation-merrill-lynch-oct2011-presentation-banco-sabadell-1 1/35
Banco Sabadell
BoAML Banking & Insurance CEOConference
Jaime Guardiola, Consejero DelegadoOctober 5th, 2011

8/3/2019 En Presentation Merrill Lynch Oct2011 Presentation Banco Sabadell (1)
http://slidepdf.com/reader/full/en-presentation-merrill-lynch-oct2011-presentation-banco-sabadell-1 2/35
2
Disclaimer
Banco Sabadell cautions that this presentation may contain forward looking statements with respect to thebusiness. financial condition. results of operations. strategy. plans and objectives of the Banco Sabadell Group.While these forward looking statements represent our judgement and future expectations concerning the
development of our business. a certain number of risks. uncertainties and other important factors could cause
actual developments and results to differ materially from our expectations. These factors include. but are notlimited to. (1) general market. Macroeconomic. governmental. political and regulatory trends. (2) movements inlocal and international securities markets. currency exchange rate. and interest rates. (3) competitive pressures.(4) technical developments. (5) changes in the financial position or credit worthiness of our customers. obligorsand counterparts. These risk factors could adversely affect our business and financial performance published inour past and future filings and reports. including those with the Spanish Securities and Exchange Commission(Comisión Nacional del Mercado de Valores).
Banco Sabadell is not nor can it be held responsible for the usage. valuations. opinions. expectations ordecisions which might be adopted by third parties following the publication of this information.
Financial information by business areas is presented according to GAAP as well as internal Banco Sabadellgroup´s criteria as a result of which each division reflects the true nature of its business. These criteria do not
follow any particular regulation and can include forecasts and subjective valuations which could represent
substantial differences should another methodology be applied.
The distribution of this presentation in certain jurisdictions may be restricted by law. Recipients of thispresentation should inform themselves about and observe such restrictions.
These slides do not constitute or form part of any offer for sale or subscription of or solicitation or invitation ofany offer to buy or subscribe to any securities nor shall they or any one of them form the basis of or be relied onin connection with any contract or commitment whatsoever.

8/3/2019 En Presentation Merrill Lynch Oct2011 Presentation Banco Sabadell (1)
http://slidepdf.com/reader/full/en-presentation-merrill-lynch-oct2011-presentation-banco-sabadell-1 3/35
3
1. Economic environment
2. Liquidity and funding
3. Commercial activity4. Asset quality and real estate
Index

8/3/2019 En Presentation Merrill Lynch Oct2011 Presentation Banco Sabadell (1)
http://slidepdf.com/reader/full/en-presentation-merrill-lynch-oct2011-presentation-banco-sabadell-1 4/35
4
1. Economicenvironment

8/3/2019 En Presentation Merrill Lynch Oct2011 Presentation Banco Sabadell (1)
http://slidepdf.com/reader/full/en-presentation-merrill-lynch-oct2011-presentation-banco-sabadell-1 5/35
5
-30
-20
-10
0
10
2006 2007 2008 2009 2010 2011
4Q10 1Q11 2Q11
GDP (% chg. QoQ) 0.2 0.4 0.2
Private consumption 0.3 -0.1 0.6
Inv. capital equipment 1.2 0.0 0.3
Inv. construction -3.1 -2.8 -0.9
Exports 3.9 5.8 -1.9
GDP (% chg. YoY) 0.6 0.9 0.7
Spain's economy has stabilised
Sources: INE and European Commission
Industrial output(% chg. YoY)
Consumer confidence(level)
-50
-40
-30
-20
-10
0
2006 2007 2008 2009 2010 2011
8/3/2019 En Presentation Merrill Lynch Oct2011 Presentation Banco Sabadell (1)
http://slidepdf.com/reader/full/en-presentation-merrill-lynch-oct2011-presentation-banco-sabadell-1 6/35
6
-8
-4
0
4
8
2000 2002 2004 2006 2008 2010
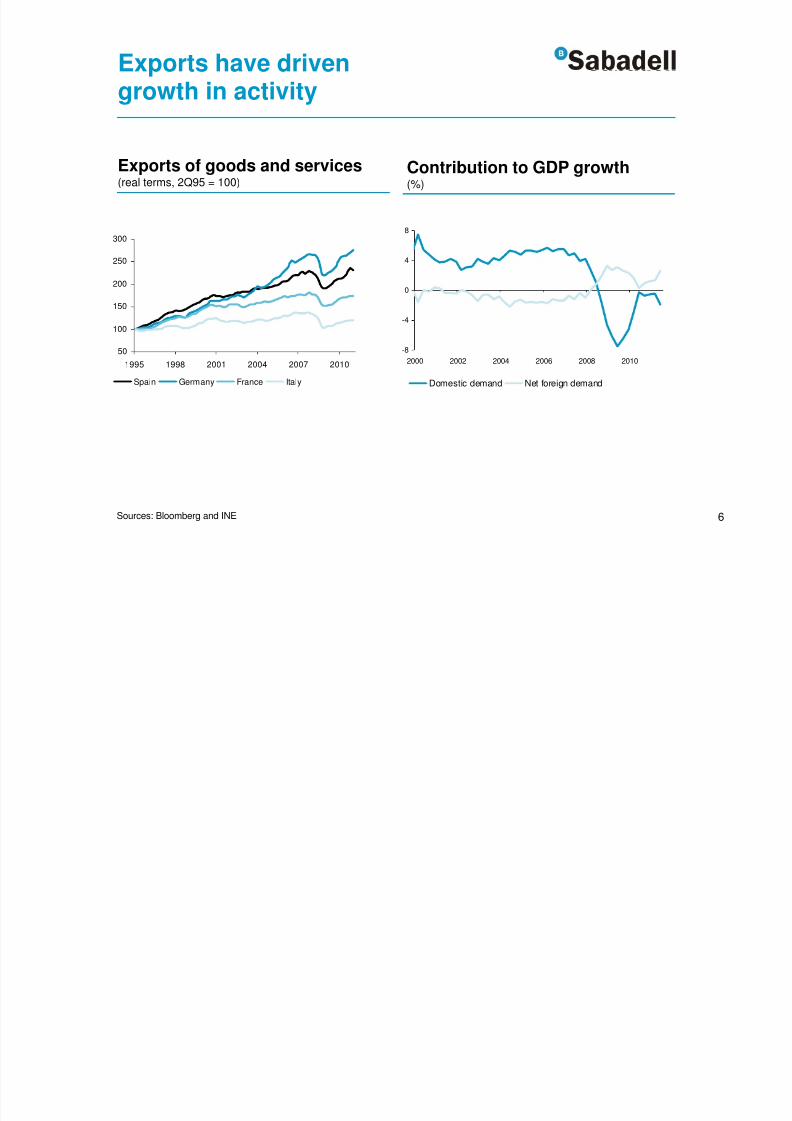
Domestic demand Net foreign demand
Sources: Bloomberg and INE
Exports of goods and services(real terms, 2Q95 = 100)
50
100
150
200
250
300
1995 1998 2001 2004 2007 2010
Spain Germany France Italy
Exports have driven
growth in activity
Contribution to GDP growth(%)
8/3/2019 En Presentation Merrill Lynch Oct2011 Presentation Banco Sabadell (1)
http://slidepdf.com/reader/full/en-presentation-merrill-lynch-oct2011-presentation-banco-sabadell-1 7/35
8/3/2019 En Presentation Merrill Lynch Oct2011 Presentation Banco Sabadell (1)
http://slidepdf.com/reader/full/en-presentation-merrill-lynch-oct2011-presentation-banco-sabadell-1 8/35
50
55
60
65
7075
80
85
90
95
2 0 1 0
2 0 1 1
2 0 1 2
2 0 1 3
2 0 1 4
2 0 1 5
2 0 1 6
2 0 1 7
2 0 1 8
2 0 1 9
2 0 2 0
2 0 2 1
2 0 2 2
2 0 2 3
2 0 2 4
2 0 2 5
8
3
4
5
6
2000 2002 2004 2006 2008 2010
0
40
80
120
160
SP FR GE PT IE IT GR
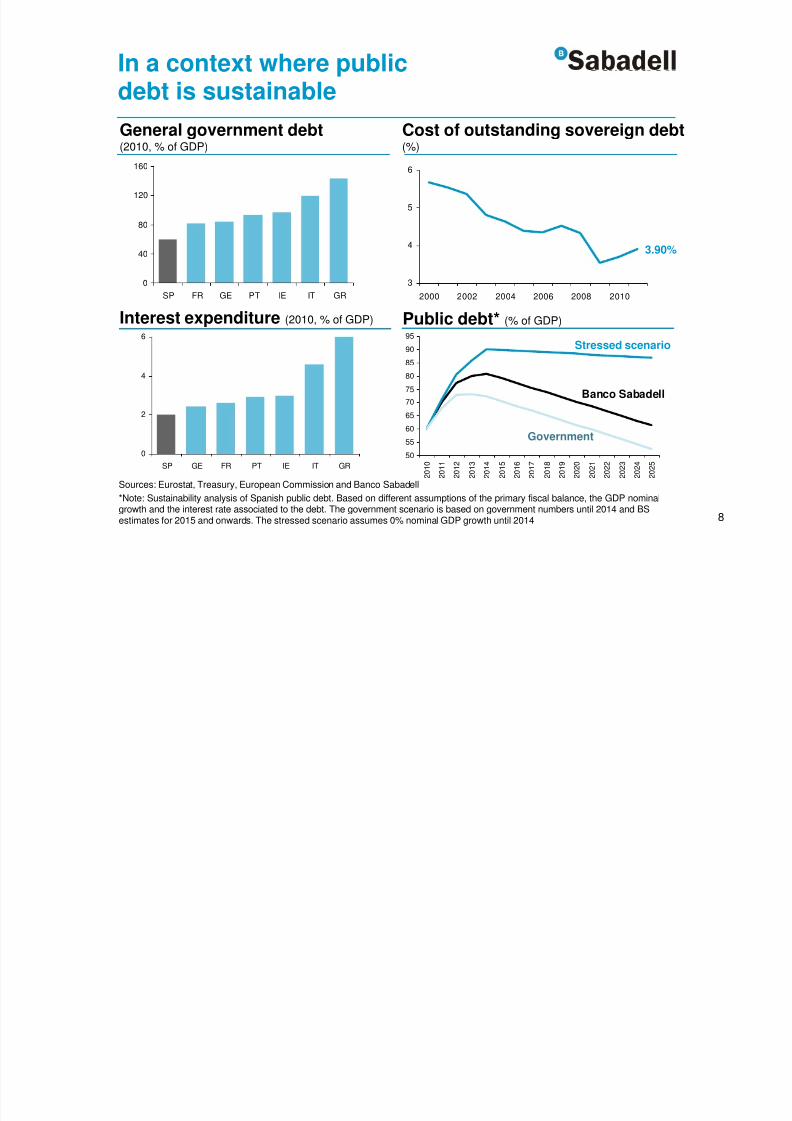
3.90%
0
2
4
6
SP GE FR PT IE IT GR
In a context where public
debt is sustainable
Sources: Eurostat, Treasury, European Commission and Banco Sabadell*Note: Sustainability analysis of Spanish public debt. Based on different assumptions of the primary fiscal balance, the GDP nominalgrowth and the interest rate associated to the debt. The government scenario is based on government numbers until 2014 and BSestimates for 2015 and onwards. The stressed scenario assumes 0% nominal GDP growth until 2014
Public debt* (% of GDP)
General government debt(2010, % of GDP)
Cost of outstanding sovereign debt(%)
Interest expenditure (2010, % of GDP)
Stressed scenario
Banco Sabadell
Government

8/3/2019 En Presentation Merrill Lynch Oct2011 Presentation Banco Sabadell (1)
http://slidepdf.com/reader/full/en-presentation-merrill-lynch-oct2011-presentation-banco-sabadell-1 9/35
9
Progress is being made with
structural reforms
Progress in structural reformsFiscal governance reform
• Law tying spending to medium-termeconomic growth
• Budget stability enshrined inConstitution, limiting the structuraldeficit
• Greater transparency in regionalgovernments' fiscal information
• Labour market and pension systemreform
• Measures to reduce the paperwork for
creating companies
• Restructuring of the financial systemand greater transparency in financialsystem exposure to construction and
real estate development
8/3/2019 En Presentation Merrill Lynch Oct2011 Presentation Banco Sabadell (1)
http://slidepdf.com/reader/full/en-presentation-merrill-lynch-oct2011-presentation-banco-sabadell-1 10/35
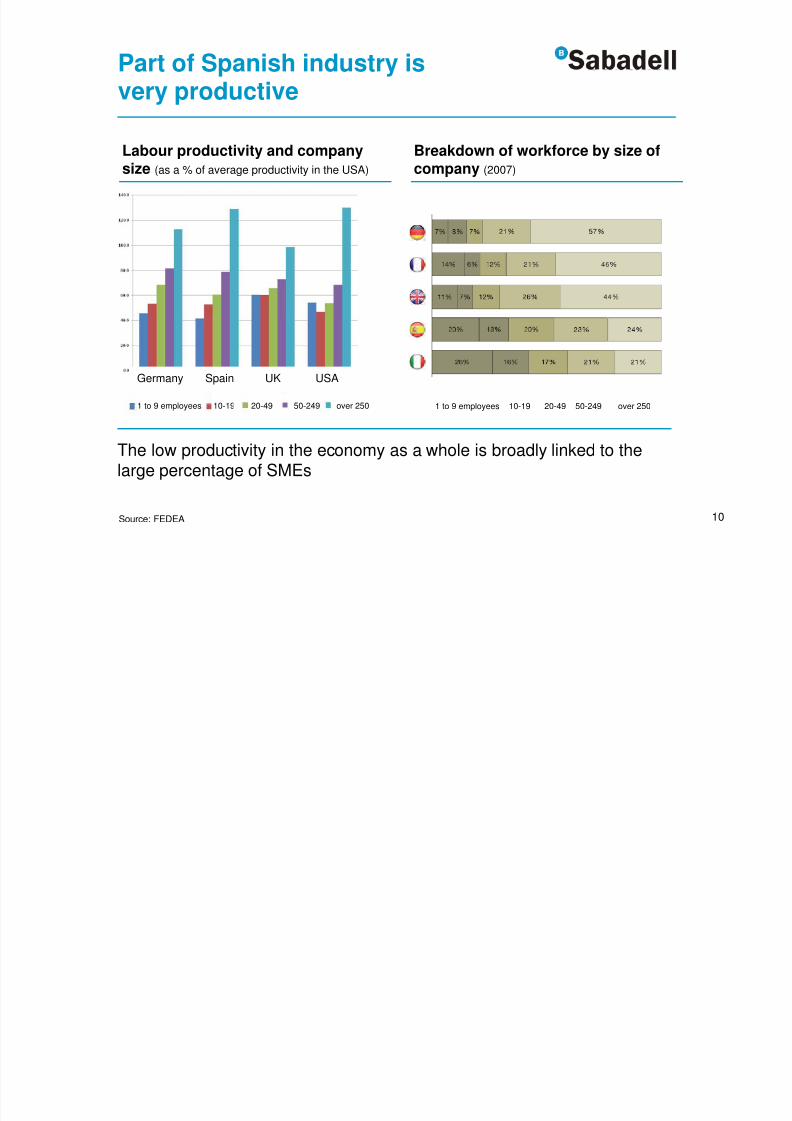
10Source: FEDEA
Labour productivity and companysize (as a % of average productivity in the USA)
The low productivity in the economy as a whole is broadly linked to thelarge percentage of SMEs
Breakdown of workforce by size ofcompany (2007)
Germany Spain UK USA
Part of Spanish industry is
very productive
1 to 9 employees 10-19 20-49 50-249 over 2501 to 9 employees 10-19 20-49 50-249 over 250

8/3/2019 En Presentation Merrill Lynch Oct2011 Presentation Banco Sabadell (1)
http://slidepdf.com/reader/full/en-presentation-merrill-lynch-oct2011-presentation-banco-sabadell-1 11/35
11
95
97
99
101
103
105
107
109
dic-07 jun-08 d ic-08 jun-09 d ic-09 jun-10 d ic-10
Spain Eurozone
Real labour productivity per capitain Spain (2000 = 100)
Improvement in the behaviour of
productivity and unit labour costs
Labour costs in Spain(% chg. YoY)
99
101
103
105
107
109
2000 2002 2004 2006 2008 2010
-1
0
1
2
3
45
6
2001 2003 2005 2007 2009 2011
100
102
104
106
108
2007 2008 2008 2009 2009 2010 2010
Spain Eurozone
Unit labour costs(Dec. 07 = 100)
Sources: INE, Eurostat and Bank of Spain
Real labour productivity percapita (Dec. 07 = 100)

8/3/2019 En Presentation Merrill Lynch Oct2011 Presentation Banco Sabadell (1)
http://slidepdf.com/reader/full/en-presentation-merrill-lynch-oct2011-presentation-banco-sabadell-1 12/35
12
40
45
50
55
60
65
S p a i n
G e r m
a n y
B e l g i u m
S w e d
e n
A u s t r i a
I r e l a n
d
F r a n
c e U K I t a l y
G r e e
c e
H o l l a
n d
P o r t u
g a l
Spanish companies are gradually refocusing their exports on marketswith greater growth potential
Sources: Goldman Sachs and COMTRADE
*Note: Index of price elasticity of exports (Goldman Sachs). Indicates how skewed a country exports are towards price inelastic goods.The higher the score on the index, the smaller the impact on export performance related to price changes. A higher score indicates thatnon-price factors dominate exports.
Exports' price sensitivity* Share of services exports (2000=100)
60
80
100
120
140
2000 2002 2004 2006 2008 2010
Spain GermanyUnited States France
Competitive position of
Spanish companies
Lower pricesensitivity

8/3/2019 En Presentation Merrill Lynch Oct2011 Presentation Banco Sabadell (1)
http://slidepdf.com/reader/full/en-presentation-merrill-lynch-oct2011-presentation-banco-sabadell-1 13/35
13
2. Liquidity andfunding

8/3/2019 En Presentation Merrill Lynch Oct2011 Presentation Banco Sabadell (1)
http://slidepdf.com/reader/full/en-presentation-merrill-lynch-oct2011-presentation-banco-sabadell-1 14/35
14
The challenging environment in
Europe increases concerns …Corporate Bond Holdings of USPrimary Dealers (USD bn)
Financial CDS 5Y in Europe(basis points)
ECB: Public Debt holdings underthe security market program (€ bn)
Stock exchange(Jan11 = 100)
Sources: Morgan Stanley, ECB and Bloomberg
0
100
200
300
400
500
600
2007 2008 2009 2010 2011Senior Subordinated
0
20
40
60
80
100
120
140
160
May-10 Aug-10 Nov-10 Feb-11 May-11 Aug-11
60
80
100
120
Jan-11 Mar-11 May-11 Jul-11 Sep-11
US (S&P500) Germany (DAX)
Spain (IBEX) Brazil (BOVESPA)
8/3/2019 En Presentation Merrill Lynch Oct2011 Presentation Banco Sabadell (1)
http://slidepdf.com/reader/full/en-presentation-merrill-lynch-oct2011-presentation-banco-sabadell-1 15/35
15
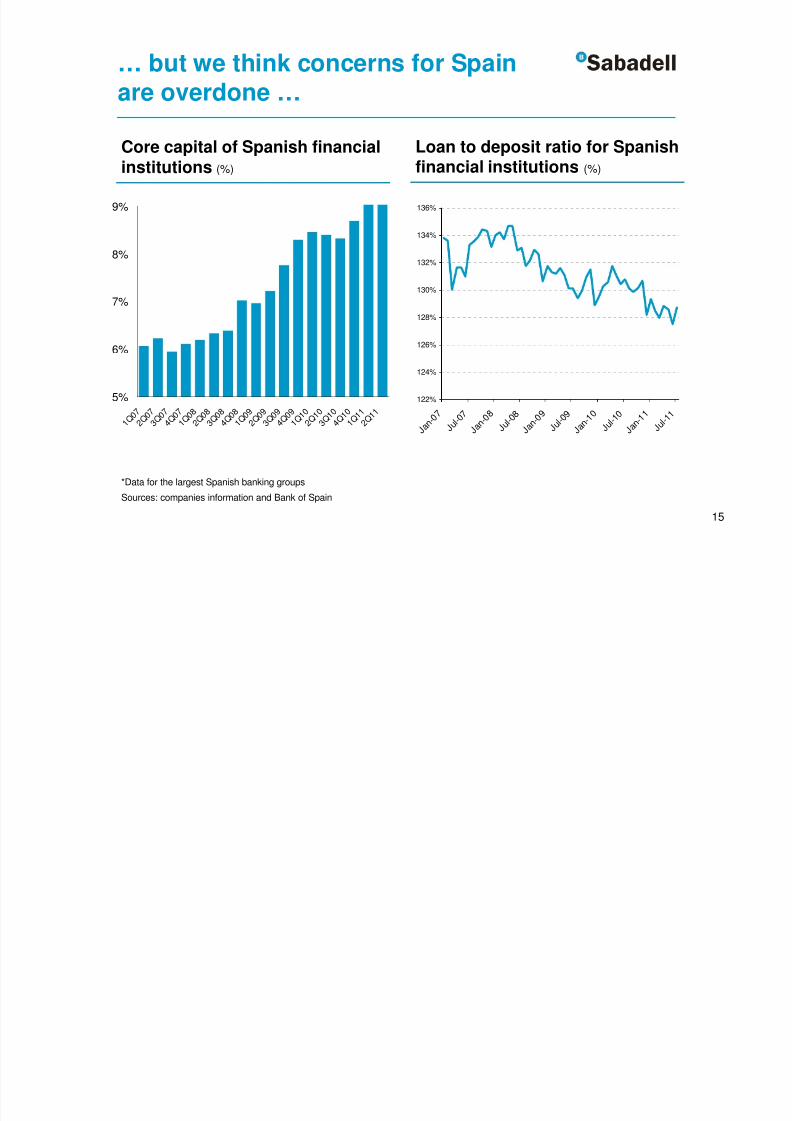
… but we think concerns for Spain
are overdone …
5%
6%
7%
8%
9%
1 Q 0 7
2 Q 0 7
3 Q 0 7
4 Q 0 7
1 Q 0 8
2 Q 0 8
3 Q 0 8
4 Q 0 8
1 Q 0 9
2 Q 0 9
3 Q 0 9
4 Q 0 9
1 Q 1 0
2 Q 1 0
3 Q 1 0
4 Q 1 0
1 Q 1 1
2 Q 1 1
*Data for the largest Spanish banking groups
Sources: companies information and Bank of Spain
Core capital of Spanish financialinstitutions (%)
Loan to deposit ratio for Spanishfinancial institutions (%)
122%
124%
126%
128%
130%
132%
134%
136%
J a n - 0 7
J u l - 0
7
J a n - 0 8
J u l - 0
8
J a n - 0 9
J u l - 0
9
J a n - 1 0
J u l - 1
0
J a n - 1 1
J u l - 1
1

8/3/2019 En Presentation Merrill Lynch Oct2011 Presentation Banco Sabadell (1)
http://slidepdf.com/reader/full/en-presentation-merrill-lynch-oct2011-presentation-banco-sabadell-1 16/35
16
ECB and central banks net liquidityprovision for European financial
institutions (as % of total assets)
0
2
4
6
8
10
12
14
2007 2008 2009 2010 2011
0
5
10
15
20
25
Ireland Portugal Spain
Germany Italy France
Greece (rhs)
ECB net liquidity provision andtotal assets in the European
context (€ bn and %)
… in light of fundamentals
Source: ECB, July & August 2011 data
ECB and
central
banks
liquidity
provision
as % of
total
liquidity
provision
Total
domestic
assets
as % of
total
domestic
assetsGermany 58 10% 8,001 25%
France 29 5% 7,979 25%
Italy 85 14% 3,848 12%
Spain 81 14% 3,553 11%
Greece 112 19% 502 2%
Portugal 46 8% 570 2%Ireland 154 26% 1,377 4%
Total 596 32,154
8/3/2019 En Presentation Merrill Lynch Oct2011 Presentation Banco Sabadell (1)
http://slidepdf.com/reader/full/en-presentation-merrill-lynch-oct2011-presentation-banco-sabadell-1 17/35
17
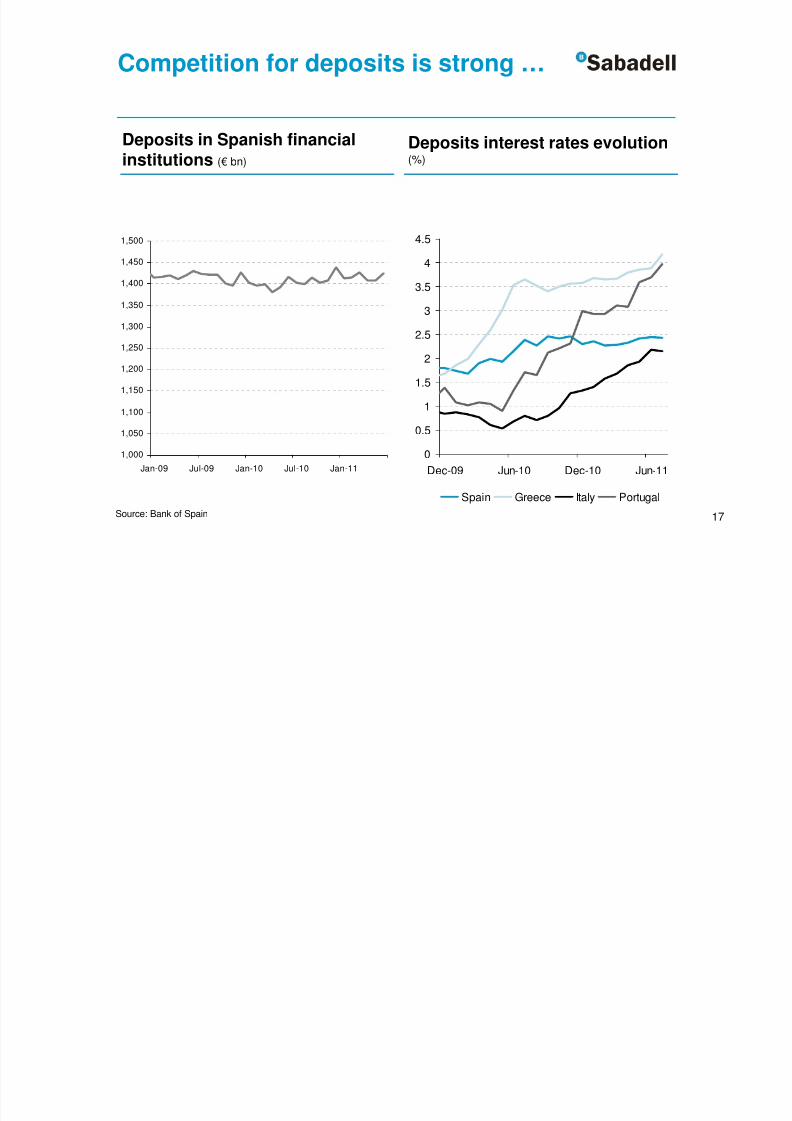
Competition for deposits is strong …
Deposits in Spanish financialinstitutions (€ bn)
1,000
1,050
1,100
1,150
1,200
1,250
1,300
1,350
1,400
1,450
1,500
Jan-09 Jul-09 Jan-10 Jul-10 Jan-11
Deposits interest rates evolution(%)
0
0.5
1
1.5
2
2.5
3
3.5
4
4.5
Dec-09 Jun-10 Dec-10 Jun-11
Spain Greece Italy Portugal
Source: Bank of Spain

8/3/2019 En Presentation Merrill Lynch Oct2011 Presentation Banco Sabadell (1)
http://slidepdf.com/reader/full/en-presentation-merrill-lynch-oct2011-presentation-banco-sabadell-1 18/35
18
… but BS has managed to increase itsdeposit base in the last quarters
BS deposit market share(%)
BS deposits evolution(€ m)
30,000
35,000
40,000
45,000
50,000
55,000
4Q08 1Q09 2Q09 3Q09 4Q091Q0102Q10 3Q10 4Q10 1Q11 2Q11
Total Deposits Acquisition BG New Deposits
2009 +€ 2.0bn
2010 +€ 6.3bn(excl. BG)
2011 YTD+€ 1.6bn
2
2.2
2.4
2.6
2.8
3
3.2
3.4
3.6
3.8
J u n - 0
7
O c t - 0
7
F e b -
0 8
J u n - 0
8
O c t - 0
8
F e b -
0 9
J u n - 0
9
O c t - 0
9
F e b -
1 0
J u n - 1
0
O c t - 1
0
F e b -
1 1
J u n - 1
1
Source: Bank of Spain

8/3/2019 En Presentation Merrill Lynch Oct2011 Presentation Banco Sabadell (1)
http://slidepdf.com/reader/full/en-presentation-merrill-lynch-oct2011-presentation-banco-sabadell-1 19/35
19
Most of our deposit base has
maturities over one year …
BS back book deposits by maturity(%)
BS deposit base by segment(%)
SMEs and
Corporates
41%
Retailers and
self-employed
8%
Other sectors
5%
Public sector
3%
Individuals
43%
9%
7%
37%
48%
Term deposit over 12 months
Term deposit 12 months
Term deposit 6 months
Term deposit 3 months

8/3/2019 En Presentation Merrill Lynch Oct2011 Presentation Banco Sabadell (1)
http://slidepdf.com/reader/full/en-presentation-merrill-lynch-oct2011-presentation-banco-sabadell-1 20/35
20
… giving us more margin to actively
manage spreads
Product jun-10 jun-11 Var YoY jun-10 jun-11 Var YoY
Credits 233 264 +31 174 223 +49Loans 156 247 +91 156 194 +38
Mortgages to individuals 81 116 +35 74 78 +4
Leasing 161 206 +45 97 113 +16
Commercial loans 242 290 +48 267 309 +42
Confirming 184 225 +41 168 237 +69
Forfaiting 263 225 -38 183 215 +32
Total loans 168 230 +62 134 157 +23
Term deposit 1 month 104 86 -18 86 69 -17
Term deposit 3 months 157 103 -54 99 69 -30
Term deposit 6 months 220 107 -113 121 113 -8
Term deposit 12 months 210 109 -101 165 160 -5
Term deposit 18 months 194 160 -34 163 191 +28
Term deposit 2 years 219 176 -43 160 204 +44
Term deposits 3 years 198 179 -19 89 134 +45
Deposits 182 116 -66 149 157 +8
Front book spreads Back book spreads
In basis points
Jun-10 Jun-11 Jun-10 Jun-11

8/3/2019 En Presentation Merrill Lynch Oct2011 Presentation Banco Sabadell (1)
http://slidepdf.com/reader/full/en-presentation-merrill-lynch-oct2011-presentation-banco-sabadell-1 21/35
21
3. Commercial activity

8/3/2019 En Presentation Merrill Lynch Oct2011 Presentation Banco Sabadell (1)
http://slidepdf.com/reader/full/en-presentation-merrill-lynch-oct2011-presentation-banco-sabadell-1 22/35
22
Attracting new clients…
Monthly new individual customers Monthly new company customers
0
5,000
10,000
15,000
20,000
25,000
30,000
Jan Feb Mar Apr May Jun Jul Aug Sep Oct Nov Dec
2010 2011
0
1,000
2,000
3,000
4,000
5,000
6,000
7,000
Jan Feb Mar Apr May Jun Jul Aug Sep Oct Nov Dec
2010 2011
Target 2011: 290,000
new customers
Target 2011: 50,000
new customers
Performance in line with CREA targets

8/3/2019 En Presentation Merrill Lynch Oct2011 Presentation Banco Sabadell (1)
http://slidepdf.com/reader/full/en-presentation-merrill-lynch-oct2011-presentation-banco-sabadell-1 23/35
23
… and growing market shares in
individuals …
Total sight deposits
3.88%
4.29%
Jun. 10
Jun. 11
+41 bps
2.06%
2.52%
Jun. 10
Jun. 11
Payrolls
+46 bps
Credit card invoicing (quarterly)
3.20%
2.74%Jun. 10
Jun. 11
+46 bps
2,94%
3.51%
Jun. 10
Jun. 11
+57 bps
1 Including cheques, transfers, SEPA transfers, receivables and promissory notes
Transactionality1
8/3/2019 En Presentation Merrill Lynch Oct2011 Presentation Banco Sabadell (1)
http://slidepdf.com/reader/full/en-presentation-merrill-lynch-oct2011-presentation-banco-sabadell-1 24/35
24
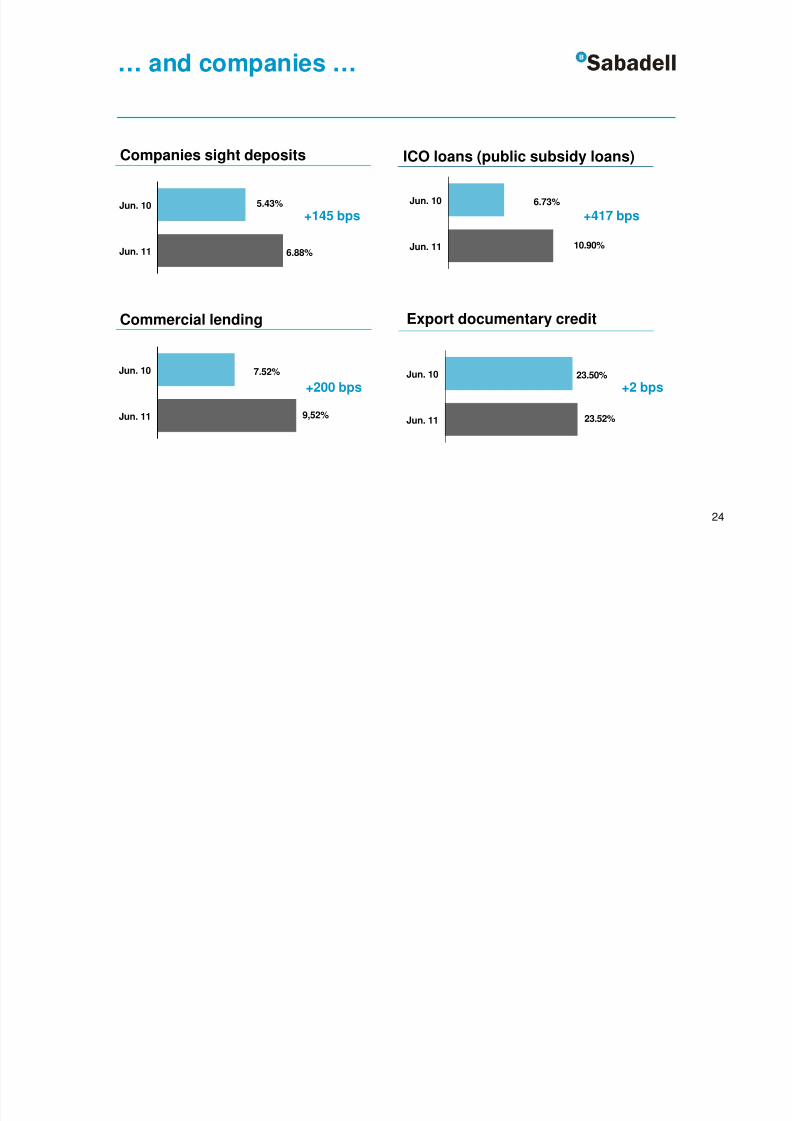
… and companies …
5.43%
6.88%
Jun. 10
Jun. 11
+145 bps
Commercial lending
23.50%
23.52%
Jun. 10
Jun. 11
+2 bps
6.73%
10.90%
Jun. 10
Jun. 11
+417 bps
7.52%
9,52%
Jun. 10
Jun. 11
+200 bps
Companies sight deposits ICO loans (public subsidy loans)
Export documentary credit

8/3/2019 En Presentation Merrill Lynch Oct2011 Presentation Banco Sabadell (1)
http://slidepdf.com/reader/full/en-presentation-merrill-lynch-oct2011-presentation-banco-sabadell-1 25/35
25
… holding up volumes in a
difficult environmentBS customer funds evolution
1 Including BG in 2010
2 Excluding repos, including preference shares and mandatory convertible bond placed in the retail network
Euros in million
Jun-10 Dec-10 Jun-11
% Var.
YoY
% Var. YoY
proforma1
On-balance sheet customer funds2
41,212 49,374 51,055 23.9% 10.7%Fix-term deposits 24,191 30,092 31,456 30.0% 15.7%
Sight deposits 16,021 18,285 18,600 16.1% 3.8%
Off-balance sheet funds 17,908 18,834 18,563 3.7% -2.1%Mutual funds 8,532 8,853 8,613 0.9% -6.8%
Pension funds 2,777 3,016 2,903 4.6% -6.6%
Third party insurance products 5,434 5,727 5,691 4.7% 4.4%
Gross loans to customers ex repos 65,356 73,058 72,309 10.6% -0.8%

8/3/2019 En Presentation Merrill Lynch Oct2011 Presentation Banco Sabadell (1)
http://slidepdf.com/reader/full/en-presentation-merrill-lynch-oct2011-presentation-banco-sabadell-1 26/35
26
4. Asset quality andreal estate

8/3/2019 En Presentation Merrill Lynch Oct2011 Presentation Banco Sabadell (1)
http://slidepdf.com/reader/full/en-presentation-merrill-lynch-oct2011-presentation-banco-sabadell-1 27/35
27
Slow negative trend persists …
0.00%
2.00%
4.00%
6.00%
8.00%
10.00%
9 0 9 1 9 2 9 3 9 4 9 5 9 6 9 7 9 8 9 9 0 0 0 1 0 2 0 3 0 4 0 5 0 6 0 7 0 8 0 9 1 0
J u n - 1
1
System NPL BS NPL
NPL ratio of Banco Sabadell vs.the system (%)
Real estate over total loans(%)
Source: Bank of Spain and annual reports
System BS
0.00%
0.50%
1.00%
1.50%
2.00%
2.50%
3.00%
3.50%
4.00%
4.50%
1 Q 0 7 2 Q
0 7 3 Q
0 7 4 Q
0 7 1 Q
0 8 2 Q
0 8 3 Q
0 8 4 Q
0 8 1 Q
0 9 2 Q
0 9 3 Q
0 9 4 Q
0 9 1 Q
1 0 2 Q
1 0 3 Q
1 0 4 Q
1 0 1 Q
1 1
4.28%
3.43%

8/3/2019 En Presentation Merrill Lynch Oct2011 Presentation Banco Sabadell (1)
http://slidepdf.com/reader/full/en-presentation-merrill-lynch-oct2011-presentation-banco-sabadell-1 28/35
28
… but manageable at the
provisioning level
Euros in million
Resilient pre-provision result has allowed forsignificant provisions to be taken through the P&L
BS pre-provision profit and cost of risk evolution(€ m)
*
* Including tax recoveries of € 99.1 m
2008 2009 2010 jun-11
Pre-provision profit 1.114,6 1.325,5 1.136,3 659,1
Total provisions -879,7 -837,7 -968,1 -545,5
Extraordinary items 650,7 83,6 296,1 102,8
Net profit 673,8 522,5 380,0 165,4
Cost of risk (bps) 136 129 133 151

8/3/2019 En Presentation Merrill Lynch Oct2011 Presentation Banco Sabadell (1)
http://slidepdf.com/reader/full/en-presentation-merrill-lynch-oct2011-presentation-banco-sabadell-1 29/35
29
Ramping up sales effort of RE
assets on bank’s balancesheet
Solvia sales force givesincentives to sell off balance
sheet RE assets
RE Credit portfolio
70-80 new hires of real estate
professionals
Regional credit risk officersworking side by side with REprofessionals to evaluate risk and
advising customers
RE risk arising from credit and asset exposures
RE Assetson and off BS
Adopting a more global approach to
managing RE risk …
8/3/2019 En Presentation Merrill Lynch Oct2011 Presentation Banco Sabadell (1)
http://slidepdf.com/reader/full/en-presentation-merrill-lynch-oct2011-presentation-banco-sabadell-1 30/35
30
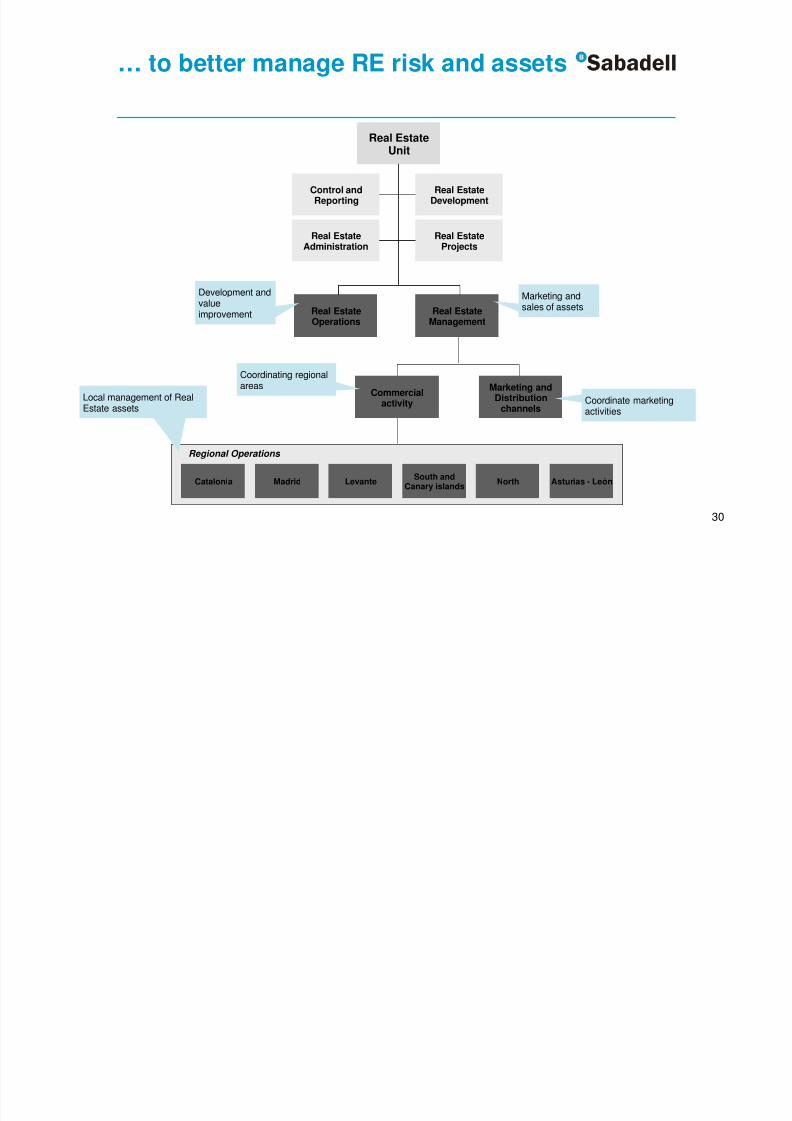
… to better manage RE risk and assets
Real EstateUnit
Real Estate
Development
Real EstateProjects
Real EstateOperations
Real EstateManagement
Control and
Reporting
Real EstateAdministration
Marketing and
Distributionchannels
Commercialactivity
Development andvalueimprovement
Marketing andsales of assets
Coordinate marketingactivities
Regional Operations
Catalonia Madrid Levante NorthSouth and
Canary islandsAsturias - León
Local management of RealEstate assets
Coordinating regionalareas

8/3/2019 En Presentation Merrill Lynch Oct2011 Presentation Banco Sabadell (1)
http://slidepdf.com/reader/full/en-presentation-merrill-lynch-oct2011-presentation-banco-sabadell-1 31/35
Finishedproperty
Land underdevelopment
Land Total %
% in
Barcelona /
Madrid
1st residence 922 966 537 2,424 67% 42%
2nd residence 168 123 37 328 9%
Industrial 151 36 143 330 9% 72%
Commercial 117 204 45 366 10% 64%
Hotels 80 35 13 128 4%
Other 22 2 1 25 1%
Gross portfolio 1,459 1,366 776 3,601 100% 48%
Provisions 320 443 269 1,032 29%
Net portfolio 1,139 923 507 2,569
31
67% of the portfolio is first residence
BS real estate portfolio breakdown(€ m)

8/3/2019 En Presentation Merrill Lynch Oct2011 Presentation Banco Sabadell (1)
http://slidepdf.com/reader/full/en-presentation-merrill-lynch-oct2011-presentation-banco-sabadell-1 32/35
32
2009 2010 1Q11 2Q11
Sales price 42 174 48 71
Pre-provision cost1
55 228 67 95
Discount to pre-provision costs 23% 24% 27% 25%
Provisions built up 12% 23% 29% 23%
% of sales price not covered by provisions 11% 1% -1% 2%
Real estate assets are sold at pricesin line with current book value
BS real estate asset sales evolution(€ m and %)
Sales target for 2011: € 400 million2
1 Including acquisition, development, and any transaction costs related to the sale of the asset2
Pre-provision cost
8/3/2019 En Presentation Merrill Lynch Oct2011 Presentation Banco Sabadell (1)
http://slidepdf.com/reader/full/en-presentation-merrill-lynch-oct2011-presentation-banco-sabadell-1 33/35
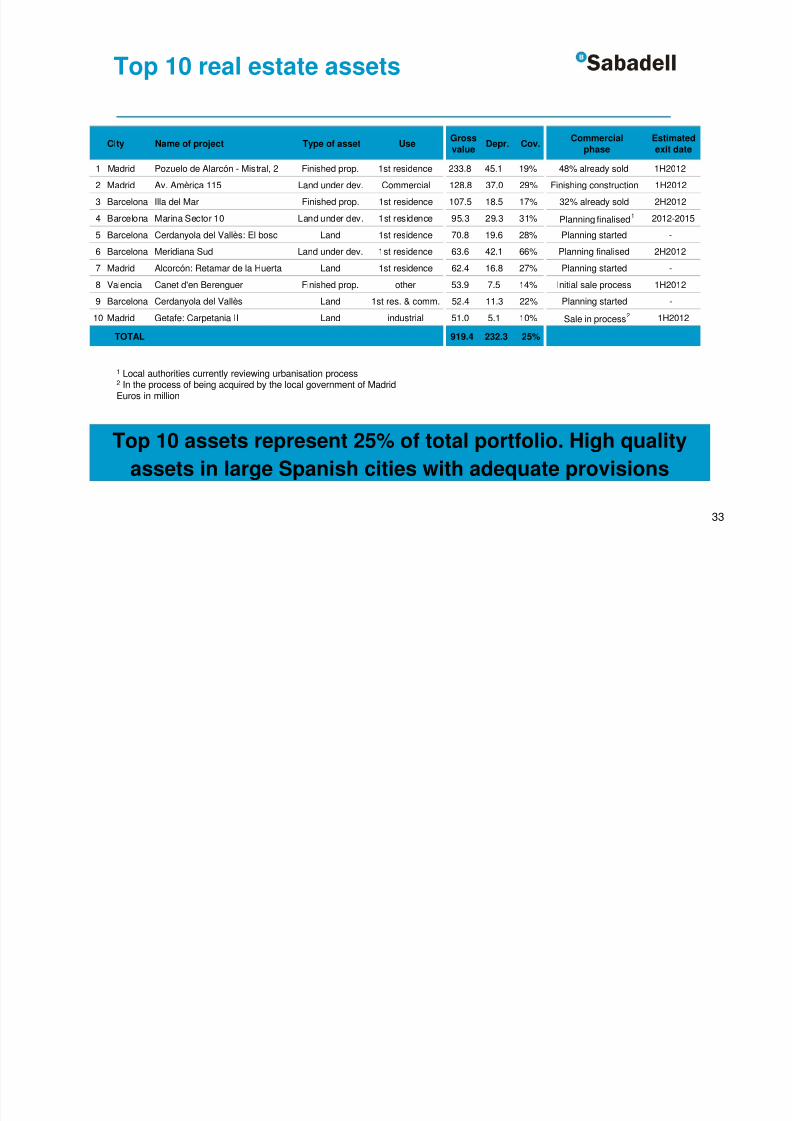
City Name of project Type of asset UseGross
valueDepr. Cov.
Commercial
phase
Estimated
exit date
1 Madrid Pozuelo de Alarcón - Mistral, 2 Finished prop. 1st residence 233.8 45.1 19% 48% already sold 1H2012
2 Madrid Av. Amèrica 115 Land under dev. Commercial 128.8 37.0 29% Finishing construction 1H2012
3 Barcelona Illa del Mar Finished prop. 1st residence 107.5 18.5 17% 32% already sold 2H2012
4 Barcelona Marina Sector 10 Land under dev. 1st residence 95.3 29.3 31% Planning finalised1 2012-2015
5 Barcelona Cerdanyola del Vallès: El bosc Land 1st residence 70.8 19.6 28% Planning started -
6 Barcelona Meridiana Sud Land under dev. 1st residence 63.6 42.1 66% Planning finalised 2H2012
7 Madrid Alcorcón: Retamar de la Huerta Land 1st residence 62.4 16.8 27% Planning started -
8 Valencia Canet d'en Berenguer Finished prop. other 53.9 7.5 14% Initial sale process 1H2012
9 Barcelona Cerdanyola del Vallès Land 1st res. & comm. 52.4 11.3 22% Planning started -
10 Madrid Getafe: Carpetania II Land industrial 51.0 5.1 10% Sale in process2 1H2012
TOTAL 919.4 232.3 25%
33
Top 10 real estate assets
Top 10 assets represent 25% of total portfolio. High quality
assets in large Spanish cities with adequate provisions
1 Local authorities currently reviewing urbanisation process2 In the process of being acquired by the local government of Madrid
Euros in million

8/3/2019 En Presentation Merrill Lynch Oct2011 Presentation Banco Sabadell (1)
http://slidepdf.com/reader/full/en-presentation-merrill-lynch-oct2011-presentation-banco-sabadell-1 34/35
34
Outlook 2011-2012
Lower volumes
Better net interest income due to lower rates thanforecasted
Satisfactory fees evolution
Provisioning behaviour according to expectations

8/3/2019 En Presentation Merrill Lynch Oct2011 Presentation Banco Sabadell (1)
http://slidepdf.com/reader/full/en-presentation-merrill-lynch-oct2011-presentation-banco-sabadell-1 35/35
35