Emory - Emory Library - open.library.emory.edu
21
Distinct amino acid and lipid perturbations characterize acute versus chronic malaria Regina Joice Cordy, Emory University Rapatbhorn Patrapuvich, Mahidol University Loukia N. Lili, Emory University Monica Cabrera-Mora, Emory University Jung-Ting Chien, Emory University Gregory K. Tharp, Emory University Manoj Khadka, Emory University Esmeralda V.S. Meyer, Emory University Stacey A. Lapp, Emory University Chester J. Joyner, Emory University Only first 10 authors above; see publication for full author list. Journal Title: JCI insight Volume: Volume 4, Number 9 Publisher: The American Society for Clinical Investigation | 2019-05-02 Type of Work: Article | Final Publisher PDF Publisher DOI: 10.1172/jci.insight.125156 Permanent URL: https://pid.emory.edu/ark:/25593/tqv5j Final published version: http://dx.doi.org/10.1172/jci.insight.125156 Copyright information: © 2019 American Society for Clinical Investigation Accessed February 18, 2022 12:28 PM EST
Transcript of Emory - Emory Library - open.library.emory.edu
Distinct amino acid and lipid perturbationscharacterize acute versus chronic malariaRegina Joice Cordy, Emory UniversityRapatbhorn Patrapuvich, Mahidol UniversityLoukia N. Lili, Emory UniversityMonica Cabrera-Mora, Emory UniversityJung-Ting Chien, Emory UniversityGregory K. Tharp, Emory UniversityManoj Khadka, Emory UniversityEsmeralda V.S. Meyer, Emory UniversityStacey A. Lapp, Emory UniversityChester J. Joyner, Emory University
Only first 10 authors above; see publication for full author list.
Journal Title: JCI insightVolume: Volume 4, Number 9Publisher: The American Society for Clinical Investigation | 2019-05-02Type of Work: Article | Final Publisher PDFPublisher DOI: 10.1172/jci.insight.125156Permanent URL: https://pid.emory.edu/ark:/25593/tqv5j
Final published version: http://dx.doi.org/10.1172/jci.insight.125156
Copyright information:© 2019 American Society for Clinical Investigation
Accessed February 18, 2022 12:28 PM EST
1insight.jci.org https://doi.org/10.1172/jci.insight.125156
R E S E A R C H A R T I C L E
Conflict of interest: The authors have declared that no conflict of interest exists.
Copyright: © 2019 American Society for Clinical Investigation
Submitted: September 27, 2018 Accepted: April 2, 2019 Published: May 2, 2019.
Reference information: JCI Insight. 2019;4(9):e125156. https://doi.org/10.1172/jci.insight.125156.
Distinct amino acid and lipid perturbations characterize acute versus chronic malariaRegina Joice Cordy,1,2 Rapatbhorn Patrapuvich,3 Loukia N. Lili,4,5 Monica Cabrera-Mora,1 Jung-Ting Chien,1 Gregory K. Tharp,1 Manoj Khadka,6 Esmeralda V.S. Meyer,1 Stacey A. Lapp,1 Chester J. Joyner,1 AnaPatricia Garcia,1 Sophia Banton,4 ViLinh Tran,4 Viravarn Luvira,7 Siriwan Rungin,3 Teerawat Saeseu,3 Nattawan Rachaphaew,3 Suman B. Pakala,8 Jeremy D. DeBarry,8 MaHPIC Consortium,1 Jessica C. Kissinger,8,9,10 Eric A. Ortlund,6 Steven E. Bosinger,1,11 John W. Barnwell,12 Dean P. Jones,4 Karan Uppal,4 Shuzhao Li,4 Jetsumon Sattabongkot,3 Alberto Moreno,1,13 and Mary R. Galinski1,13
1Emory Vaccine Center and Yerkes National Primate Research Center, Emory University, Atlanta, Georgia, USA. 2Department of Biology, Wake Forest University, Winston-Salem, North Carolina, USA. 3Mahidol Vivax Research Unit,
Mahidol University, Bangkok, Thailand. 4Division of Pulmonary, Allergy, Critical Care and Sleep Medicine, Department of
Medicine, School of Medicine, Emory University, Atlanta, Georgia, USA. 5Department of Genetics and Genomic Sciences,
Institute for Next Generation Healthcare, Icahn School of Medicine, Mount Sinai, New York, New York, USA. 6Emory
Integrated Lipidomics Core, Emory University School of Medicine, Atlanta, Georgia, USA. 7Department of Clinical Tropical
Medicine, Faculty of Tropical Medicine, Mahidol University, Bangkok, Thailand. 8Institute of Bioinformatics, 9Center
for Tropical and Emerging Global Diseases, and 10Department of Genetics, University of Georgia, Athens, Georgia, USA. 11Department of Pathology and Laboratory Medicine, Emory School of Medicine, Atlanta, Georgia, USA. 12Malaria Branch,
Division of Parasitic Diseases and Malaria, Centers for Disease Control and Prevention, Atlanta, Georgia, USA. 13Division of
Infectious Diseases, Department of Medicine, Emory University, Atlanta, Georgia, USA.
IntroductionMalaria is the most prevalent blood-borne parasitic disease worldwide, causing over 200 million cases and 400,000 deaths annually (1). Despite gains in reducing malaria incidence and mortality (1), chronic malaria predominates, with a majority of Plasmodium infections being asymptomatic (2). This presents a major challenge for population-wide treatment and eradication efforts, especially in highly endemic areas where incomplete immunity is the norm (2). Chronic blood-stage infections account for around 75% of all malaria cases (3, 4), have significant long-term impacts on human health (2, 5), and serve as a reservoir for the parasite’s sexual stages (gametocytes), which are transmitted to the mosquito vector and support disease transmission. Investigations into temporal host-parasite interactions may reveal biological factors
Chronic malaria is a major public health problem and significant challenge for disease eradication efforts. Despite its importance, the biological factors underpinning chronic malaria are not fully understood. Recent studies have shown that host metabolic state can influence malaria pathogenesis and transmission, but its role in chronicity is not known. Here, with the goal of identifying distinct modifications in the metabolite profiles of acute versus chronic malaria, metabolomics was performed on plasma from Plasmodium-infected humans and nonhuman primates with a range of parasitemias and clinical signs. In rhesus macaques infected with Plasmodium coatneyi, significant alterations in amines, carnitines, and lipids were detected during a high parasitemic acute phase and many of these reverted to baseline levels once a low parasitemic chronic phase was established. Plasmodium gene expression, studied in parallel in the macaques, revealed transcriptional changes in amine, fatty acid, lipid and energy metabolism genes, as well as variant antigen genes. Furthermore, a common set of amines, carnitines, and lipids distinguished acute from chronic malaria in plasma from human Plasmodium falciparum cases. In summary, distinct host-parasite metabolic environments have been uncovered that characterize acute versus chronic malaria, providing insights into the underlying host-parasite biology of malaria disease progression.
2insight.jci.org https://doi.org/10.1172/jci.insight.125156
R E S E A R C H A R T I C L E
leading to and associated with the development of chronic malaria, and may help to identify novel targets for intervention.
A long-held paradigm is that chronic malaria caused by Plasmodium falciparum develops primarily due to immune evasion (6). This is supported by epidemiological evidence demonstrating a decreased risk of acute malaria with increasing age, exposures, and immunity to variant antigens (6, 7). On the other hand, a recent study of Plasmodium chabaudi in mice demonstrated that chronic malaria develops in the absence of host antibodies and coincides with variation in parasite gene expression (8). This and other recent studies have postulated that exogenous factors, such as host nutrients (9–11) and parasite-derived quorum-sensing molecules (12), may modulate parasite gene expression and trigger a reduction in parasite replication rate, thus contributing to the development of chronic infections (8, 10). As a specific example, a reduction in the plasma levels of the host lipid lysophosphatidylcholine (lysoPC) has been associated with a shift in the parasite transcriptome leading to an increase in gametocyte production (9). To what degree other plasma metabolites affect parasite gene expression, disease progression, and transmission remains largely unex-plored, but represents an area of high importance for the malaria field.
Liquid chromatography–mass spectrometry (LC-MS) is a powerful tool for analyzing the large reper-toire of metabolites present in biological samples, and for distinguishing healthy and disease states (13). Striking changes in the plasma levels of amines, fatty acids, glycerophospholipids, endocannabinoids, and hemoglobin-related metabolites have been associated with severe P. falciparum malaria in humans (14–17). Specific metabolic profiles have also characterized chloroquine-resistant and high-parasite-density Plasmo-dium vivax malaria in humans (18, 19). Still, longitudinal studies characterizing the temporal dynamics of plasma metabolites in Plasmodium-infected hosts have been lacking.
Longitudinal infection studies are possible with animal models. Plasmodium coatneyi (Hackeri strain) infection of Macaca mulatta (rhesus macaques) provides a robust model for P. falciparum malaria in humans (20). Both P. coatneyi and P. falciparum exhibit a 48-hour infected red blood cell (iRBC) cycle, have charac-teristic microvascular sequestration of late-stage iRBCs, undergo antigenic variation, and cause both acute and chronic malaria (20, 21). Longitudinal experimental infections of P. coatneyi in M. mulatta are thus a means to gather data on the changes occurring in the host and parasite during the course of an infection.
The goal of this study was to identify plasma metabolites and parasite transcriptional features that can distinguish acute from chronic malaria, and to pinpoint potential biochemical and parasitological mecha-nisms associated with chronicity. Differences in the plasma metabolome and parasite transcriptome were identified when comparing acute versus chronic malaria in rhesus macaques infected with P. coatneyi, con-sistent with global changes in host and parasite amino acid, biogenic amine, and lipid metabolism path-ways. To determine the relevance of these findings for human malaria, plasma metabolomes were analyzed from human cases of P. falciparum malaria that were defined as acute (high parasitemia, with clinical signs) or chronic (low parasitemia, without clinical signs). As in the macaques, differences in amine, carnitine, and lipid metabolism were found to distinguish acute versus chronic malaria in humans. Finally, in a par-allel analysis of plasma samples from humans with acute non-malarial febrile illnesses (NMFIs), similar perturbations were detected in both acute NMFI and acute malaria. Together, these data support the con-clusion that a large set of broad, nonspecific metabolic perturbations occur during acute illness that are quite distinct from those that occur in chronic malaria, and these may hold clues to a better understanding of the interactions of the host-parasite system during the course of malaria disease progression.
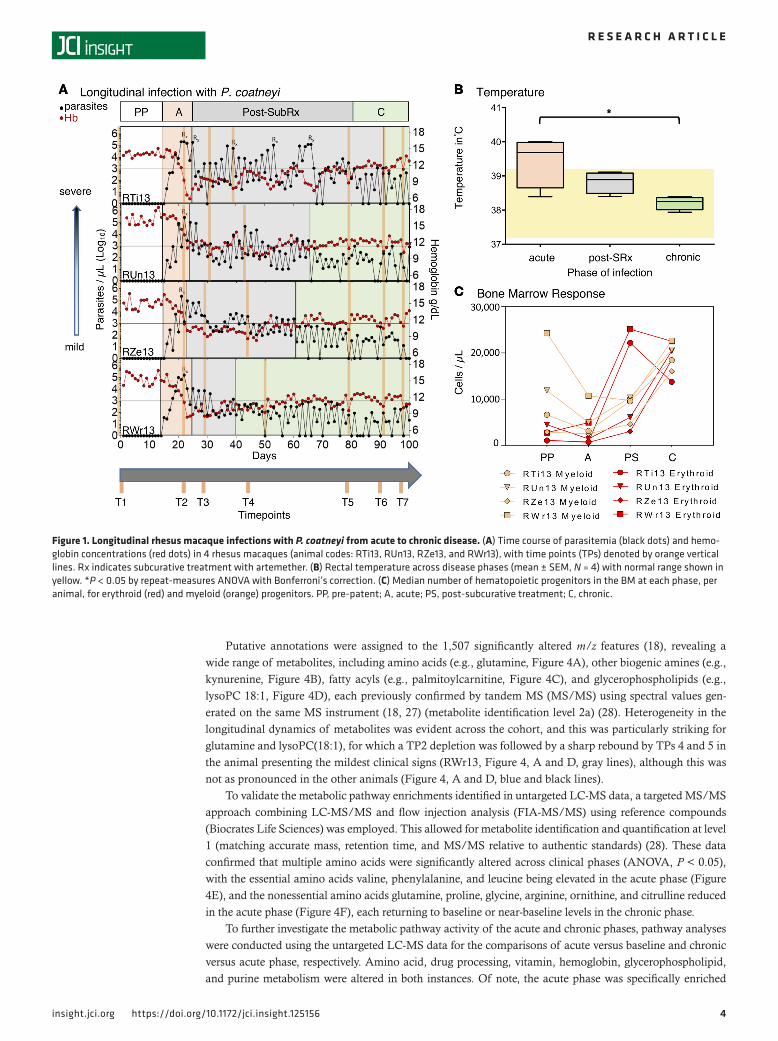
ResultsClinical and parasitological features of acute and chronic malaria are modeled in a cohort of rhesus macaques infected with P. coatneyi. To study acute and chronic malaria, a cohort of 4 malaria-naive spleen-intact rhesus macaques were infected with P. coatneyi sporozoites and monitored longitudinally. At the point at which parasitemia reached peak levels, a subcurative (subRx) dose of artemether was administered to reduce but not eliminate parasitemia, thereby avoiding clinical complications and enabling the study of chronicity (20). Daily ear-stick capillary blood draws were collected for hematological and parasite measurements for 100 days, and 7 venous blood draws and bone marrow (BM) aspirates were acquired at specific time points (TPs) to conduct plasma metabolomics, parasite transcriptomics, and quantification of BM progenitors (Figure 1A).
Clinical parameters, plasma metabolomes, and parasite transcriptional profiles were compared across multiple phases of the study: (i) baseline, before parasite inoculation; (ii) pre-patent, between
3insight.jci.org https://doi.org/10.1172/jci.insight.125156
R E S E A R C H A R T I C L E
inoculation and detection of blood-stage parasitemia by microscopy; (iii) acute, between patency and peak parasitemia; (iv) post-subRx, following subRx while parasitemia remained over 1,000 parasites/μl; and (v) chronic, following subRx when parasitemia was sustained at or below 1,000 parasites/μl (Figure 1A and Table 1). The threshold of 1,000 parasites/μl was selected to demarcate chronicity based on evidence from P. falciparum holoendemic areas suggesting that such parasitemias are associat-ed with asymptomatic infections (22–24).
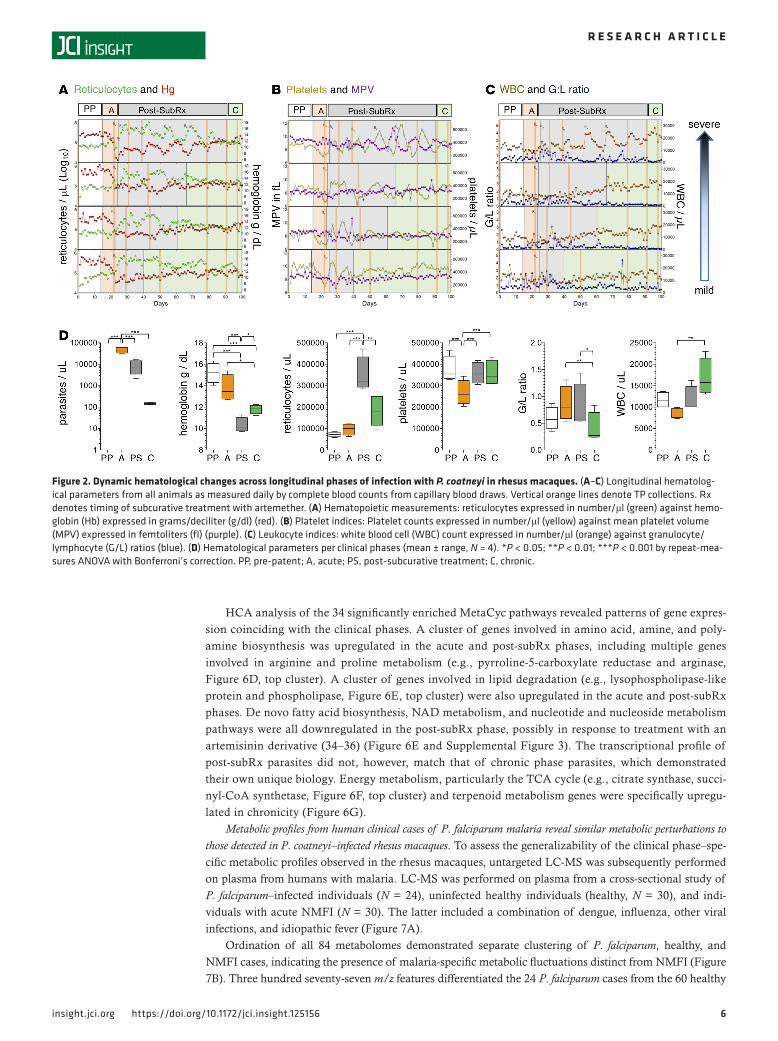
The acute phase of infection was found to be characterized by a slightly elevated mean rectal tem-perature of 39.4°C (37.2°C–39.2°C = normal range for rhesus), which was significantly higher than in the chronic phase (38.2°C, repeat-measures ANOVA, Bonferroni’s correction, P < 0.05) (Figure 1B). High parasitemias characterized the acute phases, compared with the chronic phase (Figure 1A, black dots). As also anticipated based on prior longitudinal studies with P. coatneyi in macaques (20), the acute phase was associated with a sharp drop in hemoglobin (Figure 1A, red dots). This was followed by a delayed compen-satory erythropoietic response in the post-subRx phase, as determined by microscopy showing an expan-sion in erythroid progenitors in BM smears (Figure 1C), alongside elevated reticulocytes in the periphery (Figure 2, A and D), an increased reticulocyte production index (RPI), and increased red cell distribution width (RDW) (Supplemental Table 1; supplemental material available online with this article; https://doi.org/10.1172/jci.insight.125156DS1). Despite this post-subRx compensatory response, moderate anemia persisted throughout the chronic phase of the infection, with hemoglobin levels significantly lower than baseline values (11.82 vs. 15.19 g/dl, repeat-measures ANOVA, Bonferroni’s correction, P < 0.05), similar to levels observed in P. falciparum malaria cases (25).
Thrombocytopenia was observed in the acute phase compared with baseline values (267,117 ver-sus 375,542 platelets/μl, repeat-measures ANOVA, Bonferroni’s correction, P < 0.0001), and post-subRx platelet dynamics were characterized by wide fluctuations in number and size (Figure 2B). Leukopenia occurred during the acute phase (Figure 2, C and D), alongside a reduction in myeloid progenitors in the BM (Figure 1C). Leukocytes progressively increased, however, ultimately resulting in leukocytosis in the chronic phase, with significantly higher WBC in the chronic versus acute phase (16,890 vs. 8,637 WBC/μl, repeat-measures ANOVA, Bonferroni’s correction, P < 0.01) (Figure 2, C and D). The ratio of granulocytes to lymphocytes (G/L ratio) was elevated in the acute and post-subRx phases (0.68 and 0.78, respectively), compared with the chronic phase (0.41, repeat-measures ANOVA, Bonferroni’s correction, P < 0.05) (Figure 2, C and D), consistent with a transition from innate to adaptive mechanisms of control around the onset of chronicity.
Although each of the 4 animals had similar clinical signs at the different phases of infection, similar time durations to patency (15–16 days) and from patency to peak parasitemia (7–10 days), a high degree of heterogeneity was observed in the length of time from antimalarial subRx to the onset of chronicity (15–69 days). Three of the 4 macaques self-controlled their high parasitemias following a single subRx dose of artemether, while 1 animal required 5 subRx doses before successfully self-controlling (Figure 1A). This result suggests the involvement of host factors (other than solely adaptive immunity) in the establishment of chronicity, as each animal in the cohort was malaria-naive and inoculated with the same quantity and strain of P. coatneyi sporozoites.
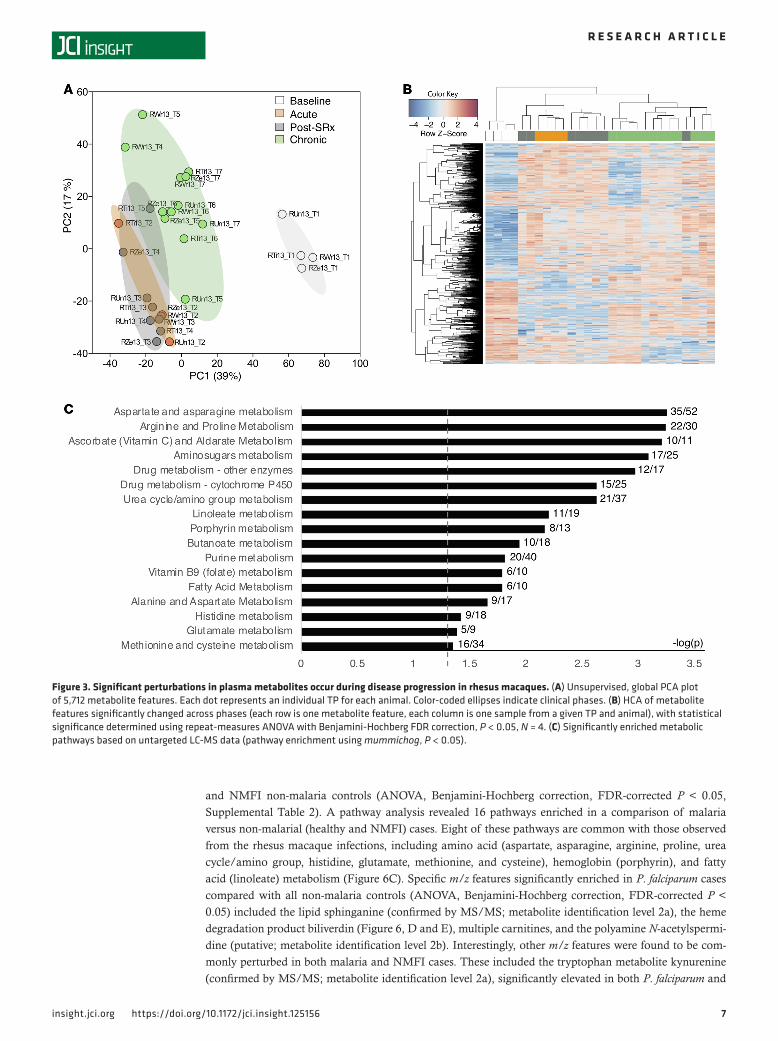
Dynamic fluctuations in plasma levels of glycerophospholipids, fatty acids, and amino acids across preinfec-tion, acute, and chronic phases of P. coatneyi infection in rhesus macaques. To identify molecular features of the malaria host-parasite interaction that may play a role in the development of chronicity, metabolites were measured in plasma samples from across the phases of infection using untargeted high-resolution metabolomics (LC-MS). An ordination analysis revealed that the metabolomes from the 7 TPs clustered according to their clinically defined phases, rather than by animal or TP (Figure 3A). Of the 5,712 mass to charge ratio (m/z) features (i.e., unique combination of m/z and time), 1,507 were significantly altered across the TPs (repeat-measures ANOVA, Benjamini-Hochberg FDR-corrected P < 0.05, Supplemental Table 2), and 3 clusters were identified using hierarchical clustering analysis (HCA), consisting primarily of (i) baseline TPs, (ii) acute and post-subRx TPs, and (iii) chronic-phase TPs (Figure 3B). A pathway enrichment analysis was performed using the metabolic pathway analysis software mummichog (26) to compare the 4 clinical phases. Seventeen metabolic pathways were significantly altered across the phases (P < 0.05), including for amino acids (e.g., arginine and proline), vitamins (e.g., ascorbate and folate), drug processing (e.g., cytochrome P450), fatty acids (e.g., linoleate and butanoate), hemoglobin-related (e.g., porphyrin), and nucleotides (e.g., purine) (Figure 3C).
4insight.jci.org https://doi.org/10.1172/jci.insight.125156
R E S E A R C H A R T I C L E
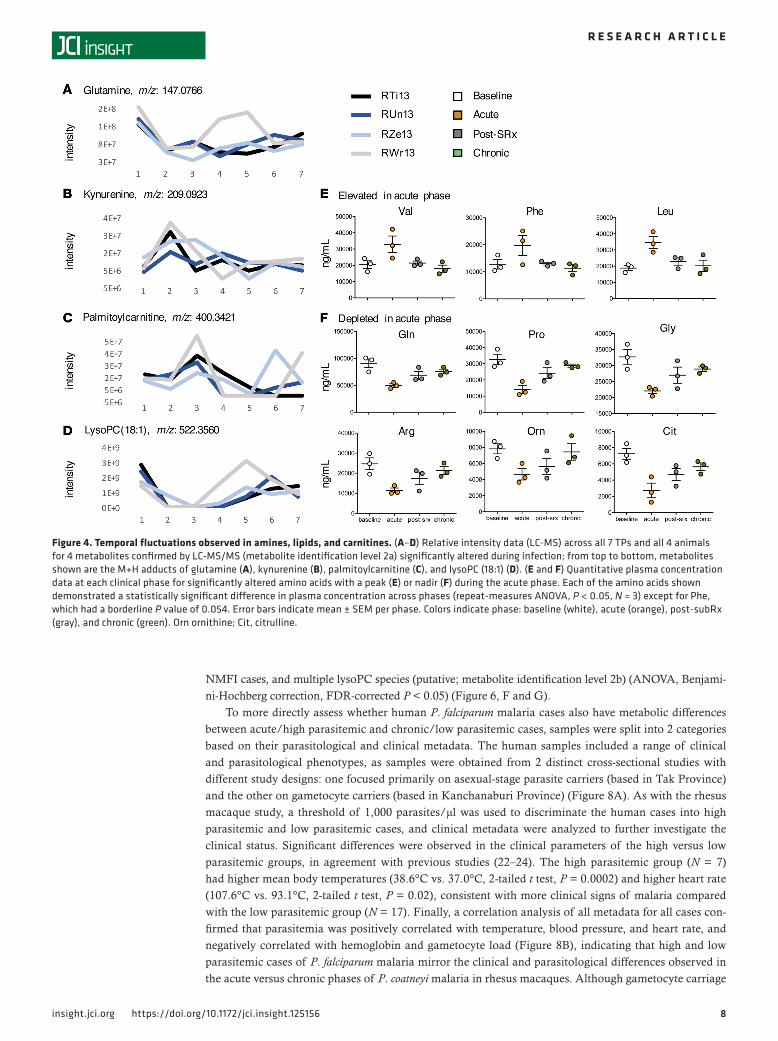
Putative annotations were assigned to the 1,507 significantly altered m/z features (18), revealing a wide range of metabolites, including amino acids (e.g., glutamine, Figure 4A), other biogenic amines (e.g., kynurenine, Figure 4B), fatty acyls (e.g., palmitoylcarnitine, Figure 4C), and glycerophospholipids (e.g., lysoPC 18:1, Figure 4D), each previously confirmed by tandem MS (MS/MS) using spectral values gen-erated on the same MS instrument (18, 27) (metabolite identification level 2a) (28). Heterogeneity in the longitudinal dynamics of metabolites was evident across the cohort, and this was particularly striking for glutamine and lysoPC(18:1), for which a TP2 depletion was followed by a sharp rebound by TPs 4 and 5 in the animal presenting the mildest clinical signs (RWr13, Figure 4, A and D, gray lines), although this was not as pronounced in the other animals (Figure 4, A and D, blue and black lines).
To validate the metabolic pathway enrichments identified in untargeted LC-MS data, a targeted MS/MS approach combining LC-MS/MS and flow injection analysis (FIA-MS/MS) using reference compounds (Biocrates Life Sciences) was employed. This allowed for metabolite identification and quantification at level 1 (matching accurate mass, retention time, and MS/MS relative to authentic standards) (28). These data confirmed that multiple amino acids were significantly altered across clinical phases (ANOVA, P < 0.05), with the essential amino acids valine, phenylalanine, and leucine being elevated in the acute phase (Figure 4E), and the nonessential amino acids glutamine, proline, glycine, arginine, ornithine, and citrulline reduced in the acute phase (Figure 4F), each returning to baseline or near-baseline levels in the chronic phase.
To further investigate the metabolic pathway activity of the acute and chronic phases, pathway analyses were conducted using the untargeted LC-MS data for the comparisons of acute versus baseline and chronic versus acute phase, respectively. Amino acid, drug processing, vitamin, hemoglobin, glycerophospholipid, and purine metabolism were altered in both instances. Of note, the acute phase was specifically enriched
Figure 1. Longitudinal rhesus macaque infections with P. coatneyi from acute to chronic disease. (A) Time course of parasitemia (black dots) and hemo-globin concentrations (red dots) in 4 rhesus macaques (animal codes: RTi13, RUn13, RZe13, and RWr13), with time points (TPs) denoted by orange vertical lines. Rx indicates subcurative treatment with artemether. (B) Rectal temperature across disease phases (mean ± SEM, N = 4) with normal range shown in yellow. *P < 0.05 by repeat-measures ANOVA with Bonferroni’s correction. (C) Median number of hematopoietic progenitors in the BM at each phase, per animal, for erythroid (red) and myeloid (orange) progenitors. PP, pre-patent; A, acute; PS, post-subcurative treatment; C, chronic.
5insight.jci.org https://doi.org/10.1172/jci.insight.125156
R E S E A R C H A R T I C L E
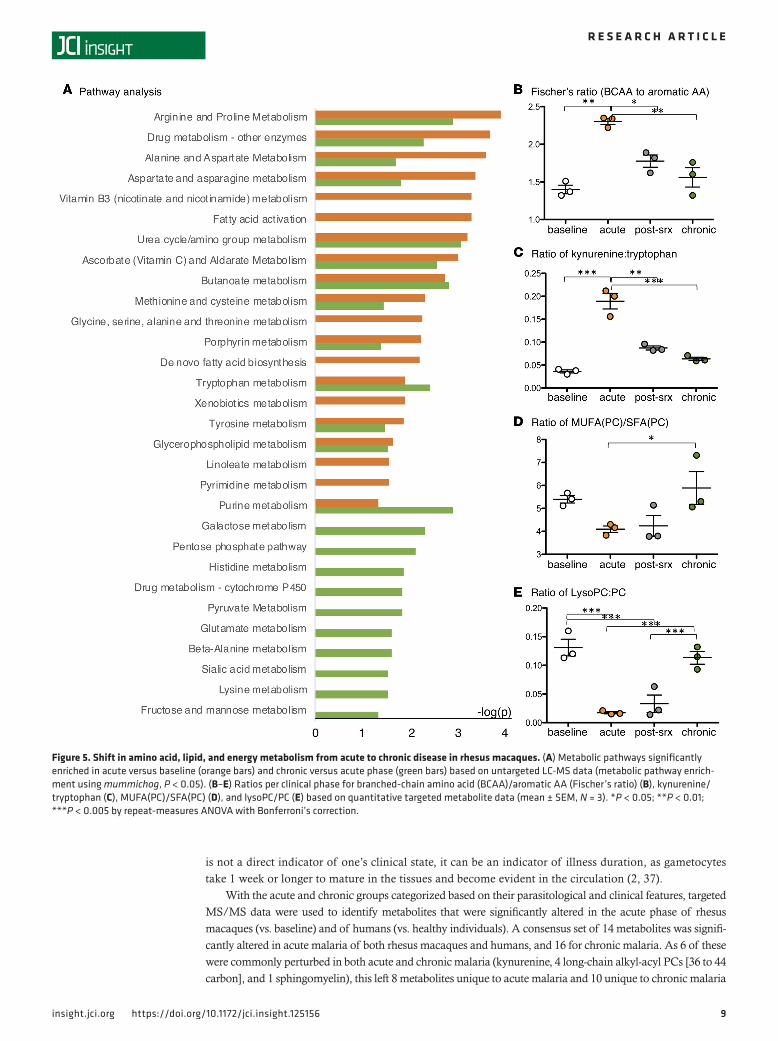
for fatty acid metabolism pathways (fatty acid activation, de novo fatty acid biosynthesis, and linoleate met-abolic pathways), while the chronic phase was specifically enriched for carbohydrate energy metabolism pathways (galactose, pentose phosphate, pyruvate, fructose, and mannose metabolic pathways) (Figure 5A).
Using the targeted MS/MS data, metabolite ratios that have been used to characterize clinically rele-vant metabolic perturbations in humans (29) were calculated for each phase of the infection. The ratios of branched-chain to aromatic amino acids (Fischer’s ratio, indicator of liver dysfunction, Figure 5B) and of kynurenine to tryptophan (indicator of immunosuppression/tolerance, Figure 5C) were found to be sig-nificantly altered (repeat-measures ANOVA, P < 0.05), peaking in the acute phase when disease was most clinically significant. The ratios of phosphatidylcholines (PCs) containing total mono-unsaturated fatty acid (MUFA) to those containing saturated fatty acid (SFA) (Figure 5D) and of total lysoPC to total PC (Figure 5E), which assess the activity of fatty acid desaturases and phospholipases, respectively, were also significantly altered (repeat-measures ANOVA, P < 0.05), with the lowest levels occurring in the acute and post-subRx phases. These data validate the results of the pathway analyses and support the hypothesis that both increased fatty acid metabolism and lipid degradation occur in the acute phase. Finally, although the pathway analyses indicated a shift in energy metabolism in the chronic phase (Figure 5A), measurements of glucose obtained by both clinical blood chemistry and targeted metabolomics showed no significant changes in host plasma glucose (Supplemental Figure 1).
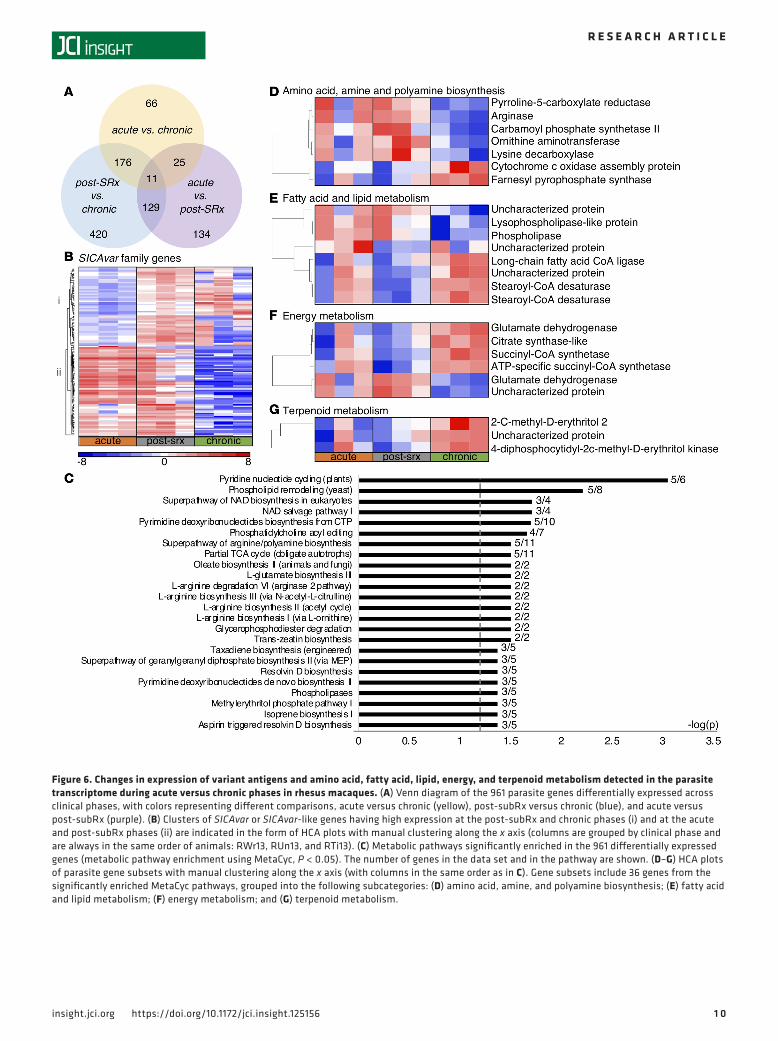
Variation in P. coatneyi parasite gene expression between acute and chronic malaria in rhesus macaques suggests changes in antigenic variation, and metabolism of amines, fatty acids, and terpenoids. To determine whether para-site transcriptional activity was altered across the phases of the rhesus infection study, transcriptomic analy-sis (RNA-Seq) was performed on RNA extracted from whole blood from each TP, and alignment and anno-tation of parasite reads were performed using the P. coatneyi (Hackeri strain) genome sequence (30). All blood samples had a predominance of ring- and early trophozoite–stage parasites (>99%), which enabled a comparison of in vivo transcriptomes over the course of the infection. Of the 5,516 protein-encoding genes in the P. coatneyi genome, 961 parasite genes (17.4%) were found to be differentially expressed as follows: 66 between acute and chronic phases, 134 between acute and post-subRx phases, and 420 between post-subRx and chronic phases (paired, 2-tailed t test, FDR-corrected P < 0.05, Figure 6A).
A particularly striking finding was the expression of variant antigen gene families across the infection phases. A total of 117 genes or gene fragments annotated in the genome as the schizont-infected cell agglutina-tion variant antigen (SICAvar) genes (30, 31) or SICAvar-like were differentially expressed across the phases, with one distinct cluster of SICAvar genes having high expression at the post-subRx and chronic phases and another showing high expression in the acute and post-subRx phases (Figure 6B). In addition, 63 genes annotated as kir or vir (i.e., orthologous to the Plasmodium interspersed repeat (pir) families in other Plasmodium species [ref. 32], and in following with the species-specific naming conventions of these gene families can be referred to as coir gene families in P. coatneyi) were likewise differentially expressed, with the majority exhibiting low expression in the acute phase and upregulated in either or both the post-subRx and chronic phases (Supplemental Figure 2).
Metabolic pathway enrichment analysis was performed on the 961 differentially expressed P. coatneyi genes using the MetaCyc metabolic pathway database (33), and 24 pathways were enriched across the clinical phases (P < 0.05, Figure 6C), including amino acid and biogenic amine biosynthesis (e.g., L-arginine biosynthesis I via L-or-nithine), fatty acid and lipid biosynthesis and degradation (e.g., phospholipases), energy metabolism (e.g., partial TCA cycle), NAD metabolism (e.g., pyridine nucleotide cycling), nucleoside and nucleotide biosynthesis (e.g., pyrimidine deoxyribonucleotides biosynthesis from CTP), and terpenoid biosynthesis (isoprene biosynthesis I).
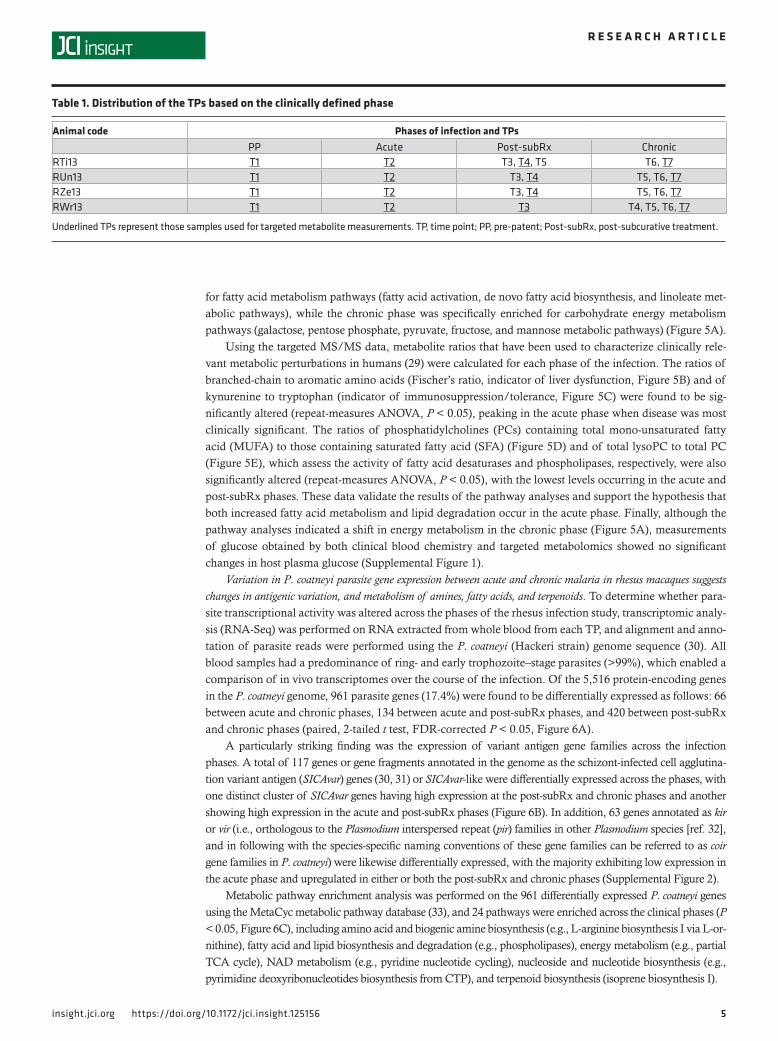
Table 1. Distribution of the TPs based on the clinically defined phase
Animal code Phases of infection and TPsPP Acute Post-subRx Chronic
RTi13 T1 T2 T3, T4, T5 T6, T7RUn13 T1 T2 T3, T4 T5, T6, T7RZe13 T1 T2 T3, T4 T5, T6, T7RWr13 T1 T2 T3 T4, T5, T6, T7
Underlined TPs represent those samples used for targeted metabolite measurements. TP, time point; PP, pre-patent; Post-subRx, post-subcurative treatment.
6insight.jci.org https://doi.org/10.1172/jci.insight.125156
R E S E A R C H A R T I C L E
HCA analysis of the 34 significantly enriched MetaCyc pathways revealed patterns of gene expres-sion coinciding with the clinical phases. A cluster of genes involved in amino acid, amine, and poly-amine biosynthesis was upregulated in the acute and post-subRx phases, including multiple genes involved in arginine and proline metabolism (e.g., pyrroline-5-carboxylate reductase and arginase, Figure 6D, top cluster). A cluster of genes involved in lipid degradation (e.g., lysophospholipase-like protein and phospholipase, Figure 6E, top cluster) were also upregulated in the acute and post-subRx phases. De novo fatty acid biosynthesis, NAD metabolism, and nucleotide and nucleoside metabolism pathways were all downregulated in the post-subRx phase, possibly in response to treatment with an artemisinin derivative (34–36) (Figure 6E and Supplemental Figure 3). The transcriptional profile of post-subRx parasites did not, however, match that of chronic phase parasites, which demonstrated their own unique biology. Energy metabolism, particularly the TCA cycle (e.g., citrate synthase, succi-nyl-CoA synthetase, Figure 6F, top cluster) and terpenoid metabolism genes were specifically upregu-lated in chronicity (Figure 6G).
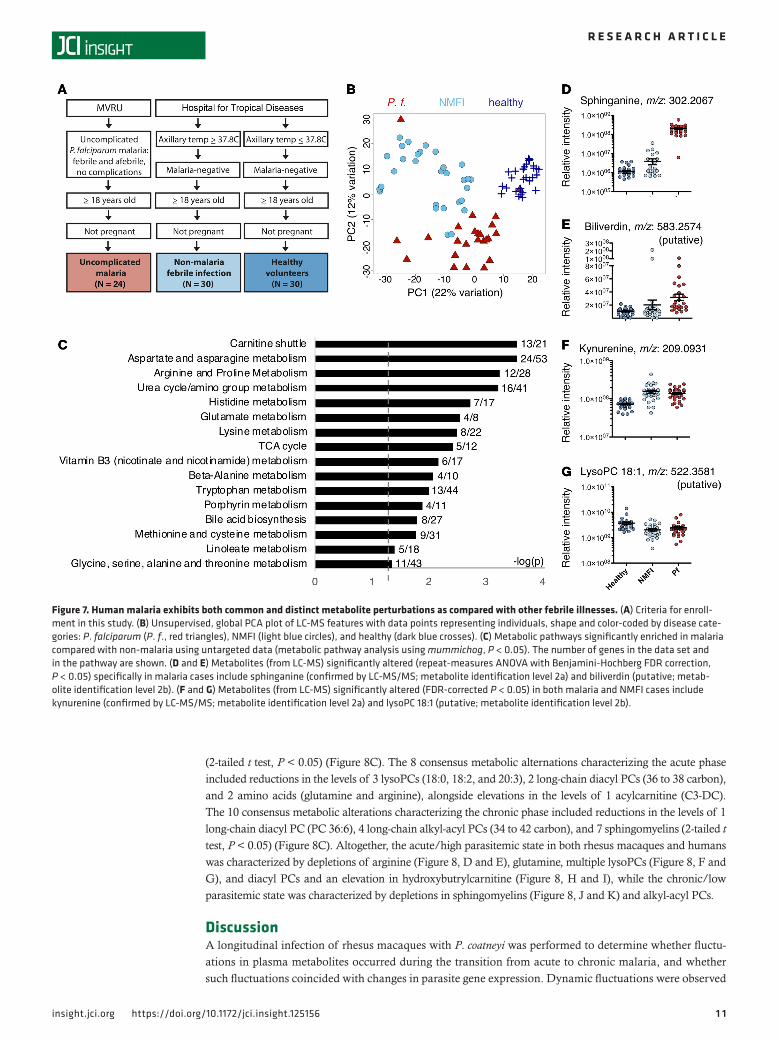
Metabolic profiles from human clinical cases of P. falciparum malaria reveal similar metabolic perturbations to those detected in P. coatneyi–infected rhesus macaques. To assess the generalizability of the clinical phase–spe-cific metabolic profiles observed in the rhesus macaques, untargeted LC-MS was subsequently performed on plasma from humans with malaria. LC-MS was performed on plasma from a cross-sectional study of P. falciparum–infected individuals (N = 24), uninfected healthy individuals (healthy, N = 30), and indi-viduals with acute NMFI (N = 30). The latter included a combination of dengue, influenza, other viral infections, and idiopathic fever (Figure 7A).
Ordination of all 84 metabolomes demonstrated separate clustering of P. falciparum, healthy, and NMFI cases, indicating the presence of malaria-specific metabolic fluctuations distinct from NMFI (Figure 7B). Three hundred seventy-seven m/z features differentiated the 24 P. falciparum cases from the 60 healthy
Figure 2. Dynamic hematological changes across longitudinal phases of infection with P. coatneyi in rhesus macaques. (A–C) Longitudinal hematolog-ical parameters from all animals as measured daily by complete blood counts from capillary blood draws. Vertical orange lines denote TP collections. Rx denotes timing of subcurative treatment with artemether. (A) Hematopoietic measurements: reticulocytes expressed in number/μl (green) against hemo-globin (Hb) expressed in grams/deciliter (g/dl) (red). (B) Platelet indices: Platelet counts expressed in number/μl (yellow) against mean platelet volume (MPV) expressed in femtoliters (fl) (purple). (C) Leukocyte indices: white blood cell (WBC) count expressed in number/μl (orange) against granulocyte/lymphocyte (G/L) ratios (blue). (D) Hematological parameters per clinical phases (mean ± range, N = 4). *P < 0.05; **P < 0.01; ***P < 0.001 by repeat-mea-sures ANOVA with Bonferroni’s correction. PP, pre-patent; A, acute; PS, post-subcurative treatment; C, chronic.
7insight.jci.org https://doi.org/10.1172/jci.insight.125156
R E S E A R C H A R T I C L E
and NMFI non-malaria controls (ANOVA, Benjamini-Hochberg correction, FDR-corrected P < 0.05, Supplemental Table 2). A pathway analysis revealed 16 pathways enriched in a comparison of malaria versus non-malarial (healthy and NMFI) cases. Eight of these pathways are common with those observed from the rhesus macaque infections, including amino acid (aspartate, asparagine, arginine, proline, urea cycle/amino group, histidine, glutamate, methionine, and cysteine), hemoglobin (porphyrin), and fatty acid (linoleate) metabolism (Figure 6C). Specific m/z features significantly enriched in P. falciparum cases compared with all non-malaria controls (ANOVA, Benjamini-Hochberg correction, FDR-corrected P < 0.05) included the lipid sphinganine (confirmed by MS/MS; metabolite identification level 2a), the heme degradation product biliverdin (Figure 6, D and E), multiple carnitines, and the polyamine N-acetylspermi-dine (putative; metabolite identification level 2b). Interestingly, other m/z features were found to be com-monly perturbed in both malaria and NMFI cases. These included the tryptophan metabolite kynurenine (confirmed by MS/MS; metabolite identification level 2a), significantly elevated in both P. falciparum and
Figure 3. Significant perturbations in plasma metabolites occur during disease progression in rhesus macaques. (A) Unsupervised, global PCA plot of 5,712 metabolite features. Each dot represents an individual TP for each animal. Color-coded ellipses indicate clinical phases. (B) HCA of metabolite features significantly changed across phases (each row is one metabolite feature, each column is one sample from a given TP and animal), with statistical significance determined using repeat-measures ANOVA with Benjamini-Hochberg FDR correction, P < 0.05, N = 4. (C) Significantly enriched metabolic pathways based on untargeted LC-MS data (pathway enrichment using mummichog, P < 0.05).
8insight.jci.org https://doi.org/10.1172/jci.insight.125156
R E S E A R C H A R T I C L E
NMFI cases, and multiple lysoPC species (putative; metabolite identification level 2b) (ANOVA, Benjami-ni-Hochberg correction, FDR-corrected P < 0.05) (Figure 6, F and G).
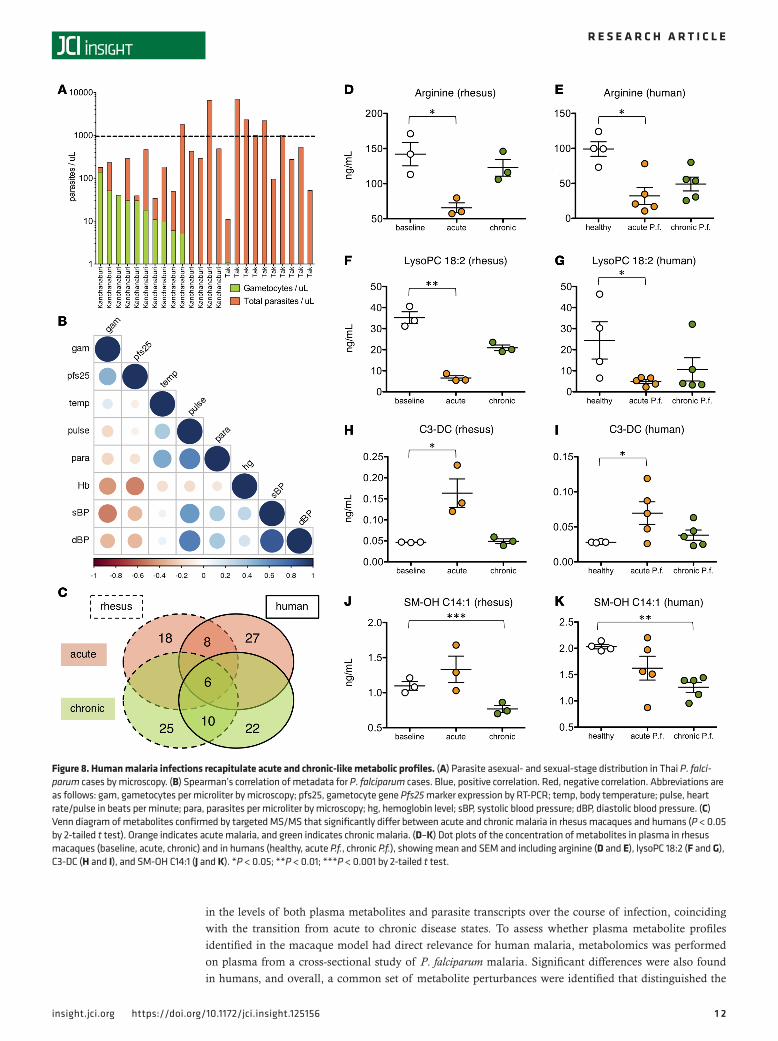
To more directly assess whether human P. falciparum malaria cases also have metabolic differences between acute/high parasitemic and chronic/low parasitemic cases, samples were split into 2 categories based on their parasitological and clinical metadata. The human samples included a range of clinical and parasitological phenotypes, as samples were obtained from 2 distinct cross-sectional studies with different study designs: one focused primarily on asexual-stage parasite carriers (based in Tak Province) and the other on gametocyte carriers (based in Kanchanaburi Province) (Figure 8A). As with the rhesus macaque study, a threshold of 1,000 parasites/μl was used to discriminate the human cases into high parasitemic and low parasitemic cases, and clinical metadata were analyzed to further investigate the clinical status. Significant differences were observed in the clinical parameters of the high versus low parasitemic groups, in agreement with previous studies (22–24). The high parasitemic group (N = 7) had higher mean body temperatures (38.6°C vs. 37.0°C, 2-tailed t test, P = 0.0002) and higher heart rate (107.6°C vs. 93.1°C, 2-tailed t test, P = 0.02), consistent with more clinical signs of malaria compared with the low parasitemic group (N = 17). Finally, a correlation analysis of all metadata for all cases con-firmed that parasitemia was positively correlated with temperature, blood pressure, and heart rate, and negatively correlated with hemoglobin and gametocyte load (Figure 8B), indicating that high and low parasitemic cases of P. falciparum malaria mirror the clinical and parasitological differences observed in the acute versus chronic phases of P. coatneyi malaria in rhesus macaques. Although gametocyte carriage
Figure 4. Temporal fluctuations observed in amines, lipids, and carnitines. (A–D) Relative intensity data (LC-MS) across all 7 TPs and all 4 animals for 4 metabolites confirmed by LC-MS/MS (metabolite identification level 2a) significantly altered during infection; from top to bottom, metabolites shown are the M+H adducts of glutamine (A), kynurenine (B), palmitoylcarnitine (C), and lysoPC (18:1) (D). (E and F) Quantitative plasma concentration data at each clinical phase for significantly altered amino acids with a peak (E) or nadir (F) during the acute phase. Each of the amino acids shown demonstrated a statistically significant difference in plasma concentration across phases (repeat-measures ANOVA, P < 0.05, N = 3) except for Phe, which had a borderline P value of 0.054. Error bars indicate mean ± SEM per phase. Colors indicate phase: baseline (white), acute (orange), post-subRx (gray), and chronic (green). Orn ornithine; Cit, citrulline.
9insight.jci.org https://doi.org/10.1172/jci.insight.125156
R E S E A R C H A R T I C L E
is not a direct indicator of one’s clinical state, it can be an indicator of illness duration, as gametocytes take 1 week or longer to mature in the tissues and become evident in the circulation (2, 37).
With the acute and chronic groups categorized based on their parasitological and clinical features, targeted MS/MS data were used to identify metabolites that were significantly altered in the acute phase of rhesus macaques (vs. baseline) and of humans (vs. healthy individuals). A consensus set of 14 metabolites was signifi-cantly altered in acute malaria of both rhesus macaques and humans, and 16 for chronic malaria. As 6 of these were commonly perturbed in both acute and chronic malaria (kynurenine, 4 long-chain alkyl-acyl PCs [36 to 44 carbon], and 1 sphingomyelin), this left 8 metabolites unique to acute malaria and 10 unique to chronic malaria
Figure 5. Shift in amino acid, lipid, and energy metabolism from acute to chronic disease in rhesus macaques. (A) Metabolic pathways significantly enriched in acute versus baseline (orange bars) and chronic versus acute phase (green bars) based on untargeted LC-MS data (metabolic pathway enrich-ment using mummichog, P < 0.05). (B–E) Ratios per clinical phase for branched-chain amino acid (BCAA)/aromatic AA (Fischer’s ratio) (B), kynurenine/tryptophan (C), MUFA(PC)/SFA(PC) (D), and lysoPC/PC (E) based on quantitative targeted metabolite data (mean ± SEM, N = 3). *P < 0.05; **P < 0.01; ***P < 0.005 by repeat-measures ANOVA with Bonferroni’s correction.
1 0insight.jci.org https://doi.org/10.1172/jci.insight.125156
R E S E A R C H A R T I C L E
Figure 6. Changes in expression of variant antigens and amino acid, fatty acid, lipid, energy, and terpenoid metabolism detected in the parasite transcriptome during acute versus chronic phases in rhesus macaques. (A) Venn diagram of the 961 parasite genes differentially expressed across clinical phases, with colors representing different comparisons, acute versus chronic (yellow), post-subRx versus chronic (blue), and acute versus post-subRx (purple). (B) Clusters of SICAvar or SICAvar-like genes having high expression at the post-subRx and chronic phases (i) and at the acute and post-subRx phases (ii) are indicated in the form of HCA plots with manual clustering along the x axis (columns are grouped by clinical phase and are always in the same order of animals: RWr13, RUn13, and RTi13). (C) Metabolic pathways significantly enriched in the 961 differentially expressed genes (metabolic pathway enrichment using MetaCyc, P < 0.05). The number of genes in the data set and in the pathway are shown. (D–G) HCA plots of parasite gene subsets with manual clustering along the x axis (with columns in the same order as in C). Gene subsets include 36 genes from the significantly enriched MetaCyc pathways, grouped into the following subcategories: (D) amino acid, amine, and polyamine biosynthesis; (E) fatty acid and lipid metabolism; (F) energy metabolism; and (G) terpenoid metabolism.
1 1insight.jci.org https://doi.org/10.1172/jci.insight.125156
R E S E A R C H A R T I C L E
(2-tailed t test, P < 0.05) (Figure 8C). The 8 consensus metabolic alternations characterizing the acute phase included reductions in the levels of 3 lysoPCs (18:0, 18:2, and 20:3), 2 long-chain diacyl PCs (36 to 38 carbon), and 2 amino acids (glutamine and arginine), alongside elevations in the levels of 1 acylcarnitine (C3-DC). The 10 consensus metabolic alterations characterizing the chronic phase included reductions in the levels of 1 long-chain diacyl PC (PC 36:6), 4 long-chain alkyl-acyl PCs (34 to 42 carbon), and 7 sphingomyelins (2-tailed t test, P < 0.05) (Figure 8C). Altogether, the acute/high parasitemic state in both rhesus macaques and humans was characterized by depletions of arginine (Figure 8, D and E), glutamine, multiple lysoPCs (Figure 8, F and G), and diacyl PCs and an elevation in hydroxybutrylcarnitine (Figure 8, H and I), while the chronic/low parasitemic state was characterized by depletions in sphingomyelins (Figure 8, J and K) and alkyl-acyl PCs.
DiscussionA longitudinal infection of rhesus macaques with P. coatneyi was performed to determine whether fluctu-ations in plasma metabolites occurred during the transition from acute to chronic malaria, and whether such fluctuations coincided with changes in parasite gene expression. Dynamic fluctuations were observed
Figure 7. Human malaria exhibits both common and distinct metabolite perturbations as compared with other febrile illnesses. (A) Criteria for enroll-ment in this study. (B) Unsupervised, global PCA plot of LC-MS features with data points representing individuals, shape and color-coded by disease cate-gories: P. falciparum (P. f., red triangles), NMFI (light blue circles), and healthy (dark blue crosses). (C) Metabolic pathways significantly enriched in malaria compared with non-malaria using untargeted data (metabolic pathway analysis using mummichog, P < 0.05). The number of genes in the data set and in the pathway are shown. (D and E) Metabolites (from LC-MS) significantly altered (repeat-measures ANOVA with Benjamini-Hochberg FDR correction, P < 0.05) specifically in malaria cases include sphinganine (confirmed by LC-MS/MS; metabolite identification level 2a) and biliverdin (putative; metab-olite identification level 2b). (F and G) Metabolites (from LC-MS) significantly altered (FDR-corrected P < 0.05) in both malaria and NMFI cases include kynurenine (confirmed by LC-MS/MS; metabolite identification level 2a) and lysoPC 18:1 (putative; metabolite identification level 2b).
1 2insight.jci.org https://doi.org/10.1172/jci.insight.125156
R E S E A R C H A R T I C L E
in the levels of both plasma metabolites and parasite transcripts over the course of infection, coinciding with the transition from acute to chronic disease states. To assess whether plasma metabolite profiles identified in the macaque model had direct relevance for human malaria, metabolomics was performed on plasma from a cross-sectional study of P. falciparum malaria. Significant differences were also found in humans, and overall, a common set of metabolite perturbances were identified that distinguished the
Figure 8. Human malaria infections recapitulate acute and chronic-like metabolic profiles. (A) Parasite asexual- and sexual-stage distribution in Thai P. falci-parum cases by microscopy. (B) Spearman’s correlation of metadata for P. falciparum cases. Blue, positive correlation. Red, negative correlation. Abbreviations are as follows: gam, gametocytes per microliter by microscopy; pfs25, gametocyte gene Pfs25 marker expression by RT-PCR; temp, body temperature; pulse, heart rate/pulse in beats per minute; para, parasites per microliter by microscopy; hg, hemoglobin level; sBP, systolic blood pressure; dBP, diastolic blood pressure. (C) Venn diagram of metabolites confirmed by targeted MS/MS that significantly differ between acute and chronic malaria in rhesus macaques and humans (P < 0.05 by 2-tailed t test). Orange indicates acute malaria, and green indicates chronic malaria. (D–K) Dot plots of the concentration of metabolites in plasma in rhesus macaques (baseline, acute, chronic) and in humans (healthy, acute P.f., chronic P.f.), showing mean and SEM and including arginine (D and E), lysoPC 18:2 (F and G), C3-DC (H and I), and SM-OH C14:1 (J and K). *P < 0.05; **P < 0.01; ***P < 0.001 by 2-tailed t test.

1 3insight.jci.org https://doi.org/10.1172/jci.insight.125156
R E S E A R C H A R T I C L E
metabolomes of acute (high parasitemia, high clinical signs) and chronic (low parasitemia, low clinical signs) malaria in both host species.
Of the metabolic changes that were detected in individuals with malaria as compared with healthy individuals, a subset has been previously implicated as being involved in malaria pathogenesis, includ-ing changes in heme metabolites (e.g., biliverdin), sphingolipids (e.g., sphinganine), acylcarnitines (e.g., hydroxybutrylcarnitine), and the polyamine N-acetylspermidine. Malaria causes the destruction of both infected and uninfected RBCs (20), leading to the release of heme, which is metabolized by the host into bilirubin and urobilinogen to avoid heme-induced oxidative stress (14), thus explaining the high levels of these metabolites in plasma. Sphinganine, an intermediate of the sphingosine-1-phosphate (S1P) pathway, being elevated, suggests an increase in S1P metabolism during malaria. S1P plays a role in signaling relat-ed to immune responses and vascular integrity, and it has been shown to be elevated in individuals with uncomplicated malaria, where it is believed to confer some protection against severe disease (38). Altered fatty acid metabolism and the increase in plasma acylcarnitines in the acute phase is consistent with an active process of shuttling fatty acids across membranes. The decreased ratio of MUFA(PC) to SFA(PC) and the depletion of long-chain saturated PCs could indicate the parasite’s activity in preferentially scav-enging long-chain MUFA(PC), which may provide the necessary MUFA (e.g., oleic acid) required for para-site growth and replication (39, 40). Finally, the parasite has the ability to synthesize polyamines (41); thus, an increase in plasma N-acetylspermidine levels may be directly related to parasite production.
Although the aforementioned changes appeared specific to malaria, other metabolic changes were found in common across human acute malaria and NMFI cases, including tryptophan/kynurenine, argi-nine, and glycerophospholipid metabolism. This suggests that these pathways are altered through broad nonspecific host responses to acute disease. Tryptophan/kynurenine metabolism has been postulated to contribute to cerebral malaria through the production of neurotoxins (42), but its upregulation here, in which neither animals nor humans with NMFI or malaria displayed signs of neurological dysfunction, seems consistent with this pathway’s known role in modulating immune tolerance (43). Similarly, plas-ma hypoarginemia during malaria, which has been previously proposed to be caused by parasite arginine uptake (44), has more recently been shown to result from a block in host arginine metabolism (45). Here too, a simultaneous depletion of arginine pathway metabolites (arginine, ornithine, and citrulline) occurred in vivo, suggesting that a block in host production was also the primary driver of plasma arginine deple-tion. A global reduction in arginine will contribute to a reduction in nitric oxide availability, and this can lead to a decrease in epithelial barrier integrity. Thus, reduction in arginine production may contribute to the vascular pathology and sequestration that characterizes severe P. falciparum malaria (45). Finally, the pronounced depletion of multiple lysoPC species is particularly intriguing. Although lysoPC is known to be taken up by parasites during asexual replication and potentially trigger gametocyte production (9), this lipid is also altered in systemic infections involving the upregulation of phospholipase A2 (PLA2), such as bacterial sepsis, where a depletion in lysoPC in plasma is a predictor of mortality (46). LysoPC depletion in malaria may therefore not be caused by parasite uptake directly, but may nonetheless provide a critical signal for increased gametocyte production and transmission.
Parasite transcriptional data support the idea that a global shift in both host and parasite biology occurs during the course of malaria disease progression. In the acute phase, coinciding with a significant depletion in plasma arginine, P. coatneyi genes related to amino acid metabolism were altered. The upregulation of genes from the parasite’s amino acid, amine, and polyamine biosynthesis pathways (pyrroline-5-carboxyl-ate reductase, arginase, and ornithine aminotransferase) may play a role in the increase in polyamines in plasma (47). Further, at the same time as the acute-phase reduction in glycerophospholipids and increase in acylcarnitines, elevated expression of genes from the parasite’s glycerophospholipid metabolism pathway (phospholipase and lysophospholipase-like protein) (47) was evident, reflecting increased expression of enzymes that cleave fatty acids from larger lipid molecules. As these enzymes are used by the parasite to obtain the fatty acids it needs for growth and replication (39), an upregulation of these enzymes coinciding with a reduction in plasma long-chain PCs and an increase in acylcarnitines may indicate a role for para-sites in driving some of the fatty acid and lipid changes observed in the plasma metabolome.
Previous studies have suggested that malaria parasites may exhibit multiple distinct metabolic pheno-types in vivo, including starvation states and normal glycolytic growth states, with variation in the expres-sion of glycolysis, TCA cycle, and fatty acid metabolism genes (48–50). While these studies have not been conclusive in terms of which host environments trigger such variation in parasite metabolic states,
1 4insight.jci.org https://doi.org/10.1172/jci.insight.125156
R E S E A R C H A R T I C L E
in agreement with these previous studies, the present study also finds evidence of variation in TCA and fatty acid metabolism genes in vivo. Specifically, amino acid, fatty acid, and lipid metabolism genes were upregulated in the acute and post-subRx phases, while de novo fatty acid biosynthesis, mitochondrial TCA cycle, and terpenoid metabolism were upregulated in chronicity. Going a step further, the data pre-sented here provide evidence of parasite gene expression changes coinciding with dynamic fluctuations in the levels of exogenous metabolites. Altogether, this work is consistent with recent reports indicating that parasites may have the ability to self-regulate their metabolism in response to environmental conditions, such as altered nutrient conditions (10, 12).
The observation of altered energy metabolism pathways is also particularly interesting since lipids are an alternate source of energy when carbohydrates are not available. While no significant differences in blood glucose were detected across TPs, parasite mitochondrial TCA cycle genes (glutamate dehydroge-nase, citrate synthase–like protein, and 2 succinyl-CoA synthetases) were highly expressed in the chronic phase, suggesting a shift in the energy metabolism of the parasite. Asexual-stage parasites in different infec-tion phases (e.g., acute or chronic) may have distinct energy metabolism mechanisms, as has been demon-strated previously for sexual and asexual stages of P. falciparum (51).
The chronic phase was further characterized by increased expression of 2 terpenoid metabolism genes (2-C-methyl-D-erythritol 2 and 4-diphosphocytidyl-2-C-methyl-D-erythritol kinase). This reflects increased activity of the parasite’s methylerythritol phosphate (MEP) pathway that operates in the parasite’s apico-plast organelle that does not exist in mammalian hosts (52). The MEP metabolic pathway results in the production of terpenes, odorant molecules produced by plants and plastid-containing organisms such as Plasmodium, which can be potential attractants to the Anopheles vector (53). It is an intriguing possibility that parasites may upregulate the production of terpenes to attract mosquito vectors to the host during chronic-ity, and in doing so, enhance transmission.
In addition to transcriptional changes in metabolic gene pathways, variation in the expression of vari-ant antigen genes, such as the SICAvar and coir gene families (30, 54), was observed here across infection phases. SICAvar genes in P. coatneyi and Plasmodium knowlesi are related to the var gene family in P. falci-parum (reviewed in ref. 31), while coir genes measured in P. coatneyi (and annotated as kir or vir-like) (30) are related to the pir gene family (32). Although the expression of alternate variants of these gene families has been traditionally thought to be triggered by host immunity, recent results have demonstrated that tran-scriptional shifts in the pir gene family of P. chabaudi were associated with the establishment of chronicity in mice in the absence of host antibodies. Future experiments would be warranted to investigate possible relationships between plasma metabolites and variant antigen gene expression.
Artemisinin derivatives have been shown to induce parasite transcriptional changes and a state of dor-mancy in P. falciparum and Plasmodium vinckei ring-stage parasites (34–36), and genes involved in parasite metabolism and replication may be affected following subRx treatment. Here, we observed reductions in the expression of de novo fatty acid biosynthesis (stearoyl-CoA desaturase and long-chain fatty acid CoA ligase) (55, 56), NAD (e.g., NAD synthase), and nucleotide metabolism (e.g., ribonucleotide reductase) in the post-subRx phase, coinciding with the days following the single subRx treatment with artemether (Supplemental Figure 3). These changes did not, however, persist into the chronic phase, which started 15 to 69 days after the treatment. Because artemether has a very short half-life (in the range of hours), it is not anticipated that the drug treatment played a major role in the chronic-phase findings of this study.
Altogether, the findings presented here are relevant to the development of novel diagnostic and thera-peutic interventions for malaria. Therapeutics targeting lipid and amino acid pathways are actively being pursued for multiple diseases (46, 57) and may be promising adjunctive therapies for treating acute malaria or altering chronic malaria transmissibility (58). As common metabolic perturbations exist between acute malaria and other acute diseases, repurposing of existing therapeutics for acute malaria may become a cost-effective way to fast-track the approval of adjunctive therapies. Still, preclinical testing will be required to explore the possible benefits of such interventions, as the complexity of host-parasite interactions makes the outcomes and possible unexpected adverse consequences difficult to predict (59). For example, iron supplementation administered in a clinical trial for malarial anemia resulted in increased mortality (59), and elevated plasma glutamine has been associated with both better outcomes in the context of malarial anemia (60) and poor outcomes in the context of cerebral malaria (61). LysoPC administration, which is currently under investigation as an adjunctive therapy for sepsis (62), may prove useful in malaria for both treating acute disease and reducing transmissibility (58). These data are also relevant to efforts to develop
1 5insight.jci.org https://doi.org/10.1172/jci.insight.125156
R E S E A R C H A R T I C L E
new diagnostics that may help differentiate malaria from NMFIs. While changes in lysophospholipids, tryptophan/kynurenine metabolism, and arginine metabolism were common across malaria and NMFI, hemoglobin-breakdown products, sphingolipid fluctuations, carnitines, and polyamines appeared to be more malaria-specific. A personalized-medicine approach that includes metabolite-based diagnostic/prog-nostic tests is one foreseeable and worthwhile path forward for more accurately identifying and differenti-ating malaria from NMFI and for identifying specific severe malaria cases that may benefit from tailored adjunctive therapies. Further study in this direction is critical and timely given recent and ongoing advances in MS, metabolomics, and personalized medicine (13).
In summary, this study represents an initial attempt at integrating diverse data types from longitudinal infections of P. coatneyi in macaques to provide a detailed picture of the dynamics of the host-parasite inter-actions across acute and chronic phases of the disease. This systems analysis of clinical, metabolomic, and transcriptional data has revealed patterns that define malaria disease progression. Importantly, distinctive phase-specific metabolic profiles were identified in rhesus macaques that were comparable to those from cross-sectional analyses of human P. falciparum cases and commonalities were observed between acute malaria and non-malarial disease. As the plasma metabolome of Plasmodium-infected hosts is a complex mixture of metabolites deriving from host, parasite, commensal microbiota, and exogenous sources, the source of metabolic fluctuations cannot be immediately known from analyzing plasma metabolomics data alone. Additional complementary data sets are currently being analyzed from the macaque study to deter-mine the role of the host immune response in protection, pathogenesis, and disease progression.
MethodsAvailability of data. All data included in this manuscript have been deposited in public repositories. The clinical data from the rhesus macaque study are available for download on the PlasmoDB website (63) under the header called “Experiment 03” at http://plasmodb.org/plasmo/mahpic.jsp. Direct links are also provided at this website for access to functional genomics data through NCBI’s Gene Expression Omni-bus (GEO GSE103259) (64), and metabolomics data through MetaboLights data set IDs MTBLS518, MTBLS691, and MTBLS664 (www.ebi.ac.uk/metabolights). Additional information about the work of the Malaria Host Pathogen Interaction Center (MaHPIC) can be found on www.systembiology.emory.edu and under the NCBI bioproject ID PRJNA368917.
Rhesus macaque longitudinal infection. The current study involved 4 male rhesus, approximately 4 years old, born and raised at the Yerkes National Primate Research Center (YNPRC). One additional rhesus from the Centers for Disease Control and Prevention (CDC) was used for Anopheles mosquito infections using standardized procedures (65) and An. dirus, An. gambiae, and An. stephensi from the CDC’s insectary. The P. coatneyi Hackeri strain (66) that has been propagated in intact rhesus macaques at the YNPRC orig-inated from original cryopreserved stocks produced and maintained at the CDC (20, 21). Procedures used for inoculation, clinical monitoring, and subRx treatment of rhesus macaques, as well as sample collection of whole blood and BM samples, have been described previously (65).
In this study, infections were initiated with an estimated 100 freshly isolated P. coatneyi Hackeri strain (66) sporozoites and monitored for 100 days. Baseline sample collections occurred at TP 1 (day –5), and inoculation at day 0. Each macaque became parasitemic between days 15 and 16 (Figure 1A), with most iRBCs on blood smears being ring or young trophozoite stages, consistent with tissue sequestration of more matured asexual stages (66). By day 22 as parasitemia peaked, a single subRx of artemether was administered to reduce para-sitemia, avoid clinical complications, and enable the study of chronicity (20). Further experimental description and clinical data sets can be accessed on the PlasmoDB public repository and in the supplemental methods.
Human subject cohort. The study population (Thai adult males and females, 18 years or older, and not pregnant) included 30 patients with symptomatic uncomplicated P. falciparum malaria based on WHO clas-sifications (67), 30 cases with NMFI, and 30 healthy controls. Individuals with malaria were recruited at the Ministry of Public Health (MOPH) Malaria Clinics in the Kanchanaburi and Tak provinces. Enrolled patients ranged from 18 to 66 years old with median and mean ages of 27 and 31 for the Kanchanaburi and Tak provinces, respectively. Patients classified as NMFI were recruited from the Fever Clinic of the Hospital for Tropical Diseases at Mahidol University. These patients had a fever (≥37.8°C), no malaria parasites determined by thick smear microscopy or PCR, and no history of taking antimalarial or antibiotic medications during the 2 weeks prior to their hospital visit. Healthy individuals were recruited as controls at the Hospital for Tropical Diseases. These individuals had no fever, no reported history of malaria and
1 6insight.jci.org https://doi.org/10.1172/jci.insight.125156
R E S E A R C H A R T I C L E
treatment, no parasites determined by thick smear and PCR, and were not on any medications at the time. These age-matched control participants ranged in age from 17 to 71 and 22 to 50 for NMFI and healthy individuals, respectively.
After signing an informed consent form, 1 ml of blood was collected in a heparin vacutainer and placed on ice. Plasma was subsequently recovered by centrifugation, and was aliquoted into cryovials and frozen at –80°C. Aliquots were then shipped to Emory University on dry ice and only thawed when preparing to run on the mass spectrometer. Six of the 30 P. falciparum malaria cases were excluded from this study due to preservation in a different anticoagulant (citrate). To control for any differences that are induced in the metabolome based on different anticoagulants, only those samples collected in heparin were analyzed in the present study. This included 30 healthy, 30 NMFI, and 24 P. falciparum malaria cases.
Human clinical and parasite measurements. Infected RBCs were quantified and parasite stage differenti-ation was performed by microscopy on blood smears. The parasite species was confirmed by PCRs per-formed on filter paper blood spots. P. falciparum gametocytes were quantified by PCR using the Pfs25 gene, as described previously (68). Pfs25 copy number was determined per 4 μl of whole blood for all P. falciparum cases. Clinical measurements were collected at the time of sample collection, including temperature, blood pressure, and heart rate. Additionally, hemoglobin (g/dl) and hematocrit values were determined using a CBC analyzer (SIEMENS ADVIA 120 Hematology system), and blood group was determined using the test-tube method, both serum and cell grouping. All slides were examined/rechecked with microscopy for RBC morphology and WBC differential.
Clinical phase categorization. Given the variability that can occur in counting microscopy smears and giv-en that 1,000 parasites/μl is a somewhat arbitrary cutoff, we applied a secondary criterion to samples in the range of 800–1,200 parasites/μl for more appropriate clinical sample classification. For the rhesus macaque samples, BM cytology results were used to designate borderline TPs as either acute or chronic, based on the ratio of myeloid to erythroid progenitors and myeloblast counts. One TP of 1,153 parasites/μl was includ-ed in the chronic phase due to its borderline parasitemia and its clinical similarity by BM cytology to the chronic phase. For the Thai samples, one TP of 899 parasites/μl was categorized as acute due to its clinical similarity (temperature, heart rate, and gametocytemia) to the high-parasitemia cases.
Untargeted LC-MS analysis of plasma samples. The extraction and LC-MS analysis procedures were per-formed as described previously (69, 70). Briefly, 50 μl of plasma was spiked with 2.5 μl of stable-isotope-labeled internal standards and 100 μl of acetonitrile to precipitate protein. The clean extract was collected after centri-fuging the plasma mixture at 14,000 g for 10 minutes at 4°C. Of the total extract, 10 μl was injected in triplicate into LC-MS (Thermo Fisher Scientific Q Exactive HF high-field mass spectrometer) using an autosampler maintained at 4°C. Sample order was randomized prior to sample preparation and samples were prepared in sequential batches. The metabolites were chromatographically separated using 2 columns: C18 (Higgins C18 column 100 × 2.1 mm for rhesus samples) with a 10-minute formic acid/acetonitrile gradient (26), and HIL-IC columns (Thermo Fisher Scientific Accucore 50 × 2.1 mm for human samples) with a 5-minute formic/acetonitrile gradient. Electrospray ionization was used in the positive-ion mode. Data quality was monitored by injecting 10 μl of quality control samples (NIST SRM 1950 and internal standards) after every 20 samples throughout the run. Raw data were preprocessed using apLCMS (71) and xMSanalyzer (72) to extract reten-tion time, m/z, and intensity information. Throughout the manuscript, an m/z feature refers to a unique com-bination of m/z and retention time. The preprocessed data were further treated to correct for batch effects using ComBat (73). The metabolic features were annotated and identified using xMSannotator (18, 74) along with MS/MS information. Data are available on the MetaboLights database under accession numbers MTBLS664 (human data) and MTBLS518 (rhesus macaque data). See supplemental methods for additional details.
Targeted LC-MS and FIA of plasma samples. Sixteen rhesus (one representative TP from each of the 4 phases of infection, for 4 animals) and 18 human samples (5 high parasitemic cases with negative gameto-cytemia and under 500 transcripts of Pfs25, 5 low parasitemic cases with positive gametocytemia and Pfs25 transcript levels over 500, 4 NMFI cases, and 4 healthy cases) were quantified using the AbsoluteIDQ p180 kit (Biocrates Life Sciences AG). The kit can absolutely quantify 188 metabolites and lipids com-prising several classes of compound (amino acids, biogenic amines, hexoses, acylcarnitines, sphingolipids, and phospholipids). Sample extraction, LC-MS, and FIA were performed as described previously (29). Briefly, 10 μl of plasma was spiked with 10 μl of stable-isotope-labeled internal standards and derivatized with phenylisothiocyanate. The derivatized samples were extracted with 200 μl of methanol in a 96-well plate and split into 2 plates and injected into LC-MS (SCIEX LC AC pump, SCIEX QTRAP5500 mass
1 7insight.jci.org https://doi.org/10.1172/jci.insight.125156
R E S E A R C H A R T I C L E
spectrometer, AB SCIEX LLC) following the kit’s standard operating protocol (Biocrates p180 kit) for quantification of metabolites and lipids. Due to lack of sufficient sample volume for TP1 from RTi13 in the targeted analysis, TPs for RTi13 were excluded from statistical analysis of targeted data. Data are available on the MetaboLights database under accession numbers MTBLS691 and MTBLS664. See sup-plemental methods for additional details.
Statistical analysis for untargeted LC-MS and targeted LC-MS/MS and FIA-MS/MS data. Untargeted LC-MS data were processed and analyzed as follows. After standard quality control procedures, the raw intensi-ty values were median-summarized among the triplicates and log2 transformed. Only metabolite features (unique m/z and time) with 50% present calls across all samples and 80% present calls in at least one of the phases were retained. Features were plotted in an unsupervised global principal component analysis (PCA) and hierarchical clustering, and statistical analyses such as paired ANOVA and LIMMA were used to iden-tify statistically significant features. Analyses were performed using an in-house R package using R software, version 3.2.1 (The R Foundation for Statistical Computing). LIMMA was followed by multiple hypothesis correction using the Benjamini-Hochberg method. Significant features from each statistical test were subject-ed to pathway analysis with mummichog (26) to identify enriched metabolic pathways and modules.
Targeted metabolite data were processed and analyzed as follows. One hundred eighty-eight metabolites were measured using the p180 kit (Biocrates). Of these, 135 met quality control criteria (greater than 25% CV across pooled reference samples on the plate and less than 40% missing values across all samples from both studies). Statistical analyses were then performed to compare metabolite concentrations across clinical phases and identify metabolites that were significantly different across categories. Statistical analyses, includ-ing t test, ANOVA, PCA, and HCA were performed using MetaboAnalyst 3.0 (www.metaboanalyst.ca) (75). All t tests were 2-tailed, and a P value of less than 0.05 was considered significant.
Sample processing and data generation for high-throughput transcriptomics (RNA-Seq). Whole blood was col-lected into Tempus tubes and RNA isolation was done using the Tempus Spin RNA Isolation Kit (Applied Biosystems) per manufacturer’s instructions and as described previously (76). RNA quality was assessed using Bioanalyzer and library preparation was done using TruSeq Stranded mRNA Sample Preparation (Illumina). Approximately 1 μg of total RNA was used as input, and mRNA enrichment was done using poly-A beads. Spike-in RNAs of known concentration were added for quality control. cDNA synthesis was conducted, leading to strand-specific libraries. Ligation of aptamers was done to allow for multiplexed sequencing. Sequencing was performed on an Illumina HiSeq1000 at the Yerkes National Primate Genom-ics Core, generating approximately 80 million paired-end 100–base pair reads per library. Data are available as raw.fastq files in the GEO database (GSE103259) and SRA database (SRP116593).
Raw.fastq files from the RNA-Seq experiments were aligned to both the P. coatneyi (30) and M. mulatta (77) reference genomes using the Spliced Transcripts Alignment to a Reference tool (STAR, version 2.4.1c) (78). The aligned features were further quantified and annotated with the High-Throughput Sequencing tool (HTSeq, version 0.6.1p1) (79) using only the P. coatneyi reference to select parasite-specific transcripts. Annotation was performed using reference genome sequences from the NCBI database (BioProject PRJNA315987) under acces-sion numbers CP016239 to CP016252, as previously described (30).
Statistical methods for parasite transcriptomics data analysis. Only samples in which parasites were detected by microscopy and at least 100,000 total reads (corresponding to at least 90 parasite/μl) were analyzed, one sample for each phase per each animal was chosen (that with the highest number of reads). As RZe13 did not have a sample in the chronic phase with greater than 100,000 parasite reads, that animal was removed from the analysis. All samples were library-size normalized together using DESeq2. Three paired analyses were performed to identify genes with significantly different expression during the acute versus post-subRx, the post-subRx versus chronic, and the acute versus chronic phases. Any gene with an FDR less than 0.05 and a base mean normalized read count greater than 4 in one or more of the paired analyses was consid-ered significantly differentially expressed. Pathway analysis was done using the MetaCyc pathway enrich-ment analysis module on PlasmoDB (63) with a cutoff of P less than 0.05 for significance. HCA heatmaps were generated using Pearson dissimilarity in Partek or heatmapper (80). The normalized parasite tran-scriptional data table used in this study are available in the GEO database (GSE103259).
Study approval. All procedures performed on rhesus macaques were approved by Institutional Animal Care and Use Committees (IACUC) as required at Emory University or the CDC, and all interventions were done in compliance with Animal Welfare Act regulations. For human subjects, plasma samples were obtained under human subjects research protocols TMEC 11-033 (malaria-infected subjects) and TMEC 14-025 (NMFI and
1 8insight.jci.org https://doi.org/10.1172/jci.insight.125156
R E S E A R C H A R T I C L E
healthy subjects), approved by the Ethical Review Committee of the Faculty of Tropical Medicine, Mahidol University, Thailand. All samples were de-identified and studied at Emory University under the Institutional Review Board (IRB) protocol IRB00066220. The IRBs of each institution reviewed and approved all enroll-ment and sample collection protocols, and the required written informed consent documentation provided to all participants prior to inclusion in the study.
Author contributionsEVSM, JWB, AM, and MRG designed and directed animal studies. JS and RP designed and directed human studies. RJC, GKT, SEB, SL, KU, and AM conceived of the data analysis framework. EVSM, MCM, SAL, and CJJ carried out animal studies. VL, SR, TS, and NR carried out human studies. VT and MK performed mass spectrometry and data extraction with supervision from DPJ and EAO. RJC, LNL, and SB performed analysis of metabolomics data. JTC, SEB, and GKT performed genomic sequencing and data processing. RJC and GKT performed analysis of transcriptomics data. AG performed bone mar-row cytology. RJC, SBP, JDD, and JCK performed data management, validation, and deposition. RJC led the writing of the manuscript with support from LNL, AM, and MRG with input from coauthors.
AcknowledgmentsThis research was supported in part by federal funds from the US National Institute of Allergy and Infec-tious Diseases, NIH, Department of Health and Human Services under contract HHSN272201200031C, which has supported the Malaria Host-Pathogen Interaction Center (MaHPIC), the National Heart, Lung and Blood Institute that supports RJC via grant 1K01HL143112-01, and the Defense Advanced Research Projects Agency and the US Army Research Office via cooperative agreement W911NF16C0008. Support was also received from the Yerkes NHP Genomics Core, supported in part by ORIP/OD P51OD011132 and from the Emory Integrated Lipidomics Core (EILC), subsidized by the Emory University School of Medi-cine, the NIH National Center for Advancing Translational Sciences (UL1TR000454), and the NIH Office of Research Infrastructure Programs/OD P51OD011132. This study was supported in part by resources and technical expertise from the Georgia Advanced Computing Resource Center, a partnership between the University of Georgia’s Office of the Vice President for Research and Office of the Vice President for Information Technology. The authors are grateful for the veterinary staff support at the Yerkes National Pri-mate Research Center, Rabin Tirouvanziam, Juan B. Gutierrez, and members of the MaHPIC/HAMMER consortium for helpful discussions, Mustafa Nural and Miriam Lachs’ assistance with data management, the staff of the Hospital for Tropical Diseases at Mahidol University, and the study participants. The content is solely the responsibility of the authors and does not necessarily reflect the official views of the funding agencies that supported the study. See Supplemental Acknowledgments for consortium details.
Address correspondence to: Mary R. Galinski or Alberto Moreno, Emory Vaccine Center, Yerkes National Primate Research Center, Emory University School of Medicine, 954 Gatewood Road, Atlanta, Geor-gia 30329, USA. Phone: 404.727.7214; Email: [email protected] (MRG). Phone: 404.727.8611. Email: [email protected] (AM).
1. WorldHealthOrganization. World Malaria Report 2017. https://wwwwhoint/malaria/publications/world-malaria-report-2017/en/ Updated November 29, 2017. Accessed April 5, 2019.
2. Lindblade KA, Steinhardt L, Samuels A, Kachur SP, Slutsker L. The silent threat: asymptomatic parasitemia and malaria trans-mission. Expert Rev Anti Infect Ther. 2013;11(6):623–639.
3. Bousema T, Okell L, Felger I, Drakeley C. Asymptomatic malaria infections: detectability, transmissibility and public health relevance. Nat Rev Microbiol. 2014;12(12):833–840.
4. Alves FP, Durlacher RR, Menezes MJ, Krieger H, Silva LH, Camargo EP. High prevalence of asymptomatic Plasmodium vivax and Plasmodium falciparum infections in native Amazonian populations. Am J Trop Med Hyg. 2002;66(6):641–648.
5. de Mast Q, et al. Is asymptomatic malaria really asymptomatic? Hematological, vascular and inflammatory effects of asymp-tomatic malaria parasitemia. J Infect. 2015;71(5):587–596.
6. Bull PC, Abdi AI. The role of PfEMP1 as targets of naturally acquired immunity to childhood malaria: prospects for a vaccine. Parasitology. 2016;143(2):171–186.
7. Okiro EA, Al-Taiar A, Reyburn H, Idro R, Berkley JA, Snow RW. Age patterns of severe paediatric malaria and their relation-ship to Plasmodium falciparum transmission intensity. Malar J. 2009;8:4.
8. Brugat T, et al. Antibody-independent mechanisms regulate the establishment of chronic Plasmodium infection. Nat Microbiol. 2017;2:16276.
1 9insight.jci.org https://doi.org/10.1172/jci.insight.125156
R E S E A R C H A R T I C L E
9. Brancucci NMB, et al. Lysophosphatidylcholine regulates sexual stage differentiation in the human malaria parasite Plasmodium falciparum. Cell. 2017;171(7):1532–1544.e15.
10. Mancio-Silva L, et al. Nutrient sensing modulates malaria parasite virulence. Nature. 2017;547(7662):213–216. 11. Zuzarte-Luís V, et al. Dietary alterations modulate susceptibility to Plasmodium infection. Nat Microbiol. 2017;2(12):1600–1607. 12. Chou ES, et al. A high parasite density environment induces transcriptional changes and cell death in Plasmodium falciparum
blood stages. FEBS J. 2018;285(5):848–870. 13. Uppal K, Walker DI, Liu K, Li S, Go YM, Jones DP. Computational metabolomics: a framework for the million metabolome.
Chem Res Toxicol. 2016;29(12):1956–1975. 14. Gupta S, et al. Extensive alterations of blood metabolites in pediatric cerebral malaria. PLoS ONE. 2017;12(4):e0175686. 15. Orikiiriza J, et al. Lipid response patterns in acute phase paediatric . Metabolomics. 2017;13(4):41. 16. Surowiec I, et al. The oxylipin and endocannabidome responses in acute phase Plasmodium falciparum malaria in children.
Malar J. 2017;16(1):358. 17. Surowiec I, et al. Metabolic signature profiling as a diagnostic and prognostic tool in pediatric Plasmodium falciparum malaria.
Open Forum Infect Dis. 2015;2(2):ofv062. 18. Uppal K, et al. Plasma metabolomics reveals membrane lipids, aspartate/asparagine and nucleotide metabolism pathway differ-
ences associated with chloroquine resistance in Plasmodium vivax malaria. PLoS ONE. 2017;12(8):e0182819. 19. Gardinassi LG, et al. Metabolome-wide association study of peripheral parasitemia in Plasmodium vivax malaria. Int J Med
Microbiol. 2017;307(8):533–541. 20. Moreno A, et al. Plasmodium coatneyi in rhesus macaques replicates the multisystemic dysfunction of severe malaria in
humans. Infect Immun. 2013;81(6):1889–1904. 21. Collins WE, Warren M, Sullivan JS, Galland GG. Plasmodium coatneyi: observations on periodicity, mosquito infection, and
transmission to Macaca mulatta monkeys. Am J Trop Med Hyg. 2001;64(3–4):101–110. 22. Bruce MC, et al. Cross-species interactions between malaria parasites in humans. Science. 2000;287(5454):845–848. 23. Cox MJ, et al. Dynamics of malaria parasitaemia associated with febrile illness in children from a rural area of Madang, Papua
New Guinea. Trans R Soc Trop Med Hyg. 1994;88(2):191–197. 24. Farnert A, Snounou G, Rooth I, Bjorkman A. Daily dynamics of Plasmodium falciparum subpopulations in asymptomatic chil-
dren in a holoendemic area. Am J Trop Med Hyg. 1997;56(5):538–547. 25. Price RN, et al. Factors contributing to anemia after uncomplicated falciparum malaria. Am J Trop Med Hyg. 2001;65(5):614–622. 26. Li S, et al. Predicting network activity from high throughput metabolomics. PLoS Comput Biol. 2013;9(7):e1003123. 27. Accardi CJ, et al. High-resolution metabolomics for nutrition and health assessment of armed forces personnel. J Occup Environ
Med. 2016;58(8 Suppl 1):S80–S88. 28. Sumner LW, et al. Proposed minimum reporting standards for chemical analysis Chemical Analysis Working Group (CAWG)
Metabolomics Standards Initiative (MSI). Metabolomics. 2007;3(3):211–221. 29. Stepien M, et al. Alteration of amino acid and biogenic amine metabolism in hepatobiliary cancers: Findings from a prospective
cohort study. Int J Cancer. 2016;138(2):348–360. 30. Chien JT, et al. High-quality genome assembly and annotation for Plasmodium coatneyi, generated using single-molecule real-
time PacBio technology. Genome Announc. 2016;4(5):null. 31. Galinski MR, et al. Plasmodium knowlesi: a superb in vivo nonhuman primate model of antigenic variation in malaria. Parasi-
tology. 2018;145(1):85–100. 32. Cunningham D, Lawton J, Jarra W, Preiser P, Langhorne J. The pir multigene family of Plasmodium: antigenic variation and
beyond. Mol Biochem Parasitol. 2010;170(2):65–73. 33. Caspi R, et al. The MetaCyc database of metabolic pathways and enzymes and the BioCyc collection of pathway/genome data-
bases. Nucleic Acids Res. 2016;44(D1):D471–D480. 34. Teuscher F, Chen N, Kyle DE, Gatton ML, Cheng Q. Phenotypic changes in artemisinin-resistant Plasmodium falciparum lines
in vitro: evidence for decreased sensitivity to dormancy and growth inhibition. Antimicrob Agents Chemother. 2012;56(1):428–431. 35. LaCrue AN, Scheel M, Kennedy K, Kumar N, Kyle DE. Effects of artesunate on parasite recrudescence and dormancy in the
rodent malaria model Plasmodium vinckei. PLoS ONE. 2011;6(10):e26689. 36. White NJ. Malaria parasite clearance. Malar J. 2017;16(1):88. 37. Price R, et al. Risk factors for gametocyte carriage in uncomplicated falciparum malaria. Am J Trop Med Hyg. 1999;60(6):1019–1023. 38. Finney CA, et al. S1P is associated with protection in human and experimental cerebral malaria. Mol Med. 2011;17(7–8):717–725. 39. Mi-Ichi F, Kano S, Mitamura T. Oleic acid is indispensable for intraerythrocytic proliferation of Plasmodium falciparum. Parasitology.
2007;134(Pt 12):1671–1677. 40. Jayabalasingham B, Menard R, Fidock DA. Recent insights into fatty acid acquisition and metabolism in malarial parasites.
F1000 Biol Rep. 2010;2:null. 41. Assaraf YG, Golenser J, Spira DT, Bachrach U. Polyamine levels and the activity of their biosynthetic enzymes in human eryth-
rocytes infected with the malarial parasite, Plasmodium falciparum. Biochem J. 1984;222(3):815–819. 42. Pappa V, et al. Lipid metabolites of the phospholipase A2 pathway and inflammatory cytokines are associated with brain vol-
ume in paediatric cerebral malaria. Malar J. 2015;14:513. 43. Tetsutani K, To H, Torii M, Hisaeda H, Himeno K. Malaria parasite induces tryptophan-related immune suppression in mice.
Parasitology. 2007;134(Pt 7):923–930. 44. Olszewski KL, et al. Host-parasite interactions revealed by Plasmodium falciparum metabolomics. Cell Host Microbe.
2009;5(2):191–199. 45. Alkaitis MS, et al. Decreased rate of plasma arginine appearance in murine malaria may explain hypoargininemia in children
with cerebral malaria. J Infect Dis. 2016;214(12):1840–1849. 46. Drobnik W, et al. Plasma ceramide and lysophosphatidylcholine inversely correlate with mortality in sepsis patients. J Lipid Res.
2003;44(4):754–761. 47. Ginsburg H, Abdel-Haleem AM. Malaria parasite metabolic pathways (MPMP) upgraded with targeted chemical compounds.
Trends Parasitol. 2016;32(1):7–9.
2 0insight.jci.org https://doi.org/10.1172/jci.insight.125156
R E S E A R C H A R T I C L E
48. Daily JP, et al. Distinct physiological states of Plasmodium falciparum in malaria-infected patients. Nature. 2007;450(7172):1091–1095.
49. Tonkin-Hill GQ, et al. The Plasmodium falciparum transcriptome in severe malaria reveals altered expression of genes involved in important processes including surface antigen-encoding var genes. PLoS Biol. 2018;16(3):e2004328.
50. Milner DA, et al. Transcriptional profiling of Plasmodium falciparum parasites from patients with severe malaria identifies dis-tinct low vs. high parasitemic clusters. PLoS ONE. 2012;7(7):e40739.
51. MacRae JI, et al. Mitochondrial metabolism of sexual and asexual blood stages of the malaria parasite Plasmodium falciparum. BMC Biol. 2013;11:67.
52. Cassera MB, et al. The methylerythritol phosphate pathway is functionally active in all intraerythrocytic stages of Plasmodium falciparum. J Biol Chem. 2004;279(50):51749–51759.
53. Kelly M, et al. Malaria parasites produce volatile mosquito attractants. MBio. 2015;6(2):null. 54. Lapp SA, et al. PacBio assembly of a Plasmodium knowlesi genome sequence with Hi-C correction and manual annotation of
the SICAvar gene family. Parasitology. 2018;145(1):71–84. 55. Gratraud P, et al. Oleic acid biosynthesis in Plasmodium falciparum: characterization of the stearoyl-CoA desaturase and inves-
tigation as a potential therapeutic target. PLoS ONE. 2009;4(9):e6889. 56. Matesanz F, Téllez Md, Alcina A. The Plasmodium falciparum fatty acyl-CoA synthetase family (PfACS) and differential
stage-specific expression in infected erythrocytes. Mol Biochem Parasitol. 2003;126(1):109–112. 57. Niihara Y, et al. L-glutamine therapy reduces endothelial adhesion of sickle red blood cells to human umbilical vein endothelial
cells. BMC Blood Disord. 2005;5:4. 58. Williamson KC, Levine RL, Miller LH. Even malaria parasites watch their host’s diet. Nat Microbiol. 2018;3(2):130–131. 59. Sazawal S, et al. Effects of routine prophylactic supplementation with iron and folic acid on admission to hospital and mortality
in preschool children in a high malaria transmission setting: community-based, randomised, placebo-controlled trial. Lancet. 2006;367(9505):133–143.
60. Kempaiah P, et al. Reduced Hsp70 and glutamine in pediatric severe malaria anemia: role of hemozoin in suppressing Hsp70 and NF-κB activation. Mol Med. 2016;22:570–584.
61. Gordon EB, et al. Targeting glutamine metabolism rescues mice from late-stage cerebral malaria. Proc Natl Acad Sci USA. 2015;112(42):13075–13080.
62. Parra Millán R, et al. Efficacy of lysophosphatidylcholine in combination with antimicrobial agents against Acinetobacter bau-mannii in experimental murine peritoneal sepsis and pneumonia models. Antimicrob Agents Chemother. 2016;60(8):4464–4470.
63. Aurrecoechea C, et al. PlasmoDB: a functional genomic database for malaria parasites. Nucleic Acids Res. 2009;37(Database issue):D539–D543.
64. Barrett T, et al. NCBI GEO: archive for functional genomics data sets--update. Nucleic Acids Res. 2013;41(Database issue):D991–D995. 65. Joyner C, et al. Plasmodium cynomolgi infections in rhesus macaques display clinical and parasitological features pertinent to
modelling vivax malaria pathology and relapse infections. Malar J. 2016;15(1):451. 66. Desowitz RS, Miller LH, Buchanan RD, Permpanich B. The sites of deep vascular schizogony in Plasmodium coatneyi malar-
ia. Trans R Soc Trop Med Hyg. 1969;63(2):198–202. 67. World Health Organization. Guidelines for the Treatment of Malaria - 2nd Edition. http://appswhoint/medicinedocs/en/m/
abstract/Js19105en/ 2010;Updated on March 9, 2010. Accessed April 5, 2019. 68. Wampfler R, et al. Strategies for detection of Plasmodium species gametocytes. PLoS ONE. 2013;8(9):e76316. 69. Go YM, et al. Reference standardization for mass spectrometry and high-resolution metabolomics applications to exposome
research. Toxicol Sci. 2015;148(2):531–543. 70. Soltow QA, Strobel FH, Mansfield KG, Wachtman L, Park Y, Jones DP. High-performance metabolic profiling with dual chroma-
tography-Fourier-transform mass spectrometry (DC-FTMS) for study of the exposome. Metabolomics. 2013;9(1 Suppl):S132–S143. 71. Yu T, Park Y, Johnson JM, Jones DP. apLCMS--adaptive processing of high-resolution LC/MS data. Bioinformatics.
2009;25(15):1930–1936. 72. Uppal K, et al. xMSanalyzer: automated pipeline for improved feature detection and downstream analysis of large-scale, non-tar-
geted metabolomics data. BMC Bioinformatics. 2013;14:15. 73. Leek JT, Johnson WE, Parker HS, Jaffe AE, Storey JD. The sva package for removing batch effects and other unwanted variation
in high-throughput experiments. Bioinformatics. 2012;28(6):882–883. 74. Uppal K, Walker DI, Jones DP. xMSannotator: An R package for network-based annotation of high-resolution metabolomics
data. Anal Chem. 2017;89(2):1063–1067. 75. Xia J, Wishart DS. Using MetaboAnalyst 3.0 for comprehensive metabolomics data analysis. Curr Protoc Bioinformatics.
2016;55:14.10.1–14.10.91. 76. Lee KJ, et al. Comparative transcriptomics and metabolomics in a rhesus macaque drug administration study. Front Cell Dev Biol.
2014;2:54. 77. Zimin AV, et al. A new rhesus macaque assembly and annotation for next-generation sequencing analyses. Biol Direct. 2014;9(1):20. 78. Dobin A, et al. STAR: ultrafast universal RNA-seq aligner. Bioinformatics. 2013;29(1):15–21. 79. Anders S, Pyl PT, Huber W. HTSeq--a Python framework to work with high-throughput sequencing data. Bioinformatics.
2015;31(2):166–169. 80. Babicki S, et al. Heatmapper: web-enabled heat mapping for all. Nucleic Acids Res. 2016;44(W1):W147–W153.