![Data Visualization & Reporting [DOCUMENT TITLE]](https://static.fdocuments.us/doc/165x107/6174b6c9163b62700973e049/data-visualization-amp-reporting-document-title.jpg)
Embedded Reporting for Data Visualization
27
Embedded Reporting for Data Visualization Robin Davies Director Sales Jinfonet Software Rockville, MD Greg Harris Product Engineer Jinfonet Software Rockville, MD
-
Upload
ifeoma-morris -
Category
Documents
-
view
49 -
download
2
description
Embedded Reporting for Data Visualization. Robin Davies Director Sales Jinfonet Software Rockville, MD. Greg Harris Product Engineer Jinfonet Software Rockville, MD. Agenda. Introduction Visualization Interactivity Embedded Reporting Examples of Visual Reporting Implementations - PowerPoint PPT Presentation
Transcript of Embedded Reporting for Data Visualization
Embedded Reporting for Data Visualization
Robin DaviesDirector Sales
Jinfonet SoftwareRockville, MD
Greg Harris Product Engineer
Jinfonet SoftwareRockville, MD
Agenda
• Introduction
• Visualization
• Interactivity
• Embedded Reporting
• Examples of Visual Reporting Implementations
• Q & A
Jinfonet Software
• Our Mission: To simplify information delivery and data visualization for enterprise applications.
• About Jinfonet Software:– Privately Held, Self-funded, Debt-free
– Profitable with Significant Re-investment in R&D
– Over 160 Java Developers Continue to Enhance JReport
– First to Offer Embedded Reporting for Java Apps in 1998
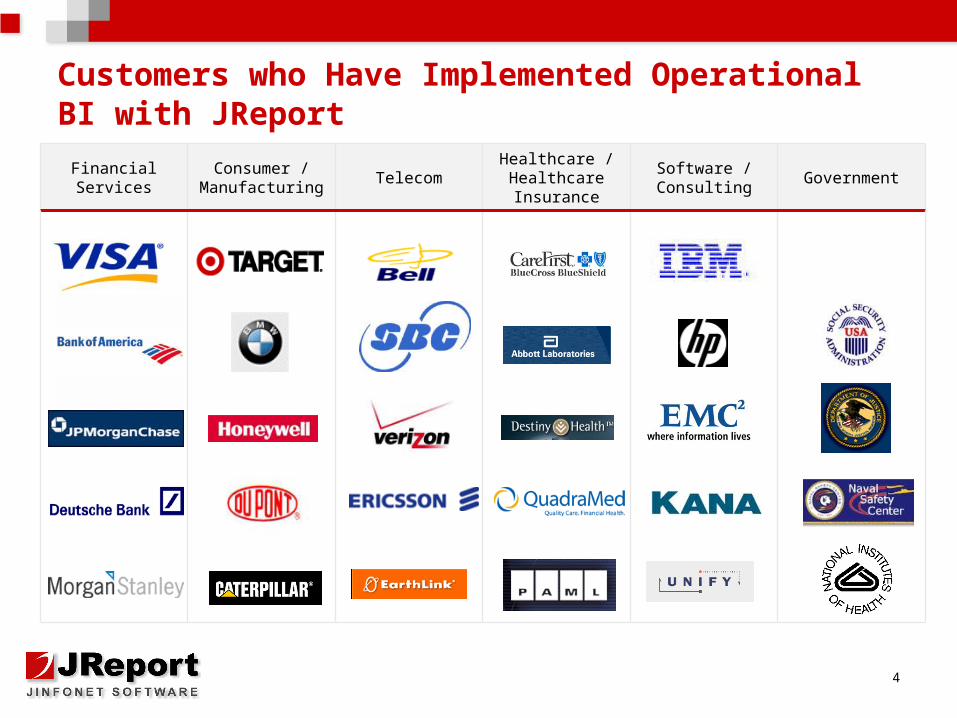
GovernmentSoftware / Consulting
Healthcare / Healthcare Insurance
TelecomConsumer /
ManufacturingFinancial Services
4
Customers who Have Implemented Operational BI with JReport
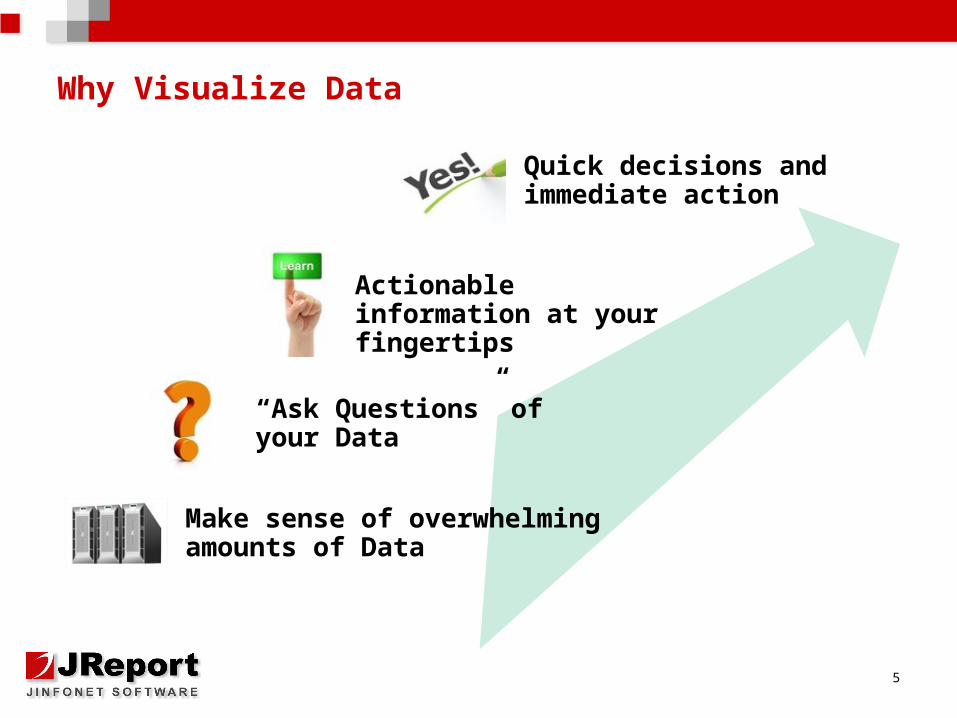
Why Visualize Data
5
Make sense of overwhelming amounts of Data
“Ask Questions” of your Data
Actionable information at your fingertips
Quick decisions and immediate action
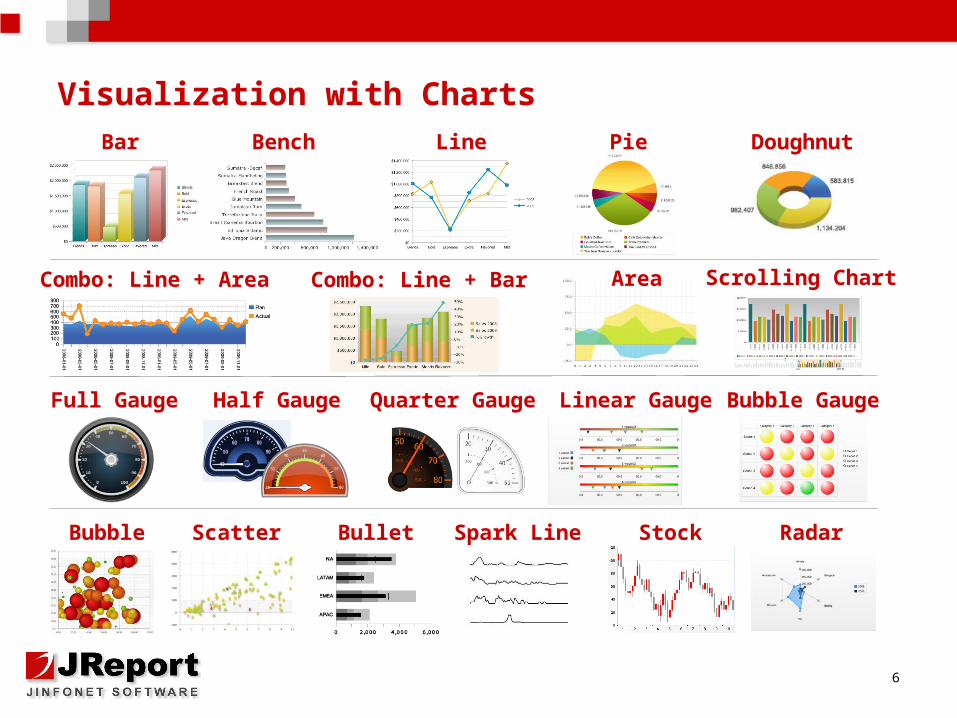
Visualization with Charts
6
Bar Bench
Area
Pie Doughnut
Combo: Line + Area Combo: Line + Bar
Full Gauge Linear Gauge Bubble Gauge
Bubble Bullet Stock Radar
Half Gauge Quarter Gauge
Scatter Spark Line
Line
Scrolling Chart
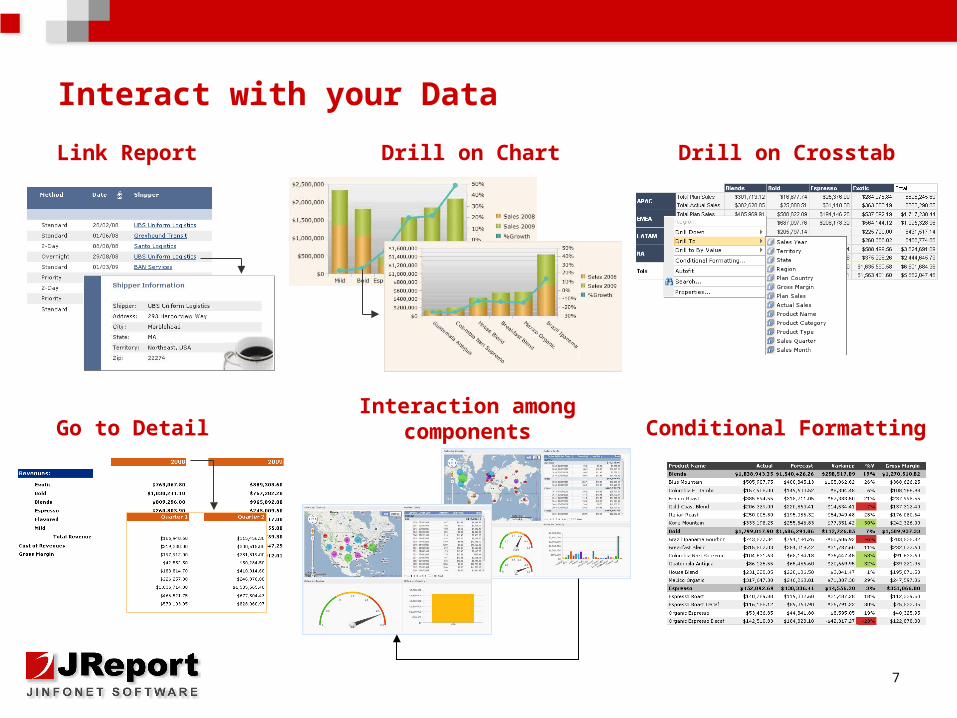
Interact with your Data
7
Drill on ChartLink Report Drill on Crosstab
Conditional FormattingGo to DetailInteraction among
components
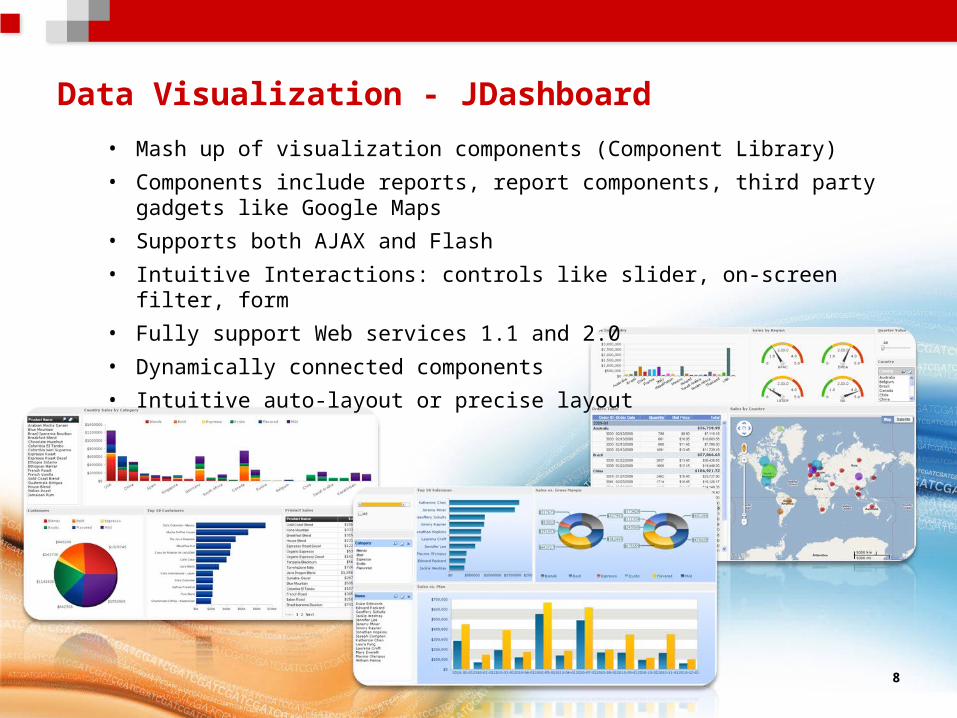
Data Visualization - JDashboard
8
• Mash up of visualization components (Component Library)
• Components include reports, report components, third party gadgets like Google Maps
• Supports both AJAX and Flash
• Intuitive Interactions: controls like slider, on-screen filter, form
• Fully support Web services 1.1 and 2.0
• Dynamically connected components
• Intuitive auto-layout or precise layout
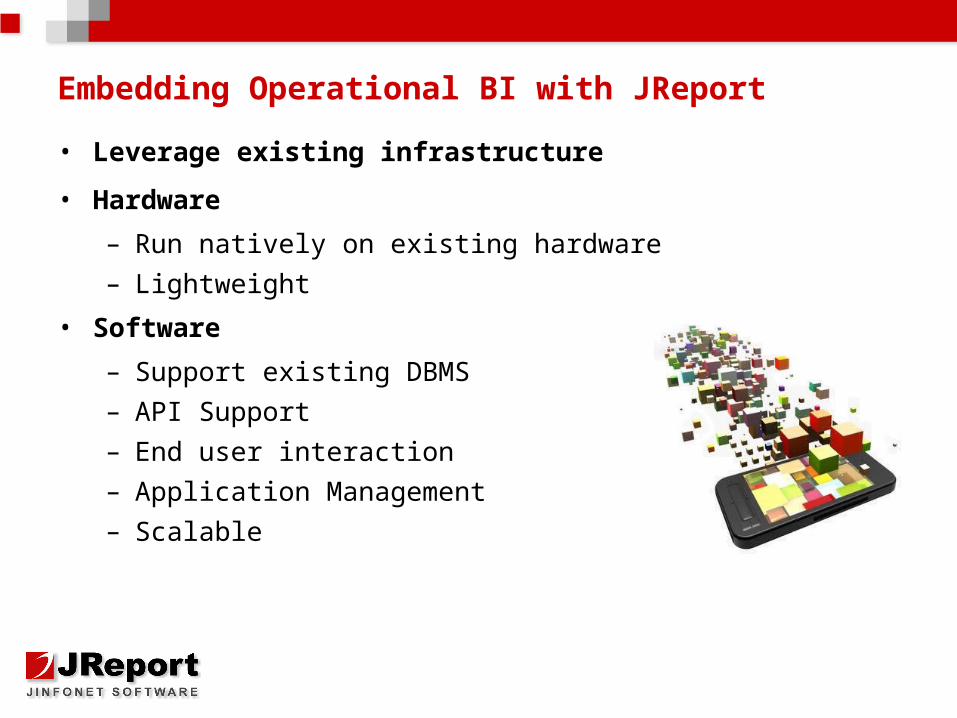
Embedding Operational BI with JReport
• Leverage existing infrastructure
• Hardware
– Run natively on existing hardware– Lightweight
• Software
– Support existing DBMS– API Support– End user interaction– Application Management– Scalable
10
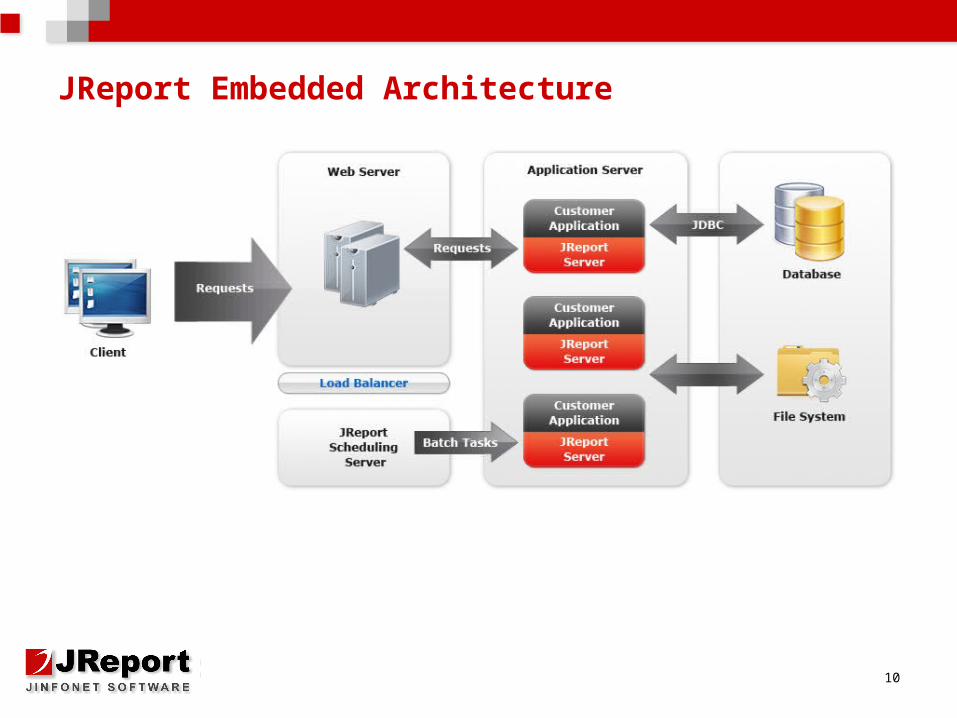
JReport Embedded Architecture
11
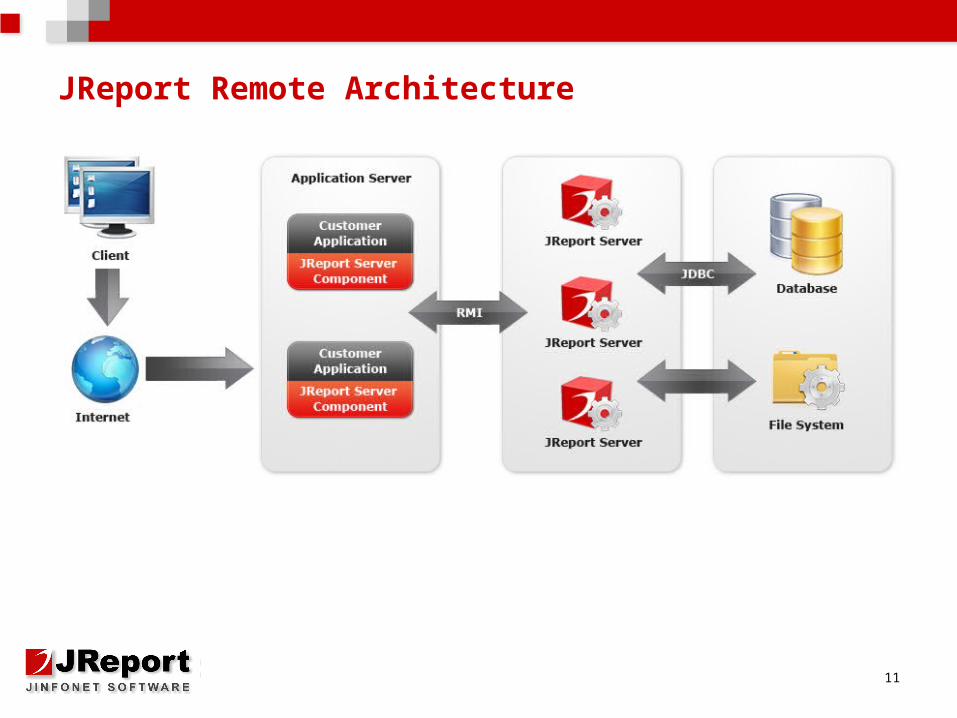
JReport Remote Architecture
12
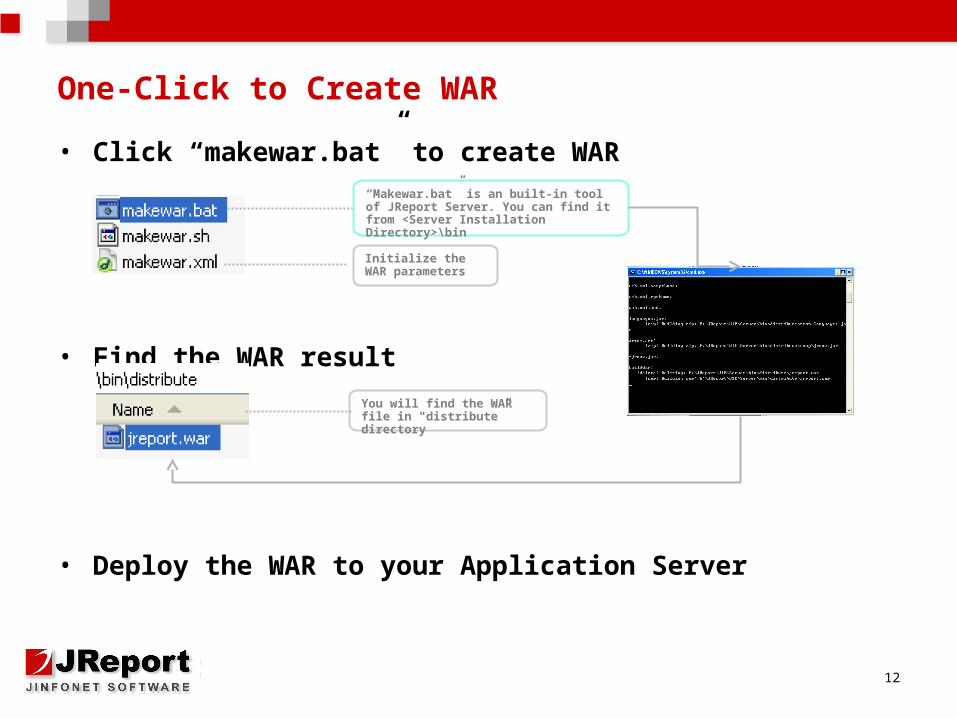
One-Click to Create WAR
• Click “makewar.bat” to create WAR
• Find the WAR result
• Deploy the WAR to your Application Server
“Makewar.bat” is an built-in tool of JReport Server. You can find it from <Server Installation Directory>\bin
Initialize the WAR parameters
You will find the WAR file in "distribute” directory
13
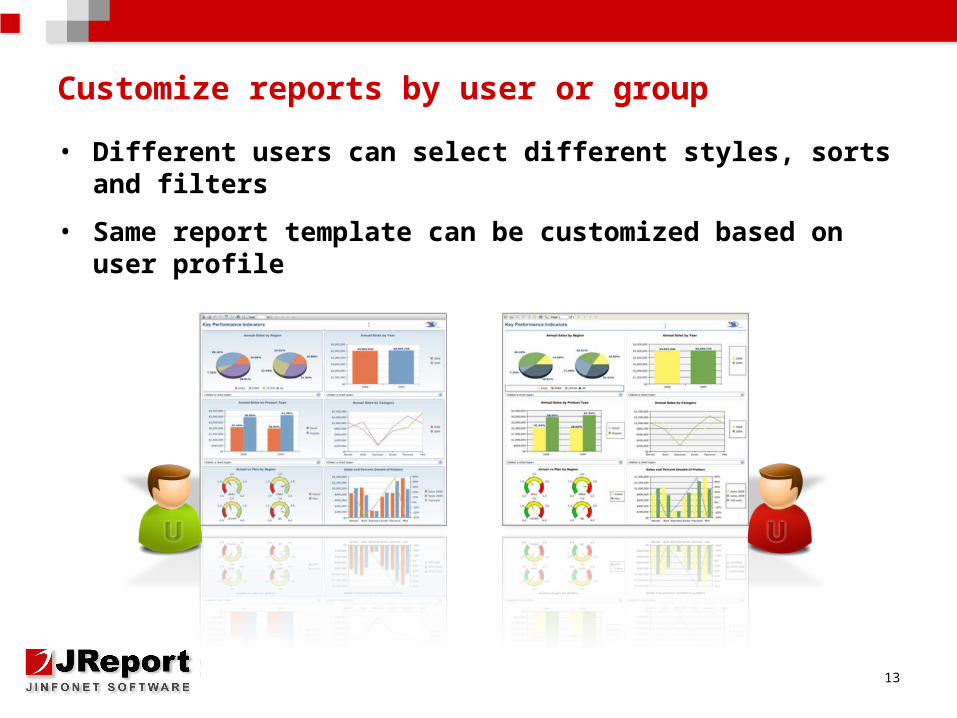
Customize reports by user or group
• Different users can select different styles, sorts and filters
• Same report template can be customized based on user profile
14
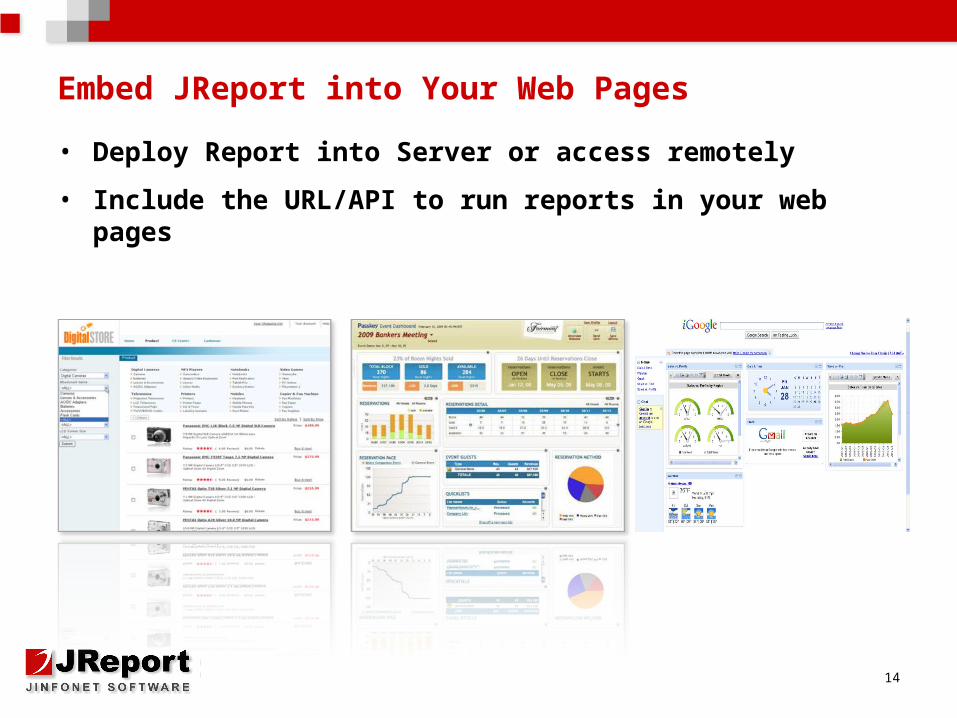
Embed JReport into Your Web Pages
• Deploy Report into Server or access remotely
• Include the URL/API to run reports in your web pages
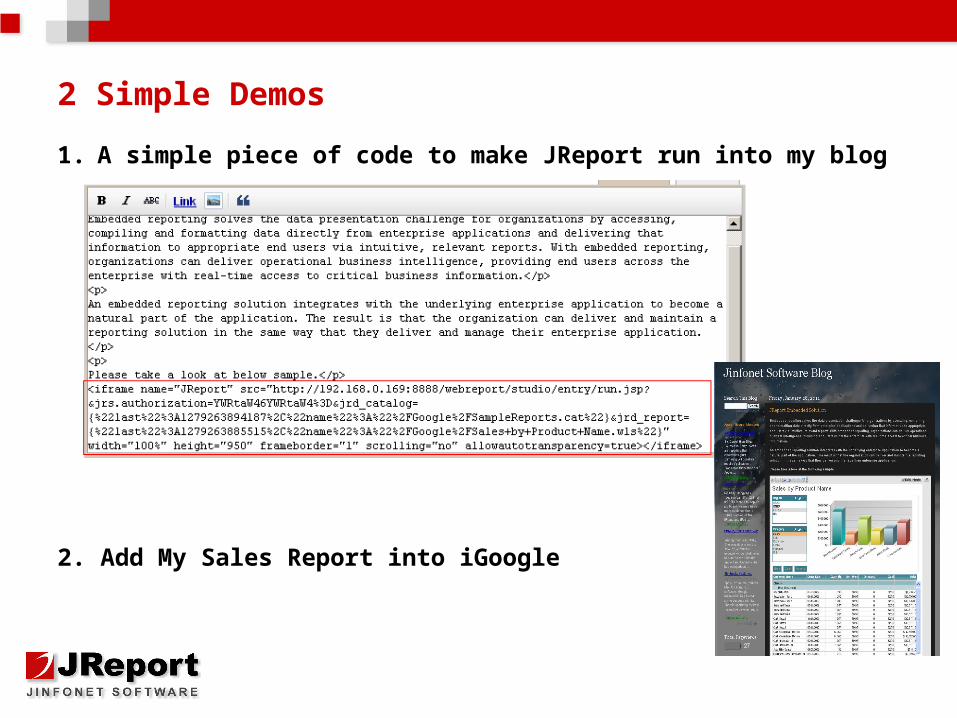
2 Simple Demos
1. A simple piece of code to make JReport run into my blog
2. Add My Sales Report into iGoogle
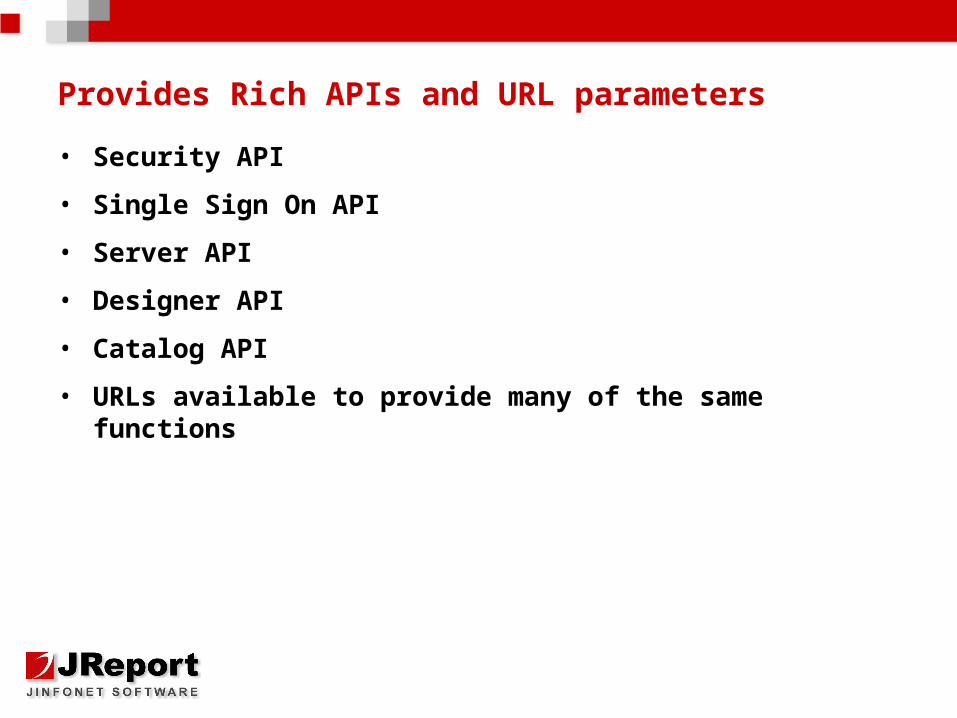
Provides Rich APIs and URL parameters
• Security API
• Single Sign On API
• Server API
• Designer API
• Catalog API
• URLs available to provide many of the same functions
17
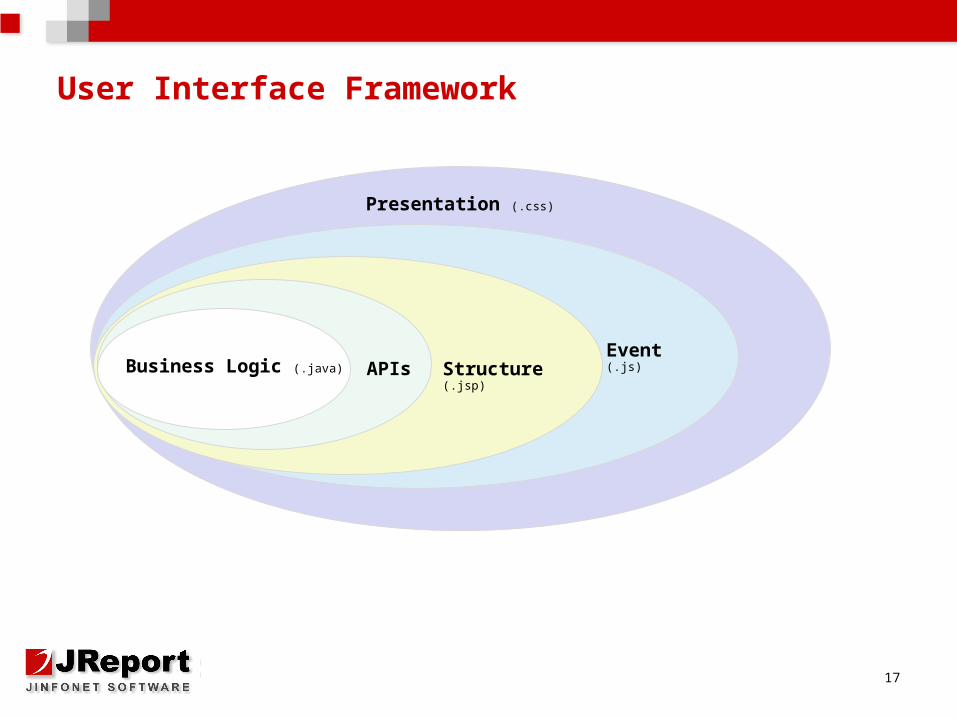
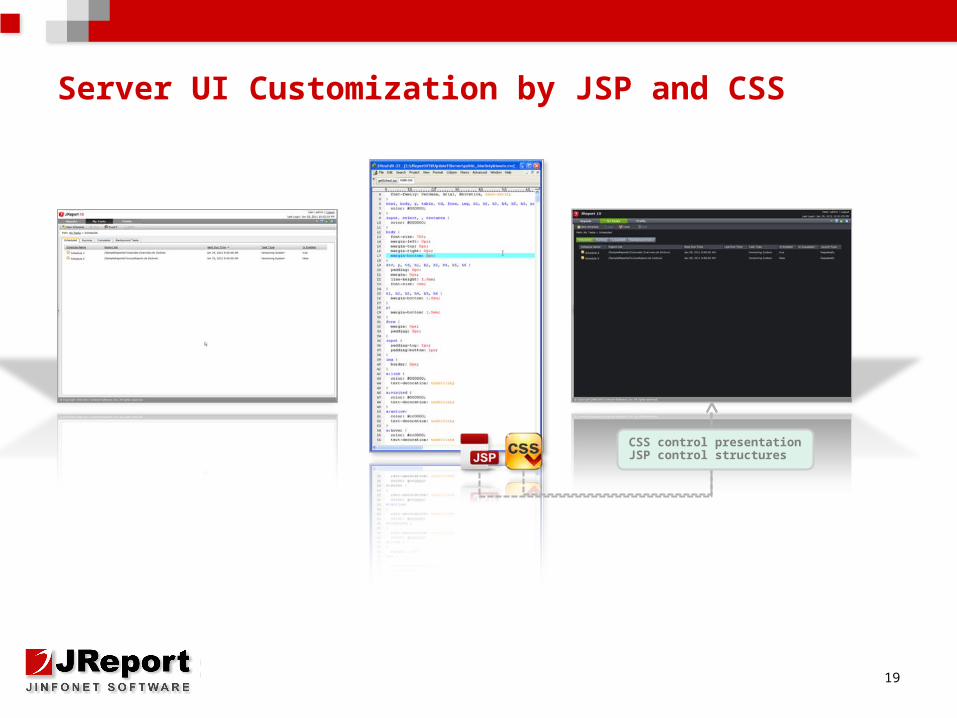
User Interface Framework
Business Logic (.java) APIs Structure (.jsp)
Event (.js)
Presentation (.css)
18
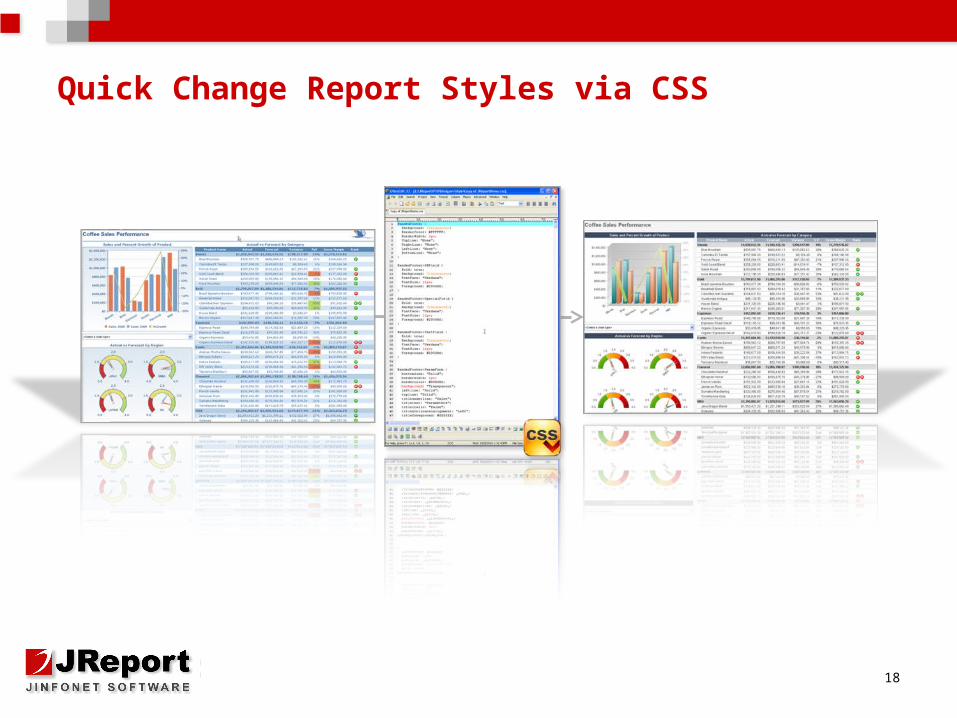
Quick Change Report Styles via CSS
19
Server UI Customization by JSP and CSS
CSS control presentationJSP control structures
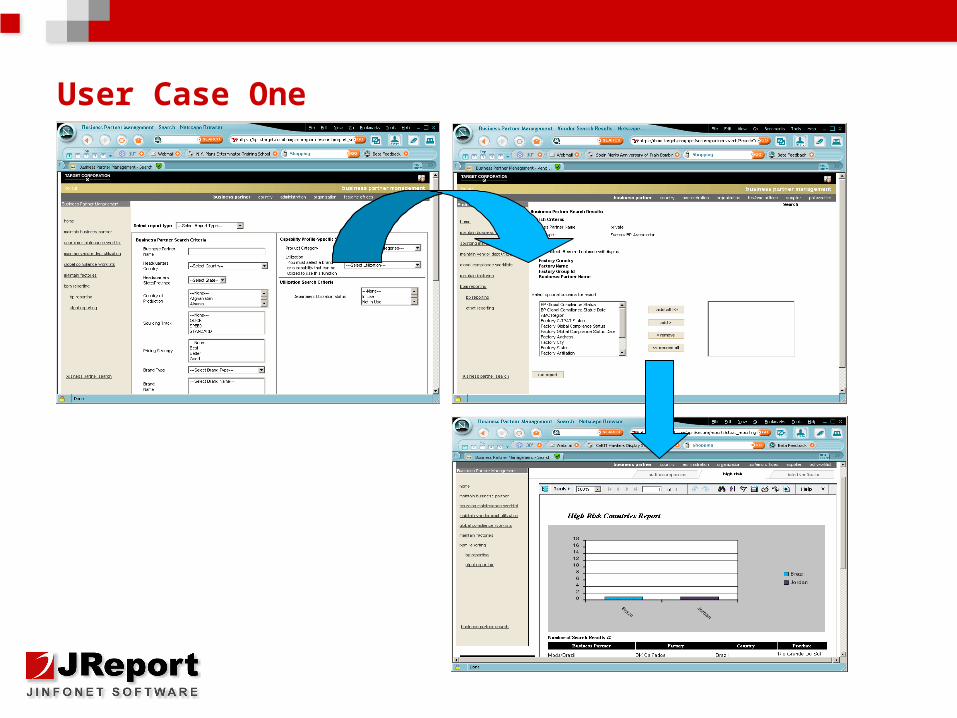
User Case One
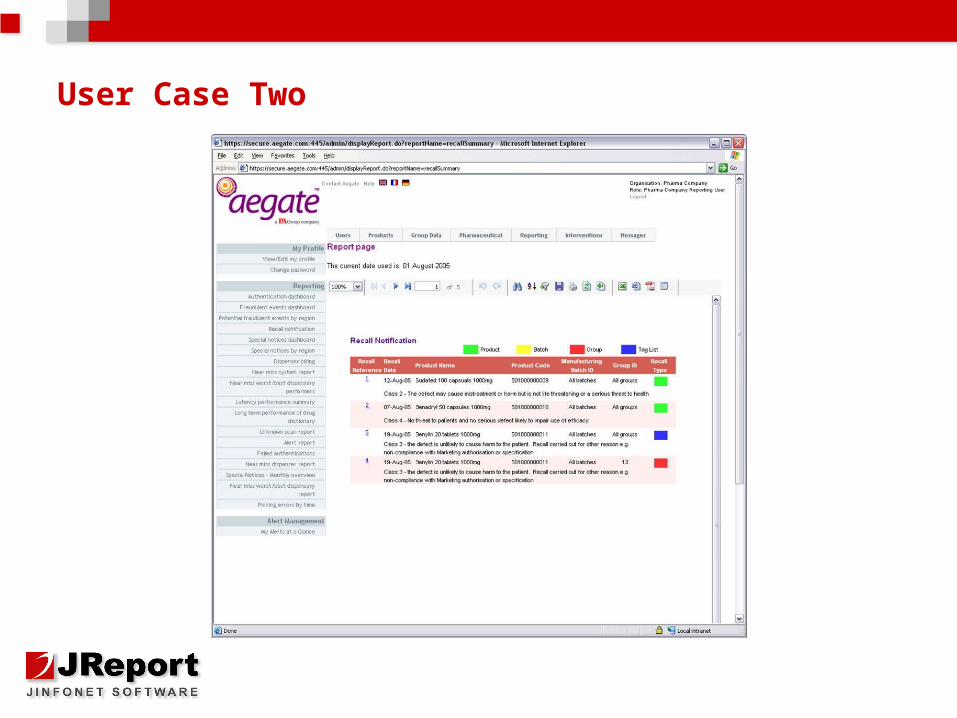
User Case Two
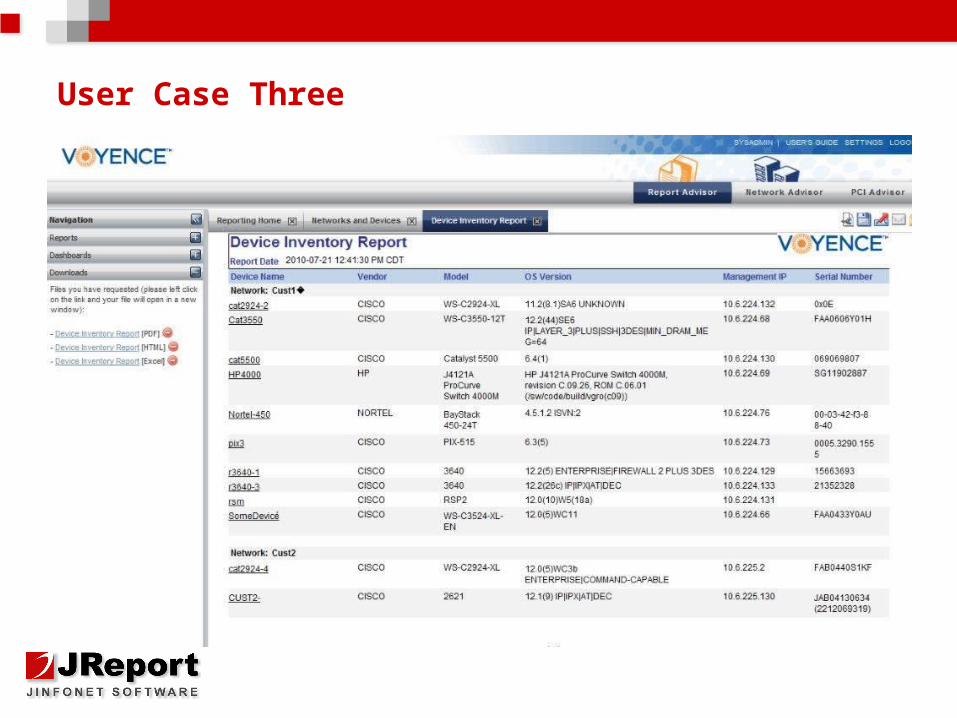
User Case Three
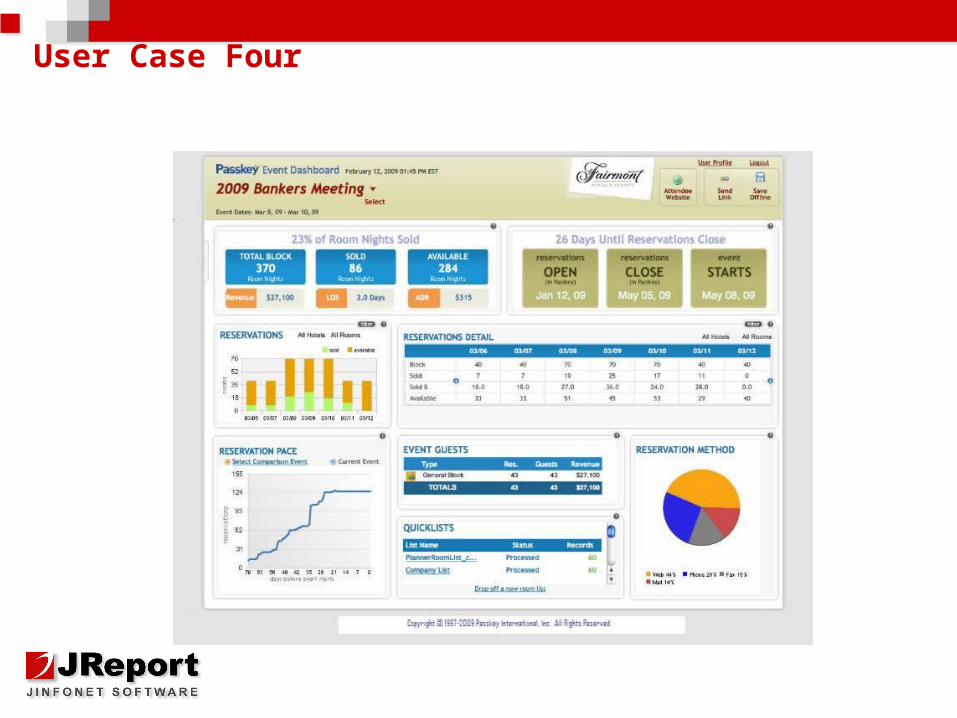
User Case Four
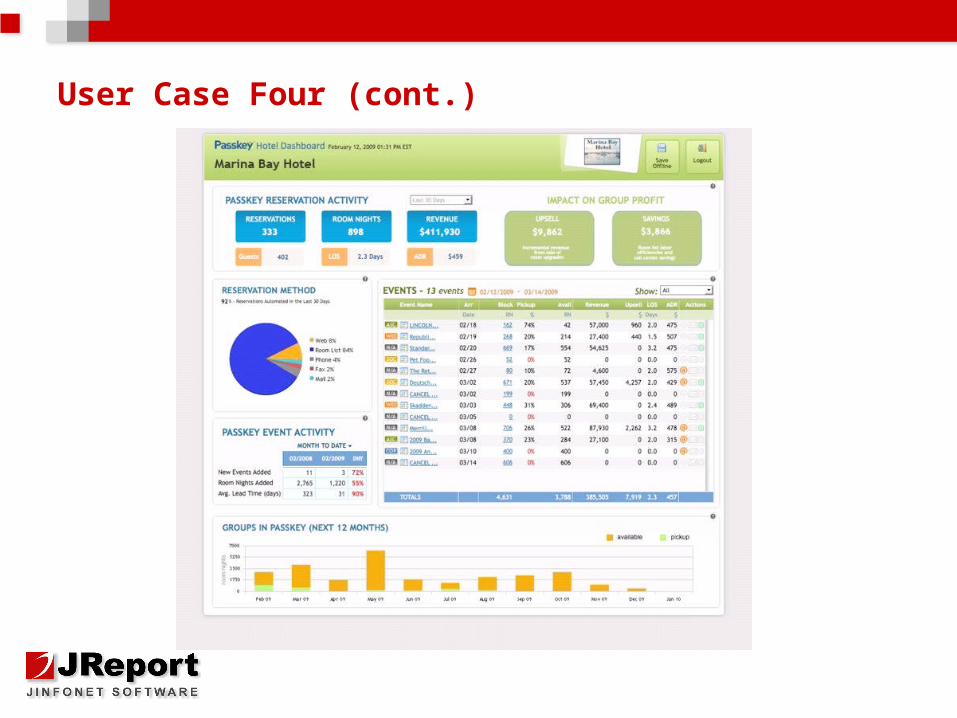
User Case Four (cont.)
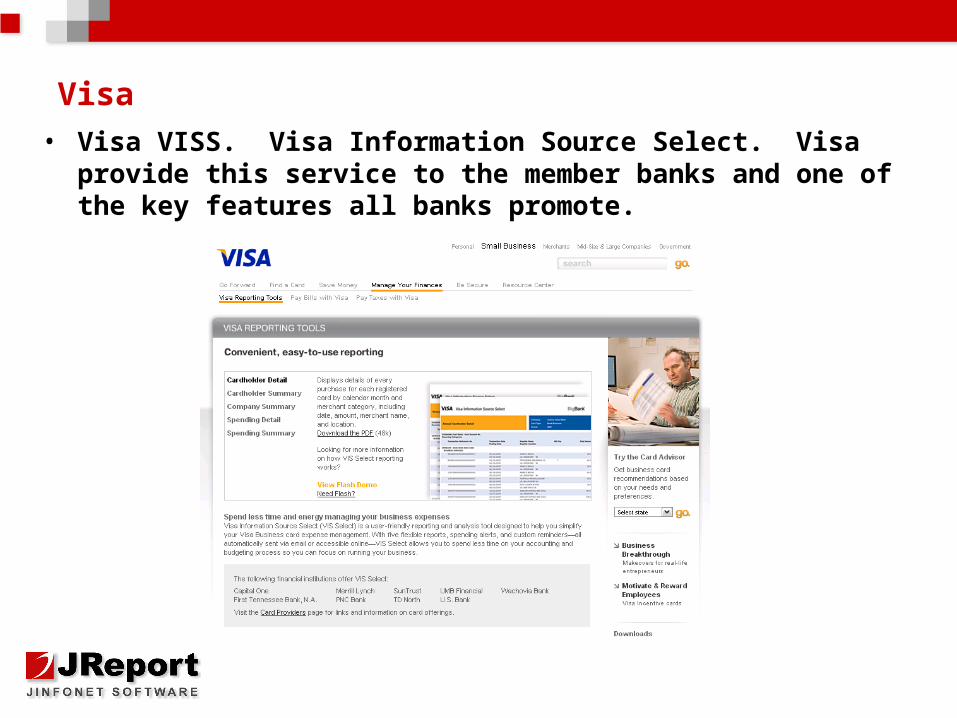
Visa• Visa VISS. Visa Information Source Select. Visa
provide this service to the member banks and one of the key features all banks promote.
Q & A
Please type questions in chat box for moderator review
Web: http://www.jinfonet.com
E-Mail: [email protected]
Sales: [email protected]
Phone: 240-477-1000
Please Join Us for our next Webinar
Agile BI: Lightning Fast Report Development & Data Analysis
Wednesday, July 27, 2011
2:00 PM (EST)