Embassy Suites (at the Airport) St. Louis, Missouri October 20, 2014 11 1.
59
For The Annual Conference of the American Society of Agricultural Consultants Embassy Suites (at the Airport) St. Louis, Missouri October 20, 2014 11 1
-
Upload
bruno-mccarthy -
Category
Documents
-
view
216 -
download
0
Transcript of Embassy Suites (at the Airport) St. Louis, Missouri October 20, 2014 11 1.

For The Annual
Conference of the American Society
of Agricultural Consultants
Embassy Suites (at the Airport)
St. Louis, Missouri
October 20, 2014
111

Major U.S. and Global Economic, Financial, Agricultural and Beef Industry Trends, Challenges and Opportunities
By Bill Helming
Economist, Agribusiness Consultant, Author and
SpeakerBill Helming Consulting Services
13881 West 138th Street #302
Olathe, Kansas 66062
(913) 768-6540
2

3
Who is Bill?
Grew up in La Jolla, CA on a ranch and feedlot with two brothers in the 1940’s and 50’s.
Went to Oregon State University on a football scholarship.
Moved to Nevada to run the family ranch and received B.S. and M.S. in Ag Economics at University of Nevada at Reno.
Moved to Denver - First Chief Economist for the National Cattlemen’s Beef Association in 1965, launched CattleFax as its first general manager.
Moved to Kansas and launched a macro economic & Ag consulting firm in 1972, “Bill Helming Consulting Services.”

Daughter Tammy & Family
Who is Bill?Bill &Wife Kathleen
Son Nathan Son Troy & Family
4
Daughter Tammy & Family

The U.S. and Global Economic and Financial Market Outlook
and Key Trends
5
A much slower than normal, very poor and disappointing average annual U.S. economic GDP growth rate for the seven years of 2007-2013 of 1.10%.
The average annual rate of U.S. economic GDP growth for the 10 years of 1929-1939 (the Great Depression) was 1.32%. The above 1.10% average annual rate of GDP growth for the seven years of 2007-2013 was significantly less (17% less) than the 1.32% average annual rate of GDP growth during the 10 year Great Depression.
6
During the 68 years of 1940-2007, the average annual rate of U.S. economic GDP growth was 3.82%. This 68-year period included 11 economic recessions. The 3.82% average annual 68-year period of GDP growth for the U.S. was 248% higher than for the seven years of 2007-2013 and 190% higher than for the 10 years of 1929-1939.
Said in a different way, the 2007-2013 economic GDP growth rate number of 1.10% was only 29% of the 3.82% economic growth rate number for the 68 years of 1940-2007 and the 1929-1939 economic GDP growth rate number of 1.32% was only 35% of the 3.82% economic growth rate number for the 68 years of 1940-2007 time
period.
7
Bottom line, the average annual rate of U.S. economic growth over the next 10 years will continue to be much less than normal, very disappointing and the U.S. economy will experience a major, painful and serious economic price, cost and asset deflationary recession within the next three to five years.
The overall European economy is now flat or in a very real and serious recession that will get worse within the next three to five years. Europe will experience price and asset deflation during this period. This will also be true for the U.S. Europe economically and demographically is now in major decline.
8

The Japanese economy has generally been in a recessionary and price and asset deflationary mode for the past 22 years. This will continue and get worse trending south within the next five years. Japan economically and demographically is also in major decline.
China continues to have the biggest and worst real estate debt bubble that the world has ever seen. This bubble is going to burst within the next three to five years. The Chinese economy continues to substantially slow down and is headed for a hard landing within the next three to five years. This will be negative for the U.S. economy and
bearish on U.S. and global commodity prices.
9

President Obama’s Gross Lack of Effective Leadership
10

11
The overall world in 2014 and beyond is facing very serious economic, debt, political, social unrest, conflict, terrorist activities and war issues, developments and trends that are very likely going to get worse. Dealing with these issues and trends requires (among other things) very strong and committed U.S. and presidential (White House) leadership and specific and well thought out strategies to effectively deal with these realities and trends. President Obama has provided, unfortunately, zero leadership and his strategies have not been well thought out for dealing with foreign policy challenges on many fronts nor the required leadership regarding badly needed new, different and effective U.S. economic policies that will get our economy back on the right track.

I Remain Bullish on the U.S. Dollar
12

I have been bullish on the U.S. dollar longer term since 2009-2010 for sound and good reasons. The U.S. dollar has been strengthening significantly. From the U.S. dollar lows over the past six years, the U.S. dollar is now 18% to 20% higher in market driven trading value. I strongly believe the U.S. dollar will continue to gain on most other major currencies for the next five years.
13

Among the many reasons why the U.S. dollar is getting stronger is that most other global economies (such as western and eastern Europe, England, Japan, South America, Australia and New Zealand) are performing worse than our economy. Many of those with wealth outside of the U.S. are buying U.S. Federal Government Treasury Bonds and the U.S. dollar as part of a flight to safety and protection because they see more serious and real financial risks and
volatility in their own countries thanin the U.S.
14
I believe these trends and perceptions are real and correct. Economically, debt and financially speaking, most major economies in the world have very dirty shirts and these shirts are typically more dirty than ours in the U.S.
15

Plan and Prepare for U.S. Price and Asset Deflation
16
The U.S. consumer price index (CPI) was 1.2% in 2013. This represents the lowest rate of CPI inflation since 1964 (in 50 years). The average rate of CPI inflation for 2014 will end up being close to 1.5%. I remain confident that our economy will experience some significant general price, cost and asset deflation for a good part of the next 10 years.

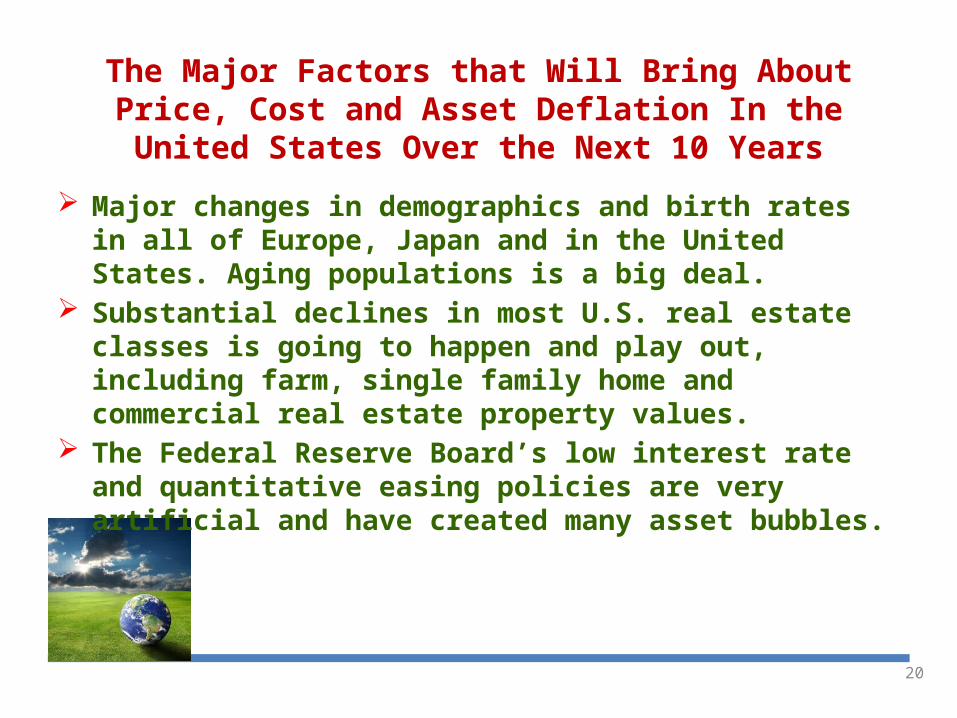
The Major Factors that Will Bring About Price, Cost and Asset Deflation In the United States Over the Next 10
Years
Declining median U.S. wages and family incomes. Total supply of labor exceeds the total demand for labor. Many existing and new technologies that result in
declining prices, costs and improved productivity levels. The very significant decline in the U.S. labor participation
rate and the major increase in part-time workers and the underemployed Americans.
17

The Major Factors that Will Bring About Price, Cost and Asset Deflation In the United States Over the Next 10
Years
The velocity of money (the turnover rate) has been declining for the past six years.
Continued slow U.S. economic growth and the coming U.S. serious and painful economic recession.
Global economic growth is slowing down significantly with some countries already in recession and experiencing price, cost and asset deflation such as in Japan and in western and eastern Europe.
18

The Major Factors that Will Bring About Price, Cost and Asset Deflation In the United States Over the Next 10
Years
Declining U.S. and global commodity prices, including sharply lower crude oil, energy and gold prices.
A substantially stronger U.S. dollar, which by itself will be bearish on U.S. commodity prices.
Rising consumer, household, business, corporate and government debt.
I fully expect U.S. crude oil prices to decline to the $35 to $45 per barrel level within the next three to five years.
19
The Major Factors that Will Bring About Price, Cost and Asset Deflation In the United States Over the Next 10
Years
Major changes in demographics and birth rates in all of Europe, Japan and in the United States. Aging populations is a big deal.
Substantial declines in most U.S. real estate classes is going to happen and play out, including farm, single family home and commercial real estate property values.
The Federal Reserve Board’s low interest rate and quantitative easing policies are very artificial and have created many asset bubbles.
20
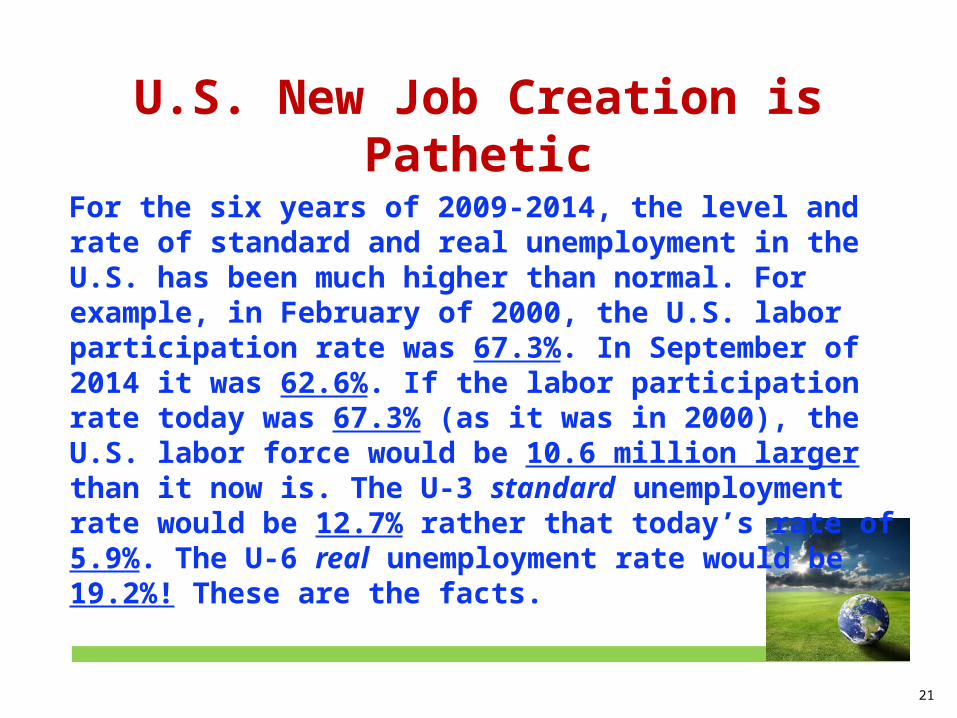
U.S. New Job Creation is Pathetic
21
For the six years of 2009-2014, the level and rate of standard and real unemployment in the U.S. has been much higher than normal. For example, in February of 2000, the U.S. labor participation rate was 67.3%. In September of 2014 it was 62.6%. If the labor participation rate today was 67.3% (as it was in 2000), the U.S. labor force would be 10.6 million larger than it now is. The U-3 standard unemployment rate would be 12.7% rather that today’s rate of 5.9%. The U-6 real unemployment rate would be 19.2%! These are the facts.
U.S. Worker Wages and Incomes are Declining
22

23
Based on the U.S. Census Bureau database, the median family net worth was $87,000 in 2007 and declined to $56,000 in 2013. This is a decline of $31,000 or 36%. This has not happened since the 1930’s. Since 2007, U.S. median incomes have declined 8.5%.
Based on the U.S. Census Bureau data, 25% of people in the U.S. today who are 25 to 34 years old are living with their parents. That number was 18% in 2007 and 11% in 1980. This is a result of (1) the rate of economic growth being much slower than normal, (2) relatively high unemployment, (3) declining real and medium wages and family incomes, (4) the supply of labor exceeding demand and (5) record high and top heavystudent loan debt in the U.S.

24
The total supply of labor and the number of people who want and need a job and who are able to work in the U.S. exceeds the total demand for labor in the U.S.
The number of new monthly jobs created at this stage of the U.S. business cycle is pathetic and is nowhere close to normal. Over 70% of the new jobs being created each month in 2013 and 2014 are part-time hourly wage jobs that pay close to 25% less than what these same jobs would have paid several years ago, according to the U.S. Department of Labor statistics.

Based on the Bureau of Economic Analysis (U.S. Department of Commerce) data, Chart 1 shows the annual value-added manufacturing output, as a percentage of GDP, for the 44 years of 1970-2013. This output declined 44% over these 44 years, a decline of 1.0% per year. Very significant U.S. manufacturing output and jobs have been lost, transferred and exported to many other countries around the world. As shown in Chart 1 total manufacturing value-added output, as a percent of GDP, was 22% in 1970 and was 12.4% in 2014.
U.S. Manufacturing is in Major Decline
25
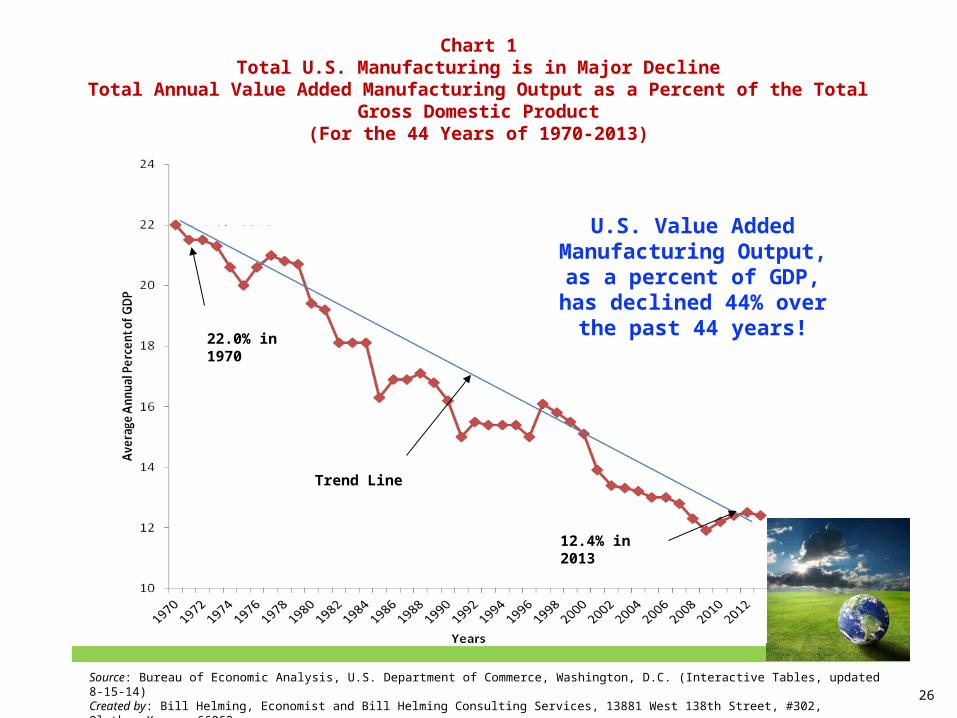
Chart 1Total U.S. Manufacturing is in Major Decline
Total Annual Value Added Manufacturing Output as a Percent of the Total Gross Domestic Product
(For the 44 Years of 1970-2013)
26
U.S. Value Added Manufacturing Output, as a
percent of GDP, has declined 44% over the past
44 years!
12.4% in 2013
22.0% in 1970
Trend Line
Source: Bureau of Economic Analysis, U.S. Department of Commerce, Washington, D.C. (Interactive Tables, updated 8-15-14)Created by: Bill Helming, Economist and Bill Helming Consulting Services, 13881 West 138th Street, #302, Olathe, Kansas 66062
U.S. Manufacturing Jobs are in Major Decline
Based on the U.S. Department of labor data, Chart 2 shows the number of people employed annually within the U.S. manufacturing industries over the past 44 years (1970-2013). Chart 2 shows the total number of men and women employed in the U.S. manufacturing industries was 17.8 million in 1970 and 12.0 million people in 2013. This represents a loss of 5.8 million manufacturing jobs over the past 44 years – a decline of 33%. Total U.S. manufacturing jobs have been in a major decline over the past 44 years. This very negative trend needs to be reversed.
27
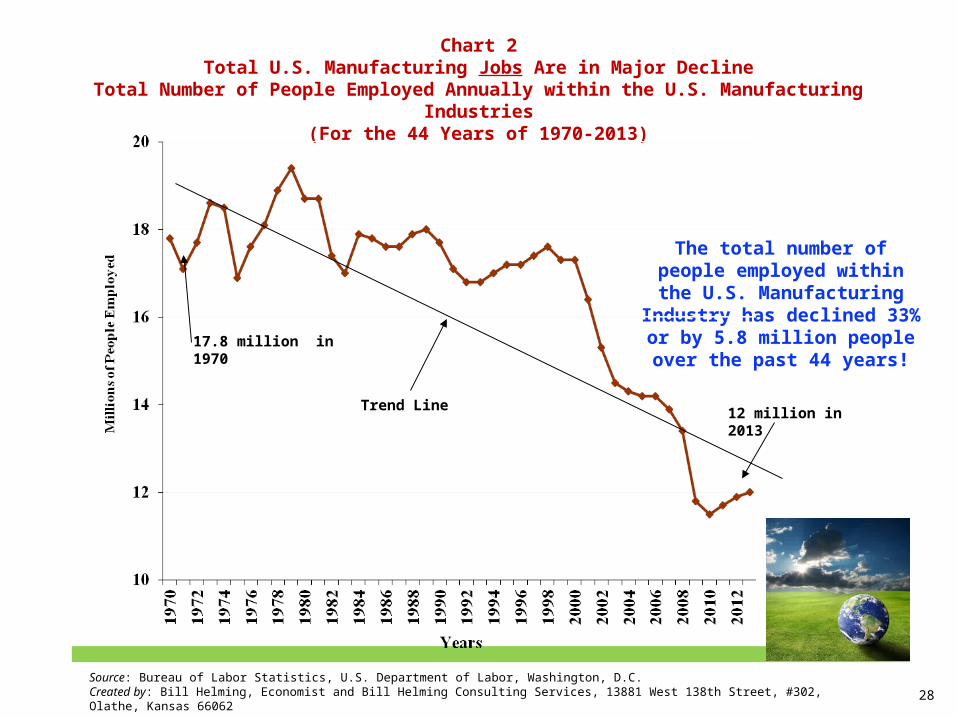
Chart 2Total U.S. Manufacturing Jobs Are in Major Decline
Total Number of People Employed Annually within the U.S. Manufacturing Industries(For the 44 Years of 1970-2013)
28
The total number of people employed within the U.S.
Manufacturing Industry has declined 33% or by 5.8 million people over the past 44 years!
Source: Bureau of Labor Statistics, U.S. Department of Labor, Washington, D.C. Created by: Bill Helming, Economist and Bill Helming Consulting Services, 13881 West 138th Street, #302, Olathe, Kansas 66062
12 million in 2013
17.8 million in 1970
Trend Line

U.S. Federal Government Debt and Spending is Out of
Control
29
30
On January 1, 2001, the U.S. Federal Government’s gross national debt was $5.662 trillion. On December 31, 2008, the gross national debt was $10.700 trillion. This is an increase of $5.038 trillion or 89% in eight years or over the 96 months of George W. Bush’s term in office ($53 billion per month).
On January 1, 2009, the U.S. Federal Government’s gross national debt was $10.700 trillion. On October 1, 2014, the gross national debt was $17.730 trillion. This is an increase of $7.030 trillion or 66% in just five years, during the 68.5 months of Barak Obama’s term in office ($103 billion per month).
These numbers represent an average increase in our country’s gross
national debt of $103 billion per month or essentially double the rate of
debt accumulation in George W. Bush’s administration. President
Obama still has two years and three months (27 more
months) to go before we have a new U.S. president in
January of 2017.

It took 206 years (from 1776 to 1981) for the U.S. to accumulate its first $1.029 trillion of gross national debt (from George Washington’s first term to Ronald Reagan’s first year as president).
From January 1 of 1981 through December 31 of 2000 (period of 20 years), the federal government’s gross national debt increased to $5.662 trillion, an increase of $4.633 trillion or 550% in 20 years.
These numbers represent an average increase of $19 billion per month in our gross national debt over a 240-month period of time (20 years)!
Our gross debt has dramatically increased and gotten completely out of control during George W. Bush’sand Barack Obama’s years in office.
31
The U.S. economy will be going back into a serious economic recession within the 2015-2021 time period. This will reduce federal government tax revenues and increase annual federal government budget deficits.
Congress and the White House will not get serious about reducing federal government spending anytime soon.
U.S. market driven interest rates will be going up over the next 10 years. This will cause budget deficits to increase by $500 to $800 billion per year based on rising interest rates alone. This will result in the national debt increasing faster and further in the years ahead.
Government spending on entitlement programs will sharply increase over the next 20 years, starting by at least 2018, as a result of the increase in payments for Social Security,Medicare and Medicaid moving forward. These cakes arealready baked.
There are at Least Four Major Factors and Reasons Why our Federal Government’s National Debt will Increase Substantially
Further Within the 2017-2025 time period.
32

Major U.S. and Global Asset and Financial Bubbles that Are Going to Burst in a Big Way Within the Next Three to
FiveYears
The U.S. Dow index will end up crashing to the 3,500 to 5,500 range, representing close to a 12,000 point or 72% decline in the Dow and a major loss of equity and wealth.
The $1.1 trillion student loan bubble will burst. Student loan delinquencies continue to increase and this reality will get worse.
The U.S. single family home subprime bubble will head south again.
33

Major U.S. and Global Asset and Financial Bubbles that Are Going to Burst in a Big Way Within the Next Several
Years
The U.S. auto industry has sold lots of cars lately as a result of subprime financing. This will become another bubble that will burst.
Corn Belt farmland values represent a major asset and financial bubble today. This bubble will burst. Farmland values in the Corn Belt will end up declining 35% to 50% because of declines in corn and soybean prices from record crop production numbers and substantial increases in corn and
soybean ending stocks numbers.
34

Other Critical and Very Important U.S. Negative Realities and Trends and Some Real Positive Opportunities and
Trends in the U.S. The U.S. and President Obama’s foreign policies stink. Many
serious foreign policy mistakes have been made and continue to be made by Obama. He has clearly failed to provide the badly needed U.S. foreign policy leadership. There are a good many people and groups (like ISIS) who want to do harm to the U.S. and our allies. We must have very strong, bold and strategic thinking and leadership from the White House. Obama has clearly shown and demonstrated zero leadership and forward thinking regarding our foreign policy.
For the past six years we have not had a secure southern border. This must be changed and soon or it will continue to
have a negative impact on our economy on many
fronts.
35

Other Critical and Very Important U.S. Negative Realities and Trends and Some Real Positive Opportunities and
Trends in the U.S. Our federal government is stifling and choking off improved
economic growth, business investment, new job creation and business risk taking due to excessive and negative government regulations.
Our U.S. federal tax code needs to be completely reformed and replaced. This would greatly help our economy and encourage new job creation. This requires strong and capable presidential and Congressional leadership which unfortunately, we do not have today.
The U.S. is now on a solid path to becoming crude oil energy independent within the next five to seven years. This is very
positive for the U.S. economy and for job creation.Again, we will need strong presidential leadershipto optimize federally owned lands crude oil exploration and production. This obviously won’t happen under Obama’s leadership.
36

Other Critical and Very Important U.S. Negative Realities and Trends and Some Real Positive Opportunities and
Trends in the U.S.
Another great opportunity for the U.S. economy and new job creation for America is our continued leadership and unmatched expertise in developing many new technologies. We are clearly the world’s leader in developing, using and merchandising many different and new technologies. We must continue to encourage and develop these technologies on many fronts. Again, this requires very good and determined presidential and Congressional leadership that we do not have today.
37
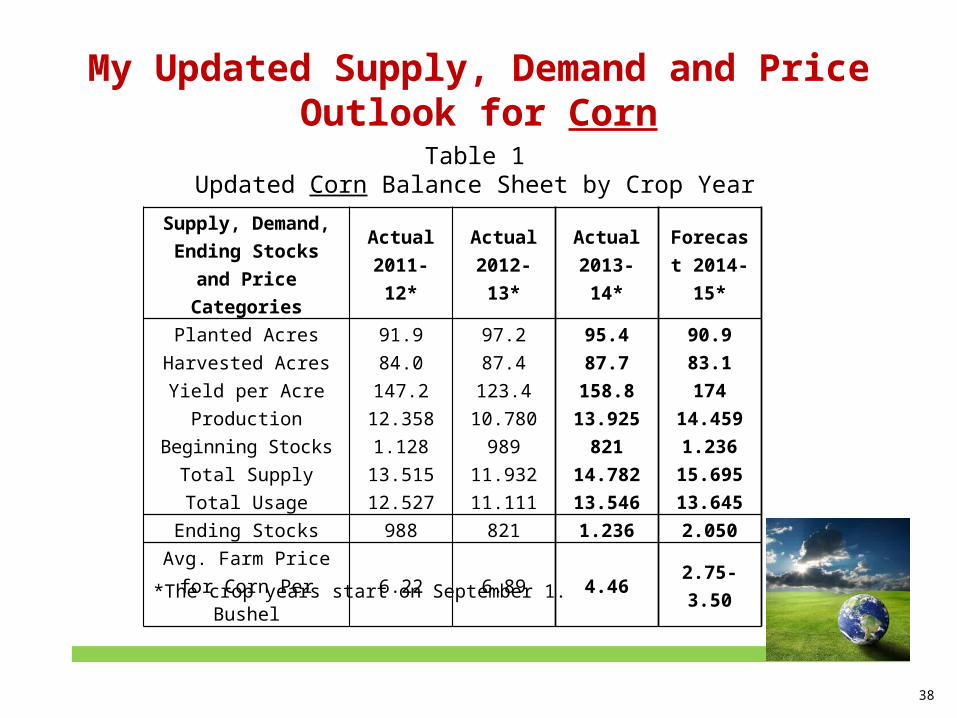
My Updated Supply, Demand and Price Outlook for Corn
38
Supply, Demand, Ending Stocks and Price Categories
Actual 2011-12*
Actual 2012-13*
Actual2013-14*
Forecast 2014-15*
Planted Acres 91.9 97.2 95.4 90.9
Harvested Acres 84.0 87.4 87.7 83.1
Yield per Acre 147.2 123.4 158.8 174
Production 12.358 10.780 13.925 14.459
Beginning Stocks 1.128 989 821 1.236
Total Supply 13.515 11.932 14.782 15.695
Total Usage 12.527 11.111 13.546 13.645
Ending Stocks 988 821 1.236 2.050
Avg. Farm Price for Corn Per Bushel
6.22 6.89 4.46 2.75-3.50
Table 1Updated Corn Balance Sheet by Crop Year
*The crop years start on September 1.

Total Real World Corn Costs Per Acre and the Breakeven Price for Central Illinois Based on an
Average Corn Yield of 174 Bushels Per Acre
39
Total Costs Per Acre1. Direct Costs $ 4022. Power Costs 1363. Overhead Costs 62
Subtotal 6004. Cash Rent Cost 235
Total Cost $ 835
Total Cost = $835 = $4.80 Breakeven Price Average Yield = 174
Breakeven Price Per Bushel = $ 4.80Actual Price Per Bushel = 3.20Loss Per Bushel in 2014-2015 crop year = $ 1.60
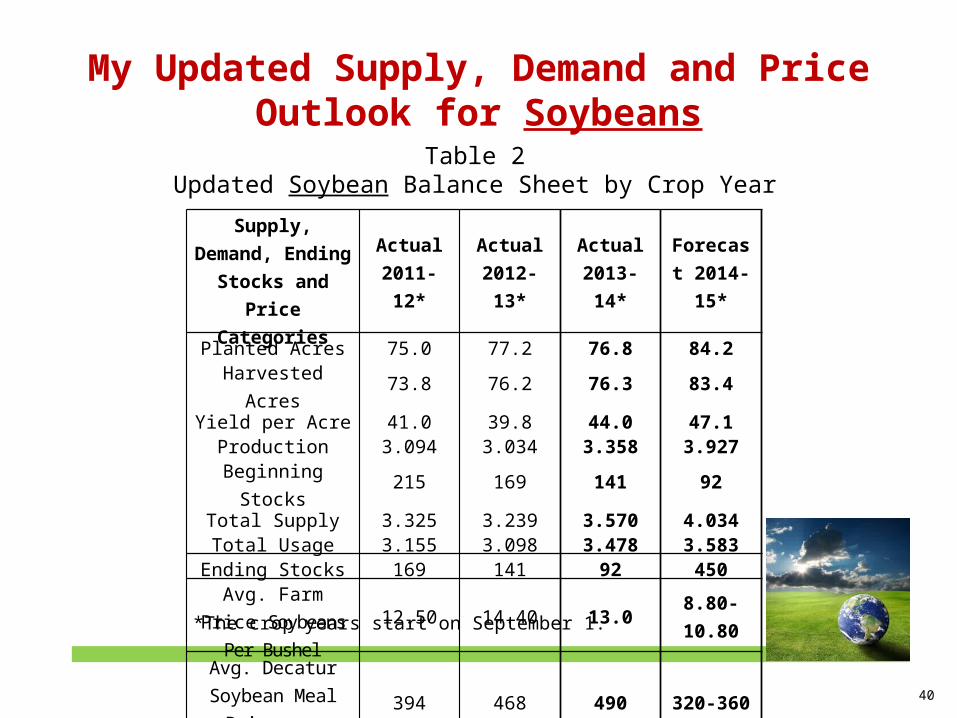
My Updated Supply, Demand and Price Outlook for Soybeans
40
Table 2Updated Soybean Balance Sheet by Crop Year
*The crop years start on September 1.
Supply, Demand, Ending Stocks and Price Categories
Actual 2011-12*
Actual 2012-13*
Actual2013-14*
Forecast 2014-15*
Planted Acres 75.0 77.2 76.8 84.2Harvested Acres 73.8 76.2 76.3 83.4Yield per Acre 41.0 39.8 44.0 47.1
Production 3.094 3.034 3.358 3.927Beginning Stocks 215 169 141 92
Total Supply 3.325 3.239 3.570 4.034Total Usage 3.155 3.098 3.478 3.583
Ending Stocks 169 141 92 450Avg. Farm Price Soybeans Per Bushel
12.50 14.40 13.0 8.80-10.80
Avg. Decatur Soybean Meal Price
per Bushel394 468 490 320-360

My Updated Supply, Demand and Price Outlook for Wheat
41
Table 3Updated Wheat Balance Sheet by Crop Year
*The crop years start on June 1.
Supply, Demand, Ending Stocks and Price Categories
Actual 2011-12*
Actual 2012-13*
Forecast 2013-14*
Forecast 2014-15*
Planted Acres 54.4 55.7 56.2 56.8Harvested Acres 45.7 48.9 45.3 46.5Yield per Acre 43.7 46.3 47.1 43.8
Production 1.999 2.266 2.135 2.035Beginning Stocks 862 743 718 590
Total Supply 2.974 3.131 3.021 2.795Total Usage 2.231 2.414 2.432 2.141
Ending Stocks 743 718 590 645Avg. Farm Price for Wheat
Per Bushel7.24 7.77 6.87 5.45-6.10

Only God knows what the weather and crop growing conditions for corn, soybeans and wheat will be in the next three years. The odds are high for relatively large corn, soybean and wheat production numbers and for even lower corn, soybean and wheat prices. These trends will have a major and negative impact on corn, soybean and wheat farmer working capital, net worth and borrowing capacity for the next several years.
Based on the USDA and Federal Reserve Bank’s estimates, 82% to 83% of the average U.S. farmer and rancher enterprise equity and net worth is tied up in their land and real estate holdings. When average Corn Belt farmland values decline 35% to 50% in the next several years, which they will, the net worth and equity position of farmers and livestock producers will decline substantially. Farmers and lenders should prepare now. Those who want to sell, should sell farmland now. Those who want to buy, should be patient for three to five years.
42

Very Important Trends and Facts Regarding U.S. Beef Cow Inventory Numbers and Per
Capita Consumption and Market Share Numbers and Trends for Beef, Chicken and
Competing Proteins
43

44
25
28
31
34
37
40
43
461970
1973
1976
1979
1982
1985
1988
1991
1994
1997
2000
2003
2006
2009
Mil
lion
s of
Hea
d
Years
1970 = 36.7 million head
2014 = 29.0 million head
1975 = 45.7 million head
Source: USDA, Economic Research Service.
A decline of 16.7 million beef cows from 1975 through 2014. This represents a
decline of 37% in 39 years.
Chart 1Annual U.S. Beef Cow Numbers As of
January 1st for the 45 Years of 1970-2014

45
Chart 2The Annual U.S. Per Capita Consumption of Beef and
All Chicken over the 44 Years of 1970-2013
1970
1972
1974
1976
1978
1980
1982
1984
1986
1988
1990
1992
1994
1996
1998
2000
2002
2004
2006
2008
2010
2012
35
45
55
65
75
85
95
Po
un
ds
Pe
r C
ap
ita
Per Capita Chicken Consumption Increased 99% from 1976 through 2013 (38 years) and increased by
41.6 pounds per person 2013 = 83.7
1970 = 84.6
1976 = 94.4
2013 = 56.5
1970 = 40.3
1976 = 42.1
1992
Per Capita Beef Consumption Declined 40% from 1976 through 2013 (38 years) and decreased by
37.9 pounds per person
46
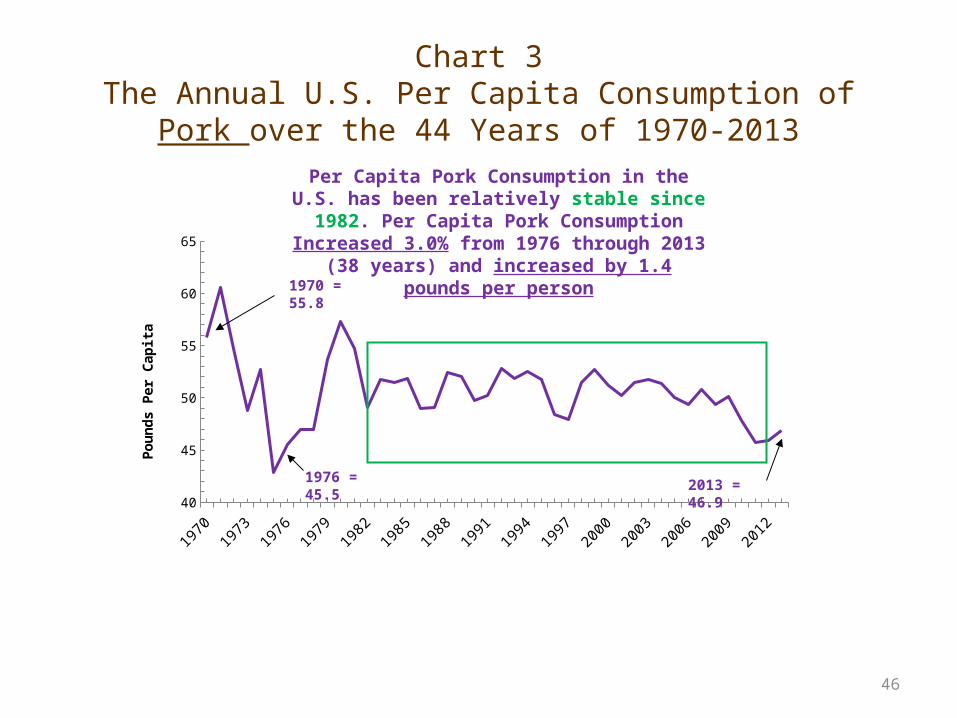
Chart 3The Annual U.S. Per Capita Consumption of Pork over
the 44 Years of 1970-2013
1970
1972
1974
1976
1978
1980
1982
1984
1986
1988
1990
1992
1994
1996
1998
2000
2002
2004
2006
2008
2010
2012
40
45
50
55
60
65
Po
un
ds
Pe
r C
ap
ita
Per Capita Pork Consumption in the U.S. has been relatively stable since 1982. Per Capita Pork Consumption Increased 3.0% from 1976 through 2013 (38 years) and increased by 1.4
pounds per person
2013 = 46.9
1970 = 55.8
1976 = 45.5
47
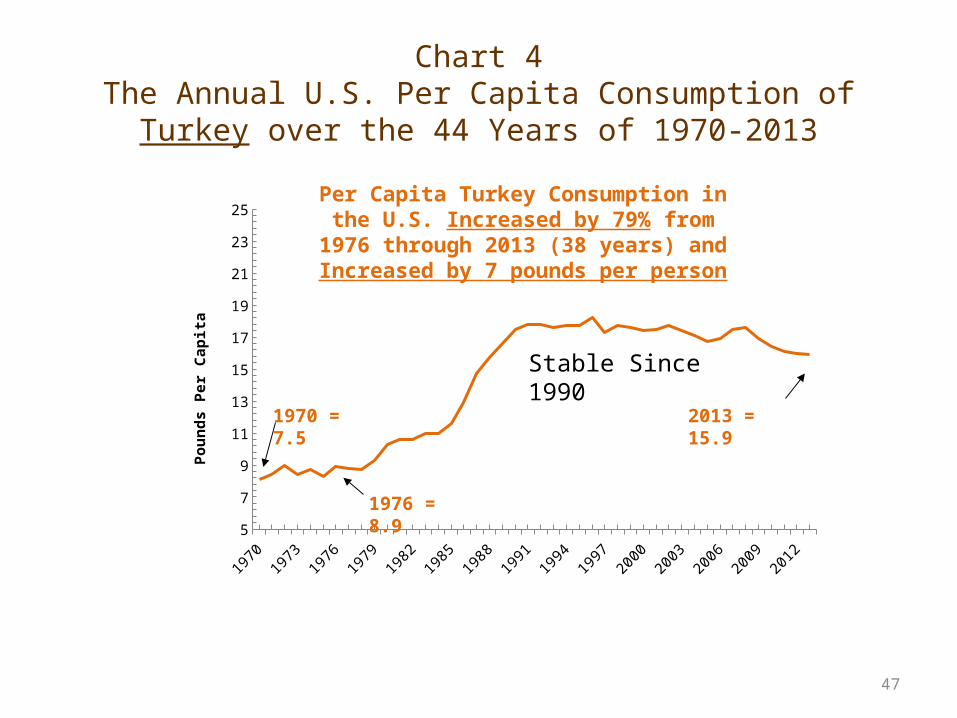
Chart 4The Annual U.S. Per Capita Consumption of Turkey
over the 44 Years of 1970-2013
1970
1972
1974
1976
1978
1980
1982
1984
1986
1988
1990
1992
1994
1996
1998
2000
2002
2004
2006
2008
2010
2012
5
7
9
11
13
15
17
19
21
23
25P
ou
nd
s P
er C
apit
a
1970 = 7.5
1976 = 8.9
2013 = 15.9
Per Capita Turkey Consumption in the U.S. Increased by 79% from 1976 through
2013 (38 years) and Increased by 7 pounds per person
Stable Since 1990

48
Chart 5The Annual U.S. Per Capita Consumption of Combined
Commercial Fish and Shell Fish over the 44 Years of 1970-2013
10
11
12
13
14
15
16
17
Po
un
ds
Pe
r C
ap
ita
Per Capita Fish and Shell Fish Consumption in the U.S. has been relatively stable since 1988. Per Capita Fish and Shell Fish consumption Increased 13% from 1976
through 2013 (38 years) and increased by 1.70 pounds per person
1970 = 11.8
2013 = 14.6
1976 = 12.9

49
Table 1The Per Capita Consumption Market Share Percentages for All Chicken,
Turkey, Beef, Pork and For Combined Commercial Fish and Shell Fish for the Year 1976
The Major Protein CategoriesThe Annual Per Capita Consumption Numbers
for 1976
The Market Share Percentage Numbers
for 1976
1. All Chicken 42.1 20.7
2. Turkey 8.9 4.3
3. Beef 94.4 46.4
4. Pork 45.5 22.3
5. Commercial Fish and Shell Fish
12.9 6.3
Total 203.8 100.0
50
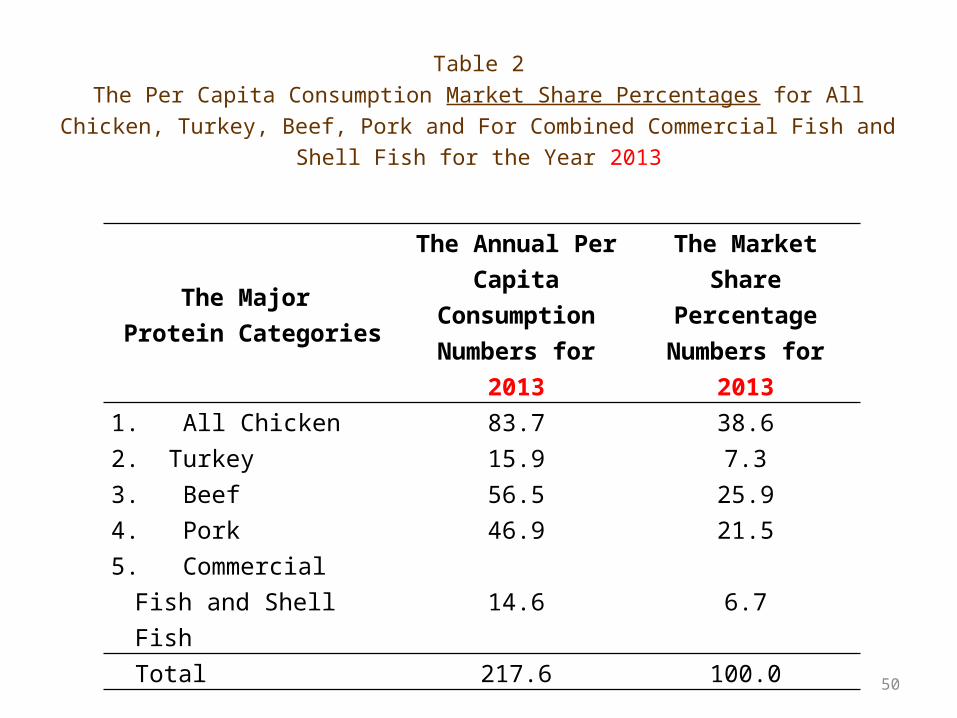
Table 2The Per Capita Consumption Market Share Percentages for All Chicken, Turkey, Beef, Pork and For Combined Commercial Fish and Shell Fish for
the Year 2013
The Major Protein Categories
The Annual Per Capita Consumption
Numbers for 2013
The Market Share Percentage Numbers
for 20131. All Chicken 83.7 38.62. Turkey 15.9 7.33. Beef 56.5 25.94. Pork 46.9 21.55. Commercial Fish and
Shell Fish14.6 6.7
Total 217.6 100.0
51
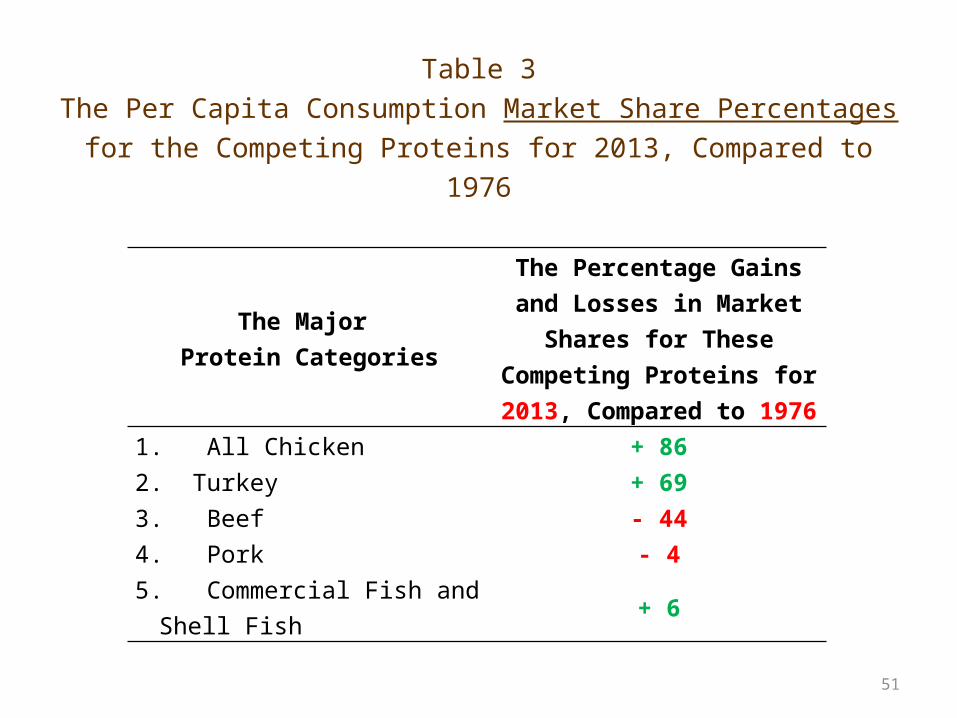
Table 3The Per Capita Consumption Market Share Percentages for the Competing Proteins for 2013, Compared to 1976
The Major Protein Categories
The Percentage Gains and Losses in Market Shares for
These Competing Proteins for 2013, Compared to 1976
1. All Chicken + 862. Turkey + 693. Beef - 444. Pork - 45. Commercial Fish and Shell Fish + 6
52
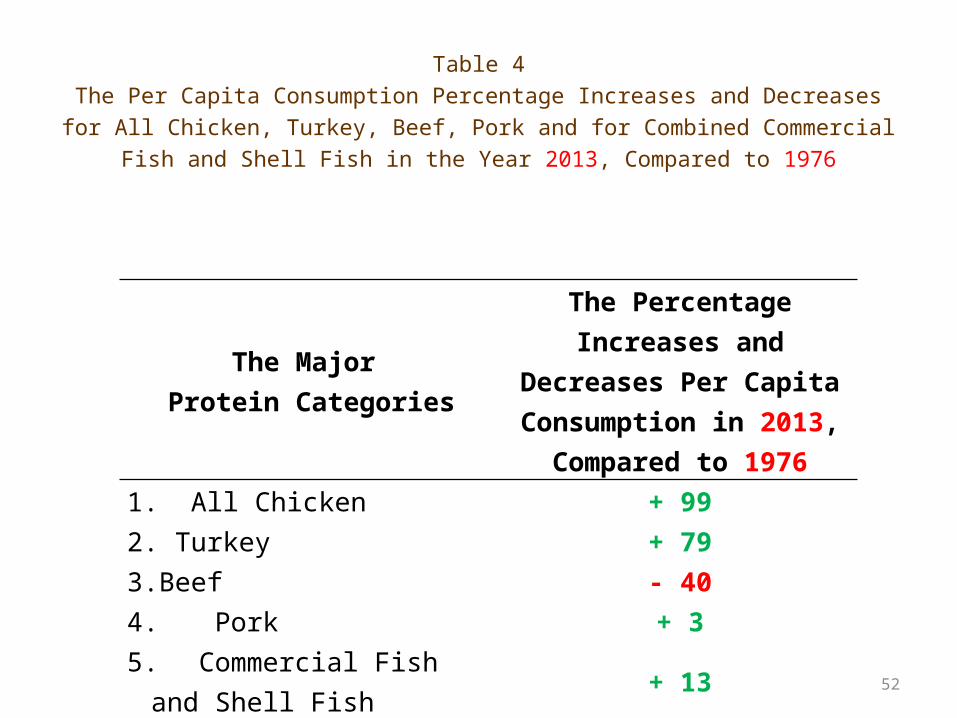
Table 4The Per Capita Consumption Percentage Increases and Decreases for All Chicken, Turkey, Beef, Pork and for Combined Commercial
Fish and Shell Fish in the Year 2013, Compared to 1976
The Major Protein Categories
The Percentage Increases and Decreases Per Capita Consumption in 2013,
Compared to 19761. All Chicken + 992. Turkey + 793. Beef - 404. Pork + 35. Commercial Fish and Shell Fish + 13

Exhibit 1Actual and Estimated Percentage of the Total Pounds of U.S.
Beef Consumption that Consists of Ground Beef (Hamburger) Over Time
(1970-2040)
4245
4952
5760*
65*
70*
42
47
52
57
62
67
1970 1980 1990 2000 2010 2020 2030 2040
Per
cent
of
Tot
al
53
Source: Based on UDSA annual cattle slaughter mix and per capita consumption data for at home and away from home consumption.*Estimated by Bill Helming.
Estimated *
Actual
2013

Exhibit 2Actual and Estimated Percentage of the Total Pounds of U.S. Beef Consumption that Consists of Non-Ground Beef (Whole
Muscle Beef, Including Middle Meats)(1970-2040)
5855
5148
4340*
35*30*30
35404550556065
Per
cent
of
Tot
al
54
Source: Based on UDSA annual cattle slaughter mix and per capita consumption data for at home and away from home consumption.*Estimated by Bill Helming.
Estimated*
Actual
2013
Simply Follow the Money
55
► Consumers in the U.S. have many protein choices. The protein purchases that Americans are making are primarily driven by price and affordability or the lack thereof. This has been true since 1970 and for the past 45 years.
► This is why U.S. consumers have been buying and consuming more and more ground beef (hamburger) and why they have been choosing and consuming more and more chicken for their protein needs since 1970.
► The probability of these key U.S. and Canadian consumer protein buying and consumption trends continuing for at least the next 30 years is 100%.

56
Where Does The Very Large Supply of Ground Beef (Hamburger) that is Consumed in the U.S.
Presently Come From?
Cull beef and dairy cows and bulls
25%
Imported beef
trimmings15%
Grain and full fed steer
and heifermarketings out of U.S. Feedlots
60%
Source: Based on private beef industry data and the USDA, Economic Research Service.
57
Both U.S. and Canadian Beef Producers and Cattle Feeders Have Been and Remain Committed to
Going Down Only One Super Interstate Highway
The Broken One Size Fits All North American Business Model
Full fed cattle only. One size fits all and a one trick
pony. High input costs. Ground beef consumption and
demand is going up. Middle meat (steaks)
consumption and demand is going down.
Total per capita beef consumption and domestic beef demand and market share are declining.

58
Where Will The Very Large Supply of Ground Beef (Hamburger) that is Consumed in the U.S.
Come From in the Years Ahead?
Cull beef and dairy cows and
bulls25%
Imported beef trimmings
15%
Grain and full fed steer and
heifer marketings out of U.S. Feedlots
20%
Source: Based on private beef industry data and the USDA, Economic Research Service.
Grass and forage fed steers
and heifers40%

Questions and Answers
God Bless You and
Keep Smiling
59