EMAP seminar FennessyV2.ppt | US EPA ARCHIVE DOCUMENT
36
Transcript of EMAP seminar FennessyV2.ppt | US EPA ARCHIVE DOCUMENT


Siobhan FennessyKenyon College
Assessing the Ecological Condition of Wetlands on a Watershed Basis using a Rapid Method:
The Cuyahoga River as a Case Study

Wetlands in the US
To date, nearly 55% of wetlands in the U.S. have disappeared (Dahl 1990)90% loss in Ohio Results in loss of ecosystem services that wetlands provide

Stressor Gradient
Ecol
ogic
al In
tegr
ity Ultimate Goal: to protect ecological integrity
low
high
low high
(e.g., land-use or other human activity gradients)
How do Ecosystems Respondto Disturbance?

Tiered Assessment Methods
Comprehensive Assessment- level 3– Reference based– Data collection averages 4 hours for 4 people– Index of Biotic Integrity
Rapid Assessment- level 2– Data collection averages 1-2 hours for 1-2 people– Calibrated to Comprehensive Assessment– Combines stressor and condition metrics– Ohio Rapid Assessment Method
Landscape Assessment- level 1– GIS analysis– Calibrated with comprehensive assessment
Leve
l of E
ffor
t
Level of Detailed Inform
ation

Application on a watershed scale: the Cuyahoga River Basin

The Cuyahoga River Basin• 815 square miles• 3% of state land area, houses 16% of population • Designated a Great Lakes Area of Concern due to legacy of industrial pollution

The Cuyahoga River fires: catalyst for environmental protection

Current Issues: urbanization
Courtesy Cuyahoga River RAP Committee

Study design: selecting sites for assessment
Define the sample frameWetlands mapped by the Ohio Wetland Inventory
– 5 classes
EMAP study designSample points selected using “GRTS” designProvides a spatially balanced sample with ordered points
All 3 levels of assessment employed

•1600 points generated for whole watershed
• Goal to sample 200
• 366 sites sampled
• of these, 243 wetlands
Randomized Sample Points

Site Access and Sampling- what did we do?


Overview of ORAM metrics
Size ofhydrogeomorphic
unit
Physical habitat
Plant communitycharacteristics
Special features(endangered spp.
etc.)
Buffer andsurrounding
land use
Hydrology
Total Score
0 906530 50
Condition Category 1
ConditionCategory 2
ConditionCategory 3Low 2

Comprehensive Sampling
At 10% of sites: – Vegetation IBI– Amphibian IBI
At all sites:– Soils, standard chemical
and enzymatic analysis

The site view…


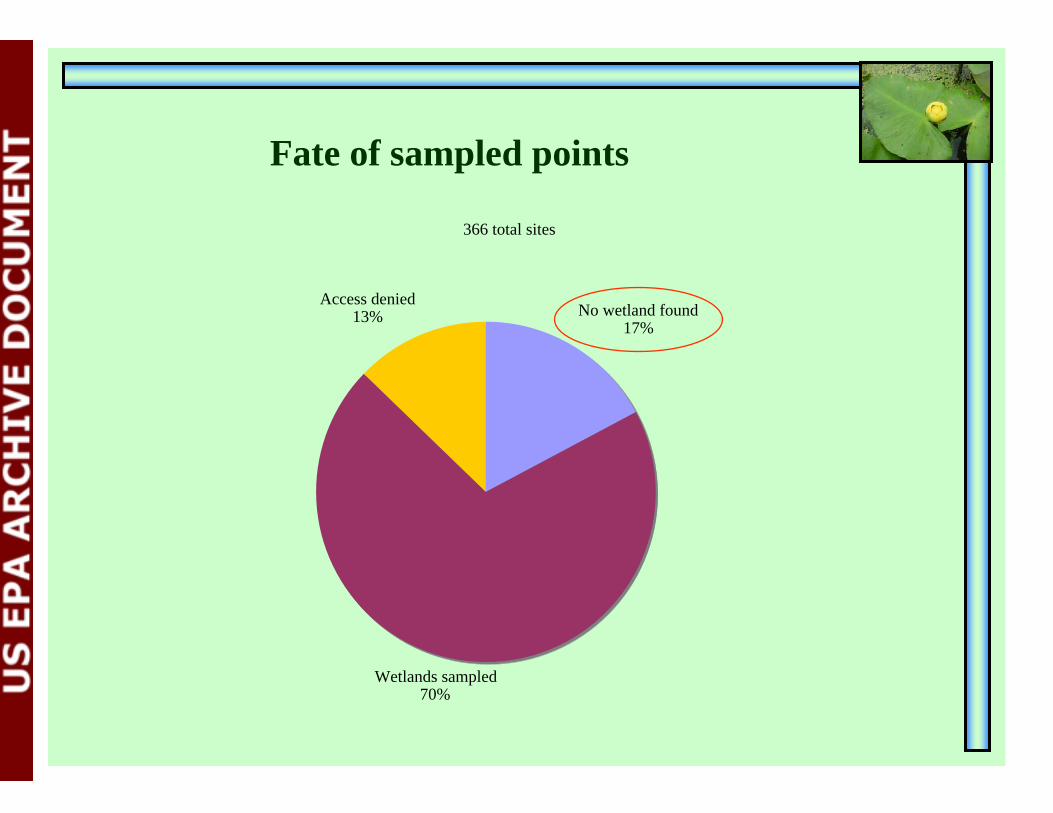
366 total sites
No wetland found17%
Wetlands sampled70%
Access denied13%
Fate of sampled points

0.0
10.0
20.0
30.0
40.0
50.0
60.0
70.0
80.0
90.0
0 25 50 75 100 125 150 175 200 225 250 275 300 325 350 375
Ordered distribution of scores for all sites sampled
Rap
id A
sses
smen
t Sco
rePreliminary Project Results

Urbanization and wetland conversion…

Diversity of wetland types
Depressional37%
Impoundment7%
Riverine37%
Slope14%
Fringing4%
Bog1%
N = 243

Impaired16%
Meets34%
Superior50%
Geauga County Wetland condition
67 wetlands
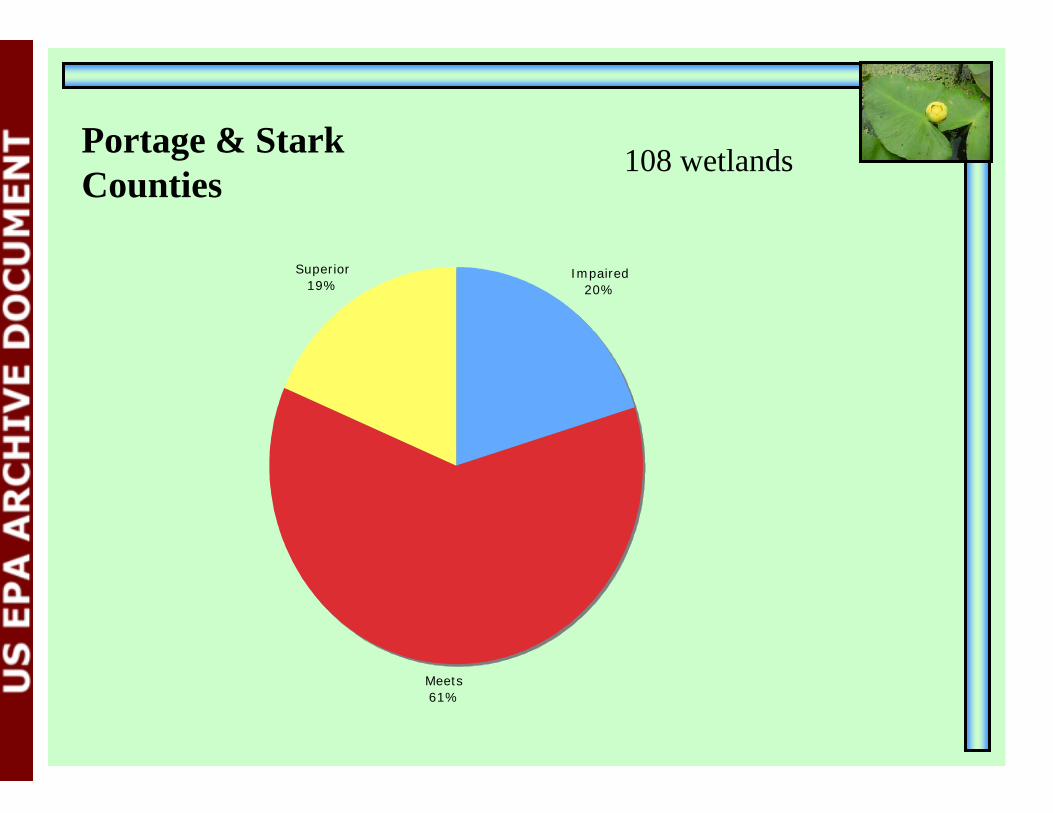
Impaired20%
Meets61%
Superior19%
Portage & Stark Counties
108 wetlands

Impaired25%
Meets67%
Superior8%
Cuyahoga and Medina Counties 12 wetlands

Total acres per condition category
298.5
1289.3
1985.9
Impaired GoodSuperior

Mean wetland size per condition category
1.2
5.2
8.01
0
1
2
3
4
5
6
7
8
9
Impaired Good Superior
Wetland condition categories
ha

100 m
250 m
500 m
1000 m
2000 m
4000 m
Landscape Analysis- multiple scales of influence

Landscape Development Index (LDI)
LDI = Σ (%LUi * LDIi)*100
where %LUi = percent of area under land use iand LDIi = LDI coefficient for land use i
LDI coefficientsNatural areas = 0 Pasture = 1.08Row Crops = 3.25 Urban = 4.65Suburban = 4.04

Variance explained in ORAM scores by LDI scores.
0
2
4
6
8
10
12
14
100 250 500 1000 2000 4000
*
*
**
0
5
10
15
20
25
30
35
40
45
50
100 250 500 1000 2000 4000
*
*
0
2
4
6
8
10
12
14
16
18
100 250 500 1000 2000 4000
*
**
*
0
5
10
15
20
25
30
35
40
100 250 500 1000 2000 4000
* * *
*
*
Var
ianc
e ex
plai
ned
(r2)
Buffer Distances (m)
Depressional Impoundments
Riverine Slope
Diemeke et al. in prep

Nutrient Retention in Watershed
101,000 tP-sorptionCapacity
114,000 tTC
8,090 tTN
1,500 tTP
1180 HaArea
Total Population
sampled
The annual P load to Lake Erie is 17,500 t, the TP held in 198 wetlands sampled account for 10% of this annual load
The P-sorption capacity of wetlands sampled accounts for 5 times the annual load of P to Lake Erie

Average ORAM =55
All Wetlands
Average ORAM =43
Agricultural Average ORAM =57
Natural
Landscape development in100 m buffer
Average ORAM =57
Size < 12 acres
Average ORAM =40
Size > 1 acre
Average ORAM =29
Size < 1 acre
Average ORAM =67
Size > 12 acres
Size Size
In sum: what factors most affect wetland condition?
Diemeke et al. in prep

Conclusions
Historically, our preoccupation with the quantity of wetlands has led us to overlook a loss of quality
Preservation and restoration efforts require information on current environmental condition
Preservation and restoration must take into account the landscape setting of the wetland

Thanks to so many people!
•U.S. Environmental Protection Agency for funding andtechnical help
Mary Kentula, Tony Olsen
•Kenyon CollegePat Heithaus and students
•Ohio EPAJohn Mack, Mick Micacchion
•Cuyahoga Remedial Action Plan committeeJim White, Marie Sullivan