Electroreception in the obligate freshwater stingray ...
12
Electroreception in the obligate freshwater stingray, Potamotrygon motoro Lindsay L. Harris A , Christine N. Bedore B and Stephen M. Kajiura A,C A Department of Biological Sciences, Florida Atlantic University, 777 Glades Road, Boca Raton, FL 33431, USA. B Biology Department, Duke University, Durham, NC 27708, USA. C Corresponding author. Email: [email protected] Abstract. Elasmobranch fishes use electroreception to detect electric fields in the environment, particularly minute bioelectric fields of potential prey. A single family of obligate freshwater stingrays, Potamotrygonidae, endemic to the Amazon River, demonstrates morphological adaptations of their electrosensory system due to characteristics of a high impedance freshwater environment. Little work has investigated whether the reduced morphology translates to reduced sensitivity because of the electrical properties of freshwater, or because of a marine-tuned sensory system attempting to function in freshwater. The objective of the present study was to measure electric potential from prey of Potamotrygon motoro and replicate the measurements in a behavioural assay to quantify P. motoro electrosensitivity. Median orientation distance to prey-simulating electric fields was 2.73 cm, and the median voltage gradient detected was 0.20 mV cm 1 . This sensitivity is greatly reduced compared with marine batoids. A euryhaline species with marine-type ampullary morphology was previously tested in freshwater and demonstrated reduced sensitivity compared with when it was tested in seawater (0.2 mV cm 1 v. 0.6 nV cm 1 ). When the data were adjusted with a modified ideal dipole equation, sensitivity was comparable to P. motoro. This suggests that the conductivity of the medium, more so than ampullary morphology, dictates the sensitivity of elasmobranch electroreception. Additional keywords: batoid, bioelectric fields, conductivity, passive electrosense. Received 9 November 2014, accepted 17 January 2015, published online 9 April 2015 Introduction Aquatic predators rely on a suite of sensory modalities to suc- cessfully detect and localise their prey. The physical properties of the aquatic medium dictate how stimuli are transmitted. For example, salinity directly correlates with conductivity and, thus, has a profound effect on the propagation of bioelectric fields. Aquatic organisms produce an electric potential because of differences in ion concentration between their tissues and the external environment. Although the skin is relatively imperme- able to ions, ion leakage occurs across mucus membranes in the mouth, gills and cloaca (Kalmijn 1972, 1974). Ventilatory activity modulates the electric potential, which provides spatial and temporal information about the source of the stimulus. Marine elasmobranchs can detect bioelectric fields at magni- tudes as small as a billionth of a volt per centimetre (Kajiura and Holland 2002). This sensitivity is especially advantageous for the detection of cryptic prey buried in the substrate or in environ- ments in which other sensory systems are hindered, such as turbid waters. Most studies of passive electroreception are limited to marine elasmobranchs, despite the widespread presence of eury- haline and stenohaline species (McGowan and Kajiura 2009). Stingrays within the family Potamotrygonidae are the only true stenohaline freshwater elasmobranchs and they are endemic to the Amazon River basin (Lovejoy et al. 2006). The potamo- trygonid stingrays demonstrate a suite of morphological and physiological adaptations to a freshwater existence, including thickening of the dermis to aid in osmoregulation by providing a barrier to ion leakage (Szabo et al. 1972). The thickened skin concomitantly forms a high-resistance electrical barrier between the internal environment of the stingray’s tissues and the external freshwater environment (Szabo et al. 1972). As a result, the electrosensory ampullary tubules need only be trans- cutaneous to detect environmental electric stimuli. In contrast to their marine relatives, the potamotrygonid stingrays possess microscopic electrosensory pores and short canals that lead to single ampullae embedded in the dermis (Szabo et al. 1972; Szamier and Bennett 1980). Collectively, high skin resistance and small, superficial ampullary organs possibly maintain functionality of the electrosensory system (Szabo et al. 1972). Previous studies have suggested that Potamotrygon spp. dem- onstrate reduced sensitivity to bioelectric fields compared with their marine counterparts (Szabo et al. 1972; Szamier and Bennett 1980). Although this early research confirmed the presence of the electrosensory system in a freshwater elasmo- branch, its importance in an ecological context was not well documented. CSIRO PUBLISHING Marine and Freshwater Research, 2015, 66, 1027–1036 http://dx.doi.org/10.1071/MF14354 Journal compilation Ó CSIRO 2015 www.publish.csiro.au/journals/mfr
Transcript of Electroreception in the obligate freshwater stingray ...
Electroreception in the obligate freshwater stingray,Potamotrygon motoro
Lindsay L. HarrisA, Christine N. BedoreB and Stephen M. KajiuraA,C
ADepartment of Biological Sciences, Florida Atlantic University, 777 Glades Road,
Boca Raton, FL 33431, USA.BBiology Department, Duke University, Durham, NC 27708, USA.CCorresponding author. Email: [email protected]
Abstract. Elasmobranch fishes use electroreception to detect electric fields in the environment, particularly minutebioelectric fields of potential prey. A single family of obligate freshwater stingrays, Potamotrygonidae, endemic to theAmazon River, demonstrates morphological adaptations of their electrosensory system due to characteristics of a high
impedance freshwater environment. Little work has investigated whether the reduced morphology translates to reducedsensitivity because of the electrical properties of freshwater, or because of a marine-tuned sensory system attempting tofunction in freshwater. The objective of the present study was to measure electric potential from prey of Potamotrygon
motoro and replicate themeasurements in a behavioural assay to quantify P. motoro electrosensitivity.Median orientationdistance to prey-simulating electric fields was 2.73 cm, and the median voltage gradient detected was 0.20mV cm�1. Thissensitivity is greatly reduced compared with marine batoids. A euryhaline species with marine-type ampullary
morphology was previously tested in freshwater and demonstrated reduced sensitivity compared with when it was testedin seawater (0.2 mV cm�1 v. 0.6 nV cm�1). When the data were adjusted with a modified ideal dipole equation, sensitivitywas comparable to P. motoro. This suggests that the conductivity of the medium, more so than ampullary morphology,dictates the sensitivity of elasmobranch electroreception.
Additional keywords: batoid, bioelectric fields, conductivity, passive electrosense.
Received 9 November 2014, accepted 17 January 2015, published online 9 April 2015
Introduction
Aquatic predators rely on a suite of sensory modalities to suc-cessfully detect and localise their prey. The physical propertiesof the aquatic medium dictate how stimuli are transmitted. For
example, salinity directly correlates with conductivity and, thus,has a profound effect on the propagation of bioelectric fields.
Aquatic organisms produce an electric potential because of
differences in ion concentration between their tissues and theexternal environment. Although the skin is relatively imperme-able to ions, ion leakage occurs across mucus membranes in themouth, gills and cloaca (Kalmijn 1972, 1974). Ventilatory
activity modulates the electric potential, which provides spatialand temporal information about the source of the stimulus.
Marine elasmobranchs can detect bioelectric fields at magni-
tudes as small as a billionth of a volt per centimetre (Kajiura andHolland 2002). This sensitivity is especially advantageous for thedetection of cryptic prey buried in the substrate or in environ-
ments inwhich other sensory systems are hindered, such as turbidwaters. Most studies of passive electroreception are limited tomarine elasmobranchs, despite the widespread presence of eury-
haline and stenohaline species (McGowan and Kajiura 2009).Stingrays within the family Potamotrygonidae are the only
true stenohaline freshwater elasmobranchs and they are endemic
to the Amazon River basin (Lovejoy et al. 2006). The potamo-
trygonid stingrays demonstrate a suite of morphological andphysiological adaptations to a freshwater existence, includingthickening of the dermis to aid in osmoregulation by providing
a barrier to ion leakage (Szabo et al. 1972). The thickenedskin concomitantly forms a high-resistance electrical barrierbetween the internal environment of the stingray’s tissues and
the external freshwater environment (Szabo et al. 1972). As aresult, the electrosensory ampullary tubules need only be trans-cutaneous to detect environmental electric stimuli. In contrast totheir marine relatives, the potamotrygonid stingrays possess
microscopic electrosensory pores and short canals that lead tosingle ampullae embedded in the dermis (Szabo et al. 1972;Szamier and Bennett 1980). Collectively, high skin resistance
and small, superficial ampullary organs possibly maintainfunctionality of the electrosensory system (Szabo et al. 1972).Previous studies have suggested that Potamotrygon spp. dem-
onstrate reduced sensitivity to bioelectric fields compared withtheir marine counterparts (Szabo et al. 1972; Szamier andBennett 1980). Although this early research confirmed the
presence of the electrosensory system in a freshwater elasmo-branch, its importance in an ecological context was not welldocumented.
CSIRO PUBLISHING
Marine and Freshwater Research, 2015, 66, 1027–1036
http://dx.doi.org/10.1071/MF14354
Journal compilation � CSIRO 2015 www.publish.csiro.au/journals/mfr
The goal of the present study was to quantify the functional
capabilities of the electrosensory system of an obligate freshwa-ter stingray that inhabits an electrically resistive medium andpossesses a reduced electrosensory morphology. To achievethis, the objectives were to (1) quantify the electric potential of
the obligate freshwater stingray, Potamotrygon motoroGarman1877, and its teleost prey items, (2) mathematically modelvoltage decay in freshwater, and (3) quantify behavioural
sensitivity of P. motoro to prey-simulating electric fields andcompare this sensitivity to marine sister taxa.
Materials and methods
Voltage and frequency determination
An electrophysiological techniquewas employed to quantify theelectric potentials (i.e. voltage) produced by the obligatefreshwater stingray, P. motoro, its representative teleost prey
items (Almeida et al. 2010) and a bioelectric field generator(BFG). These data were then used to determine an appropriateprey-simulating electric stimulus for use in the subsequent
behavioural assay.
Animal acquisition and maintenance
Six similar-sized individuals each of P. motoro and three
teleost prey species were acquired from local aquarium suppli-ers (Table 1). All fish were housed in temperature-controlledaquaria equipped with mechanical, chemical and biologicalfiltration. Fish were housed in the laboratory for a maximum
of 2 days and were not fed during that time. Electric potentialwas measured at least 12 h after acquisition.
Experimental setup
An acrylic experimental tank (89� 43� 21 cm) containedaerated, de-chlorinated freshwater with water chemistry similarto that of the holding tank (i.e. 25.0� 18C and pH 7� 1). A
100-mm-tip recording electrode was built using an Ag–AgClpellet within a 1.5-mm-diameter glass capillary tube filled with3 M KCl solution (E45P-M15NH, Warner Instruments, Ham-
den, CT, USA). The electrode tip was placed ,1 mm from thetarget location on the body and an identical reference electrodewas placed in the corner of the experimental tank (see Fig. S1,available as Supplementary material for this paper). The output
from the two electrodes was differentially amplified (DP-304,Warner Instruments) at 1000�, filtered (0.1 Hz–0.1 kHz, 60 Hznotch; DP-304, Warner Instruments & Hum Bug, Quest Scien-
tific, North Vancouver, British Columbia, Canada), digitised at
1 kHz by using a Power Laboratory 16/30 model ML 880 (AD
Instruments, Colorado Springs, CO, USA) and recorded usingChart Software (v.5, AD Instruments).
All teleost holding and experimental trials were conductedat Florida Atlantic University’s Harbor Branch Oceanographic
Institute (FAU–HBOI) in Fort Pierce, Florida, USA, or at theFAU Marine Sciences Laboratory in Boca Raton, Florida.Experimental and holding-tank conditions were identical at
each location. Freshwater stingrays were maintained, andvoltage measurements were conducted, at the Florida Fishand Wildlife Conservation Commission (FWC) Non-native
Fish Laboratory in Boca Raton, Florida, or Ornamental FishDistributors (OFD) in Miami, Florida.
Experimental protocol
Each individual teleost (n¼ 6 per species) was lightlyanesthetised with a buffered solution of MS-222 (tricainemethanesulfonate buffered with sodium bicarbonate, WesternChemical Inc., Ferndale, WA, USA; 1 : 10 000–1 : 13 000
weight : vol (100–76.3 mg L�1)), to a level that minimised fullbody movements, but allowed natural ventilation. Fish weresecured with Velcro tape to a vertical acrylic stage, which was
attached to the submerged arm of a linear translation system(Newmark Systems Inc., eTrack-300 and NSC-1S, RanchoSanta Margarita, CA, USA) positioned adjacent to the tank.
The tip of the recording electrode was placed sequentially at thefollowing four locations along the body: mouth, opercularopening, middle of the body between the gill operculum andthe tail (trunk) and the caudal peduncle (tail). The electric
potential of each individual was recorded during three trials atthe above locations along the body, and averaged to quantifymean electric potential for each species. To measure voltage
decay from the mouth, the fish was moved in computer-controlled 1-cm increments away from the recording electrodewith the linear translation system, until the signal was no longer
distinguishable from background electrical noise in the tank.Mass (g) and total length (TL, cm) were recorded for each fish.
For the freshwater stingrays (3 males, 3 females), each
individual was lightly anesthetised (buffered MS-222;1 : 15 000 weight : vol (67 mg L�1)) in the experimental tankas described for the teleosts. Stingrays were secured to a plasticmesh horizontal stage submerged in the tank. Voltage was
recorded at the following four equivalent locations along thebody as described for teleosts: the mouth, first gill slit, middle ofthe body and midway down the tail on the ventral surface. An
additional measurement was taken at the spiracle on the dorsal
Table 1. Morphometrics of study species
DL, disc length; TL, total length
Order Family Species n TL or DL range (cm) Mass range (g)
Siluriformes Loricaridae Hypostomus plecostomus 6 6.3–7.8 (TL) 2.3–4.7
Characiformes Characidae Colossoma bidens 6 6.0–9.0 (TL) 3.1–9.9
Perciformes Cichlidae Astronotus ocellatus 6 6.0–8.0 (TL) 4.9–8.6
Myliobatiformes Potamotrygonidae Potamotrygon motoro (e-fields) 6 10.5–12.5 (DL) 68–113
Potamotrygon motoro (behaviour) 7 12–15 (DL) 112–212
1028 Marine and Freshwater Research L. L. Harris et al.

surface. Mass (g), disc width (cm) and disc length (cm) wererecorded for each stingray. This research was conducted in
accordance with FAU IACUC Protocol #A09-20.
Frequency
In addition to electric potential, ventilatory frequency was
recorded from the location that a predator would most likelydetect an electric stimulus, namely, themouth of the teleosts andthe spiracle of the stingrays. A fast Fourier transform (FFT) was
used to derive the fundamental frequency from the powerspectrum of each species. FFTs were conducted on both bio-electric and background electrical signals. Mean fundamentalfrequency for each species was reported.
Statistical analyses
One-way ANOVA (a¼ 0.05) followed by a Tukey post hoc
test determined significant differences in frequency at themouth
within species, and also among species. These tests also deter-mined significant differences in electric potential across thebody within and among species. Regression analyses tested for
relationships among voltage and frequency with length andmass. All statistical analyses were conducted using JMP statis-tical software (v.10.0, SAS Institute, Cary, NC, USA).
Voltage modelling
To confirm the electric-field characteristics of stimuli used in
subsequent behaviour trials, the electric potential produced by aBFG was measured in the experimental tank used in the beha-vioural assay (described below). Environmental conditions
during measurements were an average of conditions during thebehaviour trials (i.e. t¼ 288C, pH¼ 8, r¼ 3022 Ocm). The tipof a glass electrode, identical to the ones used tomeasure voltagefrom prey items, was positioned,1mm above the acrylic plate.
An identical reference electrode was attached to the wall of thetank as far as possible from the stimulus.
An electrode placement guide was created using Adobe
Illustrator (v.3, Adobe Systems Inc., San Jose, CA, USA) andprinted onto an acetate sheet. It was then positioned on top of thedipole centre and secured to the plate. The placement guide was
marked with distances of 1, 2, 3, 4, 5 and 10 cm with respect tothe dipole centre and angles from 0 to 908 in 158 incrementswith respect to the dipole axis. A 2.2 mA stimulus was appliedacross a 1-cm dipole in the centre of the placement guide. A
distance and anglewere randomly paired on the placement guideand the voltage was measured at each location. All distance andangle combinations were measured three times and averaged to
generate a mean voltage produced by the BFG. The voltage wasplotted against distance at an angle of 08 with respect to thedipole axis. The voltage was also plotted as a function of angle
from 0 to 908 at distances of 1, 2, 3, 4, 5 and 10 cm from thecentre of the dipole.
Freshwater stingray behavioural sensitivity
An applied direct current (DC) that ranged from 1.2 to 4.0 mAwas used in behavioural trials to replicate the approximateelectric potential of the previously measured prey items (i.e.
mean 0.70mV, range 0.30–1.33mV). Environmental conditionsduring experiments were as follows: temperature ranged from
27 to 298C, pH ranged from 7.84 to 8.30, and resistivityranged from 1153.40 to 3403.68 Ocm. Average temperature,
resistance and conductivity values were used to estimate theappropriate applied current to serve as a prey-simulating bio-electric stimulus (Bedore and Kajiura 2013).
Animal acquisition and maintenance
Seven juvenile P. motoro individuals were acquired fromOrnamental Fish Distributors inMiami, Florida, and transported
to the FWC Non-native Fish Research Laboratory where exper-imental trials took place (Table 1). Prior to and throughout theduration of the behaviour trials, two stingrays each were held inaquaria equipped with mechanical, chemical and biological
filtration. Stingrays were fed to satiation daily on a diet ofshrimp, fish and live blackworms. Experiments began after allstingrays were fully acclimated to the laboratory setting, indi-
cated by feeding daily for a minimum of 1 week. During trials,stingrays were fasted for 2 days to ensure that they weremotivated to respond to prey-simulating stimuli.
Experimental setup
To determine the sensitivity of P. motoro to bioelectricfields, a behavioural assay was employed following methods
described in similar studies (Kajiura and Holland 2002; Kajiura2003; Jordan et al. 2009; McGowan and Kajiura 2009). Anopaque acrylic plate, 2 m in diameter, was placed on the bottomof a 3785-L fibreglass experimental tank at the FWC laboratory.
A vertical plastic barrier attached to the surface of the platerestricted the experimental area to ,1.5 m in diameter. Fourelectric dipoles were equally spaced 50 cm apart on the plate
(i.e. dipole array). Dipole electric fields were induced with aBFG (cf. Kajiura and Holland 2002) connected to four shieldedunderwater cables, which each terminated in a pair of gold-
plated stainless-steel electrodes (18 AWG SO, LPIL-2, Tele-dyne Impulse, San Diego, CA, USA). The electrodes were eachaffixed to a 1.4-m-long, water-filled polyethylene tube mountedto the underside of the acrylic plate. They opened to the tank
water through two 1-mm holes in the plate spaced 1 cm apart,which represents the approximate size of a dipole electric fieldproduced by a prey item. Amultimeter connected in series to the
BFG monitored the applied current (see Fig. S2, available asSupplementary material for this paper). To ensure properlighting for video analysis, four lamps equipped with incandes-
cent 100-W bulbs were affixed to the sides of the tank toadequately illuminate the dipole array. To maintain a constantwater temperature in the experimental tank, four 800-W sub-
mersible heaters were used, but were removed during trials toeliminate the potential for electrical interference.
Experimental protocol
A stingray pair was placed in the experimental tank and wasallowed to acclimate for 1 h before experimental trials. To begina trial, a food odour was introduced into the tank via an odour-
delivery tubemounted to the centre of the acrylic plate. Once thestingrays were motivated to feed, as indicated by prey searchingbehaviour, the odour delivery ceased and one of the four
electrode pairs was randomly activated. The three inactivedipoles served as controls. As a single stingray approached the
Electroreception in a freshwater stingray Marine and Freshwater Research 1029
dipole, it made a turn towards the dipole and bit as if itencountered a prey item. Once the stingray bit at the active
dipole, the stimulus was deactivated and another dipole wasrandomly activated on the plate. Trials were recorded with a HDvideo camera (Sony HDR-CX 260, Tokyo, Japan) mounted
over the centre of the array. Each trial lasted a maximum of60 min, depending on motivational state, and each stingray wastested a minimum of three times over a period of 2 weeks. This
research was conducted in accordance with FAU IACUCprotocol #A11-38 and FWC conditional non-native speciespermit EXOT-12-45.
Video analysis
Video trials were imported to a computer and edited withiMovie (v.7.1.4, Apple Computer, Inc., Cupertino, CA, USA).The frame in which an orientation to a dipole was initiated was
exported as a still image for analysis. The distance from thecentre of the dipole to the stingray’s disc margin was measuredwith image-analysis software (ImageJ, National Institutes of
Health, Bethesda, MD, USA). In addition, the angle describedby the point of orientation with respect to the dipole axis wasmeasured in the same manner. A dipole field equation was used
to calculate the electric field (i.e. voltage gradient; V cm�1) atthe point of orientation, thus providing a measure of sensitivity(Kalmijn 1982; Kajiura and Holland 2002), as follows:
E ¼ rIdprx
ðcos yÞ ð1Þ
where r is the resistivity of freshwater (1153.40–3403.68Ocm),I is the applied current (1.2�4.0 mA), d is the dipole separationdistance (1 cm), r is the orientation distance (measured at the
disc margin; cm), x is the power of the derived voltage gradient(2.22), and y is the orientation angle with respect to the dipoleaxis (degrees).
Results
Voltage and frequency determination
Electric potential and ventilatory frequency were measuredfrom six individuals of juvenile obligate freshwater stingray
P. motoro, and three species of their common teleost prey items(Table 1). Power spectrum analysis was used to quantify fun-damental frequency (reported), secondary harmonics and
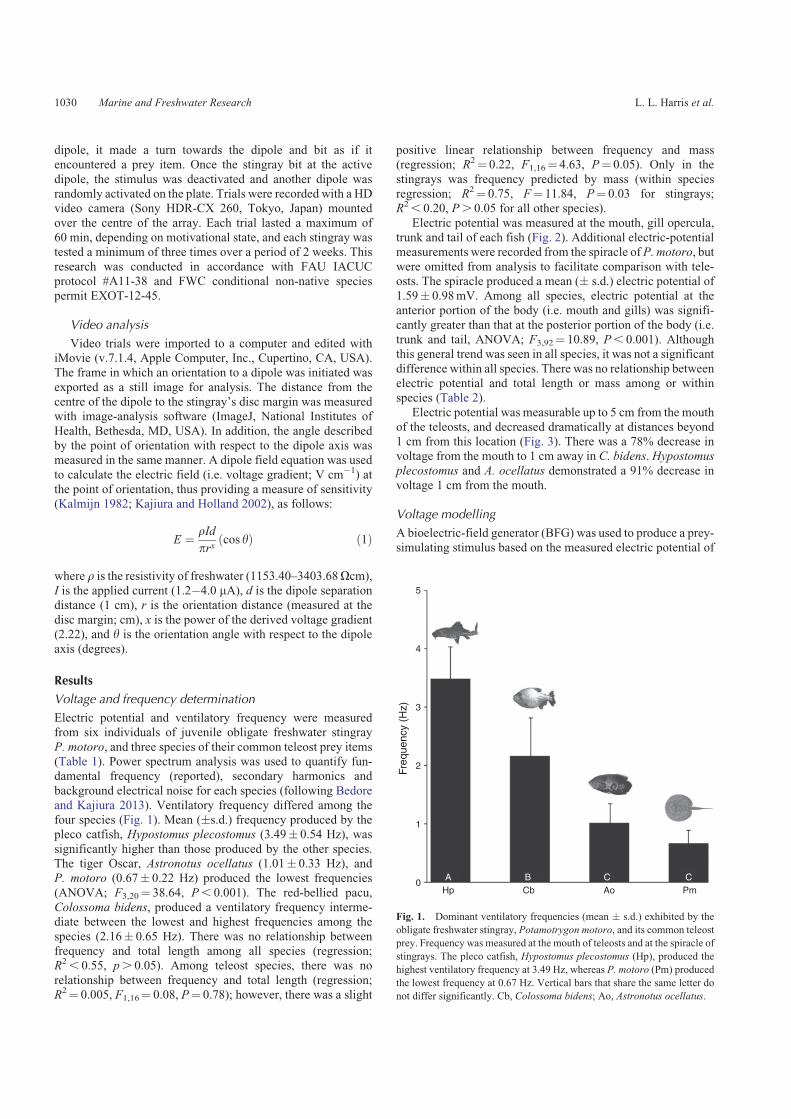
background electrical noise for each species (following Bedoreand Kajiura 2013). Ventilatory frequency differed among thefour species (Fig. 1). Mean (�s.d.) frequency produced by thepleco catfish, Hypostomus plecostomus (3.49� 0.54 Hz), was
significantly higher than those produced by the other species.The tiger Oscar, Astronotus ocellatus (1.01� 0.33 Hz), andP. motoro (0.67� 0.22 Hz) produced the lowest frequencies
(ANOVA; F3,20¼ 38.64, P, 0.001). The red-bellied pacu,Colossoma bidens, produced a ventilatory frequency interme-diate between the lowest and highest frequencies among the
species (2.16� 0.65 Hz). There was no relationship betweenfrequency and total length among all species (regression;R2, 0.55, p. 0.05). Among teleost species, there was no
relationship between frequency and total length (regression;R2¼ 0.005, F1,16¼ 0.08, P¼ 0.78); however, there was a slight
positive linear relationship between frequency and mass(regression; R2¼ 0.22, F1,16¼ 4.63, P¼ 0.05). Only in the
stingrays was frequency predicted by mass (within speciesregression; R2¼ 0.75, F¼ 11.84, P¼ 0.03 for stingrays;R2, 0.20, P. 0.05 for all other species).
Electric potential was measured at the mouth, gill opercula,trunk and tail of each fish (Fig. 2). Additional electric-potentialmeasurements were recorded from the spiracle of P. motoro, but
were omitted from analysis to facilitate comparison with tele-osts. The spiracle produced a mean (� s.d.) electric potential of1.59� 0.98mV. Among all species, electric potential at theanterior portion of the body (i.e. mouth and gills) was signifi-
cantly greater than that at the posterior portion of the body (i.e.trunk and tail, ANOVA; F3,92¼ 10.89, P, 0.001). Althoughthis general trend was seen in all species, it was not a significant
difference within all species. There was no relationship betweenelectric potential and total length or mass among or withinspecies (Table 2).
Electric potential was measurable up to 5 cm from the mouthof the teleosts, and decreased dramatically at distances beyond1 cm from this location (Fig. 3). There was a 78% decrease involtage from the mouth to 1 cm away in C. bidens. Hypostomus
plecostomus and A. ocellatus demonstrated a 91% decrease involtage 1 cm from the mouth.
Voltage modelling
A bioelectric-field generator (BFG) was used to produce a prey-simulating stimulus based on the measured electric potential of
HpA B C C
0
1
2Freq
uenc
y (H
z) 3
4
5
Cb Ao Pm
Fig. 1. Dominant ventilatory frequencies (mean � s.d.) exhibited by the
obligate freshwater stingray, Potamotrygon motoro, and its common teleost
prey. Frequency was measured at the mouth of teleosts and at the spiracle of
stingrays. The pleco catfish, Hypostomus plecostomus (Hp), produced the
highest ventilatory frequency at 3.49 Hz, whereas P. motoro (Pm) produced
the lowest frequency at 0.67 Hz. Vertical bars that share the same letter do
not differ significantly. Cb, Colossoma bidens; Ao, Astronotus ocellatus.
1030 Marine and Freshwater Research L. L. Harris et al.

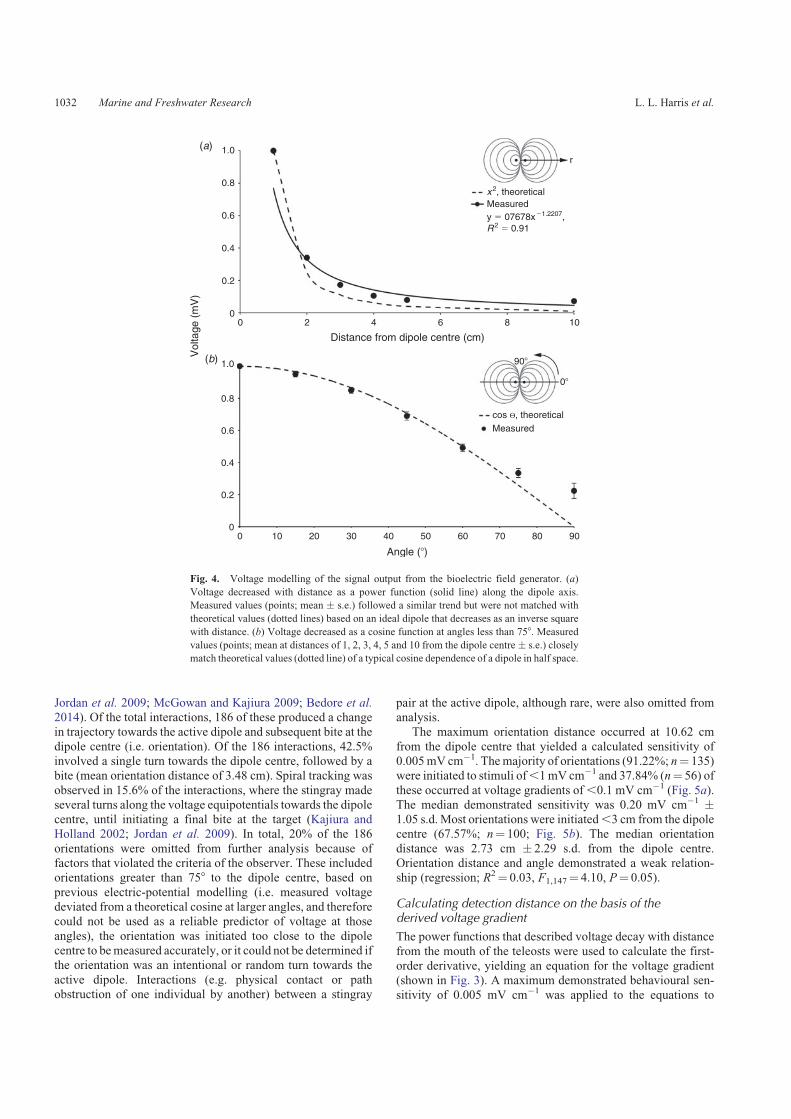
the teleost prey items. The measured electric potential from theBFGwas largely consistent with a theoretical ideal dipole in half
space (Fig. 4). A 2.2-mA current generated a maximum electricpotential of 0.93 mV at 1 cm along the dipole axis. Voltagedecreased with distance as a power function (V a r�1.22) and
became indistinguishable from background noise at distancesgreater than 10 cm from the dipole centre at all angles (Fig. 4a).Electric potential varied as a cosine function at angles less than
758 (Fig. 4b). At angles greater than 758, voltage did notdecrease as precipitously with increasing angle as predicted bythe model. Although the measured values reflected a trendsimilar to theoretical voltage decay in saltwater (i.e. V a r�2;
Kalmijn 1982; Kajiura and Fitzgerald 2009), the measured
electric potential decreased less rapidly in freshwater. On thebasis of these data, the ideal dipole equation (IDE) wasmodified
to more accurately describe voltage decay with distance infreshwater. The exponent of the first-order derivative of thestanding voltage decay from the dipole centre (E a r�2.22)
replaced the inverse cube in the original IDE modelled forseawater (Kalmijn 1982; Kajiura and Holland 2002).
Freshwater stingray behavioural sensitivity
Stingrays demonstrated 365 total interactions with the activedipole, defined as any instance that a stingray approachedwithin,20 cm from the stimulus (distance based on previous studies;
Table 2. One-way ANOVA with Tukey post hoc test outputs (left), and regression analyses (right)
Within species, body locations connected by the same letter do not differ significantly in electric potential; regression analyses were used to determine body
size (total length [TL], mass) effects on electric potential within a species
Species Mouth Gills Trunk Tail TL Mass
F3,20, P R2, P R2, P
Hypostomus plecostomus 16.99, 0.0001 A B B B 0.04, 0.3484 0.06, 0.3177
Colossoma bidens 14.59, 0.0001 B A C BC 0.02, 0.4967 0.02, 0.5069
Astronotus ocellatus 17.86, 0.0001 A A B B 0.03, 0.4517 0.02, 0.4830
Potamotrygon motoro 8.01, 0.0011 AB A B B 0.10, 0.1409 0.10, 0.1305
0.0010 1 2
Distance from mouth (cm)
3 4 50.001
0.01
Vol
tage
gra
dien
t (m
V c
m�
1 )
0.1
1
0.01
0.1
Vol
tage
(m
V)
1
y � 0.1432x�1.723
y � 0.9905x�2.959
y � 0.1949x�1.468
y � 0.2861x�2.468
y � 0.5056x�1.959
y � 0.2473x�2.723
Hp
Cb
Ao
Fig. 3. Voltage-decay characteristics of teleost prey items of Potamotry-
gon motoro. Electric potential was measured up to 5 cm away from the
mouth of each species and decreasedwith distance as a power function (solid
lines). The dotted lines represent the voltage gradient calculated as the
derivative of the measured voltage (power functions included in the figure).
On the basis of a maximum demonstrated sensitivity by P. motoro (Pm) of
0.005 mV cm�1 (horizontal arrow), Astronotus ocellatus (Ao) would be
within a detection distance at 3.2 cm (vertical arrow; shown in figure).
Hypostomus plecostomus (Hp) and Colossoma bidens (Cb) would be in
detection distance at 5.0 and 4.0 cm respectively (not shown).
0Mouth Gills Trunk Tail
Pm
Ao
Cb
Hp
1
2
3
Vol
tage
(m
V)
4
5
6
Fig. 2. Electric potential (mean� s.d.) measured at several body locations
on Potamotrygon motoro and its teleost prey. Species did not demonstrate
significant differences in measured voltage at the mouth, but electric
potential at the gills of P. motoro (Pm) was significantly larger than for
the teleosts. Among species, electric potential at the posterior portion of the
body (trunk, tail) was significantly smaller than that at the anterior portion
(mouth, gills). Hp, Hypostomus plecostomus; Cb, Colossoma bidens; Ao,
Astronotus ocellatus.
Electroreception in a freshwater stingray Marine and Freshwater Research 1031
Jordan et al. 2009; McGowan and Kajiura 2009; Bedore et al.2014). Of the total interactions, 186 of these produced a changein trajectory towards the active dipole and subsequent bite at the
dipole centre (i.e. orientation). Of the 186 interactions, 42.5%involved a single turn towards the dipole centre, followed by abite (mean orientation distance of 3.48 cm). Spiral tracking was
observed in 15.6% of the interactions, where the stingray madeseveral turns along the voltage equipotentials towards the dipolecentre, until initiating a final bite at the target (Kajiura andHolland 2002; Jordan et al. 2009). In total, 20% of the 186
orientations were omitted from further analysis because offactors that violated the criteria of the observer. These includedorientations greater than 758 to the dipole centre, based on
previous electric-potential modelling (i.e. measured voltagedeviated from a theoretical cosine at larger angles, and thereforecould not be used as a reliable predictor of voltage at those
angles), the orientation was initiated too close to the dipolecentre to bemeasured accurately, or it could not be determined ifthe orientation was an intentional or random turn towards the
active dipole. Interactions (e.g. physical contact or pathobstruction of one individual by another) between a stingray
pair at the active dipole, although rare, were also omitted fromanalysis.
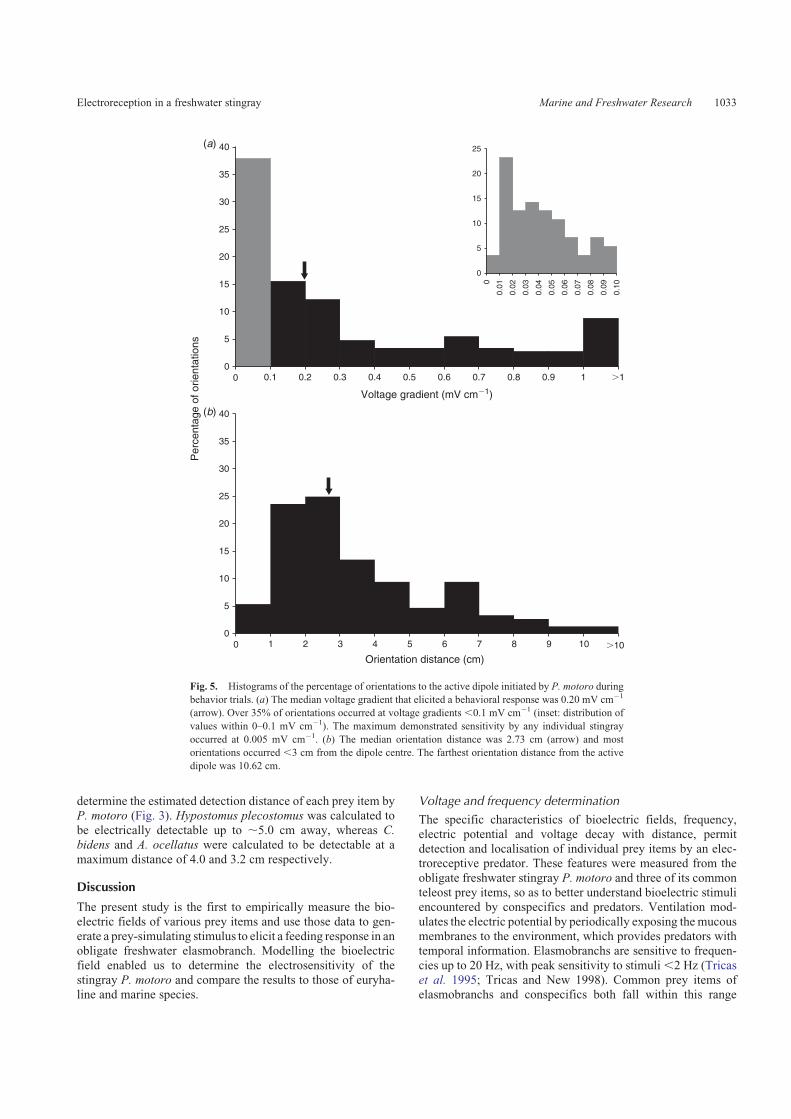
The maximum orientation distance occurred at 10.62 cm
from the dipole centre that yielded a calculated sensitivity of0.005mV cm�1. Themajority of orientations (91.22%; n¼ 135)were initiated to stimuli of,1mV cm�1 and 37.84% (n¼ 56) of
these occurred at voltage gradients of,0.1 mV cm�1 (Fig. 5a).The median demonstrated sensitivity was 0.20 mV cm�1 �1.05 s.d. Most orientations were initiated,3 cm from the dipolecentre (67.57%; n¼ 100; Fig. 5b). The median orientation
distance was 2.73 cm � 2.29 s.d. from the dipole centre.Orientation distance and angle demonstrated a weak relation-ship (regression; R2¼ 0.03, F1,147¼ 4.10, P¼ 0.05).
Calculating detection distance on the basis of thederived voltage gradient
The power functions that described voltage decay with distance
from the mouth of the teleosts were used to calculate the first-order derivative, yielding an equation for the voltage gradient(shown in Fig. 3). A maximum demonstrated behavioural sen-
sitivity of 0.005 mV cm�1 was applied to the equations to
x 2, theoreticalMeasuredy � 07678x�1.2207,R2 � 0.91
Distance from dipole centre (cm)
Vol
tage
(m
V)
Angle (�)
1.0
0.8
0.6
0.4
0.2
00 2 4 6 8 10
1.0
0.8
0.6
0.4
0.2
00 20 3010 40 6050 8070 90
(a)
(b)
cos Θ, theoretical
Measured
0�
90�
r
Fig. 4. Voltage modelling of the signal output from the bioelectric field generator. (a)
Voltage decreased with distance as a power function (solid line) along the dipole axis.
Measured values (points; mean � s.e.) followed a similar trend but were not matched with
theoretical values (dotted lines) based on an ideal dipole that decreases as an inverse square
with distance. (b) Voltage decreased as a cosine function at angles less than 758. Measured
values (points; mean at distances of 1, 2, 3, 4, 5 and 10 from the dipole centre� s.e.) closely
match theoretical values (dotted line) of a typical cosine dependence of a dipole in half space.
1032 Marine and Freshwater Research L. L. Harris et al.
determine the estimated detection distance of each prey item byP. motoro (Fig. 3). Hypostomus plecostomus was calculated tobe electrically detectable up to ,5.0 cm away, whereas C.
bidens and A. ocellatus were calculated to be detectable at a
maximum distance of 4.0 and 3.2 cm respectively.
Discussion
The present study is the first to empirically measure the bio-
electric fields of various prey items and use those data to gen-erate a prey-simulating stimulus to elicit a feeding response in anobligate freshwater elasmobranch. Modelling the bioelectric
field enabled us to determine the electrosensitivity of thestingray P. motoro and compare the results to those of euryha-line and marine species.
Voltage and frequency determination
The specific characteristics of bioelectric fields, frequency,electric potential and voltage decay with distance, permitdetection and localisation of individual prey items by an elec-troreceptive predator. These features were measured from the
obligate freshwater stingray P. motoro and three of its commonteleost prey items, so as to better understand bioelectric stimuliencountered by conspecifics and predators. Ventilation mod-
ulates the electric potential by periodically exposing themucousmembranes to the environment, which provides predators withtemporal information. Elasmobranchs are sensitive to frequen-
cies up to 20 Hz, with peak sensitivity to stimuli,2 Hz (Tricaset al. 1995; Tricas and New 1998). Common prey items ofelasmobranchs and conspecifics both fall within this range
0
5
10
15
20
25
30
35
40
0.1 0.2 0.3 0.4 0.5 0.6 0.7 0.8 0.9 1 �1
Per
cent
age
of o
rient
atio
ns
Voltage gradient (mV cm�1)
0
5
10
15
20
25
0.01
0.02
0.03
0.04
0.05
0.06
0.07
0.08
0.09
0.10
0
0
0
5
10
15
20
25
30
35
40
1 2 3 4 5 6 7 8 9 10 �100
Orientation distance (cm)
(a)
(b)
Fig. 5. Histograms of the percentage of orientations to the active dipole initiated by P. motoro during
behavior trials. (a) The median voltage gradient that elicited a behavioral response was 0.20 mV cm�1
(arrow). Over 35% of orientations occurred at voltage gradients ,0.1 mV cm�1 (inset: distribution of
values within 0–0.1 mV cm�1). The maximum demonstrated sensitivity by any individual stingray
occurred at 0.005 mV cm�1. (b) The median orientation distance was 2.73 cm (arrow) and most
orientations occurred ,3 cm from the dipole centre. The farthest orientation distance from the active
dipole was 10.62 cm.
Electroreception in a freshwater stingray Marine and Freshwater Research 1033

(Taylor et al. 1992; Almeida et al. 2010) and the frequenciesmeasured from all species in the present study were similar to
those measured in other aquatic organisms (Haine et al. 2001;Bedore and Kajiura 2013).
Among the teleost prey, electric potential at the mouth and
gills greatly exceeded that at the trunk and tail. This result is notsurprising, given that ions such as Naþ, Kþ and Cl� areexchanged at mucous membranes in the mouth and gill during
respiration and osmoregulation (Robertson 1953; Foskett et al.1983). The interaction between these ions and the surroundingion-poor environment creates a voltage gradient that emanatesfrom the prey item (Kalmijn 1972). Electric potential in fresh-
water organisms is typically greater than that in marine species(Kalmijn 1988). Electric potential in most marine invertebratesranges from 0.001 to 0.1 mV, and in teleosts it ranges from
0.02 to 0.3 mV (Haine et al. 2001; Bedore and Kajiura 2013).In the present study, electric potential at the mouth of Hypos-tomus plecostomus exceeded 1 mV, supporting previous litera-
ture on freshwater prey (Peters and Bretschneider 1972;Taylor et al. 1992). Different osmoregulatory strategies maycontribute to some variation in electric potential betweenfreshwater and marine organisms because of the ion disparity
that occurs between the internal and external environment in thedifferent media.
Voltage was measured from the same body locations in all
species, with an additional measurement taken at the spiracle ofP. motoro. Whereas the electric potential at the mouth of thestingrays fell within the range produced by the teleosts, the
electric potential at the gills was approximately five timesgreater than the mean electric potential produced at the teleostgills. Freshwater teleosts and elasmobranchs both utilise the
gills as a primary source of internal ion regulation (Ballantyneand Robinson 2010). In addition, both groups excrete nitroge-nous waste in the form of predominantly ammonia and smallamounts of urea (Wood et al. 2002). Unlike the teleosts, fresh-
water stingrays demonstrate high rates of ammonia excretion(e.g. rainbow trout, Oncorhynchus mykiss, 263 mmol kg�1 h�1,and Potamotrygon sp., 507 mmol kg�1 h�1; for review see
Ballantyne and Robinson 2010). This larger waste excretion byPotamotrygon sp. may contribute to the difference in voltageseen in the present study between the two groups. Potamotrygon
motoro produced voltage at the anterior portion of the body threeorders ofmagnitude greater than that produced bymarine batoids(Bedore and Kajiura 2013).
Voltage (mV) decreases rapidly as an inverse power function
with distance from the source and the decay rate is dictated bythe permittivity of the medium. This change over distancecreates a voltage gradient (mV cm�1) that electroreceptive
predators use to localise an electric stimulus. Voltage decayfrom the mouth of the teleosts was measured to better under-stand how an elasmobranch detects the bioelectric field of its
prey. Voltage rapidly decreased 1 cm from the source similar toother studies of marine species (Haine et al. 2001; Bedore andKajiura 2013). Using a maximum demonstrated sensitivity of
0.005 mV cm�1 in the behavioural assay, it was determined thatP. motoro should be able to detect a teleost prey item from adistance of up to 5.0 cm. This derived detection distance fellwithin the range of orientations demonstrated by P. motoro in
behaviour trials using a prey-simulating stimulus (i.e. over 75%
of orientations occurred at distances of 5 cm or less from thedipole centre, see below).
Voltage modelling
Because of the dissimilar electrical properties of freshwater andsaltwater, it was necessary to validate that the BFG used in
previous behavioural experiments in saltwater was suitable foruse in freshwater. Empirical measurements confirmed that theBFGproduced an electric potential in freshwater that conformedto the predicted values of a dipole electric field in half space. The
electric potential varied as a cosine function with angle at anglesless than 758 from the dipole axis. At angles close to normal,electric potential could not be accurately modelled with the
cosine function. The voltage at these angles is small so mea-surement error is exaggerated and likely accounts for the dis-parity. When the recording electrode crossed 908, there was a
predicted change of sign from positive to negative, as observedin other studies (Kajiura and Fitzgerald 2009).
Although electric potential in freshwater varied as a cosine
function, as in saltwater, the decay rate (dictated by the expo-nent) differed between the two media. Previous empiricalmeasurements reported that electric potential decays as aninverse square with a derived voltage gradient of r�3 in saltwater
(Kajiura and Fitzgerald 2009). In the present study, empiricallymeasured electric potential produced by the BFGdecayedwith arelationship of r�1.22, which yielded a derived voltage gradient
of r�2.22. These values were smaller than previously reportedusing the same BFG in saltwater (r�1.95 and r�2.95; Bedore andKajiura 2013). Therefore, for calculations of electrosensitivity
in the present study, the empiricallymeasured voltage decaywasemployed.
An assumption of the model used to calculate electric-fieldstrength is that the orientation distance (r) greatly exceeds the
dipole separation distance (d; in this case d¼ 1 cm; Kalmijn1982). Almost all of the orientations towards the dipole wereinitiated from a distance ,10 cm from the dipole centre. As a
result, the distance assumption is violated. However, becauseweempiricallymeasured the electric field around the dipole and didnot simply rely on a general model, we have reasonable confi-
dence in our results.
Freshwater stingray behavioural sensitivity
Electrosensitivity to bioelectric stimuli has been well docu-mented in marine and euryhaline elasmobranch species, but is
relatively untested in freshwater species. The present studyconfirmed that an obligate freshwater elasmobranch uses itselectrosensory system to detect and localise prey in a manner
similar tomarine batoids, albeit with greatly reduced sensitivity.Potamotrygon motoro demonstrated maximum and medianbehavioural sensitivity that was respectively four and five orders
of magnitude lower than marine stingrays (Jordan et al. 2009;McGowan and Kajiura 2009; Bedore et al. 2014). For example,P. motoro initiated the greatest number of orientations to the
prey-simulating dipole from a distance of 3 cm or less and themaximum orientation distance to the source was 10.62 cm,which is substantially smaller than that for marine and euryha-line batoids (24�77 cm; Jordan et al. 2009; McGowan and
Kajiura 2009; Wueringer et al. 2012; Bedore et al. 2014).
1034 Marine and Freshwater Research L. L. Harris et al.

The high ion content of seawater facilitates electrical con-ductivity, which results in a precipitous decrease in voltage with
distance. In contrast, an electric stimulus in freshwater dissi-pates less rapidly and thus the voltage propagates farther than insaltwater. Because elasmobranch electroreceptors detect the
voltage change with distance (i.e. a voltage gradient, V m�1),rather than absolute voltage, the steeper slope produced by acharge in seawater can be detected at a greater distance than the
shallower slope produced in freshwater (McGowan and Kajiura2009). During the behaviour experiments, stingrays had to bewithin 10 cm of the dipole to detect the stimulus and orienttowards it, possibly as a consequence of the physical constraints
of the medium.The electrosensitivity of Daysatis sabina, a euryhaline ray
with marine-type ampullary morphology, was reported as three
orders of magnitude lower in freshwater than saltwater, with acorresponding decrease in orientation distance (McGowan andKajiura 2009). It was undetermined whether the decreased
sensitivity was attributable to unsuitable morphology to thefreshwater electrical environment or to the electrical propertiesof freshwater. The electrosensitivity calculated in that studyused the standard IDE for saltwater, which applies a voltage
decay rate of r�3 (Kalmijn 1982; Kajiura and Holland 2002). Onthe basis of the empirically measured voltage in the presentstudy, a voltage decay of r�2.22 would be a better model for
freshwater. When a voltage decay of r�2.22 is applied to theD. sabina data, the calculated median and maximum sensitivityboth decrease by an order of magnitude (to 0.01 and
0.003mV cm�1). The revised maximum sensitivity ofD. sabinais comparable to the best response seen in P. motoro
(0.005 mV cm�1). This suggests that the electrosensitivity is a
function of the electrical properties of the medium and not aconstraint imposed by the marine-type ampullary morphologyfunctioning in freshwater.
An apparently less sensitive electrosensory system than that
of marine taxa should not be considered a detriment. Potamo-trygonid stingrays exhibit adaptations that promote sensoryintegration to facilitate successful prey capture. Several species
of freshwater stingray possess an increase in the length of theinfraorbital lateral line canal located on the ventral surface nearthe mouth (Shibuya et al. 2010). This is considered to be a
derived condition that may improve the accuracy of preylocalisation when foraging, by increasing the surface areaavailable to receive tactile cues by prospective prey at closerange (i.e. mechanotactile hypothesis; Maruska and Tricas
1998). Freshwater stingrays commonly exhibit opportunisticfeeding tactics when cruising the substrate, by undulating theirdisc to excavate cryptic prey (Garrone-Neto and Sazima 2009).
When prey are detected using this technique, they are already atclose range to the electroreceptors and electroreception is likelyto be employed to guide the mouth to individual prey items
trapped directly under the disc. The application of mechan-otactile and electrosensory information in concert synergistical-ly provides the stingray with greater localisation efficiency than
does either sensory modality in isolation because sensitivitythresholds decrease whenmultiple sensory systems are integrat-ed (Stein and Meredith 1993). This differs from marine speciesin which electro-orientation is initiated farther away from the
source, so mechanotactile cues do not come into play in
detection, but in localisation only. Compared with the marineenvironment, the freshwater environment is electrically ‘noisy’
(Peters and Bretschneider 1972; Kalmijn 1988), so differentiat-ing local dipoles produced by prospective prey may provedifficult until close to the source.
Conclusions and future research
The present study empirically confirmed that a stenohaline
elasmobranch utilises electroreception to detect and localiseprey items in a similar fashion as marine species, despitereduced electrosensory morphology. Although considered
generalistic in their feeding habits, some populations ofP. motoro demonstrate ontogenetic shifts in diet from smallinvertebrates as juveniles to mobile fishes as adults (Almeidaet al. 2010). Additional testing of adults using the same stimuli
will provide insight into whether sensitivity changes throughoutontogeny. Electrosensitivity measurements using controlledmanipulation of salinity (i.e. conductivity) or other water
parameters often encountered in the Amazonian environmentmay also contribute to our understanding of how this uniquemarine-derived sensory system functions in an electrically
unfavourable medium.
Acknowledgements
The authors thank K. Gestring and staff of the FWC Non-native Fish Lab-
oratory for extensive use of their facilities during behaviour trials. A. Harris,
D. Knott, V. Zollo and T. Gunn for experiment and husbandry support; P. S.
Wills and K. Sorge for suggestions to improve this manuscript. This work
was supported by the American Elasmobranch Society Donald R. Nelson
Behaviour Research Award and an FAU academic achievement award.
References
Almeida, M. P., Lins, P. M. O., Charvet-Almeida, P., and Barthem, R. B.
(2010). Diet of the freshwater stingray Potamotrygon motoro
(Chondrichthyes: Potamotrygonidae) on Marajo Island (Para, Brazil).
Brazilian Journal of Biology 70, 155–162. doi:10.1590/S1519-
69842010000100022
Ballantyne, J. S., and Robinson, J. W. (2010). Freshwater elasmobranchs: a
review of their physiology and biochemistry. Journal of Comparative
Physiology. B. Biochemical, Systemic, and Environmental Physiology
180, 475–493. doi:10.1007/S00360-010-0447-0
Bedore, C. N., and Kajiura, S. M. (2013). Bioelectric fields of marine
organisms: voltage and frequency contributions to detectability by
electroreceptive predators. Physiological and Biochemical Zoology 86,
298–311. doi:10.1086/669973
Bedore, C. N., Harris, L. L., and Kajiura, S.M. (2014). Behavioral responses
of batoid elasmobranchs to prey-simulating electric fields are correlated
to peripheral sensory morphology and ecology. Zoology 117, 95–103.
doi:10.1016/J.ZOOL.2013.09.002
Foskett, J. K., Bern, H. A., Machen, T. E., and Conner, M. (1983). Chloride
cells and the hormonal regulation of teleost fish osmoregulation. The
Journal of Experimental Biology 106, 255–281.
Garrone-Neto, D., and Sazima, I. (2009). Stirring, charging, and picking:
hunting tactics of potamotrygonid rays in the upper Parana River.
Neotropical Ichthyology 7, 113–116. doi:10.1590/S1679-
62252009000100015
Haine, O. S., Ridd, P. V., and Rowe, R. J. (2001). Range of electrosensory
detection of prey by Carcharhinus melanopterus and Himantura gran-
ulata. Marine and Freshwater Research 52, 291–296. doi:10.1071/
MF00036
Electroreception in a freshwater stingray Marine and Freshwater Research 1035
Jordan, L. K., Kajiura, S. M., and Gordon, M. S. (2009). Functional
consequences of structural differences in stingray sensory systems.
Part II: electrosensory system. The Journal of Experimental Biology
212, 3044–3050. doi:10.1242/JEB.028738
Kajiura, S. M. (2003). Electroreception in neonatal bonnethead sharks,
Sphyrna tiburo. Marine Biology 143, 603–611.
Kajiura, S. M., and Fitzgerald, T. P. (2009). Response of juvenile scalloped
hammerhead sharks to electric stimuli. Zoology (Jena, Germany) 112,
241–250. doi:10.1016/J.ZOOL.2008.07.001
Kajiura, S. M., and Holland, K. N. (2002). Electroreception in juvenile
scalloped hammerhead and sandbar sharks. The Journal of Experimental
Biology 205, 3609–3621.
Kalmijn, A. J. (1972). Bioelectric fields in sea water and the function of the
ampullae of Lorenzini in elasmobranch fishes. In ‘SIO Oceanography’.
(Ed. SIO Reference 72–83.) pp. 1–21. (Scripps Institution of Oceanog-
raphy, University of California: San Diego, CA.)
Kalmijn, A. J. (1974). The detection of electric fields from inanimate and
animate sources other than electric organs. In ‘Handbook of Sensory
Physiology, Vol. 3’. (Ed. A. Fessard.) pp. 147–200. (Springer-Verlag:
New York.)
Kalmijn, A. J. (1982). Electric andmagnetic field detection in elasmobranch
fishes. Science 218, 916–918. doi:10.1126/SCIENCE.7134985
Kalmijn, A. J. (1988). Detection of weak electric fields. In ‘Sensory Biology
of Aquatic Animals’. (Eds J. Atema, R. R. Fay, A. N. Popper and W. N.
Tavolga.) pp. 151–186. (Springer-Verlag: New York.)
Lovejoy, N. R., Albert, J. S., and Crampton, W. G. R. (2006). Miocene
marine incursions and marine/freshwater transitions: evidence from
Neotropical fishes. Journal of South American Earth Sciences 21,
5–13. doi:10.1016/J.JSAMES.2005.07.009
Maruska, K. P., and Tricas, T. C. (1998). Morphology of the mechanosen-
sory lateral line system in the Atlantic stingray, Dasyatis sabina: the
mechanotactile hypothesis. Journal of Morphology 238, 1–22.
doi:10.1002/(SICI)1097-4687(199810)238:1,1::AID-JMOR1.3.0.CO;2-D
McGowan, D. W., and Kajiura, S. M. (2009). Electroreception in the
euryhaline stingray, Dasyatis sabina. The Journal of Experimental
Biology 212, 1544–1552. doi:10.1242/JEB.025247
Peters, R. C., andBretschneider, F. (1972). Electric phemonena in the habitat
of the catfish Ictalurus nebulosus. Journal of Comparative Physiology
81, 345–362. doi:10.1007/BF00697755
Robertson, J. D. (1953). Further studies on ionic regulation in marine
invertebrates. The Journal of Experimental Biology 30, 277–296.
Shibuya, A., Zuanon, J., de Araujo, M. L. G., and Tanaka, S. (2010).
Morphology of lateral line canals in Neotropical freshwater stingrays
(Chondrichthyes: Potamotrygonidae) fromNegroRiver, BrazilianAma-
zon. Neotropical Ichthyology 8, 867–876. doi:10.1590/S1679-
62252010000400017
Stein, B. E., and Meredith, M. A. (1993). ‘The Merging of the Senses.’
(Ed M. S. Gazzaniga.) (The MIT Press: Cambridge, MA.)
Szabo, T., Kalmijn, A. J., Enger, P. S., and Bullock, T. H. (1972).
Microampullary organs and a submandibular sense organ in the fresh
water ray, Potamotrygon. Journal of Comparative Physiology 79,
15–27. doi:10.1007/BF00693615
Szamier, R. B., and Bennett, M. L. V. (1980). Ampullary electroreceptors in
the fresh water ray, Potamotrygon. Journal of Comparative Physiology.
A. Neuroethology, Sensory, Neural, and Behavioral Physiology 138,
225–230. doi:10.1007/BF00657040
Taylor, N. G., Manger, P. R., Pettigrew, J. D., and Hall, L. S. (1992).
Electromyogenic potentials of a variety of platypus prey items: an
amplitude and frequency analysis. In ‘Platypus and Echindas’.
(Ed. M. L. Augee.) pp. 216–224. (The Royal Zoological Society of
NSW: Sydney.)
Tricas, T. C., and New, J. G. (1997). Sensitivity and response dynamics of
elasmobranch electrosensory primary afferent neurons to near threshold
fields. Journal of Comparative Physiology. A. Neuroethology, Sensory,
Neural, and Behavioral Physiology 182, 89–101. doi:10.1007/
S003590050161
Tricas, T. C., Michael, S. W., and Sisneros, J. A. (1995). Electrosensory
optimization to conspecific phasic signals for mating. Neuroscience
Letters 202, 129–132. doi:10.1016/0304-3940(95)12230-3
Wood, C. M., Matsuo, A. Y. O., Gonzalez, R. J., Wilson, R. W., Patrick,
M. L., and Val, A. L. (2002). Mechanisms of ion transport in Potamo-
trygon, a stenohaline freshwater elasmobranch native to the ion-poor
blackwaters of the Rio Negro. The Journal of Experimental Biology 205,
3039–3054.
Wueringer, B. E., Squire, L. J., Kajiura, S.M., Tibbetts, I. R., Hart, N. S., and
Collin, S. P. (2012). Electric field detection in sawfish and shovelnose
rays. PLoS ONE 7, e41605. doi:10.1371/JOURNAL.PONE.0041605
www.publish.csiro.au/journals/mfr
1036 Marine and Freshwater Research L. L. Harris et al.

Marine and Freshwater Research 2015, 66, 1027–1036 © CSIRO 2015 http://dx.doi.org/10.1071/MF14354_AC
Page 1 of 2
Supplementary material
Electroreception in the obligate freshwater stingray, Potamotrygon motoro
Lindsay L. HarrisA, Christine N. Bedore
B and Stephen M. Kajiura
A,C
ADepartment of Biological Sciences, Florida Atlantic University, 777 Glades Road,
Boca Raton, FL 33431, USA.
BBiology Department, Duke University, Durham, NC 27708, USA.
CCorresponding author. Email: [email protected]
Fig. S1. Electrophysiological apparatus used to measure voltage produced by a living organism. A
representative prey item was secured to a submerged stage on the arm of a linear translation system (A). The tip
of a recording electrode (B) was placed at various locations along the body, and the voltage from the recording
and reference (C) electrodes was differentially amplified, filtered, digitised, and visualised on a computer. For
the distance trials, the fish was moved in automated 1-cm increments away from the recording electrode using
the linear translation system.

Marine and Freshwater Research 2015 © CSIRO 2015 http://dx.doi.org/10.1071/MF14354_AC
Page 2 of 2
Fig. S2. Simplified top-down view of experimental apparatus for behavioural sensitivity trials. An acrylic
plate 2 m in diameter (A) rested on the bottom of the experimental tank of equal diameter. Electrodes connected
to the centre of each 20-cm-diameter circle on the plate were controlled by a bioelectric field generator (B) that
emits an electric current. Current was monitored using a multimeter (C). To encourage prey-searching
behaviour, an odour stimulus was introduced into the tank before electrode activation by an odour-delivery tube
(ODT) mounted flush to the middle of the plate.