Electronic supplementary information - The Royal … supplementary information Enhancement of...
11
Electronic supplementary information Enhancement of Magnetic Heating Efficiency in Size Controlled MFe2O4 (M = Mn, Fe, Co and Ni) Nanoassemblies Jeotikanta Mohapatra, a Saumya Nigam, b J. Gupta, c A. Mitra, d M. Aslam, a,d, * D. Bahadur, a,c, * a Centre for Research in Nanotechnology and Science (CRNTS), b IITB-Monash Research Academy, c Department of Metallurgical Engineering and Materials Science, d Department of Physics, Indian Institute of Technology Bombay, Powai, Mumbai-40076, India *To whom correspondence should be addressed. [email protected]. (M. Aslam). Phone: +91 22 2576 7585, E-mail: [email protected]. (D. Bahadur), Phone: +91 22 2576 7632 (A) Experimental Technique X-ray diffraction (XRD) spectra were retrieved from Xpert PANAlytic X-ray diffractometer with Cu Kα radiation (λ = 1.54 Å). FTIR spectra were taken on Bruker, Vertex-80 using KBr pellet. High-resolution transmission electron microscopy images and selected area diffraction patterns were obtained with JEOL JEM 2100F, field emission gun transmission electron microscope (FEG-TEM) at an accelerating voltage of 200 kV. The scanning electron micrographs (SEM) were taken by JSM-7600F FEG SEM. Thermogravimetric analysis (TGA) of coated Fe3O4 MNNAs was carried out using a Perkin-Elmer Pyris instrument. TGA measurements were made from room temperature to 600 °C with a heating rate of 10 °C/min. The surface area and porosity measurements were performed by Micromeritics ASAP 2020 surface area and porosity analyzer. These samples were degassed at 90 °C for 2 h and then at 200 °C for 4 h by surface area and porosity analyzer prior to surface area, pore volume and pore size measurements. The ζ-potential measurements were carried out by the Zetasizer nano series, Malvern Instruments. The magnetic properties of the samples were studied using physical property measurement system (Quantum Design PPMS). The isothermal magnetization (M) versus applied magnetic field (H), zero-field- cooled (ZFC), and field-cooled (FC) measurements were performed over the temperature range 10–300 K with applied field of 20 kOe. The applied external field for ZFC and FC isotherm was 200 Oe. Electronic Supplementary Material (ESI) for RSC Advances. This journal is © The Royal Society of Chemistry 2015
Transcript of Electronic supplementary information - The Royal … supplementary information Enhancement of...

Electronic supplementary information
Enhancement of Magnetic Heating Efficiency in Size Controlled MFe2O4 (M =
Mn, Fe, Co and Ni) Nanoassemblies
Jeotikanta Mohapatra,a Saumya Nigam,b J. Gupta,c A. Mitra,d M. Aslam,a,d,* D. Bahadur,a,c,*
aCentre for Research in Nanotechnology and Science (CRNTS), bIITB-Monash Research
Academy, cDepartment of Metallurgical Engineering and Materials Science, dDepartment of
Physics, Indian Institute of Technology Bombay, Powai, Mumbai-40076, India
*To whom correspondence should be addressed. [email protected]. (M. Aslam). Phone: +91
22 2576 7585, E-mail: [email protected]. (D. Bahadur), Phone: +91 22 2576 7632
(A) Experimental Technique
X-ray diffraction (XRD) spectra were retrieved from Xpert PANAlytic X-ray diffractometer with
Cu Kα radiation (λ = 1.54 Å). FTIR spectra were taken on Bruker, Vertex-80 using KBr pellet.
High-resolution transmission electron microscopy images and selected area diffraction patterns
were obtained with JEOL JEM 2100F, field emission gun transmission electron microscope
(FEG-TEM) at an accelerating voltage of 200 kV. The scanning electron micrographs (SEM)
were taken by JSM-7600F FEG SEM. Thermogravimetric analysis (TGA) of coated Fe3O4
MNNAs was carried out using a Perkin-Elmer Pyris instrument. TGA measurements were made
from room temperature to 600 °C with a heating rate of 10 °C/min. The surface area and porosity
measurements were performed by Micromeritics ASAP 2020 surface area and porosity analyzer.
These samples were degassed at 90 °C for 2 h and then at 200 °C for 4 h by surface area and
porosity analyzer prior to surface area, pore volume and pore size measurements. The ζ-potential
measurements were carried out by the Zetasizer nano series, Malvern Instruments. The magnetic
properties of the samples were studied using physical property measurement system (Quantum
Design PPMS). The isothermal magnetization (M) versus applied magnetic field (H), zero-field-
cooled (ZFC), and field-cooled (FC) measurements were performed over the temperature range
10–300 K with applied field of 20 kOe. The applied external field for ZFC and FC isotherm was
200 Oe.
Electronic Supplementary Material (ESI) for RSC Advances.This journal is © The Royal Society of Chemistry 2015

(B) Synthesis of 4-24 nm Fe3O4 nanoparticles
Uniform Fe3O4 nanoparticles (σ ≤ 15%) are prepared using our previously published protocol.1 In
a typical synthesis of 4 nm Fe3O4 nanoparticles, a mixture of 4 mM of FeCl2 and 28 mM of
oleylamine (precursor to amine molar ratio 1:7) was heated at 200 ˚C under N2 atmosphere. The
size was controlled with the molar ratio of precursor to amine as 1:3 (9 nm) and 1:5 (6 nm),
respectively. To further increase the particle size above 9 nm, a seed-mediated growth model was
utilized.
(C) Theoretical basis of magnetic fluid heating
The principal equations of SAR and the power dissipation (P) are as follows.2, 3
PSAR
…..................... (1)
2 ''
0 0P Uf H f …..................... (2)
where ρ the density of magnetic material, φ the volume fraction of nanoparticles in the
suspension, μ0 the magnetic permeability, H0 the magnetic field, ω =2πf the frequency of the
applied ACMF.
The frequency dependence of the complex susceptibility (χ″) is expressed as follows.
2
0
23 1 ( )
S
B
VM
k T
…..................... (3)
where MS is the saturation magnetization, V is the volume of the nanoparticle and τ is the
effective relaxation time which is consisted of Brownian (B ) and Néel (
N ) relaxation time.
This relaxation times are as follows
3 HB
B
V
k T
…..................... (4)
1/2
3/2
0
exp2
effS BN
eff B
K VM k T
K V k T
…..................... (5)
Where η = viscosity coefficient of the matrix fluid, kB = Boltzmann constant, T = absolute
temperature, VH = hydrodynamic volume and Keff = effective anisotropy constant. Because the
Brownian and Néel processes take place in parallel, the effective relaxation time τ is given by
1 1 1
B N …..................... (6)
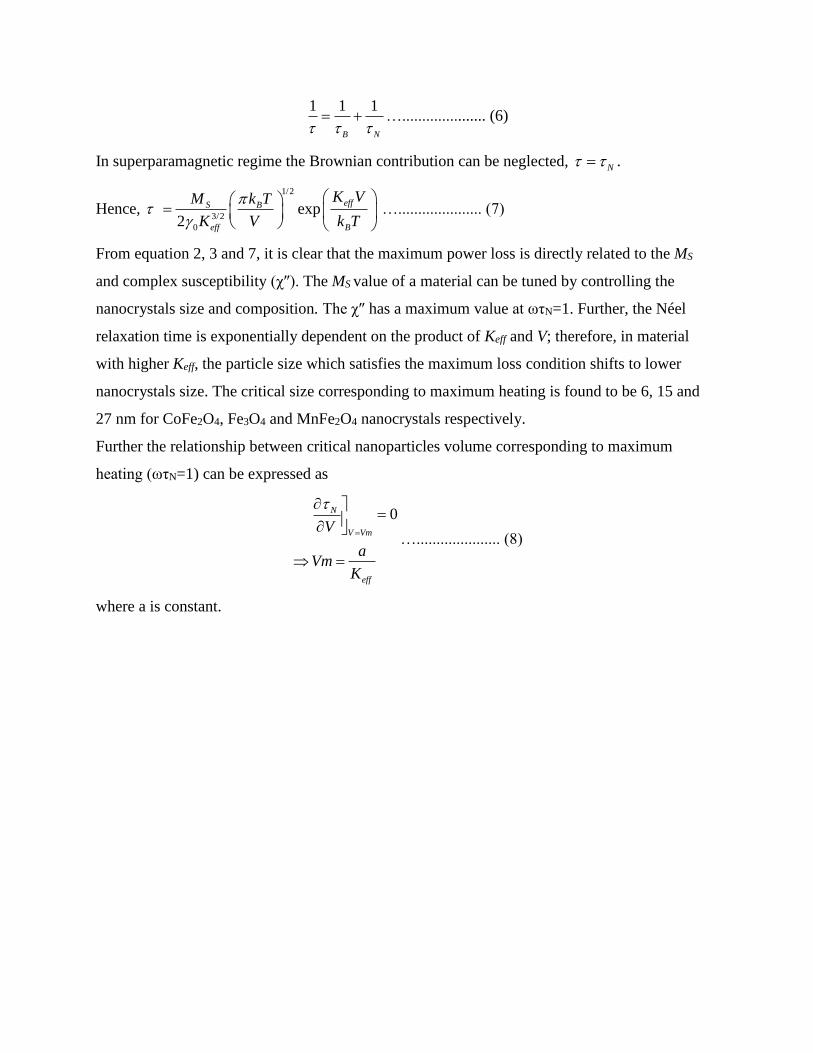
In superparamagnetic regime the Brownian contribution can be neglected, N .
Hence,
1/2
3/2
0
exp2
effS B
eff B
K VM k T
K V k T
…..................... (7)
From equation 2, 3 and 7, it is clear that the maximum power loss is directly related to the MS
and complex susceptibility (χ″). The MS value of a material can be tuned by controlling the
nanocrystals size and composition. The χ″ has a maximum value at ωτN=1. Further, the Néel
relaxation time is exponentially dependent on the product of Keff and V; therefore, in material
with higher Keff, the particle size which satisfies the maximum loss condition shifts to lower
nanocrystals size. The critical size corresponding to maximum heating is found to be 6, 15 and
27 nm for CoFe2O4, Fe3O4 and MnFe2O4 nanocrystals respectively.
Further the relationship between critical nanoparticles volume corresponding to maximum
heating (ωτN=1) can be expressed as
0N
V Vm
eff
V
aVm
K
…..................... (8)
where a is constant.

(D) Surface functionalization of MFe2O4 MNNAs: FTIR study
Fig. S1 (a) Represents the FTIR spectra of as prepared and PEI functionalized Fe3O4 MNNAs
(80 nm). The intensity of amine-related FTIR peaks (N-H stretching mode of primary amine at
3740 cm-1 and C-N stretching at 1068 cm-1) in as prepared sample is weak and becomes
prominent after surface fictionalization with PEI.4, 5 It indicates that in the as prepared Fe3O4
MNNAs a small amount of PEG-amine functional groups are coordinated to the iron cations,
after surface modification there are large amount of PEI molecules located on the particles
surface. All these results confirmed that PEI-functionalized Fe3O4 MNNAs have been
successfully obtained. (b) FTIR spectra of PEI-functionalized MFe2O4 MNNAs (80 nm). The
typical low frequency band at around 578 cm-1 refers to Fe-O vibration (Fe3+ bond) in octahedral
and tetrahedral sites, which could be attributed to spinel ferrite phase of Fe3O4 while the Fe-O
band for γ- Fe2O3 is usually seen at 540 cm-1.6 The high frequency band at 3740 cm-1 is assigned
to N-H stretching mode of primary amine, while the C-H bending, C-N stretching, CH2
scissoring and NH2 scissoring peaks appear at 895 cm-1, 1068 cm-1, 1546 cm-1 and 1645 cm-1
respectively.4, 5 The peaks at 2852 cm-1 and 2930 cm-1 are assigned to CH2 vibrations originating
from the polyethylenimine. The strong band observed at 3410 cm-1 is ascribed to O-H vibration
originating from physically adsorbed water molecules.4

(E) Crystal structure and morphology
Fig. S2: (a) The XRD spectra of iron oxide nanoparticles produced using 9 mmol Fe-precursor
shows mixed phase of Fe3O4 (♦) and α- Fe2O3 (*). (b) The representative TEM micrograph of the
sample produced using 9 mmol Fe-precursor shows non-uniformity in shape as well as size.
Fig. S3: (a) XRD spectra of different sized Fe3O4 MNNAs prepared using EG as solvent. (b) The
full width half maxima (FWHM) and peak position for the entire sample are nearly same. This
indicates that the nanocrystal size of the MNNAs prepared using EG is nearly the same. (c) The
variation of nanocrystal size and lattice strain with Fe3O4 MNNAs size.

Fig. S4: Histograms of the particle size distribution of Fe3O4 MNNAs prepared with the PEG
contents of ; (a) 2 ml, (b) 5 ml, (c) 8 ml and (d) 12 ml. The statistical analysis has been done by
measuring the size of almost 45-60 particles. The average MNNAs size is estimated from TEM
micrograph using the lognormal distribution.

34 36 38
(iv)
(iii)
(ii)
(i)
Inte
nsi
ty(a
.u.)
2 (degree)
311
30 40 50 60
(iv)
(iii)
(ii)2
22
Inte
nsi
ty(a
.u.)
2 (degree)
(i)
440
51
1
42
240
0
31
1
22
0
Assembly
size (nm)
Crystallite
size (nm)
60 8
80 14
110 18
135 22
30 40 50 60
44
0
Inte
nsi
ty(a
.u.)
2 (degree)
222
511
422
400
311
220
(b)
(c) (d)
(a)
Fig. S5: (a) XRD spectra of different size (60 nm –i, 80 nm –ii, 110 nm –iii and 135 nm –iv)
Fe3O4 MNNAs prepared using EG and PEG as solvent. (b) The full width half maxima (FWHM)
increases with the increases of MNNAs size, which indicates that the nanocrystals size of the
MNNAs prepared using EG and PEG increases with increases of nanoassemblies size. (c) The
XRD spectra of MNNAs produced using 20 ml of PEG shows narrow bordering in the XRD
spectrum. (d) Shows the variation of nanocrystals size with Fe3O4 MNNAs size.
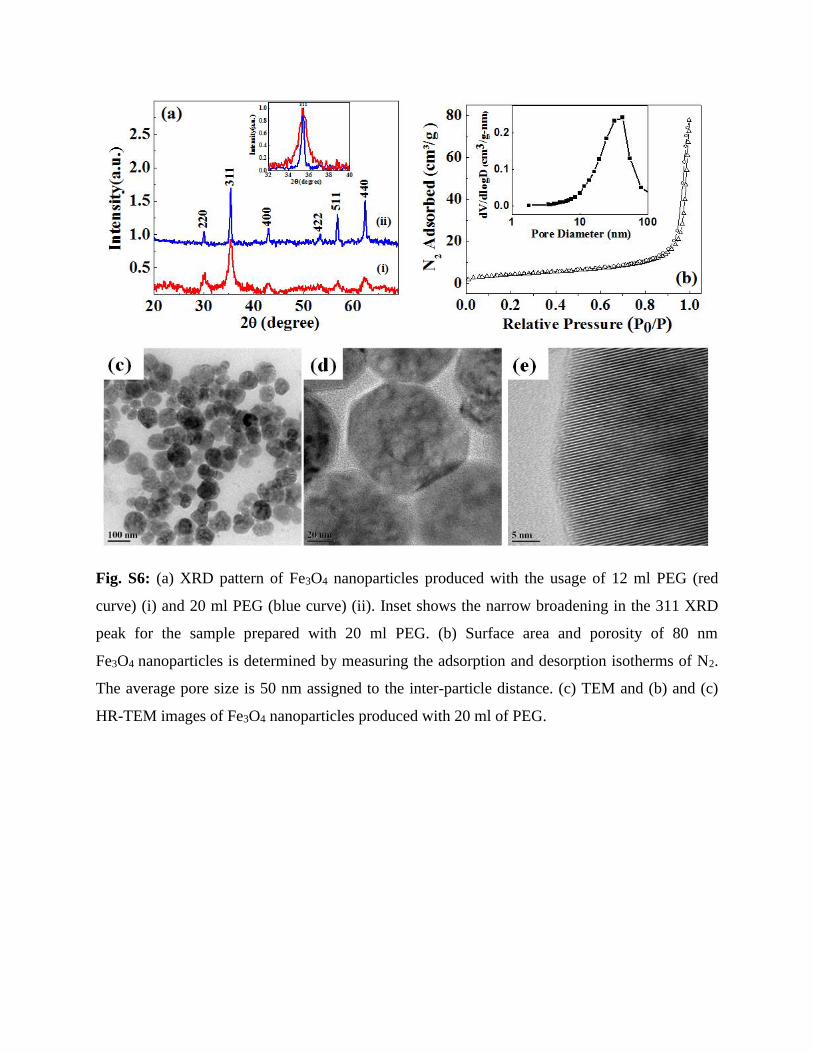
Fig. S6: (a) XRD pattern of Fe3O4 nanoparticles produced with the usage of 12 ml PEG (red
curve) (i) and 20 ml PEG (blue curve) (ii). Inset shows the narrow broadening in the 311 XRD
peak for the sample prepared with 20 ml PEG. (b) Surface area and porosity of 80 nm
Fe3O4 nanoparticles is determined by measuring the adsorption and desorption isotherms of N2.
The average pore size is 50 nm assigned to the inter-particle distance. (c) TEM and (b) and (c)
HR-TEM images of Fe3O4 nanoparticles produced with 20 ml of PEG.

(F) Magnetic properties
Fig. S7: (a) Blocking temperature vs. MNNA size plot of all MFe2O4 (M = Mn, Fe, Co and Ni)
MNNAs of size 25-60 nm. The size of the MNNAs is controlled by varying the mole content of
metal chloride precursor. Although the nanocrystallite size of 25- 60 nm sized MFe2O4 MNNAs
are nearly the same, we observed a linear increment of TB with the nanoassembly size, which
could be due to magnetic couplings between the nanocrystals within the MNNA. (b) MS value
vs. MNNA size plot of all MFe2O4 MNNAs of size 25-60 nm. MS value shows an increasing
trend with the increase of size of MNNAs. (c) The variation of room temperature MS value with
size of MFe2O4 MNNAs (σ ≤ 20 %) prepared by using bisolvent mixture of EG and PEG.

(G) Hyperthermia characteristics
Fig. S8: Demonstrates an optimization of heat activation efficiency of MFe2O4 nanocrystals
nanoassemblies (MNNAs) by controlling size, composition and magnetic coupling among the
nanocrystals within the MNNAs. The highlighted part (yellow) represents the SAR results of
similar nanocrystallite sized MFe2O4 MNNAs and the SAR values are controlled by varying the
MNNAs size from 25-60 nm. The increase in SAR values with MNNAs size (of similar
nanocrystallite size) is due to the magnetic coupling between the nanocrystals with the
nanoassembly. To further improve the SAR value, the size of the nanocrystals (8-22 nm) as well
as MNNAs (60-135 nm) is controlled by using bi-solvent mixture of PEG and EG. The non-
highlighted part of the figure shows the SAR values for 60-135 nm sized MFe2O4 MNNAs. Here,
the SAR values are controlled by varying both the nanocrystals and nanoassembly size to
achieve a high efficiency magnetic heating material.

(H) Elemental composition analysis
Table S1: Elemental composition of 110 nm sized MFe2O4MNNAs measured by EDX and ICP-
AES.
Sample
Code
Fe atom (%) M atom (%) Fe/M ratio
EDX ICP-AES EDX ICP-AES EDX ICP-AES
MnFe2O4 28.4 29.2 13.1 14.2 2.1 2
CoFe2O4 26.2 26.8 11.3 12.8 2.3 2.3
NiFe2O4 25.9 27.4 13.7 13.5 1.9 2
References:
1. J. Mohapatra, A. Mitra, D. Bahadur and M. Aslam, CrystEngComm, 2013, 15, 524-532. 2. R. E. Rosensweig, J. Magn. Magn. Mater., 2002, 252, 370-374. 3. J. Carrey, B. Mehdaoui and M. Respaud, J. Appl. Phys., 2011, 109, 083921. 4. P. Griffiths and J. A. De Haseth, Fourier transform infrared spectrometry, Wiley-Interscience,
2007. 5. M. Chen, Y.-G. Feng, X. Wang, T.-C. Li, J.-Y. Zhang and D.-J. Qian, Langmuir, 2007, 23, 5296-5304. 6. Z. Xu, C. Shen, Y. Hou, H. Gao and S. Sun, Chem. Mater., 2009, 21, 1778-1780.